Categories
Forex Fundamental Analysis

How The ‘Government Debt’ Numbers Impact A Nation’s Currency Value?

Introduction

Government Debt as an economic indicator has recently been gaining more attention from economists, investors, and traders. Many economies have chosen to actively take on debts to boost economic growth. Hence, it has become a metric & also a concern for many.

Just like a piling up debt is terrible for a householder, huge government debt is a negative sign for any economy. How the debt is used to run economic activities, methods deployed to repay it, all these have a long-term financial impact. In this sense, Government Debt is a critical metric by itself that needs to be watched out for, as investors decide to lend money to governments, basing this also as one of the reasons.

Government Debt levels have consequences that are many-fold to understand. Hence, understanding Government Debt now is more important than ever as the world’s largest economies are taking on debts beyond their revenues.

What is Government Debt?

Government Debt, also called Sovereign Debt, Country Debt, National Debt is the total public Debt and intragovernmental Debt owed by the governing body of the country. It is the money that the Government owes to its creditors.

            Government Debt = Public Debt + Intragovernmental Debt

Public Debt – It is the Debt held by the public. The Government owes this Debt to the buyers of the government bonds, who can be its citizens, foreign investors, or even foreign governments.

Intragovernmental Debt – It is the Debt owed by the Government to other Government departments. It is generally used to fund Government and citizen’s pensions. The Social Security Retirement account would be one such typical example.

Whenever the Government spends more than its generated revenue, it creates a budget deficit and adds to the total Government Debt. To operate in this budget deficit mode, the Government has to issue treasury bills, notes, and bonds, which are promissory notes to lenders that the Government shall pay back the amount along with interests.

Hence, The National Public Debt is the net accumulation of all annual budget deficits of the Federal Government.

How can the Government Debt numbers be used for analysis?

The Governments depend mainly on public spending to stimulate growth in the economy by assisting businesses and individuals in the form of unemployment compensations, wage hikes, etc. This leaves Government no choice but to fall back on taking on more Debt and keep paying interests from the tax revenues and other income sources.

The piling Debt may let things continue smoothly now but will inevitably tighten the belt for the economy in the future. When Debts go out of hand, it can lead to economic collapse, as default on Debts leads to reduced credibility and may lead to a lack of funds during times of need.

When support is lost for the Government, it has to fall back on assets, selling them and thus going to the brink of bankruptcy. At this stage, a nation is vulnerable as enemy nations can also use this situation to their advantage to wage wars in extreme cases. When there is no monetary support, business slowdowns and recessions are unavoidable.

The following are some strategies the Government may opt to reduce the debt burden:

📎 Low-Interest Rates: By lowering interest rates through open market operations, the Government can make borrowing money easy for the business and people in the economy to boost the economy. This has been the case in the United States. Prolonged low-interest-rate environments have not proven to be an effective solution to Debt-ridden Governments.

📎 Monetization: Countries like the United States, whose currency is not pegged to any other currency or commodity, can print off money and clear Debt. But this can lead to hyperinflation and currency depreciation. Hence, it is not preferable.

📎 Spending Cuts: This is the hard pill to swallow that actually works. It is the spending that leads to an increasing debt burden. If the Government cuts back on spending, which is equivalent to cutting back of money supply into specific segments or programs, that will lead to deflationary situations in the economy that can lead to a recession. Furthermore, when the Government cuts back on spending, they lose the support of citizens and fear losing favors in elections by businesses and the population.

📎 Tax Raises: The main culprit is failing to cut back on spending. As the spending continues to rise year after year, increased tax revenues do little to help reduce the burden of Debt. It is the most common practice but is not effective in the long run.

📎 Pro-Business/ Pro-Trade: By selling off real assets like real estate, gold, and military equipment, the Government can reduce the burden. It is like selling your house to pay off the mortgage. This type of solution is not applicable to all countries, but some like Saudi Arabia reduced their Debt significantly from a debt 80% of GDP to 10% in seven years by selling off oil.

📎 Debt restructuring or Bailouts: When the solvency of the Government is at the brink, Debt restructuring (renegotiating the terms of Debt, or partial payments) is one final option. It is a pseudo-defaulting case. This is not also a practical solution, as the credibility is damaged after this, as it tells the world that the economy is weak.

📎 Default: Defaulting may seem the most effective way to get rid off Debt. This is considered only when there are no other options for the Government. This leads to a lack of future monetary support from the rest of the world. Defaulters like Pakistan, Greece, and Spain are good examples of this. Defaulting occurs when the Debt burden crosses way beyond the tipping point, which is 77%. For the United States, it has already passed 100% in recent years.

Impact on Currency

The National Debt is an increasing concern in recent years as the repayments are starting to take more massive proportions of the Government’s revenue. What method the Government decides to opt for to tackle its debt burden in a given year directs the growth for that business year.

The Government Debt is a proportional indicator, meaning higher Government debt numbers are more stimulating for the economy, and appreciating for the currency and vice-versa. The vital thing to note here is that as long as the Debt has not gone way out of control that the Government cannot afford to pay the interests also. For the United States, the Debt burden will be unbearable by 2034, at which point they have to cut back on spending and raise taxes.

The Government Debt is a lagging and reactionary number. It is taken on to solve an issue and is not an initiative effort. Debt numbers follow the already ongoing situation. Hence, it has a low market impact. The more direct implications of the taken Debt are manifested through press releases and other news reports like wage growth, employment statistics, etc.

Economic Reports

The Treasury Department has the “Debt to the Penny” section on their website which shows, the daily Debt after all purchase and sale of the Government Bonds.

The U.S. Treasury Department releases quarterly, end of the period, the Federal Government’s Debt reports.

Sources of Government Debt

The Office of Management has a historical tables section where we can find Federal Debt records. Some of the most reliable sources are given below.

Impact of the ‘Government Debt’ news release on the price charts 

Government Debt which also known as the national debt, is the public and intergovernmental debt owned by the federal government. The government may take a loan from the World Bank and or from other financial institutions for a variety of reasons. It could be required for fulfilling the needs of the people, for defense purposes, or for stabilizing the economy. A moderate increase in debt will boost economic growth, but too much debt is not good for the economy.

It dampens growth over the long term. Higher debt means a higher rate of interest and, thus, more burden on the government while repaying the loan. Investors compare the debt held by the government and its ability to pay it off. Based on this data, they have a short to long term view on the currency. However, traders do not react violently to the Government Debt news release and make few adjustments to their positions in the market.

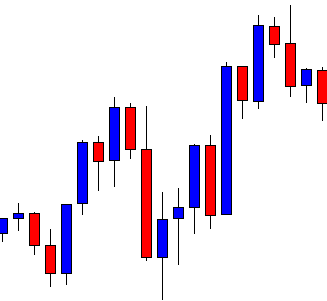
In today’s article, we will be analyzing the impact of the Government Debt announcement on Turkish Lira as traders identify the debt of the Turkish Government. The below image shows the previous and latest Government debt of Turkey, which indicates an increase in debt from last month.

USD/TRY | Before The Announcement

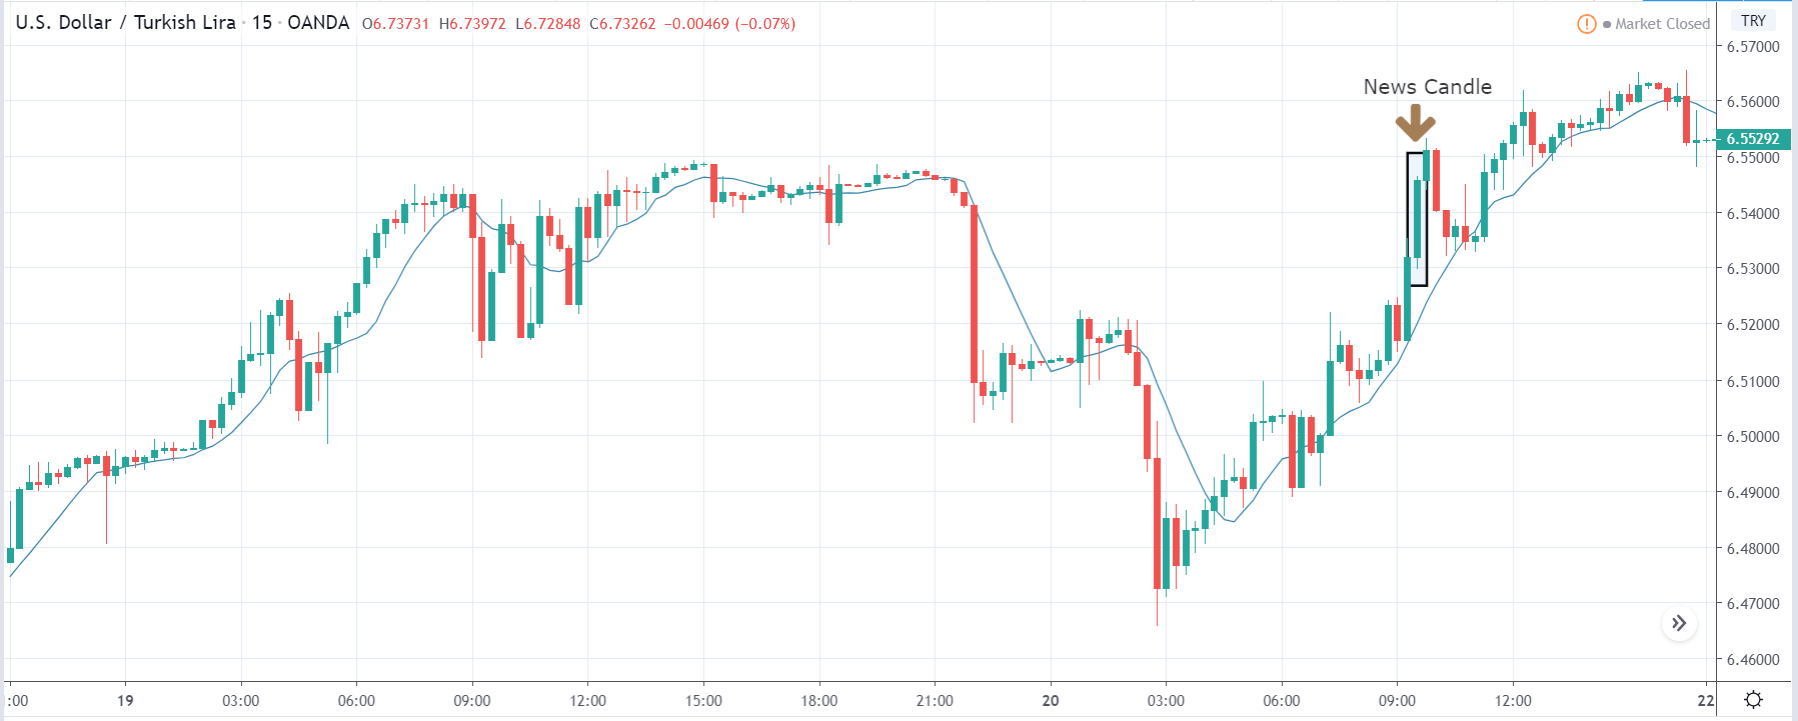
The above image represents the USD/TRY currency pair before the news announcement. We see that the chart is in an uptrend and the price has broken many resistance points. Currently, it is approaching a major resistance area from where the market has reversed earlier. High volatility on the upside could be an indication that the market is expecting a weak Government Debt data. One can join the uptrend only after the market gives a retracement.

USD/TRY | After The Announcement

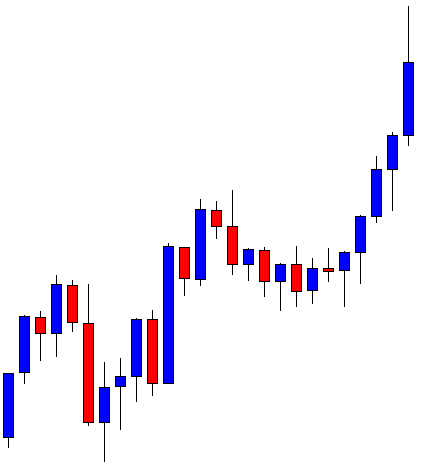
As soon as the Government Debt data is announced, the market violently moves higher, and price rises quickly to the top. The reason behind the increase in volatility to the upside is that the Government Debt increased by almost $70B for the month of March. As a rise in Debt is considered to be negative for the economy, this explains why traders and investors sold Turkish Lira and bought U.S. dollars after the numbers were announced. The bullish ‘news candle’ is a sign of trend continuation, and thus one can go ‘long’ in the pair after a suitable price retracement.

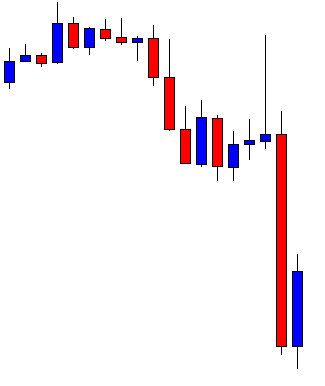
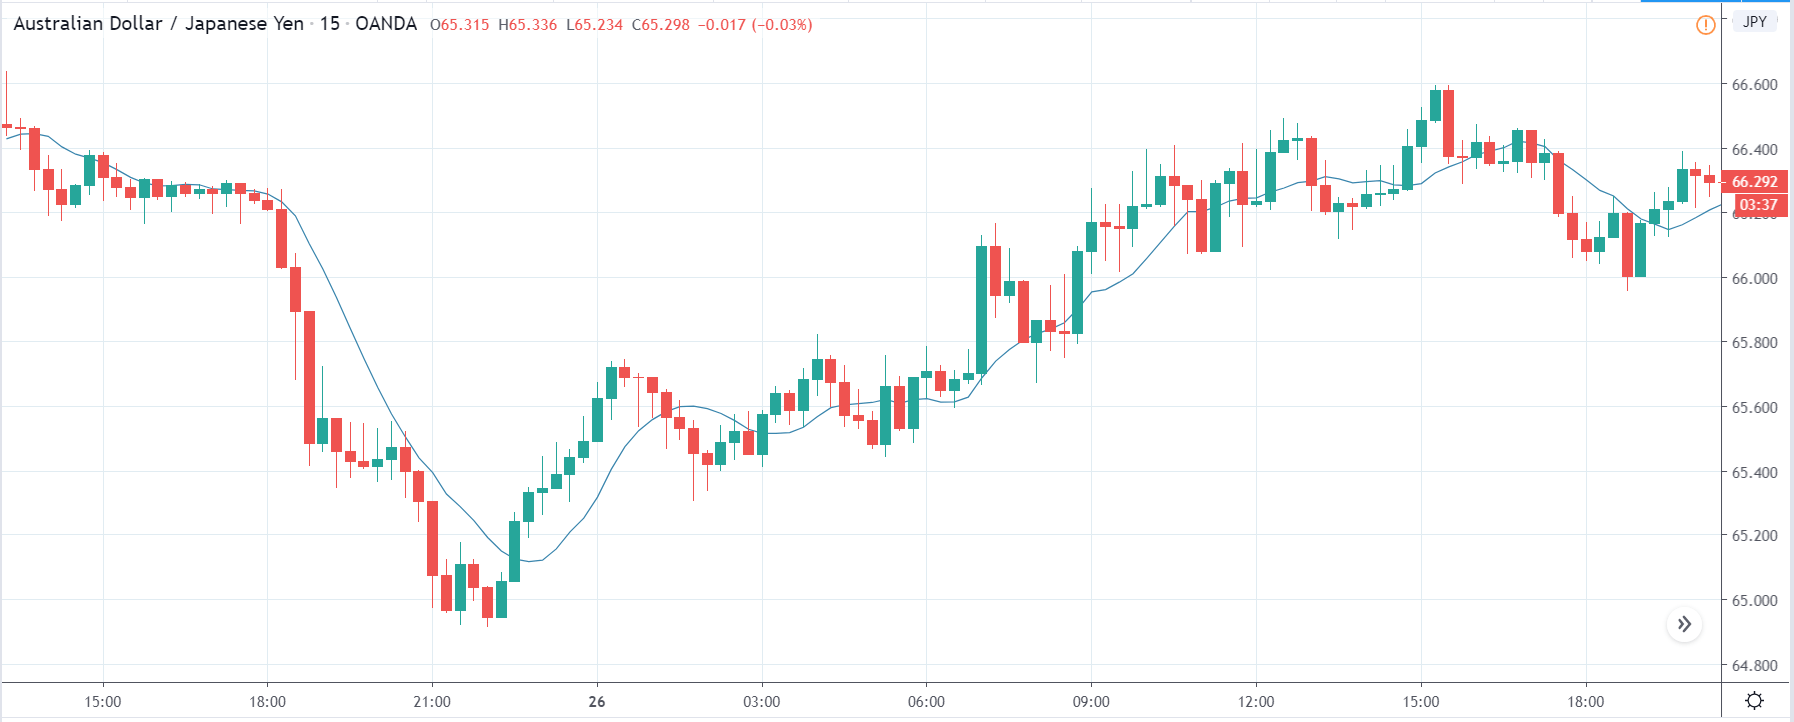
TRY/JPY | Before The Announcement

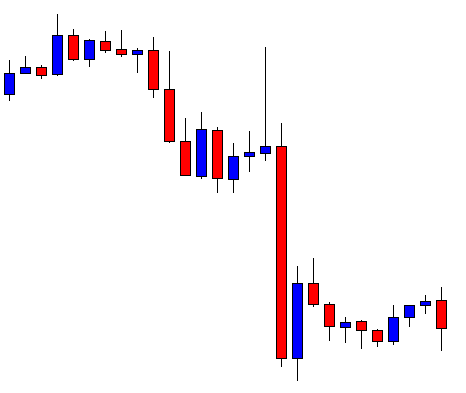
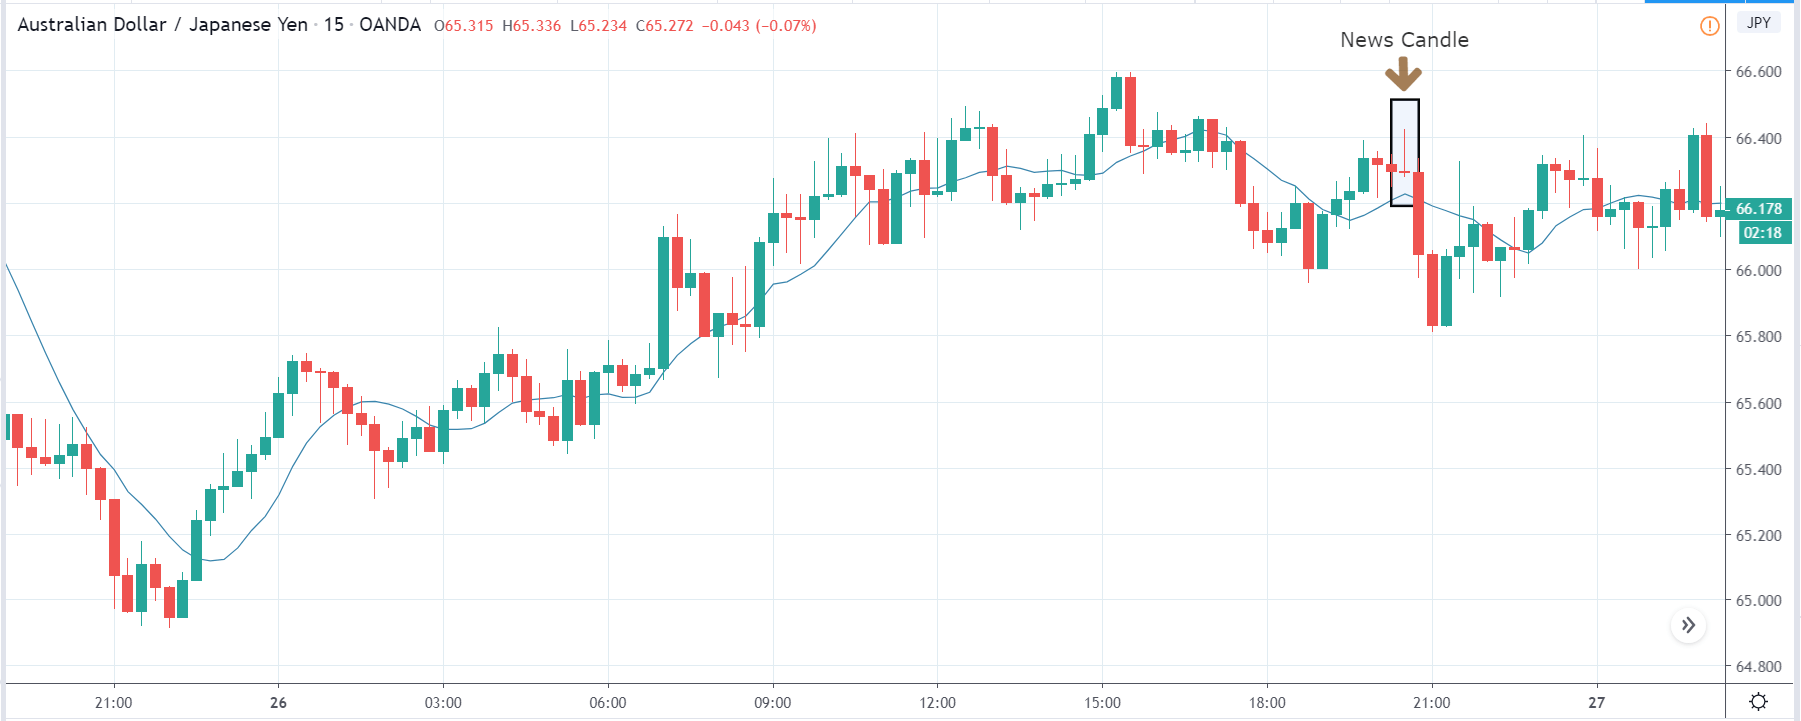
TRY/JPY | After The Announcement

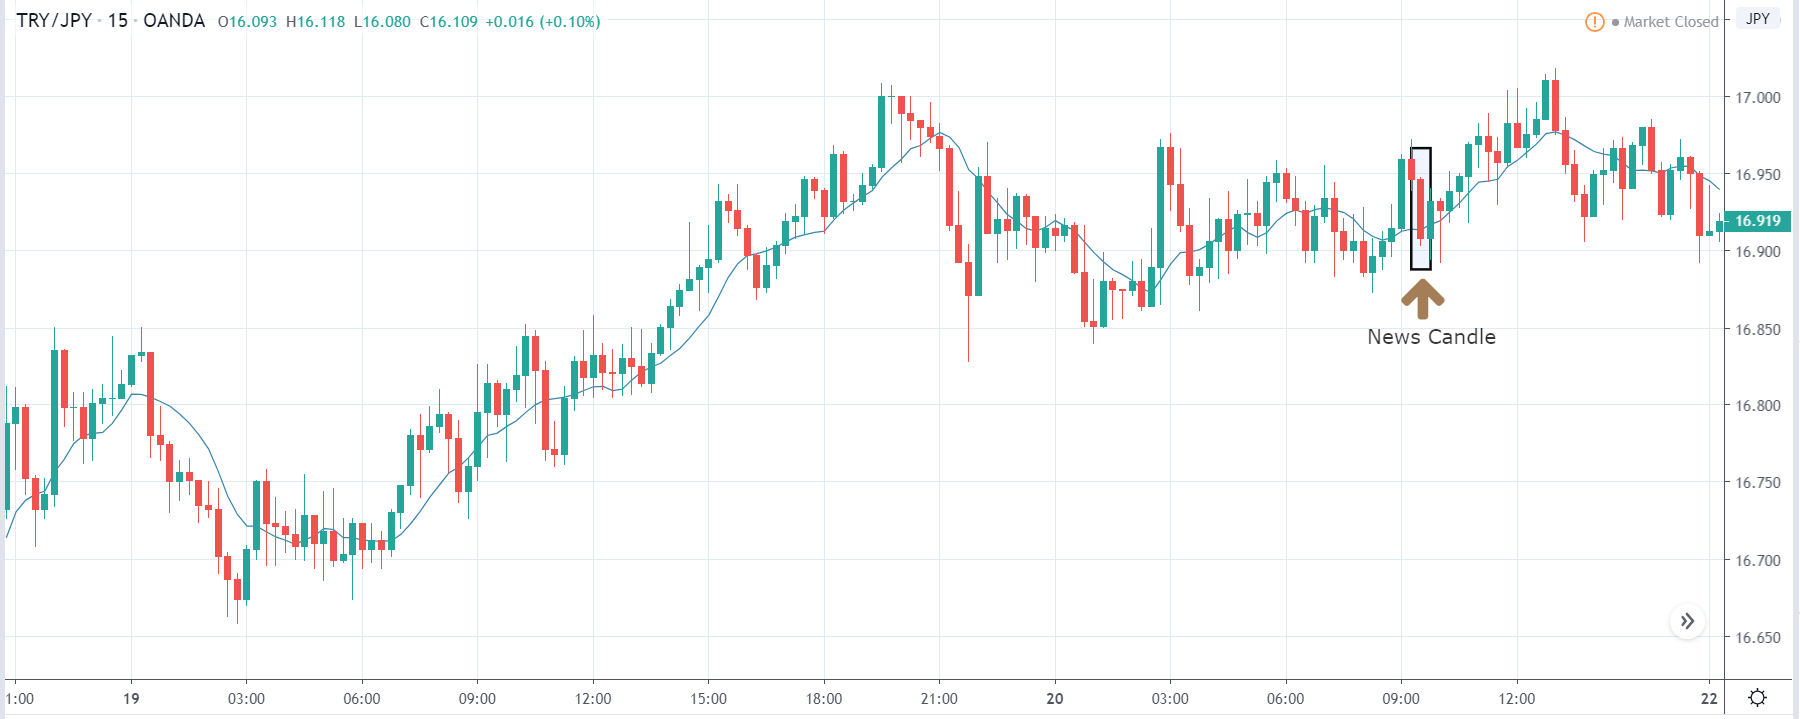
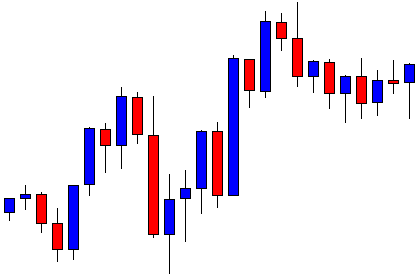
Next, we will discuss the impact of the news on the TRY/JPY currency pair, where we see that the market is moving in a range, and the overall trend is up. As the Turkish Lira is on the left-hand side, a ranging market indicates an indecision state of the market. Before the news announcement, price is at the ‘resistance’ area, and thus one can expect some selling pressure from this point, which can take the price lower. In such a market scenario, aggressive traders can take a ‘short’ trade in the market, expecting bad news for the economy.

The news release resulted in volatility expansion on the downside as the market reacted negatively owing to poor Government Debt data. The price crashed and closed as a strong bearish candle. But this was immediately retraced by a bullish candle, which could be due to the reaction from ‘support’ of the range. Thus, one should go ‘short’ in the pair after the price breaks key levels as the overall trend is up.

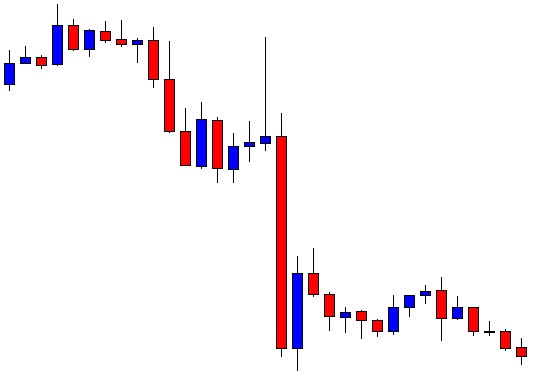
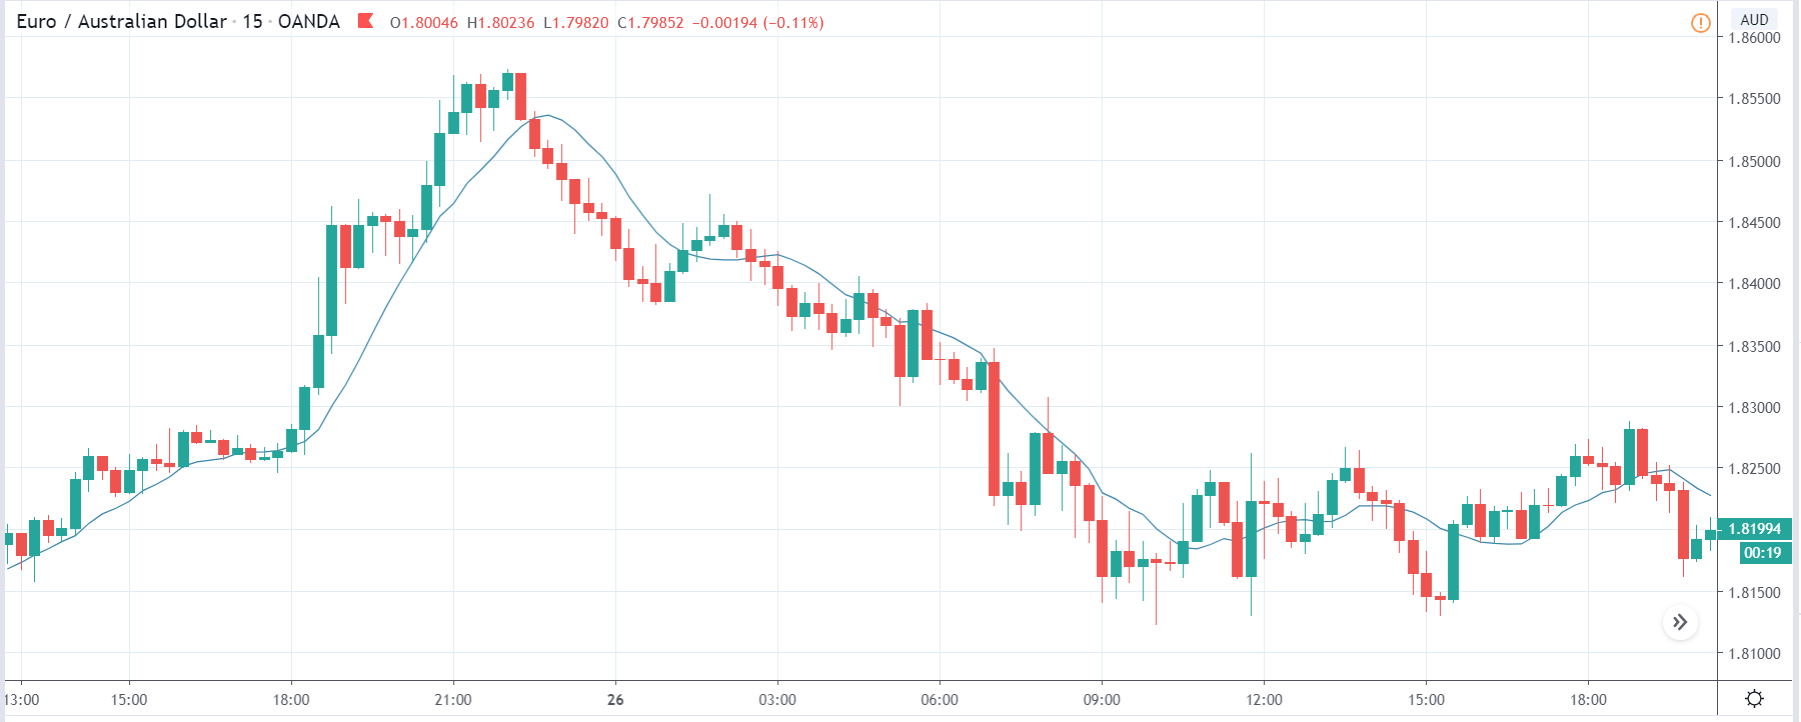
EUR/TRY | Before The Announcement

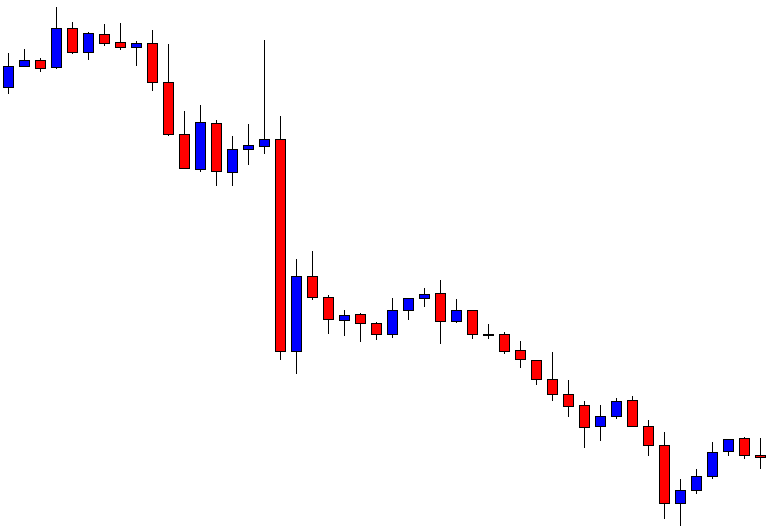
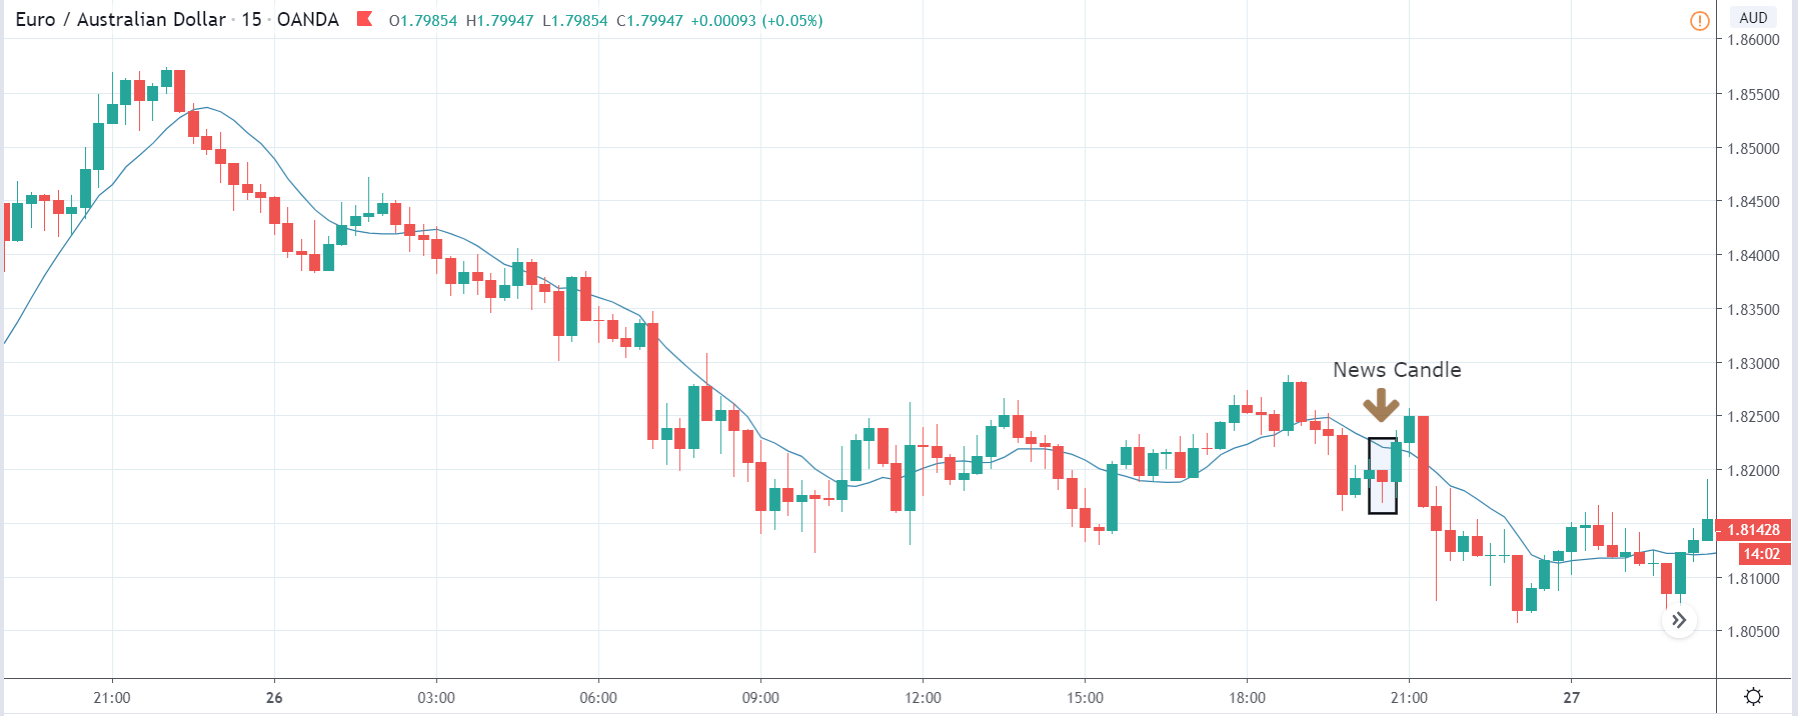
EUR/TRY | After The Announcement

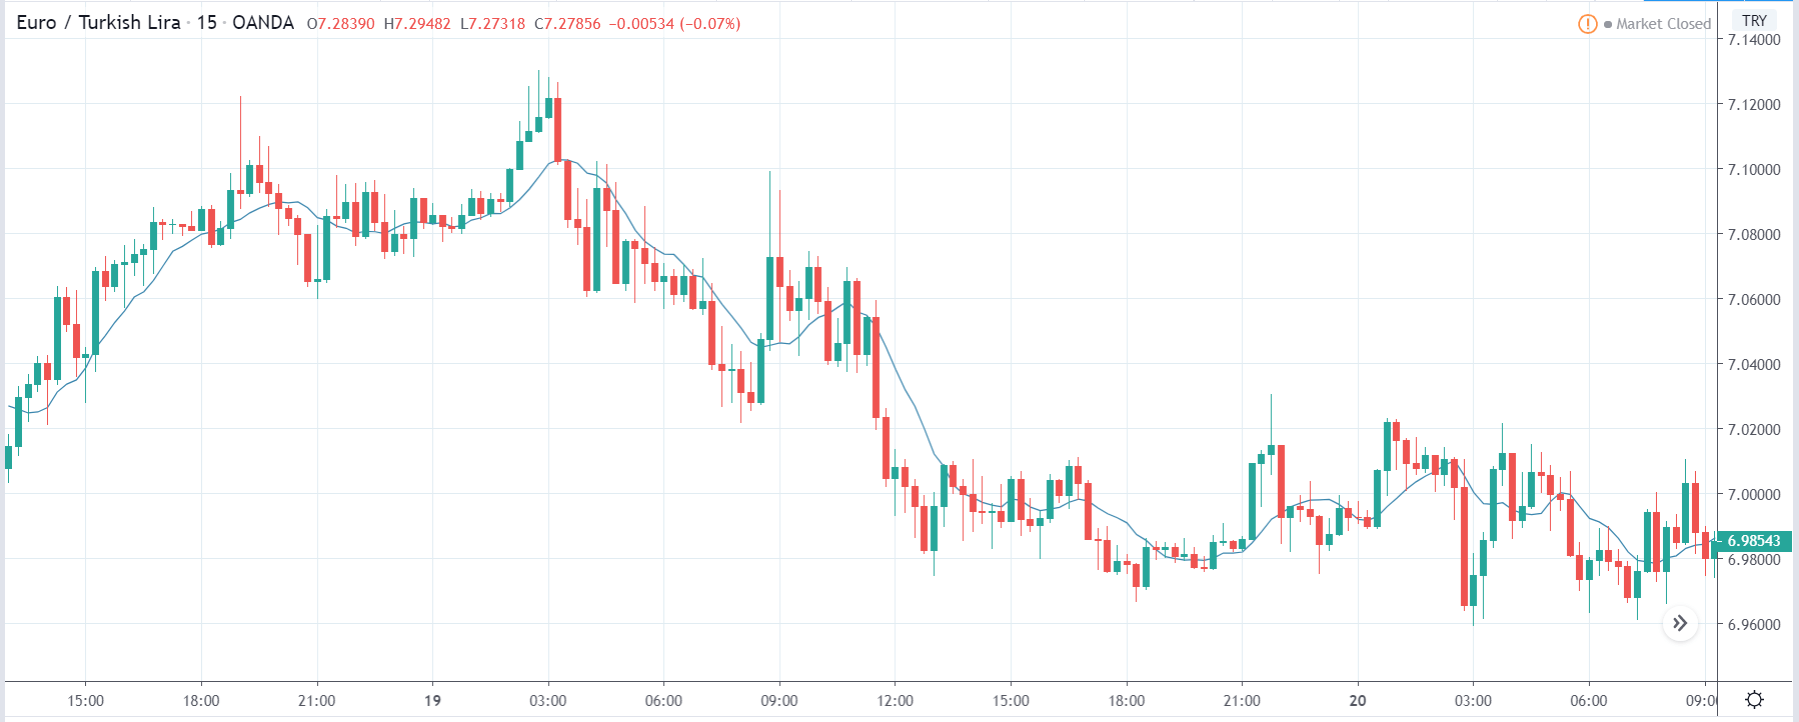
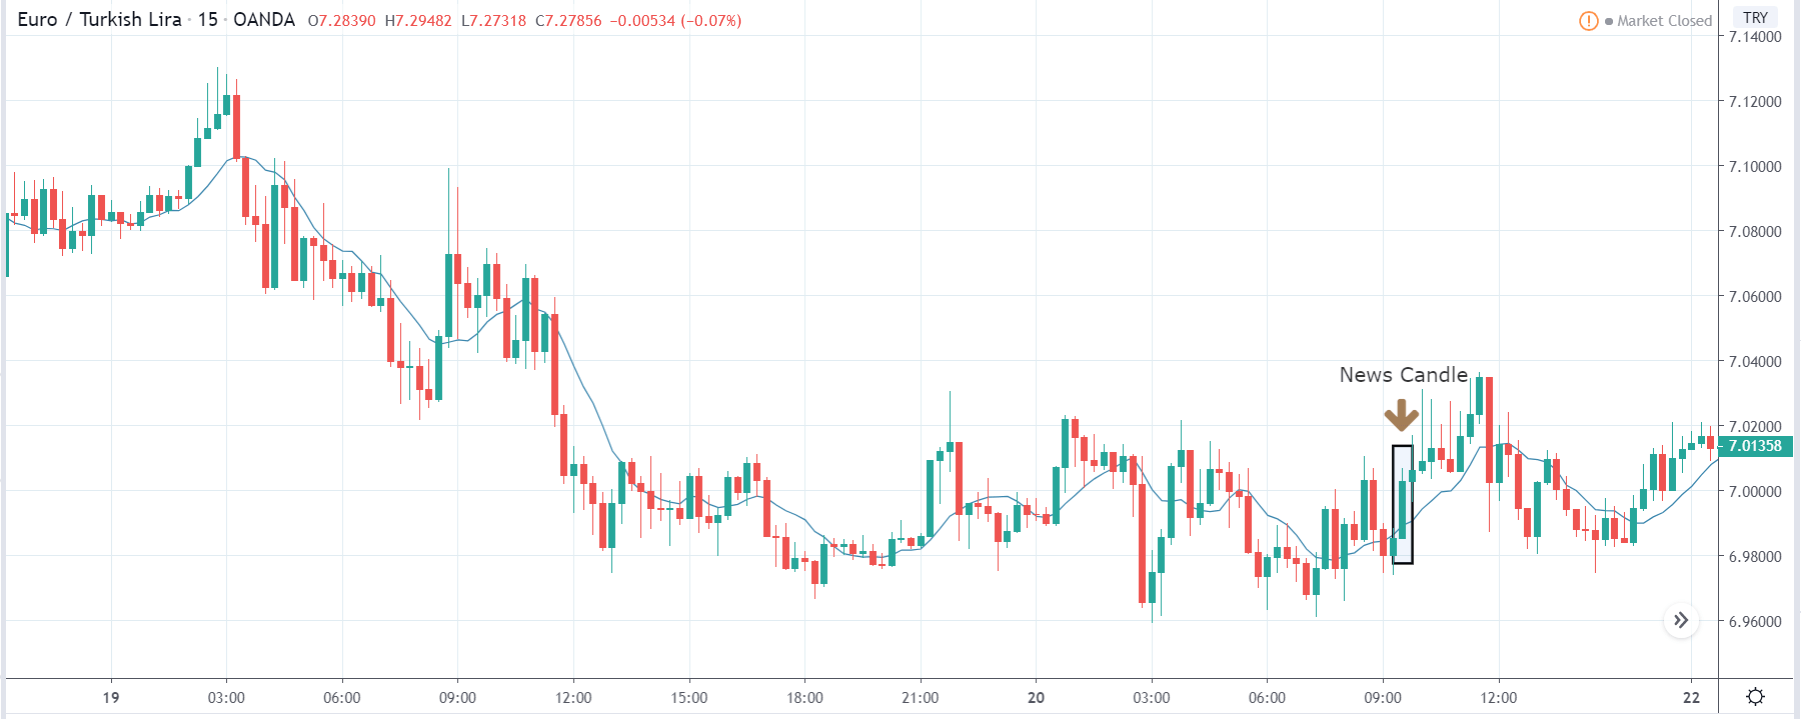
The above images are that of the EUR/TRY currency pair, and here too, the market is range-bound where the overall trend is down. Since the Turkish Lira is on the left-hand side, a ranging market indicates a moderate strength in the currency. Just before the announcement, price is at the ‘bottom’ of the range, and one can expect some buying strength in the market, which can take the price higher from here. The safer approach is to wait for the shift in volatility due to news release and then trade based on the data.

After the data is released, the market, just as in the above pairs, moves higher sharply, and traders sell Turkish Lira. The bullish ‘news candle’ indicates that the Government Debt data was extremely bad for the economy and thereby prompting traders to go ‘long’ in the pair. As now the price is at resistance, one should wait for a breakout and then ‘buy.’

That’s about ‘Government Debt’ and its impact on the Forex market after its news release. If you have any questions, please let us know in the comments below. Good luck!

Categories
Forex Market Analysis

AUD/USD Closes Below 0.6475 – Can Doji Pattern Drives Selling?

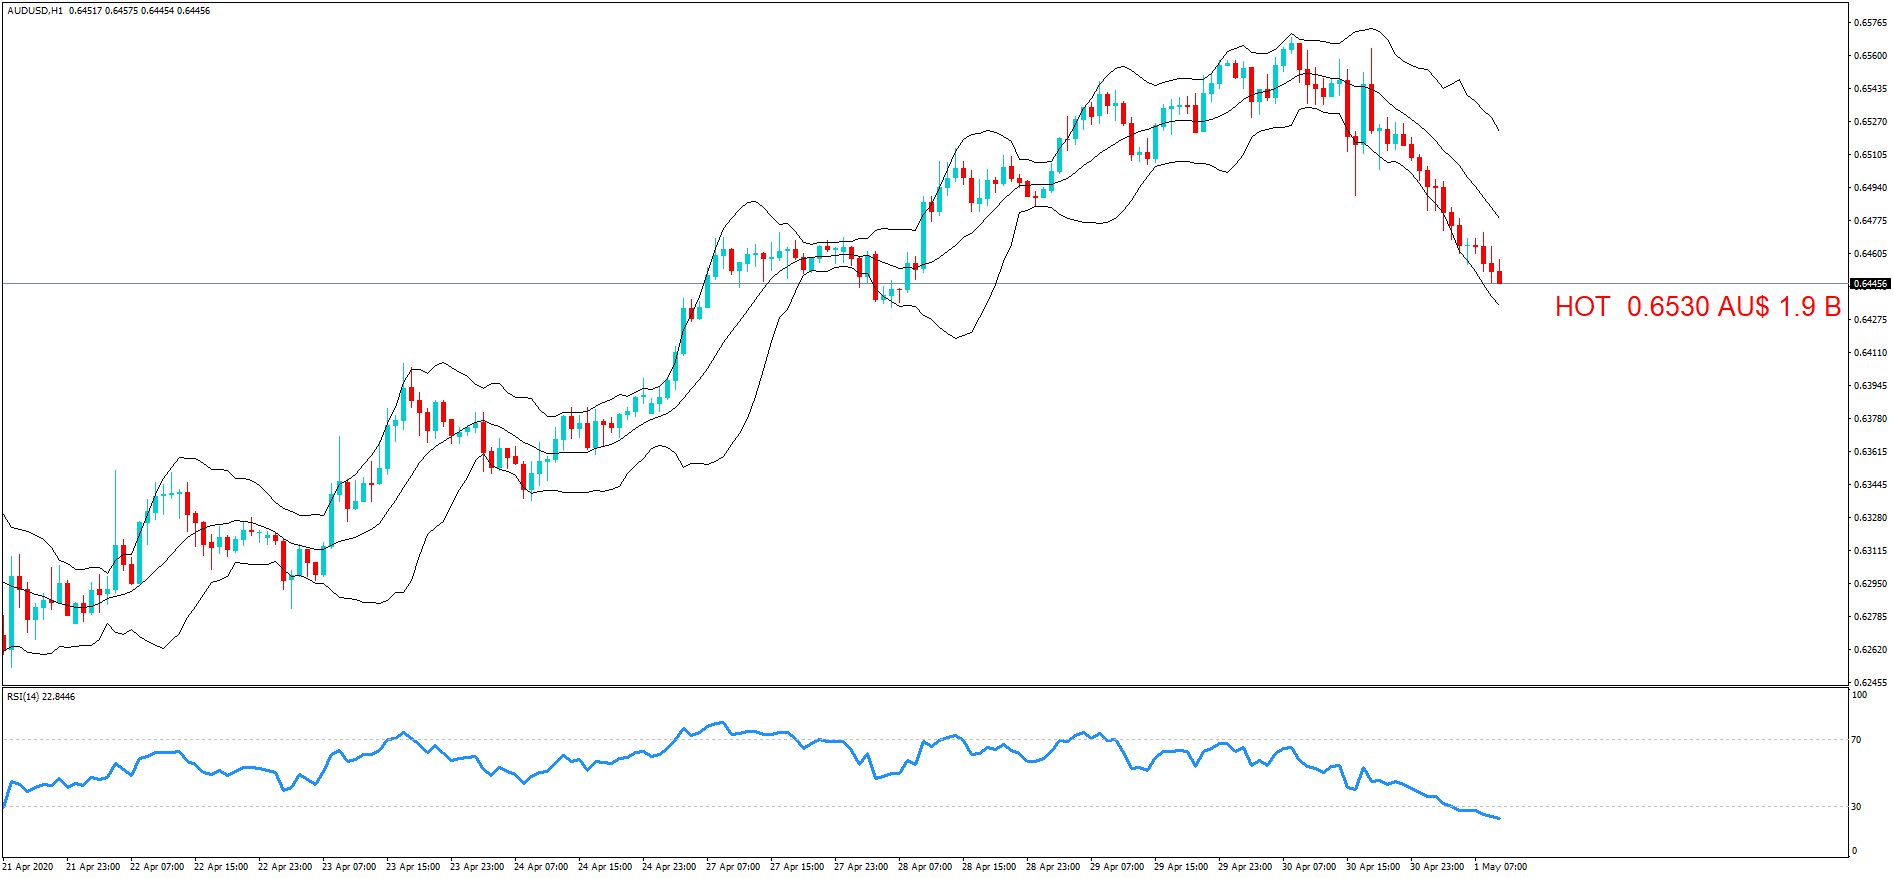
The AUD/USD pair was closed at 0.64041 after placing a high of 0.64526 and a low of 0.63934. Overall the movement of AUD/USD pair remained bearish throughout the day. The Aussie lost its ground on Wednesday on the back of US dollar strength across the board. The US dollar index rose by about 0.4% on Wednesday. The risk-off tone emerged in the market after the grim US employment report and the increasing tensions between US & China.

The US ADP employment report, which was forecasted to be declined by 20.5 Million, came in on Wednesday and showed that jobless people were count as 20.236 Million in the private sector only. This was caused by the impact of coronavirus over the economy due to the lockdown and shutdown of businesses.

Meanwhile, the US President Trump’s threat to China for imposing tariffs and canceling the phase-one trade deal has been favoring the US dollar against riskier assets like Aussie. The risk-off market tone weighed heavily to the pair AUD/USD on Wednesday.

On the other hand, the Retail Sales data from Australia for the month of March showed that the retail sales were recorded as 8.5% against the 8.2% forecasted, and this helped Aussie to pick some ground against the US dollar. Hence, Aussie abled to minimize Wednesday’s losses on the back of better than expected Retail Sales data.

Threats to China would affect Aussie more than any other country because of Australia’s trading relationship with China. That is why this pair was mostly affected even after better Retail Sales data from Australia.


On Thursday, the Trade Balance from Australia and the Unemployment claims from the United States would impact heavily on AUD/USD pair.

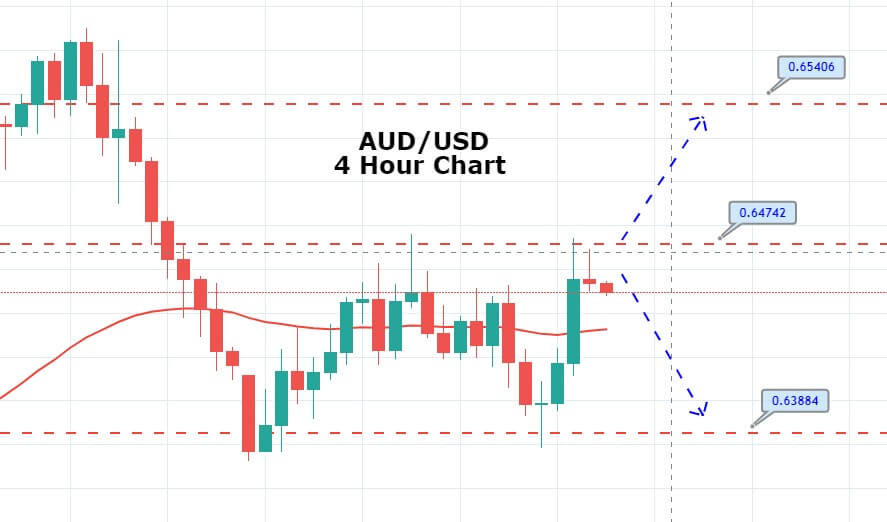
Technically, the AUD/USD prices have closed a Doji candle right below 0.6475 trading level, which can drive some selling in the market. A bullish breakout of 0.6475 level can trigger buying until the next resistance level of 0.6540. While the closing of candles below 0.6475 can keep sellers dominant until 0.615 and 0.6385 level today. Good luck! 

Categories
Forex Videos

The Free Forex Academy Signal Service! Over £18,000 made already! Part Two!

How You Can Make Money Using Forex.Academy’s Free Trading Signals Service – PART 2

Welcome to how can you make money using forex academies free trading signals service part 2. By connecting to the Forex.Academy website and clicking the tab for our Free Trading Signals Service, you will find this page.
If you haven’t seen part one, please do so because we go into great detail about the usability of the trading signals page, including the various types of the assets being traded, the types of trade setups, and details of the professional traders involved in the signals.
In this presentation we will be looking at how the signals service can help you, the trader, whether you are a novice trader or a seasoned professional, there is something here for you in this superb free signal service.

So for argument’s sake, let’s say you are a complete novice forex trader, and you have looked at the forex space and decided that you would like to take advantage of this 5 trillion dollars per day turnover business machine, which is totally recession-proof. You have a couple of options, one you can go to the trouble of learning every aspect of the forex market, including everything that you will need to know about fundamental and technical analysis, which is no mean feat because there is just so much to learn in order to become a proficient and profitable currency trader. That said, all the educational tools that you will need can be found absolutely free of charge on the Forex Academy website.

You also have the option of using a copy or mirror trading platform, where you link your forex account to a trader based on the scrutiny you have done regarding his/her track record. However, most traders will not give you a biography, and hardly any of them will speak to you directly regarding their trading approach and methodology. Also, there will be a monthly subscription cost to the mirror platform, and also a separate fee-based subscription to the trader. While you may be able to see his/her performance track record, you will not be able to analyze their trade setups, because he or she will very likely not provide that information to you. In effect, you are blindly trusting them to make you money.

Alternatively, you can use the forex Academy trading signals service, which is totally free, And where you get to choose the type of asset which is traded, from a basket of currencies and bitcoins.

And where you are provided with a biography of each trader, including their professional status within the forex market, both past, and present. And where you can find details of the trade, including the name of the asset being traded, the technical analysis name for the trade setup, up-to-date visual technical analysis charts of the setups, and a written description of the fundamental and technical analysis behind each and every trade. Our professional traders only use technical and fundamental analysis setups that are widely used in the forex trading community in order to offer you reliable trading signals.

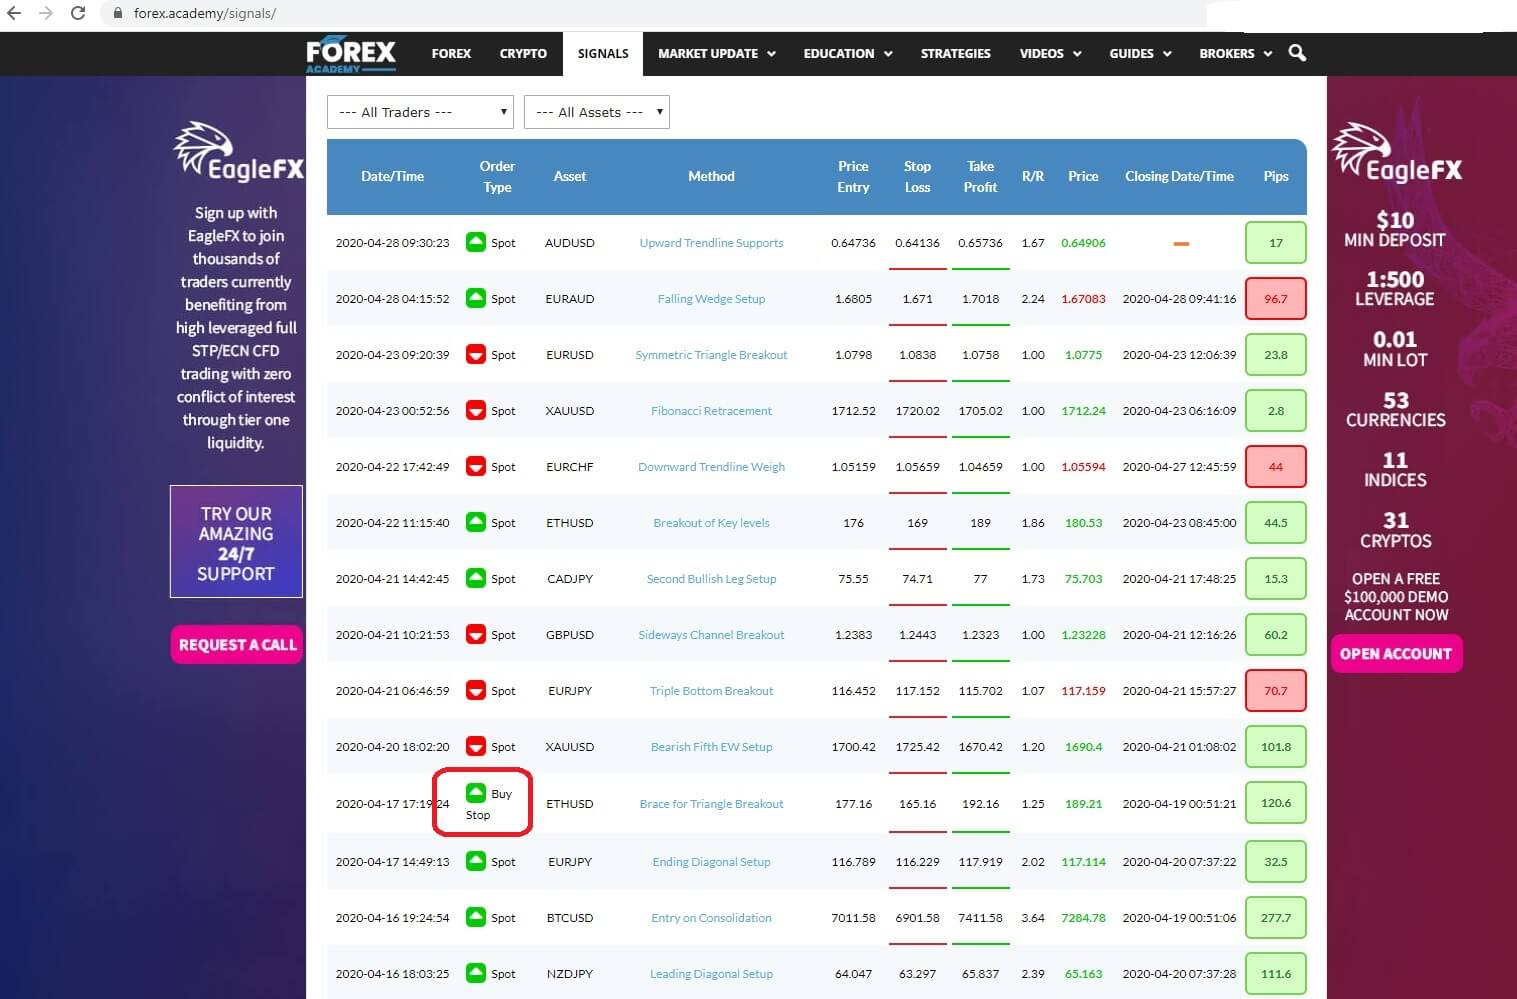
Trades will either be instant execution or pending orders and where you will be able to keep an eye on the trade table as and when these opportunities are presented, in which case you can pick and choose which trade to copy on your own trading platform. Having looked at the technical set up that the trader has uploaded in the method section, you then simply add stop loss and take profit

levels, or make adjustments to them based on your own risk preferences, and you then copy the entry price bearing in mind that if it is an instant execution you might miss a few pips unless you are monitoring the table continually. However, you would be more likely to get in at the beginning of the trade by copying pending orders such as this buy stop order.
If you would like to be notified by a free subscription service of every single trade set up, you can open up an account with eagle FX, by visiting their website www.eaglefx.com, who are our partners in this venture, and where you will benefit from high leverage and full, STP/ECN, processing which means you will have zero trading conflict with this reliable and respected broker.

Another benefit of having an account with the EagleFX is that you will also be notified automatically of key FX levels, which act as magnets for price action in the spot forex market. You can also find details of these on the forex academy website by clicking on the market update tab and scrolling down to FX options.
So, as you can see, if you are a novice trader, you have the ability to research the trade, and if you like it, you can copy them onto your own platform having confidence in the expertise of the professional trader who set the trade signal up in the first place. This will help you to grow as a trader, as you steadily learn more about trading via this unique option.
Of course, it might be that you are a seasoned trader and hence you are still happy with the methods that you find on our trade table, and perhaps you want to spend a little less time looking at setups yourself, in which case you can copy our free signals in order for you to enjoy that lifestyle choice.

Please also keep an eye out for the relevant marketplace for ‘Signal Academy’ Android and IOS trading signals apps, which we are developing and which will be available to download soon.

Categories
Forex Signals

GBPUSD bounced off supports: Regression Channel bottom and 200-SMA

The Setup

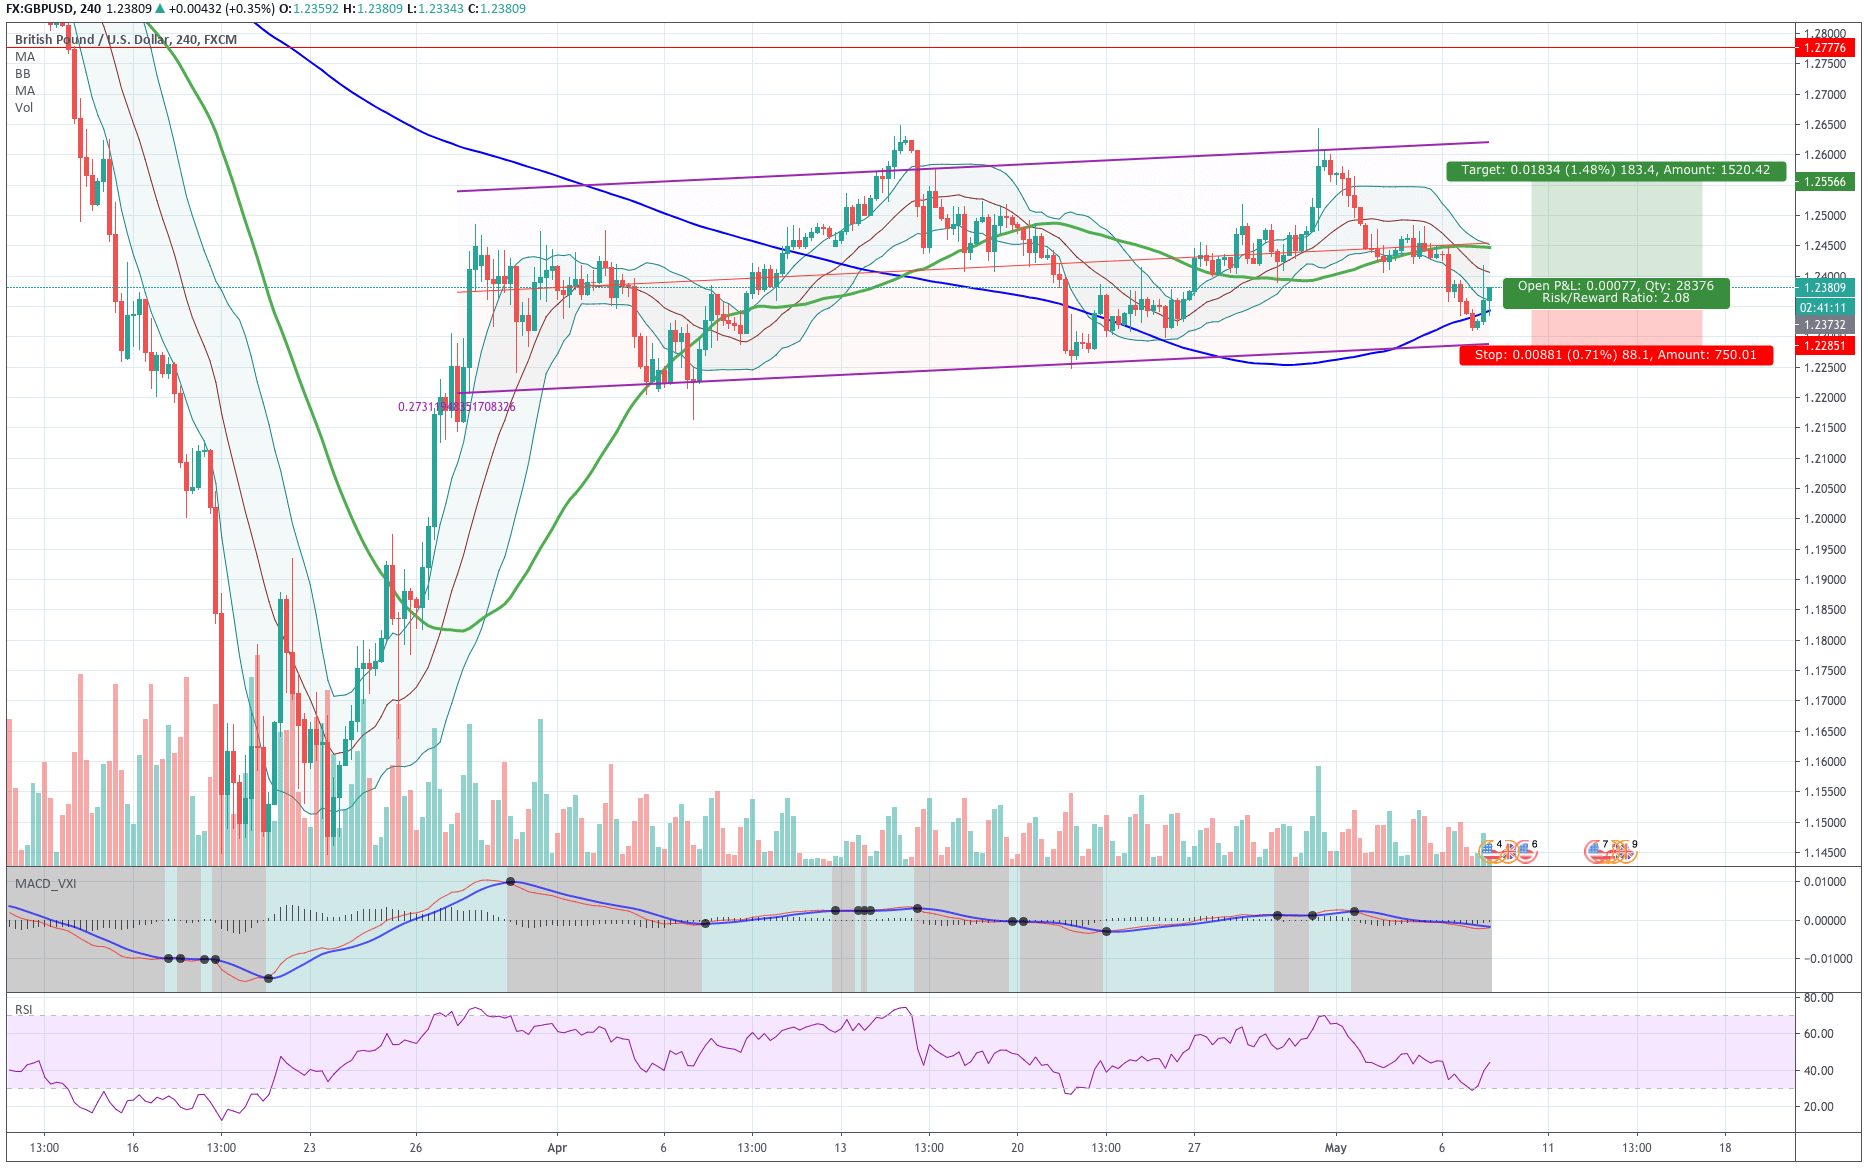
GBPUSD has created a descending leg inside a linear regression channel, which is pointing slightly upwards.  The pair has bounced near the -2Sigma line that signals the bottom of the channel. We see also that, after piercing the 200-SMA line it soon recovered and is back above it. Additionally, we see that the price has made a kind of morning star figure, with a strong candle that engulfed the last two bearish candlesticks.

A buy-stop order at the high of the last candle in progress could create a movement to the upside, seeking the top of the channel, helped by the sentiment of investors about the relief by the UK government of the confinement British people are enduring due to the COVID-19 pandemic.

Main Levels

Entry stop-buy: 1.2386
     Stop-loss: 1.2295
 Profit Target: 1.2568

Risk and reward:

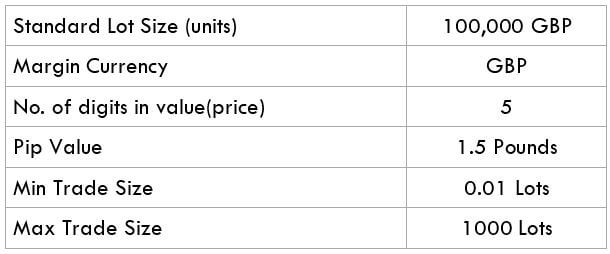
The risk is 91 pips or $910 per lot, $91 on a mini-lot, and $9.1 on a micro-lot.

The reward is 182 pips, or $1,820 per lot, $182 on a mini-lot and $18.2 on a micro-lot

The Reward-to-risk factor is 2.


Categories
Forex Course

112. Summary – Elliot Wave Theory

Introduction

Over the last six lessons, we discussed the Elliot Wave Theory from understanding the basics of applying it in the financial markets. In this article, we shall have a quick summary of the previous learnings.

The Elliot wave theory was discovered by a professional accountant named Ralph Nelson, who claimed that markets don’t move in random directions, but recurring swings called waves. Most importantly, Elliott stated that the waves are fractals. That is, each swing or wave in the market can be broken into smaller and smaller waves of the same type.

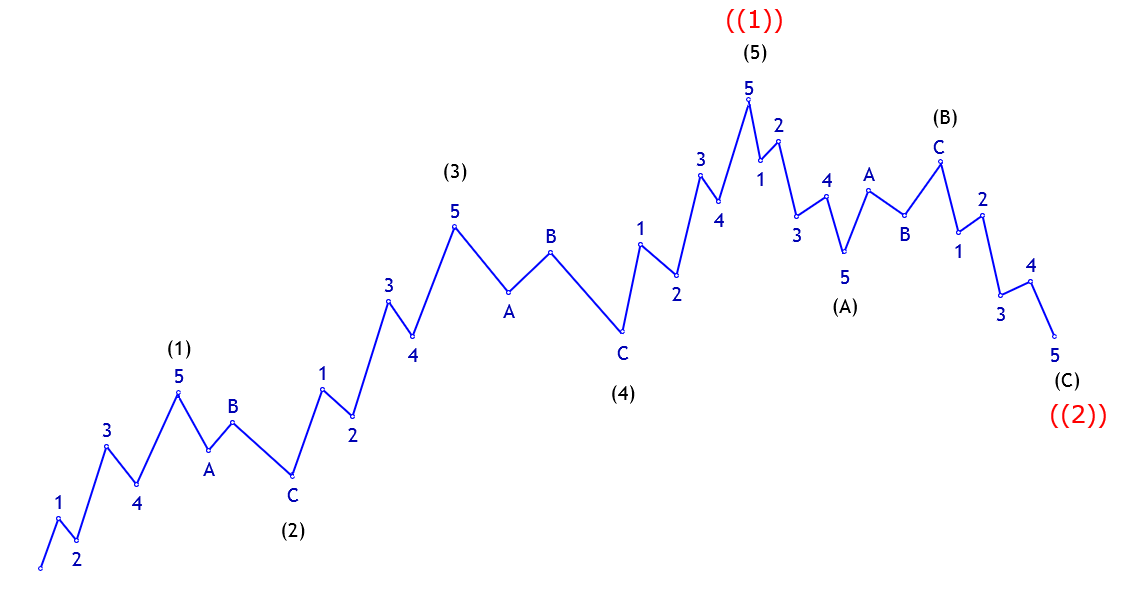
The market moves in the 5-3 Elliot pattern. This pattern is appliable on uptrend and downtrend. Also, it occurs in every timeframe.

Impulse Waves

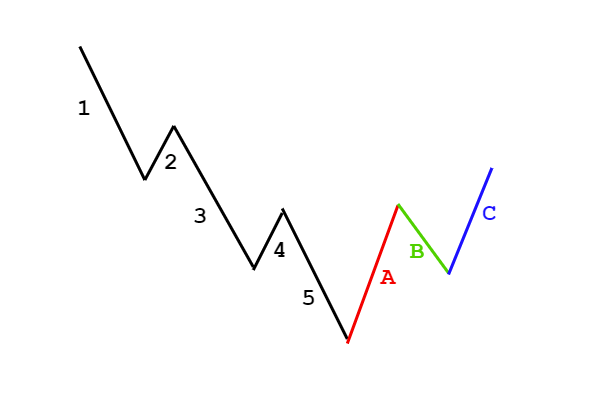
In the 5-3 wave pattern, 5 refers to the impulse waves. The 5-wave pattern is a trending wave pattern that moves along the overall trend. It is made up of 5 waves where Wave 1, 3, and 5 are impulse waves towards the trend, while waves 2 and 4 are retracements to the impulse waves. Out of the three impulse waves, wave 3 is usually the strongest and the longest and is ideal for trading.

  • Wave 1 is where only a small number of people take positions.
  • Wave 2 is where the institutional traders and some smart retail traders enter.
  • Wave 3 is where the mass public enter, while smart & professional traders exit their positions.

Corrective Waves

For every trending market, there is a pullback. And this retracement corresponds to corrective waves. The corrective waves are a 3-wave pattern that moves against the overall trend. It is denoted as wave ABC or abc, depending on the timeframe. The first corrective wave begins after the end of the impulse wave. Note that, the corrective wave pattern should not go beyond the area of wave 1 impulse wave. If it does happen, the waves must be counted from the beginning.

There are 21 types of corrective patterns based on their design. The three basic ones include

  • The Zig-Zag Formation
  • The Flat Formation
  • The Triangle Formation

Rules in Elliot Wave Theory

There are three rules in the Elliot wave pattern to confirm the legitimacy of the pattern. The strategies will hold true only if the following strategies are satisfied.

  • Rule 1: Wave 3 must never be the shortest impulse wave.
  • Rule 2: The Wave 2 must hold above Wave 1.
  • Rule 3: Wave 4 must never cross in the price area of Wave 1.

Even if one of the rules is not satisfied, waves must be recounted from the start.

We have also discussed different ways of trading the Forex market using the Elliot wave theory, and that lesson can be found here.

Final words

The Elliot Waves are a great tool in determining the direction of the market. One can get a clear understanding of if the market is trending or retracing. Accordingly, one can take a trading decision by adding other tools which will help in precise entries.

We hope you found the Elliot Wave theory course informative and useful. Do try this out for yourselves as well. Happy trading!

Categories
Forex Options

FX option expiries for May 7 New York cut

Thank you for visiting the Forex.Academy FX Options Expiries Section. Each day, where available, we will bring you notable maturities in FX Options of amounts of $100 million-plus, and where these large commutative maturities at specified currency exchange rates often have a magnetic effect on price action, especially in the hours leading to their maturities, which happens daily at 10.00 AM Eastern time. Each option expiry should be considered ‘in-play’ if labelled as Hot, Warm, or ‘out of play’ if labelled Cold with regard to the likelihood of price action meeting the strike price at maturity.

…………………………………………………………………………………………………………………..

FX option expiries for May 7 NY cut

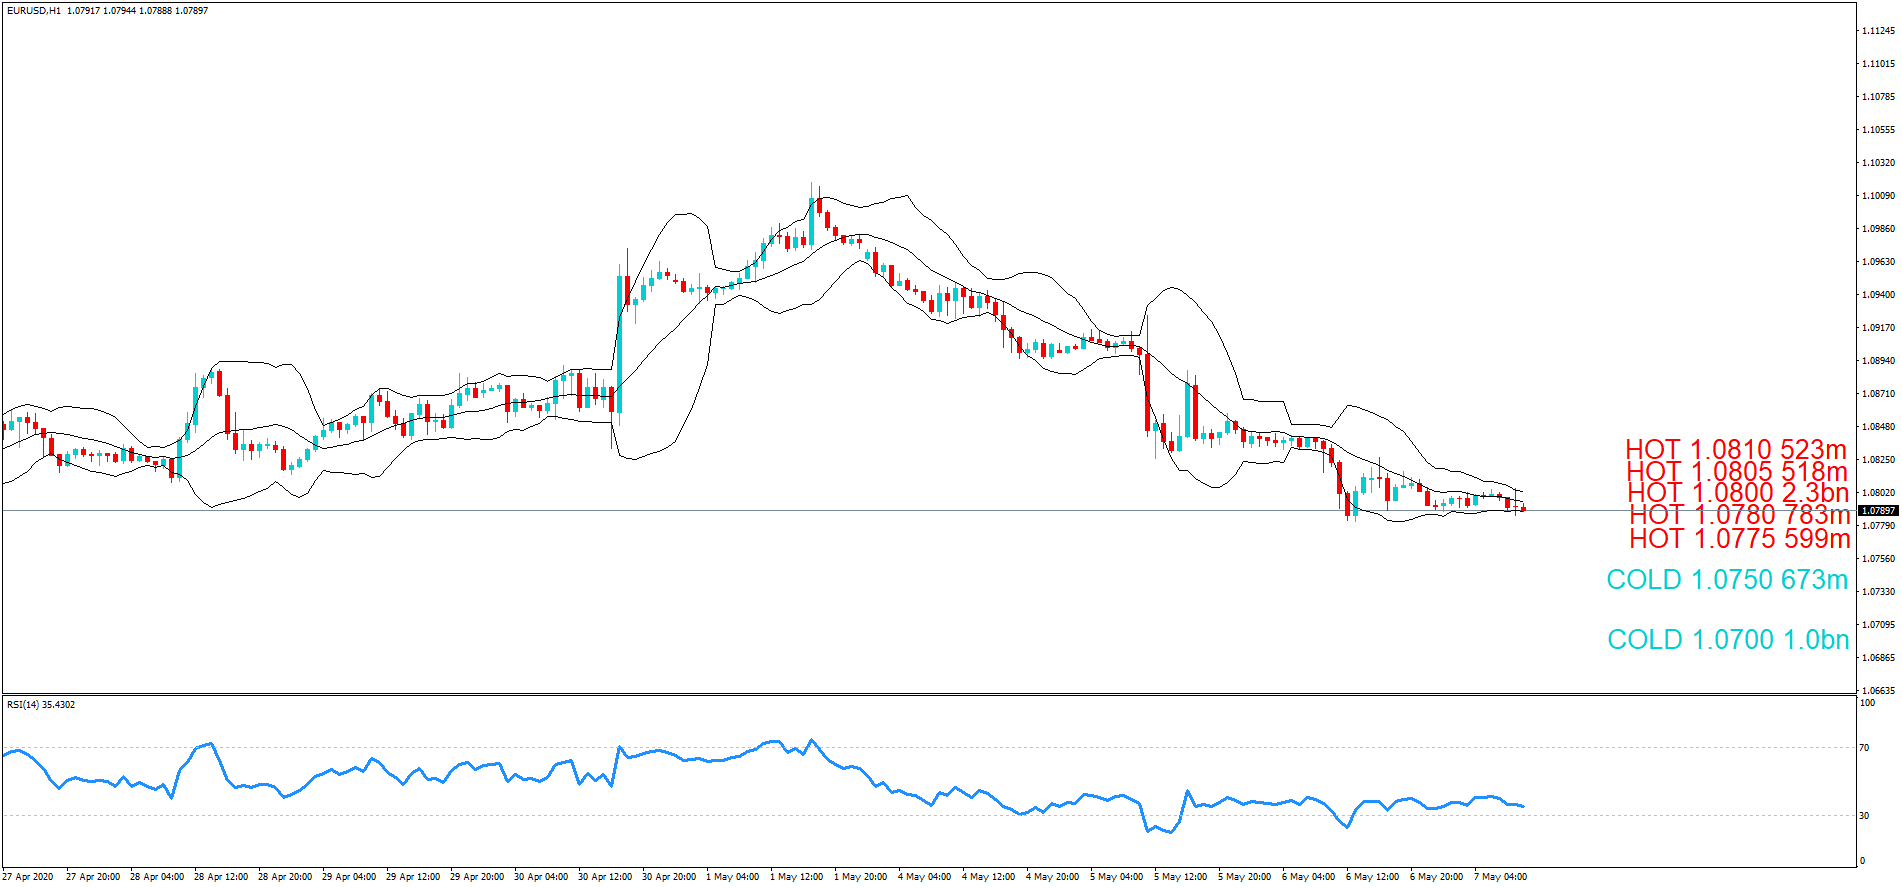
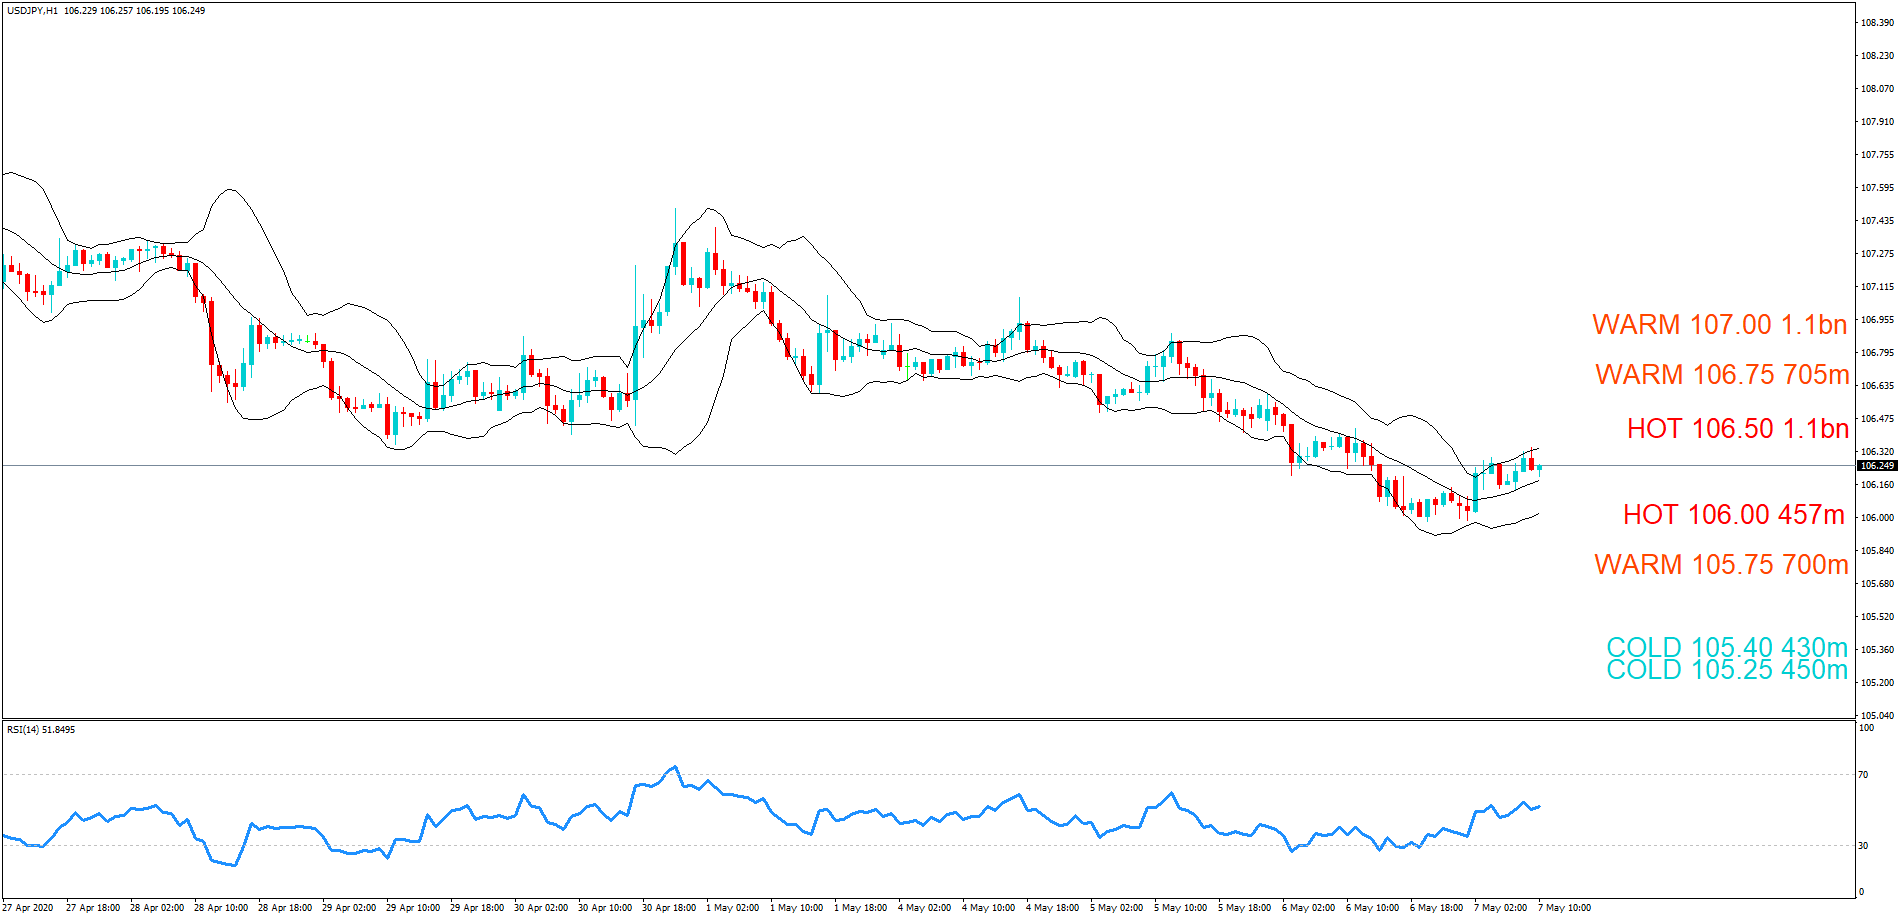
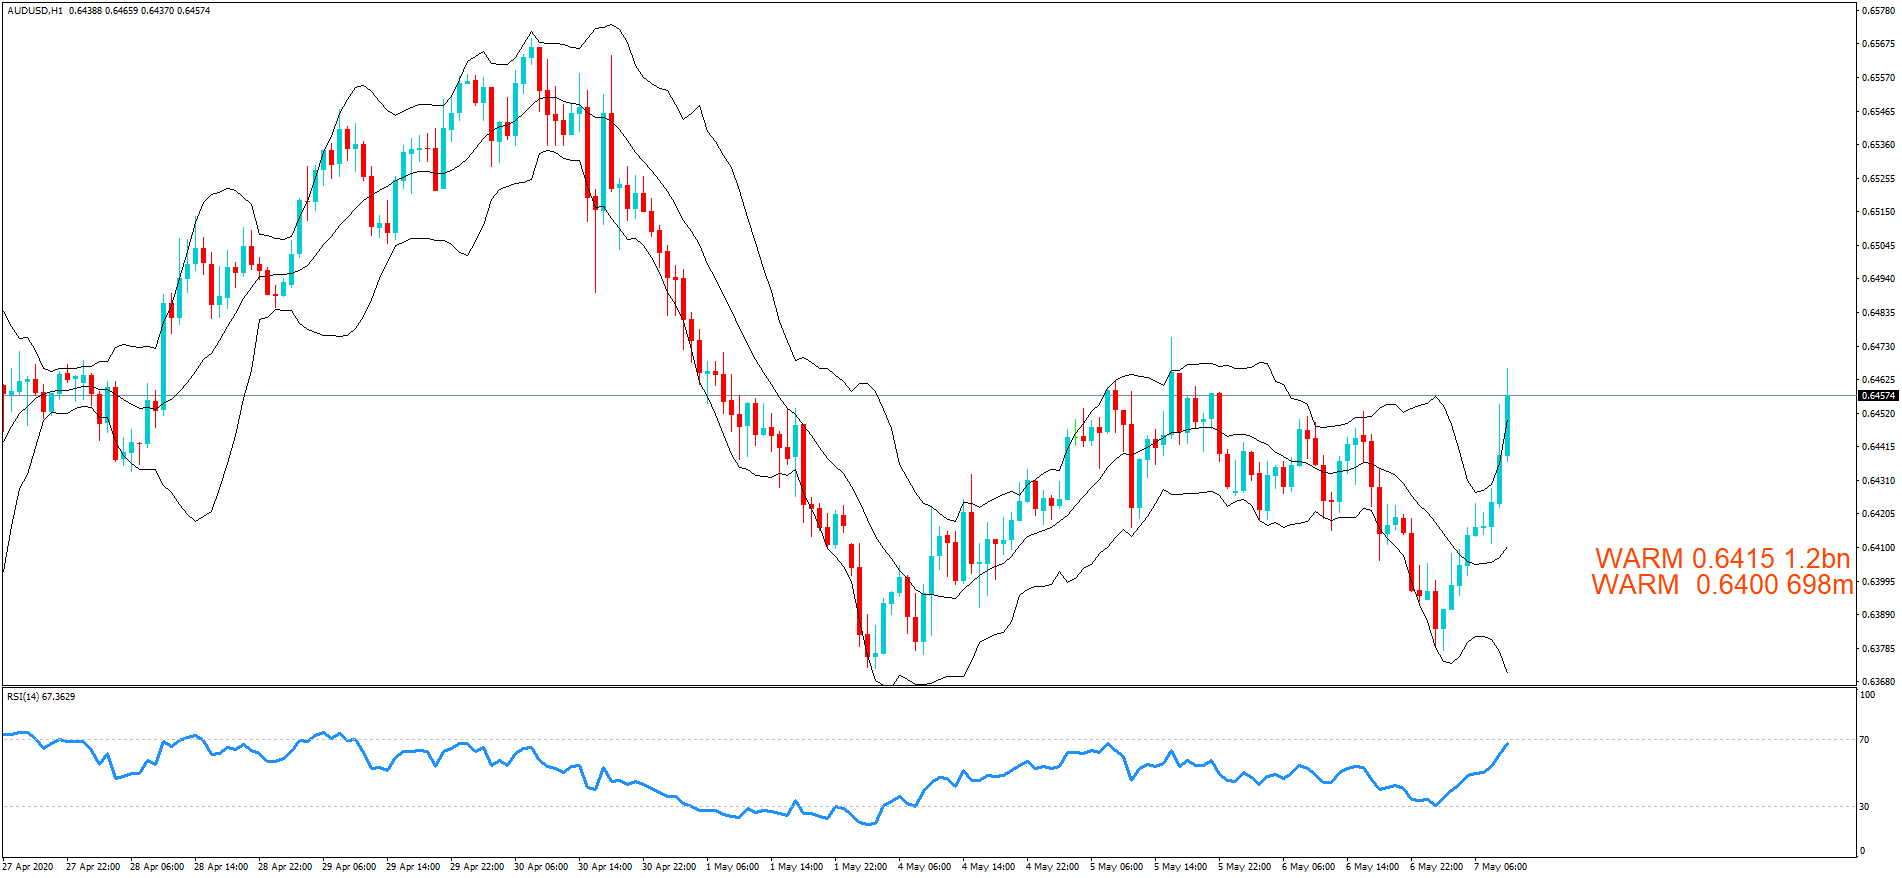
FX option expiries for May 7 NY cut at 10:00 Eastern Time, via DTCC, can be found below.

– EUR/USD: EUR amounts

  • 1.0700 1.0bn
  • 1.0750 673m
  • 1.0775 599m
  • 1.0780 783m
  • 1.0800 2.3bn
  • 1.0805 518m
  • 1.0810 523m

– USD/JPY: USD amounts         

  •  105.25 450m
  •  105.40 430m
  •  105.75 700m
  •  106.00 457m
  •  106.50 1.1bn
  •  106.75 705m
  •  107.00 1.1bn

– AUD/USD: AUD amounts

  • 0.6400 698m
  • 0.6415 1.2bn

………………………………………………………………………………………………………………

If you want to learn how forex option expiries affect price action in the spot FX market see our educational article by clicking here: https://bit.ly/2VR2Nji

DISCLAIMER: Please note that this information is for educational purposes. Also, heat levels may change throughout the day in line with the exchange rate fluctuations due to technical analysis trading and upcoming economic data releases of the associated pairs.

Categories
Forex Market Analysis

Daily F.X. Analysis, May 07 – Top Trade Setups In Forex – Braces for BOE Policy Decision! 

The greenback gained against most of its rivals and became the best performer along with JPY on Wednesday. Despite the loss of 20 million jobs in U.S. private payrolls, the U.S. dollar still managed to remain high on board. The ADP Non-Farm Employment change showed that during April, about 20236K people reported as jobless against the 20500K of expectations. Brace for U.S. Jobless Claims…

Economic Events to Watch Today


EUR/USD – Daily Analysis

The EUR/USD prices were closed at 1.07957 after placing a high of 1.08458 and a low of 1.07817. Overall the movement of the EUR/USD pair remained bearish throughout the day. The EUR/USD posted losses for 3rd consecutive day on Wednesday amid the new economic forecast by the European Commission. The COVID-19 pandemic has driven the European Union into a deep and uneven recession due to the contraction of national economies amid the disruptive work, daily life, and the movement of goods. 

The new economic forecast by the European Commission came in after weeks of industrial shutdowns and social restrictions due to coronavirus pandemic. The economy of the whole Euro-region was forecasted to shrink by 7.5% this year after the increased unemployment, public debts, and the steps taken by the government to contain the virus spread. The forecasted decline in the economy is far worse than the contraction of around 4.5% during the Great Recession.

According to the European Commission, the economies of Italy, Spain, and Greece will see the contraction of more than 9% this year. The news gave a negative impression of the single currency and hence weighed on EUR/USD on Wednesday.

At 11:00 GMT, the German Factory Orders for the month of March were dropped by -15.6% against the expected drop of 10.0% and weighed on EUR. At 12:15 GMT, the Spanish Services PMI came as 7.1 against the expected 10.0 to weigh on EUR. At 12:45 GMT, the Italian Services PMI exceeded the expectations of 9.2 and came in as 10.8 in the month of April and supported EUR. 

However, at 12:50 GMT, the French Final Services PMI came in line with the expectations of April as 10.2. At 12:55 GMT, the German Final Services PMI for April exceeded the expectations of 15.9 and came in as 16.2 to support EUR. However, the Final Services PMI for the whole bloc came in line with the expectations of 12.0. At 14:00 GMT, the Retail Sales for the month of March dropped the same as expected by 11.2%. Most data from Europe side came against EUR and hence weighed on EUR/USD prices on Wednesday.

Daily Support and Resistance

  • R3 1.0901
  • R2 1.0875
  • R1 1.0834
  • Pivot Point 1.0808
  • S1 1.0768
  • S2 1.0741
  • S3 1.0701

EUR/USD– Trading Tips

The EUR/USD price fell sharply from 1.0820 zones to place a low of around 1.0783. Closing of candles above this level is suggesting odds of bullish retracement. Continuation of buying above 1.078 can lead the pair towards the next resistance level of 1.0832 level. The EUR/USD pair has dropped below the double top resistance level of 1.0817, and the closing of candles below this level may extend selling bias until 1.0752. The EMA is still suggesting selling bias. Therefore, we may see selling below 1.0817. While bullish crossover above 1.0817 can lead to EURUSD prices towards 1.0865.

GBP/USD – Daily Analysis

The pair GBP/USD was closed at 1.23413 after placing a high of 1.24499 and a low of 1.23349. Overall the movement of GBP/USD remained bearish throughout the day. The GBP/USD pair on Wednesday posted losses for the 4th consecutive day and hit a fresh weekly low near 1.2330. The drop in GBP/USD pair was attributed to the strength of the U.S. dollar across the board.

Greenback gained against most of its rivals and became the best performer along with JPY on Wednesday. Despite the loss of 20 million jobs in U.S. private payrolls, the U.S. dollar still managed to remain high on board. The ADP Non-Farm Employment change showed that during April, about 20236K people reported as jobless against the 20500K of expectations.

Twenty million loss in U.S. private payroll was under the expected figure, so the U.S. dollar gained traction in the market on the back of the view that data came better than the expectations. Strong U.S. dollar weighed heavily on the GBP/USD pair and dragged its prices on Wednesday.

On the British side, the economic data about the Construction PMI for the month of April showed a decline to 8.2 against the expectations of 21.5 and weighed on GBP. Weaker than expected data from Britain caused pressure on Sterling and added in the downward movement of GBP/USD on Wednesday.

However, the mood towards Pound may change into positive on the next day when the Bank of England is due to announce its May monetary policy. Although no change in the interest rates will be seen given the circumstances, the nature of talks and comments on the British economy will be under consideration by traders.

Daily Support and Resistance

  • R3 1.2534
  • R2 1.2492
  • R1 1.2417
  • Pivot Point 1.2376
  • S1 1.2301
  • S2 1.226
  • S3 1.2185

GBP/USD– Trading Tip

The GBP/USD has traded in line without a previous forecast to test the support level of the 1.2318 level. The recent formation of inside up bar on the 4 hour time is suggesting odds of buying in the GBP/USD pair. On the higher side, the GBP/USD pair may find support around 1.2315 level, while resistance is likely to be found around 1.2385 and 1.2420 level. The 50 EMA lingers around 1.2470 level, and below this, we can expect additional selling in the GBP/USD pair. We are already keeping our sell limit around these levels. 

USD/JPY – Daily Analysis

The USD/JPY was closed at 106.102 after placing a high of 106.617 and a low of 105.985. Overall the movement of USD/JPY remained bearish during the day. On Wednesday, the pair USD/JPY was dropped for the 4th straight day towards 105 level and remained under heavy selling pressure. The downfall in the USD/JPY pair seemed somewhat to ignore the strong buying of the U.S. dollar on Wednesday.

The latest ADP report about the private-sector jobs showed that employment in the Non-farm industry was declined by 20.236 million in April as compared to the decline of 149K in March. Greenback showed a muted reaction to this report by ADP on Wednesday because the figure came in less than the expected decline of 20.500 million, but the decline itself was huge.

Meanwhile, the downward trend of USD/JPY was continuous, which could be attributed to the worsening of US-China relations. After the threats given by the U.S. President Donald Trump to cancel the phase-one deal and impose new tariffs on Chinese goods, the risk-off market sentiment has been triggered and causing a drop in USD/JPY prices.

All of the threats given by Trump came on the back of arguments about the origin of coronavirus and its global spread. The count of jobless people increased to more than 20 million people from the U.S. private sector, and the coronavirus pandemic caused this. The lockdown of economic activities has caused millions of people jobless. As a result, the U.S. dollar extended its decline against the Japanese Yen and moved below 106 level. Furthermore, the downfall in USD/JPY prices on Wednesday below 106 level could also be attributed to the technical selling for crossing the horizontal support near the mid-106 level. 

Daily Support and Resistance    

  • R3 107.19
  • R2 106.91
  • R1 106.54
  • Pivot Point 106.26
  • S1 105.88
  • S2 105.61
  • S3 105.23

USD/JPY – Trading Tips

The technical side of USD/JPY is still bearish. However, the pair is showing some bullish correction, which may lead it towards 106.289. The pair has already violated the symmetric triangle, which was extending support at 106.700. As we can see in the 4-hour chart above, the USD/JPY is holding below the symmetric triangle, which is now extending resistance around 106.650. The 50 M.A. is also keeping pressure on the pair around the same level of 106.650. Below this level, we may see a selling trend in the USD/JPY pair until the next target levels of 106.

All the best for today! 

Categories
Forex Fundamental Analysis

Does The News Release Of ‘Gasoline Prices’ Impact The Forex Market?

Introduction

Despite the advent of alternate and renewable sources of energy, Oil remains the largest consumed non-renewable energy resource on the planet. Even after the Greenhouse effect debates, pollution, etc. we are still using Oil in a big way.

Although a shift has begun, a complete switch out of Oil will definitely take some decades and a lot of technological innovations. Gasoline Price is very closely tied to Consumer Expenditure, and many industrial activities, volatility in Gasoline Prices, affects the economy directly. Hence, understanding of Gasoline Price changes, its causes and consequences are essential for us in assessing macroeconomic indicators like Inflation, Personal Consumption Expenditures, or Consumer Prices Index, etc.

What is Gasoline Price? And Why is it important?

Gasoline is a carbon-based fuel that is extracted from Crude Oil through a process of distillation and refinement. Crude Oil is dark, heavy, and a sticky liquid that is naturally formed inside Earth. It is extracted, boiled to varying degrees, to distill away impurities to obtain purer forms like Diesel, Petrol (or Gasoline), or Fuel Oils, etc. Gasoline is lighter and is more in demand in the market.

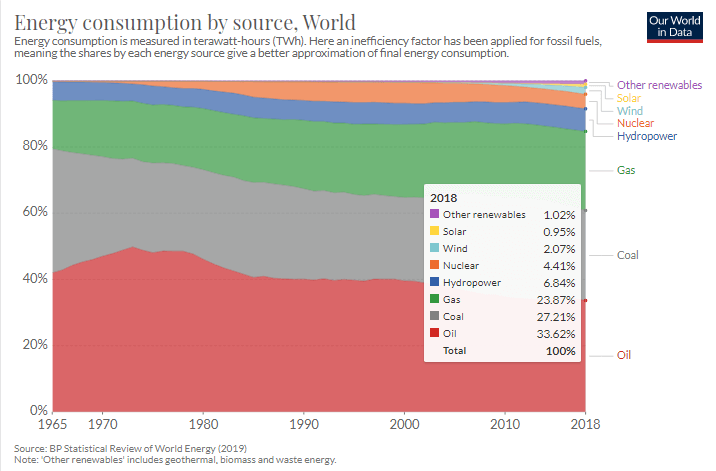
As shown below, Oil is still the largest consumed energy source in the world, accounting for about 34% of all energy sources consumed. Gasoline is one of the first products that is obtained from Crude Oil. The general population and many industries depend on Gasoline heavily to conduct their lifestyle. Today almost, every household has a car or bike that requires Gasoline.

Changing Gasoline prices have a direct effect on the general public and dependent industries like Transportation sectors. Increasing Gasoline prices are always followed by a bitter reaction from the public as it increases their daily expenditures, how industries ship goods.

Gasoline prices are dependent on the following critical factors

(Source: gaspricesexplained.com)

Crude Oil Prices: The raw material used for Gasoline production primarily drives the Crude Oil Price as per the United States Energy Information Administration. Crude Oil is available on almost all the continents, except Australia, where it is quite less relatively. Countries like Saudi Arabia, Venezuela have the most abundant reserves of Crude Oil and are essential players in the global Oil market.

The process of extraction is also dependent on terrain where Crude Oil is found. For example, in Canada, the sandpits of Alberta make it challenging to extract Crude Oil that makes it relatively expensive.

Refining: The number of impurities present in the extracted Crude Oil also categorizes the Oil into “sweet or sour Oil.” Sweeter/Lighter Crude Oil contains lesser impurities and hence is easier to refine. The heavy or sour Oil is more abundant and relatively less in demand. The sweet is the more preferred Oil and is the standard when we see Crude Oil pricing. Refining costs vary seasonally as different parts of the world have to follow different mandates on pollution levels, refining technologies available in the regions. Other ingredients like ethanol that are mixed into Gasoline are also minor factors.

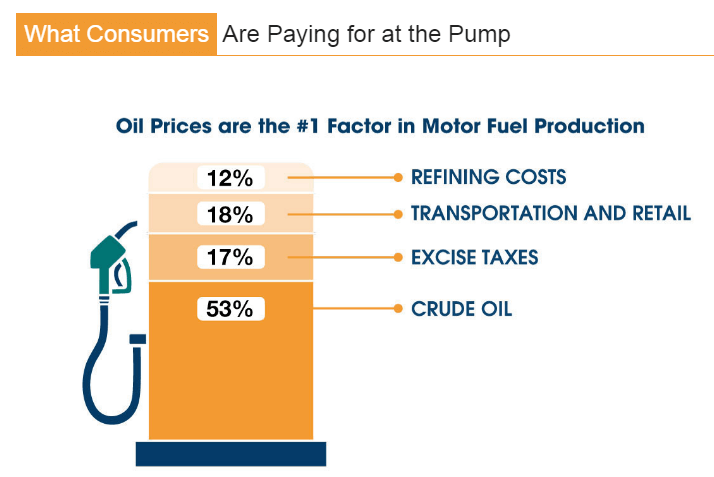
Taxes: Taxes add to the Gasoline prices. The Governing body of the country imposes the excise taxes that add to the final consumer price. As of now, on average, all taxes, i.e., federal and local state taxes, included average to 17% of the total Gasoline price.

(Picture Credits: gaspricesexplained.com)

Transportation: Most of the Gasoline is shipped from refineries by pipeline to terminals near consumer regions. It is delivered through tanker trucks to individual gas stations. The price of all this transportation cost and profits are included in the final price. The taxes and transportation costs remain largely constant relative to the Crude Oil price volatility.

Organization of the Petroleum Exporting Countries (OPEC): It is an organization of 12-oil major producing countries that make up 46% of the world’s oil production. They regulate the price of fuel to sustain this non-renewable resource for an extended period.

Speculation: Energy traders speculate Oil prices frequently that drive up or down the Oil prices based on their projected views about the future Oil prices. The volatility is increased due to speculation and tends to create an asset bubble.

How can the Gasoline Price numbers be used for analysis?

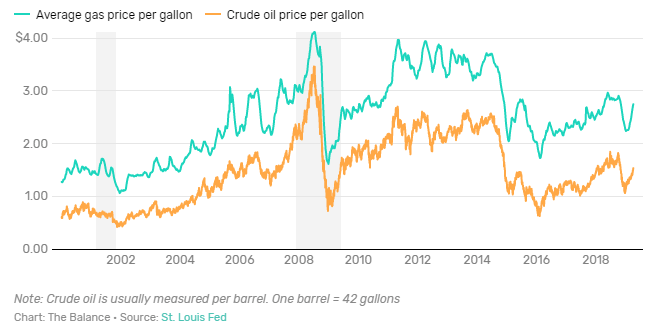
There is a positive correlation between Gasoline and Crude Oil prices in general. The dependency on Gasoline, a high growth rate of the emerging countries, increasing world population, etc. all have increased the demand for Gasoline overtime. For now, there is no significant alternative to compete with Gasoline. Other options like Natural Gas, Electric vehicles are in their budding state and would take some years before they can become worthy alternatives.

Gasoline is a daily consumption, a non-durable commodity that is required by every country. There is no country as of now that is entirely Gasoline-independent. Every country uses Gasoline for one or the other purposes as it has 84% fuel efficiency when burnt (meaning 84% of it is converted into energy).

As attempts to significantly switch to alternate sources of energy are being made, there is still some time left before we see renewable alternatives to Gasoline.

Impact on Currency

An increase in Gasoline Prices is reflected in the Personal Consumption Expenditures reports. As fewer people are able to afford highly-priced Gasoline, Industries dependent on Gasoline mainly observe a cut in their profits that slows down their business. To avoid this, they may increase prices of their end product to compensate for this increase, which again inflates the economy further. The rising costs of Gasoline are terrible for the economy and the currency. It leads to price rises lead to currency depreciation.

Lowered Gasoline prices, stimulate consumption, and increases expenditure in other sectors by public and dependent industries. Changes in Gasoline prices due to Crude Oil price changes take about 4-6 weeks to translate. Gasoline prices are lagging indicators for the Energy traders and have a low impact on the Energy trading community. On the other hand, prolonged increases in Gasoline prices has long term depreciating impact on the currency and the economy.

Economic Reports

Gasoline prices are available daily on the internet on many websites. For the United States, The United States Energy Information and Administration releases the weekly Petroleum status report on its official website.

The OPEC’s Monthly Oil Market Report details the significant causes affecting the world Oil Market that is published on the 12-16th of every month on their website.

Sources of Gasoline Prices

Global Oil market prices & News can be found in the below-mentioned sources.

Oil PricesOPEC – Oil Prices and reserves dataOPEC MOMRGlobal Gasoline Prices – Trading Economics | EIA – Weekly

Impact of the ‘Gasoline Prices’ news release on the price charts 

Gasoline Prices have a major role to play went it comes to the development of the nation. Everyone knows that higher Gas Prices will make each of to pay more at petrol bunks, leaving less to spend on other goods and services. It not only has an effect on the public on an individual level, but higher gas prices also have an effect on the broader economy. Economists and analysts also believe that there is a direct correlation between consumer confidence, spending habits, and gas prices. As gas prices decrease, a large percentage of institutional traders feel that the economy is ‘getting better.’ By this, we can say that the announcement of Gasoline Prices have a major impact on the currency pairs and can cause moderate to high volatility in the pair.

In today’s article, we will be analyzing the impact of Gasoline prices of North America on the U.S. dollar. The Gasoline Prices are published on a Weekly, Monthly, and Annual basis by the U.S. Energy Information Administration. They also provide a statistical analysis of the report. The above image shows the weekly retail Gasoline Prices.

AUD/USD | Before The Announcement

We start our analysis with the AUD/USD currency pair, and the above image shows the state of the chart before the Gasoline Prices are announced. The market essentially is moving in a ‘range’ where the price is repeatedly reacting from ‘resistance’ equals ‘support’ area. Also, the overall trend remains to be up. In such a market scenario, it is prudent to wait for the news announcement and then trade based on the change in volatility in the market. As the Gasoline Price economic indicator is a highly impactful event, there can be extreme movements in the market on either side. However, technically, the bias is on the ‘buy’ side.

AUD/USD | After The Announcement

After the weekly Gasoline Prices are released, price drops sharply, and volatility increases on the downside, owing to a decrease in the Gasoline Prices compared to the previous week. As the U.S. dollar is on the right-hand side of the pair, to buy the U.S. dollar, we need to sell the currency pair. This is why we see a fall in the price after the data is announced, which was positive for the U.S. economy. Even though the market reacted to the news release on expected lines, we should not forget that the price is exactly at the bottom of the range. It is not surprising to see buying strength from here, and therefore we should wait for key levels to be broken to trade based on the News.

EUR/USD | Before The Announcement

EUR/USD | After The Announcement

The above images represent the EUR/USD currency pair. Looking at the first image, we can say that the market is in a downtrend that began recently. Since the selling pressure is above average in the pair, a news announcement that is positive for the U.S. economy is favorable for taking a ‘short’ trade in the pair. On the other hand, we can look to ‘buy’ the pair only if the news release is extremely bad for the U.S. economy.

After the announcement is made, the market falls, and what we see is a firm bearish candle. A decrease in Gasoline Prices is considered to be positive for the economy and, thus, the currency, which is why traders sell Euro and buy U.S. dollars. One can sell the currency pair after a retracement of the price to the moving average.

USD/CAD | Before The Announcement

USD/CAD | After The Announcement

Lastly, we discuss the USD/CAD currency pair where before the news announcement, we see that the market is in a very strong uptrend and currently at a place from where the market had reversed earlier. The continuous bullish green candles suggest a great amount of strength in the U.S. dollar. Thus, a negative Gasoline Price indicator data that is bad enough to cause a reversal in the trend is an appropriate situation for going ‘short’ in the pair. Technically, the chart is more supportive of going ‘long’ in the pair.

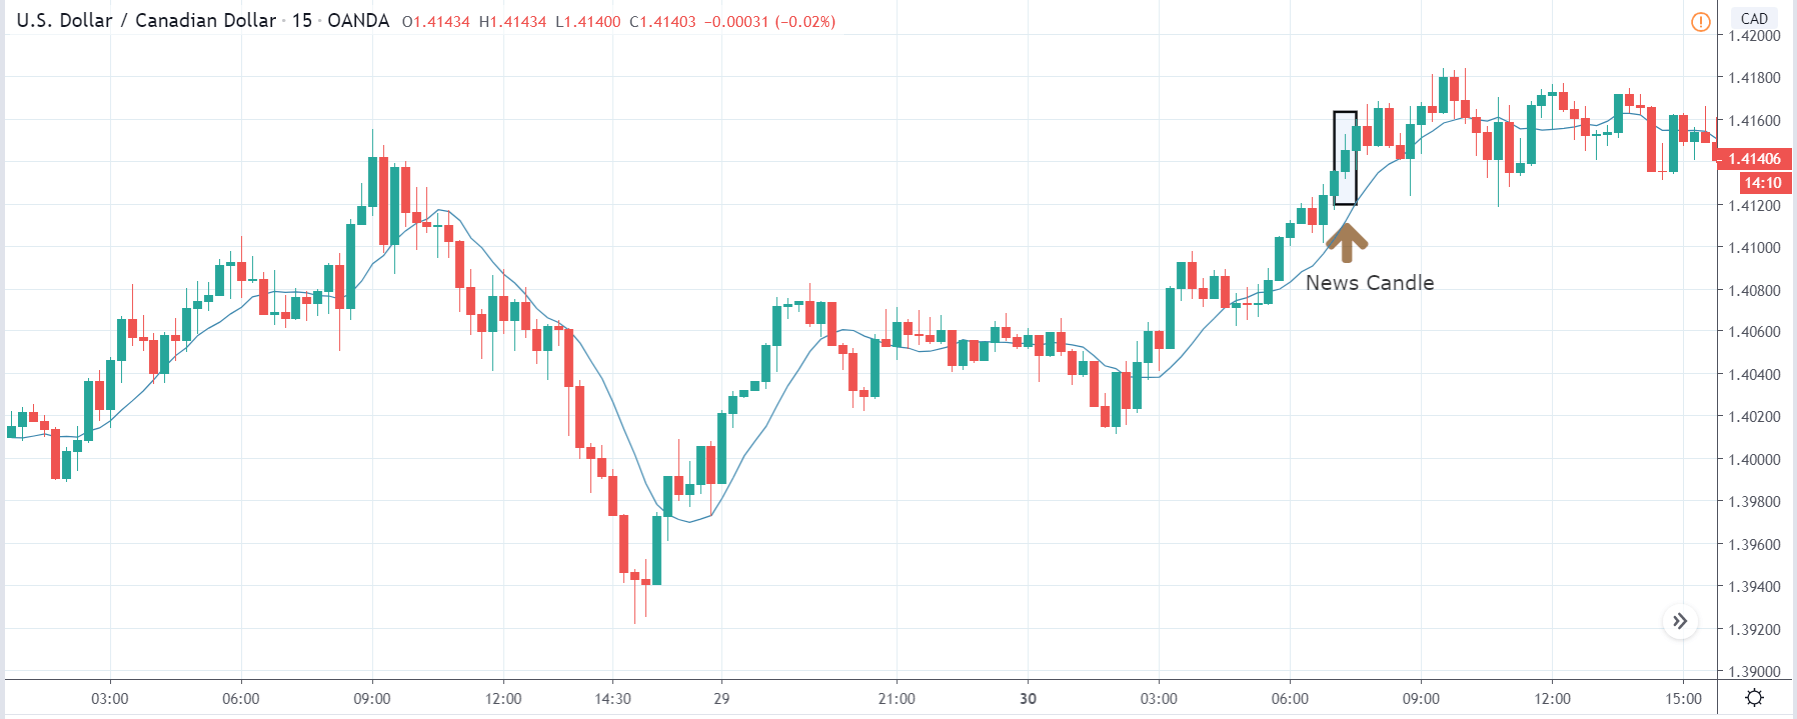
After the data is released, we see that the price breaks out above the resistance area and closes as a ‘bullish’ candle. Here too, the market reacted similarly to the above pairs based on the robust Gasoline Prices. One should be ‘buying’ this pair only after the price retraces to the moving average and bounces off from the line. In this way, we will be trading along with the trend, and the stop loss will be below the ‘news candle.’

That’s about ‘Gasoline Prices’ and its news release impact on the Forex market. If you have any questions, let us know in the comments below. Good luck!
Categories
Forex Course

111. Trading Forex Market Using Elliot Wave Theory

Introduction

In all the previous lessons, we understood the terminology and interpretation of the popular Elliot Wave theory. Now we are well-versed with the subject to apply it to the forex market.

The Elliot Wave Theory is a wide concept and can be traded in several different ways. In this lesson, we shall analyze the forex currency pairs using Elliot wave concepts by combining it with some price action.

The best way to trade the Elliot waves

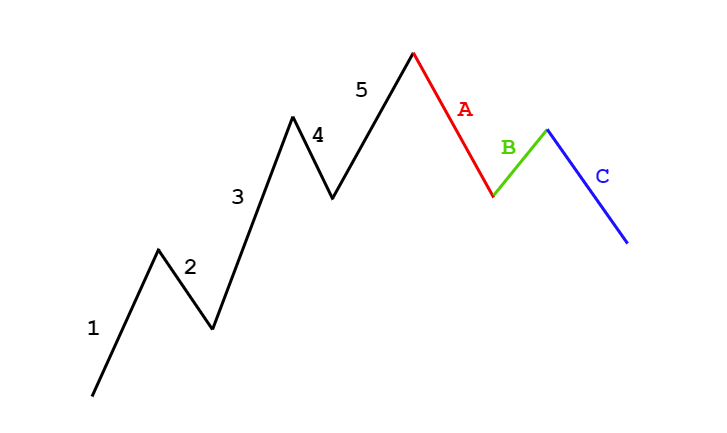
We know that according to the Elliot wave theory, there are two types of waves. There is an impulsive wave pattern made of 5 waves, and a corrective wave made of 3 waves. The impulsive wave is towards the trend, while the corrective wave is basically a pullback for the overall trend.

As a trader, we need to look for trades that payout well along with less risk. So, it is not ideal to trade all the impulsive waves and corrective waves.

Trade setup 1

The setup is to trade the impulsive waves. In the 5-wave impulsive pattern, three waves are along with the trend and two against it. Out of those three impulse waves, the ideal wave to catch is Wave 2. This is because, the Wave 2 is usually the strongest out of the three impulse waves, which significantly reduces the risk on the trade.

Trade Example

After the market makes the first wave, the price starts to pullback. But while the market is retracing, we won’t know where the market will hold and complete its second wave. So, we make use of other tools to determine where the market will resume its trend.

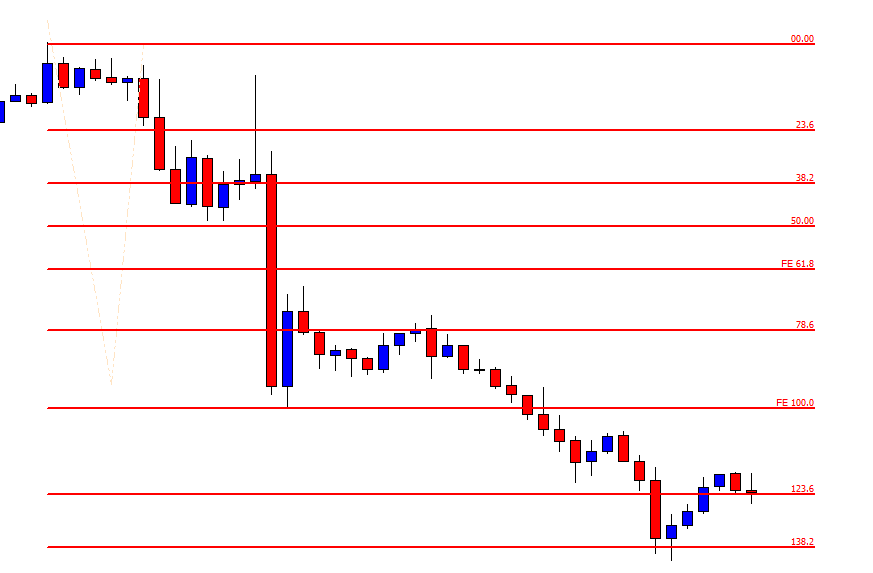
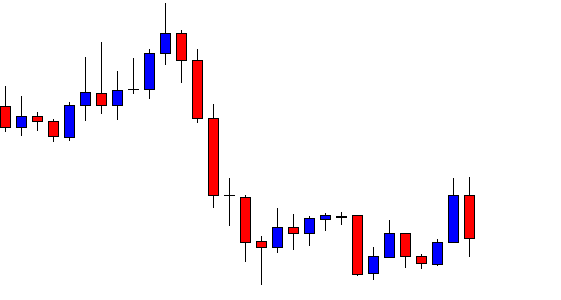
Consider the below price chart. As represented, the market made its first wave. Then, wave 2 began, where the market started to retrace. But, note that, at this point in point, we cannot confirm the end of wave 2. So, to determine the completion of wave 2, we shall be applying the Fibonacci retracement.

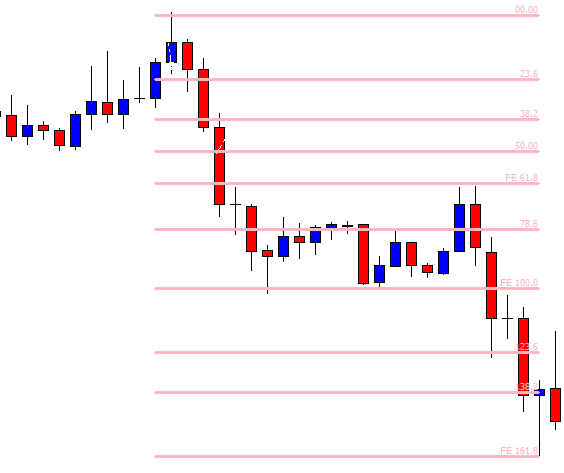
In the below chart, the fib retracement has been applied. We can see that the market began to hold at the 50% level. This hence confirms that wave-2 leg has come to an end. Thus, we can prepare to go long in anticipation of wave 3.

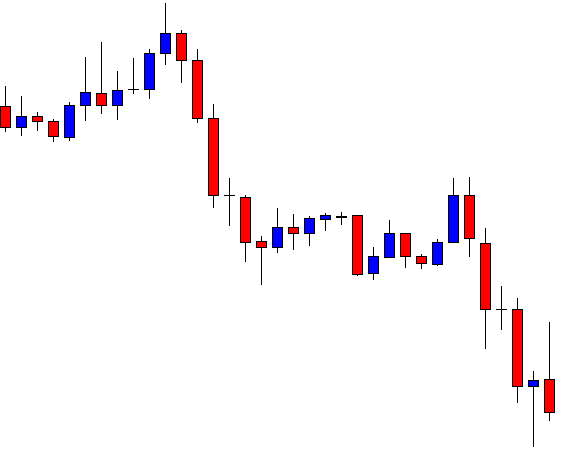
In the following chart, we can clearly see that the market held at the 50% fib level and ended up making a higher high, i.e., wave 3.

Trade setup 2

This is the type of setup where we consider the complete 5-3 wave pattern. In the below chart, the 5-wave impulsive pattern is represented with the black trend lines, while the 3-wave corrective pattern is represented by the red trend lines. Since in an Elliot wave pattern, the high of the third corrective wave must be below low of the first wave in the impulsive wave pattern, we can trigger the sell at the area shown in the chart.

This hence concludes our discussion on the Elliot Wave theory. In the next lesson, we’ll summarize this topic for your better understanding and then pick another interesting course.

[wp_quiz id=”72249″]
Categories
Forex Assets

What Should You Know About The ‘XLM/USD’ Crypto Fiat Pair

Introduction

XLM is the abbreviation for Stellar. This cryptocurrency was founded in 2014 by Jed McCaleb. Stellar is also a payment technology that was created mainly to connect financial institutions and reduce the costs for cross-border transfers.

Stellar is actively traded in the market against fiat currencies and other cryptocurrencies. In this article, we shall be analyzing Stellar against the US dollar, abbreviated as XLM/USD.

Understanding XLM/USD

The price of XLM/USD depicts the value of the US Dollar that is equivalent to one Stellar. It is quoted as 1 XLM per X USD. For example, if the value of XLM/USD is 0.073264, then each stellar is worth 0.073264 US dollars.

Note: The price is considered from coinbase exchange.

XLM/USD Specifications

Spread

It is the athematic difference between the bid and the ask price managed by exchanges. It varies based on the type of execution model used by exchanges.

Spread on ECN: 450 pips

Spread on STP: 520 pips

Fee

A Fee is nothing but the commission on the trade. It is charged only on ECN accounts, and there is no fee on STP accounts.

Slippage

The difference between the trader’s intended price and the broker’s executed price is called slippage. It varies based on the volatility of the market and the exchange’s execution speed.

Trading Range in XLM/USD

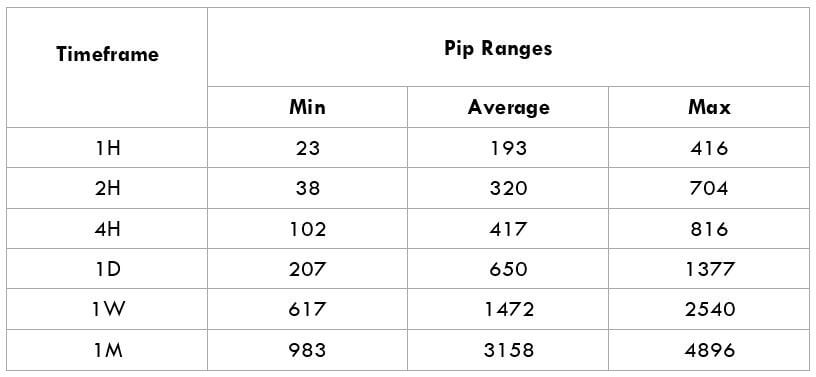
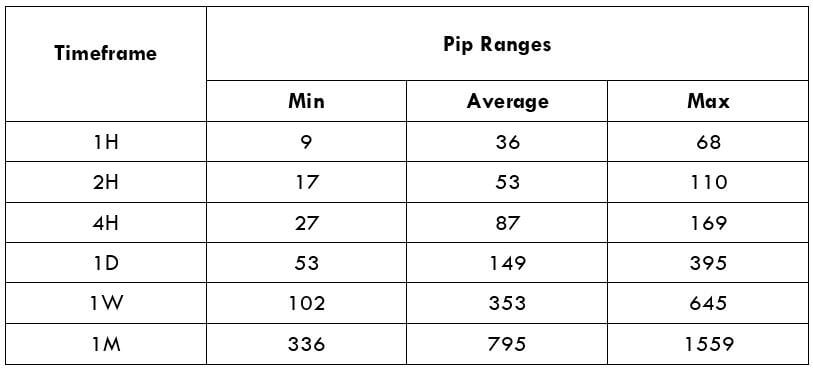
The trading range is simply the illustration of the pip movement in a pair for different timeframes. With these values, a trader will know how long they have to wait for their trade to perform. Also, they can calculate approximate profit/loss on a trade beforehand.

Procedure to assess Pip Ranges

  1. Add the ATR indicator to your chart
  2. Set the period to 1
  3. Add a 200-period SMA to this indicator
  4. Shrink the chart so you can assess a large time period
  5. Select your desired timeframe
  6. Measure the floor level and set this value as the min
  7. Measure the level of the 200-period SMA and set this as the average
  8. Measure the peak levels and set this as Max.

XLM/USD Cost as a Percent of the Trading Range

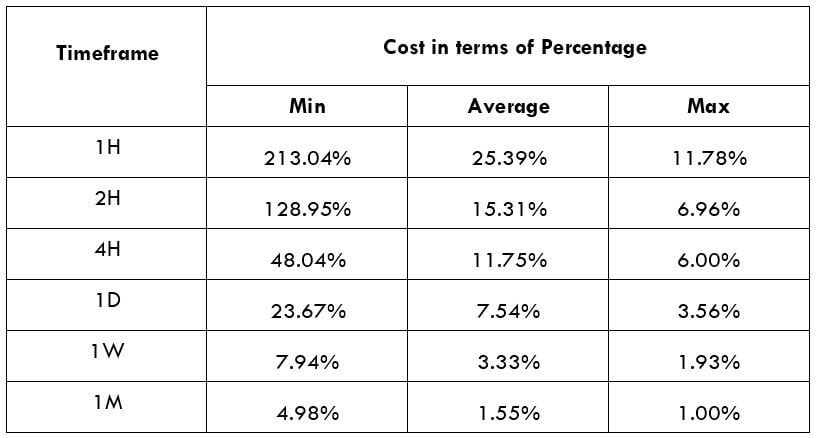
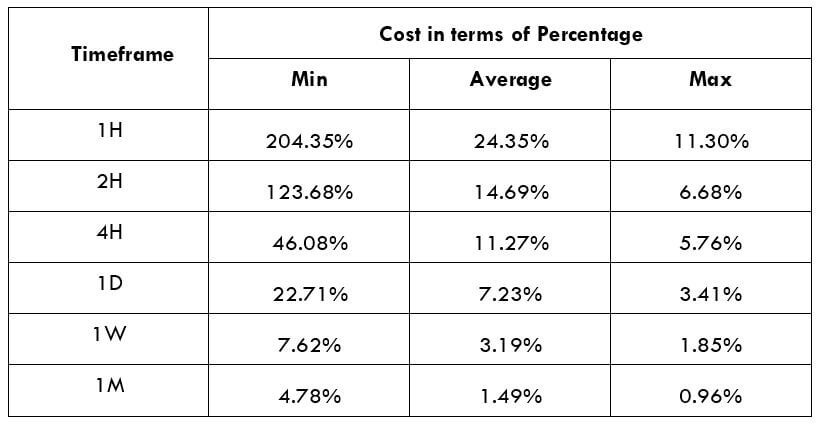
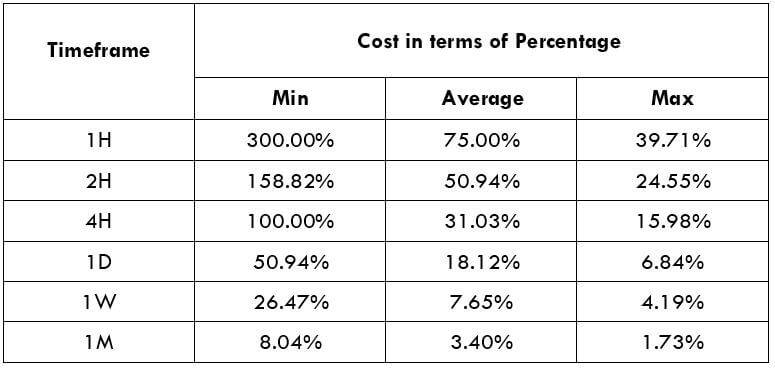
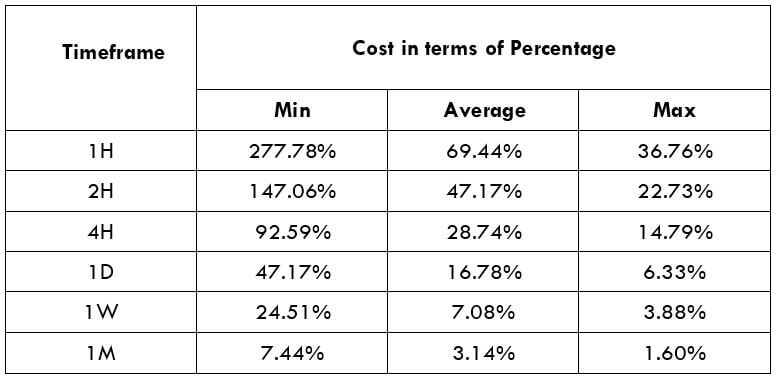
The following tables represent the total cost variations for ECN and STP accounts. It represents how the costs vary with the change in volatility.

ECN Model Account

Spread = 450 | Slippage = 70 |Trading fee = 50

Total cost = Slippage + Spread + Trading Fee = 70 + 450 + 50 = 570

STP Model Account

Spread = 520 | Slippage = 70 | Trading fee = 0

Total cost = Slippage + Spread + Trading Fee = 70 + 520 + 0 = 590

Trading the XLM/USD

It is a known fact that cryptocurrency is a 24-hour market and is traded even during the weekend. However, this does not mean we can enter any time to pull out a trade from it. Though many traders do this, it is not a professional approach. Using the volatility and cost variation values, we can determine the ideal times to trade this pair.

The pip values seem to look really large, but it doesn’t indicate high volatility. This pair is as volatile as other major cryptocurrencies. From the cost table, it can be ascertained that the values are large for lower volatilities that decease as the volatility increases. So, traders who are concerned with high costs can trade during the times when the volatility high. However, they must be cautious about the risk involved in it. On the other hand, traders who wish to have an equilibrium between the two, then they may trade when the volatility is around the average values.

Furthermore, trading via limit and stop orders also reduces costs by a good number. In doing so, the slippage will be taken off of the total costs. So, in our example, the total cost would reduce by 70, which is quite a decent reduction.

Categories
Forex Signals Forex Videos

The Free Forex Academy Signal Service! Over £18,000 made already!

How You Can Make Money Using Forex.Academy’s Free Trading Signals Service – PART 1

The Forex.Academy’s Free Trading Signals Service. What is it and how can it help you?

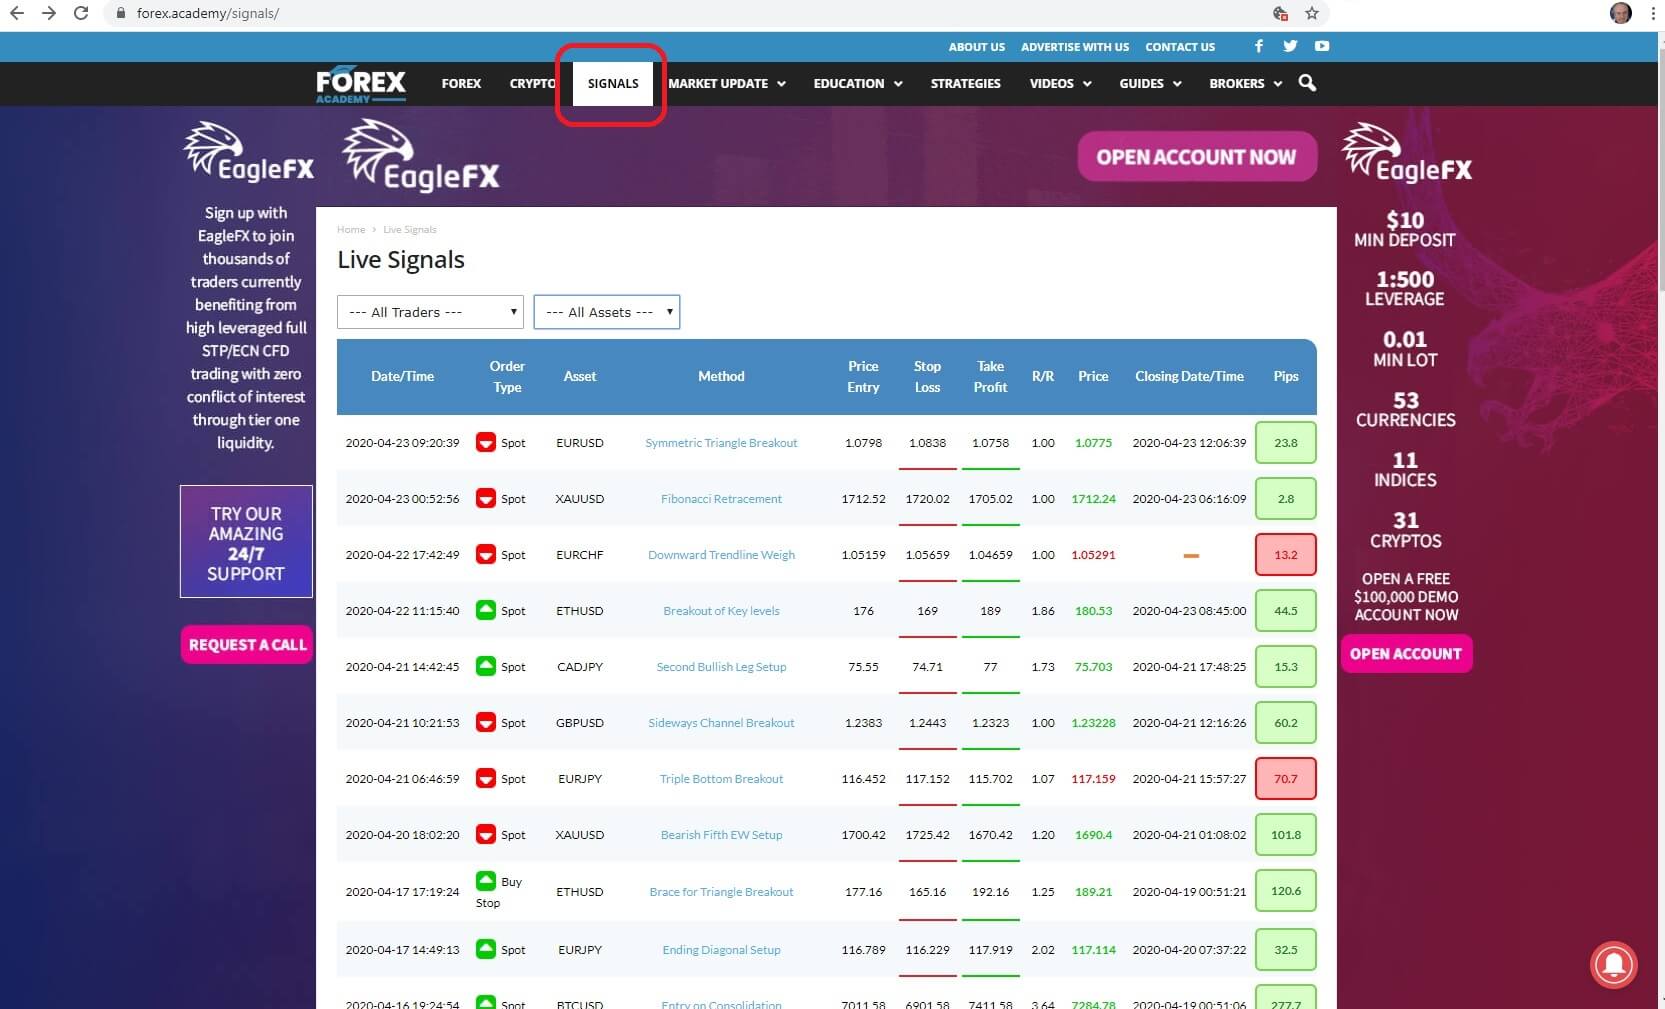
Forex.Academy has recently launched its free trading signals service which can be found under
the Signals tab on the Forex.academy website.


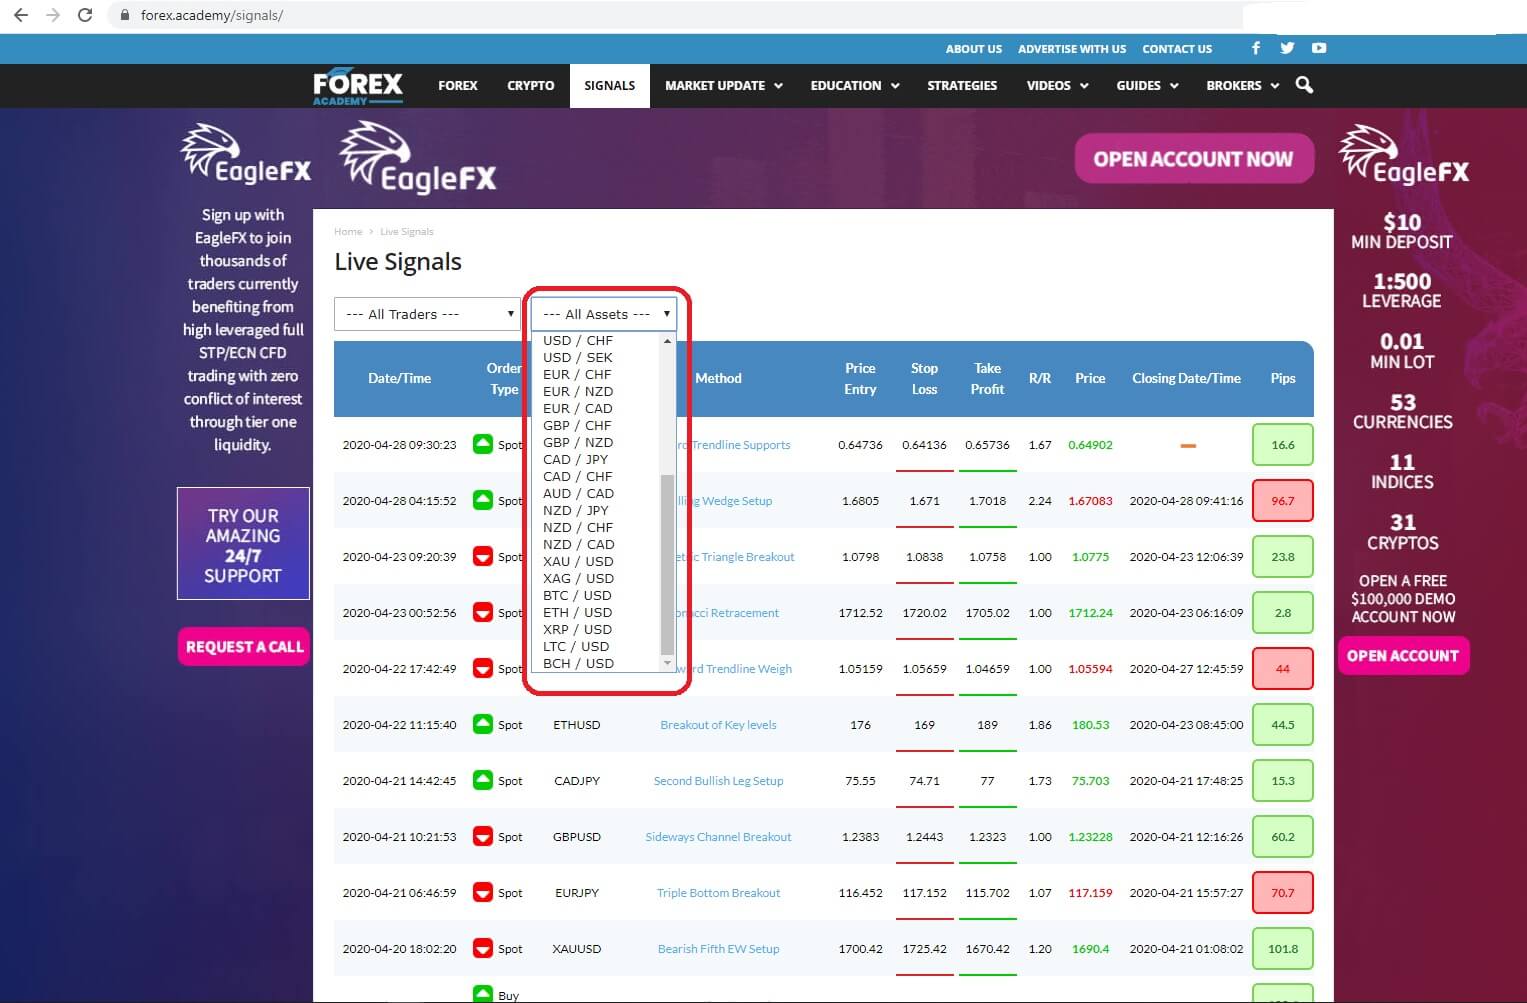
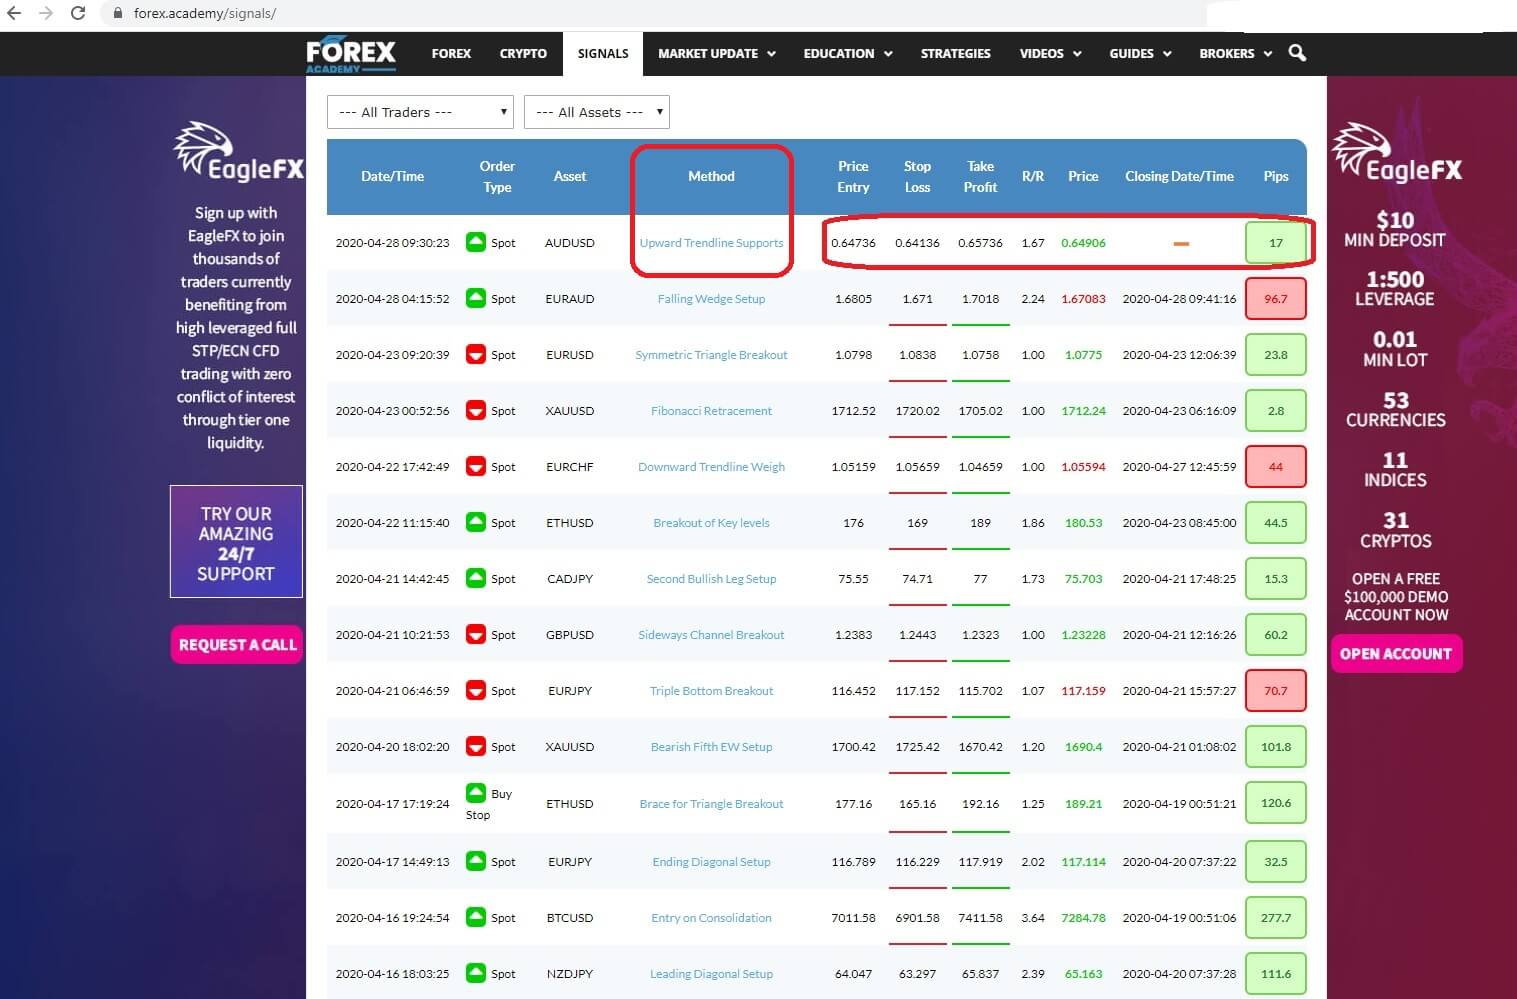
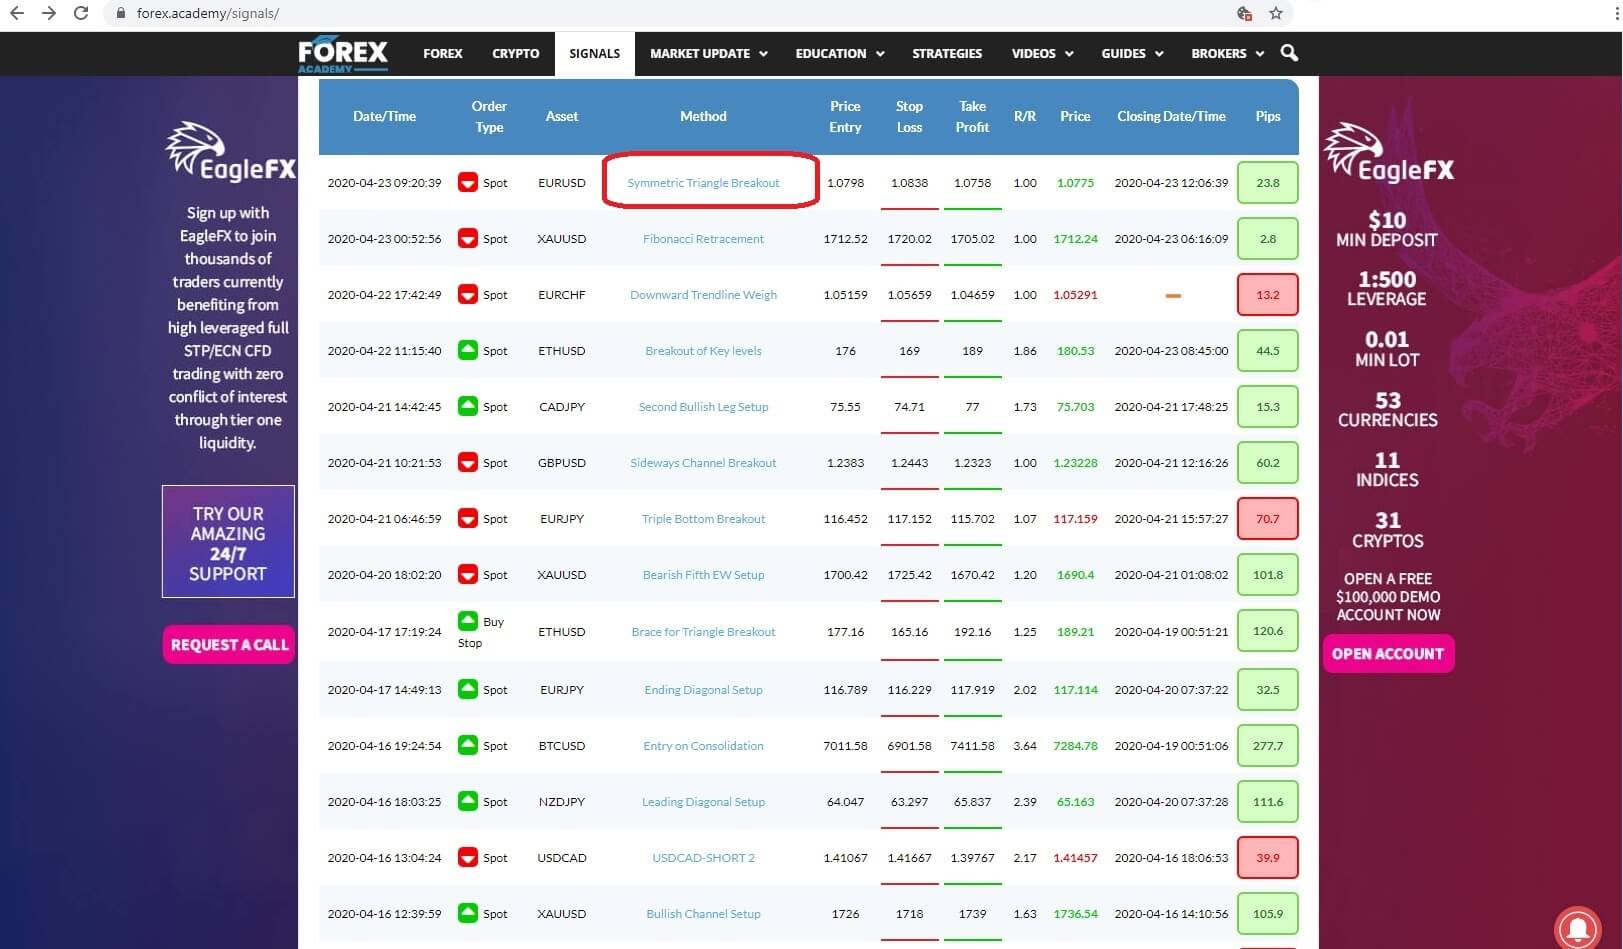
The webpage lists many open and pending orders relating to trades in several assets, from currency pairs, gold, and bitcoin.


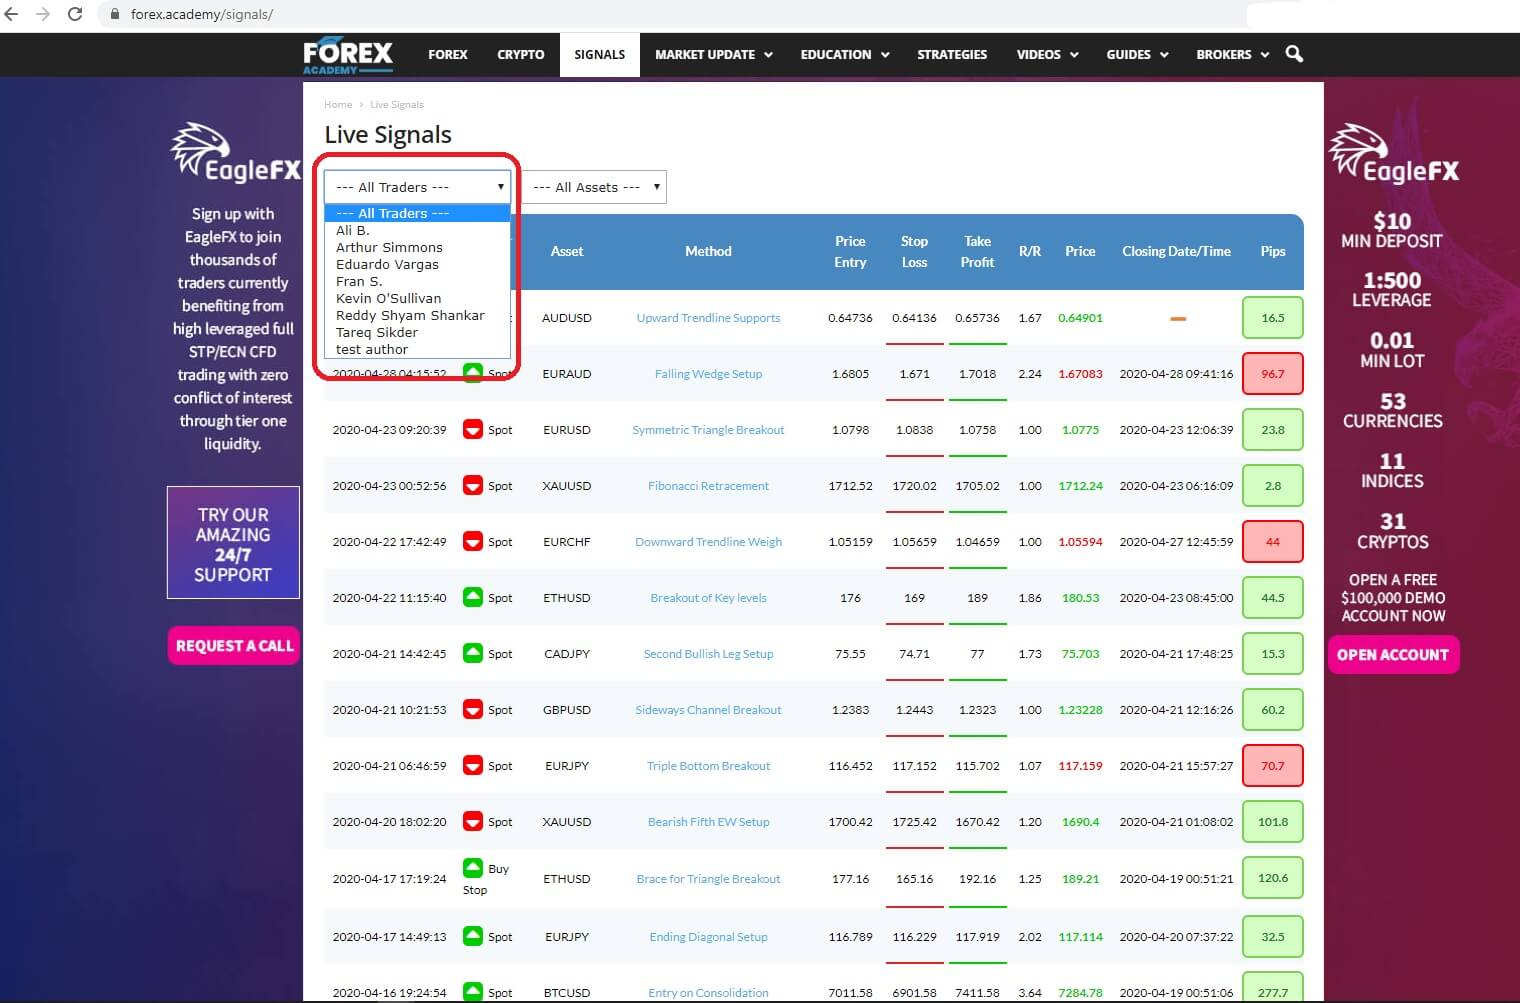
And the trades are managed by professional traders, some who have come from an institutional background, having trading with institutional size deal tickets running into $ billions. Biographies of each trader will be added to the technical analysis for every trade and you will be able to access this information to help you decide which trades to copy. You wont be disappointed. These guys really know their stuff.
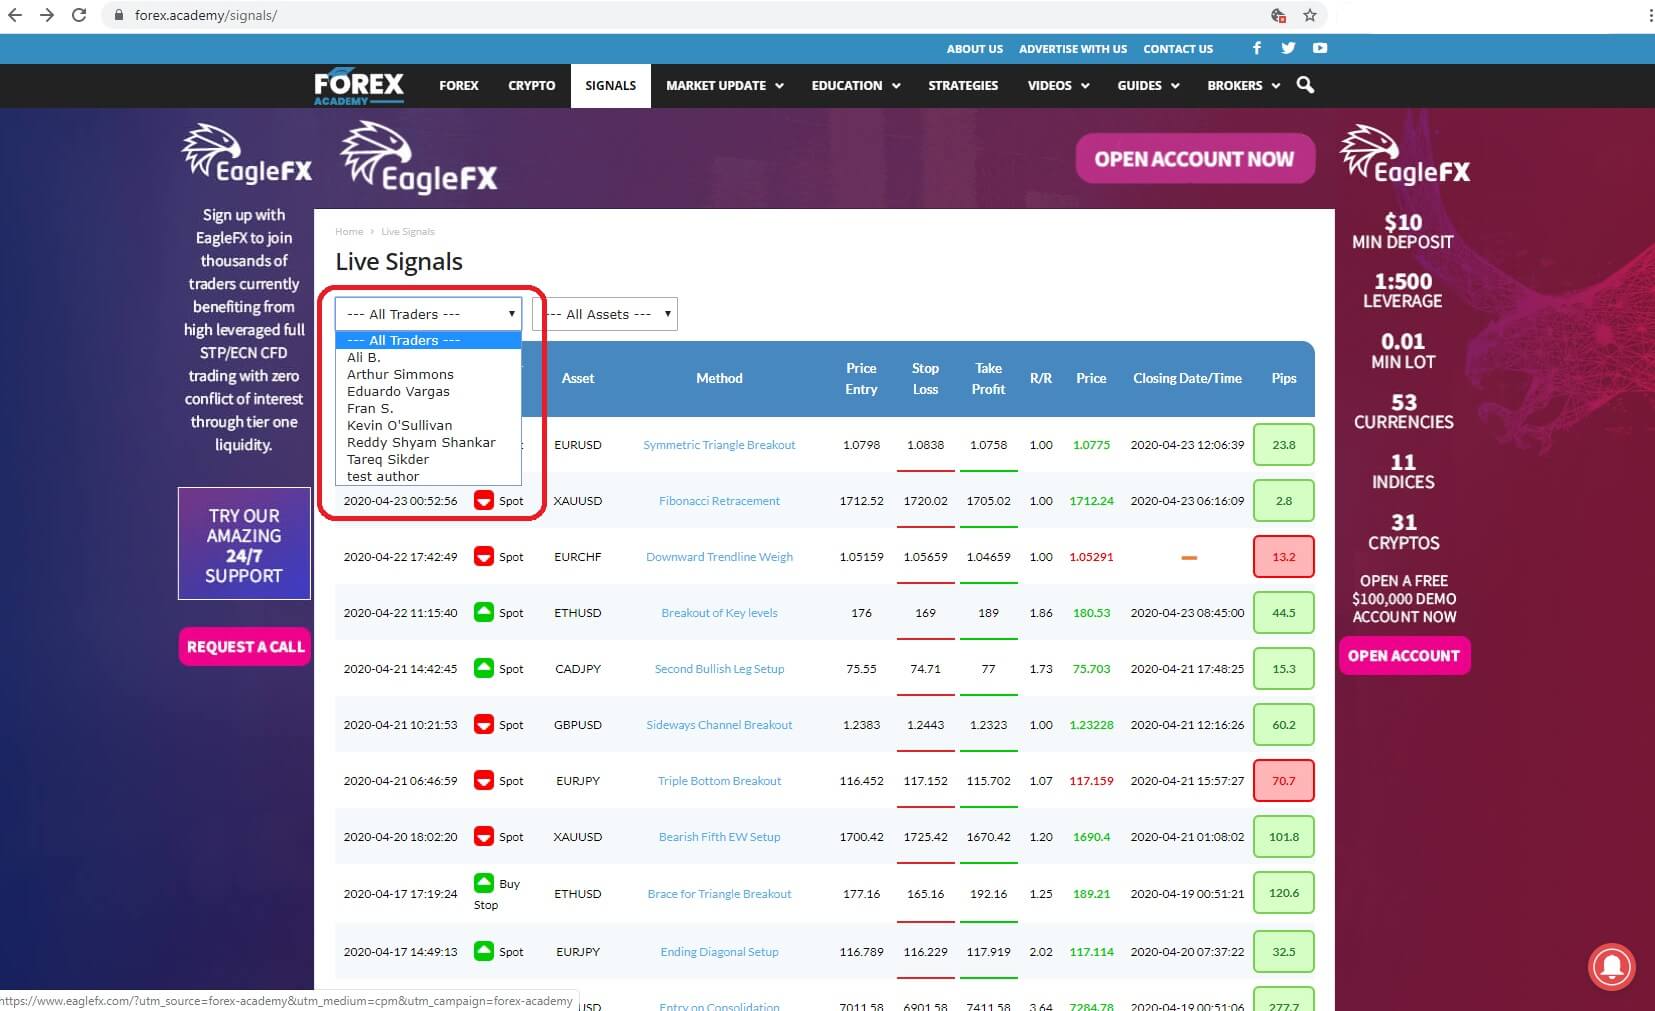

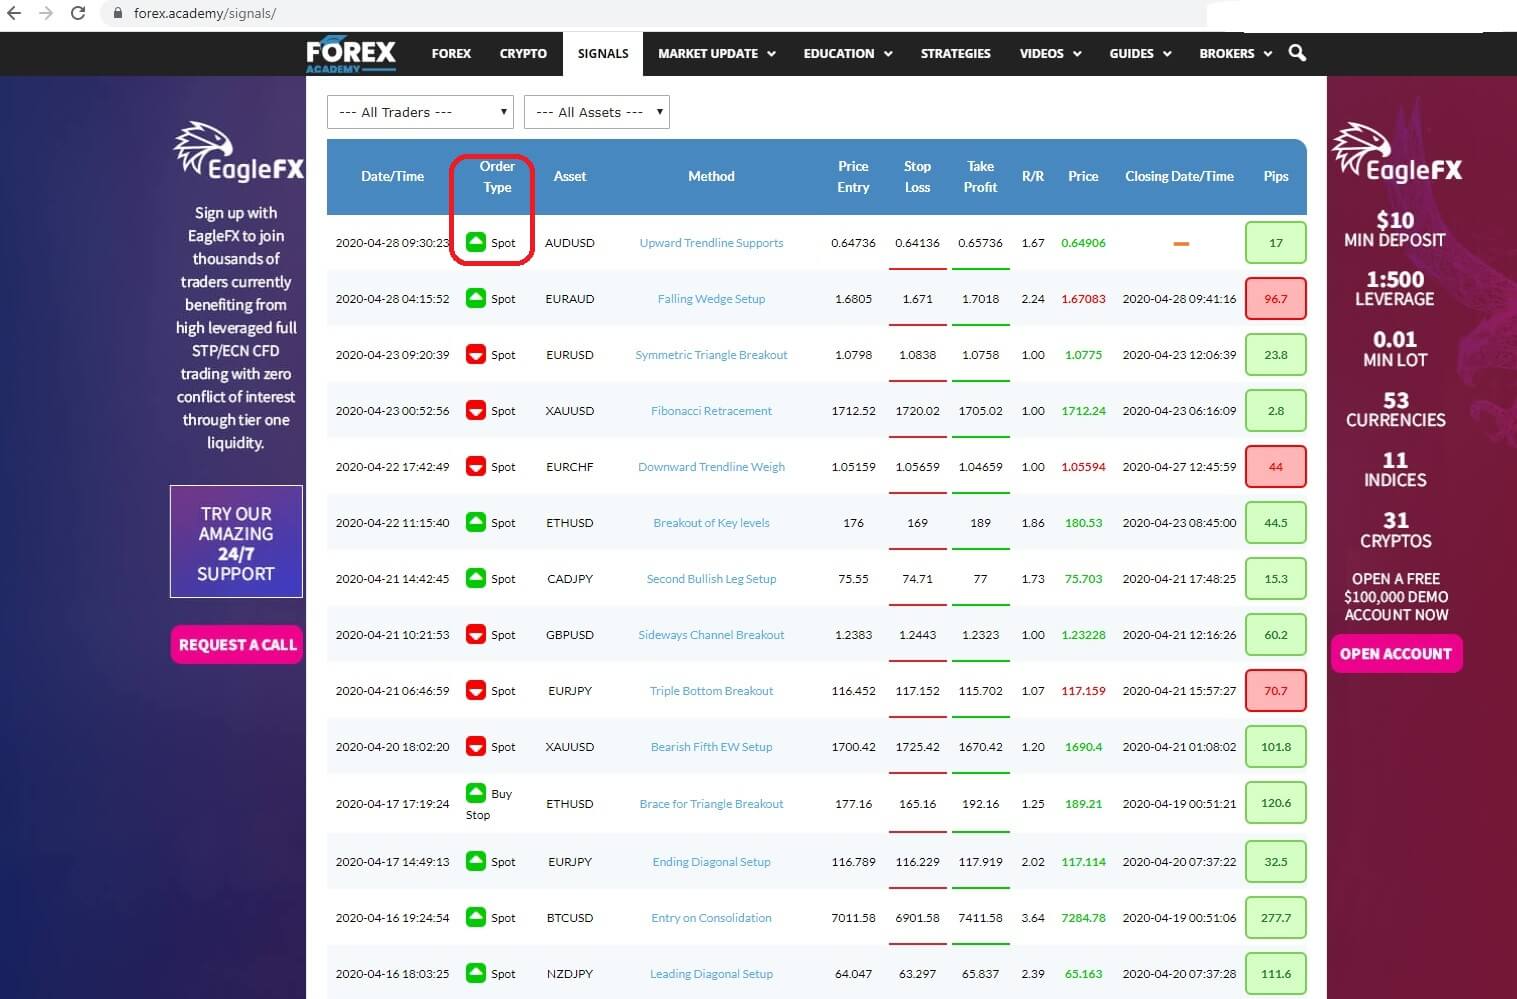
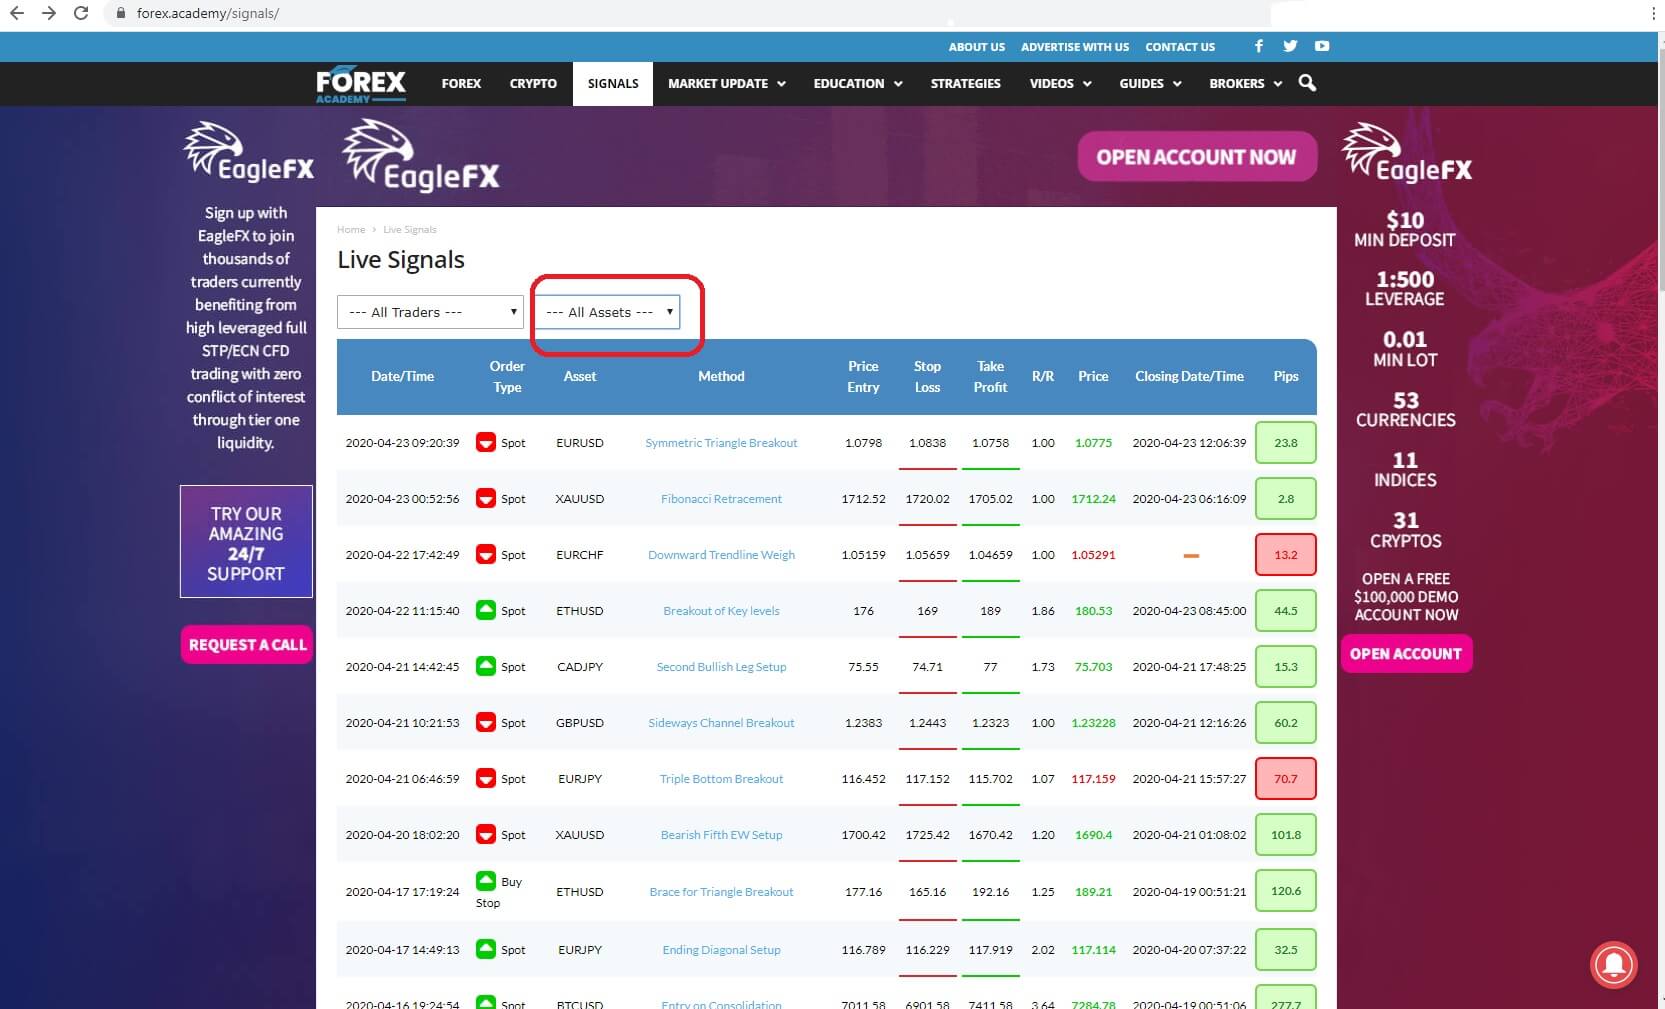
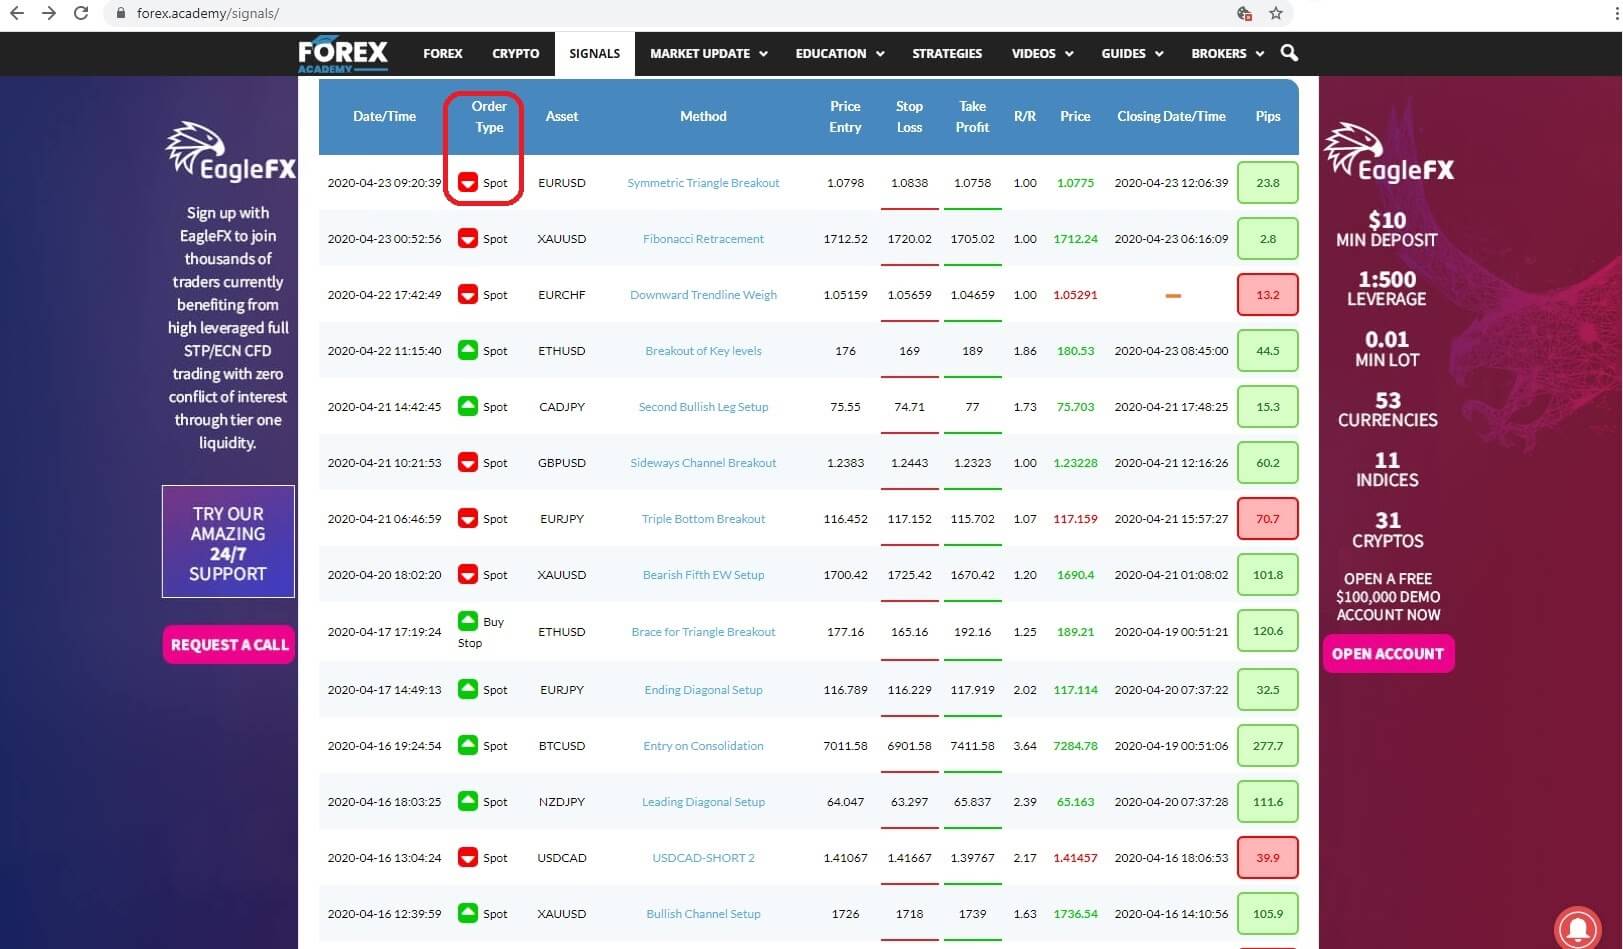
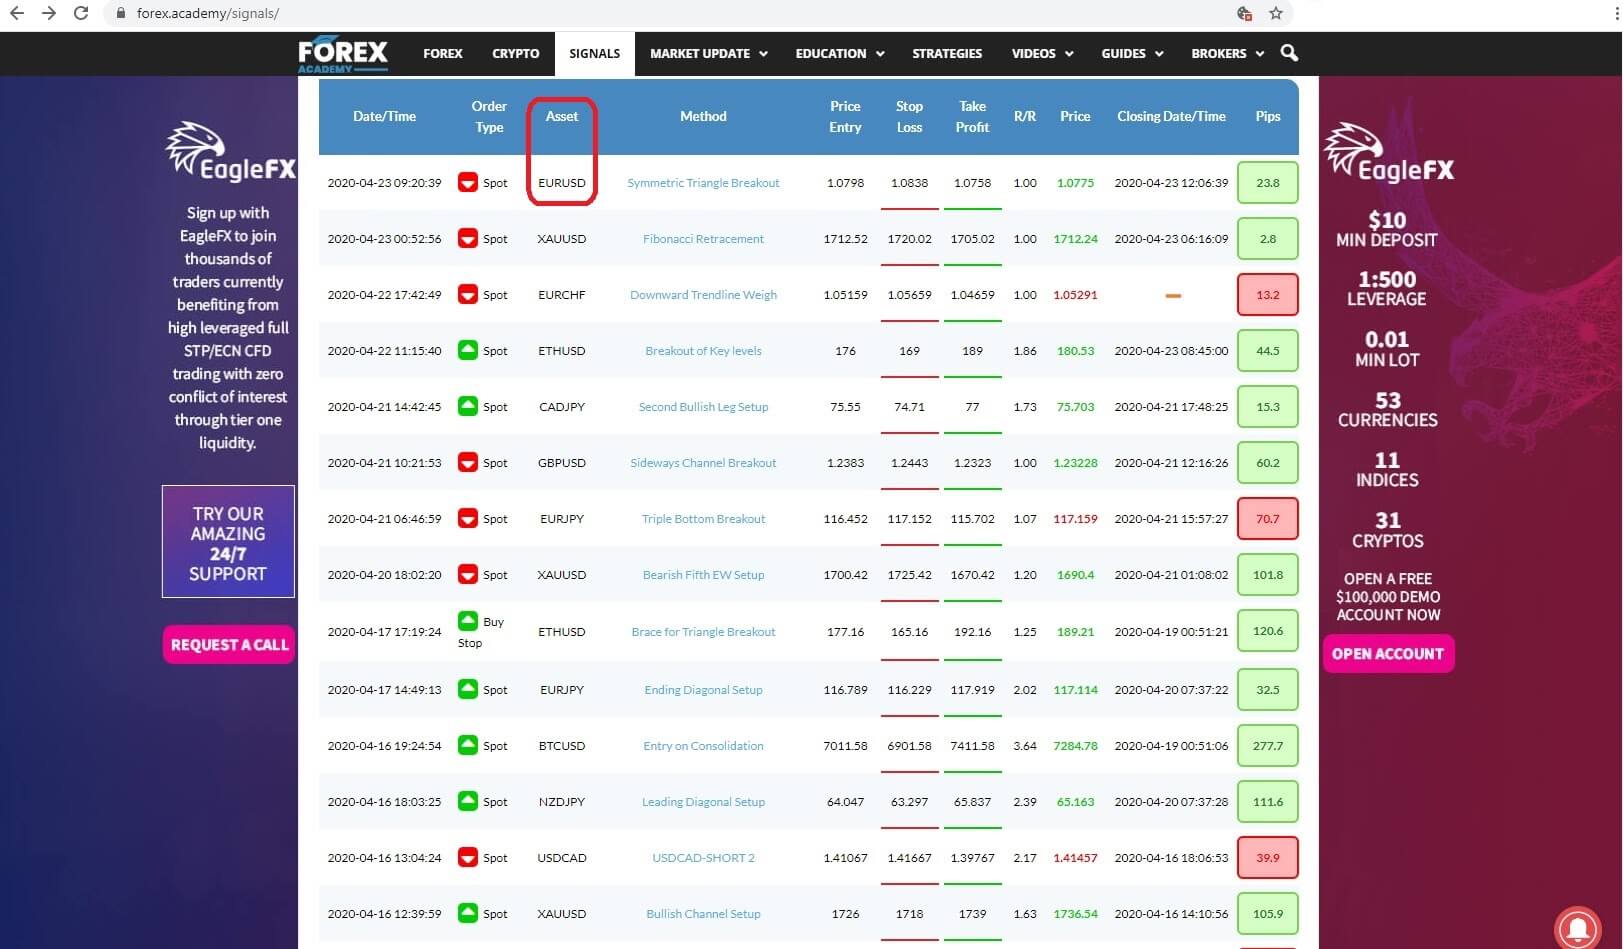
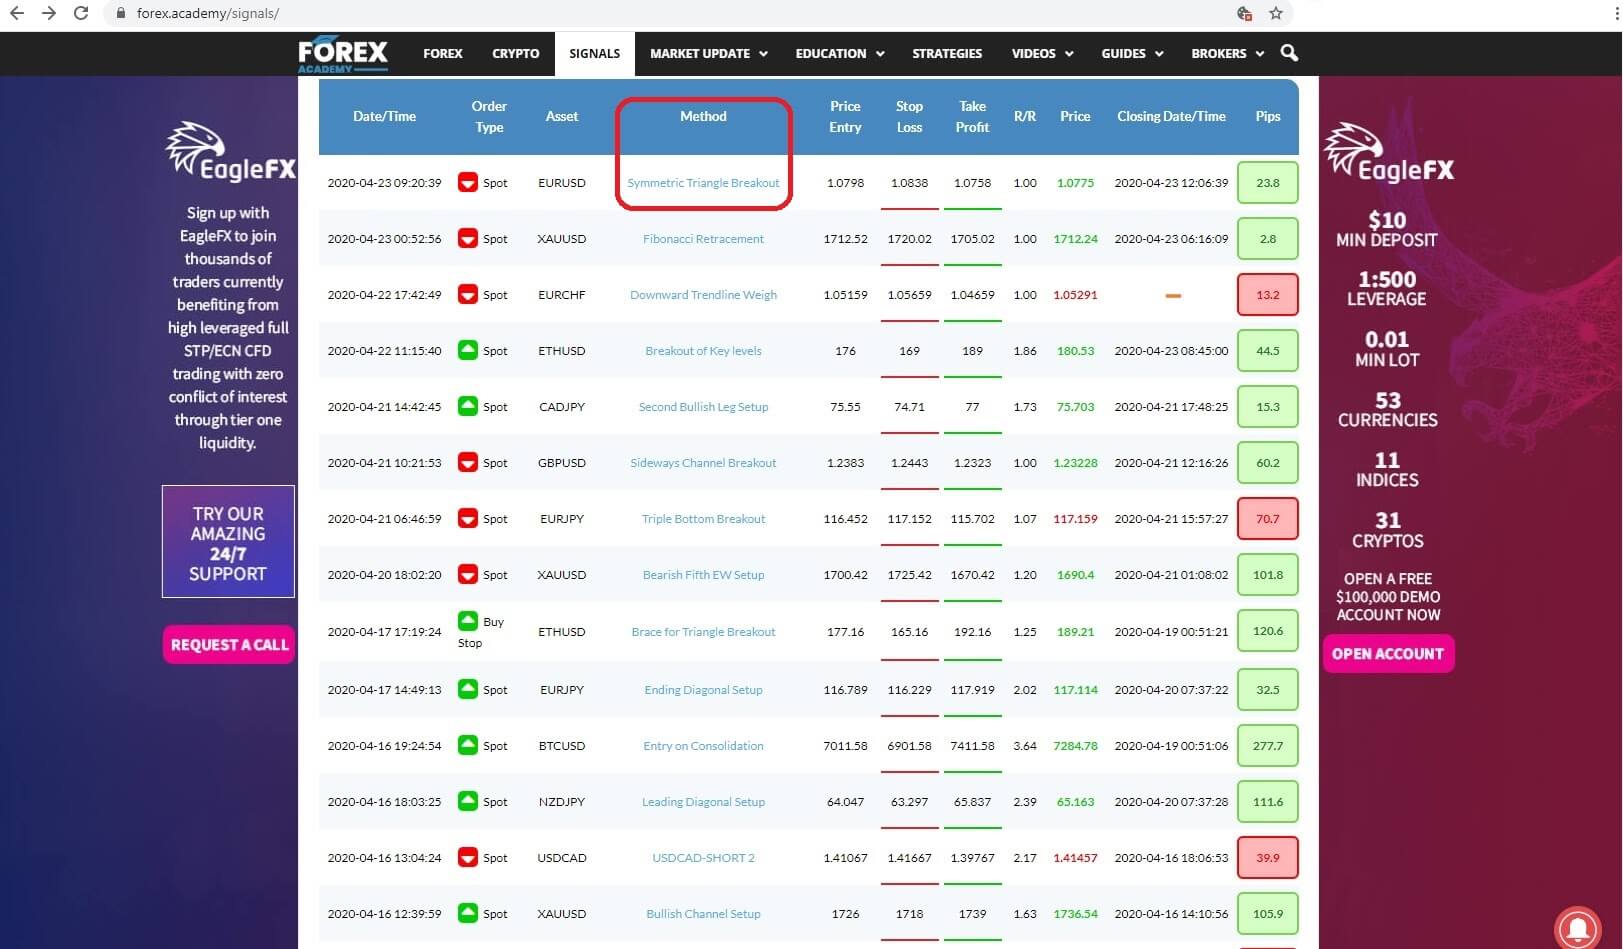
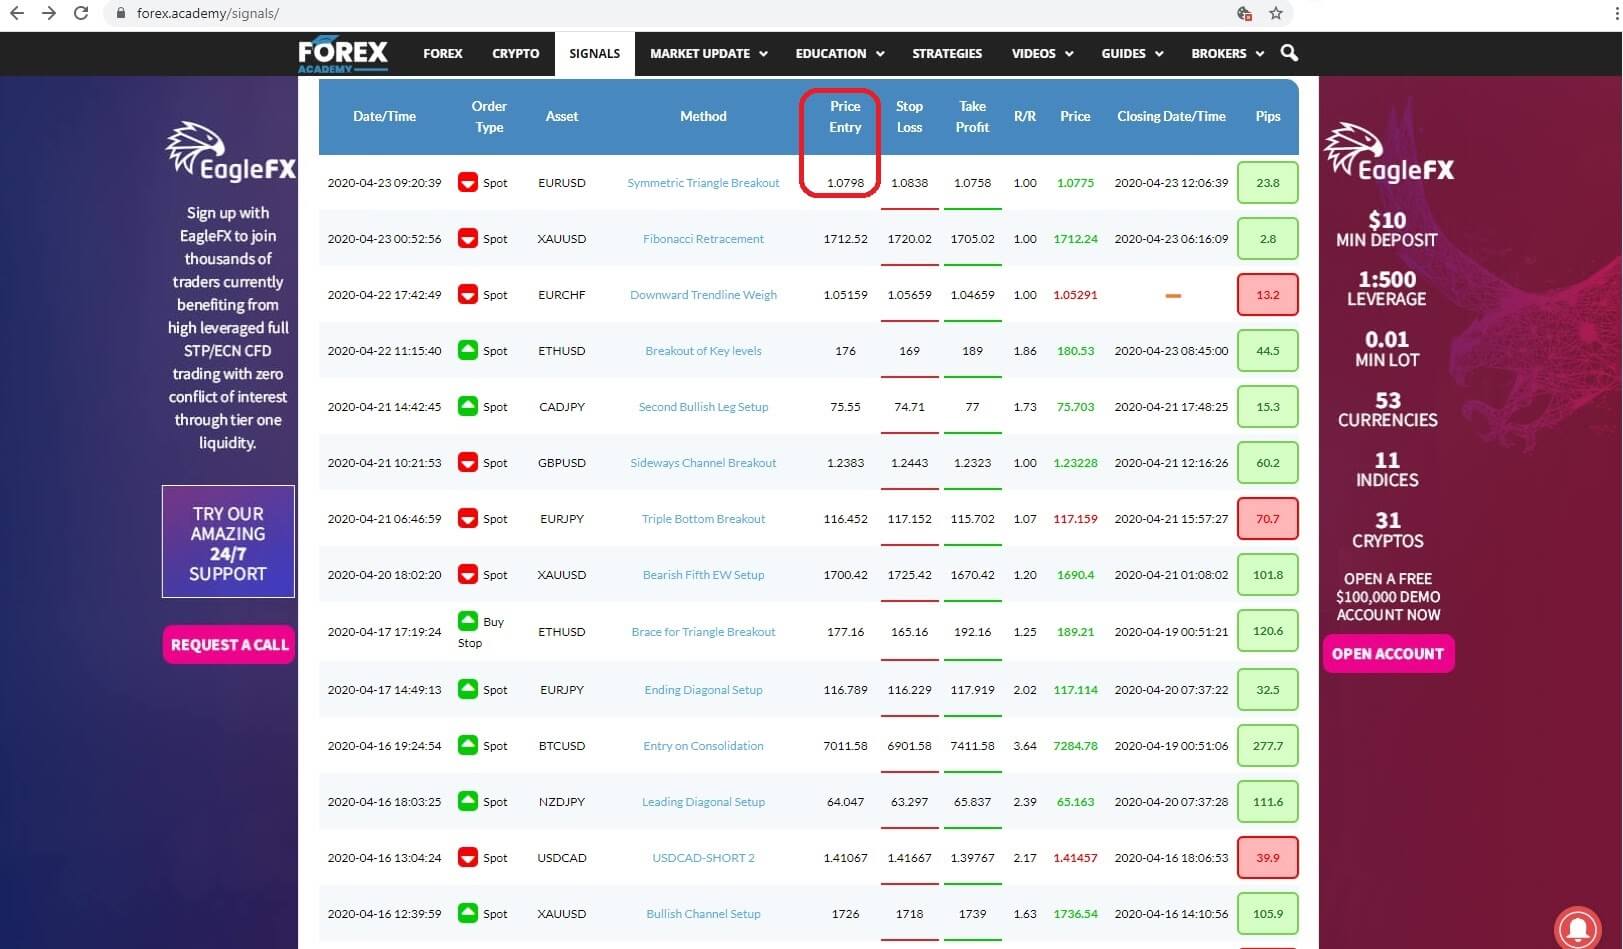
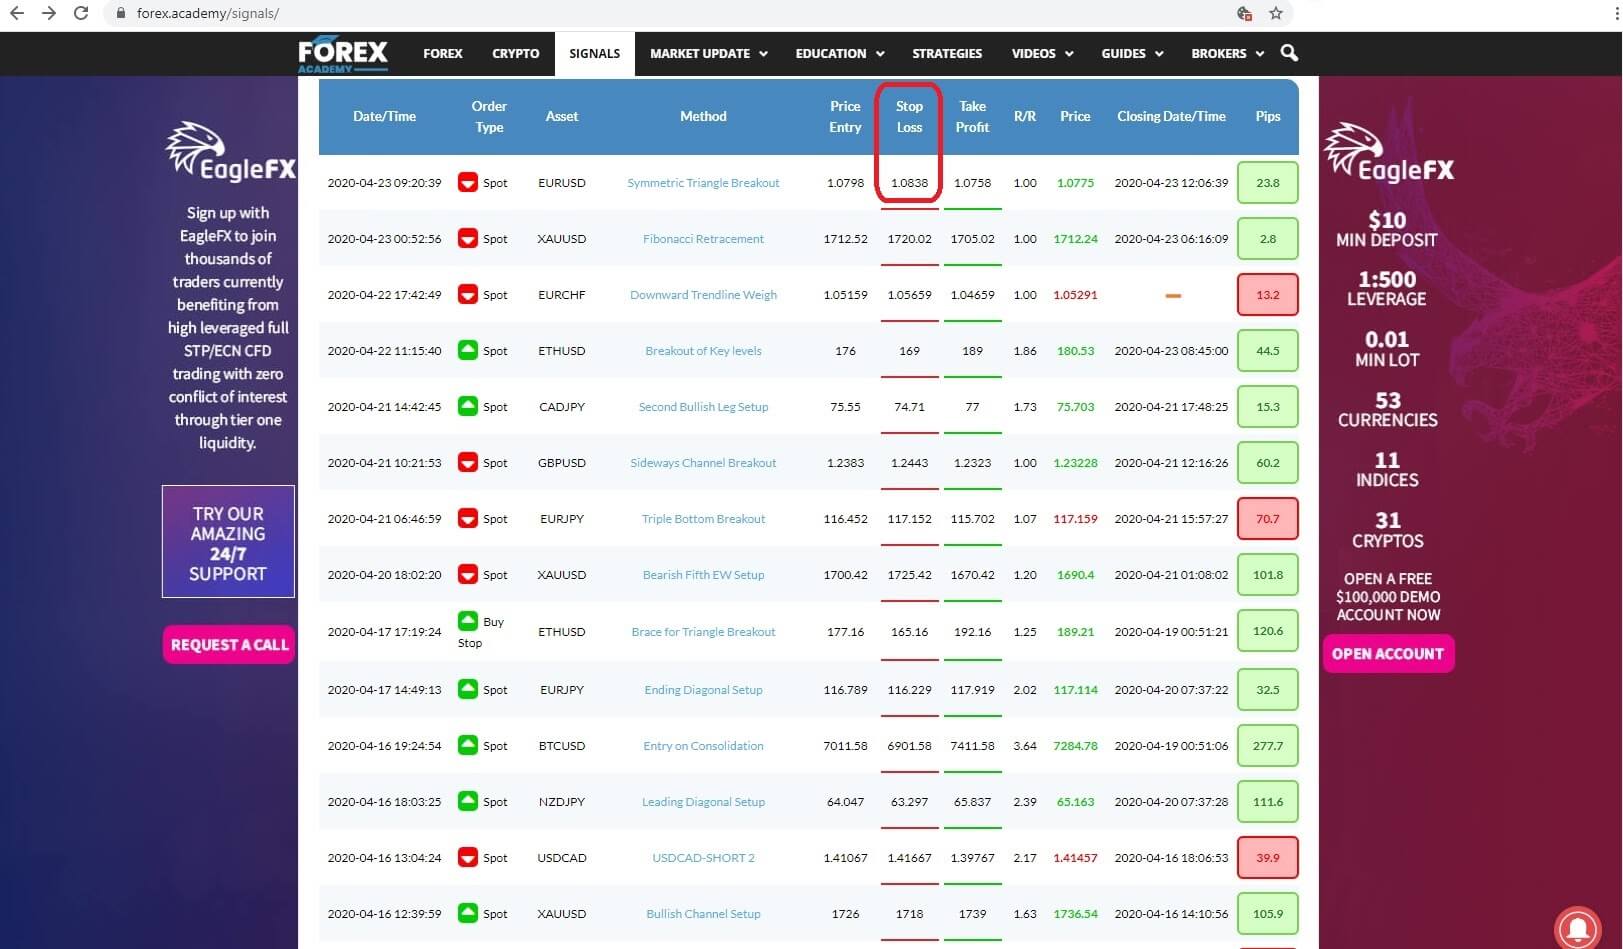
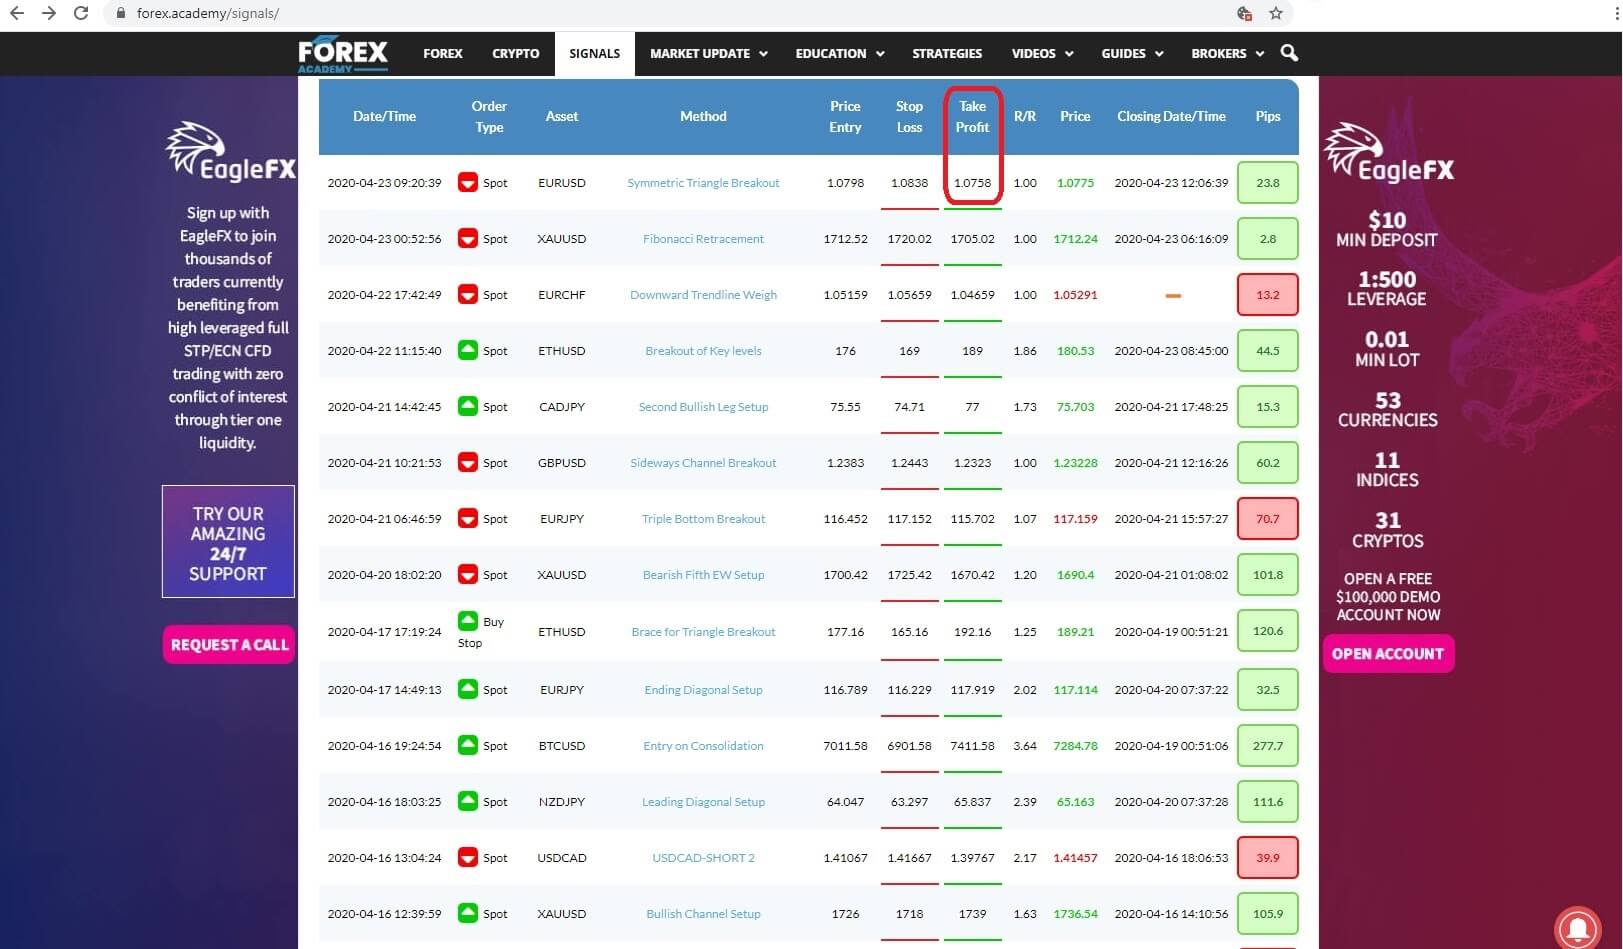
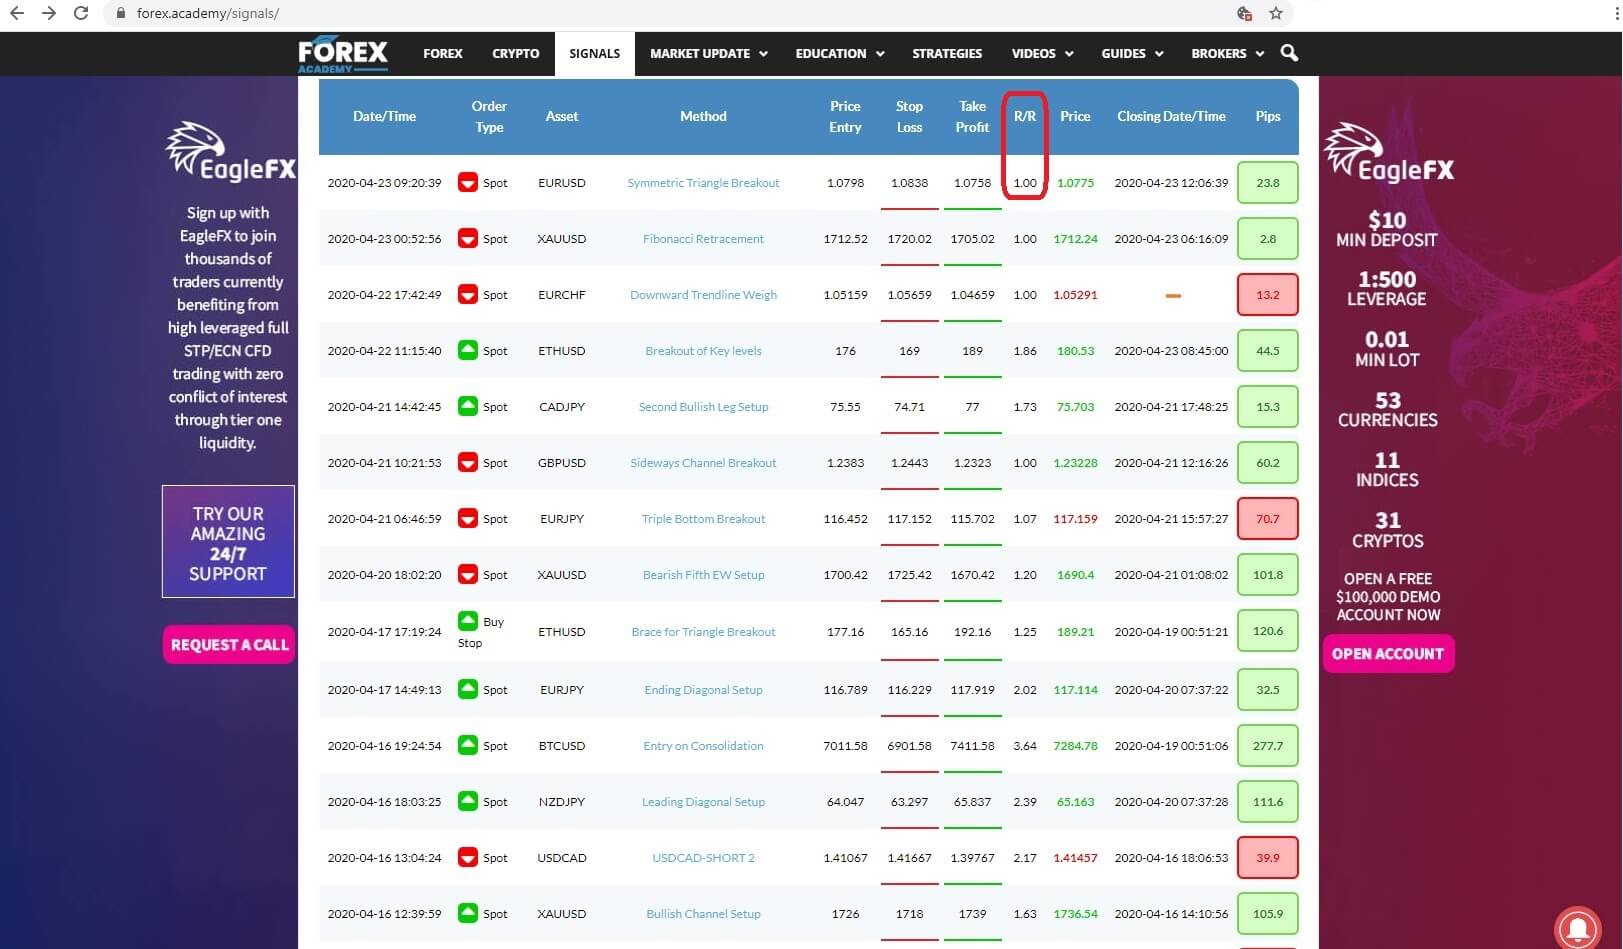
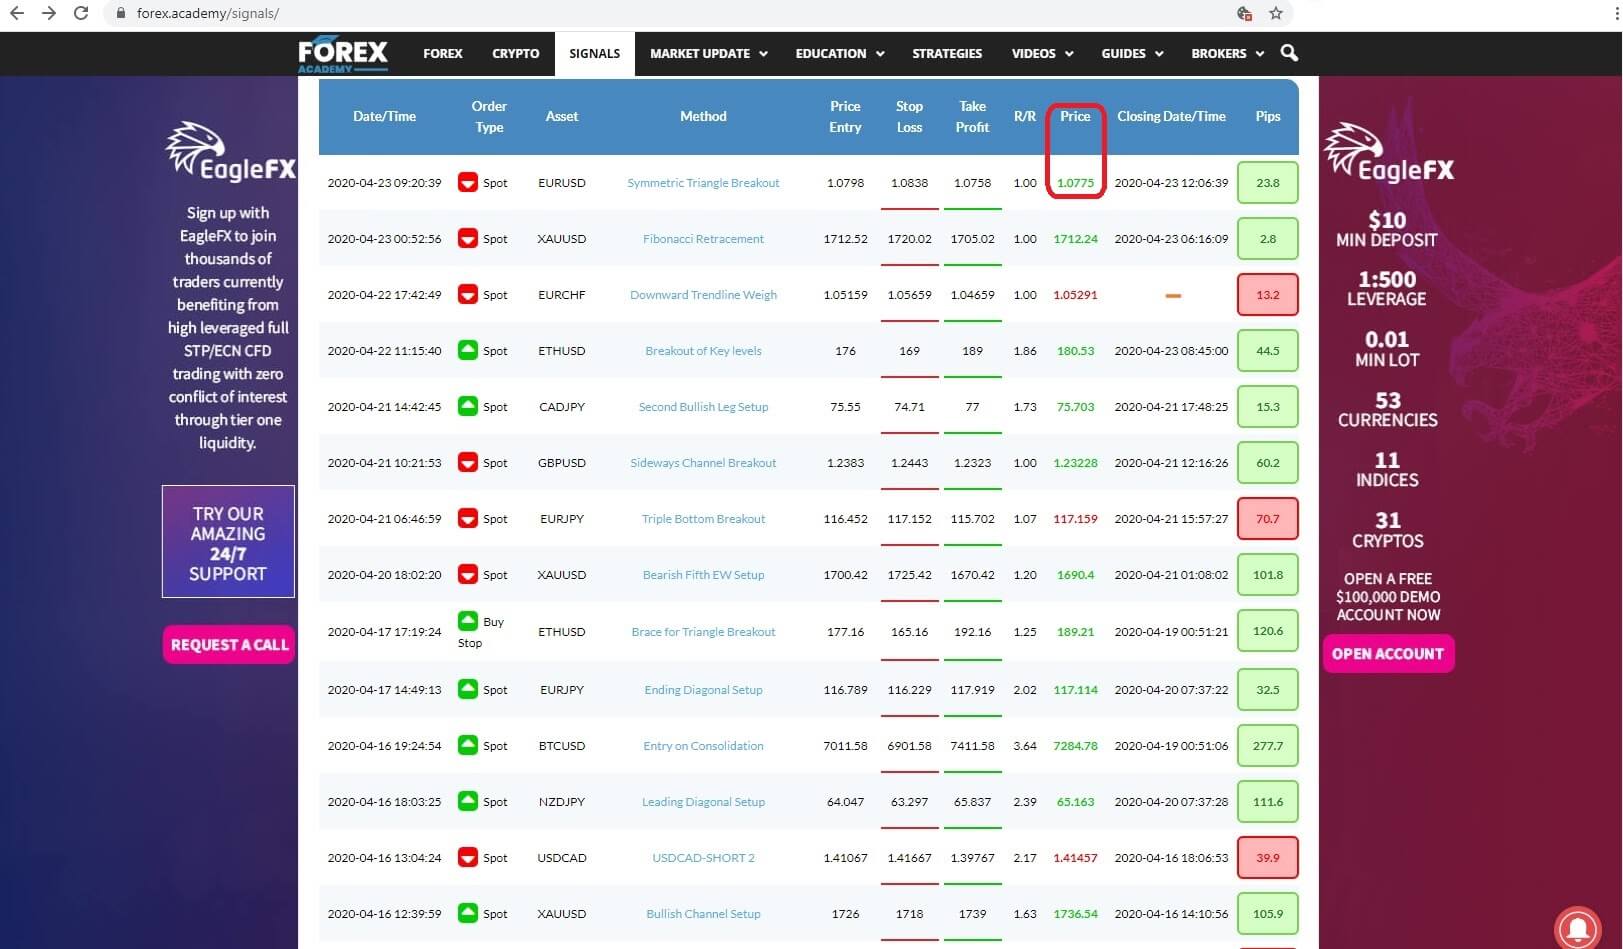
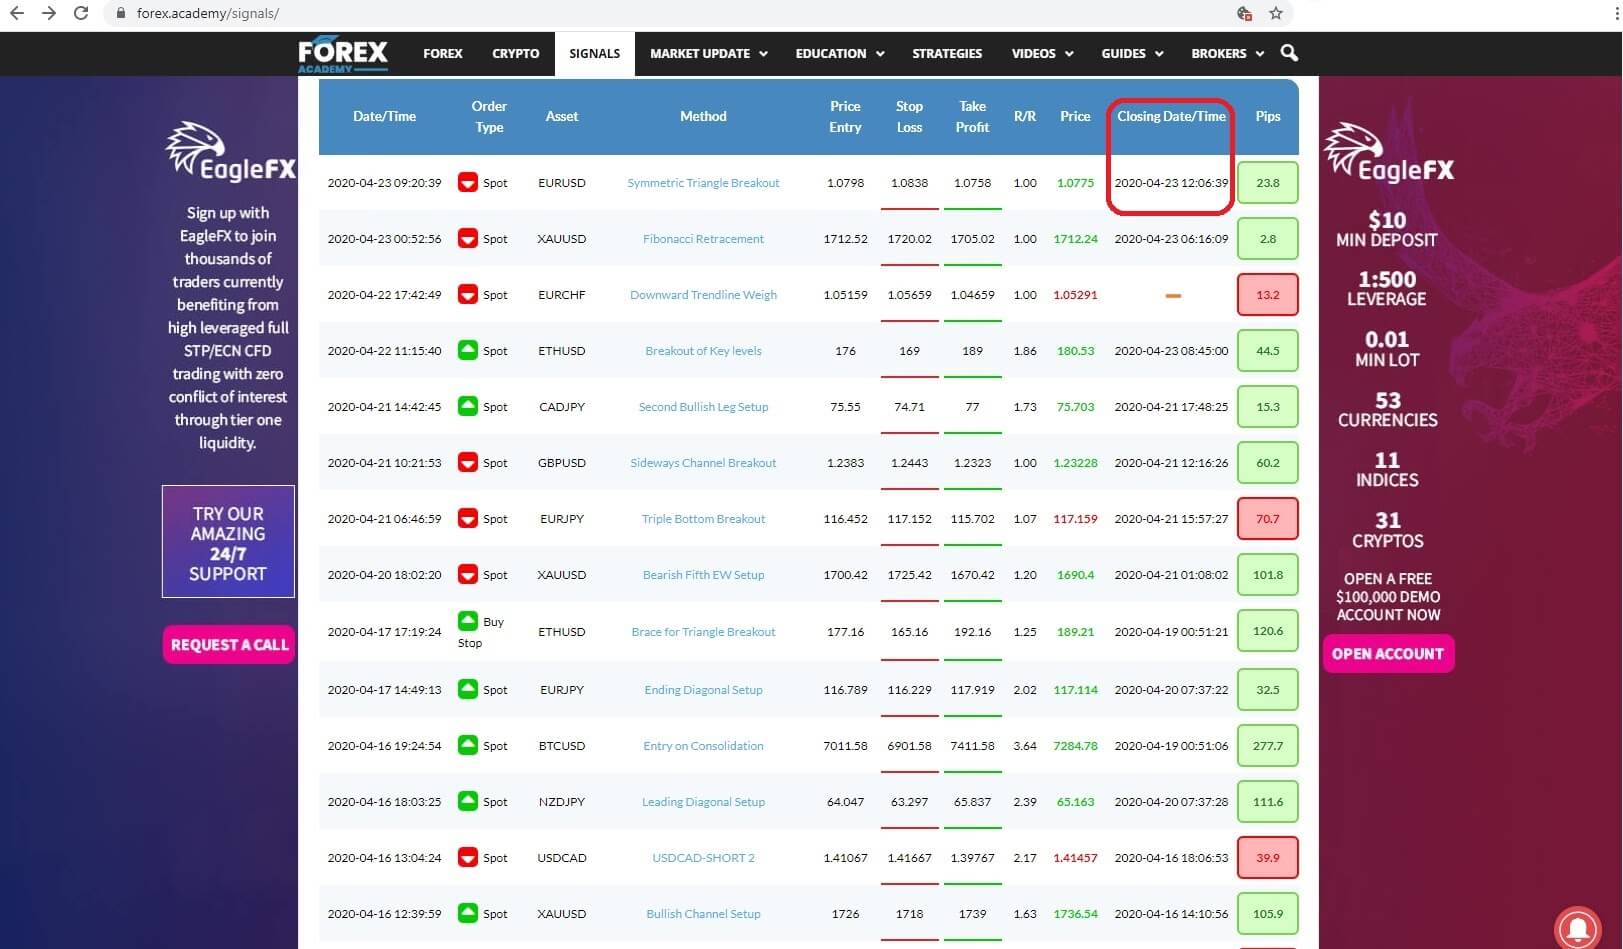
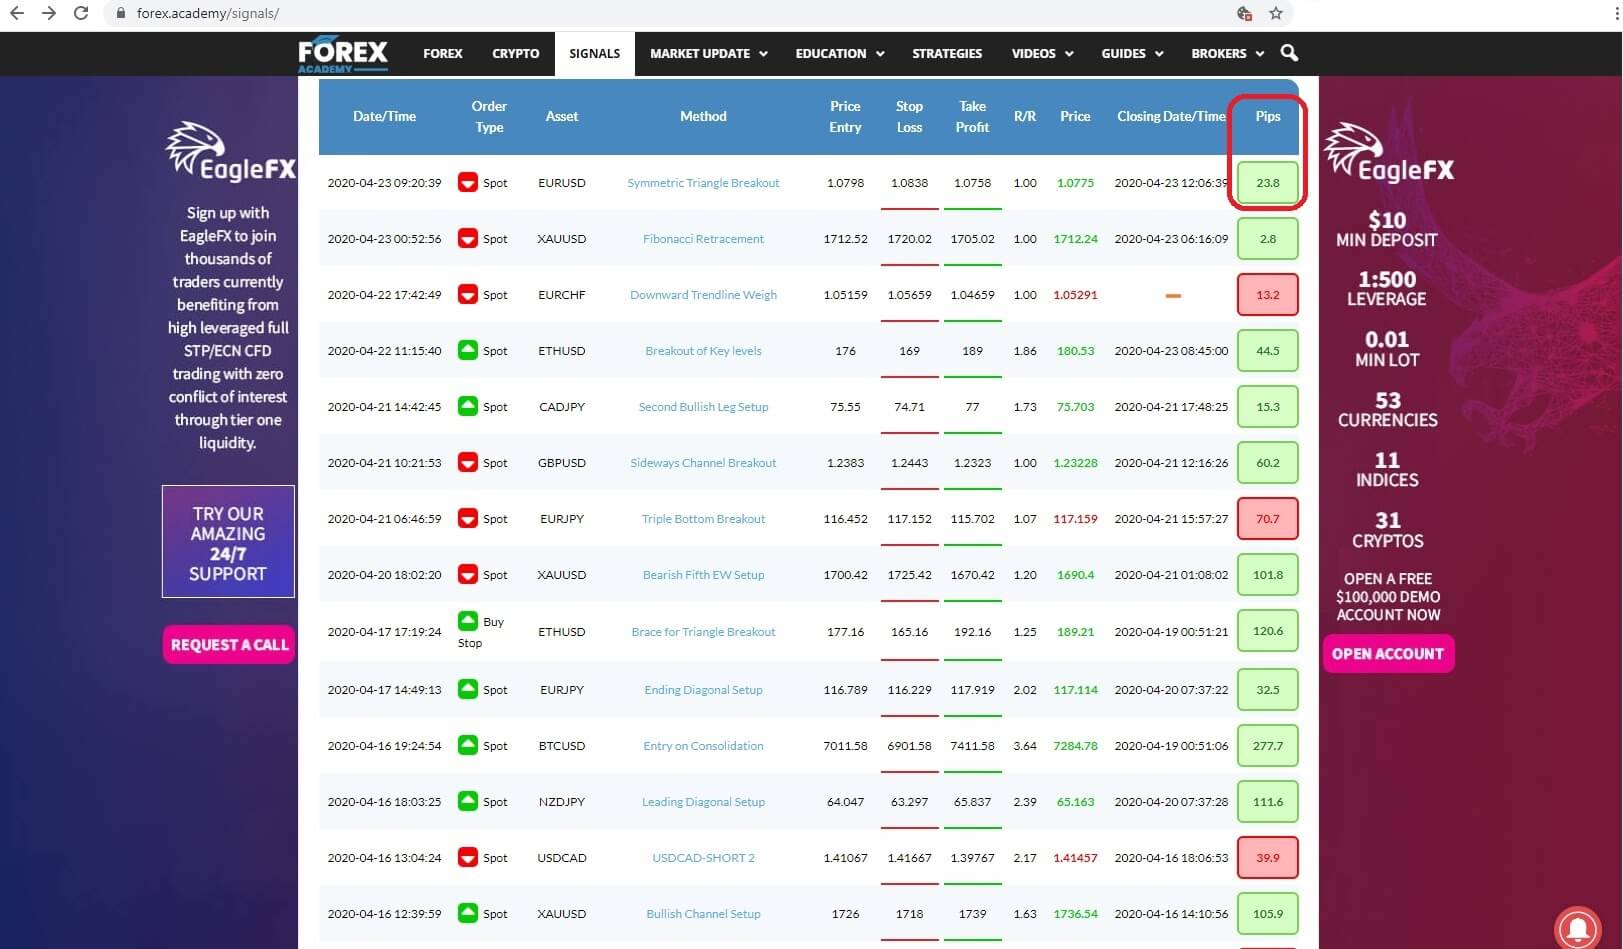
Each individual trade is listed on the table, and comprises of several components parts, including: Insert 1: The date the trade was listed: Insert 2: The type of order, which could be an instant execution, or spot trade, or a limit order including a buy limit or stop buy order or a sell limit or stop sell order, Insert 3: the type of asset, which could be a number of major or cross FX pairs and gold and bitcoin. Insert 4: the method where the each trader gives a detailed analysis of the thinking behind each trade, which, incidentally, most other signal providers do not offer, and where we will come back later in this video to take a more detailed look, Insert 5: the entry price for the trade, Insert 6: the stop loss for the trade, Insert 7 : the take profit level, Insert 8, The risk to reward level, Insert 9: the price level at close; Insert 10:
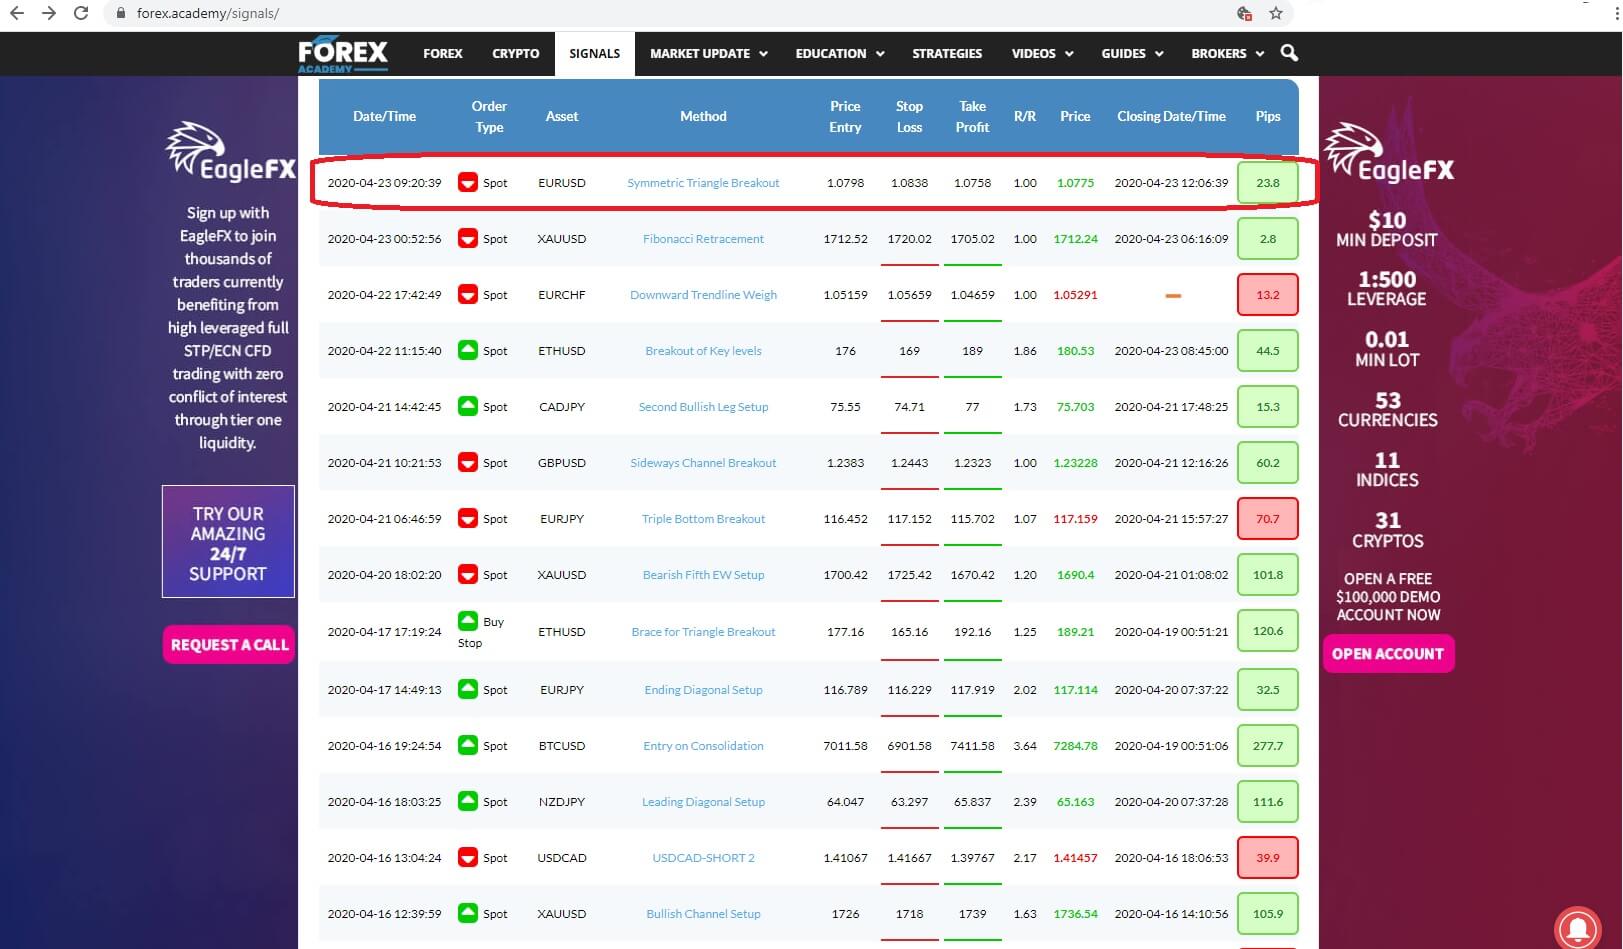
The closing date and time, if applicable and insert 11: the amount of pips won or lost or in the event of an open trade the fluctuating level of pips in play.
Now lets drill down a little further into the trade methodology as promised earlier.


The platform has a cool feature called the method, it allows total scrutiny of all trades by third parties, such as yourself, who want to know about the thinking and methodology behind the set-up of each trade. This is not about tossing a coin and hoping for the best, it’s about incorporating all the methods and techniques which are employed and incorporated by professional traders and institutions which have a high for this type of technical and fundamental analysis, which tend to offer a high success rate.
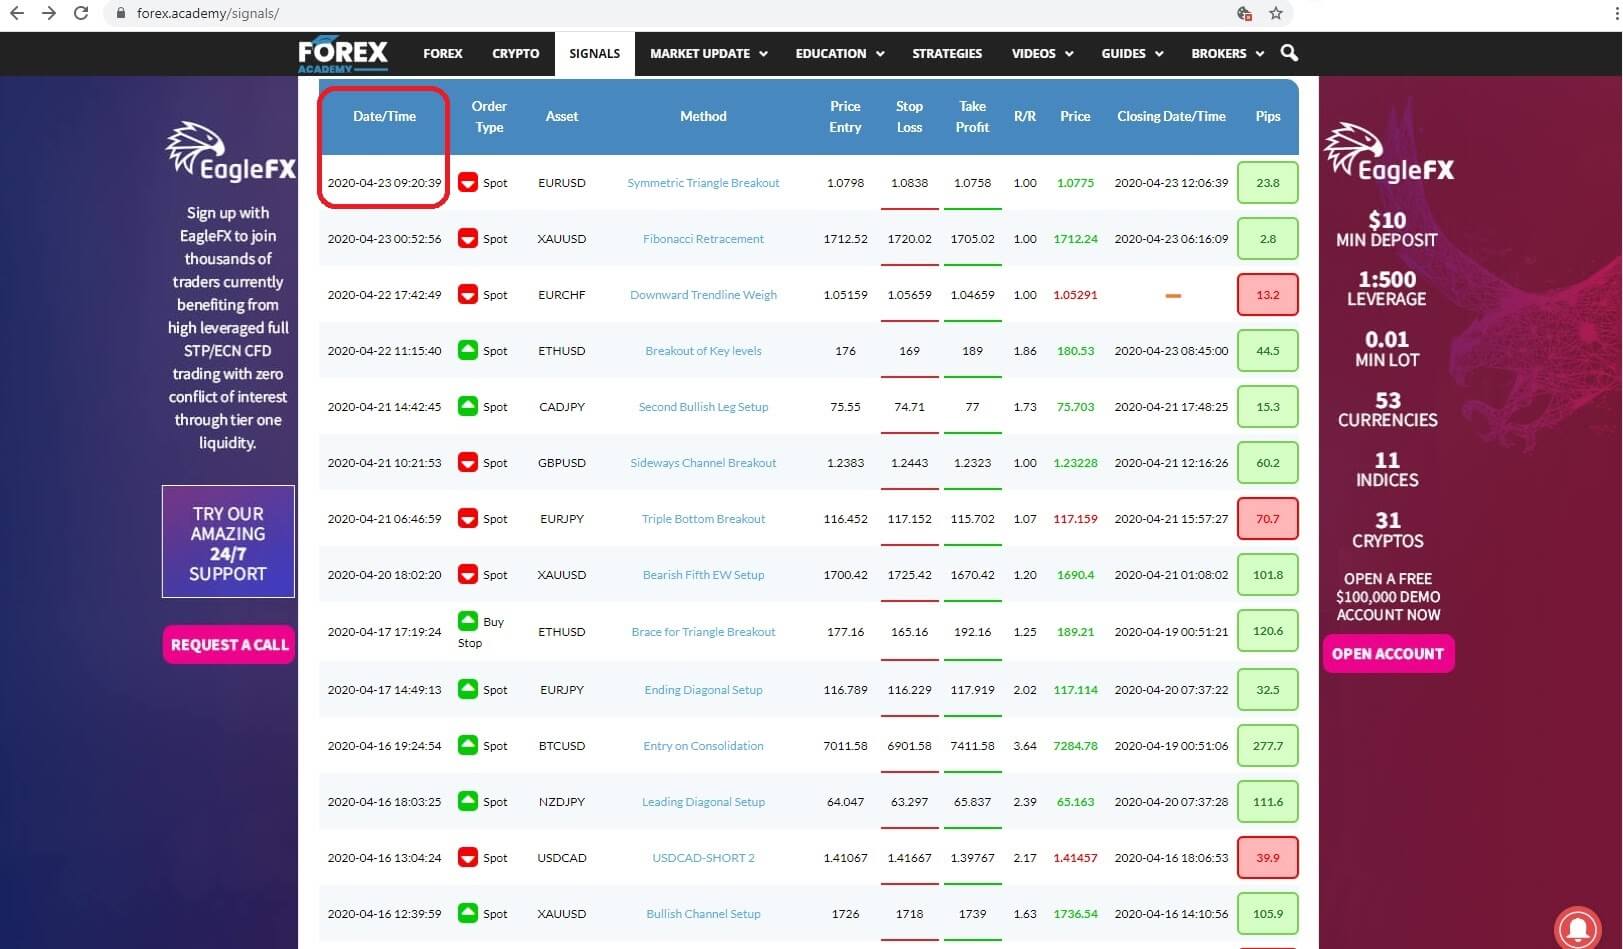
And so in this spot EURUSD trade, the trader had based his assumption that the pair should move lower and entered a short position as an instant execution trade at the exchange rate of 1.0798 with a stop loss of 1.0838 and a take profit target level of 1.0758 with a risk to reward ratio of 1.00 and where the trade was manually closed out on the 23rd 04 2020 at 12:06 PM with a profit of 23.8 pips. This tells us that the price action was reversing and unlikely to achieve its target exchange rate at 1.0758 and therefore the trader decided to close out. Followers would have the same option, and remember, this is about making money, and that markets can change direction and things can therefore change.


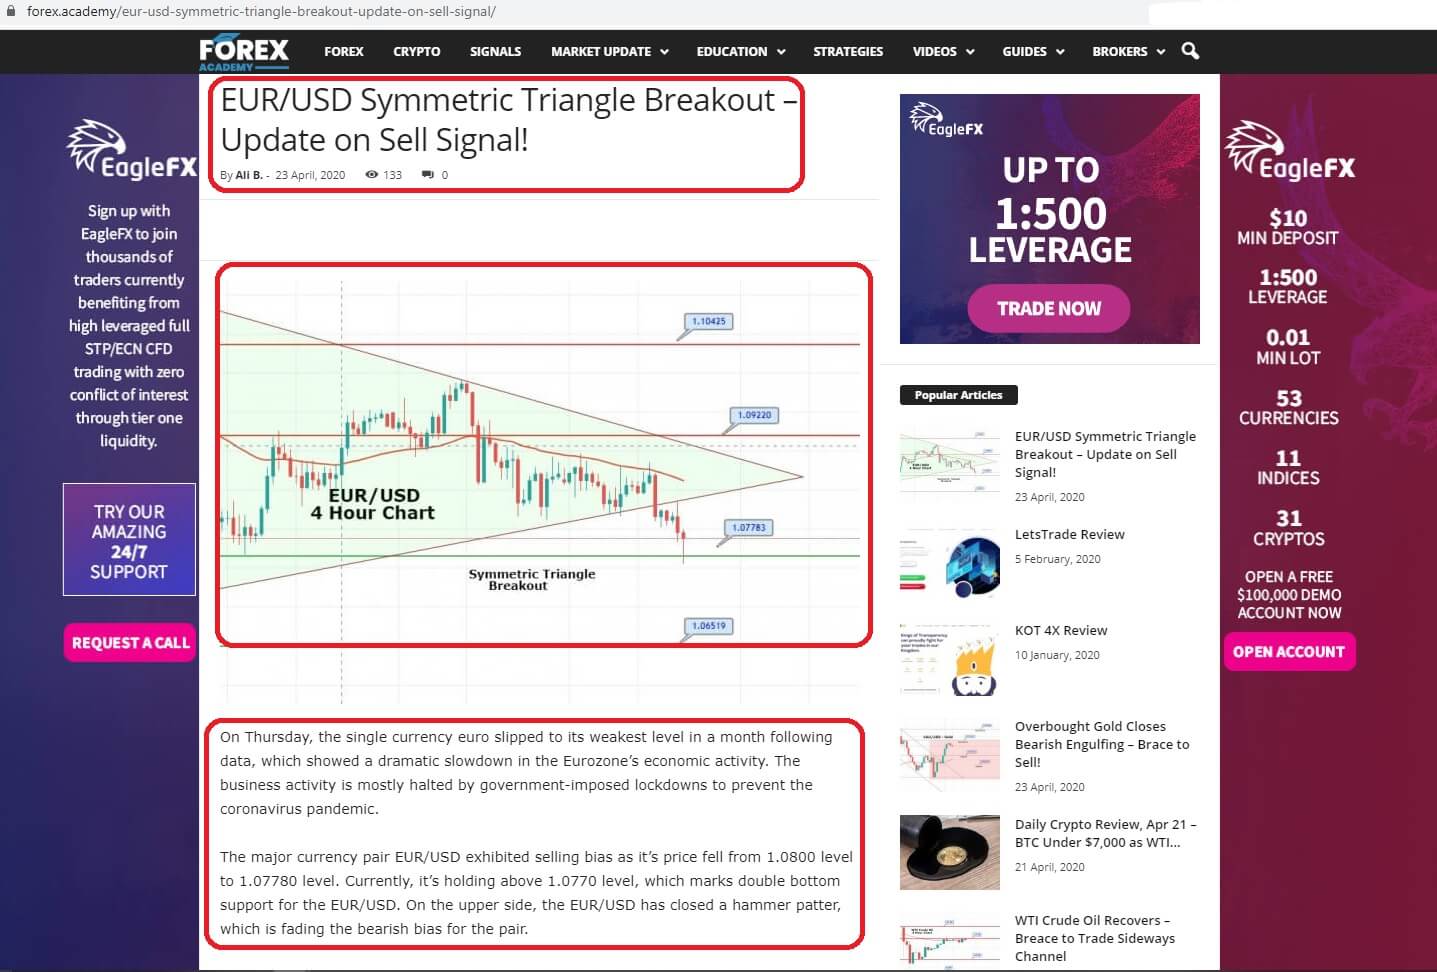
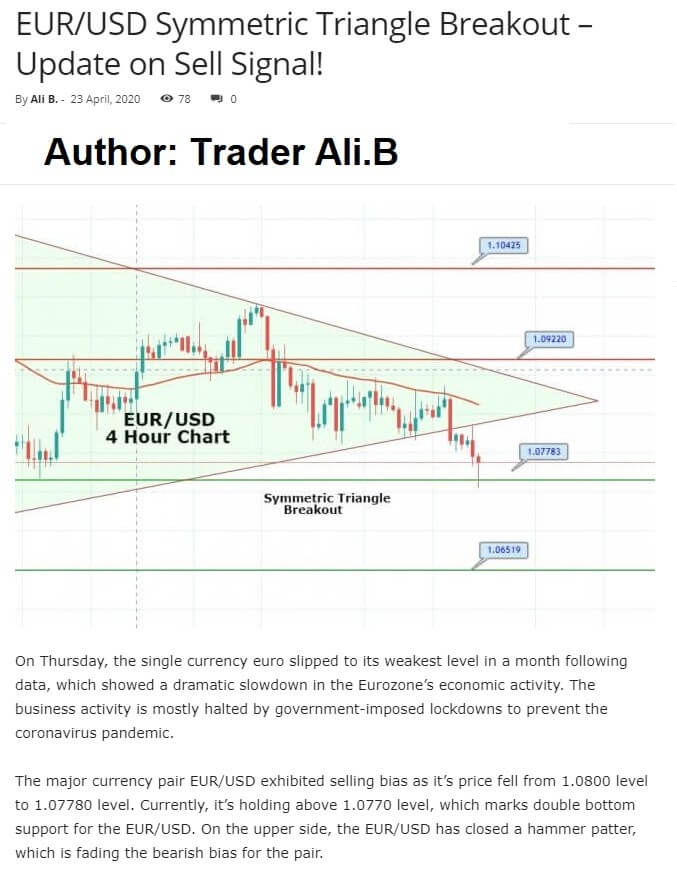
So let’s now click on the Method tab, and drill down further into the trading methodology behind this trade. Now you will be presented with a detailed analysis of this train set up. In this instance, the trader is Ali.B, who has elected to use a technical and fundamental analysis approach, based on a symmetrical

triangle breakout and while preferring the 4-hour time frame. Ali has incorporated several support and resistance levels, and has keenly observed that price action was forming a squeeze, and that a symmetrical triangle breakout had occurred and this was the set-up that he had incorporated as the backbone of this trade.
Ali provides detailed clarification from a fundamental basis, which is backed up by cool headed technical analysis.


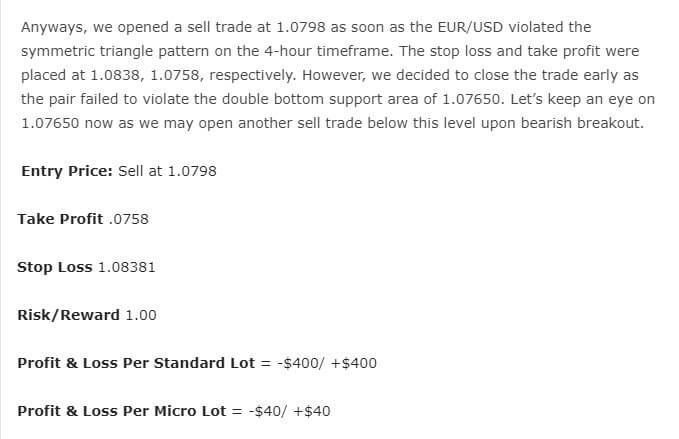
By scrolling down we can see that more detailed information has been provided and where copy traders can also calculate what their profit and loss would likely be in the trade was allowed to go all the way to the targets and stop levels, based on the incorporation of using a standard or micro lots for those who decide to copy the signals.

This is the trading signals service table in a nutshell, it’s completely transparent, fully detailed, easy to follow with trades that can be copied by others, including new traders, or even experienced ones with a limited amount of time to set up their own trades, or those who wish to supplement their trading portfolios.
So what is the catch I hear you say? Other signal providers want to charge me a monthly subscription fee, often quite expensive, so there must be a catch or there must be something wrong with this service. Well just because it’s free, it doesn’t devalue the product and Insert J
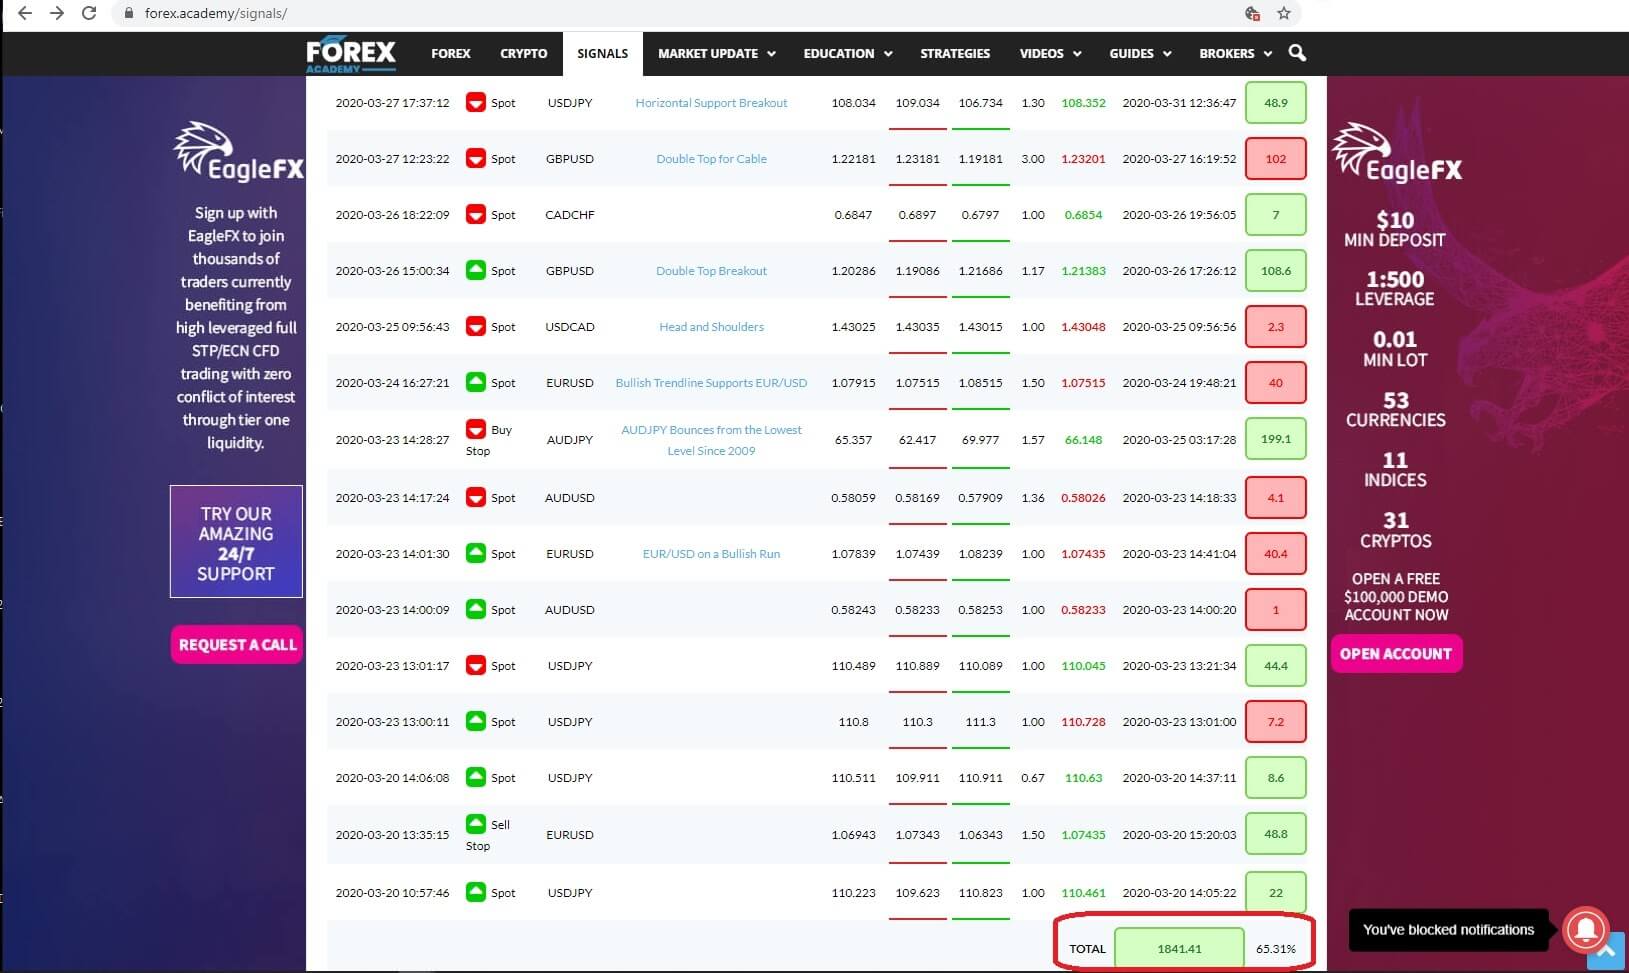
just look at the success story so far, in just a few weeks our team of professional traders, many who will be trading these setups themselves, with their own funds, has bagged a very impressive amount of pips won of 1841.41, and that equates to $18,410 less fees and spreads for traders who copied all these signals with risking one standard lot size, and even a still impressive $1,841 less fees and spreads while risking a mini lot. All with a win to lose ratio currently running at over 65%.
As for the trading signals service being free; well it is all a part of the commitment by the owners and team here at Forex.Academy to offer free professional, comprehensive educational and related services within the world of financial trading.

Join us for part 2 to find out how this brand new free service can help you.

Categories
Forex Signals

ETH/USD Peaking Out of Descending Trendline – Brace for Bullish Trade! 

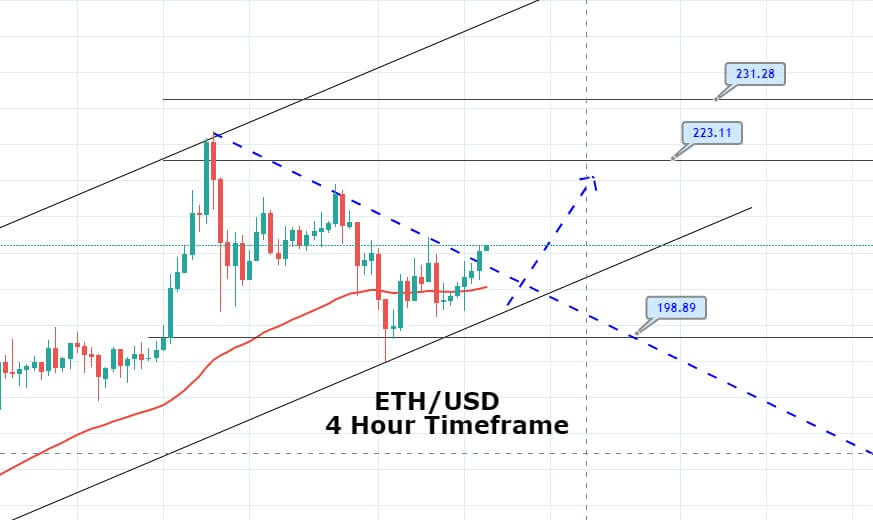
Yesterday on Tuesday, the ETH/USD pair had exhibited slight bullish momentum on the 4-hour timeframe, which leads Ethereum prices to soar over 200 resistance levels. With this, the ETH/USD pair has crossed over 50 periods EMA and has also closed three white soldiers pattern on an 8-hour timeframe, which suggests odds of the bullish trend.

The support level stays around 205, which is extended by the 50 periods EMA on the 4-hour timeframe. While the MACD is also showing a bullish crossover as it has started concluding histograms above 0, demonstrating bullish bias in ETH/USD. 

For now, the ETH/USD has the potential to target the next resistance around 220 and 224. However, on the way, it may also meet an immediate hurdle around the 211 level. Therefore, the idea will be to place a buy stop above 177.16 with a stop loss below 165.16 and take profit at 192.16.


Trading Plan Summary

Buy Stop: 210.78    

Protective Stop: 203.28    

Profit Target: 222.78    

Risk/Reward Ratio: 1.60    

Categories
Forex Signals

GBP/USD Violates Upward Channel – Ready for a Sell Limit? 

The GBP/USD currency pair failed to stop its 3-day losing streak and still trading below 1.2390 while representing 0.46% declines on the 4-hour timeframe. Sell-off came after the United Kingdom registered the highest death toll in Europe. The receding expectations of the government aid package also keep the currency pair under pressure. 

Moreover, the broad-based US dollar recovery rally weighed on the cable pair. At the press time, the GBP/USD currency pair is currently trading at 1.2435 and consolidates in the range between the 1.2425 – 1.2450. However, traders are cautious about placing any strong positions as they are keenly awaiting for the upcoming final reading of April month UK Constriction PMI.

As per the latest report, the UK reported the highest death toll in Europe by rose above Italy’s 29,315 figures with 29,427. As in result, the Tory government get pressurized and could face additional criticism. As we know, the UK government is already criticized massively about the shortage of medical supplies, falling below testing targets, and a lack of clear guidelines for lockdown exit as well.


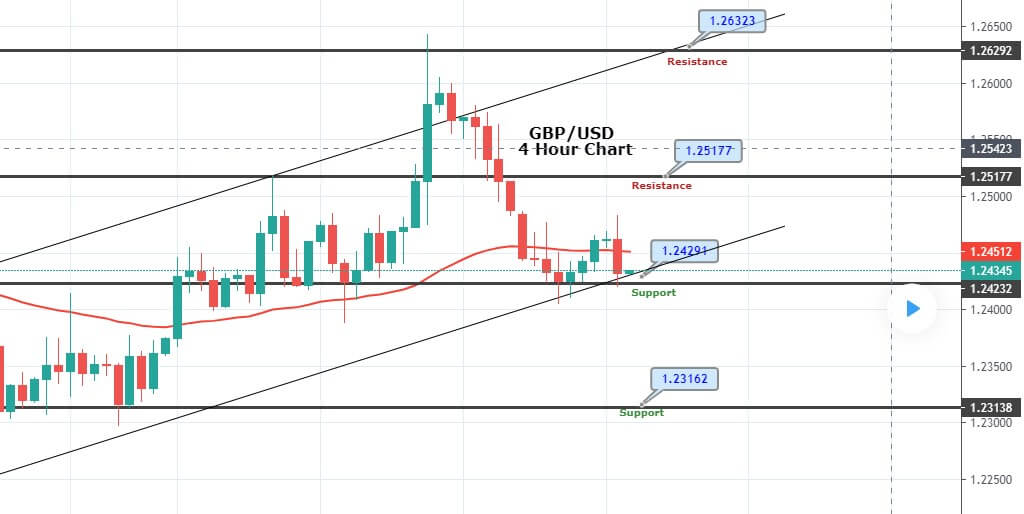
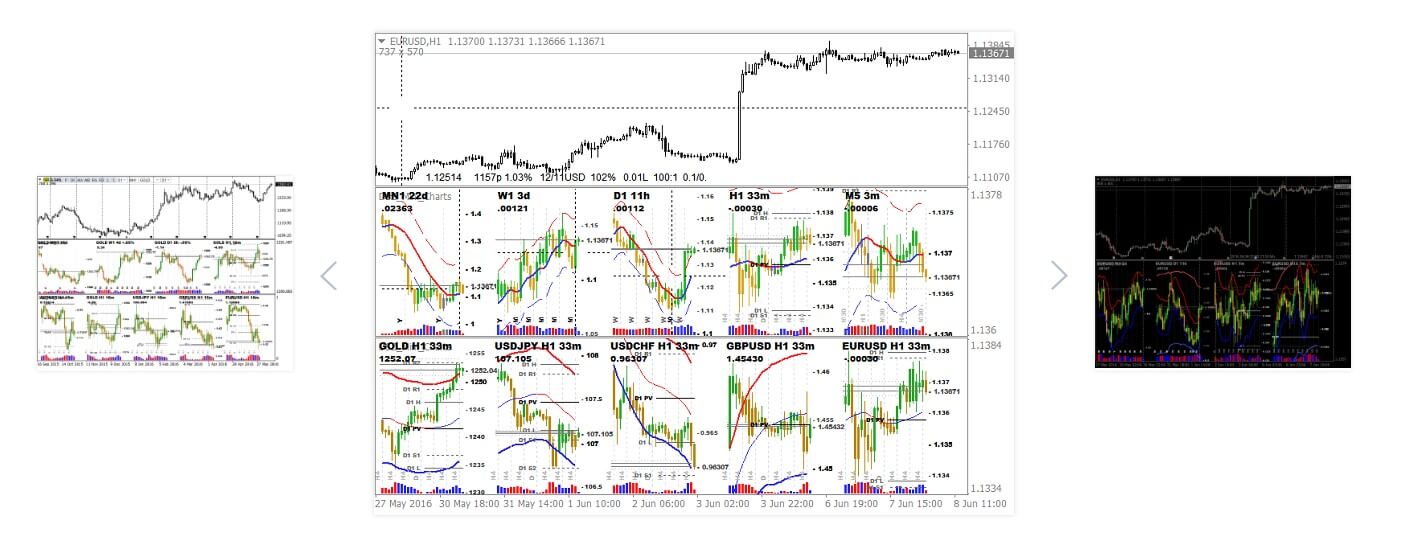
On the technical front, the GBP/USD pair has violated the upward channel on the 4-hour timeframe. The channel was supporting the pair around 1.2427 level, which Cable violated via closing a bearish engulfing candle. At the same time, the 50 EMA also extends resistance around 1.2425 area, and below this, the pair has the potential to drop until the next target level of 1.2318 level and even below this until 1.2246. Considering this, we should wait for a slight retracement in Sterling, and it’s worth placing a sell limited instead of entering a sell trade right away. 
Entry Price: Sell Limit at 1.2418       

Take Profit 1.2318    

Stop Loss 1.2498

Risk/Reward 1.25

Profit & Loss Per Standard Lot = -$600/+$1000

Profit & Loss Per Micro Lot = -$‭‭60/+$100

Categories
Forex Signals

USD/JPY Breakout of Symmetric Triangle – Brace for Sell Position! 

The USD/JPY currency pair failed to stop its 4th-consecutive session losing streak and dropped to fresh seven-week lows, around the 106.20 regions on Wednesday as the US dollar still depressed against its Japanese counterpart. The intensifying tension of the US-China war boosted the Japanese yen safe-haven demand, which eventually keeps the currency pair under pressure. 

At this moment, the USD/JPY currency pair is currently trading at 106.31 and consolidates in the range between the 106.22 – 106.64. However, the currency pair failed to cheer the positive news about the re-opening of economies as traders awaited Chinese reaction to the US allegations.

Despite the fresh, positive report that most of the nations are set to re-starting their economies, investors are still cautious due to the intensifying fears of the second flow of a rise in the virus infections and worsening US-China relationships. 

US President Donald Trump gave warning about imposing a fresh tariff on Chinese goods in toke revenge on the mishandling of the virus outbreak at the early stage. As in result, the Japanese yen continues to taking bids.


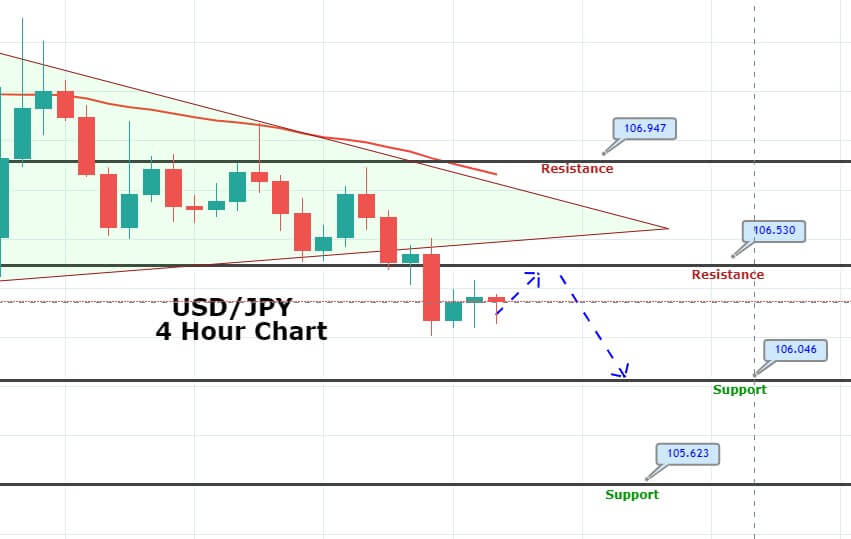
Technically, the USD/JPY pair has violated the symmetric triangle pattern, which was supporting the pair around 106.530. Violation of this candle may drive further selling in the pair until the next support area of 106.027, while resistance now continues to stay at 106.530. The MACD has started forming bearish histograms below 0, which is supporting selling bias in the USD/JPY pair. The violation of a symmetric triangle pattern can trigger further selling, so we have opened a selling trades in USD/JPY. 

Entry Price: Sell at 106.27   

Take Profit 105.77    

Stop Loss 106.77    

Risk/Reward 1.00

Profit & Loss Per Standard Lot = -$500/+$500

Profit & Loss Per Micro Lot = -$‭‭50/+$50

Categories
Forex Signals

Bitcoin Breaks the triangle formation to the Upside

The Setup

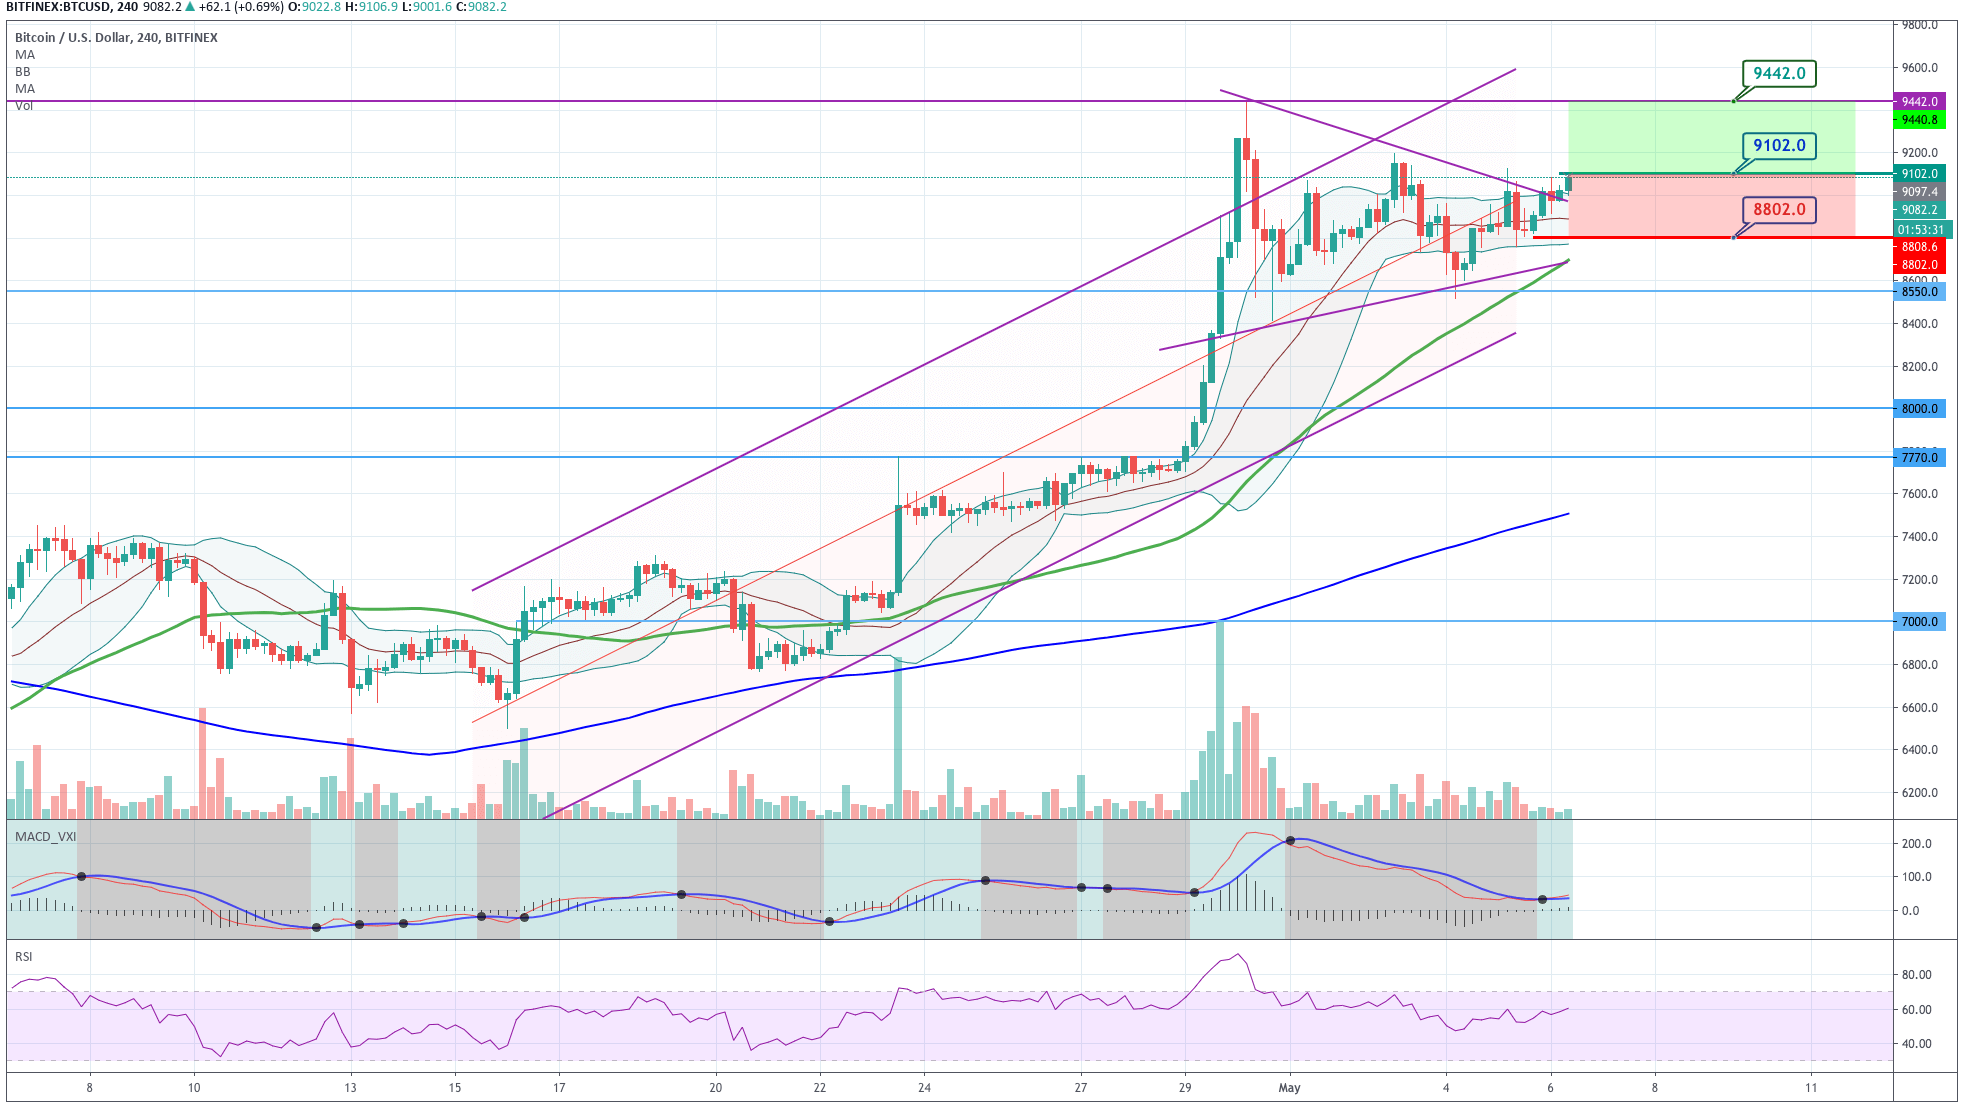
Bitcoin has been creating a consolidation range after the extensive bullish impulse made on April 29. The consolidation is also within the upward channel. Lately, the price is making a breakout of the triangle, and above the $9,000 resistance level. Also, the MACD made a bullish crossover, and the RSI is progressing and touching the 60 level.

Also, BTC price moves above its 20-, 50- and 200-period SMA which means the underlying trend is up.

A trading plan can be made, assuming the continuation of the bullish trend, with an entry above the current price of $9,100, with a stop below the recent low, and betting that at least the price will try to hit the last high of $9,442

The key levels

Risk and Reward

This trade has a $300 risk and $340 profit. for every bitcoin unit.

Reward/risk = 1.13

We recommend taking no more than 0.1 BTC for every $1000 in your account.


Categories
Forex Options

FX option expiries for May 6 New York cut

Thank you for visiting the Forex.Academy FX Options Expiries Section. Each day, where available, we will bring you notable maturities in FX Options of amounts of $100 million-plus, and where these large commutative maturities at specified currency exchange rates often have a magnetic effect on price action, especially in the hours leading to their maturities, which happens daily at 10.00 AM Eastern time. Each option expiry should be considered ‘in-play’ if labelled as Hot, Warm or ‘out of play’ if labelled Cold with regard to the likelihood of price action meeting the strike price at maturity.

…………………………………………………………………………………………………………………..
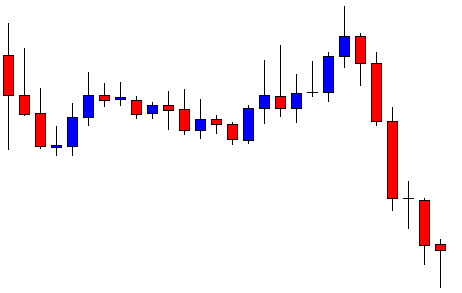
FX option expiries for May 6 New York cut

FX option expiries for May 6 NY cut at 10:00 Eastern Time, via DTCC, can be found below.

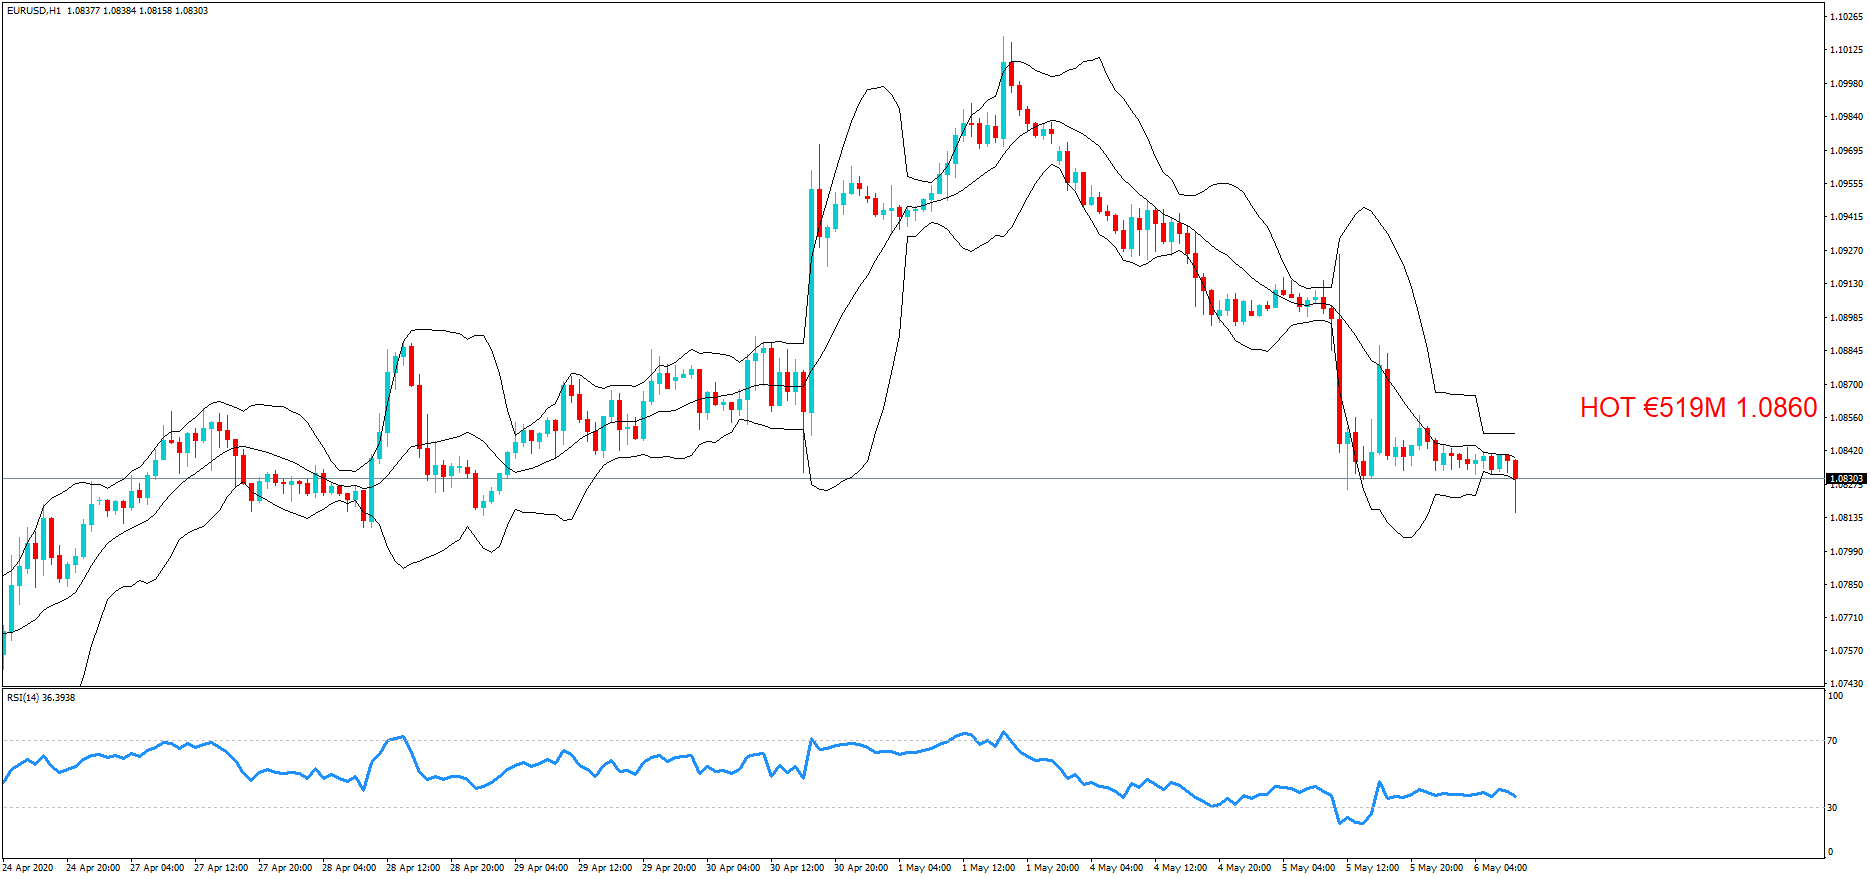
EUR/USD: EUR amounts

  • 1.0860 519m 


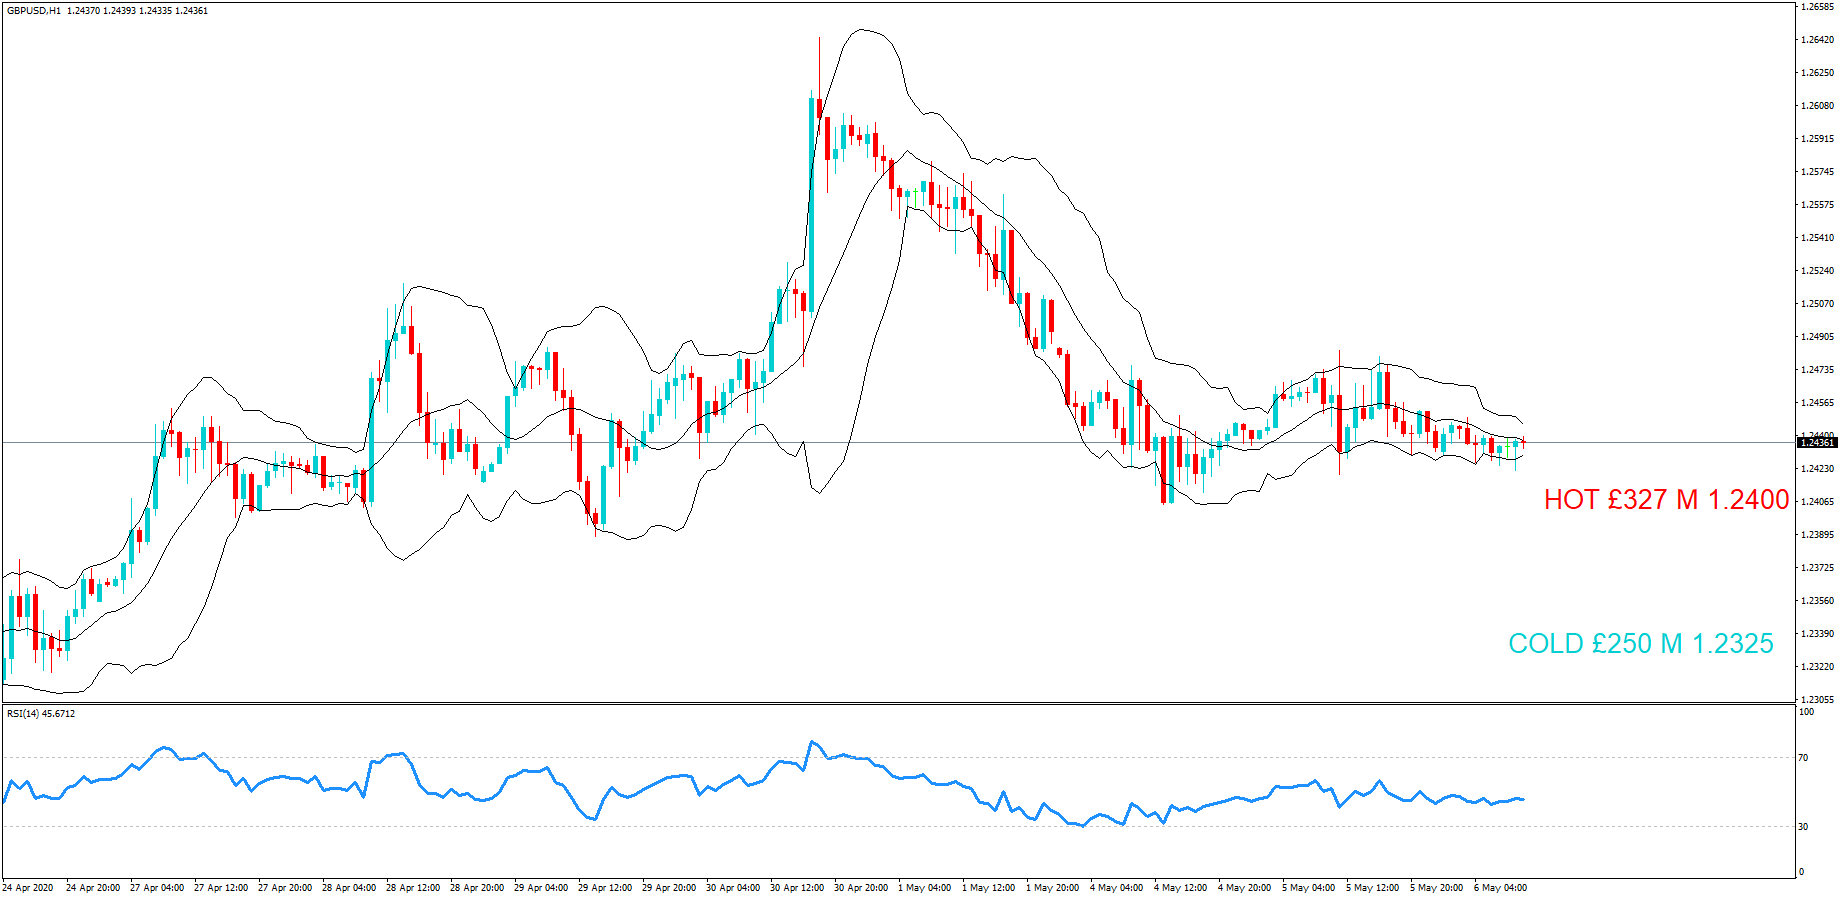
– GBP/USD: GBP amounts   

  • 1.2325 250m
  • 1.2400 327m

………………………………………………………………………………………………………………

If you want to learn how forex option expiries affect price action in the spot FX market see our educational article by clicking here: https://bit.ly/2VR2Nji

DISCLAIMER: Please note that this information is for educational purposes. Also, heat levels may change throughout the day in line with the exchange rate fluctuations due to technical analysis trading and upcoming economic data releases of the associated pairs.

Categories
Forex Market Analysis

Daily F.X. Analysis, May 06 – Top Trade Setups In Forex – Eyes on Services PMI Figures! 

The U.S. dollar was also supported by the re-opening of economies by many countries, including several states of the U.S., which resulted in the risk-on sentiment in the market. Meanwhile, the announcement Trump made against China about imposing tariffs in case China fails to meet the condition of buying U.S. goods worth 200$. On Wednesday

Economic Events to Watch Today


EUR/USD – Daily Analysis

Today in the early Asian session, the EUR/USD currency pair struggling to break a bearish channel around 1.09 after the registered biggest daily drop by 0.67% to 1.0899 level in over a month on Monday due to broad-based U.S. dollar strength.

At 11:45 GMT, the French Government Budget Balance by the French Treasury Agency was released, which showed a deficit of 52.5B. At 12:00 GMT, the Spanish Unemployment Change fell short of expectations of 500K and showed that during April, 282.9K people were jobless. At 14:00 GMT, the Producer Price Index for March showed a decline of 1.5% against the expected decline by 1.3%.

The Factory Orders dropped to a record of 10.3% during the month of March against the forecasted 9.7% decline. However, in contrast to the economic data, the U.S. Dollar Index remained strong during Monday when it gained about 0.4% and it to 99.59 level, which is the highest since Thursday. The key factor will be the NFP data on Friday this week, and investors will be looking forward to it.
U.S. dollar was also supported by the re-opening of economies by many countries, including several states of the U.S., which resulted in the risk-on sentiment in the market. Meanwhile, the announcement Trump made against China about imposing tariffs in case China fails to meet the condition of buying U.S. goods worth $200.

The renewed fears of a trade war between China & the U.S. also helped the greenback to gain traction against its rival currency EUR, and hence, the EUR/USD pair declined on Tuesday. Strong U.S. dollar amid better than expected economic data along with the weak EUR due to German court ruling on Tuesday caused EUR/USD pair to drop to 1.08257 level.
Daily Support and Resistance

  • R3 1.0927
  • R2 1.0921
  • R1 1.0912

Pivot Point 1.0906

  • S1 1.0896
  • S2 1.0891
  • S3 1.0881

EUR/USD– Trading Tips

The EUR/USD price trading slightly bearish falling to 1.0837 level after violating the upward trendline at 1.0889. On the 4 hour chart, the EUR/USD has formed a strong bearish engulfing candle, which is proposing selling bias among traders. Typically such a pattern reveals that buyers are weakened, and sellers may control the market. On the downside, the EUR/USD may encounter next support around 1.0835 level and violation of which can open further opportunity for selling until 1.07600 level. 

GBP/USD – Daily Analysis

The GBP/USD is currently trading at 1.2428 and consolidates in the range between the 1.2410 – 1.2440. However, the traders are cautious about placing any position due to mixed market sentiment ahead of the U.S. Advance Nonfarm Payroll data, which is coming out during the New York session today. 

Furthermore, the Bank of England will hold its official monetary policy meeting in the coming Thursday this week, and investors will be waiting for it. The BoE is expected to keep its interest rates unchanged at 0.10%. However, the speech and briefing will be new to Pound traders.

The pair GBP/USD roughly made a move on Tuesday and rose about only 0.05%. However, Cable has the potential to move in an upward direction and give a strong performance in the coming months. The U.K. & the U.S. talks will take effect from today over the matter of post-Brexit trade deal with E.U. It should be noted that this deal could help economies to recover from the COVID-19 pandemic.

On Tuesday, the International Trade Secretary Liz Truss started the trade talks via video conference with the U.S. trade representative Robert Lighthizer. Pound traders will keep an eye on the talks for further investment.

The drop of GBP/USD pair in the absence of any macroeconomic data and news from Great Britain was caused by the strength of the U.S. dollar across the board. Despite the poor Factory Orders data from the U.S. on Monday, the U.S. Dollar Index rose about 0.4% and remained strong against its rival currencies.

Daily Support and Resistance

  • R3 1.2597
  • R2 1.255
  • R1 1.2497

Pivot Point 1.2451

  • S1 1.2398
  • S2 1.2352
  • S3 1.2299

GBP/USD– Trading Tip

On Wednesday, the GBPUSD pair unchanged and holding mostly above 1.2435, testing a triple bottom pattern around 1.2425. The recent Doji pattern on GBP/USD pair is suggesting chances of bullish correction over 1.2425 support level. This may lead the GBP/USD prices towards 1.2515 level. On the lower side, the violation of 1.2420 support can lead the Sterling prices towards the next target level of 1.2316. Overall, the trading bias of GBP/USD is neutral right now, but the violation of 1.2420 can drive selling until the next support level of 1.2345 and 1.2310 level today. 

USD/JPY – Daily Analysis

The USD/JPY currency pair finally broke out of trading ranges to trade at the 106.530marksk and recovered almost 25 pips from the initials low. The risk-on market sentiment is keeping the Japanese yen under pressure and provided support to the pair. On the other hand, the broad-based U.S. dollar weakness kept a lid on any gains in the currency pair. 

The USD/JPY is trading at 106.35 and is consolidating in the range between the 106 – 106.80. However, traders are cautious about placing any strong position ahead of the fresh catalyst. The reason behind the recovery of the risk sentiment is the sign of easing lockdowns, which provided a positive mood around the equity markets. As in result, the Japanese yen became weaker in the wake of decrease safe-haven demand and seen as a key factor behind the pair’s modest uptick.

Moreover, a drop in the rate of virus-led fatalities has also helped in risk recovery sentiment. At the USD front, the U.S. dollar lost its bullish traction and struggled to gain any follow-through traction on Tuesday. The weak U.S. dollar was considered as a barrier to restrict currency pair’s gains at least for now.

Anyhow, the currency pair stopped its 2-day decline streak, and now it will be interesting to see if the buyers can maintain the move due to the concerns about a US-China spat about the origin of the coronavirus.

Looking forward, the market traders will now keep their eyes on the U.S. economic docket, which will release the ISM Non-Manufacturing PMI. This coming data will likely influence the USD price moves and produce some short-term trading opportunities.

Daily Support and Resistance    

  • R3 107.36
  • R2 107.14
  • R1 106.86

Pivot Point 106.64

  • S1 106.37
  • S2 106.14
  • S3 105.87

USD/JPY – Trading Tips

The technical side of USD/JPY has turned bearish as the pair continues to trade bearish after violating the symmetric triangle support level of 106.700. As we can see in the 4-hour chart above, the USD/JPY pair has crossed below the symmetric triangle, which is now extending resistance around 106.650. The 50 M.A. is also keeping pressure on the pair around the same level of 107.050. Below this level, we may see a selling trend in the USD/JPY pair until the next target levels of 106

All the best for today! 

Categories
Forex Signals

Gold Symmetric Triangle Pattern – Who’s Up for Choppy Trading?  

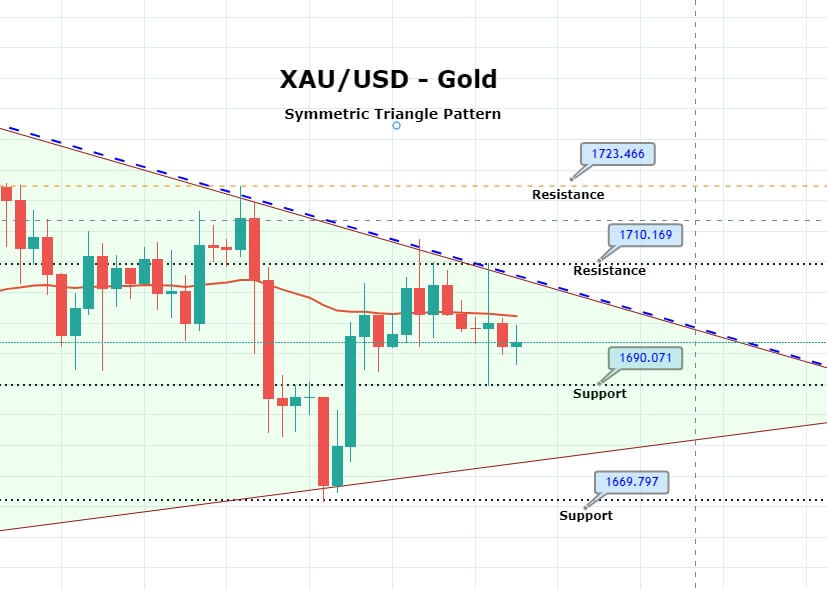
Gold prices continue to move in a sideways trading range of 1,710 – 1,690, while the recently formed symmetric triangle pattern is stretching the trading range. The fresh trading range is likely to provide selling below 1,700 and buying above 1,680. The gold prices are exhibiting mixed bias in the wake of mixed risk sentiment as many nations have also joined the United States in this blame-game to China because of the increased number of deaths and the global economic slowdown, both caused by the coronavirus pandemic. 

Britain has asked that China would have to answer about the information it shared about the outbreak. The US is formulating measures to hold China responsible for the damage caused by the pandemic. The measures would probably be the sanctions, new trade policies, and cancelation of US debt obligations.

On the other hand, on Sunda,y the US Secretary of State, Mike Pompeo, said that there was enormous evidence that the COVID-19 pandemic was originated in the Chinese Wuhan laboratory. All of the above news indicates the need for safe-haven and hence, gold surges above $1713 on Monday. Coronavirus has infected almost 3.5M people across the globe, and governments & central banks all over the world have announced considerable monetary and fiscal measures to reduce the economic damage.

On the macroeconomic data side, at 19:00 GMT, the Factory orders of the United States showed a decline of 10.3% in the month of March, which was previously expected to be declined by 9.2%. This weakened the US dollar across the board and added in the upward movement of gold prices.


On the technical front, gold has crossed below 50 periods EMA which is providing resistance around 1,701 level. Recent close of bearish engulfing on the 4-hour timeframe suggesting investor’s bias towards selling. On the higher side, a downward trendline may also extend resistance around 1,705, and below this level, we may see selling until 1,690 and 1,683 level today. 

  • Entry Price: Sell at 1695.83    
  • Take Profit 1683.83
  • Stop Loss 1705.83    

Risk/Reward 1.20

  • Profit & Loss Per Standard Lot = -$1000‬‬/ +$1200‬
  • Profit & Loss Per Micro Lot = -$‭‭100/+$120
Categories
Crypto Videos

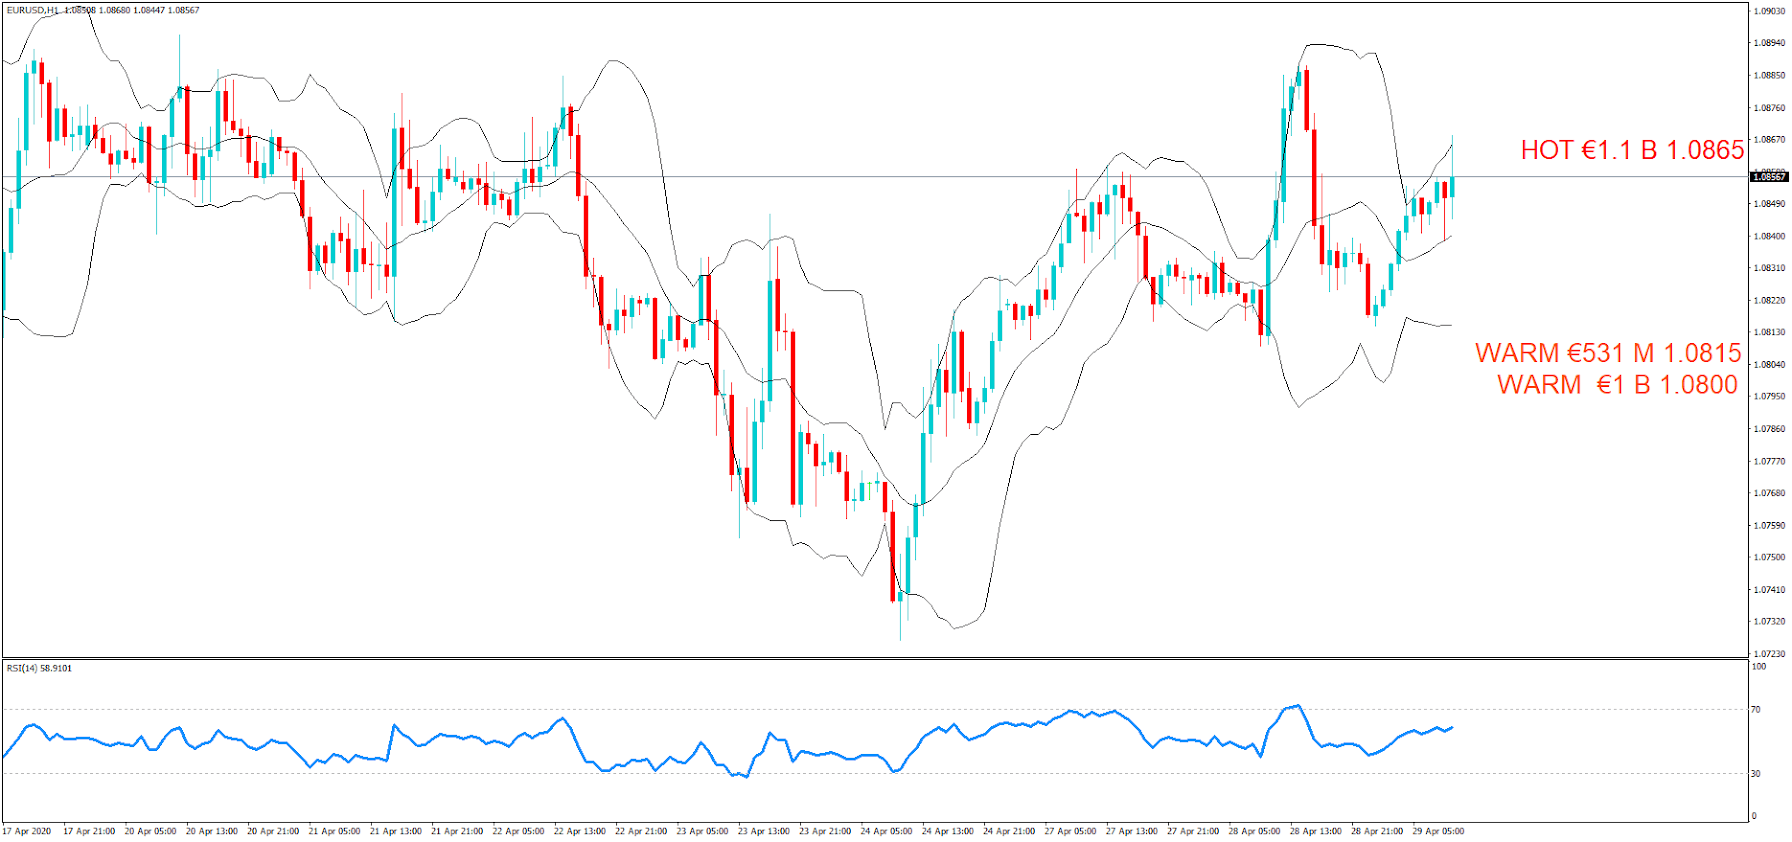
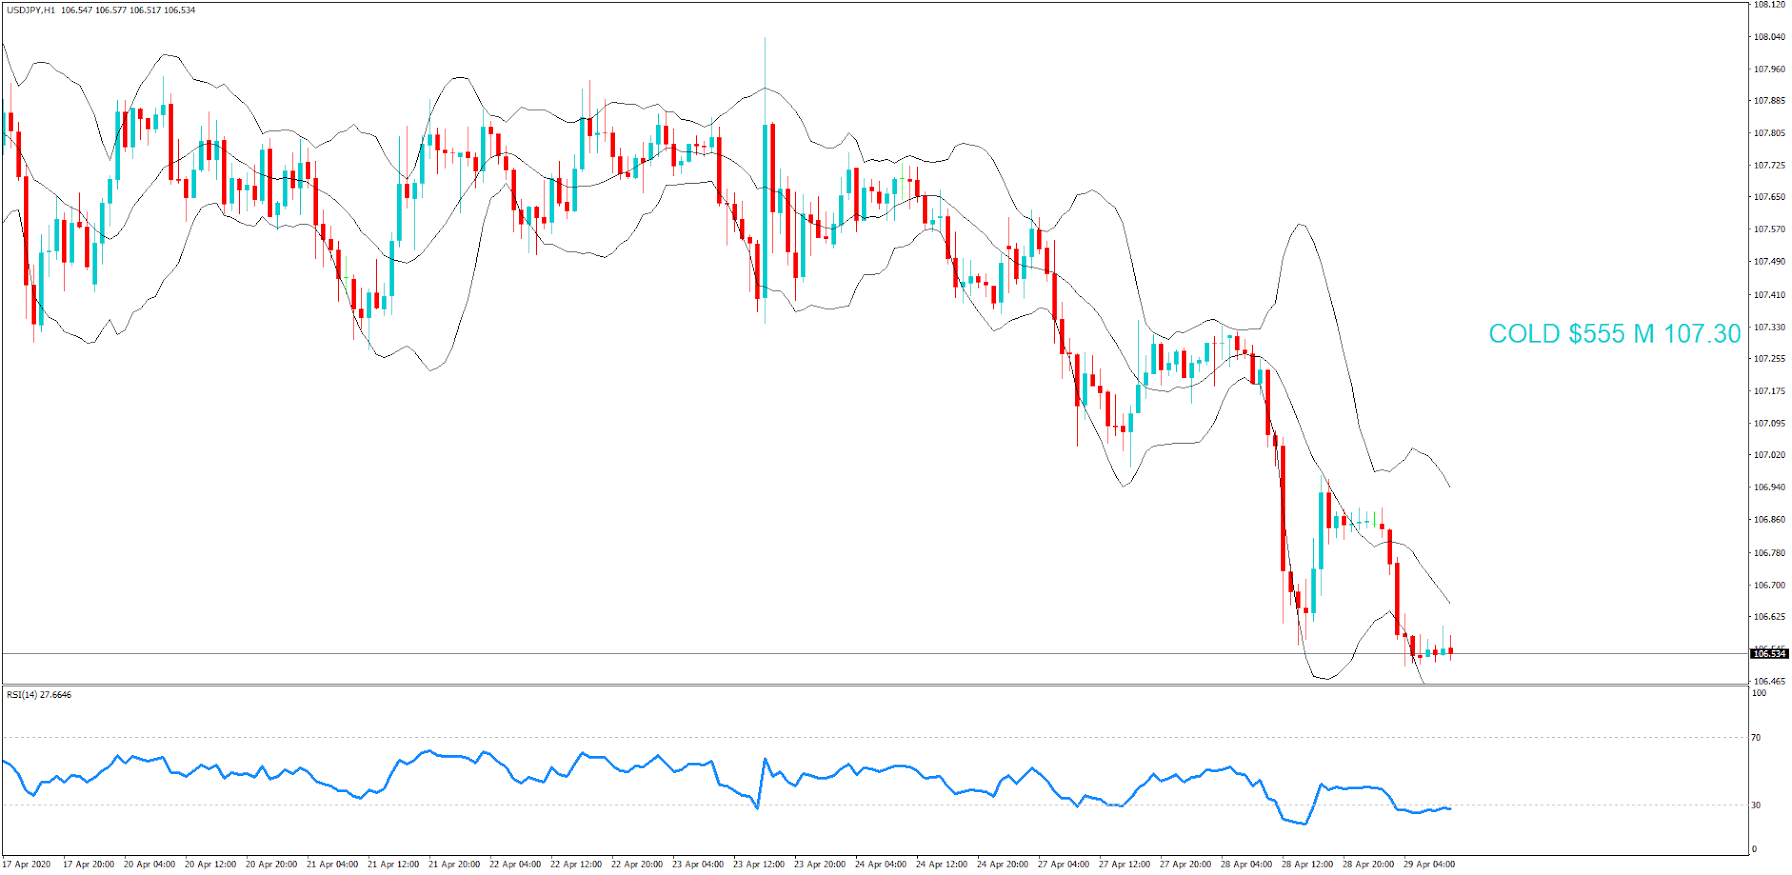
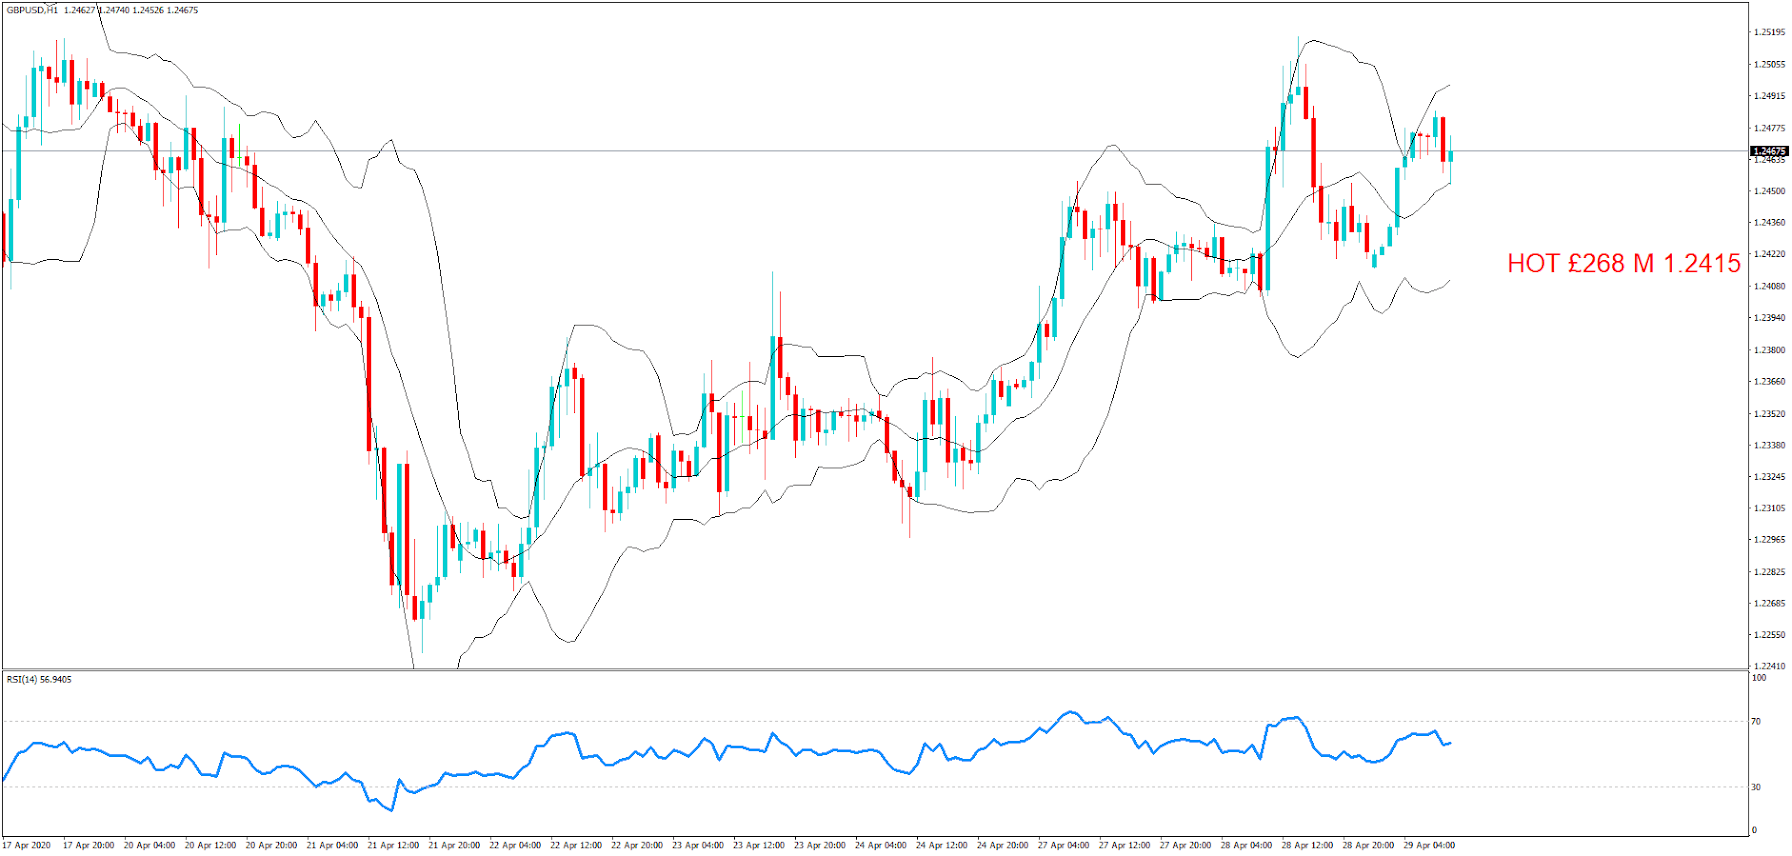
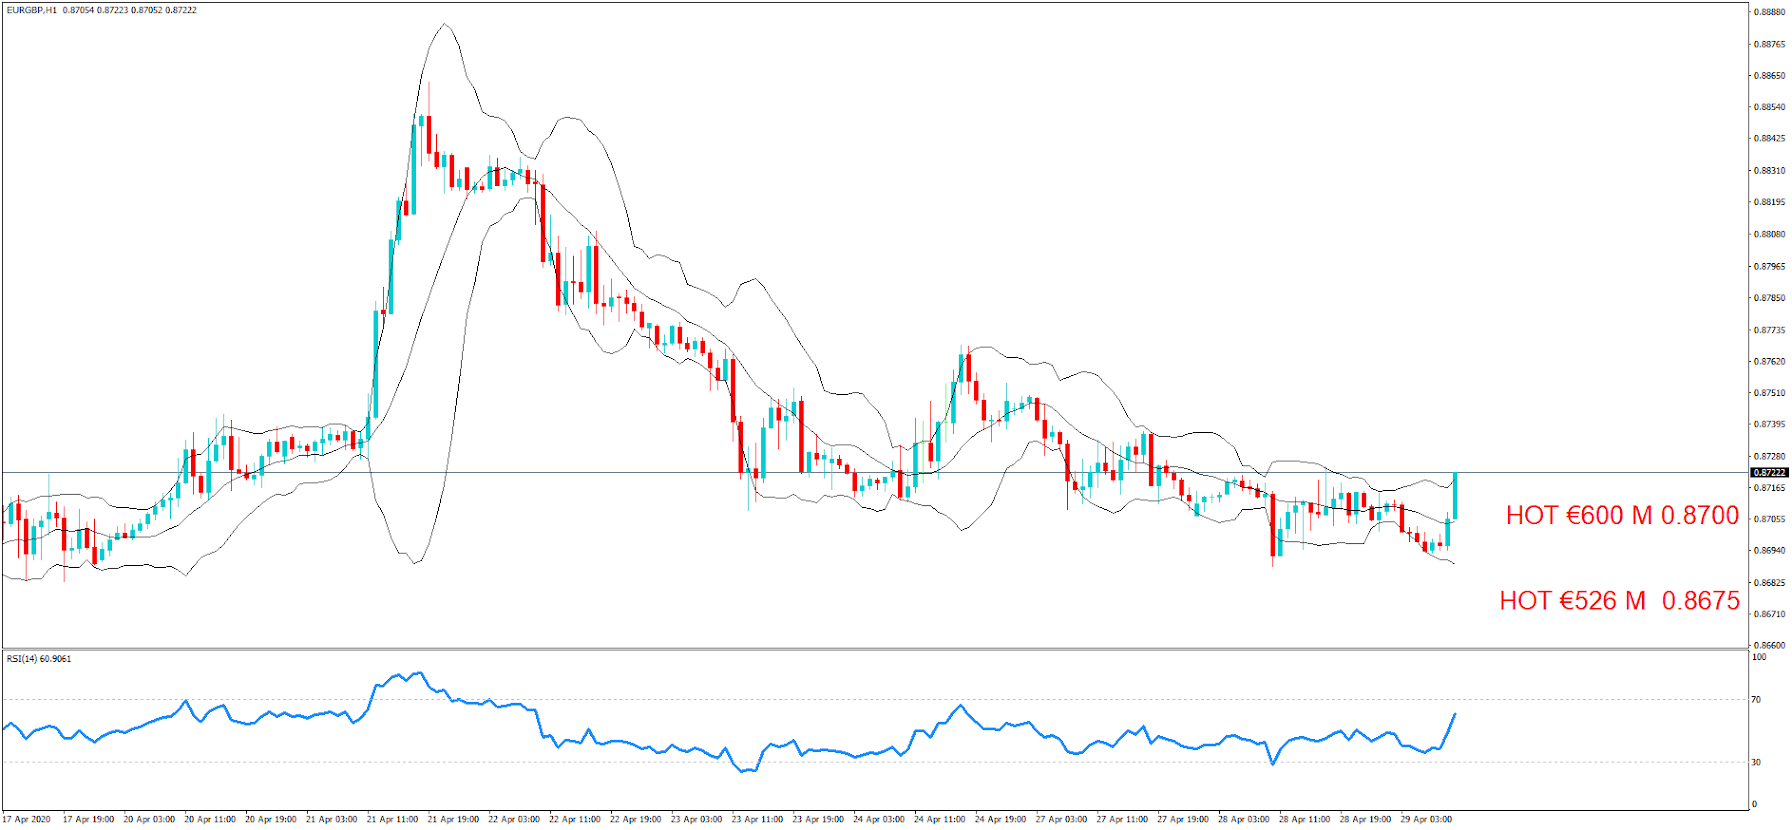
Forex Option Expiries Over $100,000,000 – The 10AM New York Cut part 3


FX option expiries for Apr 29, NY cut at 10:00 Eastern Time, via DTCC, can be found below.


– EUR/USD: EUR amounts
• 1.0800 1.0bn
• 1.0815 531m
• 1.0865 1.1bn
– USD/JPY: USD amounts
• 107.30 555m
– GBP/USD: GBP amounts • 1.2415 268m
– EUR/GBP: EUR amounts
• 0.8675 526m
• 0.8700 600m

Hello everybody and thank you for joining us for the daily FX expiries briefing video for the 10 am New York cut today. If it is your first time with us, the FX currency options market runs in tandem with the spot FX market, but where traders typically place Call and Put trades on the future value of a currency exchange rate and these futures contracts typically run from 1 day to weeks, or months.

Each day we bring you details of the notable FX option expiries where they have an accumulative value of a minimum of $100M + and where quite often these institutional size expiries can act as a magnet for price action in the Spot FX arena leading up to the 10 a.m. cut.
We will also plot the levels on to the relevant charts at the various exchange rates where there are due to expire, and also identify the levels which are in play, and where we believe there is a greater chance of the expiry maturing based on technical analysis at the time of writing, we will label them as hot, warm or cold.

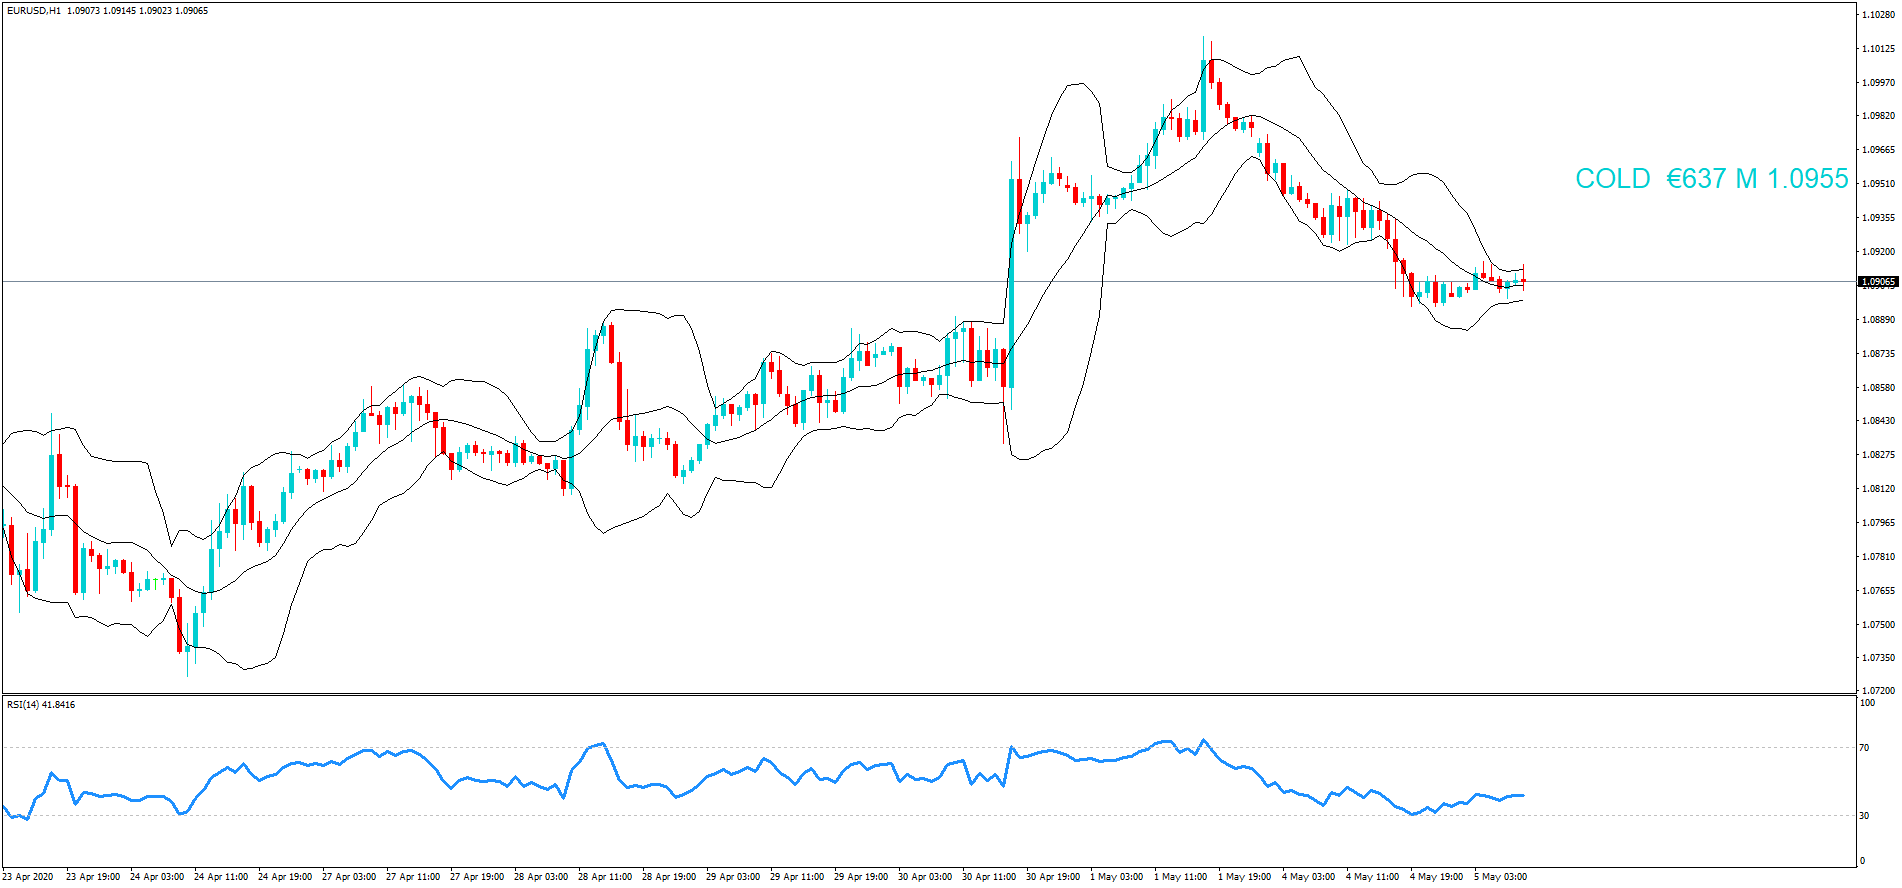
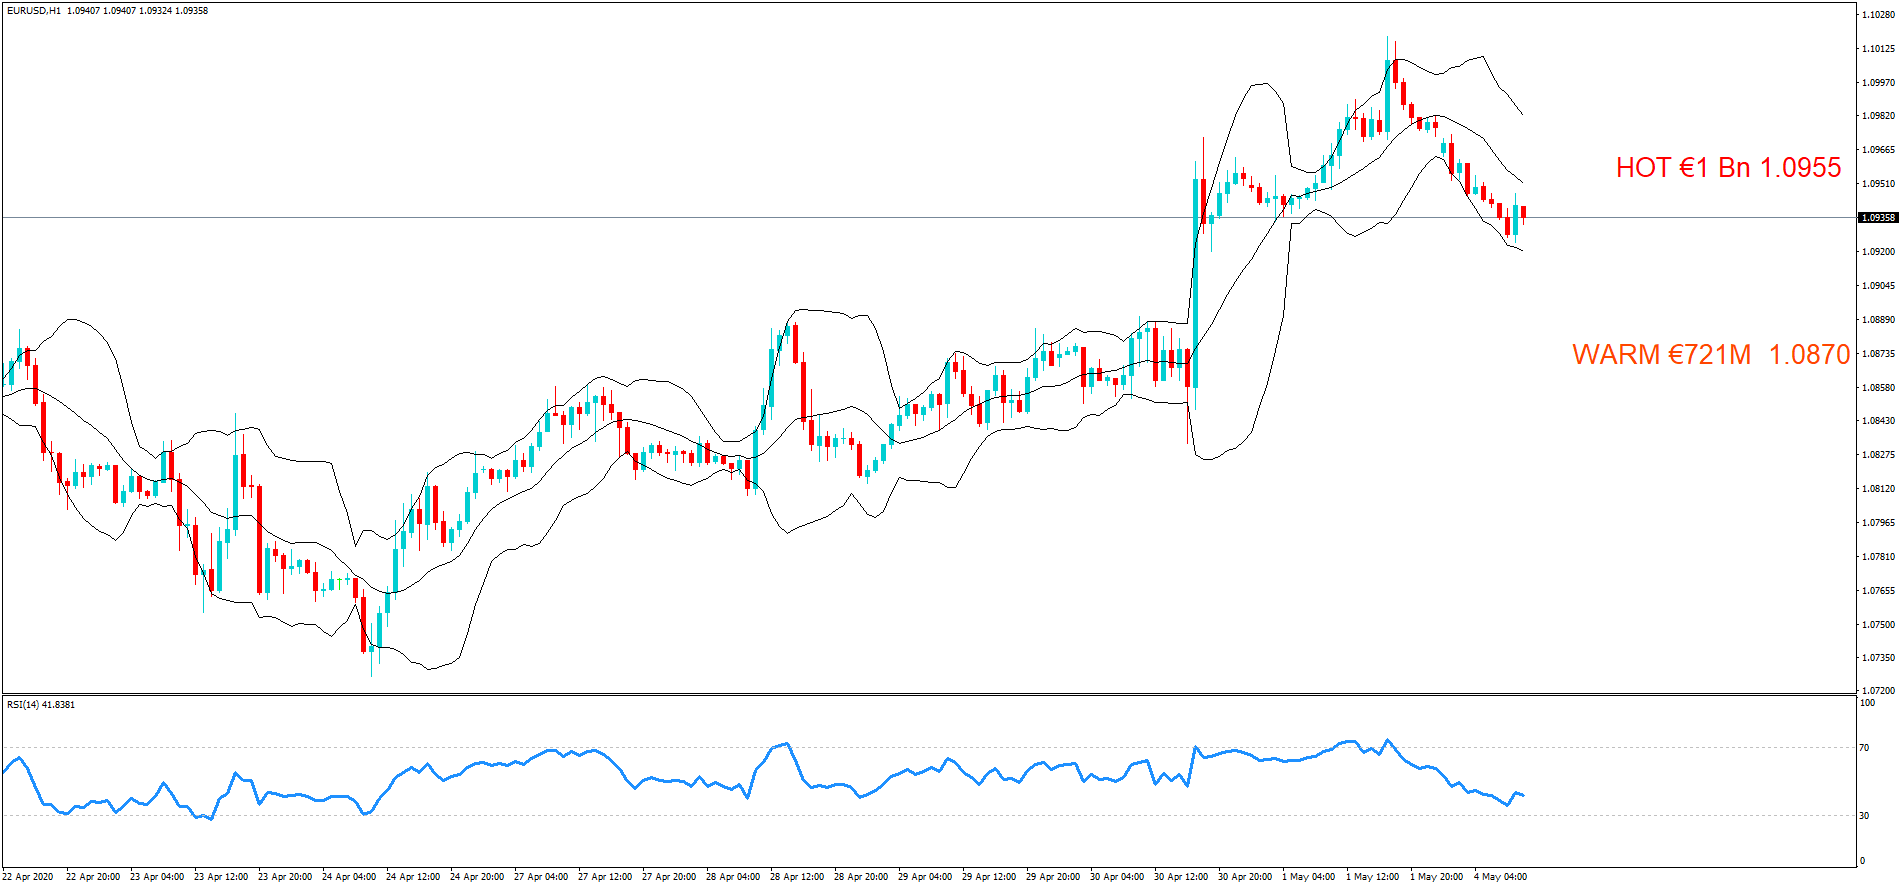
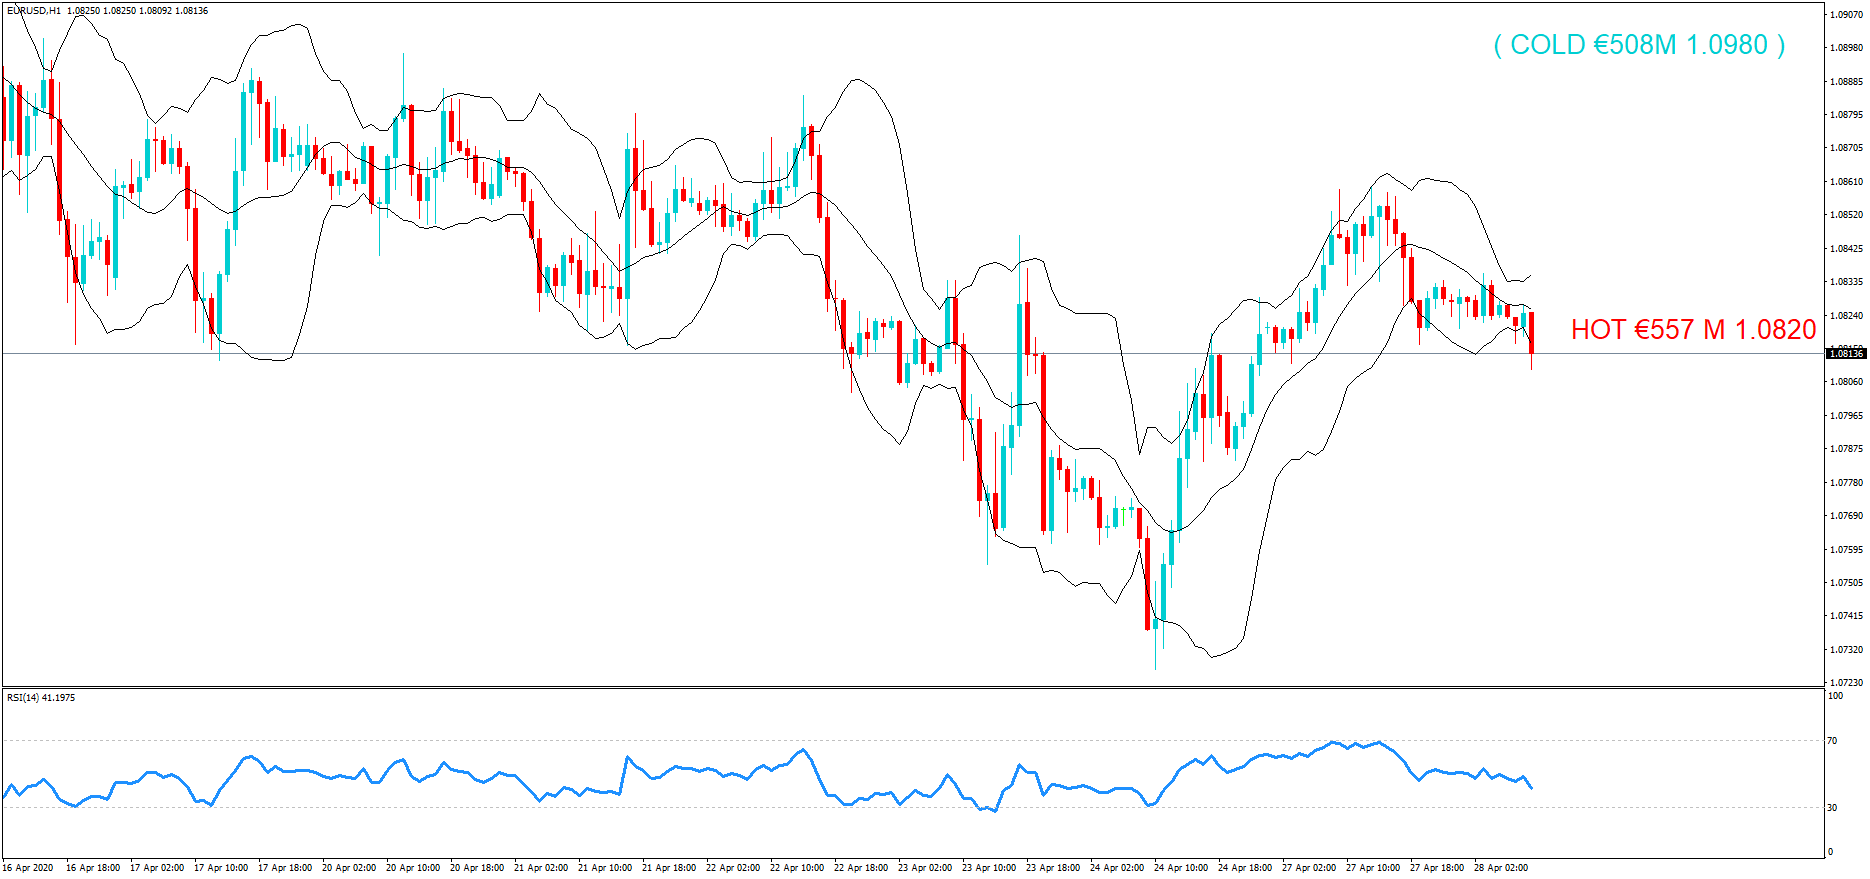
So today, we have Option Expires for the EURUSD, one of which is considered Hot at 1.0865 in the amount of €1.1bn. This is very much in the money with price action currently very close to the strike rate.

We also have Warm strikes at 1.0815 for €531m and 1.0865 for €1.1bn


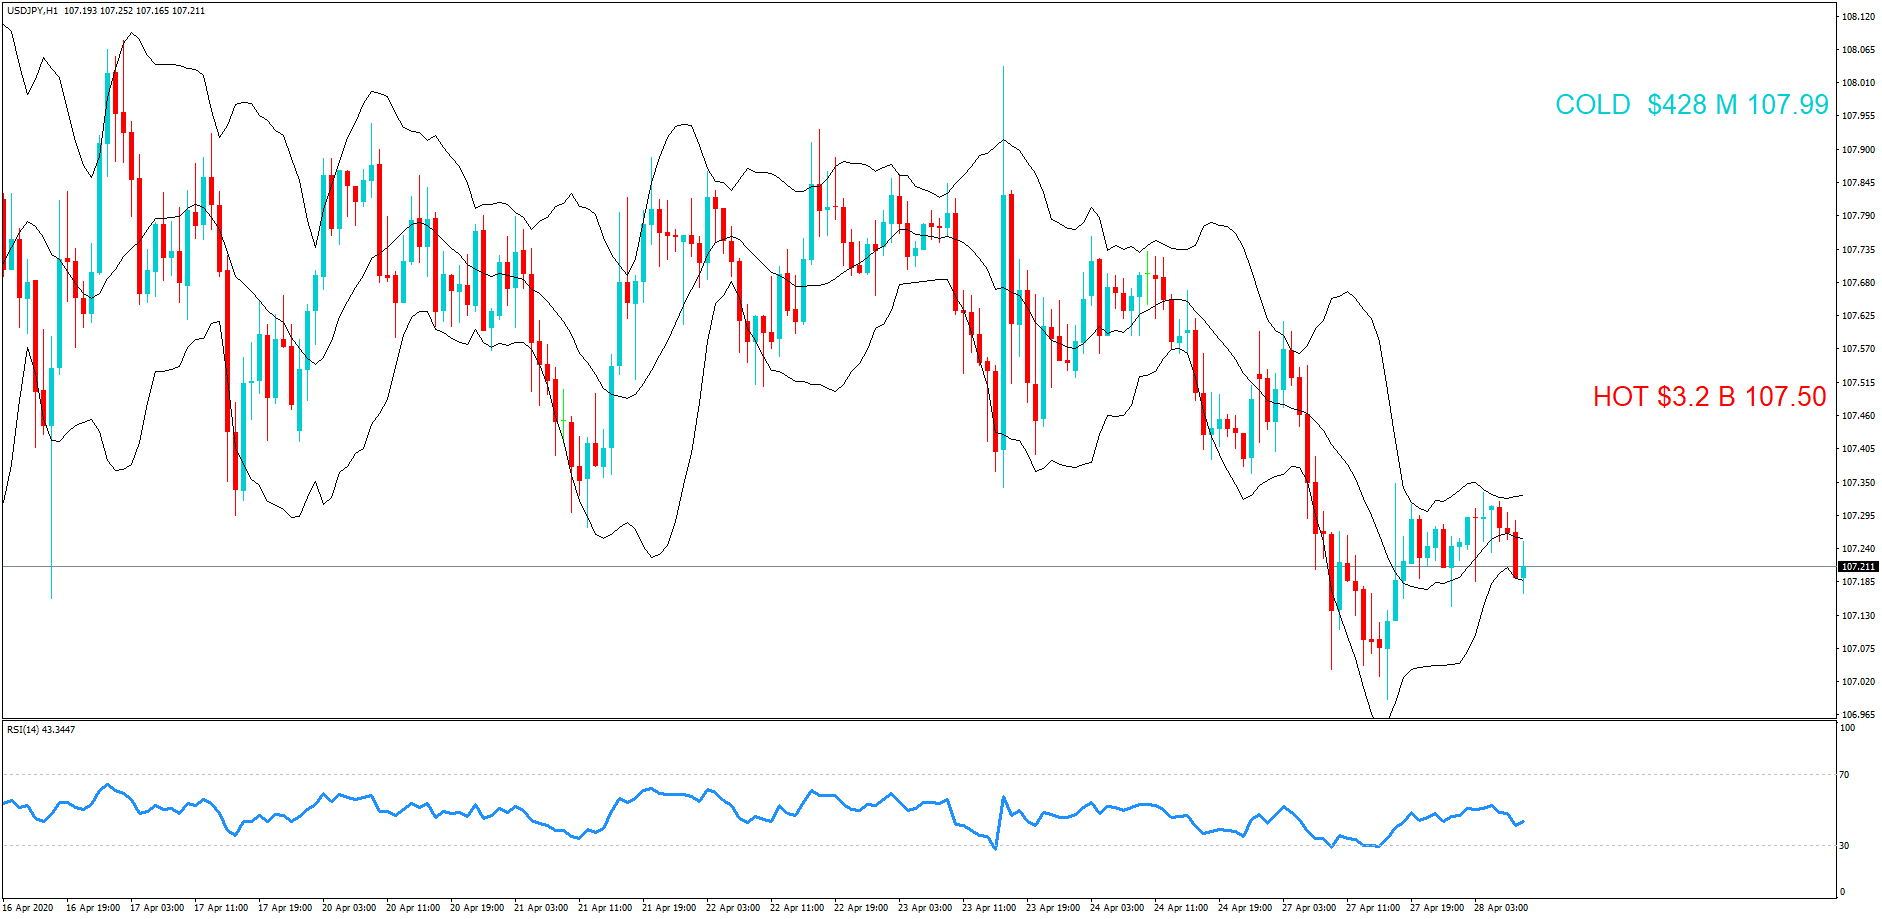
Also, there is also an Option expiring for the USDJPY pair at 107.30 for $555M, however, although this is currently cold, as price action on our one hour chart is gravitating to the downside currently.


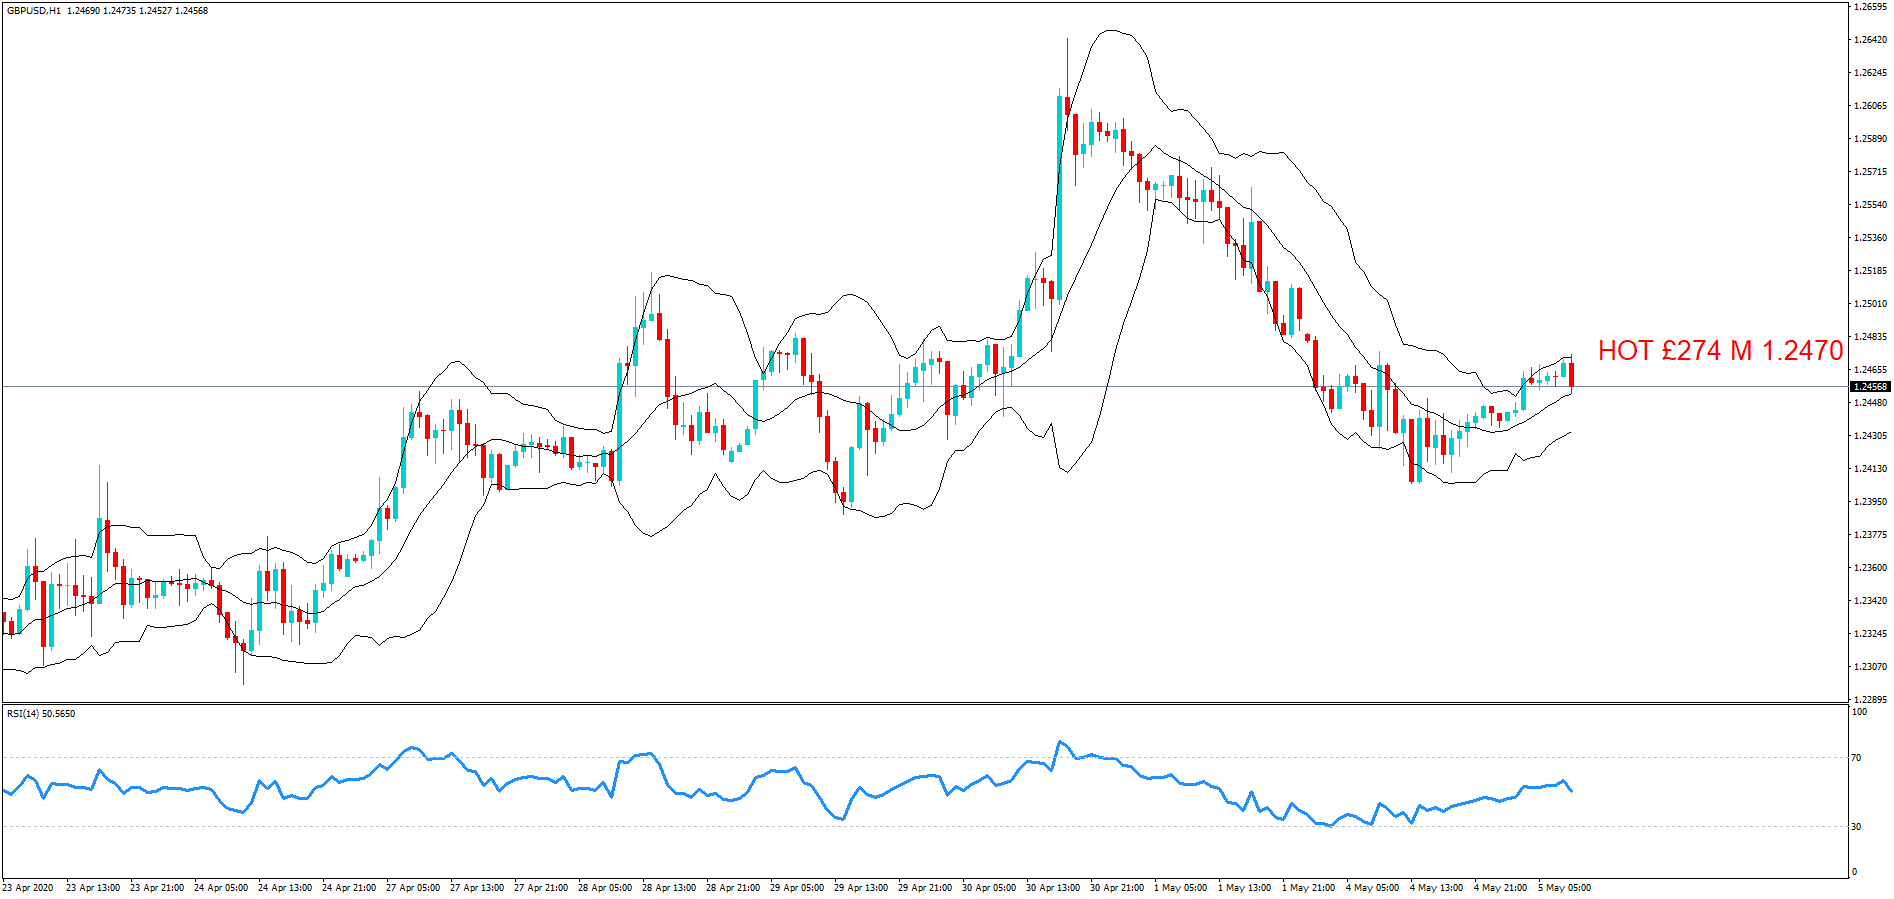
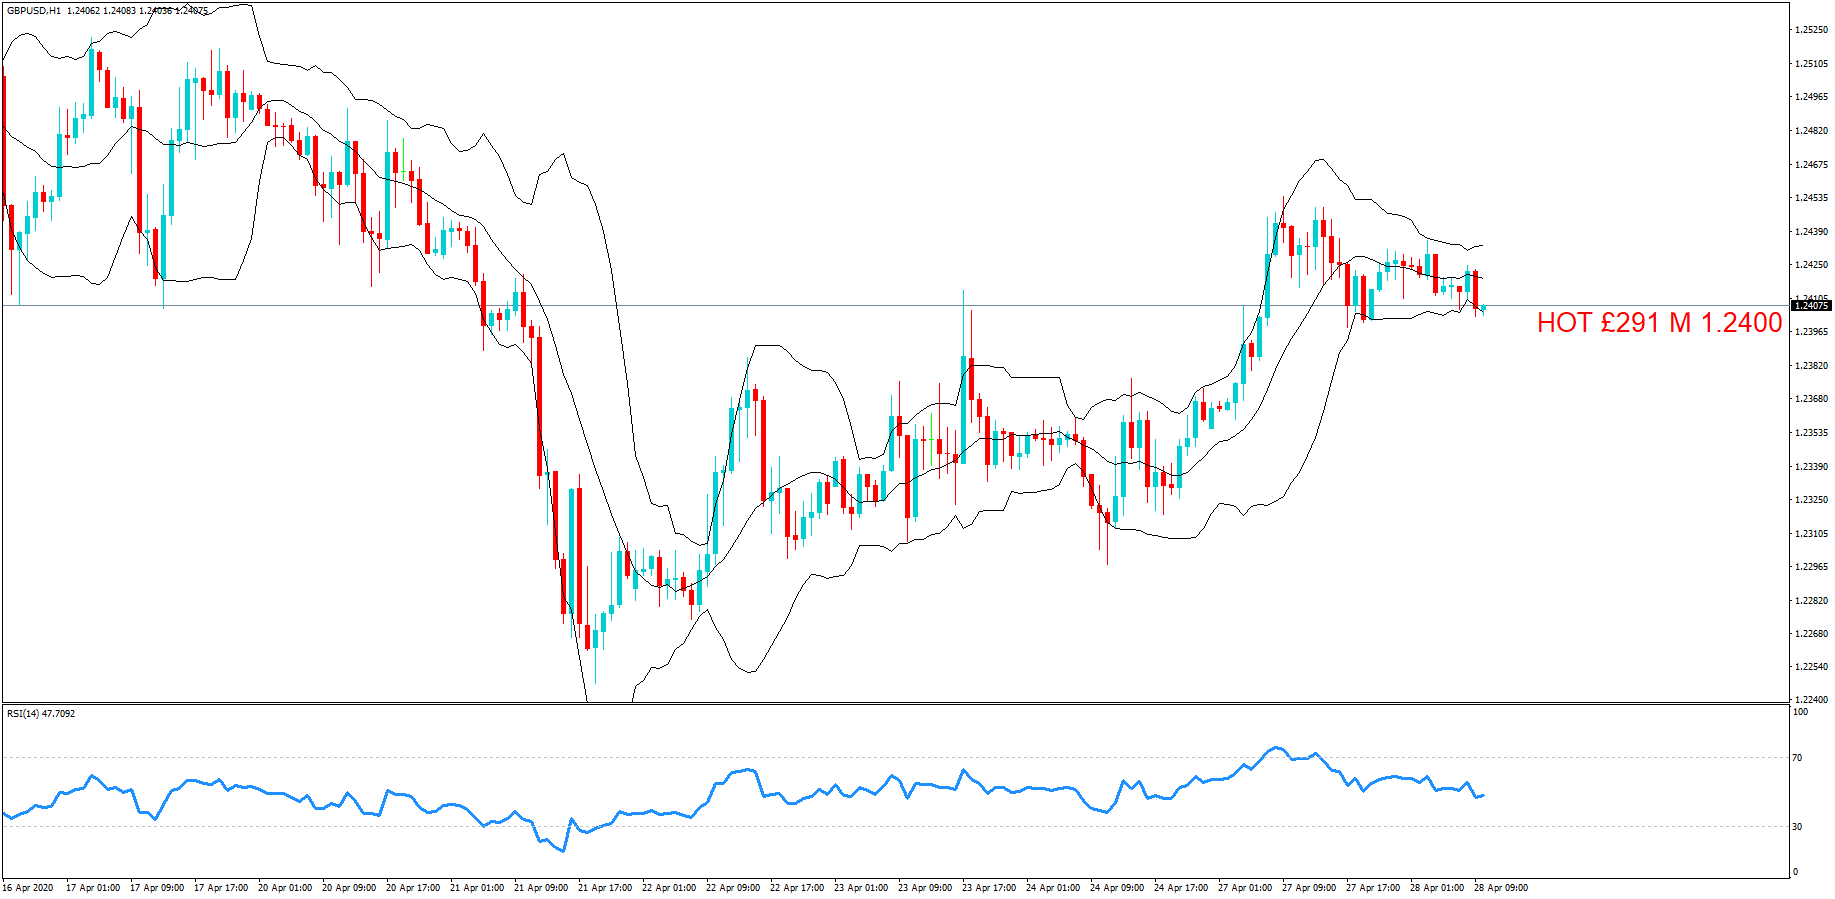
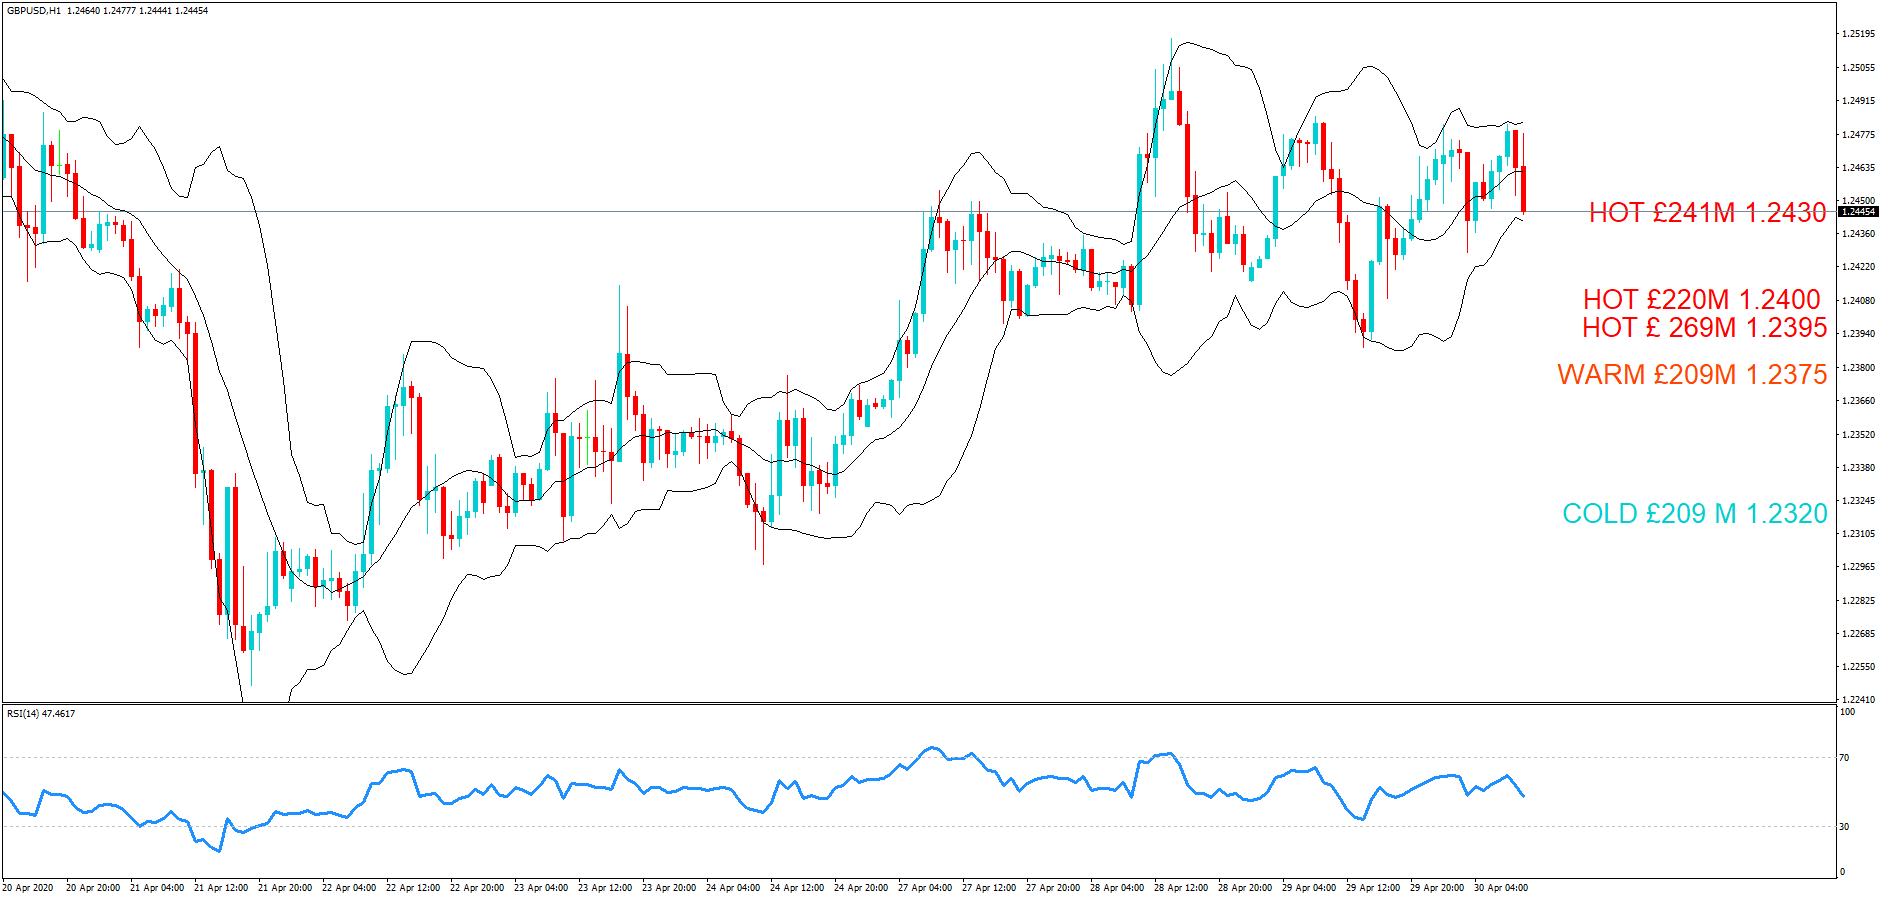
Moving on to the GBPUSD, we have one notable strike, which is in the money and labeled Hot on our 1-hour chart at 1.2415 for £268M. Price has been very volatile for the pair but looks to be running out of steam to the upside at the time of writing.


Finally, we have two hot ones for you in EURGBP at 0.8675 for €526 M and 0.8700 in €600M. Price action is in a downward channel on our one hour chart.
We suggest you take the levels and plot them onto your own trading charts and incorporate the information into your own trading methodology in order to use the information to your advantage.
Remember, the higher the amount, the larger the gravitational pull towards the exchange rate maturity at 10:00 AM Eastern time.
For a detailed explanation of FX options and how they affect price action in the spot forex market, please follow the link to our educational video.

Categories
Forex Signals

U.S. Session Trade Setup – Crude Oil on Bullish Run Amid Upward Channel

The U.S. WTI crude oil futures continue to advance at $24.39 a barrel in the wake of optimization around the market sentiment and weaker U.S. dollar. Besides this, the latest report about the slowdown in inventories at Cushing since mid-March also continues to support crude oil prices.

The reason for the uptick in crude oil prices could also be attributed to the U.S. dollar weakness. The U.S. dollar is losing its bullish traction and struggling to gain any follow-through traction. Whereas, the U.S. dollar index stalled its moderate bounce just above 99.50 to now trade moderately lower at 99.40.

The start of the OPEC+ production cut by 9.7 million barrels a day also boosted the oil prices. Looking forward, the oil traders will keep their eyes on the weekly release of private inventory data from the American Petroleum Institute (API), which is scheduled to release at 20:30 GMT. The industry stockpile for the week ended on May 1 will likely follow the tracks of the previous reduction to 9.978 million barrels into the inventories.


Crude oil has made a strong bullish recovery, as it has violated the resistance level of 21.82 level. Above 21.82, we may see oil prices soaring further higher until 25.02 level. For now, support holds around 21.85, but the bullish bias remains strong as the RSI is also heading north and may also lead oil prices on the upper side.

WTI Crude Oil – Trade Setup

Categories
Forex Brokers

Fibonetix Review

Fibonetix is a broker owned and operated by Zeus Tech & Trading Group Ltd. Although their headquarters are located in Luxemburg, this company is actually registered in Belize, a very popular offshore zone where brokers can set up with minimum regulations. We also found evidence online that Luxemburg’s CSSF had warned people against unregulated brokers, including Zeus Tech & Trading group, back in July 2019.

Fibonetix offers four different account types and also a wide variety of assets available for trading. Keep reading to find out what this broker has to offer.

Account Types

Customers wanting to open up an account with this broker have a choice of four accounts to choose from namely, the Expert, Basic, Advanced, and VIP. The accounts vary in spread types, leverage, type of training offered, and monthly fees. From their Account Types page, it seems like the Expert account is the most popular with their customers. Here is a breakdown of the main characteristics of all available accounts.

Expert Account
Spreads – Floating
Leverage – 1:200
Free Withdrawals per month – 2
Hedging – Yes

Basic Account
Spreads – Fixed
Leverage – 1:100
Free Withdrawals per month – 1
Hedging – Yes

Advanced Account
Spreads – Floating
Leverage – 1:100
Free Withdrawals per month – 2
Hedging – Yes

VIP Account
Spreads – Floating
Leverage – 1:400
Free Withdrawals per month – Unlimited
Hedging – Yes

All accounts can be opened as Islamic (swap-free) accounts if the customer requests it.

Platforms

Unfortunately, this broker does not provide any information regarding the trading platforms that they have available. Upon loading the platform, however, it appears to be their own proprietary platform. There appears to be no MetaTrader integration and no possibility to trade from a mobile device.

Leverage

The leverage offered depends on the account type chosen by the customer. The highest leverage customers can use is 1:400 which is available on the VIP account only. The basic and the Advanced accounts both offer leverage of 1:100 whereas the Expert account has a 1:200 leverage available.

Trade Sizes

The broker does not go into detail about the minimum and the maximum trade sizes available so we cannot comment any further on this for the time being.

Trading Costs

When placing trades with Fibonetix customers should expect to pay swap fees (unless they opt for an Islamic account), the spread which can be either fixed or floating depending on the account type and we also found mention of another fee customer’s might encounter when using this broker. This fee is for those accounts that are active for less than 30 working days that have less than 25 trades. For these instances, the customers are expected to pay a 150 Euro service fee in case of full liquidation.

Assets

Fibonetix has quite a variety of assets available including CFDs, Stocks, Currencies, Commodities, ETFs, Indices and also some Cryptocurrencies. The broker does not provide the full list of their available assets on their website, so it would be best to contact the broker directly for this information.

Spreads

The Advanced, VIP, and Expert accounts all have floating spreads for all available assets whereas the Basic account has fixed spreads. The broker does not provide solid information regarding the spreads customers may encounter when using their service.

Minimum Deposit

The broker does not mention that they have a strict minimum deposit requirement to open up any of their available account types, however, we cannot confirm this as the broker did not answer our questions regarding this.

Deposit Methods & Costs

If you have an account with Fibonetix and you’re looking to deposit funds into it, you can do so via Visa, Visa Electron, Mastercard, Bitcoin, Bitcoin Cash, and Ethereum. To deposit funds customers must log in to their account, click on the Deposit button and choose their preferred payment method.

When depositing via Credit/debit cards the funds are transferred instantly, or within 1 business day for the first credit/debit card deposit. E-money should be credited within 24 hours and deposits made via Wire Transfer may take up to 10 business days to be completed.

Withdrawal Methods & Costs

To withdraw funds, customers must click on the Withdrawal button found on their account. Customers must be fully verified in order to withdraw and the broker also states that there is a minimum withdrawal amount of Eur 250 for all account types. The broker does not mention if there are any charges for withdrawals, however, on their Accounts page, they do mention that different account types have a number of free withdrawals per month, which makes us think that there are some fees that are applied to each withdrawal.

Withdrawal Processing & Wait Time

Withdrawal requests are processed within 2-3 business days and customers should expect to receive their money within 24 hours for E-money transfers, up to 5 business days for Credit/Debit card withdrawals, and up to 10 business days for Wire transfers.

Bonuses & Promotions

On their Bonus Policy page, the broker states that they offer a number of interesting rewards and bonus features to its regular and new customers. These are available once customers become part of the company’s promotion program. Unfortunately, we could not find any more information regarding this promotion program on the website.

Education & Trading Tools

When it comes to educational content, Fibonetix only offers a trader’s glossary of all the terms and phrases that are commonly used within the trading industry.

Customer Service

Customers wanting to get in touch with this broker can do so via email or telephone, unfortunately, they do not offer a live chat option.

Here is their contact information:

Address – 24 Boulevard d’Avranches, 1160 Luxembourg
Telephone – Luxemburg – +352 20 20 42 90
Germany – +49 32 221095494
United Kingdom – +44 3318 7100
Email – [email protected]

Demo Account

Fibonetix does not offer a Demo account for those wanting to test out their trading conditions.

Countries Accepted

Although the broker does not mention any countries that are specifically restricted from using their services, in their terms and conditions they do inform potential customers that access to their website and their financial contracts may be restricted in some jurisdictions.

Conclusion

Fibonetix is a broker located in Luxemburg that is registered in Belize. They have a choice of 4 account types to choose from and it seems like they offer quite a nice variety of assets available. Unfortunately, there is a lot of important information that is not found on their website such as; list of assets, trade sizes, trading platform, and spreads available. Apart from this, the broker does not offer a Demo account, which means a customer can only test out their conditions by investing real money into their account. We did reach out to the broker via email, however, we were not given any answers, so their customer service is not very efficient.

If you are interested in what this broker has to offer head on to their website to discover more.

Categories
Forex Fibonacci

Fibonacci Levels Help Traders Make Better Trading Decision

In today’s lesson, we are going to demonstrate a chart where the price makes a strong bearish move from a Fibonacci level. It has two messages, which we will find out soon. Let us get started with the chart’s price action.

The chart shows that the price makes a strong bearish move. The last candle comes out as a long bearish candle, which states that the sellers dominate over the buyers. Traders may want to wait for the price to make a bullish correction to go short in the pair with more aggression.

The chart produces a bullish inside bar. The sellers are to keep their eyes on the pair to get a bearish reversal candle to go short. It seems that the pair may produce a strong bearish reversal candle (the signal candle) soon.

The chart produces a bearish inside bar, which is not the sellers’ favorite to go short. The price makes a little bearish move and heads towards the North again. Look at the last candle in the chart. It comes out as a bearish engulfing candle, which is one of the strongest bearish reversal candles.

As expected, the bearish engulfing candle drives the price towards the South. The sellers on the minor chart are going short. Thus, the price is about to make a breakout at the last swing low on the chart as well.

The price makes a breakout at the last swing low and heads towards the South further. Then, it produces two bullish candles in between but continues its bearish journey again. The price may have found its support since it produces four consecutive bullish candles. The price may continue its bearish journey, or it may make a bullish reversal. The bull looks good here. Let us draw Fibonacci levels and see whether it gives us a clue about the trend continuation or a reversal.

The chart produces a bullish inside bar right at 138.2 level. Please note that the price makes its bearish move from 78.6 level. The level of 78.6 has a strong relation with 138.2. If the price trends from 78.6, it often makes a reversal at 138.2. This is what happens here.

To sum up, if we learn the art of using Fibonacci levels and understand how a level is related to others, it becomes easy for us to take trading decisions such as entry, exit, and taking a partial profit. In the end, it makes us prolific traders.


Categories
Forex Options

FX option expiries for May 5th New York cut

Thank you for visiting the Forex.Academy FX Options Expiries Section. Each day, where available, we will bring you notable maturities in FX Options of amounts of $100 million-plus, and where these large commutative maturities at specified currency exchange rates often have a magnetic effect on price action, especially in the hours leading to their maturities, which happens daily at 10.00 AM Eastern time. Each option expiry should be considered ‘in-play’ if labelled as Hot, Warm or ‘out of play’ if labelled Cold with regard to the likelihood of price action meeting the strike price at maturity.

…………………………………………………………………………………………………………………..

FX option expiries for May 5 NY cut

FX option expiries for May 5 NY cut at 10:00 Eastern Time, via DTCC, can be found below.

 EUR/USD: EUR amounts

  • 1.0955 637m 


– GBP/USD: GBP amounts   

  • 1.2470 274m


………………………………………………………………………………………………………..

If you want to learn how forex option expiries affect price action in the spot FX market see our educational article by clicking here: https://bit.ly/2VR2Nji

DISCLAIMER: Please note that this information is for educational purposes. Also, heat levels may change throughout the day in line with the exchange rate fluctuations of the associated pairs.

Categories
Forex Services Reviews-2

EA Prototype Reverse Review

The Prototype Reverse Expert Advisor was made available in September 2019 by the creator Svyatoslav Kucher. Kucker has an extensive list of available products ranging from indicators to expert advisors. The EA we will be looking at today has not had any updates made since 2019 and unfortunately, there are no reviews about it at the moment. Read through this review to get a better idea of what this Expert Advisor does and how it can help you increase your profits when trading.

Overview

The Prototype Reverse EA uses order averaging to avoid losses when prices move in the opposite direction from the initial entry. The EA basis its entrance according to what happened in the first order, ie, if the first order is closed at a profit, the next order is opened in the same direction in the hope of achieving the same results and vice versa; if the first order is closed at a loss, the next order is opened in the opposite direction.

There are a number of parameters that can be set by the users including; language, the maximum number of open orders at one given moment, the take profit value in points, the percentage of margin, the width and style of the lines and also the ability to delete the order history from the price chart amongst many others. This EA is extremely customizable and you can find the full list parameters on the website.

Service Cost

The cost of the Prototype Reverse EA is $35 for purchase or $15 monthly. Users can also choose to test out the free demo which is available before investing in this product.

Conclusion

Unfortunately, there are no user reviews or comments regarding this product at the moment, and from 46 people that downloaded the free demo, only 5 of them decided to purchase it. If you think this EA can help make your trading more profitable, we suggest downloading the free version to try it out first hand and determine whether it can be beneficial for you.

This Forex Indicator is currently available in the MQL5 marketplace: https://www.mql5.com/en/market/product/42060

Categories
Forex Services Reviews-2

DSZ Mini Charts Indicator Review

The DSZ Mini Charts Indicator was created by Dariusz Szewczyk back in June 2016. Szewczyk has two other similar indicators available for purchasing however they do not seem to be very popular amongst traders. This indicator can be used on the Metatrader 4 platform and it has so far only had one update meaning that users can currently purchase version 1.2 of this indicator. Read through this review to determine whether this could be useful for you and your unique trading style.

Overview

This indicator’s main function is to display a bar chart for specific symbols at any given time period. It is mainly used to implement a top-down investment approach which is an investment analysis technique that first looks at the macro picture of the economy and then looks at the smaller factors in even finer detail.

The DSZ Mini Charts available have a number of interesting features including unique statistical bands, the elapsed time count, specific information about orders, the option of rounding numbers, saving and loading graphic objects, up to nine charts per row and pivot support and resistance levels.

Users can also customize the charts in a number of ways including the style and colors of the charts, color schemes for the volume and the price, and an adjustable symbol and timeframe for every chart.

Costs

This indicator can be purchased for $39 or it can be rented out for $10 for one month, $19 for three months, or $29 for six months. There is also a free demo available for those wanting to test it out before purchasing or renting it.

Conclusion

Although the Demo version of this indicator has been downloaded more than 100 times, only 10 traders have decided to purchase it. Unfortunately, there are no ratings or reviews available for us to share with you so for those of you who would like to find out more about what this indicator can offer, we suggest that you download the free demo and check whether these mini charts can be beneficial to you and your trading.

This Forex Indicator is currently available in the MQL5 marketplace: https://www.mql5.com/en/market/product/16299

Categories
Forex Fibonacci

Fibonacci Trading and Deeper Correction

In today’s lesson, we are going to demonstrate an example where the chart produces a reversal candle at a Fibonacci level, but the price does not head towards the trend’s direction. It then makes a deeper correction. It finds its new resistance and heads towards the trend’s direction with good momentum. Let us now have a look.

The price heads towards the South with excellent bearish momentum. It produces six consecutive bearish candles, four of them having solid long bearish bodies. The sellers are to wait for the price to make a bullish correction and to produce a bearish reversal candle at the value area. Let us proceed to the next chart.


The price makes a bullish correction and produces a bearish engulfing candle. However, the price does not make a bearish breakout. It rather goes towards the North again. The last two candles come out as bullish candles. The price goes towards the North further for a deeper correction.

The chart produces a bearish Marubozu candle. The combination of the last two candles is called Track Rail. The Track Rail is one of the strongest reversal signal candles. The sellers may keep their eyes on this chart with attention. The Fibonacci traders may draw their Fibonacci levels to find out which level it is trending from.

Let us proceed to the next chart to find out what the price does.

The chart produces another bearish candle and makes a breakout at the wave’s lowest low. The Sellers then take control of the pair and drive the price towards the South at an extreme pace. The last candle on this chart comes out as an inverted hammer. It suggests that the price may keep heading towards the South. However, do not forget that the chart produces a bullish Pin Bar as well, and the last candle closes within the level of support where the Pin Bar bounces off.

Anyway, let’s draw the Fibonacci level on the chart and see how the price reacts to some levels.

The chart gives us a clearer picture. At first, the price produces the bearish reversal candle at 78.6. The asset does not make a breakout. Instead, it goes towards the North and finds its resistance at 61.8. The level produces a bearish reversal candle followed by a breakout at the wave’s lowest low. The price then hits 161.8 level with ease.

If the price makes a breakout by trending from 78.6, it may not hit 161.8 level. The price usually reverses at 138.2 if it trends from 78.6. Stay tuned. We are going to study with some live examples on this soon.


Categories
Forex Course

110 – The Key Rules in the Elliot Wave Theory

Introduction

The Elliot Wave theory is a subjective topic. The key to trading Elliot waves is to find and comprehend the waves correctly. By understanding the wave theory correctly, we will be able to figure out which side of the market we have to be on. For doing so, there are a few rules we can lay on the Elliot waves while confirming the legitimacy of a wave. They are based on waves in the 5-3 wave pattern. And most importantly, these rules must never be broken.

The Three Golden Rules of Elliot Wave Theory

Rule 1: Wave 2 must be above wave 1

Wave 1 is the impulse wave, which is towards the trend, while wave 2 is a smaller corrective wave against the trend. So, to hold the definition of an uptrend, the second wave must never go below the first wave. In other terms, there should be a higher low in the price.

Rule 2: Wave 3 must never be the shortest impulse wave

Wave 3 is the second push towards the overall trend. This wave represents the move where all big players buy into the market. Hence, this wave is the strongest and the longest. According to the rule, the wave 3 can be shorter than either wave 1 or wave 5, but not BOTH.

Rule 3: The Wave 4 must stay above the wave 1

Wave 4 is the second corrective wave in the 5-wave pattern. And this wave should never cross below the area of wave 1. In technical terms, the low of Wave 4 must be higher than the high of Wave 1.

This sums up the rules that need to be mandatorily followed while trading the Elliot Waves. So, even if one of the rules is not satisfied, then the Elliot wave pattern must be counted from the beginning, and the current must be discarded.

Guidelines for trading Elliot Waves

Now that you are clear about the rules, here are some guidelines for trading the Elliot waves. Note that these are guidelines and not rules. Hence, they are not a necessary condition to trade Elliot waves.

🌊 When Wave 5 is the longer impulse wave, then wave 5 can approximately be as lengthy wave 1.

🌊 It is useful in targeting the end of Wave 5. Traders also determine the length of the Wave 1 and add it with the low of Wave 4 and use it as a possible target.

🌊 Wave 2 and Wave 4 will usually be different forms. For instance, if Wave 2 was a sharp correction, then Wave 4 will be a flat correction and vice versa. With this, chartists can determine the time of correction of Wave 4

🌊 After a strong Wave 5 impulse wave advance, the 3-wave ABC correction pattern could come down only until the low of Wave 4.

These are the guidelines traders must understand and interpret in their own meaningful way. With this, we have come to the stage where we can apply the concepts and trade the Forex market. So, stay tuned for the next lesson.

[wp_quiz id=”71849″]
Categories
Forex Assets

Trading The ‘GBP/BRL’ Exotic Pair & Comprehending The Costs Involved

Introduction

GBP/BRL is the abbreviation for the Pound sterling against the Brazilian real. As we know, GBP is the official currency of the United Kingdom, Jersey, Guernsey, and others, whereas BRL is the official currency of Brazil. In Forex trading, currencies are always traded in pairs. The primary currency in the pair is known as the base currency, while the second one is the quote currency.

Understanding GBP/BRL

To find the relative value of one currency, we compare that with another currency in the Forex market. The market value of GBP/BRL helps us to understand the strength of BRL against the GBP. If the exchange rate of the pair GBP/BRL is 6.5415. It means that to buy 1 GBP, we need 6.5415 BRL.

Spread

Forex brokers have two prices for currency pairs. They are the bid and ask prices. The difference between this bid and the ask prices is known as the spread, and this is how Forex brokers profit for the services they provide. Some brokers include the costs in the buy and sell prices of the currency pairs instead of charging spreads. Below are the ECN and STP spread values for the pair GBP/BRL.

ECN: 41 pips | STP: 44 pips

Fees

A Fee is a commission we pay to the broker for executing our trades. It differs for different types of brokers. For instance, there is no fee charged by the STP brokers, but for ECN accounts, a few pips are charged a fee.

Slippage

It is the difference between the expected price and the price at which the trade gets executed. Slippage can occur at any time, but it mostly happens when the market is highly volatile.

Trading Range in GBP/BRL

Being aware of the volatility of a particular currency pair before placing the trade is very important for every aspiring trader. The trading range here is useful to measure the volatility of the GBP/BRL pair. The amount of money we will win or lose in a given amount of time can be assessed using the below trading range table.

Procedure to assess Pip Ranges

  1. Add the Average True Range indicator on your price chart
  2. Then, set the period to one
  3. Add a 200-period Simple Moving Average to the ATR indicator
  4. Shrink the chart to assess a significant period
  5. Select the desired timeframe
  6. Measure the floor level and set this value as the minimum
  7. Measure the level of the 200-period SMA and set this as the average
  8. Measure the peak levels and set this as Max.

GBP/BRL Cost as a Percent of the Trading Range

The cost of trade depends on the broker type and varies based on market volatility. The total cost of trade involves spreads and slippage apart from the trading fee.

ECN Model Account

Spread = 41 | Slippage = 3 |Trading fee = 5

Total cost = Slippage + Spread + Trading Fee = 3 + 41 + 5 = 49

STP Model Account

Spread = 44| Slippage = 3 | Trading fee = 0

Total cost = Slippage + Spread + Trading Fee = 3 + 44 + 0 = 47

Trading the GBP/BRL

There are a few currencies that are hardly traded in the foreign exchange market. These currencies are called exotic-cross currency pairs, and the GBP/BRL is one such exotic pair.

These pairs have less market depth, less volume, and are also illiquid. GBP/BRL is a trending market. Further, the average pip movement on the 1H timeframe is 198 pips, which is considered to be volatile. Higher the volatility, lower is the cost on a trade. However, this should not be considered an advantage as it is risky to trade in highly volatile markets.

Let’s take, for example, in the 4H time frame. The Maximum pip range value is 816, and the minimum is 102. When the comparison of the fees for both the pip movements is made, we find that for 102pip movement, fess is 46.08%. But for the 816pip movement, fess is only 5.76%.

So, we can confirm that the prices are higher for low volatile markets and low for highly volatile markets. We recommend trading when the volatility is around the average values. Experienced traders who strictly follow money management can trade in a highly volatile market.

Categories
Forex Market Analysis

Gold Descending Triangle Pattern Weights – Quick Sell Setup! 

The safe-haven-metal prices were flashing green and were recovering gradually from the intraday low above $1,700 level, mainly due to the risk-off market sentiment in the wake of intensifying trade tussle between the United States and China. On the other hand, the positive news from Gilead about the vaccine of virus seems to have eased the coronavirus fears in the market, which turned out to be one of the key factors that kept a lid on any additional gains in the gold prices. 

At the press time, the yellow metal prices are currently trading at 1,702.27 and are consolidating in the range between 1,692.34 and 1,702.27. However, when gold slipped to $1,692.30 during the early-Asian session, it was possibly due to US dollar strength.

The good news from Gilead about coronavirus vaccine successful trials which seem to reduce the coronavirus (COVID-19) fears at the start of the week in the market. The company making the vaccine reported that it has been exporting the anti-viral drug to the United States and making it available to US patients with the help of the US government.


Daily Support and Resistance


S1 1621.49

S2 1656.9

S3 1678.78

Pivot Point 1692.32

R1 1714.19

R2 1727.73

R3 1763.15

Gold prices have closed drawing a hanging man pattern, which is keeping the precious metal gold supported 1,692 level. Closing of candles below a downward trendline may keep the gold prices bearish below 1,711 level. On the lower side, gold may find support around 1,692 and 1,681 level. Conversely, a bullish crossover of 1,717 resistance can drive buying until 1,732/36 level. Good luck! 

Categories
Forex Signals

EUR/JPY Triple Top Pattern Hold’s – Quick Update on Trading Signal! 

The EUR/JPY is trading bearish at 116.850, falling below the triple top resistance level of 117.500. The broad-based selling pressure of the Euro made it difficult for the EUR/JPY pair to come out of the negative territory. The 10 Year US Treasury bond yield added in the downfall of USD/JPY when it fell more than 2% on Friday.

On the other hand, the strategy to blame China for the outbreak of COVID-19 started weeks ago, and on Thursday, when Trump officially accused China of this and said that he would punish China for mishandling the outbreak by imposing tariffs, many other countries showed their support to him as well.


Technically, the EUR/JPY is holding above 116.580, having closed a Doji candle above 50 EMA support level of 116.600. Below this, selling bias remains strong, and it can lead the EUR/JPY pair until 115.450. On the 4 hour timeframe, EUR/JPY seems to violate the descending triangle support level of 116.600, and this can lead the pair towards an initial target level of 115.450. The MACD is holding above 0, suggesting bullish bias among traders. While the 50 periods, EMA continues to support the selling trend in the pair. 

Entry Price: Sell at 116.962    

Take Profit 116.462    

Stop Loss 117.462    

Risk/Reward 1.00

Profit & Loss Per Standard Lot = -$467.5‬‬/ +$467.5‬

Profit & Loss Per Micro Lot = -$‭‭46.7/+$46.7

Categories
Forex Market Analysis

Daily F.X. Analysis, May 04 – Series of E.U. Manufacturing PMI In Highlights! 

On the forex front, the ICE U.S. Dollar Index marked a day-low of 98.64 Friday before paring losses to close flat at 99.08. Research firm Markit will publish final readings of April Manufacturing PMI for the Eurozone (33.6 expected), Germany (34.4 expected), France (31.5 expected). The Eurozone Sentix Investor Confidence Index for May will be released (-28.0 expected). The Commerce Department will report March factory orders (-9.4% on month expected) and final readings of durable goods orders (-14.4% on month expected).

Economic Events to Watch Today


EUR/USD – Daily Analysis

The EUR/USD currency pair stopped its three-day winning streak and dropped to 1.0936 while representing 0.33% declines on the day mainly due to the broad-based U.S. dollar strength in the wake of risk-off market sentiment. However, the reason for the risk-off market sentiment could be attributed to the intensifying trade war between the U.S. and China. 

The EUR/USD is trading at 1.0936 and consolidates in the range between the 1.0935 – 1.0975. As we all well aware that the currency pair rose 0.48%, 0.75%, and 0.24% on Wednesday, Thursday, and Friday, respectively, but failed to extend its bullish rally on the first day of trading this week.

The GDP of the Eurozone dropped 3.8% in this quarter from the previous 14.4%. The ECB expects a 5% – 12% contraction in Eurozone’s economy this year. The International Monetary Fund (IMF) has forecasted the same Eurozone’s economic contraction as 5%, which was in line with the ECB’s projection. The ECB Vice President Luis de Guindos said in April that he expected a worse recession to be faced by the European economy than the rest of the world.

Furthermore, the President of the United States, Donald Trump, on Friday, announced to punish China for not holding the virus in its Wuhan city and mishandling the coronavirus outbreak by imposing tariffs. He said that trade relations with China were on his secondary importance now after the coronavirus outbreak. This also helped the EUR/USD pair to move upward.

The EUR was boosted by the hopes and hype of an early reopening of the economy across the globe. The pair EUR/USD was also helped by the developments made in COVID-19 vaccines, which caused the decreased demand for the U.S. dollar as a funding currency. EUR was also supported by the decreasing number of deaths and appearing cases in Germany, Italy, Spain, and France. Overall the EUR/USD pair has recovered from its March corona caused the lowest level of 1.0637 to its multi-week highest of 1.1019 on Friday.

Daily Support and Resistance

  • R3 1.1005
  • R2 1.0993
  • R1 1.0977

Pivot Point 1.0965

  • S1 1.095
  • S2 1.0937
  • S3 1.0922

EUR/USD– Trading Tips

On Monday, the EUR/USD price is holding at 1.0924 area, after placing a high of 1.0948 during the Asian session. On the 4 hour chart, the EUR/USD has formed a candlesticks pattern three black crows around 1.0927 level. Typically such a pattern shows that buyers are exhausted, and sellers may enter into the market soon. On the lower side, the EUR/USD pair has already completed 38.2% Fibonacci retracement at 1.0920, and now it can go for 50% retracement at 1.0900 mark. Both of the leading indicators are supporting the bullish trend, but a slight retracement can be expected. The resistance is likely to be found around 1.0971 and 1.0992. Consider staying bearish below 1.099 level today.  

GBP/USD – Daily Analysis

The GBP/USD failed to stop its Friday’s losses and dropped below 1.2450 level while representing 0.36% losses on the day as the U.S. dollar is benefitting again from the risk-off sentiment in the financial markets. However, the reason behind the risk-off market sentiment is the intensifying trade tussle between the U.S. and China. 

The on-going crisis of the UK Tory government about the mishandling of the virus situation also keeps the British Pound under pressure. The GBP/USD currency pair is currently trading at 1.2448 and consolidates in the range between the 1.2440 – 1.2487. On the other hand, the PMI from the U.S. also dropped to its 11 years lowest level at 41.5 and weakened the U.S. dollar across the board. However, the pair GBP/USD ignored US PMI and continued falling on Friday.

As for the news, Boris Johnson’s announcement for coming up with a plan on how to restart the economy next week did not give much impact to GBP. The biggest risks nowadays to the U.K.’s economy and the British Pound include the Brexit & coronavirus. 

As for Brexit, both parties Britain and the European Union has its differences in the future relationship. Another challenge of Brexit is the timeline for securing a deal because Johnson has insisted that the transition period will not be extended by his government. 

If Johnson will not seek an extension, which can only be applied before June 31, there is a possibility that both sides will not have a deal before the deadline of December. European Union insisted that an agreement of this size needs several years to be hammered. 

Daily Support and Resistance

  • R3 1.2544
  • R2 1.2524
  • R1 1.249

Pivot Point 1.247

  • S1 1.2436
  • S2 1.2416
  • S3 1.2382

GBP/USD– Trading Tip

The GBPUSD pair showed strong bearish movement to trade at 1.2445, testing a double top pattern around 1.2425. The recent Doji pattern on GBP/USD pair is suggesting chances of bullish correction over 1.2425 support level. This may lead the GBP/USD prices towards 1.2515 level. On the lower side, the violation of 1.2420 support can lead the Sterling prices towards the next target level of 1.2316. Overall, the trading bias of GBP/USD remains bullish, considering the 50 EMA as it’s keeping the Cable bullish above 1.2420 today.  

USD/JPY – Daily Analysis

The USD/JPY pair was closed at 106.903 after placing a high of 107.405 and a low of 106.603. Overall the movement of USD/JPY remained bearish throughout the day. The USD/JPY pair during the America Session started to move upward towards the 107 level but failed to hold and preserve the recovery due to weak PMI.

At 4:30 GMT, the Tokyo Core CPI for the year was released, which showed a decline of -0.1% against the expected 0.1%. At 5:30 GMT, the Final Manufacturing PMI from Japan was released by the Bank of Japan for March, which showed that the manufacturing sector in Japan contracted to 41.9.

It was expected to remain the same as the previous month’s 43.7. The decline in manufacturing activity due to coronavirus pandemic resulted in weak Japanese Yen against the U.S. dollar. As for the U.S. data, at 18:45 GMT, the Final Manufacturing PMI form the U.S. was released, which came as 36.1 against the expectations of 36.9, and it weakened the U.S. dollar. At 19:00 GMT, the ISM Manufacturing PMI for the month of April was released, which was dropped to its 11 years lowest level at 41.5 from the previous month’s 49.1.

The drop in U.S. manufacturing activities due to a pandemic, which disturbed the supply chain across the globe, made the US PMI fell to its records low, and this weakened the U.S. dollar across the board on Friday. The weakened U.S. dollar pulled the pair USD/JPY to 106.6 level at the ending day of the week.

At 19:00 GMT, the Construction Spending from the U.S. also released, which came in as 0.9% against the -3.5% and supported the U.S. dollar. The ISM Manufacturing prices were also increased to 35.5 from the forecasted 30.7. The Wards Total Vehicle Sales during April were recorded as 8.6M against the 7.0M forecasted.

Daily Support and Resistance    

  • R3 108.76
  • R2 108.14
  • R1 107.66

Pivot Point 107.03

  • S1 106.55
  • S2 105.92
  • S3 105.44

USD/JPY – Trading Tips

The USD/JPY pair take’s a bearish turn in the wake of mixed sentiment to trade around 106.700. As we can see in the 4-hour chart above, the USD/JPY pair is struggling to cross over the downward trendline, which is extending resistance around 106.950. The 50 EMA is also keeping pressure on the pair around the same level of 107.050. Below this level, we may see a selling trend in the USD/JPY pair until the next target levels of 106.44 and 106. The 50 EMA and MACD are also suggesting selling bias for the USD/JPY pair. Taking a selling trade below 106.950 can be a good idea today.

All the best for today! 

Categories
Forex Options

FX option expiries for May 4 New York cut

Thank you for visiting the Forex.Academy FX Options Expiries Section. Each day, where available, we will bring you notable maturities in FX Options of amounts of $100 million-plus, and where these large commutative maturities at specified currency exchange rates often have a magnetic effect on price action, especially in the hours leading to their maturities, which happens daily at 10.00 AM Eastern time. Each option expiry should be considered ‘in-play’ if labelled as Hot, Warm or ‘out of play’ if labelled Cold with regard to the likelihood of price action meeting the strike price at maturity.

…………………………………………………………………………………………………………………..

FX option expiries for May 4 NY cut

FX option expiries for May 4 NY cut at 10:00 Eastern Time, via DTCC, can be found below.

– EUR/USD: EUR amounts

  • 1.0870 for 727m
  • 1.0955 for 1bn

………………………………………………………………………………………………………………

If you want to learn how forex option expiries affect price action in the spot FX market see our educational article by clicking here: https://bit.ly/2VR2Nji

DISCLAIMER: Please note that this information is for educational purposes. Also, heat levels may change throughout the day in line with the exchange rate fluctuations of the associated pairs.

Categories
Forex Elliott Wave

How to Count Using the Elliott Wave Principle Part 1 of 3 – Advanced Level

Introduction

Wave counting is a systematic process by which the wave analyst identifies in a logical and standardized order the movement developed by the action of the market.

R.N. Elliott, in his work “The Wave Principle,” comments out that counting is not the most relevant part of the study of wave theory; however, this process empathizes that it is useful when studying the market progress across time.

Elliott, the Wave Principle, and Financial Markets

The Wave Principle, defined by R.N. Elliott, is part of the law of nature, which, when known, can make predictions without knowing the underlying causes that originated this phenomenon.

In this context, financial markets are the result of a socio-economic interaction, which reflects the psychological feeling of the participants interacting in the negotiation process.

Despite the interests of each market participant, the outcome of the trading process is reflected in a price chart.

Elliott, in his work “The Wave Principle,” detected that price tends to make repeated movements over time. 

On the one hand, there are movements that, over time, create trends. Elliott defined these movements as impulsive and are characterized by being composed of five segments.

On the other hand, Elliott described movements that oppose to impulsive moves as corrections and are composed of three internal segments.

Once the price action completes an impulsive sequence and a corrective movement, the market completes a cycle and starts a new one of similar dimension or degree

The following figure shows the complete structure of a cycle.

What We Have Studied So Far

Until now, our study of wave analysis has included the following aspects:

  • Identification of directional and non-directional movement.
  • Impulsive and corrective structure.
  • Types of corrective waves.
  • Extensions.
  • Canalization.
  • The alternation principle.
  • Validation of impulsive and corrective waves.
  • Complex corrective structures.
  • Identification and wave degrees.

The process of analyzing and identifying waves will be an integration of all these concepts, which will allow the wave analyst to make a high probability forecast for the next market movement.

The Degrees Importance

R.N. Elliott defined a set of degrees that do not obey a specific timeframe, for example, hourly chart, or 2-day temporality. But allow the wave analyst to evaluate a structural sequence that maintains a proportionality in terms of price and similar time.

Also, the use of the degrees allows us to identify, and in turn, to predict what will be the next movement that should act for the price in a given time horizon.

The following table shows the different degrees described by Elliott and the contributions incorporated by Prechter & Frost in his work “Elliott Wave Principle.”

In general, our analyses will start from the Subminuette degree.

Conclusions

In this first section, we have seen the basis of the Wave Principle developed by R.N. Elliott. Likewise, we review the structure that makes up a complete cycle and concludes with the description of the different degrees that Elliott defined to maintain a systematic order in the process of analysis.

In the next educational article, we will review the different regression rules that will allow us to systematize the counting process in the first wave count.

Suggested Readings

  • Neely, G.; Mastering Elliott Wave: Presenting the Neely Method; Windsor Books; 2nd Edition (1990).
  • Prechter, R.; The Major Works of R. N. Elliott; New Classics Library; 2nd Edition (1990).
  • Prechter, R., Frost.A.J.; Elliott Wave Principle: Key to Market Behavior; New Classic Library; 10th Edition (2005).
Categories
Forex Fibonacci

Fibonacci Trading: How Fibonacci Levels Can be Used in Trading?

Fibonacci levels and price action around those levels give traders clue what they should do with their potential trade setup. The 61.8% level is the most significant level, which is paid attention by the traders to make a trading decision. The price usually goes towards the level of 161.8% when it trends from 61.8%. Since it creates enough space for the price to travel, different traders trade and make use of the wave-length in differently.  We will learn some other strategies that are integrated with Fibonacci levels. Meanwhile, let us demonstrate an example of a chart where the price reacts at 61.8% and trends towards 161.8% afterwards.

The chart shows that upon producing a double bottom, the price heads towards the North and makes a new higher high. The buyers are to wait for the price to make a bearish correction now.

The price heads towards the South upon producing a bearish inside bar. The last candle comes out as a bearish engulfing candle closing within a flipped support. Let us wait and see whether the level produces a bullish reversal candle.

The price produces three bullish candles at the flipped support. The last candle looks to be the strongest one. The price may head towards the North and makes a breakout at the highest high of the wave.

As expected, the price heads towards the North and makes a breakout at the highest high of the wave. The price continues its journey towards the North further. The last candle on the chart comes out as a bullish candle having a long upper shadow. Do you notice anything interesting here? Look at the next chart.

The price after making a bullish move, it starts having a bearish correction. The price consolidates around the 61.8% level. It produces a hammer and heads towards the North. It makes a breakout at the last highest high and heads towards the North with good bullish momentum. The price hits 161.8% as it usually does when it trends from 61.8% level.

Some traders go long in this chart before the price makes the bullish breakout. As long as 61.8% level produces a strong reversal candle, they trigger their entry. It provides an excellent risk-reward but less winning percentage. On the other hand, some traders trade once the price makes a breakout. This offers not that great a risk-reward but an excellent winning percentage.

Categories
Forex Videos

Forex Option Expiries Over $100,000,000 – The 10AM New York Cut part 2


Forex Option Expiries Over $100,000,000 – The 10 am New York Cut part 2

Hello everybody, and thank you for joining us for the daily FX expiries briefing video for the 10 am New York cut today.

If it is your first time with us, the FX currency options market runs in tandem with the spot FX market, but where traders typically place Call and Put trades on the future value of a currency exchange rate and these futures contracts typically run from 1 day to weeks, or months.
Each day we bring you details of the notable FX option expiries where they have an accumulative value of a minimum of $100M + and where quite often these institutional size expiries can act as a magnet for price action in the Spot FX arena leading up to the 10 am cut.

We will also plot the levels on to the relevant charts at the various exchange rates where there are due to expire, and also identify the levels which are in play, and where we believe there is a greater chance of the expiry maturing based on technical analysis at the time of writing, we will label them as hot, warm or cold.


So today we have Option Expires for the EURUSD Pair We have one notable expiry which is in play at 1.0820 for €557M and a Cold expiry which is out of play for €508M at 1.0980

Also, there are also Options expiring for USDJPY pair with a Hot expiry at 1.0750 for $3.2 B in USD value and a cold expiry at 1.0799 for $428M

There is one expiry for the GBPUSD at 1.2400 and is Hot for £291M

We also have a Hot expiry for the NZDUSD pair at 0.6050 for 352M In new Zealand dollar value.

Of the notable option expiries which we brought you yesterday: price action gravitated to the 107.00 level on USDJPY, just before the New York cut. We listed this as Hot
ERUGBP gravitated towards the 0.8700 level. We listed this as Hot too.
EURUSD had several options, and we listed 1.0820 as being Hot and where traders who purchased a Put, for this expiry level would have been in the money.

We suggest you take the levels and plot them onto your own trading charts and incorporate the information into your own trading methodology in order to use the information to your advantage.
Remember, the higher the amount, the larger the gravitational pull towards the exchange rate maturity at 10:00 am Eastern time.
For a detailed explanation of FX options and how they affect price action in the spot forex market, please follow the link to our educational video.

Categories
Forex Fundamental Analysis

‘Initial Jobless Claims’ – What Should You Know About This Fundamental Indicator?

Introduction

The Initial Jobless Claims is a weekly statistics released by the United States department of labor. Unlike most other indicators that are released monthly, this report has an additional advantage. Because the Initial Jobless Claims report predicts the unemployment two to three weeks ahead compared to the employment report that is released monthly.

What is the Initial Jobless Claims report?

Jobless claims report comes directly from the United States department of labor, AKA. DOL. The department of labor is an executive branch of the United States Federal government and is mainly responsible for monitoring and promoting employment, employee welfare, improving employee wages, and helping them to claim their employment benefits. To do so, it enforces the main Federal laws and regulations.

The United state has a provision for providing insurance for those who are unemployed. In the year 1935, this policy came into implementation. Although it does not mean that every unemployed person is eligible, it has certain criteria. Insurance is provided to the people who have worked for a certain period and have recently lost their job due to factors that do not directly involve them.

For example, seasonal layoffs or business closure, the unemployment compensation insurance is applicable. The payment of compensations is for about 20-26 weeks, which may vary from state to state. The amount is usually a percentage of their most recent average wage for the year.

The initial jobless claim is different from them continued jobless claims. This report only shows the number of people who have applied for the unemployment benefit for the first time during the last week. In this regard, it becomes slightly more important than the continued jobless claim as it indicates the increase or decrease in the unemployment rate within the country.

How is the Initial Jobless Claims calculated?

The Initial Jobless Claims is prepared by the department of labor, which receives this data from state unemployment offices, which intern receive them from the local unemployment offices. The department of labor releases this report at 8:30 a.m. Eastern Standard Time.

Although many citizens apply for the benefit, it necessarily does not represent all the eligible people. Because, it is just a claiming, which will be either considered valid or invalid by the respective departments later.

Is the Initial Jobless Claims important?

When trying to assess the importance of the Initial Jobless Claims report as an economic indicator, there are many things we need to keep in mind.

The report does not cover the entire population. Not all people who are eligible for benefits apply for the same. Many people who are not eligible for the benefits will also apply. Also, the report is very volatile from week to week and is also a function of seasonality.  Hence, A four week moving average of the Initial Jobless Claims report irons out this volatility.

Below is a snapshot of the initial jobless claim report for the period of January- 2018 to February-2020. As we discussed, the numbers are very volatile, which makes it one of the ‘not-so-easy to decode’ economic indicators.

An increase in the Initial Jobless Claims report numbers relative to the previous numbers tells that more people have lost a job in the recent time. This has been historically associated with times of GDP contraction and economic stagnation. In other words, it indicates the beginning of an upcoming recession. A conversely significant decrease in the report occurs when the economy is coming out of recession and progressing towards economic growth (GDP expansion).

How can the Initial Jobless Claims Report be Used for Analysis?

The Initial Jobless Claims can act as abridge towards assessing the unemployment rate or the employment situation report (which are released monthly). The frequency of the report is the main advantage in comparison to other indicators. Because it allows interested people to get the most current economic situation. As mentioned, it can give us an idea about economic health two to three weeks before the employment reports that are released monthly.

Some Forex traders who are looking to buy or sell the US dollar can use this report for the most recent data in this regard. Higher the number, lesser is the confidence in the economy’s strength and vice versa. But in general, this is a minor indicator in comparison to the monthly reports, which are complete, thorough, and consistently reliable as they cover a greater section of the nation’s population.

Overall the Initial Jobless Claims report is a cruder and rudimentary indicator and is not robust or consistent at all times. But to some extent, it can reflect the direction in which the economy is heading. It may not be easy for us to know the minor movements in the economy accurately, but major movements get definitely reflected. In such cases, the Initial Jobless Claims report can also act as one of the main leading indicators to predict any oncoming recession or expansion of the economy.

Sources of Initial Jobless Claims Reports

The United States Department of Labor releases the Initial Jobless Claims report weekly on their official website in the ‘news releases’ section. Reference link – Initial Unemployment Insurance Claims

You can also find the same indexes diversified and other related categories like Continued claims etc. on the St. Louis website.

Impact of the ‘Initial Jobless Claims’ news release on the price charts 

After understanding the definition and significance of Initial Jobless Claims as an economic indicator, we are ready to find out the impact of the same on the currency. As we know that Initial Jobless Claims measures the number of individuals who filed for unemployment insurance for the first time during the week, and the impact is said to vary from week to week. A higher than expected reading is considered to be negative for the currency while a lower than expected data is taken as positive. The data has a moderate to high impact on a currency that causes a fair amount of volatility in the pair.

The below image shows the previous, forecasted and actual number of people who filed for unemployment insurance for the third week of March. We can see that the Jobless Claims were much higher than before with a rise in 70K people. From prerequisite knowledge, this should be extremely negative for the economy and hence the currency, but let us examine the reaction of the market.

USD/JPY | Before The Announcement

We start our analysis with the USD/JPY currency pair, where we notice a strong uptrend, which a result of excessive buying interest of US dollars. The strength in the US dollar could be due to another fundamental factor that is driving the currency higher. Technical analysis tells that when the market is trending strongly in one direction, we need to wait for a retracement to join the trend or wait for market reversal patterns. Hence, before the news announcement, we do not find any suitable way to position ourselves in the market.

USD/JPY | After The Announcement

After the Initial Jobless Claims are announced, volatility increases on both sides but finally closes in the form of ‘Doji’ candlestick pattern. Even though the data was very bad, it was bad enough to cause a reversal in the market. After looking at the market reaction, we can say that the data created confusion among traders as the market consolidates after the news release. Since the Unemployment data did not cause the price to break key levels of support and resistance, the uptrend is still intact. Therefore, one can enter for a ‘buy’ after an indication from an important technical indicator.

GBP/USD | Before The Announcement

GBP/USD | After The Announcement

The above images represent the GBP/USD currency pair, where we witness a strong downward move on the previous day before the news release. After the big move, market moves in a range, and just before the announcement, the price is at the ‘support’ area. This means traders who are optimistic about the Unemployment data can position themselves on the ‘long’ side with a strict stop-loss below the support.

After the news announcement, we hardly notice a change in volatility, and the candle again forms an indecisive pattern. Since the Jobless Claims data did not cause any drastic change in volatility, traders can enter for new ‘long’ positions or hold on their existing ones and should compulsorily exit at the nearest resistance.

GBP/USD | Before The Announcement

GBP/USD | After The Announcement

The GBP/USD currency pair shows similar characteristics as that of the USD/JPY pair, where before the news announcement, the market is in a strong uptrend. In such market scenarios, we essentially cannot position ourselves on any side of the market as we don’t have any technical factors supporting our trade. Therefore, it is wise to wait for the news release and then act based on the data.

After the Initial Jobless Claims numbers were announced, we see an increase in volatility but with no bias. It results in the formation of an ideal ‘Doji’ candlestick pattern with wicks on both sides and small body. Since the market did not collapse, we can conclude that the data was not damaging to the US dollar. From the trading point of view, we cannot enter for ‘buy’ even after the news release as technically, we need a retracement before we join the trend.

That’s about ‘Initial Jobless Claims’ and its relative news release impact on the Forex price charts. If you have any questions, please let us know in the comments below. All the best.

Categories
Forex Market Analysis

Daily F.X. Analysis, May 01 – Top Trade Setups In Forex – Eyes on U.S. ISM Manufacturing PMI

The U.S. dollar traded with a selling bias in the wake of weaker economic data. The closely watched Unemployment Claims for a previous week from the United States weighed on the U.S. dollar when it came in as 3839K against the expected 3500K. The Personal Spending for the month of March from the U.S. was declined by -7.5% against the expected decline by -4.8% and added in the weakness of the U.S. dollar.

The Core Price Index for the month of March came in line with the expectations of -0.1% and had a null effect on the U.S. dollar. The Employment Cost for the first quarter of this year came in favor of the U.S. dollar when it exceeded 0.8% against the expectations of 0.7%. Later today, the market is expected to show thin volatility in the wake of Labor day holiday. However, investors will be focusing on the ISM Manufacturing PMI figures from the United States to drive further price action in the market. 

Economic Events to Watch Today     


EUR/USD – Daily Analysis

The direct currency pair EUR/USD surged dramatically to close the day at 1.09517, having placed a high of 1.09725 and a low of 1.08327 yesterday. The ECB held its rates unchanged on Thursday and said that it expects the rates to remain at the present level or lower levels until the inflation of the Eurozone meet the level or reach near the projection of 2%. ECB also said that it was ready to adjust all of its instruments to achieve its projected aim of inflation in a sustained manner.

The Euro gained bullish momentum, although French Flash GDP for the First Quarter dropped more than expectations. It was expected to decline by -4.0 % in the first quarter of this year, but the results showed that the actual drop in French Flash GDP was recorded as -5.8%. While the German Retail Sales data decline by -5.6% against the expectations of -8.1%, it was in favor of the single currency Euro as the actual drop in German Retail Sales was less than its forecasted value.

At 11:45 GMT, the French Consumer Spending in the month of March was dropped by -17.9%, which were assumed to be dropped by -5.7%, and hence it weighed on single currency Euro. The French Prelim Consumer Price Index for the month of April came in favor of Euro as 0.1%, which was expected to decline by -0.2%.

The Spanish Flash Gross Domestic Product (GDP) for the First Quarter of year also dropped more than expected and weighed on Euro. The drop-in Spanish GDP was recorded as -5.2% at 12:00 GMT, whereas it was expected to drop by -4.2%. The Spanish Flash Consumer Price Index (CPI) for the year also showed a decline in April by -0.7% when it was expected as-0.5% and weighed on Euro currency.

The single currency Euro remained supportive by the data and ECB’s decisions on Thursday and gave strength to EUR/USD pair. Though the quarterly GDP of the Eurozone dropped to its lowest level since the records, the EUR/USD pair still managed to remain bullish throughout the day. 

Daily Support and Resistance

  • R3 1.115
  • R2 1.1062
  • R1 1.1009

Pivot Point 1.0921

  • S1 1.0869
  • S2 1.078
  • S3 1.0728

EUR/USD– Trading Tips

On Friday, the EUR/USD price is holding at 1.0944 area, after placing a high of 1.0973 during the U.S. session on Thursday. On the 4 hour chart, the EUR/USD has formed a candlesticks pattern hanging man around 1.0955 level. Typically such a pattern shows that buyers are exhausted, and sellers may enter into the market soon. On the lower side, the EUR/USD pair can go for completing 38.2% Fibonacci retracement at 1.0920 and 50% retracement at 1.0900 mark. The trading sentiment for the EUR/USD continues to be bullish, especially after the bullish crossover of 50 EMA and MACD. Both of the leading indicators are supporting the bullish trend, but a slight retracement can be expected. The resistance is likely to be found around 1.0971 and 1.0992. Consider staying bearish below 1.099 level today.  

GBP/USD – Daily Analysis

During Thursday’s Asian session, the GBP/USD is trading slightly bearish around 1.2562, maintaining the overall trading range of 1.2644 to 1.2525. Most of the buying triggered in the wake of weaker U.S. Jobless Claims figures 

The U.K. Prime Minister, Boris Johnson, informed that the latest figure of 81,011 tests was hopeful, which were conducted on Wednesday, close to the government target of 100,000 tests per day by the end of April. He also said to the business community that he acknowledge their patience but informed that they have to keep going the way they are doing business now for the time being.

On the other hand, surgeons across the U.K. have warned that if the U.K. comes out of the lockdown too soon, it will cause the death of thousands. The Royal College of surgeons urged Prime Minister Boris Johnson to consider the service that saved his life when discussing the lifting of restrictions from lockdown.

Furthermore, there was no economic data or major event from the U.K. side, so the movement of the GBP/USD pair remained solely on USD. The U.S. dollar remained weak throughout the day because of poor economic data on Thursday. 

The unemployment claims for the previous week from the U.S. were recorded as 3839K against the expectations of 3500K. An increased number of unemployed people weighed on the U.S. dollar and helped the pair GBP/USD to move in an upward direction and close the month with a bullish candle.

Daily Support and Resistance

  • R3 1.2896
  • R2 1.2769
  • R1 1.2682

Pivot Point 1.2555

  • S1 1.2467
  • S2 1.2341
  • S3 1.2253

GBP/USD– Trading Tip

The GBPUSD pair showed strong bullish movement to trade at 1.2540 after making a double top pattern around 1.2644. The recent bearish engulfing pattern on GBP/USD pair suggesting chances of selling in Sterling. On the lower side, the GBP/USD may find support around 1.2520. Below this, the GBP/USD prices have the potential to go after 1.2470. 

Overall, the trading bias of GBP/USD remains bullish, considering the 50 EMA and MACD, both of the indicators are supporting selling bias. Consider staying bullish above 1.2510 and bearish trades below 1.2638 level today. 

USD/JPY – Daily Analysis

The USD/JPY pair was closed at 107.169 after placing a high of 107.497 and a low of 106.404. Overall the movement of USD/JPY remained Bullish throughout the day. The USD/JPY pair posted gains on Thursday despite the weakness of the U.S. dollar across the board amid poor than expected economic data. Throughout the day, the USD/JPY pair moved back and forth but managed to post gains in the ending day of the month.

On Thursday, Federal Reserve announced to expand the scope of its main street lending in order to support the small and medium-sized businesses by giving them credit. The scheme would now provide the credit flow to the financially sound small & medium-sized companies which were in good condition before the pandemic.

Federal Reserve announced to allow finance to companies with up to 15,000 employees and $5 Billion in revenue, which was previously set for companies with up to10,000 employees and $2.5 Billion in revenue during the period of the pandemic, which affected the business activity across the United States.

At 17: 30 GMT, the closely watched Unemployment Claims for a previous week from the United States weighed on U.S. dollar when came in as 3839K against the expected 3500K. The Personal Spending for the month of March from the U.S. was declined by -7.5% against the expected decline by -4.8% and added in the weakness of the U.S. dollar.

Daily Support and Resistance    

  • R3 108.76
  • R2 108.14
  • R1 107.66

Pivot Point 107.03

  • S1 106.55
  • S2 105.92
  • S3 105.44

USD/JPY – Trading Tips

The USD/JPY pair take’s a bullish turn in the wake of risk-on sentiment to trade around 107.180. As we can see in the 4-hour chart above, the USD/JPY pair is struggling to cross over the downward trendline, which is extending resistance around 107.250. The 50 EMA is also keeping pressure on the pair around the same level of 107.250. Below this level, we may see a selling trend in the USD/JPY pair until the next target levels of 106.99 and 106.960. The 50 EMA and MACD are also suggesting selling bias for the USD/JPY pair. Taking a selling trade below 107.350 and buying above 107.030 can be a good idea today.

All the best for today! 

Categories
Forex Options

FX option expiries for May 1 New York cut

Thank you for visiting the Forex.Academy FX Options Expiries Section. Each day, where available, we will bring you notable maturities in FX Options of amounts of $100 million-plus, and where these large commutative maturities at specified currency exchange rates often have a magnetic effect on price action, especially in the hours leading to their maturities, which happens daily at 10.00 AM Eastern time. Each option expiry should be considered ‘in-play’ if labelled as Hot, Warm or ‘out of play’ if labelled Cold with regard to the likelihood of price action meeting the strike price at maturity.

…………………………………………………………………………………………………………………..

FX option expiries for May 1 New York cut

FX option expiries for May 1 NY cut at 10:00 Eastern Time, via DTCC, can be found below.

– EUR/USD: EUR amounts

  • 1.0900 630m


– AUD/USD: AUD amounts

  • 0.6530 1.9bn 

AUD/NZD: AUD amounts

  • 1.0600 378m 

………………………………………………………………………………………………………….

DISCLAIMER: Please note that this information is for educational purposes. Also, heat levels may change throughout the day in line with the exchange rate fluctuations of the associated pairs.

Categories
Forex Market Analysis

WTI Crude Oil Reaches Double Top – Is It Good Time to Short?

The WTI crude oil prices soar to trade at 17.79 level despite an increased number of inventories. The quantity of crude oil owned by private companies that are incapable of selling the product due to the novel coronavirus (COVID-19) pressure seems to set an all-time high in the weeks ahead. 

Global producers may develop creative measures to find crude storage, which caused by the lack of physical demand due to coronavirus lockdowns, while US President Donald Trump made a commitment to deliver a system to help the country’s oil companies, which also helped the sentiment around the commodity. The Treasury Secretary Steven Mnuchin said the plan could add millions of barrels of oil to already-teeming national reserves.

At the US-China front, US President Donald Trump’s stoked fresh trade war between China and the United States, which weighed on the risk sentiment but not so much. On the other hand, the Fed’s dovish pause and positive updates on the virus medicine have recently improved market sentiment, which is growing crude oil prices.


Daily Support and Resistance

  • S1 9.99
  • S2 13.21
  • S3 14.95

Pivot Point 16.44

  • R1 18.18
  • R2 19.66
  • R3 22.89

On the technical front, the U.S. Oil is holding below the strong double top resistance level of 18.35. On the 4 hour timeframe, WTI seems to close a Doji candle below this level, and if it actually happens, we may see oil prices falling further until 23.6% and 28.2% Fibonacci support areas of 16.33 and 15.17 respectively. The MACD is suggesting an overbought scenario, while the 50 EMA is also far from the CMP (current market price), so we may see a selling opportunity. Good luck! 

Categories
Forex Signals

USD/CAD Gain Support Over Double Bottom – Who’s Up for Bullish Trade?  

The USD/CAD pair slipped sharply to form the double bottom pattern around 1.3864 level on the 4-hour chart. The primary reason behind a sharp sell-off in the USD/CAD pair is the risk-on market sentiment, which is increasing demand for crude oil following the report of successful clinical trials of Gilead Sciences’ retroviral drug Remdesivir. The drug will be used to treat those infected by COVID-19, and investors are expecting the market will be back to its feet once this medicine gets success.

With this, demand for oil will be strong again, and due to which, Loonie will gain bullish bias, causing USD/CAD pair to drop. The US dollar draws further offers in the wake of less heaven demand and exert some pressure on the USD/CAD currency pair.


From the technical perspective, the USD/CAD pair’s failure to register any meaningful recovery further indicates that the near-term bearish pressure could not finish soon. Therefore, the range-bound trading action might still be classified as a consolidation phase before the next leg of the pair’s bearish move. Before we see further selling in the USD/CAD pair, the odds of bullish retracement will remain strong. The USD/CAD pair may drive the pair’s prices towards 23.6% or 38.2% Fibonacci retracement level of 1.3915 and 1.3945, respectively. 

Entry Price: Buy at 1.38889    

Take Profit .1.39389    

Stop Loss 1.38489    

Risk/Reward 1.25

Profit & Loss Per Standard Lot = -$400/ +$500

Profit & Loss Per Micro Lot = -$40/ +$50

Categories
Forex Videos

Forex – Whats Driving The Price Of The Pound?


What’s Driving The Pound? Helium?


The British Pound has been affected greatly by the Coronavirus outbreak. As per the slide of the GBPUSD daily chart, the 7-day period at the beginning of March saw price action collapse from a level of 1.32 to 1.14. However, it has had a phenomenal rebound up to current levels of 1.25, and so what has led this recovery? And is it sustainable?

First, we have to factor in that in the early stages of March, where Britain was hard hit by the coronavirus, and the government decided to close the bulk of the business sector down by putting the country into lockdown in order to try and curtail the effect of the coronavirus. It implemented financial strategies to inject capital into the markets in order to try and protect small to medium businesses, while also agreeing to make financial payments to individuals who were on lockdown. This has created a debt bubble.
The shock wave to the financial system was huge and sent the Pound crashing against counterparts and especially the dollar. But also at this time, the United States was in the early stages of the pandemic, and this would have influenced investors and currency traders to buy the dollar against the Pound.


However, during the later stages of March, we can see that price action is heavily supported around the 1.1400 and 1.1500 key levels, as the United States becomes more susceptible to the virus with increased numbers of people being infected there and as the death rate begins to rise.

Analysts will also argue that the huge amounts of dollars being injected into the markets by the Federal Reserve, their slashing of interest rates and their huge overnight repurchase program which effectively provides more stimulus has greatly helped liquidity in the financial markets where the UK is heavily dependent within its huge financial services sector, thus giving the Pound a lift. But from 1.1400 to 1.2500, in six days? Wow, who saw that coming. Not many traders and analysts I expect, especially with the country in lockdown, with increasing unemployment, businesses going to the wall, and Government debt growing exponentially while essentially propping up the country.

Now we have to factor into other critical components as to why the Pound is so elevated. Firstly we have the USA in a similar situation, where a majority of the industrial sector has also been shut down and where the majority of the population, excluding essential and key workers, have been put in lockdown. Of course, these workers do not contribute to the country’s gross domestic product, and as such, they make a negative contribution to GDP due to salaries and equipment that they need which all comes from the Federal Government, again, this bad for the US economy, and so we would expect a bounce in exchange rates to take some of this into consideration.

However, I suspect one of the key reasons that the GBPUSD exchange rate is elevated at the moment is because investors envisage that the British government will not be able to effectively negotiate the terms of the new trading agreement with the European Union where Britain’s transition period ends at the end of December 2020. Although this is enshrined in law, analysts and investors are predicting that the government will have to find a way to extend this period by 1 or 2 years, simply because the pandemic has meant the British companies are not in a position to effectively be able to implement any new trade deals that the government negotiates with the EU by December, thus forcing the government to extend the transition period. And this, of course, would mean that uncertainties surrounding negotiations will be pushed back, thus alleviating pressure on the Pound.

There is one more thing to consider, that the pandemic, which is forcing the global economy into recession is almost unprecedented on this scale, and where we see large swings in currency pairs such as we have seen in cable, where huge volumes of stop losses will have been incurred by vast amounts of traders and institutions, and often you will find in the circumstances volume begins to dry up in currency terms as investors stay on the sidelines, which causes high levels of volatility, and vacuums, where are traders, cannot predict levels of resistance and support, because there is a lack of historical technical analysis levels of support and resistance, which further fuels uncertainty.

Therefore we should expect more volatility in this pair. However, as price action consolidates, we will likely see more levels of support and resistance being observed by traders looking for signs that the pandemic is easing, before finding more clarity with regard to directional bias.

Categories
Forex Videos

The Stock market Bubble Is Real! Is It Time To Pull The Plug?

Are Stocks In A Helium Bubble?

During the fall of the Roman Empire, Romans of wealth, including high-level soldiers, melted down silver Roman coins because they could see the end of the empire coming. They were effectively converting out of cash and into a precious metal. They knew the value of silver, no matter what.

A few months ago, when the Covid-19 virus started to take hold in China and especially when it hit Italy, sharp investors bailed out of stock markets and converted their investments into US treasury bills and also cash. INSERT B: Shortly afterwards the main Stock indices crashed with the biggest hit to the Dow Jones 30, which tanked from above 29.000 to 18.200 at its low point. The Federal Reserve, along with other major Western governments, acted quickly and reduced interest rates and pumped as much money as possible into economies to try and limit the damage, where the majority of the world was in a state of lockdown, and all but essential business were closed. The global economy was flatlining, going into recession, and is currently facing the biggest economic disaster which this world has ever known.


And yet, in the last few weeks global indices, especially the Dow Jones, INSERT 1 S&P 500, the INSERT 2 German Dax and INSERT 3 the FTSE INSERT 4 have rebounded off of their lows and incredibly are in what can only be termed as a bull run. With no end in sight to the Covered-19 crisis and no cure on the horizon, and where economic production and gross domestic product are tanking, how can stock indices be riding on a high?

This can be down to a couple of reasons, f o m o: Fear of missing out, where investors are diving back and picking up what they see as cheap stocks under the old adage; buy at the bottom and sell at the top, and where Executives have also picked up stock in their own firms. Another reason can be put down to automatic trading algorithms which simply have no rationale when it comes to fundamentals, they have no empathy with people that are affected by this disease, they have no consideration of flatlining economies and negative GDP’s, they are simply programmed to buy and sell on whatever technical trading criteria the programmer sets.

The upshot is that a bubble has been created in these indices, where artificially inflated stocks are floating well above where they should be, in some kind of helium bubble. And we all know what happens to bubbles: they burst.
Stock markets, and the companies which are contained within, grow on consumer demand and while consumers are currently buying their necessities like food, medicine, electricity, gas; the basics, in other words, they certainly are not buying luxury items including cars, holidays abroad including airline flights, on cruise liners, or requiring hotels. And they are not going out to restaurants or cinemas, and they are not buying petrol for their cars because most of them are in lockdown. They aren’t moving house, and the financial services sector, in terms of lawyers and mortgage underwriters, are affected. And of course, all of this has a knock-on effect on those companies, which means they cannot grow, and which means that essentially their stock value should be crashing through the floor. And yet here we are in a bull run.

There is an old adage: the writing is on the wall, and when oil prices crashed this week and turned negative for the first time in history, it sent a chill through the spines of investors that told them that the financial markets were on borrowed time. While the oil market crash was said to be on a technicality, due to a futures contract for May which established that there was insufficient oil storage capacity, which sent oil prices to minus $40 Per barrel for West Texas Intermediate, and where we have seen a slight rebound in June contract prices, what do you think is going to happen when this maturity comes up.

There will still be an oversupply of oil in a marketplace that doesn’t need it because it’s in lockdown, there will still be a lack of storage capacity in a purpose-built facility such as Cushing, Oklahoma and around the world, so expect more jitters there. And of course, the longer the Covid-19 virus continues, the more likely that the stock market bull run is going to end with a flash bang wallop.
And of course, because all of the financial markets are so closely interconnected, we can only expect extreme volatility to spill over into the foreign exchange market.

Categories
Forex Market Analysis

Daily F.X. Analysis, April 30 – Top Trade Setups In Forex – Brace for ECB Rate Decision! 

On the forex front, the ICE U.S. Dollar Index fell 0.4% on the day to a two-week low of 99.48, posting a four-day decline. The European Central Bank will announce its interest rates decision (deposit facility rate unchanged at -0.5% expected). The European Commission will post 1Q GDP (-3.4% on year expected) and March jobless rate (7.8% expected).

The U.S. Labor Department will release initial jobless claims in the week ended April 25 (3.5 million expected). The Commerce Department will report March’s spending (-5.0% on month expected) and personal income (-1.5% on month expected). The Market News International will release April Chicago PMI (37.7 expected).

Economic Events to Watch Today     


EUR/USD – Daily Analysis

The EUR/USD soared over 0.5% to 1.0876. The economic figures revealed that the eurozone’s Economic Confidence Index slipped to 67.0 in April (73.1 expected) from 94.2 in March. Meantime, traders are awaiting the European Central Bank to maintain its key rates unchanged later today. Also, the eurozone’s first-quarter GDP (-3.4% on year estimated) and March jobless rate (7.8% expected) will be reported.

At the USD front, the dollar index’s (DXY) bounce from the 13-day low of 99.45 reached during Tuesday’s American trading hours, and it ran out of steam near 99.90 early on Wednesday. It’s mostly because both the S&P 500 futures and Asian stocks climbed, as in result greenback is losing its haven demand. 

On the flip side, the European Central Bank will likely hold its policy unchanged and show a willingness to give more monetary stimulus if required. The EUR will likely give importance to the ECB’s moves on sentiment than traditional monetary policy signals.

At the USD front, the monthly safe-haven demand for the U.S. dollar also kept currency pair under pressure during the April month. The U.S. Dollar Index hit a daily low at 99.54 earlier in the morning but remained above Tuesday’s lows. Equity prices held on to gain.

At the coronavirus front, the number of confirmed coronavirus cases rose to 159,119, with a total of 6,288 deaths reported as per the German disease and epidemic control center report. While. The cases rose by 1,478 in Germany, the daily rate of increase shows rise to 0.9% from 0.8% on Wednesday. The death losses rose by 173 vs. 202 seen a day before.

Traders will keep their focus on the Eurozone CPI and GDP data ahead of the ECB policy decision. The coronavirus headlines and U.S. dollar dynamics could entertain the traders during the day ahead.


Daily Support and Resistance

  • S1 1.0774
  • S2 1.082
  • S3 1.0847

Pivot Point 1.0867

  • R1 1.0894
  • R2 1.0913
  • R3 1.0959

EUR/USD– Trading Tips

The technical side of the EUR/USD is more or less the same as yesterday. The EUR/USD is trading bullish around 1.0877 as the U.S. dollar seems to face bearish pressure due to dovish FOMC. The EUR/USD has the potential to go after 1.0882, and bullish breakout of this level may drive EUR/USD prices further higher until the next resistance level of 1.0960. 

The trading sentiment for the EUR/USD continues to be bullish, especially after the bullish crossover of 50 EMA and MACD. Both of the leading indicators are supporting bullish trend with immediate support around 1.0814. We should consider taking buying trades above 1.0840 today. 

GBP/USD – Daily Analysis

During Thursday’s Asian session, the GBP/USD currency pair extended its recovery moves from 1.2430 to 1.2470 but still considered bearish and trading below the 1.2500 level while representing 0.05% losses on the day mainly due to the broad-based U.S. dollar recovery pullback. The persistence criticism on Tory government policymakers’ performance about securing the personal protective equipment keeps the British Pound under pressure. 

The GBP/USD is currently trading at 1.2478 and consolidates in the range between the 1.2429 – 1.2485. However, traders are cautious about placing any strong position ahead of coronavirus briefings by the UK PM Boris Johnson.

The Tory leader failed to head any daily coronavirus briefings even after the UK PM Boris Jonson returned to the office. Whereas, the reason behind the British PM Johnson’s little presence yesterday could be the news of his fiancée giving birth to a baby boy. On the other hand, the United Kingdom leader met with opposition Labour Party leader Keir Starmer and discussed the proceedings to combat the crisis.

The Tory party has been under pressure mainly due to the latest coronavirus report, which shows the U.K. as having the second-highest death toll in Europe. As well as, the criticism about the policymakers’ performance on securing the personal protective equipment (PPE) added further pressure on the Tory government. Despite this, the UK Tory government still claims to be on the top of performance while showing a coronavirus tracking app that warns the user when the contact with peoples infected by COVID-19,

On the flip side, the Foreign Secretary Dominic Raab said that the U.K. must pass and secure a Brexit deal by the end of the year to provide businesses, and this will be the best chance to ‘bouncing back’ economy from the coronavirus pandemic.

At the US-China front, U.S. President Donald Trump’s fueled fresh trader war between China and the United States, which sent the currency pair lower as the dollar caught bids in the wake of safe-haven demand. On the other hand, the Fed’s dovish pause and positive updates on the virus medicine have weighed on the U.S. dollar previously.

Daily Support and Resistance

  • S1 1.2315
  • S2 1.2371
  • S3 1.24

Pivot Point 1.2427

  • R1 1.2456
  • R2 1.2483
  • R3 1.2539

GBP/USD– Trading Tip

The GBP/USD continues to trade upward around 1.2479 area, as it’s maintaining a fresh trading range of 1.2525 – 1.2396. The GBP/USD has developed a bullish channel, which is supporting it around 1.2396 along with resistance around 1.2501. On the higher side, a bullish breakout of 1.2520 opens up further room for buying until 1.2560 and 1.2626 level. 

The GBP/USD pair is holding a buying zone, above 50 EMA, which is also supporting the cable around 1.2409. Since the MACD is holding above 0, which demonstrates that one should be looking to enter a buying trades in the GBP/USD pair. Consider staying bullish above 1.2430 and bearish trades below 1.2520 level today. 

USD/JPY – Daily Analysis

The USD/JPY lost 0.2% to trade around 106.61. The economic figures showed that Japan’s industrial production fell 3.7% on month in March, which is less than expectations of -5.0%, and retail sales declined by 4.5%. The currency pair failed to cheer the Japanese yen’s weakness and dropped to 6-weeks low yesterday. 

The USD/JPY is trading at 106.64 and consolidates in the range between the 106.39 – 106.89. Whereas, the safe-haven demand for the U.S. dollar continues to lose due to risk-on sentiments in the stock market amid hopes of re-opening of the economies in Australia, New Zealand, and parts of Europe. 

The currency pair continues to follow the broad-based U.S. dollar directions so far this week, with the latest stop in the dollar decline offering some support. The U.S. dollar index trades at 99.70 after hitting a daily low of 99.63. 

The reason behind the risk-on market sentiment could also be the upbeat comments from the BOJ Governor. The Bank of Japan (BOJ) Governor Haruhiko Kuroda said that Japan’s financial system remains firm because a whole as bank groups have satisfactory capital buffers. Lastly, weakness in the U.S. dollar is also weighing on the USD/JPY. As expected, the Federal Reserve kept its benchmark interest rates unchanged at 0.00%-0.25%. The central bank acknowledged that the coronavirus pandemic is posting a considerable risk to the medium-term outlook for the economy.

Daily Support and Resistance    

  • R3 108.1
  • R2 107.72
  • R1 107.3

Pivot Point 106.93

  • S1 106.51
  • S2 106.14
  • S3 105.72

USD/JPY – Trading Tips

The USD/JPY pair has traded mostly in line with the forecast to drop from 106.980 level to 106.350 level. At the moment, the USD/JPY pair is trading at 106.650, gaining immediate support around 106.350, and violation of this level can extend selling bias until 105.850. On the 4 hour chart, we can see the USD/JPY pair is holding below descending triangle pattern, which may keep the pair in a bearish mode under 106.980 resistance. At the same time, the 50 EMA and MACD are also suggesting selling bias for the USD/JPY pair. Taking a selling trade below, 106.850 seems to be a good idea today.

All the best for today! 

Categories
Forex Options

FX option expiries for Apr 30 NY cut

Thank you for visiting the Forex.Academy FX Options Expiries Section. Each day, where available, we will bring you notable maturities in FX Options of amounts of $100 million-plus, and where these large commutative maturities at specified currency exchange rates often have a magnetic effect on price action, especially in the hours leading to their maturities, which happens daily at 10.00 AM Eastern time. Each option expiry should be considered ‘in-play’ if labelled as Hot, Warm or ‘out of play’ if labelled Cold with regard to the likelihood of price action meeting the strike price at maturity.

…………………………………………………………………………………………………..

FX option expiries for Apr 30 NY cut at 10:00 Eastern Time, via DTCC, can be found below.

– EUR/USD: EUR amounts

1.0730 513m

1.0750 712m

1.0800 2.1bn

1.0947 1.1bn

– USD/JPY: USD amounts

105.50 645m

106.00 569m

106.60 640m

106.65 521m

107.00 645m

107.10 413m

107.15 573m

107.35 1.4bn

107.50 2.2bn

107.60 640m


– GBP/USD: GBP amounts

1.2320 209m

1.2375 209m

1.2395 269m

1.2400 220m

1.2430 241m


– AUD/USD: AUD amounts

0.6570 2.7bn 


Of the notable option expiries which we brought you yesterday: price action hit the 108.65 level for EURUSD pair, which was an official strike at the 10 AM cut. We listed this as Hot

ERUGBP hit 0.8730 at the cut, which was only 30 pips from the 0.8700 option expiry. We listed this as Hot too.

GBPUSD had an expiry at 1.2425 and where we saw price action hit 124.47 at the cut, just 22 pips from the option expiry. We also listed this as Hot

………………………………………………………………………………………………………………

DISCLAIMER: Please note that this information is for educational purposes. Also, heat levels may change throughout the day in line with the exchange rate fluctuations of the associated pairs.


Categories
Forex Daily Topic Forex Fibonacci

Draw Fibonacci Levels on Your Trading Chart

Fibonacci traders are to find out a good move, followed by a price correction. They keep their eyes on the 61.8% level with extreme attention. If the level of 61.8% produces a reversal candle, traders trigger for entry. Usually, the price goes up to the level of 161.8% if the price trends from 61.8%. This allows an excellent risk-reward to the traders as well. In today’s article, we are going to demonstrate an example of how the golden ratio of 61.8% plays such an important role in moving the market towards the trend. Let us get started.

The chart shows that it makes a bullish move upon producing a bullish engulfing candle. The price makes a downside correction and moves towards the North again. This time the price makes the move with good bullish momentum. The Fibonacci traders are to wait for the price to make a downside correction and draw Fibonacci levels to go long in the pair. Let us proceed to the next chart to find out whether it starts having downside correction or heads towards the North further.

This is an interesting move by the chart. It has a bearish gap, but the candle comes out as a bullish candle. Despite having an upper shadow, this is a bullish reversal candle. Let us find out how the price reacts upon getting such a bullish reversal candle.

The price heads towards the North with extreme bullish momentum. The bull outplays the bear. This is such a strong bullish move that the buyers would love to make full use of it. Do you notice something interesting? Yes, the price trends from the 61.8% zone. Let us draw the Fibonacci levels and see how it looks.

The chart shows that despite having a bearish gap, the chart produces a bullish candle within 61.8% zone and heads towards the North. It hits the level of 161.8% in a hurry as well. This is what the Fibonacci golden ratio level does almost all the time. There are different ways of trading and catch such a move. Some traders enter before the breakout, while some enter after the breakout at the highest high of the wave. Both have merits and demerits, which we will learn in our forthcoming Fibonacci lessons. Meanwhile, concentrate on your chart and practice drawing Fibonacci levels by pointing out the highest high and the lowest low. Start practicing this, so you get well acquainted with Fibonacci significant levels and how the price reacts to them. This will help you trade much better soon.

Categories
Forex Assets

Analyzing GBP/BGN Exotic Pair & Comprehending The Costs Involved

Introduction

GBP stands for the British pound sterling, which is sometimes also known as the Pound. It is the 4th most traded currency in the Foreign Exchange market after USD, EURO and YEN. Whereas, BGN is the abbreviation of the Bulgarian lev, and it is the official currency of Bulgaria.

Understanding GBP/BGN

In Forex, the currencies are traded in pairs. In this case, GBP is the base currency, and BGN is the quote currency. Generally, if the value of the base currency goes up, the value of the quote currency goes down and vice versa. The market value of GBP/BGN determines the strength of BGN against GBP. It can be easily comprehended as 1GBP is equal to how much of BGN. So, if the exchange rate of GBP/BGN is 2.2409, to buy 1GBP, we need 2.2409 BGN.

Spread

Spread is the athematic difference between the bid and ask prices. Here, the bid is the selling price, whereas ask is the buying price of the currency pair. So basically, the spread is a type of commission brokers make for the services they provide. Below are the ECN and STP spread values for the pair GBP/BGN.

ECN: 19 pips | STP: 22 pips

Fees

It is obvious that we need to pay some commission to the broker every time we place a trade. A Fee is simply that commission we pay to the broker for opening a particular position. This fee varies from the type of broker we use. For example, there is no fee charged for STP account models, whereas a few pips are charged by ECN brokers.

Slippage

Slippage is referred to as the difference between the expected price at which the trader wants to buy/sell a currency pair and the price at which the trade is executed in real-time. It is important to know that slippage can occur at any time. However, it mostly happens when the market is extremely volatile.

Trading Range in GBP/BGN

Whether we make a profit or loss in a given time period depends on the movement of a currency pair. This can be assessed using the trading range table that is given below. It is basically a representation of the min, avg, and the maximum pip movement in a Forex currency pair. Evaluating the volatility of the market before taking the trade is the most important thing to do. The trading range here is to measure the volatility of the GBP/BGN pair.

Procedure to assess Pip Ranges

  1. Add the ATR indicator to your chart
  2. Set the period to 1
  3. Add a 200-period SMA to this indicator
  4. Shrink the chart so you can assess a significant period
  5. Select your desired timeframe
  6. Measure the floor level and set this value as the min
  7. Measure the level of the 200-period SMA and set this as the average
  8. Measure the peak levels and set this as Max.

GBP/BGN Cost as a Percent of the Trading Range

Most of the time, the cost of trade depends on the type of broker we choose. This varies based on the market’s volatility. The total cost involves the costs incurred from slippage and spreads along with the trading fee. Below we have discussed the cost variation in terms of percentages. Let’s look into both the ECN and the STP models.

ECN Model Account

Spread = 19 | Slippage = 3 |Trading fee = 5

Total cost = Slippage + Spread + Trading Fee = 3 + 19 + 5 = 27

STP Model Account

Spread = 22| Slippage = 3 | Trading fee = 0

Total cost = Slippage + Spread + Trading Fee = 3 + 22 + 0 = 25

Trading the GBP/BGN

The GBP/BGN is an exotic-cross currency pair and is a low volatile market. As seen in the Range table, the average pip movement on the 1-hour time frame is only 36. This clearly shows that if we trade this pair, we will have to wait for a more extended period to get some good profit as the pip movement is very less.

On any given day, if the market volatility is high, the cost of the trade is lower and vice-versa. However, this shouldn’t be considered as an advantage always because more the volatility, the riskier is our trade.

For instance, in the 1M time frame, the maximum pip range value is 1559, and the minimum is 336. When we compare the fees for both the pip movements, we find that 8.04% is the fee for the former, and it is only 1.73% for the latter. Hence we can infer that the prices are higher for low volatile markets and low for highly volatile markets.

Categories
Forex Course

108. What Are Corrective Waves & How To Comprehend Them?

Introduction

In the last lesson, we discussed the impulsive waves and 5-wave pattern corresponding to it. A trend is made up of the combination of the 5-wave pattern and the 3-wave pattern. The 5-wave impulsive pattern moves along the original trend, while the 3-wave corrective pattern moves against the trend. In this lesson, we shall discuss the corrective wave and then interpret the 5-3 waves.

Corrective waves

In case of an uptrend, the impulsive waves are towards the upside, and the corrective waves are towards the downside. Continuing with the example mentioned in the previous lesson, the corrective waves are represented in the below figure.

In the above figure, waves a, b, and c represent the corrective waves. The overall trend of the market is up, but corrective waves are against it. In other terms, the 3-wave corrective wave can be considered as pullback for the uptrend.

Note: The 3-wave corrective wave is also referred to as the ABC corrective wave pattern.

Reverse Corrective Wave Pattern

The Elliot wave theory is applicable to both uptrend and downtrend. So, for a downtrend, the impulsive wave faces downwards following the overall trend, while the corrective wave faces upwards. Below is a figure representing the 5-3 wave pattern for a downtrend.

Types of Corrective Wave Patterns

The above illustrated corrective wave is not the only type of corrective wave that occurs. According to Elliot, there are twenty-one 3-wave corrective wave patterns, where some are simple and some complex. However, a trader need not memorize all of them at once. The following are three simple corrective waves that are most occurring in the market.

The Zig-Zag Formation

The zig-zag formations are very steep compared to the regular one and are against the predominant trend. In the three waves, typically, wave B is the shortest compared to wave A and wave C. Note that, the Zig-Zag pattern can happen twice or thrice. Also, the zig-zag patterns, like all other waves, can be broken into 5-wave patterns.

The Flat Formation

As the name suggests, in flat corrective wave patterns, the 3-wave pattern is in the sideways direction. That is, the wave C does not go below wave B, and wave B makes a high as much as wave A. Sometimes, the wave B goes higher than wave A which is acceptable as well.

The Triangle Formation

The Triangle formation is a little different from the other corrective patterns. The difference is that these patterns are made up of 5-waves that move against the overall trend. These corrective waves can be symmetrical, ascending, descending, or expanding.

These were some of the most used corrective patterns used by traders. These must be known to technical traders by default. In the next lesson, we shall discuss another important concept related to the Elliot Wave theory.

[wp_quiz id=”71613″]
Categories
Crypto Guides

‘Whales’ & Their Impact On The Cryptocurrency Market!

Introduction

Whales are a metaphor for individuals with high-worth in the capital and have the capability to persuade the market in their preferred direction. In this article, we shall understand how the whale’s actions impact the cryptocurrency market.

Whales’ typical move is to create a wave in the market. They cause the market to artificially appreciate or depreciate so that they can get the best price to make their purchase and ride in profit. Now let’s see how they create this illusion in the market.

How do the Whales work?

We know that the job of Whales is to create a wave in the market. And the amount needed to create it depends on the market cap of the instrument. So, a bigger ocean would require bigger whales to produce a considerate wave.

To produce a wave, the whales place a large number of sell orders at a low price such that there are not as many buy orders as their sell orders. With these sell orders, the exchange has no other option but to execute the order. In doing so, a wave will be brought into the market, which will drive the prices lower and lower in a very short period of time. Once prices drop, the whales begin to buy at these lower prices.

If the number of orders of the whales is not as large as the number of buyers, and they still place sell orders at low prices, there would be enough buyers to fill those sell orders. Hence, only a young market with a small market cap is prone to these whale waves.

For instance, BearWhale was able to bring and hold the prices of Bitcoin to as low as $300 only for a few hours. Because there were a large number of buyers to consume the entire sell orders of the whales. However, it did bring a sudden drop to the Bitcoin prices, but the impact is relatively lesser than smaller markets.

Price Suppression

As mentioned in the previous example, the Whales use their powers to create waves to make strategic lows so that they can buy the cryptocurrency at great discounts. They use this strategy repeatedly, placing orders at low prices, wait for the price to drop, remove their sell order, and buy for the reduced price. For example, the NEO coin with a very small market cap fell from $37 to $4 in just one day. And the responsible ones were none other than the waves.

On the contrary, there price pumping, where the whales, instead of placing sell orders, place enormous buy orders to inflate the market higher. When the prices appreciate all of a sudden, they get off with their buy orders and prepare to take short positions.

Conclusion

A sudden appreciation or depreciation in the prices can not only cause by Whales but other factors as well. This becomes difficult for traders to predict if the sudden rise and fall are real or not. Unfortunately, such activities cannot be put to a stop until the market-cap of cryptocurrency grows to the extent that such manipulations cannot be played.

Categories
Forex Fundamental Analysis

The Impact Of ‘Personal Saving’ News Release On The Forex Price Charts

Introduction

Personal Saving is one of the main components of Personal Income. Savings can give us hints on Consumer Spending patterns and future sentiments concerning financial matters. Personal Spending and Personal Savings are two primary sections into which the Disposable Personal Income divides, and the proportion of these two helps us ascertain short-term and long-term economic activity. Hence, understanding Personal Savings and Personal Savings Rate reports can help us solidify our understanding of fundamental analysis.

What is Personal Saving?

Personal Saving is the difference between Disposable Personal Income and Personal Outlays.

Disposable Personal Income (DPI), also called After-Tax Income, is the remainder of an individual’s income after all federal tax deductions. Hence, It is the amount people can spend, save, or invest.

Personal Outlays, or Personal Spending, refers to all the expenditures incurred to conduct one’s lifestyle, like rent, internet, fuel, transportation, groceries, etc.

For example, If an individual earns 100,000 dollars per year and his tax-deductible is 30%. His DPI is 70,000 dollars. If his year around expenses amount to 63,000 dollars, then the Personal Savings would be 7,000 dollars. Here, the Personal Saving rate would be 10%. Personal Savings would be the amount left after all the expenses have been deducted from the available income.

Personal Savings Rate (PSR) is the ratio of Personal Saving to the Disposable Personal Income expressed as a percentage.

Marginal Propensity to Save (MPS): It is one more metric used to assess Saving, which is defined as the ratio of the amount saved for each additional dollar. If a person got 100 dollars extra as a bonus this month, and if he spends 60 dollars of it and saves 40 dollars, then his MPS would be 0.4 (40/100). His general savings saw an increase of 40 dollars, and his disposable income saw an increase of 100 dollars. Hence, MPS considers the change in savings to change in income rather than the actual Saving.

Factors That Affect Personal Saving

DPI: An increase in Disposable Personal Income generally translates to increased savings once the necessities are met. Low levels of DPI mean that the majority of the available income is spent on Personal Expenditures leaving little room for saving. Personal Saving has been affected by variations in household net worth, consumer debt, and housing investment. In 2008 and 2009, during the most recent recession, the personal saving rate increased by about two percentage points each year, reaching 5.9 percent in 2009.

Economic Stability: Unstable economic conditions and frequent recessionary periods induce higher saving patterns in the general public as they cut back on their expenses to save for future rainy days. A growing and healthy economy see a stable saving rate and an increase in personal consumption, as people spend more when they have a positive sentiment towards their future financial security.

Deposit Rates: Banks pay interest to depositors for their deposited money. Higher interest rates can attract the general public to save money overspending as it would generate more money for future consumption.

Individual preference: How people traditionally see debt, mortgages, and savings also determines people’s saving and spending patterns. Generally, people from unstable economic regions or developing economies tend to save more than people who have always been in a stable economy. For example, the China saving rate is 35%, while that of America is around 8%. This cultural backdrop also plays a role in people’s tendency to save and spend. The proportion of different people within the economy will determine the direction of Personal Saving Rates.

How can Personal Saving numbers be used for analysis?

Changes in the saving rate are inversely related to changes in household net worth (i.e., cost of a house) as a percentage of DPI. The ratio of household net worth to DPI typically rises during periods in which household real estate and financial assets are appreciating and falls when these assets are losing value. As household assets appreciate, incentives to save from current income are lessened, while incentives to save are increased during periods of falling asset values.

An increase in Personal Savings is good for banks as they can give out more loans in one aspect and hence is good in the long run for the economy. But, in the short term, it implies expenses are cut back, which means businesses will see a slowdown, and that is not good either. An optimal balance between Spending and Saving has to be struck for sustained growth.

Personal Savings usually see an increase during economic shocks and recessionary periods. Hence a significant spike in Saving Rate can be considered as an indicator of an ongoing financial contractionary period.

Personal Savings numbers simply would be a function of growing population and inflation. If the economy improves, so does the Personal Savings. For example, saving 100 dollars ten years back and now are two different things. We have to take inflation and increase in wages into account. Personal Saving Rate is more accurate in this regard as it is proportional. This is illustrated clearly in the below graphs of PS and PSR, respectively.

Hence, PSR is more prevalent amongst economists and investors for analysis. Also, Marginal Propensity to Save is higher for wealthier people than for poorer people. Hence, MPS can also be used to understand what is the standard of living and wealth the general public is enjoying, which reflects the strength and wealth of the overall economy itself.

Impact on Currency

As such, there is no direct one-to-one indication of Personal Savings figure to GDP, but there is a pattern here, during deflationary conditions when the currency value depreciates there is an upward spike in Personal Savings figures. In this sense, it is an inverse indicator and has a mild-to-low impact on the currency market. Economic shocks can also increase the Personal Savings figure.

Due to the long-term nature of the figures themselves, the currency volatility is low around these numbers compared to other macroeconomic indicators. Still, they are useful in understanding the long-term direction of the economy.

Economic Reports

The United States Commerce –  Bureau of Economic Analysis releases Personal Saving as part of the monthly report titled “Personal Income and Outlays.”

BEA releases the report in the last week of the month for the previous month. Quarterly and Annual reports, Seasonally adjusted versions of the same, along with Personal Saving Rate Reports, are all available under this release.

Unlike the PCE (Personal Consumption Expenditure) report, the Personal Saving figures are not expressed in percentages. Instead, the Personal Saving Rates is more popular, which is a percentage metric.

Sources of Personal Saving

The monthly Personal Saving numbers releases can be found on the official website of the Bureau of Economic Analysis under the “Current Release” section. This data can be found here – Consumer Spending – BEA. The Personal Saving Rate report can be found here.

Historical and Graphical comparisons are available on the St. Louis FRED website. Visit these pages to access this information. Personal Savings – FREDPSR – FRED.

Personal Savings date for countries other than the USA can be found here.

Impact of the ‘Personal Saving’ news release on the price charts 

The Personal Savings Rate is a big determinant of economic activity. The savings of an individual are directly related to consumer spending, which accounts for 63% of GDP. Higher savings can generate higher levels of investments and boost productivity over the longer term. The Harrod-Domar model of economic growth suggests that the level of Personal Savings is a key factor in determining growth. This has an effect on the value of the currency, and traders have a short to long term view on the currency based on the Personal Savings data. Today we will be analyzing the fourth quarter Personal Savings data of Australia that was released on the following date.

The below image shows the latest and previous Personal Savings data, where it was decreased to 3.6% percent in the fourth quarter of 2019 from 4.8% percent in the third quarter of 2019. A higher than expected reading is considered to be bullish for the currency while a lower than expected reading is considered to be bearish.

AUD/JPY | Before The Announcement

The first pair we will be examining is the AUD/JPY currency pair, and as we can see in the above image, the price has shown signs of reversal and might be going lower. Just before the announcement, the market has retraced the recent down move and is somewhere near the support turned resistance area. Technically, this is the ideal situation for going ‘short’ in the market, but it is wise to do so after we get confirmation from the market.

 AUD/JPY | After The Announcement

After the Personal Saving numbers are announced, there is a sudden surge in volatility where the price the initially moves higher, but this gets immediately sold into, and the ‘news candle’ leaves a large wick on the top. When traders found the Personal Savings to be lower than last time, they sold Australian dollars and weakened the currency. This happened as the news was not healthy for the Australian economy. Once the volatility increases to the downside, one can go ‘short’ in the pair with a stop loss above the ‘news candle’ and a ‘take-profit‘ near the ‘support’ area.

EUR/AUD | Before The Announcement 

EUR/AUD | After The Announcement

The above images are that of the EUR/AUD currency pair, and since the Australian dollar is on the right-hand side, a down-trending market, as in this case, indicates strength in the currency. After the big move to the downside, the market has started moving in a range and volatility appears to be high on both sides. Just before the news release, price is at the bottom of the range, known as ‘support,’ and from here, we can expect some buying force, which can take the market higher.

But as there is news release in the next few minutes, it can bring a drastic change in volatility, and we cannot predict where the market will go. After the announcement is made, we see a similar reaction from the market as in the above pair, and the ‘news candle’ leaves a wick on the bottom. We find that the Personal Savings was lower than last time and poor. This is why we see some buying interest in the market from the support, and thus we can go ‘long’ in the market with a stringent ‘take-profit’ near the resistance.

NZD/USD | Before The Announcement


NZD/USD | After The Announcement

These images represent the AUD/USD currency pair, where we see that the market is in a strong uptrend, and the Australian dollar is showing a lot of strength. Before the Personal Savings numbers are announced, price is above the moving average, and the uptrend is very much in place. As we do not have any forecasted data available with us, we cannot take any position in the prior to the announcement. We need to notice the change in volatility and then take suitable in the market.

After the Personal Savings data is announced, the market falls owing to poor Personal Spending data, and we see some selling pressure. But since the price does fall drastically and we do not see any trend reversal patterns, going ‘short’ in this pair is ruled out. Thus, the news announcement does not have a major impact on this pair as the uptrend is very strong.

This completes our discussion on the fundamental indicator ‘Personal Spending’ and the impact of its news release on the Forex market. If you have any questions, please let us know in the comments below. Cheers.

Categories
Forex Market Analysis

Daily F.X. Analysis, April 29 – Top Trade Setups In Forex – Eyes on FOMC & U.S. GDP Today! 

On the forex front, the ICE U.S. Dollar Index slipped 0.1% on the day to 99.96 on Tuesday, as investors awaited U.S. first-quarter GDP data and the Federal Reserve’s interest rates decision due later today. The U.S. Federal Reserve will announce its interest rate decision (hold at 0.00% – 0.25% expected). The European Commission will post the Eurozone’s April Economic Confidence Index (73.1 expected).

Moreover, the European Central Bank will report the Eurozone’s M3 money supply in March (+5.5% on-year expected).

Economic Events to Watch Today     


EUR/USD – Daily Analysis

Today in the early Asian session, the EUR/USD currency pair erasing yesterday’s losses and crossed above key support at 1.0809 while representing a 0.27% gains on the day mainly due to the broad-based U.S. dollar weakness in the wake of risk-on market sentiment. 

The better mood in the risk market supports the shared currency. At the time of writing, the EUR/USD currency pair is currently trading at 1.0847 and consolidates in the range between the 1.0818 – 1.0855. However, the traders are cautious about placing nay strong position ahead of the all-important Federal Reserve (Fed) rate decision. 

At the USD front, the dollar index’s (DXY) bounce from the 13-day low of 99.45 reached during Tuesday’s American trading hours, and it ran out of steam near 99.90 early on Wednesday. It’s mostly because both the S&P 500 futures and Asian stocks climbed, as in result greenback is losing its haven demand. 

The greenback dropped to multi-week lows against the JPY currency and faced notable declines against the Aussie dollar and the New Zealand dollar mainly due to the better sentiments in the risk market. However, the reason behind the renewed risk-on market sentiment could be the lack of negative updates related to coronavirus. The slight stability in the oil market also keeps the market calm.

Later today, the U.S. Federal Reserve will announce its interest rate decision (hold at 0.00% – 0.25% expected). The U.S. Commerce Department will post 1Q annualized GDP (-4.0% on quarter). The National Association of Realtors will publish pending home sales for March (-13.6% on month expected).

Daily Support and Resistance

  • S1 1.0682
  • S2 1.0761
  • S3 1.0792

Pivot Point 1.084

  • R1 1.087
  • R2 1.0919
  • R3 1.0998

EUR/USD– Trading Tips

The EUR/USD is trading bullish at 1.0868 as the U.S. dollar seems to face bearish pressure ahead of Fed fund rate decision. On the higher side, the EUR/USD has the potential to go after 1.0882, and bullish breakout of this level may drive EUR/USD prices further higher until the next resistance level of 1.0960. The overall trading bias continues to be bullish, especially after the bullish crossover of 50 EMA and MACD. Both of the leading indicators are supporting bullish trend with immediate support around 1.0814. We should consider taking buying trades above 1.0840 today. 

GBP/USD – Daily Analysis

During Wednesday’s Asian session, the GBP/USD currency pair flashing green and taking bids near the 1.2475 while representing 0.40% gains on the day mainly due to broad-based U.S. dollar fresh weakness in the wake of renewed risk-on sentiment in the market. The currency pair erased Tuesday’s losses, which were caused by doubt regarding the U.K. government’s coronavirus (COVID-19) figures. 

Currently, the GBP/USD is trading at 1.2475 and consolidates in the range between the 1.2423 – 1.2486. However, the pre-FOMC and US GDP sentiments are boosting the currency pair’s strength.

On Tuesday, the official death toll of 552 shows further flattening of the virus curve in the U.K., while the update from the Office of National Statistics (ONS) indicates that the actual death toll in England to April 17 was 54% higher than the government released data report.

On the other hand, the U.S. dollar hit the multi-week lows against the JPY currency and suffered notable declines against the Aussie dollar and the New Zealand dollar mainly due to lack of its demand ahead of FOMC and U.S. GDP. The Dollar index’s (DXY) climbed from the 13-day low of 99.45 reached during Tuesday’s American trading hours ran out of steam near 99.90 early Wednesday, as the S&P 500 futures and Asian stocks rose, as in result greenback is losing its haven demand.

At the Brexit front, the report came that the discussions between the European Union (E.U.) and the U.K. regarding new trade arrangements from next year continue to postponed mainly due to disagreements and the coronavirus crisis. Besides this, the U.K.’s international trade secretary Liz Truss said that the E.U. is expected to stick under pressure and agree to a post-Brexit trade deal with the U.K.

Daily Support and Resistance

  • S1 1.2315
  • S2 1.2371
  • S3 1.24

Pivot Point 1.2427

  • R1 1.2456
  • R2 1.2483
  • R3 1.2539

GBP/USD– Trading Tip

The GBP/USD is exhibiting bullish bias around 1.2449 area, as it’s maintaining a fresh trading range of 1.2525 – 1.2396. On the 4 hour chart, the cable has also formed a bullish channel, which is supporting it around 1.2396 along with resistance around 1.2501. On the higher side, a bullish breakout of 1.2520 opens up further room for buying until 1.2560 and 1.2626 level. 

The GBP/USD pair is holding a buying zone, above 50 EMA, which is also supporting the cable around 1.2409. Since the MACD is holding above 0, we should look for buying trades in the GBP/USD pair. Let’s look for buying trades above 1.2410 and bearish trades below 1.2520 level today. 

USD/JPY – Daily Analysis

During the Asian session, the USD/JPY currency pair extended its 6-day losing streak and dropped to 106.41 while representing 41% declines on the day mainly due to broad-based U.S. dollar weakness in the wake of the risk-on market sentiment. However, the currency pair failed to cheer Japanese yen weakness and dropped to 6-weeks low. As of writing, the USD/JPY currency pair is currently trading at 106.44 and consolidates in the range between the 106.39 – 106.89. 

Whereas, the safe-haven demand for the U.S. dollar continues to lose due to the better mood in the equity market as hopes of re-opening of the economies in Australia, New Zealand, and parts of Europe boosting the market sentiment. Moreover, the dismal U.S. C.B. Consumer Confidence data, as well as the hopes of sharp U.S. economic contraction, keeps the U.S. dollar under pressure.

The currency pair continues to follow the broad-based U.S. dollar directions so far this week, with the latest stop in the dollar decline offering some support. The U.S. dollar index trades at 99.70 after hitting a daily low of 99.63.

The reason behind the risk-on market sentiment could also be the upbeat comments from the BOJ Governor. The Bank of Japan (BOJ) Governor Haruhiko Kuroda said on Tuesday that Japan’s financial system remains firm because a whole as bank groups have satisfactory capital buffers.

Daily Support and Resistance    

  • R3 108.1
  • R2 107.72
  • R1 107.3

Pivot Point 106.93

  • S1 106.51
  • S2 106.14
  • S3 105.72

USD/JPY – Trading Tips

On the technical front, the USD/JPY was facing solid support around 107, the round figure, but it got violated over increased demand for safe-haven yen. At the moment, the USD/JPY is facing strong resistance around 107, along with support at 106.500, but this support seems weaker, and we may see USD/JPY prices falling further until 106.240 later today. Looking at the leading indicators on the 4-hour timeframe, we may see USD/JPY prices are holding below 50 periods EMA, and at the same time, the MACD is also holding into a negative zone. Let’s look for selling trades below 106.800 today. 

All the best for today!