Introduction
Personal Saving is one of the main components of Personal Income. Savings can give us hints on Consumer Spending patterns and future sentiments concerning financial matters. Personal Spending and Personal Savings are two primary sections into which the Disposable Personal Income divides, and the proportion of these two helps us ascertain short-term and long-term economic activity. Hence, understanding Personal Savings and Personal Savings Rate reports can help us solidify our understanding of fundamental analysis.
What is Personal Saving?
Personal Saving is the difference between Disposable Personal Income and Personal Outlays.
Disposable Personal Income (DPI), also called After-Tax Income, is the remainder of an individual’s income after all federal tax deductions. Hence, It is the amount people can spend, save, or invest.
Personal Outlays, or Personal Spending, refers to all the expenditures incurred to conduct one’s lifestyle, like rent, internet, fuel, transportation, groceries, etc.
For example, If an individual earns 100,000 dollars per year and his tax-deductible is 30%. His DPI is 70,000 dollars. If his year around expenses amount to 63,000 dollars, then the Personal Savings would be 7,000 dollars. Here, the Personal Saving rate would be 10%. Personal Savings would be the amount left after all the expenses have been deducted from the available income.
Personal Savings Rate (PSR) is the ratio of Personal Saving to the Disposable Personal Income expressed as a percentage.
Marginal Propensity to Save (MPS): It is one more metric used to assess Saving, which is defined as the ratio of the amount saved for each additional dollar. If a person got 100 dollars extra as a bonus this month, and if he spends 60 dollars of it and saves 40 dollars, then his MPS would be 0.4 (40/100). His general savings saw an increase of 40 dollars, and his disposable income saw an increase of 100 dollars. Hence, MPS considers the change in savings to change in income rather than the actual Saving.
Factors That Affect Personal Saving
DPI: An increase in Disposable Personal Income generally translates to increased savings once the necessities are met. Low levels of DPI mean that the majority of the available income is spent on Personal Expenditures leaving little room for saving. Personal Saving has been affected by variations in household net worth, consumer debt, and housing investment. In 2008 and 2009, during the most recent recession, the personal saving rate increased by about two percentage points each year, reaching 5.9 percent in 2009.
Economic Stability: Unstable economic conditions and frequent recessionary periods induce higher saving patterns in the general public as they cut back on their expenses to save for future rainy days. A growing and healthy economy see a stable saving rate and an increase in personal consumption, as people spend more when they have a positive sentiment towards their future financial security.
Deposit Rates: Banks pay interest to depositors for their deposited money. Higher interest rates can attract the general public to save money overspending as it would generate more money for future consumption.
Individual preference: How people traditionally see debt, mortgages, and savings also determines people’s saving and spending patterns. Generally, people from unstable economic regions or developing economies tend to save more than people who have always been in a stable economy. For example, the China saving rate is 35%, while that of America is around 8%. This cultural backdrop also plays a role in people’s tendency to save and spend. The proportion of different people within the economy will determine the direction of Personal Saving Rates.
How can Personal Saving numbers be used for analysis?
Changes in the saving rate are inversely related to changes in household net worth (i.e., cost of a house) as a percentage of DPI. The ratio of household net worth to DPI typically rises during periods in which household real estate and financial assets are appreciating and falls when these assets are losing value. As household assets appreciate, incentives to save from current income are lessened, while incentives to save are increased during periods of falling asset values.
An increase in Personal Savings is good for banks as they can give out more loans in one aspect and hence is good in the long run for the economy. But, in the short term, it implies expenses are cut back, which means businesses will see a slowdown, and that is not good either. An optimal balance between Spending and Saving has to be struck for sustained growth.
Personal Savings usually see an increase during economic shocks and recessionary periods. Hence a significant spike in Saving Rate can be considered as an indicator of an ongoing financial contractionary period.
Personal Savings numbers simply would be a function of growing population and inflation. If the economy improves, so does the Personal Savings. For example, saving 100 dollars ten years back and now are two different things. We have to take inflation and increase in wages into account. Personal Saving Rate is more accurate in this regard as it is proportional. This is illustrated clearly in the below graphs of PS and PSR, respectively.
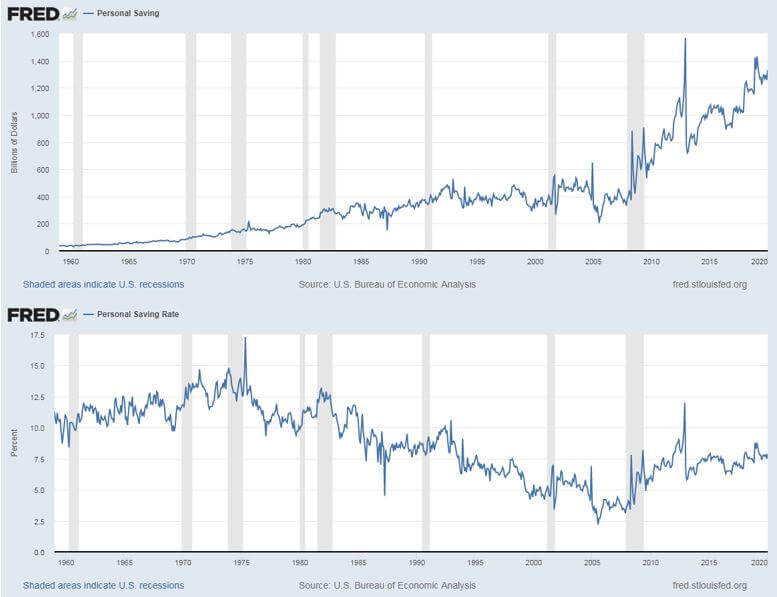
Hence, PSR is more prevalent amongst economists and investors for analysis. Also, Marginal Propensity to Save is higher for wealthier people than for poorer people. Hence, MPS can also be used to understand what is the standard of living and wealth the general public is enjoying, which reflects the strength and wealth of the overall economy itself.
Impact on Currency
As such, there is no direct one-to-one indication of Personal Savings figure to GDP, but there is a pattern here, during deflationary conditions when the currency value depreciates there is an upward spike in Personal Savings figures. In this sense, it is an inverse indicator and has a mild-to-low impact on the currency market. Economic shocks can also increase the Personal Savings figure.
Due to the long-term nature of the figures themselves, the currency volatility is low around these numbers compared to other macroeconomic indicators. Still, they are useful in understanding the long-term direction of the economy.
Economic Reports
The United States Commerce – Bureau of Economic Analysis releases Personal Saving as part of the monthly report titled “Personal Income and Outlays.”
BEA releases the report in the last week of the month for the previous month. Quarterly and Annual reports, Seasonally adjusted versions of the same, along with Personal Saving Rate Reports, are all available under this release.
Unlike the PCE (Personal Consumption Expenditure) report, the Personal Saving figures are not expressed in percentages. Instead, the Personal Saving Rates is more popular, which is a percentage metric.
Sources of Personal Saving
The monthly Personal Saving numbers releases can be found on the official website of the Bureau of Economic Analysis under the “Current Release” section. This data can be found here – Consumer Spending – BEA. The Personal Saving Rate report can be found here.
Historical and Graphical comparisons are available on the St. Louis FRED website. Visit these pages to access this information. Personal Savings – FRED & PSR – FRED.
Personal Savings date for countries other than the USA can be found here.
Impact of the ‘Personal Saving’ news release on the price charts
The Personal Savings Rate is a big determinant of economic activity. The savings of an individual are directly related to consumer spending, which accounts for 63% of GDP. Higher savings can generate higher levels of investments and boost productivity over the longer term. The Harrod-Domar model of economic growth suggests that the level of Personal Savings is a key factor in determining growth. This has an effect on the value of the currency, and traders have a short to long term view on the currency based on the Personal Savings data. Today we will be analyzing the fourth quarter Personal Savings data of Australia that was released on the following date.
![]()
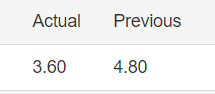
The below image shows the latest and previous Personal Savings data, where it was decreased to 3.6% percent in the fourth quarter of 2019 from 4.8% percent in the third quarter of 2019. A higher than expected reading is considered to be bullish for the currency while a lower than expected reading is considered to be bearish.
AUD/JPY | Before The Announcement
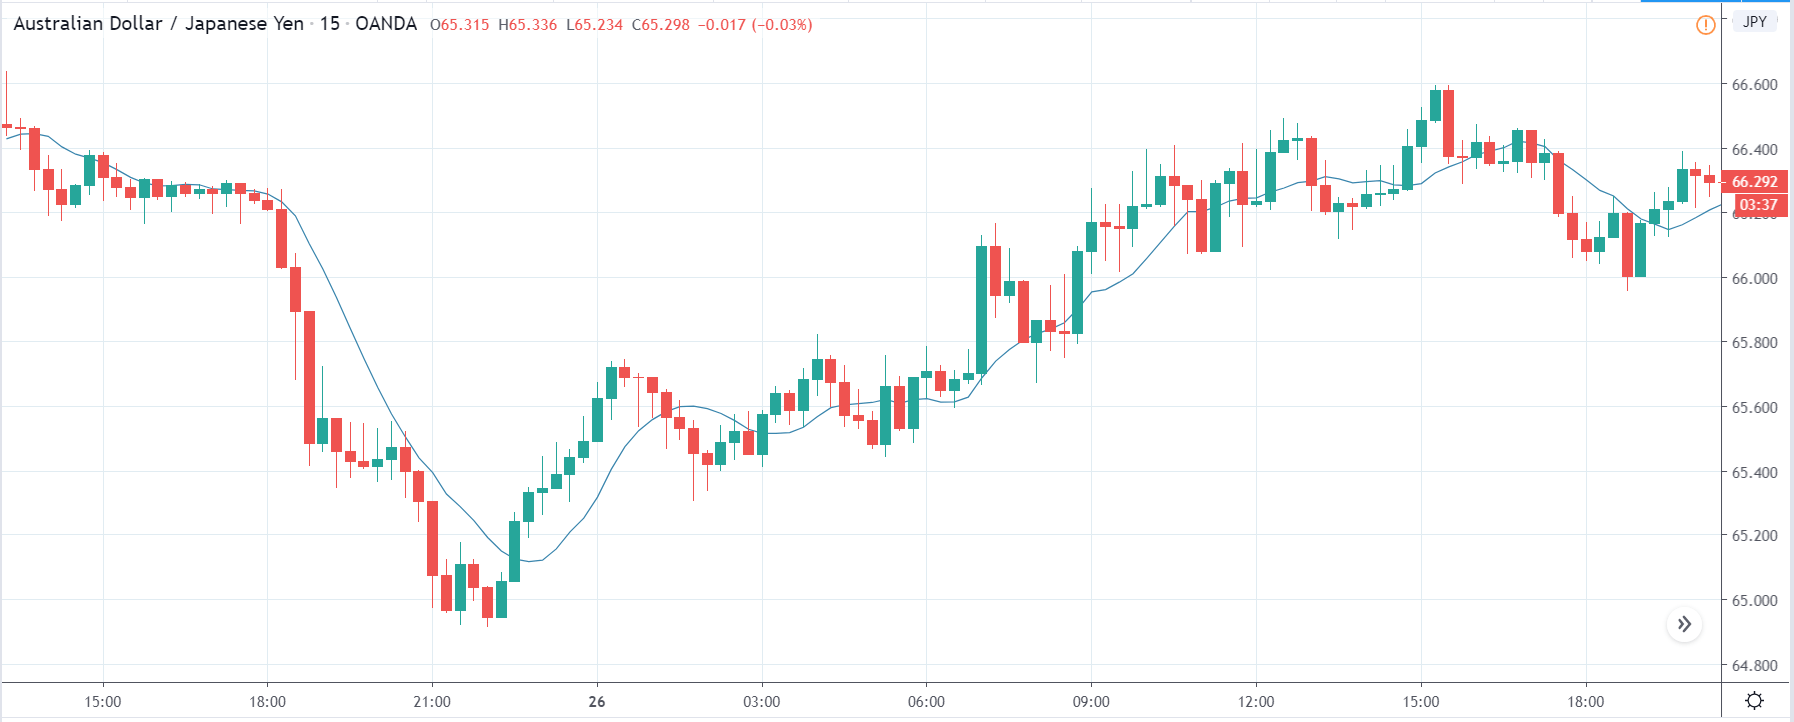
The first pair we will be examining is the AUD/JPY currency pair, and as we can see in the above image, the price has shown signs of reversal and might be going lower. Just before the announcement, the market has retraced the recent down move and is somewhere near the support turned resistance area. Technically, this is the ideal situation for going ‘short’ in the market, but it is wise to do so after we get confirmation from the market.
AUD/JPY | After The Announcement
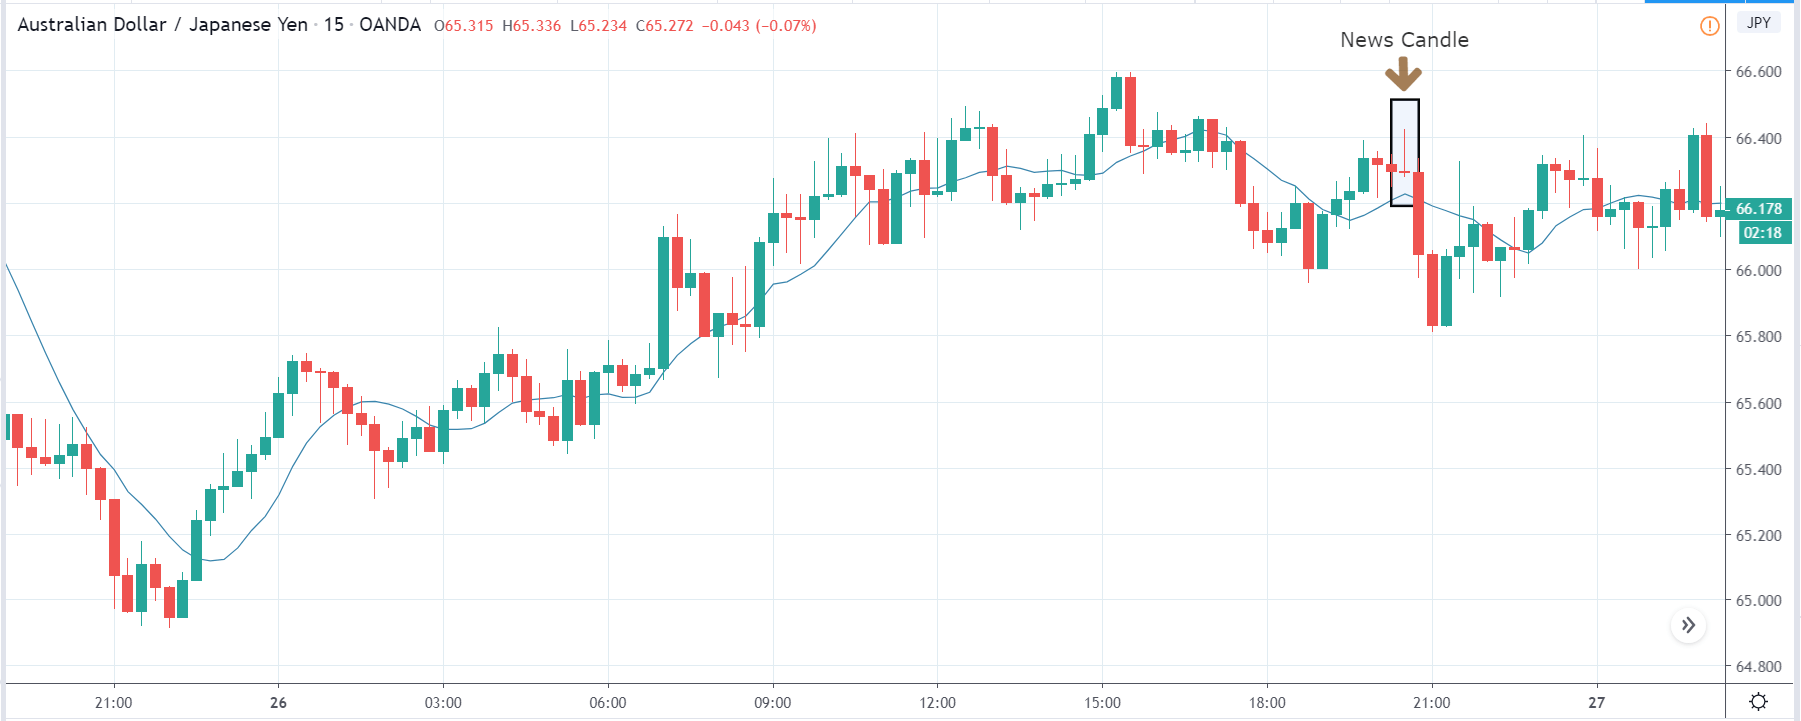
After the Personal Saving numbers are announced, there is a sudden surge in volatility where the price the initially moves higher, but this gets immediately sold into, and the ‘news candle’ leaves a large wick on the top. When traders found the Personal Savings to be lower than last time, they sold Australian dollars and weakened the currency. This happened as the news was not healthy for the Australian economy. Once the volatility increases to the downside, one can go ‘short’ in the pair with a stop loss above the ‘news candle’ and a ‘take-profit‘ near the ‘support’ area.
EUR/AUD | Before The Announcement
EUR/AUD | After The Announcement
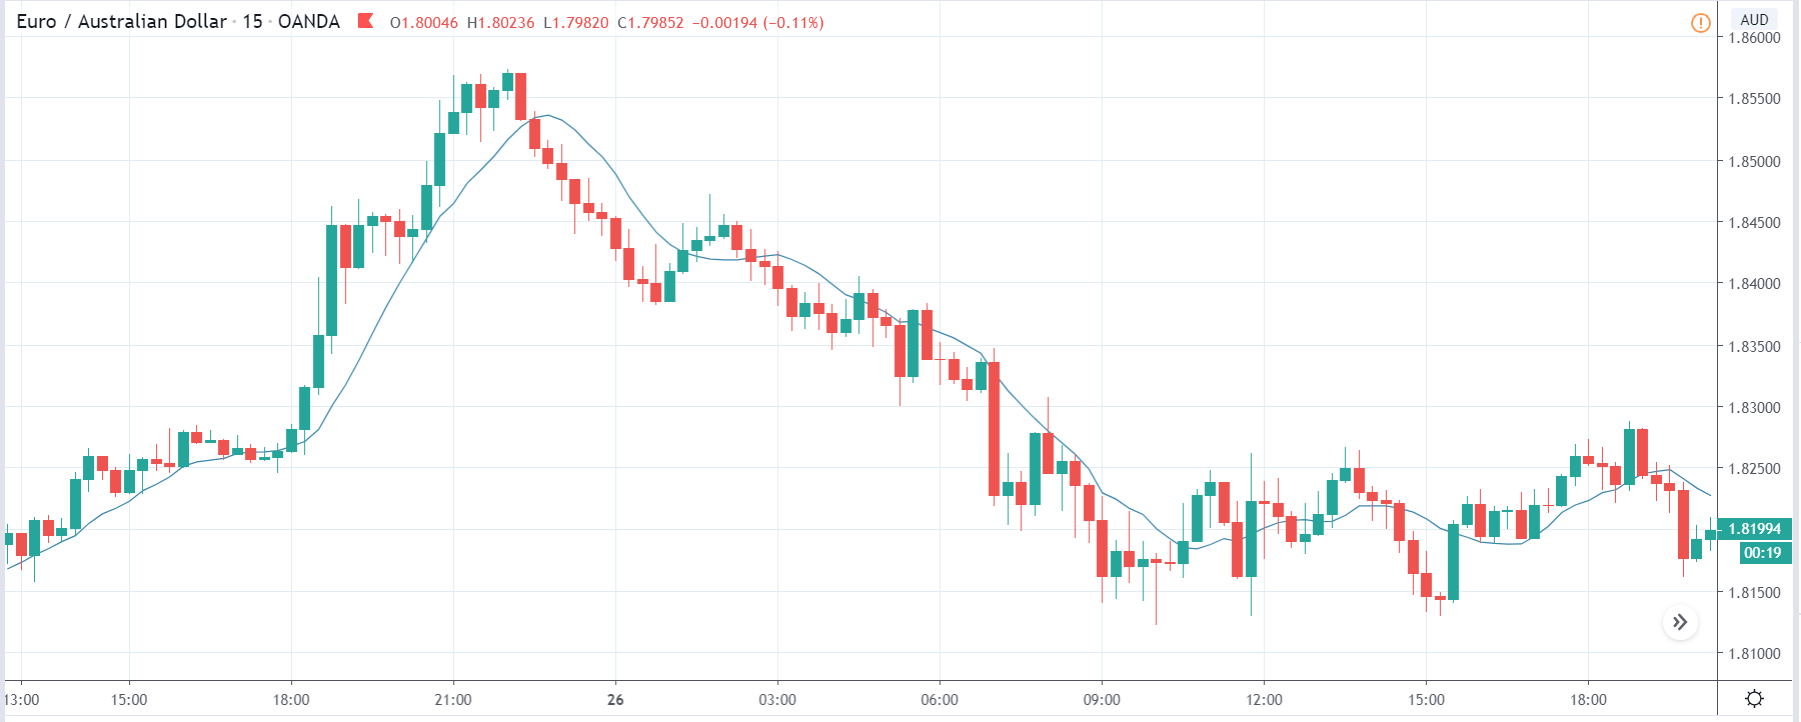
The above images are that of the EUR/AUD currency pair, and since the Australian dollar is on the right-hand side, a down-trending market, as in this case, indicates strength in the currency. After the big move to the downside, the market has started moving in a range and volatility appears to be high on both sides. Just before the news release, price is at the bottom of the range, known as ‘support,’ and from here, we can expect some buying force, which can take the market higher.
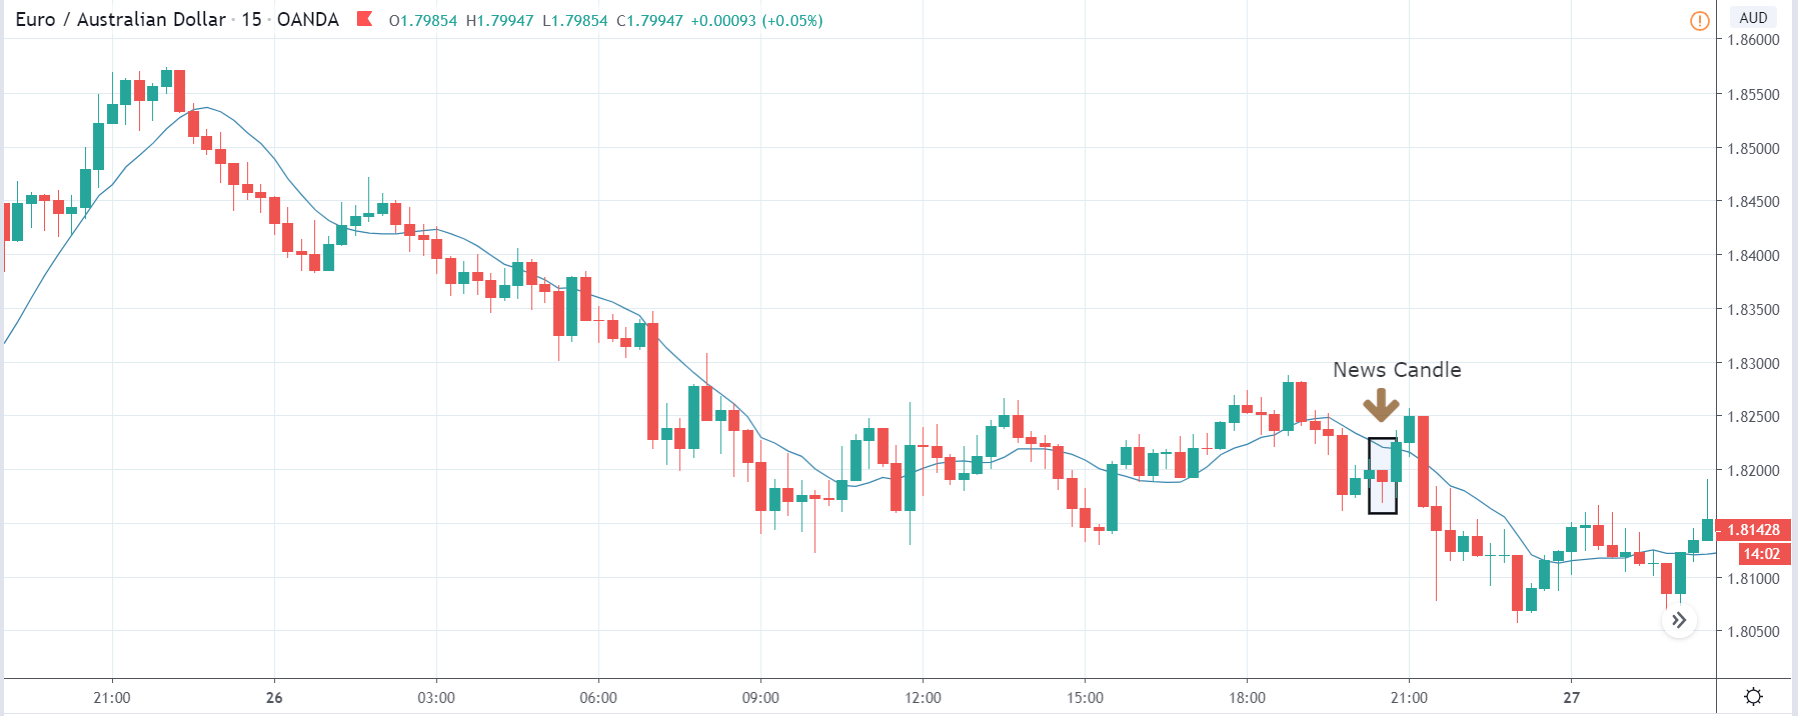
But as there is news release in the next few minutes, it can bring a drastic change in volatility, and we cannot predict where the market will go. After the announcement is made, we see a similar reaction from the market as in the above pair, and the ‘news candle’ leaves a wick on the bottom. We find that the Personal Savings was lower than last time and poor. This is why we see some buying interest in the market from the support, and thus we can go ‘long’ in the market with a stringent ‘take-profit’ near the resistance.
NZD/USD | Before The Announcement
NZD/USD | After The Announcement
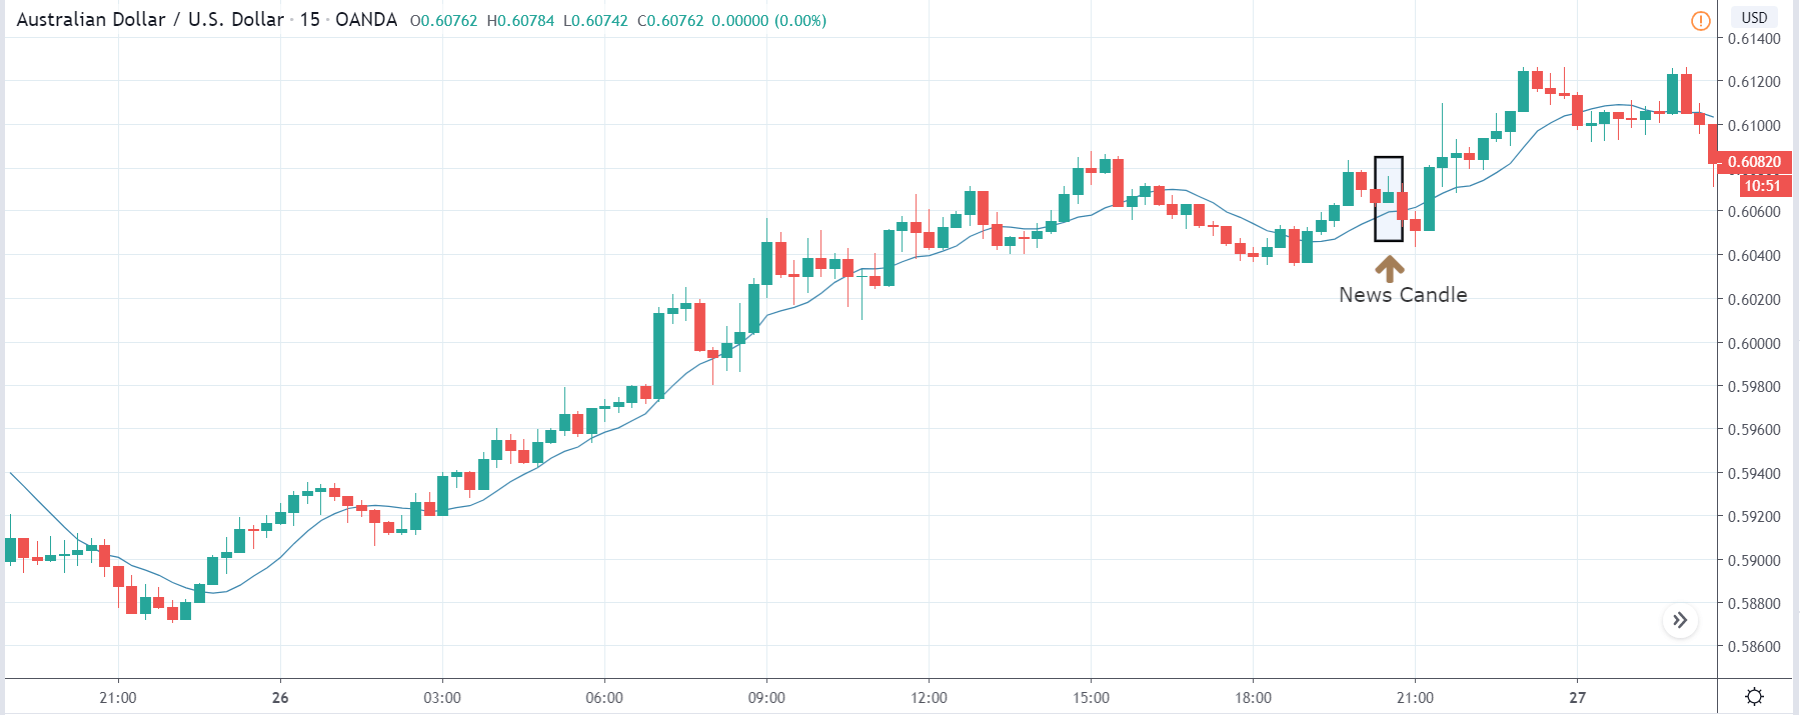
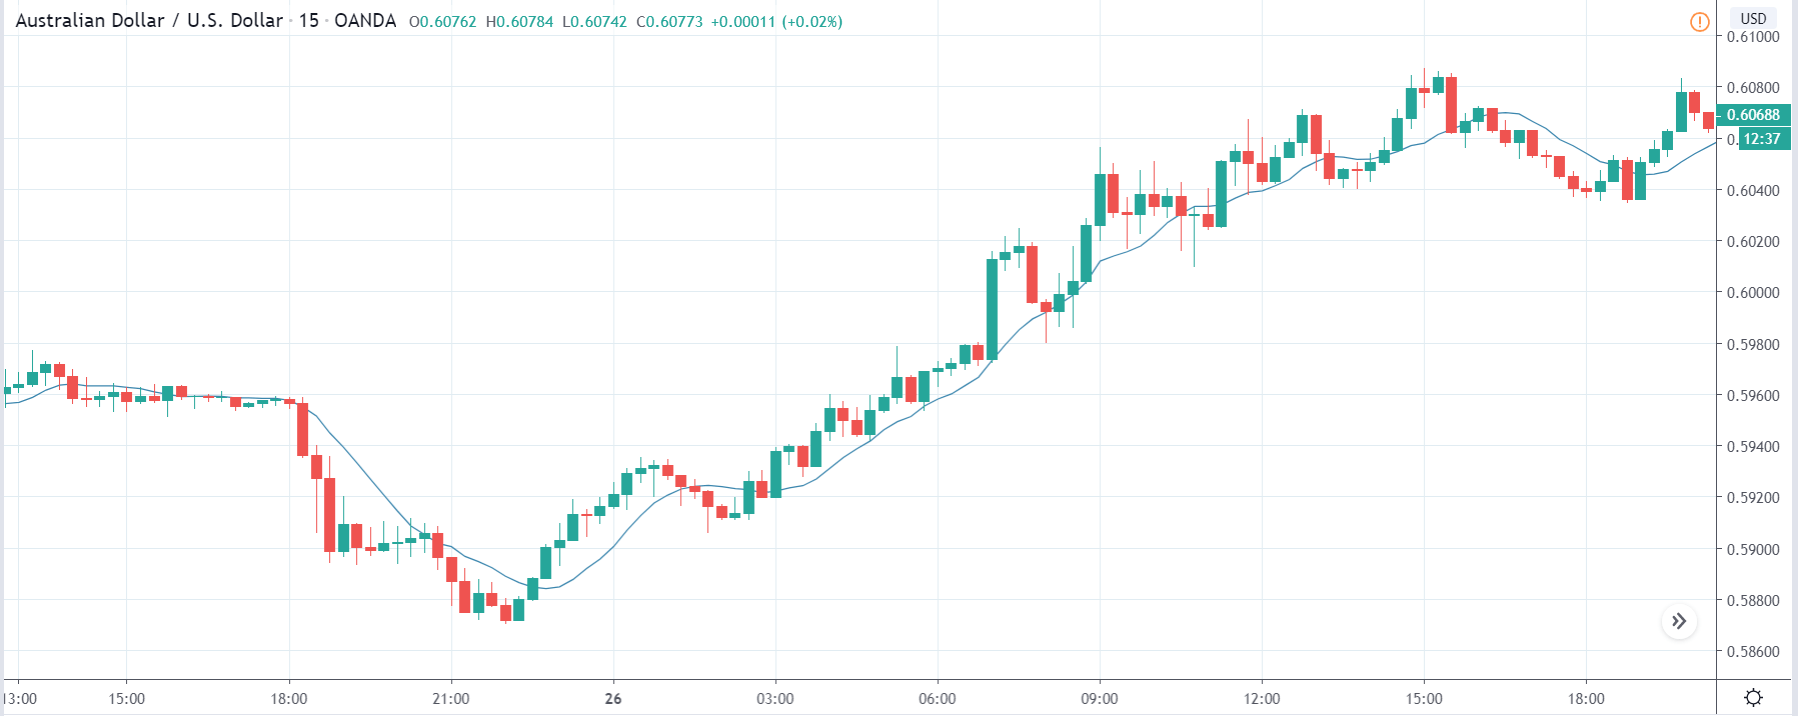
These images represent the AUD/USD currency pair, where we see that the market is in a strong uptrend, and the Australian dollar is showing a lot of strength. Before the Personal Savings numbers are announced, price is above the moving average, and the uptrend is very much in place. As we do not have any forecasted data available with us, we cannot take any position in the prior to the announcement. We need to notice the change in volatility and then take suitable in the market.
After the Personal Savings data is announced, the market falls owing to poor Personal Spending data, and we see some selling pressure. But since the price does fall drastically and we do not see any trend reversal patterns, going ‘short’ in this pair is ruled out. Thus, the news announcement does not have a major impact on this pair as the uptrend is very strong.
This completes our discussion on the fundamental indicator ‘Personal Spending’ and the impact of its news release on the Forex market. If you have any questions, please let us know in the comments below. Cheers.