Categories
Beginners Forex Education Forex Basics

Comprehensive List of FREE Forex Resources

Education about forex should be free according to some mentors but you will find most of the online content has a price tag, some even reaching triple-digit numbers. If we compare the educational value, free resources are not always basic in scope and depth, on contrary, what you find on forums, social media channels, and portals are much better than any class you may have about forex you paid for, including the one you may get out of universities. Simply, you will face practical problems, ideas, and solutions people have when trading, with all the varieties you can think of and the ones you cannot think of.

Luckily, we now live in an age where information is widely available; however, it is not always reliable, truthful, or without any background marketing intent. The Internet is flooded with dishonest intent presented as the right source for your queries. This problem is so dominant it is not easy to recognize what is an ad or a sales funnel page from what might be matching your interest. Whatmore, the content you are after might not point you in the right direction. 

This list of free resources comes from personal experience by prop traders and suggestions smart and successful traders have made, but now listed progressively on how one’s interest and knowledge grows, from a beginner trader to a pro. We will start with a basic understanding of forex and how one can trade and then explore topics that will define you as a trader. Forex crates unlimited variations of how one can become successful and each professional trader has its special way to the top. 

  1. When you think or hear about forex trading it is logical to start with the basics. How to trade, principles, terms, and topics. The best source for this is free at babypips.com. The content is fun and easy to consume, and will get you inspired and motivated to get going. Now, understand that some of the content may guide to indicators and strategies professional traders do not use, so keep yourself open to find out more before you adopt anything on babypips.com as ready to roll, especially what you learn in later classes. Their forums section could also be useful for anything you might be interested in additionally. 
  2. Invetopedia.com is our second stop on the list. Their content is dressed up in a banker’s suit although you will add on to the babypips.com knowledge to the point you might even become interested in other investing ways. Completing everything they have is a very demanding task however you could probably beat many experts in a quiz after finishing. In the simulator you can practice your investing strategies but do not stay for long, you are in for a much longer and interesting journey. 
  3. Time to get into forex talk, next stop is forexfactory.com. More specifically the Rookie Talk thread in the Forums section of the site. Forexfactory is the most popular portal for traders. You can meet legendary traders and coders, their topics, strategies, Expert Advisors, ideas and so much more you might feel lost. If you are into forex, it is like a candy store without limits. Since you are just starting and fresh out of babypips.com free course, the rookie thread might be repetitive for you. In that case, move into more advanced topics and make your account. You will likely feel at home here once you start trading. Forexfactory is your source for basically everything, although orientation and organization might be lacking. 

Now you probably understand how wide and deep forex trading is. You have seen some strategies, some indicators, you follow some ideas and you are into politics, events, charts, and fundamentals. It is time to open your first demo account where you can shape your first trading systems. 

  1. One of the most popular trading platforms is Metatrader 4, while MetaTrader 5 is slowly picking up where version 4 left. Most brokers that offer demo accounts also support MetaTrader clients where you can insert custom indicators and strategy templates you found on Forex Factory or elsewhere. This platform is probably the best place to practice your skills since it offers so much customization. This said, your next stop could be their website, metaquotes.com. 
  2. However, an important clue about the brokers and their quality comes from the Forex Peace Army website. Here you will learn what makes a good broker and the most reliable broker ratings. The portal does not stop there and allows you to really see how big the rabbit hole is in the brokerage industry. 

After spending some time you may find you need some guidance, some traders ascend alone, however, most professionals had a mentor at some point, champions had one at an early age. Real mentorship is not free unless you are getting one from your family, but we are talking about free online resources here. Time to turn to the best alternatives. 

  1. Youtube! Of course, this portal is full of amateurism and marketing you are probably skipping with ease by now, but diamonds in the rough exist. One such channel is from VP, a professional trade that shares his way of trading is a very careful and meticulous way. The most important aspects and barriers a trader can experience are covered here. His blog and channel go by the name of “no-nonsense forex”
  2. Tweeter. Follow like-minded people that align with your trading philosophy but also try to follow other trading ways, you never know what goodies you might steal. @FXCM_MarketData channel is great to stay informative, tweeter has a nice feature to offer you useful and related profiles. 

Once you become skilled you might want specialized forums and market information. Such sources are hard to find but we found some readers might enjoy it.

  1. Forex-station.com. An amazing resource for indicators, strategies, and coding help. One of the most interesting aspects of this forum is the fact many of the indicators and strategies are free, updated, and customized to impressive levels. Each indicator type has its own thread where you can find a plethora of variations pimped up with alerts, multi-timeframe options, filters, price calculations options, and more. If you have favorite indicators, you will likely find their ultimate version here. 
  2. www.stevehopwoodforex.com is a closed type forum that is carefully moderated so only quality content can be found with minimal redundancy. All information is carefully catered to a trader, be it a beginner or experienced. The founder of the forum is also a host for the HGI system. Also, the EA section is very rich with hard to find resources. 
  3. If you nerd out you might be interested in this gem – zorro-trader.com. This is a special kind of platform that can take your trading to whole new levels. Let’s just say it is for hardcore market analysts also adept at coding. 
Categories
Beginners Forex Education Forex Basics

How to Trade Your Way from $10,000 to $1 Million

Forex opens and an incredible array of possibilities of how you can get your target million. Therefore, there is no single answer. More importantly, the answer you may get might not be adequate to your character, and the way you approach forex trading. Beginner traders asking this question fall into the first and probably the most dangerous trap called “getting rich quick”. This desire in young traders is overwhelming, aligning with the temperament that only spells failure in forex trading, unfortunately. Getting rich quickly in forex is plausible, forex is a game of probabilities, and is also a mechanism where higher risk brings higher reward and vice versa. However, not all risks are justified, some things are just worth trying while others border with stupidity. 

If getting rich quick is what you want to make out of forex, there are some ways of doing it that are better than having any plan at all. So, the key is having a plan. A plan that will increase your odds however abysmal they might be when you are after that $1million during a very short time. At this point, forex trading is more like buying lottery tickets worth $10.000 – scoring the jackpot probability is still way under 0.1% in most major lotteries. There has to be a better way right? Well, increasing the odds is an everlasting quest of a forex trader, do it meticulously, and finding ways to get “lucky” will be opening up in front of you. Instead of presenting how percentages and compounding works, let’s get into a few basic examples to get things into perspective, just note the following ways are not recommended. 

Assuming you are hyped and do not want to spend time learning how to trade like professionals, try to search for a good forex robot. This process might take a few weeks but it is still better than going all-in without any clue where. Try to find good reviews about the robot with a high win rate on a single, specialized asset they run best on since you will need consecutive wins over a short time. Forex robots or Expert Advisors for MetaTrader platforms are numerous, some are free. A higher price for a robot does not mean they are better, just try to find one with good ratings, results, and reviews (be aware of fake reviews). Pay attention to the leverage, how much is put into every trade, and set everything to your $1 million goal time frame. All you have to do is let it run, watch, and hope. By the way, some brokers might be hesitant to pay you out and will probably try to find anything to discredit your incredible gains, but this is another topic. 

Our second do-not-do-it example of how to get rich quick is trading high-risk forex events. Such events are global and deep, like elections or recent pandemic. The extreme moves they cause in a short period are your perfect playground to get that gain you need. Identify a trend that has started on a specific asset, for example, the S&P 500 index or the USD currency pairs where big moves are expected. Now, you need to set your position sizes and leverage to endure the drawdown you might experience as your tolerance for losses is extremely low with the way you are trading, even on an already established strong bear rally. By getting in a strong trend your odds of survival for the first candle (periods) are better than 50% and you also have a chance to win big as the trend continues for days, just know to set a trailing stop optimally. You might still need a few of these monster wins to get to that $1 million but at least you have better odds with a plan. Waiting for these opportunities might take some time, however, it still counts as getting rich quickly. 

The final example is popular and directed to another type of new-age currencies. You got it right – cryptocurrencies. There are several ways to fill your pockets in this market, but similarly to trading forex during extreme global events, you will need extreme mover assets. Splitting your $10.000 across several altcoins with a good perspective to get popular will get your portfolio skyrocketing. All you have to do is research what are good picks. This method applies diversification, meaning the likelihood of losing everything is low, especially if you pick more than 10 coins. Of course, your $1 million goal needs to wait for things to get going, yet if only one multiplies in the value we are talking about extreme gains, possibly above your targets. An example altcoin that changed investor’s lives is the Verge with a 1,581,942% peak gain, going from $0.000019 per coin to $0.300588 per coin from December 2016 to December 2017. Similar to what happened to Einsteinium and Reddcoin. So the odds are much better here than with lottery tickets, especially if you do some fundamental analysis about altcoins. Suddenly picking 100 altcoins and investing $10.000 in them does not sound like a bad idea, just know you will never know when it will happen (if it happens at all), so it may not be as quickly as you expect. 

Now, the recommended way to get rich is by devoting to the process of learning and experiencing forex trading. This path requires effort and not for getting rich quick-minded people. Professional traders sacrificed some time, a few years to get at the top of the game. They do not have extreme triple-digit returns over a year, but they are consistent. They switch high-risk returns for consistency that lasts for a lifetime. The two biggest pillars of trading are Psychology and Risk or Money Management. The analysis comes third after these most important aspects often overlooked by impatient traders. As with the above not recommended methods, start with a plan. Seek out beginner forex trading portals (such as babypips.com) to get the basic understanding of forex and then explore some more advanced topics such as strategies, indicators, trading systems, theories, and some forex psychology books. Improve your knowledge following financial websites and social media channels. Follow smart investors and traders on Twitter and try to find their channels on youtube or some other platform. Some of these figures are going to be appealing to you and your learning curve will get easier quickly, open your mind, and get motivated.

For some, a few years of demo trading and trying things out might be too long but reaching $1 million from $10k is what professional traders actually do consistently. Many spend decades just to try to live with $10k let alone become millionaires. What is great about forex trading is it does not force you to quit your daily, conventional jobs. It is as flexible as it is deep. You may become a purely technical trader, long term investor, crypto holder, but all successful traders have things in common, they all have a plan or system, structured risk management, and have mastered psychological trading aspects. Having a good plan is great, sticking to it is the psychology challenge most cannot overcome. However, with the internet, all the information available to you, all you have to do is dig up a bit and put that $10k to use, $1 million might be just a couple of years ahead.

Categories
Forex Elliott Wave Forex Market Analysis

Euphoric Market’s Sentiment Pushes GBPCHF Up

Overview

The GBPCHF cross began the current trading week, advancing over 1.30%, boosted by the U.S. post-election rally and Pfizer’s Covid vaccine upbeat results. However, the Elliott Wave view anticipates that the euphoric rally could soon end, and the cross could reverse its course toward new lows.

Market Sentiment

The week started with a risk-on U.S. Presidential post-election stock market rally, driving the risk-off currencies to drop. In this context, the GBPCHF cross advances over 1.30% to its highest level since late September.

The following 8-hour chart displays the intraday market sentiment. Although the sideways movement predominates since late September, the strong bullish move developed in the Monday trading session takes the GBPCHF cross to the extreme bullish sentiment zone.

Likewise, we can see the price action developing above the 60-period weighted moving average, which confirms the intraday upward bias that could hold during the following trading sessions.

On the other hand, the euphoric sentiment bolstered by news media’s coverage of the U.S. elections and the continuation of the stock market rally added to the news of the promising vaccine results developed by Pfizer and BioNTech leads us to expect a limited upside in the risk-on currencies.

Technical Overview

The big picture of the GBPCHF under the Elliott wave perspective reveals its progress in a descending broadening formation. Its latest downward sequence began on December 13th, 2019, when the price found fresh sellers at 1.33113. We can see, as well, that this leg still remains in progress.

The following daily chart unveils the advance in the fifth wave of Minute degree labeled in black, which started on 1.22224, where the price action declined in a bearish impulsive movement reaching a new lower low. This decline that ended on 1.15989 completed the first wave of Minuette degree labeled in blue.

Currently, the GBPCHF cross moves in its second wave (in blue). Nevertheless, the psychological barrier of 1.20 could represent a significative intraday resistance.

Technical Outlook

The intraday outlook of the GBPCHF cross reveals the bullish continuation of the current upward momentum. The next 2-hour chart exposes the supply and demand zones according to the potential next move that the cross could develop in the coming trading sessions.

On the one hand, the price advances in its wave c of Subminuette degree identified in green, developing the third internal wave. Likewise, the retracement that should correspond to its fourth internal wave could retrace to the area between 1.19292 and 1.19694. This zone could back the possibility of a new rally that would boost the price toward 1.21012 and 1.21306. 

On the other hand, our first scenario considers the bearish continuation. In this case, if the price action penetrates and closes below 1.1803, the cross could see further declines toward the zone of 1.1650.

Finally, our second scenario considers that if the GBPCHF cross continues its advance beyond 1.22224, the cross could extend its gains toward the descending upper- trendline shown in the daily chart.

Categories
Forex Fundamental Analysis

What Should You Know About ‘Mortgage Market Index’ Macro Economic Indicator

Introduction

In the recent past, the real estate market has been a critical indicator of economic performance. As with any other aspect of the financial market that intertwines with consumer demand, the significance of the mortgage market cannot be overstated. Knowing if mortgage applications have increased or reduced can tell a lot about the demand in the housing market and households’ welfare. This index can be a leading indicator of demand in the economy.

Understanding the Mortgage Market Index

Primarily, the mortgage market index tracks the number of mortgage applications over a specific period. In the US, for example, the mortgage market index is compiled by the US Mortgage Bankers Association (MBA). The MBA mortgage market index is released weekly. MBA has an association of about 2200 members encompassing the entire real estate financing industry. The companies included in the association are deal originators, compliance officers, deal underwriters, servicers, and information technology personnel. These companies are active in residential, multi-family, and commercial real estate.

Owing to its vast network of real estate companies across the country, MBA is in the best position to provide comprehensive coverage of the mortgage applications made. The published data shows both seasonally adjusted and unadjusted changes in the US’s number of mortgage applications. Furthermore, the report also includes the Refinance Index,  which shows the number of applications made by households wishing to refinance their mortgages. The report also includes seasonally adjusted and unadjusted ‘Purchase Index,’ which shows the number of outright purchases in the real estate sector during that week.

Furthermore, this weekly report analyses the change in the Adjustable-Rate Mortgage (ARM) applications. As the name suggests, the ARM is a mortgage in which the interest rate payable on the balance varies throughout its life. The number of the Federal Housing Administration (FHA) loans are also included in the report. It further analyses the average contract interest rate for 30-year fixed-rate mortgages with Jumbo loan balances and conforming loan balances. Jumbo loan balances are those above $510,400 while conforming loan balances are less than this amount. Finally, the MBA mortgage market weekly report analyses the change in the average contract interest rate for 15-year fixed-rate mortgages.

Using the Mortgage Market Index in Analysis

The change in the number of mortgages in an economy tells a lot about the prevailing economic conditions. These conditions range from demand in real estate to prevailing monetary policies. Both of these aspects are integral in the growth of an economy.

When the mortgage market index is rising, it means that the number of mortgage applications has increased. The increase in mortgage applications could imply that there is a growing demand for real estate. One thing you have to know, when people decide to invest in the housing market, it normally means that they have increased disposable income and have thus fulfilled all other intermediate needs.

An increase in disposable income in the economy means that more people are gainfully employed or that wages have increased. In both these circumstances, we can deduce that the economy is expanding. The reason for this deduction is because when demand in the real estate market expands, it means that demand in the consumer discretionary industry has also increased. Thus, the output in the economy is higher.

More so, when the mortgage market index rises, it could mean that households and investors in the economy have access to cheap finance. Either they are creditworthiness has improved, or the market interest rates are lower. When the interest rate is lower in the market, it is usually due to the central banks’ expansionary monetary policy.

Such expansionary policies are adopted when the central banks aim to stimulate the growth of the economy. It means that people have access to cheap money and can borrow more. When there is a growing money supply in the economy, households can increase their consumption, and investors can scale up their operations. Overall, the economy will experience an increase in output, thus in the GDP.

Furthermore, it could also mean that households who previously could not afford to service a mortgage can now be able to afford mortgages due to low-interest rates. This scenario played out towards the end of the first quarter of 2020 when the US Federal Reserve made a series of interest rate cuts. The MBA mortgage market index is seen to have hiked. This hike can be taken as a sign that households and investors were taking advantage of the expansionary policies by increasing their holding in the real estate sector.

Source: Investing.com

On the other hand, a drop in the MBA mortgage index means that the demand for demand in the housing market is waning. The decrease in demand could be synonymous with an overall contraction of demand in the economy. The contraction of aggregate demand can be taken as a sign that the overall economy is also contracting. Similarly, it can also be taken as a sign that the public has lost confidence in the housing market as during the 2007 – 2008 housing market crash.

Source: Investing.com

Impact of the Mortgage Market Index on Currency

In theory, the domestic currency should be susceptible to fluctuations in the mortgage market index.

When the index increases, it can be taken as a sign that there is an increased money supply in the economy. Under such circumstances, contractionary monetary and fiscal policies might be implemented, such as hiking the interest rates. When such policies are adopted, the domestic currency tends to increase in value compared to other currencies in the forex market.

Conversely, when the index is continually dropping, it can be taken as an indicator of overall economic contraction. In this instance, expansionary policies might be implemented, like lowering interest rates to encourage consumption and prevent the economy from slipping into a recession. These policies make domestic currency depreciate.

Sources of Data

In the US, the mortgage market index is compiled and published weekly by the Mortgage Bankers Association. A historical time series of the data is available at Investing.com.

How the US Mortgage Market Index Affects The Forex Price Charts

The latest publication by the MBA was on October 21, 2020, at 7.00 AM EST. As seen in the screengrab below, a low impact on the USD is expected when the index is published.

For the one week to October 21, 2020, the mortgage market index was 794.2 compared to 798.9 in the previous publication.

Let’s see how this publication impacted the USD.

GBP/USD: Before US Mortgage Market Index Release on October 21, 2020, 
just before 7.00 AM EST

Before the publication of the US Mortgage Market Index, the EUR/USD pair was trading in a weak uptrend. In the above 5-minute chart, the 20-period MA is almost flattened with candles forming slightly above it.

GBP/USD: After US Mortgage Market Index Release on October 21, 2020, 
at 7.00 AM EST

The pair formed a 5-minute bearish candle after the release of the index. It later traded in a neutral trend as the 20-period MA flattened, and candles formed around it.

Bottom Line

This article has shown that the US MBA Mortgage Market Index plays an essential role as an indicator of demand in the housing market. But as shown by the above analyses, this economic indicator has no significant impact on price action in the forex market.

Categories
Forex Assets

Understanding The Fundamentals Of AUD/KES Forex Currency Pair

Introduction

In the AUD/KES pair, the AUD represents the Australian Dollar while the KES is the Kenyan Shilling. When buying and selling this exotic currency pair, forex traders should expect instances of high volatility. In the AUD/KES pair, AUD is the base currency, and KES is the quote currency. The price attached to this pair is the amount of KES that 1 AUD can buy. For example, if the price of AUD/KES is 76.399, it means that if you have 1 Australian Dollar, you can buy 76.399 Kenyan Shillings.

AUD/KES Specification

Spread

When you want to buy a currency pair in forex trading, you buy it from the broker. If you sell the pair, you sell it to the broker. The difference between these two prices is the spread. The spread for the AUD/KES pair is – ECN: 25 pips | STP: 30 pips

Fees

Most brokers charge a commission when you open a position. This commission varies from broker to broker and also depends on the size of your position. STP accounts are usually commission-free.

Slippage

In times of high volatility, or when your broker delays executing a trade, you will notice that the price at which you open a position is different from the exertion price. This is slippage in forex trading.

Trading Range in the AUD/KES Pair

In forex trading, trading range refers to the fluctuation in a currency pair’s price across different timeframes. Analysis of the trading range provides a powerful tool for deriving the volatility of a currency pair.

The Procedure to assess Pip Ranges

  1. Add the ATR indicator to your chart
  2. Set the period to 1
  3. Add a 200-period SMA to this indicator
  4. Shrink the chart so you can determine a larger period
  5. Select your desired timeframe
  6. Measure the floor level and set this value as the min
  7. Measure the level of the 200-period SMA and set this as the average
  8. Measure the peak levels and set this as Max.

AUD/KES Cost as a Percentage of the Trading Range

The total trading cost involved in buying and selling a currency pair includes the spread, slippage costs, and brokers’ fees. Using the total trading costs, we can establish the percentage costs of a currency pair in pips.

ECN Model Account Cost

Spread = 25 | Slippage = 2 | Trading fee = 1 | Total = 28

STP Model Account Cost

Spread = 30 | Slippage = 2 | Trading fee = 0 | Total cost = 32

The Ideal Timeframe to Trade the AUD/KES

These analyses show that trading the AUD/KES pair on larger timeframes carries lower costs than smaller timeframes. Notice that on longer timeframes, volatility is higher. We can thus say that higher volatility corresponds to lower costs. For both the ECN and the STP accounts, costs are highest when volatility is at four pips and lowest when volatility is 737.1 pips.

To determine the ideal trading will depend on your trading style. Generally, longer-term traders enjoy low costs for both types of accounts. For the shorter-term traders, waiting for when volatility is at the ‘maximum’ will help lower the costs. Traders can also use forex limit orders to lower trading costs since using such orders eliminates slippage. Here’s one example using the ECN account.

Total cost = Slippage + Spread + Trading fee = 0 + 25+ 1 = 26

With no slippage costs, notice how costs have significantly dropped. The highest cost for the AUD/KES pair has dropped from 474.58% to 440.68%.

Categories
Forex Elliott Wave Forex Market Analysis

AUDJPY Could Develop a Limited Upside

Overview 

The AUDJPY cross advances in an incomplete upward sequence that belongs to a corrective structural series backed by Monday’s trading session’s euphoric sentiment. The Elliott Wave view unveils the likelihood of a limited upside before resuming its declines.

Market Sentiment

The AUDJPY cross retraces on the overnight Tuesday trading session after the surprising weekly kick-off, which jumped the price over 2.2%, climbing until 77.037, its highest level since September 18th.

The AUDJPY 8-hour chart illustrates the 30-day high and low range, which exposes the participants’ intraday market sentiment. The figure distinguishes the price action consolidating in the extreme bullish sentiment zone, backed by the stock market’s euphoric rally on Monday’s trading session.

The breakout of the last 30-day high of 76.274 during Monday’s trading session raised the participants’ extreme bullish sentiment, expecting further upsides on the cross. Moreover, we see that the price action remains above its 60-period linear weighted moving average, which confirms the bullish bias on the AUDJPY.

Nevertheless, the AUDJPY found resistance below mid-September’s consolidation zone. This market context expects a significative retracement or a consolidation movement before continuing the rally experienced in Monday’s session. Finally, a retracement below the 75.087 level would turn the market sentiment from bullish to bearish.

Technical Overview

The AUDJPY cross advances in an incomplete upward bullish sequence of a lower degree, which belongs to a descending structure that began on August 31st when the price topped on 78.462.

The below 8-hour chart exposes the price action running in an upward wave ((b)) of Minute degree labeled in black, which currently advances its fourth wave of Minuette degree identified in blue. Likewise, according to the Dow Theory, considering that the AUDJPY cross advanced over 66% of the bearish decline, the price should develop a bearish connector corresponding to wave ((b)).

In this context, following the Elliott Wave theory and considering the third internal segment of the intraday rally, the price could produce a limited upside toward the supply zone bounded between 77.295 and 77.497. Finally, the bearish divergence on the MACD oscillator may mean a confirmation of the upward movement’s exhaustion corresponding to wave ((b)).

Short-Term Technical Outlook 

The incomplete bullish sequence of the AUDJPY cross unfolded in its 4-hour chart exposes the progress in its fourth wave of Subminuette degree labeled in green. Likewise, considering that the third wave is the extended wave of wave (c), the fifth wave in green should not be extended.

On the other hand, considering that the second wave in green is a simple correction, the fourth wave should elapse more time than the second wave. Additionally, the fifth wave in green could extend itself between 77.140 and 77.654. The price could find fresh sellers expecting to open their shorts on the bearish side of wave ((c)) of Minute degree labeled in black. The invalidation level of the bearish scenario locates at 78.462. 


Categories
Forex Course

170. Why Consider Analysing Multiple Timeframes When Trading Forex?

Introduction 

Our previous lessons have covered trading multiple timeframes in forex and which timeframes are suitable for your trading style. To some forex traders, trading multiple forex timeframes can seem tedious and time-consuming. Here are some of the most important reasons why you should look at multiple timeframes when trading forex.

1. To easily identify trends and their momentum 

Depending on the type of forex trader you are, multiple timeframes will enable you to see the prevailing market trends at a glance by filtering out periodic price spikes. It is easier to identify the direction of the market trends and consolidations, whether in the short- or long-term.

For the long-term market trend, you can use the weekly and the monthly timeframes, while the intermediate market trend can best be identified by the 4-hour to daily timeframes. Timeframes of between five minutes and one hour can be used to determine the short-term market position.

The longer timeframes filter out the short-term price fluctuations, which might otherwise result in trend inconsistencies when viewed alone. The periodic fluctuations in the short-term add up in the long-term. With multiple timeframe analysis, the strength and consistency of the short-term trend can be compared to that in the long-term. This comparison is made by observing whether the prevailing long-term trend was dominant in the short-term as well.

2. To establish the significance of fundamental indicators

Using multiple trend analysis, you can easily establish the magnitude that news release of economic indicators has on a given currency pair. To determine the significance of the economic indicators, you can use different timeframes to establish how long the news release affected price action. The effects of high-impact fundamental indicators can be traced from the shorter timeframe to the longer timeframes. Low-impact indicators only affect price action on the shorter timeframe.

3. Identifying the support and resistance levels

Based on the forex trading style you choose, you can use the more extended timeframe within your category to establish the support and resistance levels in the market trend. Shorter timeframes can then be used to trigger entry and exit points for a trade.

These support and resistance levels are crucial in deciding the forex order type you want to execute. Say, for example, you want to use a buy limit order. You will use the support level as your trigger price. Similarly, the support level can be used as the trigger price for a sell stop order. You can use the resistance level as the trigger price for the sell limit and buy stop orders.

4. To avoid the lagging effects of technical indicators

Technical forex indicators are lagging since they derive their properties from the price action of a forex pair. Therefore, the forecasting significance of multiple timeframe analysis in the forex market can be said to be leading that of the technical indicators. Furthermore, some technical forex indicators can produce conflicting signals. Thus, trading with multiple timeframes improves your forex analysis.

We hope you understood why it is crucial to consider analyzing various timeframes while analyzing the Forex market. Please take the below quiz to know if you got the concepts correctly. Cheers!

[wp_quiz id=”89156″]
Categories
Beginners Forex Education Forex Basics

What You MUST Know About Bank Accounts for FX Trading

Forex traders often find themselves with the need for more features than what is offered with traditional bank accounts, such as the need to have access to multiple currency options. Finding a sufficient bank account can be a frustratingly difficult task for medium-sized investors, especially when it comes to tax optimization. However, if you choose to work with a bank in a non-CRS jurisdiction, your tax information won’t be reported immediately to the tax authorities in other countries.

You’ll also find several other benefits, including low opening deposits and tax credits and exemptions. This type of account is especially useful to beginners that are just getting started in the forex market and it can serve as a one-size-fits-all option for those that also invest in stocks, bonds, and other financial instruments. If you still aren’t convinced, allow us to give you five great reasons to open a forex-friendly bank account today:

Low Deposit and Account Balance Requirements

Most banks ask for a fairly high deposit, but forex-friendly accounts will typically allow you to get started with a deposit of just $2,500, which is generally much lower than what is required elsewhere. Minimum balance requirements are also set at a lower bar than what you would be required to keep with another type of account, so you don’t have to worry about topping up your balance as often. Altogether, these perks take away the stress for traders that want to avoid making a large deposit or who might dip into their account balance farther than expected.

Fees that are Both Low and Transparent

Banking fees are inevitable no matter where you go, but the real issue with many banks is transparency. If you don’t want to find any unexpected charges on your bank statement, a forex friendly account is the way to go. Many of these banks offer transparent pricing, along with fees that are usually lower than the competitor’s offer.  Trust us, transparency is key when it comes to anything dealing with brokers or banks. 

Beneficial Tax Policies

If you decide to open an account with one of our associates, you can look forward to tax exemptions that would lower your income tax rate to less than 10%. You’ll also benefit from the fact that they don’t work with jurisdictions that have dividends tax or national gains tax, and they only tax nationally sourced income because there is a territorial base for their tax rate.

Privacy

Most banks work with jurisdictions that are part of the CRS/AEOI, which require them to share exchange tax information with foreign tax authorities. Luckily, our associates don’t work with these jurisdictions, meaning that your privacy is protected and you can have the peace of mind that your assets and information are equally protected.     

An Account that Fits All Your Needs

Whether you’re only interested in trading forex or if you also dabble in precious metals, stocks, bonds, options, futures, and other financial instruments, a forex friendly account will give you access to everything you need with no need to open multiple accounts through different institutions. These multi-currency accounts are the most convenient option for traders that want efficient banking options. 

A Guide to Opening a Forex-Friendly Account

First, you’ll need to start by attempting to gain pre-approval from the bank. This doesn’t guarantee that you’ll be accepted, but it is the first step to the process and it improves your chances. You’ll need the following documents for pre-approval:

  • A bank form that has been filled out and signed
  • A (notarized) passport copy
  • A certified copy of your proof of residence
  • Six months’ worth of previous bank statements OR a banking reference

If the bank accepts your pre-approval, they will begin the process of reviewing your application, which typically takes around 20 days total with most banks. Don’t be alarmed if you’re asked to provide additional documents or forms during this time, as this is completely normal. You’ll also be expected to engage in a quick phone call with a banking representative to finalize the pre-approval process. Finally, if everything checks out, you’ll be all set to open your forex-friendly bank account.

Categories
Forex Indicators

Parabolic Sar Need Not be Complicated – Read these Best Practices Today!

In forex trading, some indicators are a case study in making sure you’re using the right tool for the right job and what can go wrong when you take something at face value without doing your own research.

The Parabolic SAR is a great example of an indicator that absolutely crushes some traders – particularly beginners and traders who aren’t properly testing their tools. Like a lot of forex trading tools out there, the SAR is advertised as being good at one thing but it turns out that this superficial understanding of it leads you down a dead-end and can cause your portfolio serious harm if you use it wrong. And, just like a lot of other indicators out there, there may well be legitimate and effective uses for it that lurk beneath the surface but that you will never discover if you just use it out of the box, without taking the time to examine it properly.

This is precisely why the parabolic SAR merits a closer look. That means both that we’re going to talk about it here but also that you should put in the work and properly test how it can fit in with your trading setup.

What is it and Why is it?

There’s a recurring theme in the forex world and the world of trading in any kind of securities more broadly and that’s that the people who dream up and develop indicators and tools are just downright bad at naming them. So many times you’ll come across a tool or method or indicator and you’ll think it’s good at doing one thing because of what it’s called but, on further examination, you’ll realize that it’s actually no good at that thing and you end up using it for something completely different – sometimes you’ll straight up use it for the opposite of its intended application.

That’s kind of the case with the parabolic SAR, which is an acronym of Stop and Reverse. The indicator was the brainchild of pretty much the daddy of a whole host of technical trading indicators – you may have run into him before but if you haven’t, his name will still crop up often enough that you’ll end up remembering it anyway: Welles Wilder Junior. He came up with some of the most-used indicators out there, the Relative Strength Index (RSI), the Average True Range (ATR), the Average Directional Index, and, among them, the Parabolic SAR.

Now, it’s true that he came up with a lot of these indicators to assist equities traders rather than forex traders – they were mostly developed in the 1970s and 80s, well before spot forex trading was even a thing – but the fact that they are still so familiar to us today speaks to the fact that there is often still some value in them. And there is potentially some value in the parabolic SAR, it’s just that it may not be in using it as it was originally intended.

Wilder developed the SAR because he was looking for a way to measure an asset’s momentum in such a way that it would be possible to calculate the point at which it becomes more likely than not that the momentum would switch direction. The idea he had was that a strong movement in the momentum takes on the shape of part of a parabolic curve. A parabolic curve looks a little like a graph of exponential growth and traces a gentle arc from the near horizontal to the near-vertical. In the SAR, the momentum doesn’t always follow through the whole curve and might only mark out a section of it – nonetheless, that’s where the first part of its name comes from.

Wilder also noticed that when the price catches up to the curve mapped out by the momentum, the odds that it would change direction became higher than the chance of it continuing in the same direction. This meeting point of the momentum arc and the price is then the stop point and a reversal here becomes likely – hence stop and reverse.

Reversal Hunting

There’s one great thing about the Parabolic SAR that’s immediately obvious to everyone who comes across this thing and that draws traders into actually using it and that is that it’s almost ridiculously easy to read.

Now, to the more seasoned traders out there that might seem like a bit of a nonsensical thing to say, they would immediately see that as a red flag and be like, “well, you know what, just because something is easy to read doesn’t automatically mean that it’ll actually work the way it’s intended”. And they’d be right of course but once you’ve been trading a while it becomes kind of difficult to take yourself back in time and put yourself in the mindset of someone who’s just starting out.

Traders who have never seen anything like the SAR before will be immediately impressed with how clear and simple it is and how straightforward the signals it sends you are. And that’s its initial appeal – it looks like it does exactly what it was advertised to do and there’s zero input required from you the trader. You just plug it in and it’s ready to go.

On the surface of it, the SAR was developed as a reversal indicator that tracks momentum and then tells you, “hey, momentum has bumped up against price here, there’s a reversal unfolding”. And if you don’t look at it in any greater depth than that, this superficial approach to it is going to lead you down a blind alley where you could find yourself embroiled in some very serious losses.

The first thing to point out here is that reversal trading is a very dangerous, high-risk business and if you’re not 100% sure of what you’re doing, it is very hard to be in the small, elite club of traders that can make it reliably and sustainably work for them. If you are new to trading or even if you have a couple of years of experience under your belt and you decide to go hunting reversals using the parabolic SAR, you are doubly in trouble. Not only will you almost certainly run into big losses running reversal trading without an array of measures and systems (such as risk assessment, money management, and a thoroughly tested and evaluated toolkit of indicators and strategies) designed to cut back on bad trades, you will also be applying the wrong tool to the wrong job.

Reversal trading is not for the faint-hearted and it most definitely is not for beginner traders. But more than that, the parabolic SAR just isn’t a good indicator for the job. It will, almost without fail, call out reversals that are immediately followed by retracements – go test it out, it’s almost uncanny.

Alternative Uses

So if it sucks at doing what its name says it’s good at, what is the SAR actually good for? Well, those of you who have by now become accustomed to taking indicators for a spin around the testing range will be familiar with this one phenomenon that crops up all the time.

What happens, even with quite experienced traders, is that you’ll take a tool or an indicator and start backtesting it, and when you see it takes you into a trade, you’ll measure out how much of a win that trade would have been. So, if you see it take you into a trade that runs for, say 600 pips, you’ll say to yourself, “awesome, this thing is great, I just took home 600 pips!” Well, no, no you didn’t. If you were really making that trade in real-time, there’s no way that you would have taken all 600 pips of that run. Your trade entry and exit just cannot be that perfect in the real world. If you’re lucky, you might have grabbed half of it and taken a 300 pip win but more likely you’ll only have been able to realize something like a third of the whole movement and taken 200 pips.

Now, of course, the reverse is also true and you might have seen that move switchback early on just far enough to blow out your stops so you would have to count it as a loss. One would hope that you have the right money management approach to cut down on that loss by ensuring that you are going into the trade with the right stake that allows you to set your stops at a point that allows a bit of leeway in the price movement. The other thing that you can do here to maximize your win is to apply the right technical trading tools to ensure that you can reap as much of the reward as possible.

This is where the SAR comes in. Not, probably, as your primary entry indicator but more as a secondary, confirmation indicator that helps you to see out a trade to the maximum possible point. In short, you can use it as a trailing stop.

On your chart, the SAR will appear as a series of dots above and below the price that appears as lines – those are the sections of the parabolic curve that we talked about before. When the lines of dots cross the price line, they will flip across to the other side. In reversal trading, this is supposed to be a signal that a reversal is happening but – as we saw – that’s not the best way to use these things.

Context

It’s important to know when to use the SAR because, like a lot of other indicators, it only works in certain market conditions. The main thing to remember is to absolutely never use the SAR when the market is choppy. If you see that the market is ranging or heading sideways or even if there’s a weak trend then you are not going to want to use SAR because it will throw up lots of little false signals that will make it impossible for you to make any money out of the trades it leads you into.

So, the best way to approach the SAR is to use it once you have already identified a strong trend in the market and in conjunction with a primary indicator (or set of indicators) that will lead you into a trade. Under these conditions, the SAW can really shine.

When your system identifies a trade entry on a strong trend and you make the decision to pull the trigger, you can use the SAR as a continuation indicator to lead you down the movement to the point at which you can exit and still walk away with as many pips as possible.

To get accustomed to how this might actually function out in the real world, you will have to put in the work and try this thing out on your historical charts and through a demo account – making sure you combine it carefully with the tools you already use.

Round-Up

In short, the main things to take away from the SAR are that you should never ever use it in either of the following scenarios: a) as any kind of reversal indicator – it does not do this job well and it will lose you money; b) in any way shape or form if the market is not in a clear, strong trend – if there is any fuzziness to the market or even a weak, watered-down trend, don’t use the SAR.

But in its capacity as a secondary or confirmation indicator that you use as a trailing stop or continuation indicator that leads you through a trade you are entering (when the market is already in a strong trend), it has the potential to help maximize your wins.

Finally, make sure you test it for yourself and that it works in the system you have set up to suit your trading needs and preferences. If it doesn’t fit into this, never fear, there are plenty of other trend indicators out there that will do a similar or better job and all you have to do is get out there and find them.


Categories
Forex Chart Basics

The Ultimate Guide To Correlations: From Basics to Opinions

Individuals eager to enter the world of trading usually feel perplexed when they start analyzing the charts, not fully understanding the movement of prices and what causes it. After a while, they typically start making connections between different factors in the market, beginning to grasp this association. Correlations, the implication that connections can be drawn between the behaviors of two distinct things, are one of the inherent parts of different trading markets. Nowadays we can see how various events affect the changes we see in a specific market and how different markets can impact one another, providing proof for the existence of both inter- and intra-connectedness in terms of market cause-and-effect relation. We can now see and understand how correlations work and the way they cause things to move. Often we find how pulling one string affects other parts of the web, which is why it is necessary to see the extent of this impact and whether it can have practical applications for traders. Today we are reviewing different types of correlations, finding real-life market implications, and evaluating their effectiveness.

Correlation Degrees

Correlations can either be positive or negative and together these two polarities form a spectrum consisting of several different degrees of correlation. As can be seen from the table below, both positive and negative correlation can be either perfect, high, or low. With the positive (left) side, we understand that two things are moving exactly the same, unlike for the negative (right side of the table). With similar indices, we can often detect a positive correlation, such as the case of the SPX and the SPY (ETF) which, due to their similarity, do not only have a positive correlation but a number of correlations as well. On the other hand, examples such as the correlation between DIA (diamonds) and DOG (inverse ETF) reflect a negative correlation owing to the fact that they move exactly opposite to each other. Therefore, we can conclude that a positive correlation is the one where two things are moving together, while the negative one implies that two items are moving in the opposite directions, as portrayed in the graphs below.

Many traders assume that, since there are two extreme points at both ends of the spectrum, the middle stands for a perfect balance between the two. However, as correlations simply work differently, the mid-point actually signals something completely different. For example, in the stock market, there is a number called beta, which essentially stands for a measure of volatility. In this respect, the S&P 500 is esteemed 1, so if anything is considered to be 2, it would signify a two times higher degree of volatility in comparison to the afore-mentioned index. Hence, if anything was measured to be 0.5, it would imply that it is half as volatile as the S&P 500. In the early 2000s, Netflix had a negative beta and, as it went down each time the S&P 500 went up and vice versa, it was impossible to measure volatility in relation to this index because Netflix never followed what the other was doing. In statistics, there is a term called R-value which reveals how things are correlated and, going back to the previous table, we can see that there are two perfect correlations on each side, positive and negative, but the middle, however, shows no correlation. This further means that there is no perfect balance in between the two extremes, yet that there is a void where no correlation exists just like the previous example involving Netflix shows. 

In terms of positive correlations, we can find many examples of stocks correlating with the S&P500. One example where there is an indication of a similar movement is displayed below. Although the correlation between Goldman Sachs and Morgan Stanley (both of which are in the same line of business – brokers, trading, and asset management, among others) is not a perfect one, we can definitely find proof of it being a positive correlation despite the existing differences. Although these differences are obvious, we see that these two similar companies also have a tendency to move in a similar fashion.

Although most stocks are said to have a positive correlation with the S&P 500, there is still evidence of some with a negative correlation. The example below shows exactly that type of correlation, where we can see how FAS and FAZ are inversely or negatively correlated. The chart below is very close to a perfect negative correlation where the movements go in almost entirely opposite directions. Where we see the FAS going up, the FAZ is going down and vice versa. This almost perfect opposite behavior is completely understandable since FAS stands for a financial ETFx3 to the upside, whereas FAZ represents a financial ETFx3 to the downside (Direxion Financials).

Major Correlation Causes

Many sources claim that correlation does not equal causation, implying that things that are correlated need not be the cause of each other’s existence, yet there is proof that certain factors lead to specific occurrences in different markets. We recognize three of such determining factors where correlation is quite vivid and, consequently, undeniable: 1) market correlations, which is the most prominent in the currency market; 2) commodity correlations due to which specific commodities affect certain currencies; and, 3) currency correlations where one currency is likely to go down because the other one goes up for example.

Market Correlations

Whenever the topic of market correlations comes up, it is necessary to bring up the measure between risk and reward as well. Today we understand how some assets are considered to be very safe, while others are seen as risky. These projections stem from the analysis of volatility and risk of loss, so we can call an asset risky whenever it is likely to lead to a loss. Those assets which are perceived as safe always entail some form of security, e.g. government bonds that are both paid and guaranteed by the US government and that come with a 3—10% return on a 30-year bond. With such assets, people feel certain that the money in which they have invested is guaranteed and they typically leave a sense of stability overall (as in the example of the US government, which is unlikely to run out of business, that poses as a sign of security for the bonds). Stocks, on the other hand, can easily increase by 30—40% and drop the same percentage immediately afterward, which is why they are considered to be riskier assets. 

In the world of bonds and stocks, people have always used the ability to allocate their funds from one to the other. As bonds come with a greater percentage return whenever things are going well and a significantly lower percentage return when things are not so well, people turn to them whenever the circumstances seem to be unsafe. Therefore, each time people see that the economy is booming, they will invest in stocks and not in bonds, which eventually leads to an increase in stock prices and a decrease in bond prices. However, the moment people feel concerned due to some external factors or events, they will immediately sell their risky assets and allocate their money to safe assets. People will then be piling money in bank deposits, bonds, or utility stocks, which are considered to be less risky, and this is the one reason why assets’ value increases. These surges and reductions in prices almost always stem from people’s decision where to invest their money, which is noticeable in the currency market as well.

When the COVID-19 pandemic started, the US and world economies shut down and we have witnessed major GDP drops across the globe. It is interesting to note how the JPY, the official currency of Japan, skyrocketed by 11.6% in just 4 weeks. To make a comparison, forex traders are more than satisfied with a half a pip growth in one week, so this sudden change had a message to convey. The only cause of such a rise was people looking to buy the currency in question, which seemed like a wise decision in times of crisis and unpredictability. This was an example of a risk-off move where people are eager to buy safe investments for the sake of exiting the riskier assets. Such conversions always affect currency prices, so if people are willing to buy US government bonds as a safe investment, the money will flow into the US and the USD as well. Aside from the US government bonds, ranked the first owing to the US economy is the largest one in the world, China’s and Japan’s bonds are also considered to be the safest assets and respectively hold the second and the third place in terms of their economies. People will always look to invest in these countries’ assets because they are believed to be the least likely to collapse, making people’s investments as secure as possible. Australia, for example, may not be able to pay off all the bonds due to a lack of money or wealth, which is what people may feel worried about when choosing where to invest their money.

Risk On/Risk Off

From the perspective of history, the JPY, the USD, and the CHF have traditionally been viewed as currencies of safety, while the NZD, the AUD, and the CAD are considered to be risky currencies. The shapes below explain how the purchase of currencies works in different situations. A typical risk-off move occurs when people look to buy stability and sell what is risky. Whenever people are buying stocks, economies are growing, and there seems to be less worry about risk overall, we are seeing a risk-on move where growth currencies boom. They are called growth currencies because their economies are much smaller, so they can achieve much higher growth rates during times of prosperity. During these times, currencies such as the USD, the JPY, and the CHF, which are representative of their strong economies, would normally not do so well. The EUR and the GBP are usually always somewhere in the middle, more or less unaffected by the same factors as other currencies.

These moves and changes in currency preferences, however, need not always play out as we expect them to. Theory and real-life applications often differ in the world of trading, so traders need to have in mind that textbooks should only serve as guidance rather than absolute truth. The same discrepancy can be seen in any other line of business, where people often claim to not have been prepared for everything they encountered until they started building a business. Any resource we get hold of is meant to tell us how things are supposed to unravel, yet these prescribed scenarios should never be seen as carved in stone. For example, whenever there is panic in the market, the EUR is always found in the middle and the CHF is always perceived as a currency of strength. However, when the Eurozone was on the verge of collapse in 2012/2013, these two currencies were found in a completely different set-up.

The Eurozone attempted to take countries of different economies, currencies, and histories and blend them into one. Before any of these changes, the event of one currency dropping in value was able to affect that country alone, which allowed them to export their goods and services more easily due to them being cheaper and thus more appealing to other countries. When different European countries agreed to come together in 1998, many were doing exceptionally well, pouring money into the Eurozone. When Greece and other countries showed less preparedness to provide the same, the member countries with stronger economies began to complain, not wishing to keep funding the underperforming economies. At that time, the Eurozone did not have a functioning measure that would tackle these issues, so many people started to raise questions regarding the future of the EUR, which consequently became the riskiest currency. Then this worry affected the financial markets and the EUR lost its previous status.

The CHF, the usual currency of safety, which is also located right in the middle of the Eurozone, made people feel worried about what would happen to Switzerland and its official currency despite its long-held favorable status. The unsettled issues and rising concern made the currency fall from grace, leaving a need to allocate large sums of money in some other direction. Unexpectedly and suddenly, people showed interest in New Zealand and the NZD became the currency of favor for a while. As the Eurozone was affected by its internal troubles, people desired to look outside the continent and this is an excellent example of how external factors play a big part in how events play out. Therefore, stories, news, and history in the making are going to affect currencies and make them move outside their usual patterns. Today we see the USD as the currency of stability and safety, but this may too change because of the risk-on and risk-off moves people make. This is an extremely important correlation and traders should always acknowledge its impact. In addition, it is vital to remember that the decision on which currencies to pair in the event of equity markets going down is easy to make when there is knowledge on which currencies act as the currencies of safety.

Commodity Correlations

Canada is an excellent example of a resource risk economy, which further entails that a great proportion of its economy is dependent on its resources. Due to this reason, the price of resources is an extremely important factor for this country. Oil, in which Canada is abundant, is known to have affected their economy through history. For example, in 2005 when the price of oil shifted to $150/barrel only to go back down and up again impacted Canada to a great extent. Such price alterations meant that the country had to close down oil production and put a lot of people out of work, which increased unemployment levels, decreased taxes the government could collect, and ultimately made their bonds a lot riskier. This story exemplifies how relevant these commodity correlations are, as commodity prices inevitably influence people’s buying preferences and the entire strength of an economy. It is, however, interesting to note that, while there always seem to be high correlations between the CAD and the price of oil, between 1986 and 1991, the price of oil increased while the CAD remained unchanged, which only points to a conclusion that these correlations are not always present.

Some other correlations are vivid in the gold market, especially in connection with the three currencies that are highly correlated with the price of gold: the CHF, the AUD, and the NZD. Today, the CHF is the only remaining currency still pegged to the gold standard, which means that any desire of the Swiss government to increase wealth needs to be carried out through the acquirement of more gold. Whenever a country buys great quantities of gold, whose price increases around the same period of time, the country in question immediately becomes that much richer and is much more likely to be able to pay up on its bonds. This has a direct impact on the way the currency and the country are perceived by people, who are then increasingly more likely to see them as stable and safe and are, thus, more willing to purchase their bonds. Alike the CHF that is backed up by gold, Australia is also closely connected to gold due to its mining. Furthermore, the NZD which is tightly connected to the AUD is then also likely to be impacted by any changes occurring with the price of gold and the AUD. Therefore, should the AUD go up as a result of the changes in the price of gold, the odds of the NZD changing are higher and vice versa. The AUD, the NZD, and the CHF all have a positive correlation with the price of gold, which further entails that they will typically rise when the price of gold does as well.

We can find these correlations with other currencies as well, for example, the South African rand and the Swedish krona have both demonstrated high correlations with the price of gold although we typically do not trade them. The USD also shows proof of such correlation with gold, although a negative one, which signifies that the price of the USD will generally fall whenever the price of gold rises. Moreover, whenever we consider the prices of oil and gold, we are able to develop an insight into what is happening with the CAD, the AUD, and the CHF. Some websites even offer tables with information on different correlations, so as the table below suggests, copper is mildly correlated with the EUR.

Currency Correlations

When we discussed another type of correlation above, we explained how the AUD is highly positively correlated to the NZD because of the close proximity, which also means that the two will be each other’s greatest trading partners. Another example of geographic closeness is that of Canada and the United States of America, and such ties will always imply that whatever happens to one country is probably going to affect the other one as well. With Australia and New Zealand, it is interesting that their common trading partner apart from one another is China, which is a very big part of their GDP and export. Again, if anything occurs in China that should impact its economy, both Australia and New Zealand will feel the reverberation of these events. 

As the Eurozone is a very peculiar unit, when the coronavirus took over the world by storm, the entire union took on a meticulous plan on how to tackle the challenge. There were signs of problems in Italy and Spain early on, yet the effort to shut everything down and make everyone comply with the rules led to lasting changes for the better. Unlike the US, they crushed their economy right on the start only to come out later on even stronger. With the United States, the economy was always semi-closed, so the number of people affected by the virus kept rising while no effective change was recorded. Since the Eurozone’s economy improved after they had it closed off, this also helped the neighboring countries and their currencies – the CHF and the GBP, which are all going to be positively correlated, moving together in the same direction. 

Examples of such currency correlations are numerous, so for example the EUR and the USD have often shown signs of negative correlations, meaning that when one goes down, the other one will go up and vice versa. Traders can find information on these currency correlations on different websites and even check for various time frames to draw more advanced conclusions (see the table below). Nevertheless, apart from such correlations calculators, it is important to mention how certain experts loudly criticize the general approach of different educational sources to currency correlations due to the difficulty and impracticality of their application in real trading. 

While many assume that a currency that is currently strong will be equally strong against many other currencies and not just one, some forex experts claim that such knowledge is impossible to use in everyday trading. These individuals also find it hard to believe that several currencies moving in the same direction can be taken as a predicament of some future movement. They claim how traders are keen to receive a signal that would warn them about some market changes but how these signals are unlikely to be found in currency correlations themselves. Therefore, whenever traders find two currencies moving together in a correlating fashion in the chart, they are prone to assuming that they will also change direction at the same time due to this inter-connectedness. However, since they are moving exactly the same, the chances of traders receiving the early entry signal they may be eager to get are probably very slim. What is more, this group of experts insists that there are no two charts that show true correlations, which is why they are inviting all traders to compare any two charts they believe are correlating and assess them candle by candle. They argue that all traders will be able to see a different picture details as well as understand that the two currencies are not truly correlating once they start considering all (ponder on the following two images). 

It is paramount that traders understand that many a time what they see in a chart is not an indication of any correlation but a special circumstance where one strong currency is leading the pair. What often happens is that one currency has greater importance than the other one in terms of how this currency controls whether the pair moves up or down. The examples above show how the GBP just mattered more and, whenever this happens in real trading, you will see two charts that look very similar and think that currencies may correlate as a result. Out of the eight major currencies, the EUR and the JPY are the easiest to spot whenever they are in such a position of power. These circumstances cause many charts involving the two currencies to look the same, but it does not mean that they are correlating. What traders can do in such situations is check another related chart; so, if the EUR/AUD and the EUR/NZD pairs appear to be the same, traders should look up the AUD/NZD chart. It is, therefore, crucial that we look into matters more deeply and analytically so as to prevent ourselves from taking currency correlations literally.

While some forex expert traders claim that currency correlation is a phenomenon that simply does not exist, they admit to pairs being able to run together. What they do contribute to this statement is that pairs, however, need not run together at all times. If currencies could be controlled, everyone would have been using this information by now and, since we have no tangible proof of currency correlations, the best approach to take is to work on individual trading systems that are sure to bring traders the signals and trades that can weather through any market despite the natural market oscillations and changes. 

Conclusion

The excitement over correlation varies from trader to trader although it is impossible to deny how different external factors have a tendency to impact various markets. What traders need not focus on is any specific currency; however, the knowledge on risk-on and risk-off moves are rather important because they determine various market movements. If you are eager to get a good trade, simply consider the risk you are leveraging and understand how specific correlations with related markets can assist your trading. Nevertheless, besides connecting these dots, the only thing you can truly feel you can trust and the only thing you can test both backward and forward is your own system. Traders often exhaust themselves looking for information outside their systems, when in fact it is the algorithm and individual set of values and skills that will determine one’s success. Anything else has a much higher chance of sabotaging your efforts and your system, taking you away from something that can work well. Therefore, if your system is telling you to make a specific move and enter a trade, do not go against it just because of the idea that some presupposed correlation is going to lead to a better or worse scenario. Rely on the entire knowledge of markets and the histories of countries and currencies but always trust your system on how to manage your trades and all market ebbs and flows.

Categories
Forex Risk Management

How to Deal With Overexposure Like A Professional

Risk management in forex is of extreme importance and traders around the world have often struggled with overexposing themselves in one currency. We will address this issue using our trading system as a practical example. Exceeding the 2% risk limit (according to our risk management using our algorithm structure from previous articles) without having any awareness of how these oversights occur is almost every beginner trader’s mistake. These scenarios are frequently driven by a news event or some other occurrence that affects the specific currency they are trading, which consequently leads to an enormous loss. These losses can at times be so grave that they completely extinguish a trader’s account or erase several-month-long work despite traders’ initial efforts to maintain the risk at 2%. Interestingly enough, it typically happens that most trader’s individual trades are properly set at 2% when the exposure to only one of those currencies turns out to be increasingly higher. Today we are going to assess risk from several real-life situations and discuss them in order to gain some insight into how to manage risk better. 

Imagine a situation where a trader who is already going long on EUR/USD gets a new signal somewhere along the line to enter a new trade and go short on EUR/GBP. The trader does not ask any questions and enters the trade as the system suggested, setting the risk at 2%. Naturally, if the system has been properly tested, there is a high chance of winning both trades, which is important for beginners as they often shy away from these situations. Although it may seem like too much risk, these circumstances can prove to be quite fruitful. Despite the fact that these occurrences happen often and that the outcome is generally positive, the trader from the story made a single mistake thinking that the risk on the EUR equals zero. The risk, in fact, is 2% long and 2% short at the same time, which further entails that the trader will not take any other EUR-based trades unless at least a portion of the existing trades is closed. What traders frequently fail to grasp is that the 2% short and long, despite the opposition in direction, cannot cancel one another or equal 0%. 

Another situation involves a trader who received two long signals for EUR/CHF and EUR/USD and decided to enter both trades at the same time. In order to manage risk in these ongoing trades, the trader would need to take 1% from each trade to have a 2% risk on the EUR. If the individual for some reason decided to exit either of the two trades, the risk would come down to 1%. In this case, the traders could enter another trade or a continuation trade of the one that had just been closed. The trouble is that many traders assume that they somehow have their whole 2% here, which then leads to increased risk. The goal here is to fit into that 1% that we have left after the second trade was closed.

Should a trader receive a EUR/USD long signal but then reconsider his/her options because another EUR-based pair is likely to get there in one day, they can take a 1% risk on the first currency pair and wait for the 24h to pass to see what will happen. The other trade may or may not get to the place we hoped or expected it to reach, which can be quite unsettling but does not involve any increased risk or missed-out opportunity since the previous requirement was met. The equity is settled with the EUR, so the trader can, if he/she wishes, enter a new trade later on when an opportunity presents itself. Even if you decide to enter a 2% EUR trade in the beginning without waiting for the situation with the other pair to fully develop, there is no mistake made. The choice falls on the traders alone and no damage is done until the risk limits are properly sit – 1% on one of the two trades or 2% on a single trade. 

Sometimes it happens that the market is quite active and that prices are moving, so you can get several signals on a single currency at a time. What you should do here is divide the 2% by the number of trades you wish to enter. Therefore, if you received four signals for four EUR trades, make sure that each of the four trades has a 0.5% risk. While this may seem like a lot, it actually can prove to be both useful and lucrative as long as the risk is managed well. If you assumed that the EUR is going to do well and your assumptions prove to be correct, you will take wins in all EUR-based trades you entered. However, if your assumptions somehow turn out the other way, your trades are secured because the proper risk management can function as a form of a hedge.

While this is an excellent strategy and a secure way of protecting oneself, this does not imply that any trader should go on a spree looking for several trades involving one currency as this often fails to bring the results we are hoping to get. The system you have worked to build should be enough as a source of signals, so there is no need to go beyond that. Moreover, it is also extremely important for traders to trust their algorithms when we do get several signals for one currency at the same time and not miss opportunities out of fear.

Traders can sometimes be misguided by the sudden success they experience in some of these situations when they win instead of losing despite not having set the risk properly. Such outcomes can be particularly dangerous for the understanding of how risk management truly works. Once the winning part ensues, traders can get so excited that their thinking processes get affected negatively and no logical conclusion can be drawn as a result. In order to overcome this challenge and improve your overall trading, especially if you are at the beginning of your forex career, you should devote time to learn about money management and trading psychology, which will prove to outdo all other forex-related topics by far.

The more advanced traders who have already started backtesting their systems may be experiencing some difficulty due to the inability to apply today’s advice during these processes. The problem with dividing risk while backtesting is that it would make the whole assessment that much longer, so the suggestion here is to test the system on different currency pairs one by one. Overexposure prevention is important but, for the backtesting part, it would dimply overcomplicate everything, However, during the forward testing, whose purpose is to gain more clarity and see the things which may be fixed, you can expect to see some differences. This second part of testing should also serve to prepare you emotionally for trading real money and traders should, thus, be particularly vigilant throughout the process. Any of the parts that you do not focus on entirely or fail to address with a sufficient amount of attention during the demo phase will inevitably haunt you down later on and probably in a much more serious situation affecting your or other people’s finances.

As we described above, the dangers of accidental success are real, which calls for increased attention to testing processes where one can discern what works well and what can potentially endanger his/her entire forex career. If you suddenly go into the negative having taken a few losses in a row after an incredible 15% win is quite indicative of a malfunctioning system. The challenge here is not to interpret the word system as tools, numbers, and indicators alone because, as we said before, money management and trading psychology are superior to any technical aspect of trading in the spot forex market. Even if you have already lost a lot and feel doubtful about your abilities and knowledge on trading, what you can and should do is go back to the basics – start a demo account and devote the proper amount of attention testing requires.

Therefore, to sum it all up, if you are intent on trading a single currency through several trades, make sure that your 2% risk is divided accordingly, based on the number of trades you enter. We can see from this how trading requires precision both in terms of settings and emotions. Traders may know everything there is to know about entering a few trades involving the same currency at the same time, but the excitement and the enthusiasm may still blur their vision and prevent them from interpreting their results in an objective manner. The testing should help traders get accustomed to their systems, wins, and losses, but the topic of risk management cannot unfortunately be applied in this format to backtesting due to its complexity. The psychological side of trading can become increasingly heavy on the trader if they fail to recognize which role their emotions play in risk management, causing traders to either take too little or too much risk. While forex is a complex net connecting various fields of our existence, articles such as this one can serve to guide individuals on their way of bettering themselves, their prospects of making money, and thus their living conditions as well.


Categories
Forex Course Guides Forex Daily Topic

The right ways to Stop-loss Setting

We, at Forex.Academy, try to help novice, and not so novice, traders the best ways to trade in this Forex jungle.  Many novice traders put their focus on entries, thinking that to be profitable, you need to be right. Right?

– Wrong!  in his book “Trade your way to your financial freedom,” Van K. Tharp proposed a random entry system as an example to show that trade management is more important than entries. The stop-loss setting is a key part of trade management, so let’s have a look at how to optimize them.

Stop-loss placement is the part of the system that decides when the current trade setting is no longer valid, and the best curse is to cut losses. Of course, there are lots of ways to do that, and we at forex.academy have published several articles regarding stop-loss definition. This is a kind of entry point for you to have it easy.

Usually, new technical traders trust stops placed below easily seen supports or above resistance levels. If all participants see them, why would this be a good method? Surely not. Therefore, we suggested a better solution: ATR-Based stops.

An improved method for the ATR Stops is the Kase-Dev Stops. Kese stated that a trade is a bet on a continuation of a trend. The ideal trend is a straight line, but the market has noise. The aim of a well-placed stop-loss order is to set it away from the noise of the market.

Shyam, while writing the Forex course, teaches his learners that Fibonacci levels are not only meant for entries but serve quite well to define Fibonacci-based stop-loss levels.

Arthur Simmons, another of our excellent writers, explains how you can set stop-loss orders using point and figure charts.

Finally, if you are statistically oriented, you may be interested in the Maximum Adverse Excursion (MAE) stops. The concept of Maximum Adverse Execution was introduced by John Sweeney. The idea is simple: If your entry system has merit, successful trades behave differently than losing trades. The MAE level defines the point beyond which it is likely the current trade would belong to the losers set, and thus, it is the optimal level to place the stop-loss.

I hope this gives you nice ideas for your stop-loss orders and helps you avoid being a victim of the market makers and institutional hawks.

Good trading!

Categories
Forex Indicators

What You Need to Know About Trading with the Williams %R Indicator

Do you trade using indicators? Still do not know this indicator created by Larry Williams? The Williams %R indicator, although less popular than others, is worth studying.

Introduction

The Williams %R is an impulse indicator developed by Larry Williams. It moves between 0 and -100, providing information about the weakness or strength of a financial instrument, i.e., stocks, currencies, or commodities. It can be used as overbought/oversold levels, impulse confirmations, and trading signals. Readings from 0 to -20 are considered overbought. Readings from -80 to -100 are considered oversold levels.

Calculus

The formula used to calculate the Williams %R is:

% R = (Maximum – Closing) / (Maximum – low) * -100

Minimum = lowest minimum over the period analysed.

Maximum = highest maximum in the period analysed.

The default setting for the Williams %R is 14 periods. It can be days, weeks, months, or an intraday period of time. An R %of 14 periods would use the most recent closure, the maximum of the last 14 periods and the minimum of the last 14 periods. The Williams %R has only one line by default.

When the indicator is:

-Near zero shows that the price is quoted near or above the maximum during the period analysed.

-If the indicator is close to -100, the price is traded near or below the minimum of the analysed period.

-Above -50, the price is traded within the upper part of the period analysed.

-Below -50, the price is traded at the bottom of the period analysed.

If we look at the daily chart, AAPL shows overbought at the -4 level. Back sessions were at the -80 oversold level.

Interpreting

Williams’ interpretation of %R is very similar to that of the Stochastic Oscillator, except that %R is traced backward and the Stochastic Oscillator has internal smoothing. Williams’ interpretation of %R is very similar to that of the Stochastic Oscillator. Values in the range of 80% – 100% want to tell us oversold, while readings in the range of 0 to 20% suggest that it is overbought.

Like other overbought indicators – oversold, the most favorable thing will always be to wait for the price to change direction before trading. The over-purchase may remain for an extended period of time. For example, if an overbought indicator – oversold (such as Williams’ Stochastic Oscillator or %R) shows an overbought condition, it is advisable to wait for the price to fall, before selling if you already have a long position or a stop loss.

Often, the %R indicator helps to find a turnaround in the stock market almost at the right time. The indicator usually forms a peak and then turns offa few days before the value price turns. Similarly, the %R usually creates a drop and goes up a few days before the price resumes.

Like the vast majority of overbought indicators – overbought, it is much better that we wait for the price to change direction before trading.

Using the William %R Indicator Correctly
  • To identify over purchases in an Index or stock.
  • Centre line of the WILLIAMS %R indicator.
  • Divergences

Let’s look at each of them in the most detail.

To identify levels of over-purchase:

The indicator ranges from 0 to -100. No matter how fast action moves or falls, the Williams %R indicator fluctuates in this range. Oversold and overbought levels can be used to make an identification price extremes, which appear to be unsustainable.

-Williams %R above the threshold of -20 is considered overbought.

-Williams %R below the threshold of -80 is considered to be oversold.

As is known, a market may remain overbought for an extended period of time. Trends with some strength usually present a problem in these oversold levels – overbought already classic. WILLIAMS %R can be overbought (> -20) and prices can simply continue to rise when the uptrend is strong. In contrast, the WILLIAMS %R may be oversold (-80) and prices may simply continue to fall when the trend is strong.

Amazon has a WILLIAMS %R at 14%, in a daily chart. Seeing, from left to right, Amazon came to overbought at -3 in early December, when it traded around 696. Amazon did not reach the peak level as soon as the overbought reading appeared. It took a few days but then we saw a drop of almost 149 points. 19%. From overbought levels of -3.1, the WILLIAMS %R moved around -98 in mid-January towards the oversold terrain. Despite this oversold reading, Amazon continued to fall to the ground on January 20. Traders must always confirm the WILLIAMS %R indicator with price action or price action. On 20 January a Hammer sail was formed with the oversold WILLIAMS %R. This confirms that the short-term soil was reliable and recovered up to $638 a share. The WILLIAMS %R indicator was overbought and again we saw drops. Overbought and oversold levels are marked on the charts.

Centre line of indicator WILLIAMS %R:

The WILLIAMS %R indicator detects bullish and bearish movements in the market by observing when crossing above or below the WILLIAMS% R-50 level. After being overbought and oversold, if the Williams %R crosses the -50 line, it usually indicates a change in movement.

If you can find the Microsoft chart from April 20, the DOJI formed by Microsoft suggests a trend change. It also broke -50 which also suggests a change. In the example illustrated above, the %R of MSFT was overbought, then the share price began to fall and the %R crossed below the -50 line quickly, before most of the bearish movement occurred.

It is advisable to use the price stock with this Williams-based %R strategy to increase the odds of success. . As you may have observed, in the above example, the bar that pushed the reading of the Williams %R, below -50, was a DOJI. This usually warns of a change of trend if the next candle is also bearish. Traders should open short positions in MSFT with Stop Losses just above the DOJI sail. The trader would have entered the market when the bearish momentum was at its highest. Therefore, you could have managed to place a tighter stop loss, which in turn would increase your risk/reward advantage in this particular operation.

It is possible to use this strategy to be able to open a long position when the %R is above -50after it has been oversold for a period of time.

It is highly recommended to use price action in combination with this Williams-based %R strategy to increase the odds of success.

Divergences:

The WILLIAMS %R divergence occurs when there is a difference between what the price action indicates and what the WILLIAMS %R indicates. These differences can be interpreted as a sign of an imminent turn. There are two types of divergences. Bearish and bullish.

Bullish divergence WILLIAMS %R:

A bullish divergence occurs when the WILLIAMS %R is oversold, below -80, increases above -80, remains above -80 in recoil, and then breaks over its previous reaction at a higher level. A bullish divergence forms when prices move to a lower minimum, but the indicator forms a higher maximum.

WILLIAMS% R bearish divergence: when the price reaches a new maximum, but the WILLIAMS %R reaches a lower maximum.

If you can see a Facebook chart, the price dropped to 77.22 on May 5. WILLIAMS %R went straight to the oversold area. It moved up and up even further, but the price dropped to 76.79 on May 12. Once the WILLIAMS %R moved above -80 and we had a bullish enveloping pattern, as shown above, we marked the turn. The price recovered up to $83.

Conclusion

The WILLIAMS %R index is a unique impulse indicator that has stood the test of time. The WILLIAMS %R is best suited to identify possible spins in overbought/oversold levels and bullish/bearish divergences. As with most indicators, WILLIAMS %R should be used in combination with another indicator or with the price action. It is possible and positive to perform the combination of using WILLIAMS %R with price patterns with the objective of increase signal robustness. If you operate intelligently, by combining price action, and use the Williams %R to confirm the momentum in the market, your likelihood of ending a profitable trade would greatly increase.

Categories
Forex Elliott Wave Forex Market Analysis

GBPCAD Advances in a Double-Three Pattern

Overview

The GBPCAD cross advances in a sideways sequence corresponding to an incomplete double-three pattern. The mid-term Elliott Wave view foresees a potential rally that could boost the cross toward last March’s highs.

Market Sentiment

The mid-term market sentiment overview of the GBPCAD cross unfolded by the 90-day high and low range and illustrated in its daily chart, reveals the price action moving in the bearish sentiment zone (SZ).

The previous chart reveals the sideways movement bounded between the extreme bullish SZ located at 1.76759 and the extreme bearish SZ at 1.69214. Likewise, the 60-Day moving average looks flat, suggesting the balance between supply and demand, or bull and bear traders, which in turn, is indicative of sideways action.

On the other hand, considering the year’s opening price at 1.71923, we distinguish that the yearly candlestick pattern corresponds to a narrow body candle identified as a doji, revealing the next direction’s market participants’ indecision that the price will take.

In consequence, while the GBPCAD cross remains moving mostly sideways, the primary bias will continue neutral.

Elliott Wave Overview

The long-term Elliott Wave landscape of the GBPCAD cross reveals the price action is developing an incomplete three-wave sequence of Intermediate degree labeled in blue, which currently advances its wave (B). The internal structure unfolds in a double-three pattern as it exposes the next weekly chart on a log scale.

The previous chart reveals that the double-three pattern in progress looks incomplete. According to the Elliott wave theory, this complex formation follows an internal structural series subdivided as 3-3-3. In this context, the GBPCAD cross advances in its last “three” or the third component of the double-three pattern identified as wave Y of Minor degree labeled in green.

The internal structure of wave Y subdivided into another “three” sequence, which advances in its wave ((b)) of Minute degree labeled in black. Likewise, the wave ((b)) follows the arrangement of a triangle pattern. Thus, the GBPCAD cross should develop an upward movement subdivided into five-waves, corresponding to its wave ((c)) of Minute degree identified in black.

Elliott Wave Outlook

Considering the progress of the GBPCAD cross into a triangle pattern, the following 12-hour chart unveils that the price completed its wave ((b)) with the failure of reaching a new lower low at 1.69014, where the cross began to advance in an upward sequence that corresponds to its wave ((c)) of Minute degree identified in black.

The previous chart illustrates the end of the wave (e) of Minuette degree identified in blue and the upward sequence of a potential leading diagonal pattern, which could follow a 5-3-3-3-3 internal sequence. Simultaneously, the price seems to be advancing in its fifth wave of Subminuette degree labeled in blue, which belongs to the first wave of Minuette degree in blue. 

The first impulsive wave of Minuette degree could find resistance in the supply zone between 1.73665 and 1.74341, from where the cross could start to retrace until the demand zone is located between 1.71151 and 1.70262. Once GBPCAD completes its second wave, the third wave could become the upward cycle’s extended wave. This upward movement could drive the pair toward 1.77356 and continue until 1.79911.

The bullish scenario’s invalidation level locates at 1.69014, which coincides with the wave’s origin ((c)) that remains in progress.

Categories
Forex Basics

The Fundamentals of Forex Standard Accounts Revealed

When it comes to forex trading, a standard account is the most common account type out there. Most brokers offer an account by this name, especially if the broker only offers one account type altogether. While the name might not sound so impressive, standard accounts do offer some benefits to traders, along with disadvantages. Stay with us to find out more about this type of trading account.

Pros

  1. Standard accounts can usually be opened with a reasonable deposit minimum, typically from around $100 to $300 or $500 in some cases. Some beginners might have to save up to afford the deposit, but it isn’t an impossible goal to reach.
  2. Standard account holders can usually access some perks through their brokers, like reduced spreads, bonus opportunities, and so on.
  3. Those trading on a standard account have good opportunities to profit. For example, you could profit $1,000 with each pip being worth $10 if a position moves in your favor by 100 pips. It usually isn’t possible to come out with this type of gain with other account types.
  4. Spreads on standard accounts are usually about average, although some brokers do offer competitive spreads on these account types. This can really go either way. 

Cons

  1. Some brokers might ask for a larger deposit in order to open one of their standard accounts. The good news is that you can avoid those companies and look for a cheaper broker if you can’t meet the minimum requirements.
  2. Although standard accounts offer a good opportunity to gain profits, traders can also lose the same amount of money if things move against them.
  3. Beginners might struggle with the loss potential on these accounts, especially if they are only working with the minimum required deposit in their account. One bad move could be financially devastating if the risk isn’t managed well enough. 
  4. While standard account holders can usually access some perks, they are often more limited than those offered to higher tier account holders. Bonuses might be more limited, other account holders might be given a free trading coach or one on one lessons, and so on. 

The Bottom Line

Many beginners start out with either a mini account or a standard account. The standard account is a common type of trading account that can usually be opened for $100 to a couple of hundred dollars, with some perks, like an opportunity for larger financial gains, average to competitive spreads, and extra perks in some cases. On the downside, traders can lose just as much as they can gain, so these accounts can be dangerous for those that don’t really know how to manage their risk well. We’ve also seen high fees with some brokers on these account types, so traders will need to remain diligent when it comes to researching terms associated with any broker’s standard account before signing up.

Categories
Forex Course

This Forex Trading Plan May Actually Shock You

In the forex market where every activity and movement happens rather quickly, traders need to be particularly prepared to take on unexpected challenges. This form of readiness requires preparedness and understanding of various steps that would secure one’s position regardless of external influences or triggers. Naturally, traders may find a specific activity to be of greater difficulty, such as journaling is for many, yet these tasks need to be incorporated and accepted as habits. It is in the acknowledgment of the purpose and effectiveness of having a fixed routine where traders can finally learn how to exercise control and minimize the risks in which this market is so profoundly abundant. As this article focuses on risk as a concept and as an inherent part of the forex market, traders are invited to think through and analyze what their understanding of this term is and assess how much risk they are generally ready to take. Today’s topic is also a path to a discovery of one’s own perception and risk tolerance, supported by constructive advice on how to actively control and limit any risk-related issue, towards learning how to use this knowledge to create a functioning trading plan. 

We know that the forex market is, unlike others, almost always open and this characteristic often draws traders into assuming that they are in a position to take action just because there seems to be movement. This compulsive and uncontrolled drive is frequently emphasized by a desire to increase one’s capital, but they, unfortunately, lack the insight into the market’s nature and the skills to plan their actions. As the market typically moves quite randomly and unexpectedly, traders usually fail to grasp the fact that they can only trade when there is an actual trend or a move taking place that is worth the risk they are about to take on. Due to these reasons, it is crucial that traders learn how to plan their trades, weigh their options, and construct a plan based on the charts.

What traders are summoned to do is strive to understand why their results do not match their initial expectations and become introspective to reach invaluable conclusions. The ability to ponder actively and check in on oneself is key because the realization of what has caused all the losses one has had to take renders the trader free. When people get into thinking of why they made a certain move and what kind of behavior enabled a certain string of events, they may come to understand how their personality is linked to the outcome they have never seen coming. Once they start unfolding layers and opening up to an internalized assessment, traders have a real opportunity to see how their traits and characteristics affect and create their trading styles. What is more, this process also allows traders to discover areas where they are likely to struggle as well as parts of their personality which can be particularly useful for their trading careers.  

Since many of us, including traders with years of experience in this market, lack this deep understanding of why we keep making the same mistakes over and over again, it is high time that we asked ourselves why this keeps happening. Why is it that we repeat the same actions that continually impact our trading in a negative way? Unfortunately, even when traders make a promise to themselves that they would be more disciplined and that would strive to control hazardous behaviors, their actions often fail to follow their thinking. If we had the power to do everything ourselves, we would have corrected our flaws by now. As this is not the case and we are unable to effectively alter the behaviors that proved to be detrimental to our finances and accounts long ago, we need to acknowledge the fact that there is a deeper underlying problem.

Learning the basics of this market may take a few months, after which you will be fairly versatile in charts, currencies, crosses, and rates although, needless to say, the amount of time needed to study yourself is much longer. With the development of a trading plan, you are rounding off your trading career, thus setting yourself off on a good path to prosperity. We know by now how the market is going to oscillate freely and regardless of what you chose to do at a particular moment and, as such, it is still not the least uncontrollable factor – you are. Each trader is the variable that can put effort and work on himself/herself to become a constant in whichever context. And, again, in spite of what market situation you find yourself in, you need to find the beliefs, skills, and steps that will put you in the group of winners because this market is always going to bread both winners and losers under all circumstances.

To be able to create an effective trading plan, traders need to set realistic goals and returns, so once they complete their education on forex basics, they need to move on to its practical applications. It is unfortunate that after years of trading, many individuals still show no knowledge of some elementary terms such as currency swap. What is more, even when they do complete the initial learning stage, traders are faced with the cold reality where many theoretical items of knowledge go against what they are required to do in actuality. As in real life, theory always differs from practice and this is the concept shared across various businesses, asking people to always come up with new and innovative ideas to adjust to real-life situations. 

This article will be divided into several sections – we will firstly assess and explain the forex market, show how it operates, and reveal some interesting facts that traders may use in the future. Then, we will move on to currencies and learn about the major currencies and different monetary systems across the globe. Afterward, we will highlight the differences between going short and going long, which are considered essential for trading, and see how we can use pairs trading. We will also learn how traders actually get their orders filled and how we can reach the market. In addition, we will cover the differences between amateurs and professionals, where you can go through a checklist and assess yourself. Last, we are going to analyze different constituents of a trading plan, giving you a definitive list of the parts you need to incorporate when creating your own trading plan. 

The Forex Market 

The Foreign Exchange market, otherwise known as the FX, Spot, Cash, Currency, or Interbank market is the largest one in the world so far. With an incredible turnover of people and finances, this market is entirely different from any other marketplace or trading experience. As such, forex required all interested parties to exude a special interest in these topics and show a true passion for trading. For example, many expert traders who first started off in some other markets quickly learned that trading currencies differs greatly from experience accumulated while trading equities or futures. With equities, in particular, the stock market opens at 9.30 AM EST and closes at 4 PM EST each and every day. This schedule allows stock traders to go home at the end of the day and relax without thinking about trading or needing to make a move outside their working hours. Trading currencies is, however, vastly dissimilar because of the market uniqueness and the fact that it does not close the way others do. Many professional trades explain how they see forex both as a blessing and as a curse, having experienced the greatest wins and the biggest stress trading in this market. Experts also point out how the FX market rendered their lives less traditional than before owing to the intricate characteristics and a distinctive schedule each currency trader comes to develop over time.

It is interesting to note how traders within the United States of America typically trade currencies on the side, while they primarily engage in trading stocks, options, and/or futures. Traders in some other countries, however, appear to be strictly focused on the forex market because the local markets are quite underdeveloped in comparison to the currency market. Canada could serve as a great example of a country whose stock exchange includes solely a few hundred stocks out of which only approximately 100 have a volume decent enough to start trading in the first place. As the market is simply not big enough in terms of depth and liquidity, Canadian traders are understandably more specific with regard to the markets they choose to trade. Similarly, Indian local markets severely lack structure and are highly affected by corruption, which directly propels locals to turn to currency trading. 

With $4 trillion transactions a day, the forex market is undeniably immense and diverse. As such an immense marketplace, its scope encompasses the US stocks, futures, commodities, and the Treasury markets combined and multiplied by three. Interestingly enough, despite its wide applications from the perspective of geography and the fact that it is so widely dispersed and lucrative, forex actually has no physical marketplace. Stocks, for example, are traded at the New York Stock Exchange and, even though technology has changed the way everything is processed, orders are still sent to the nearest exchange where they are filed electronically whenever a trader clicks to buy shares. Another American stock exchange, the NASDAQ, however, does not have an actual building although it ranks second after the New York Stock Exchange. The advertisements created for this exchange even seem to suggest that traders can actually walk freely into its offices when, in fact, one could only find empty desks and computers in their database located in New Jersey.  

The forex market resembles the NASDAQ, as traders cannot find an actual exchange that they could visit. In actuality, the forex market is comprised of various banks, corporations, and traders that weave this intricate network together. All rates are put on the interbank rate list with thousands of participants giving their bids and ask, thus creating the market in question. Forex is also known for its high liquidity that surpasses any other market along with the unique speed of trade and transaction costs. In addition, when compared with the stock market, forex traders need not worry about the low volume and large spreads between the bid and the ask (or between what you buy it for and what you sell it for). In the currency market that numbers such so many participants, the number of transactions is incredibly high, which entails that traders need not worry about the same challenges that are present in other markets. Aside from its tight spreads, the FX market is also praised for the best possible rates for spreads and commissions. 

Trading styles can be truly diverse and they may vary from one market to the other. As forex is a trending market, most traders are solely interested in directional trading, i.e. traders buy and you sell or they sell and then they buy, although they have a plethora of other options at their disposal. For example, in options and futures, it is possible to try spread trading; in trading stocks, participants can learn about pair trading and, in trading currencies, everyone is mostly governed by the notion of making a profit based on the difference between buying and selling, which is what directional trading essentially means. Despite the many trading variations that traders can test and use, forex is an exceptionally good market for directional trading because of its depth, the lowest prices, and the best trends.

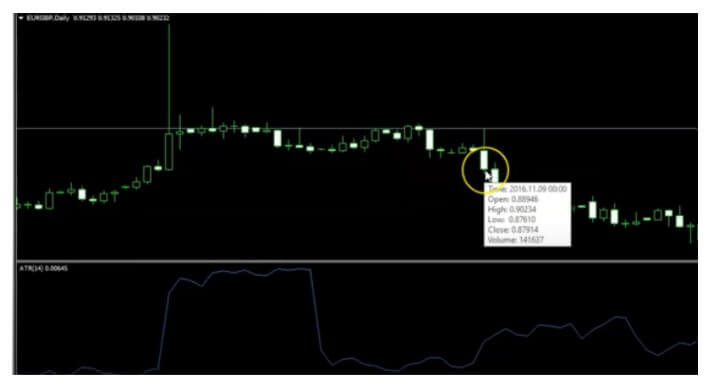
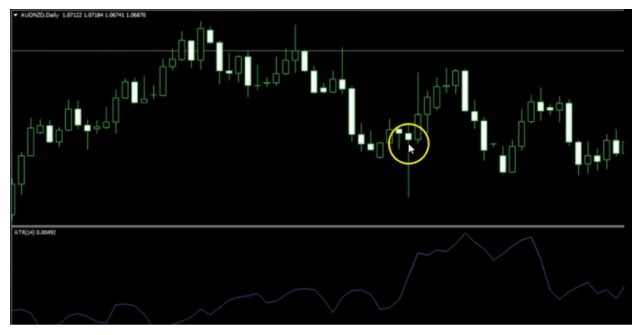
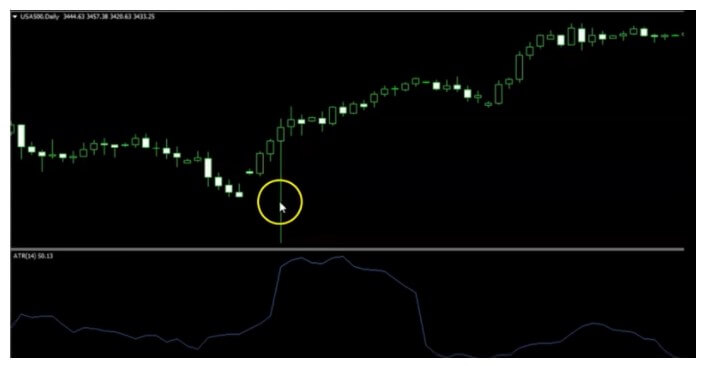
In the stock market, a particular stock can move in a specific direction for a few days or a few hours before it finally pulls back. In the currency market, the price has been known to keep moving one way for five or more days without any substantial pullback. Prices in forex can even keep going down without a bounce for over a month too, which leaves much room for successful directional trading due to the trending nature of this market.

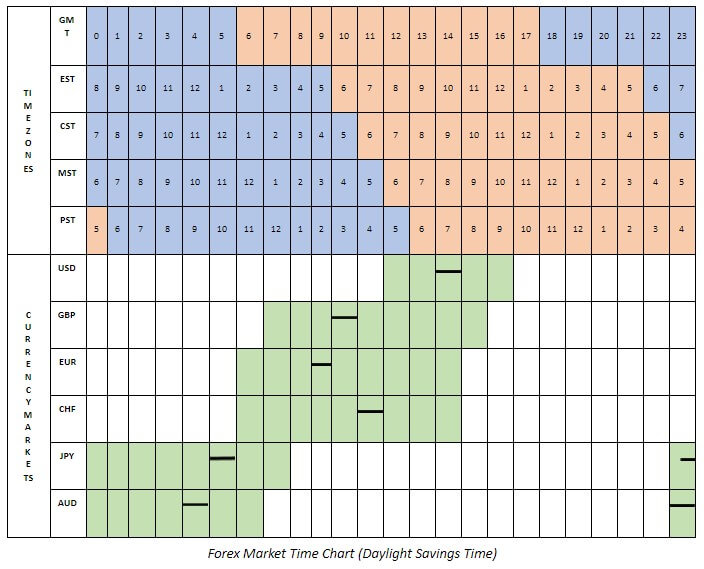
As explained before, it is the nature of this market to be constantly open. In fact, the forex market offers 24-hour access over 5 days a week. It opens at roughly 5 PM EST on Sunday and closes at about the same time each Friday. Due to its availability and ease of access, traders often feel compelled to trade and they often do it excessively, falling into the trap of overtrading. Many professional traders explain how they have struggled with this issue in the past, feeling grateful that they started in some other market first. We have seen above with some other markets how traders are unable to click any more buttons or make additional trades once these markets close at the end of each day. As forex does not have this ability, it is important to remember that we can only enter trades when the market is there or when there is sufficient energy to do so. As in the forex market, we do not need to wait for the following morning to start trading again, we truly need to learn when we can and cannot trade because trading whenever we feel like it is unproductive and quite hazardous as well. 

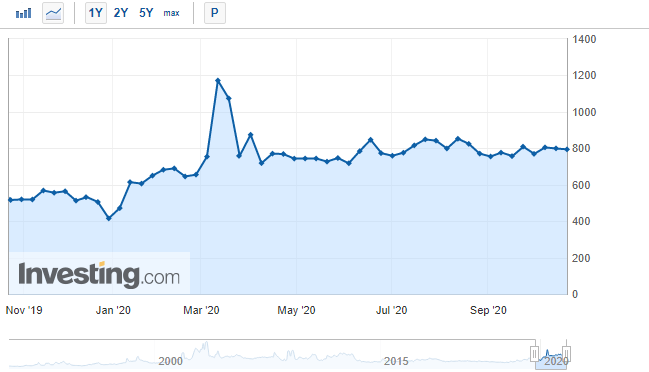
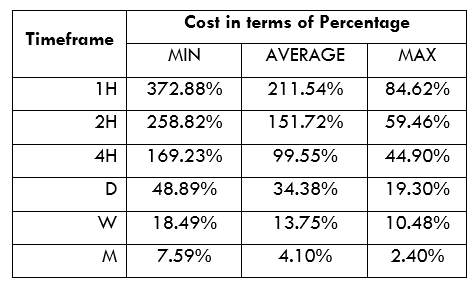
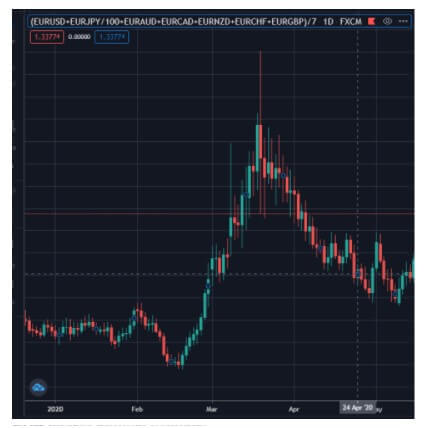
Most currency trading is done through the banks, which are major market participants that are always in the act of buying and selling, as well as through the interbank rates. The reason why the forex market is always open lies in the fact that one can always find banks to be open sometime, somewhere in the world. The first bank that opens on Sunday with respect to the daylight savings time is located in New Zealand, immediately followed by the banks of Australia and Japan. As the chart below shows, both the Australian and the Japanese banks close just after European banks open, which only points to the nature of the currency markets to always be open and running somewhere on the planet. We can also see how when the US market closes, the New Zealand banks open up, so trading happens continuously. This chart below is clearly very inviting for anyone who wishes to start trading, and with so many options and availability in terms of time, it is easy to fall for the illusion that you can trade anytime, whenever you please. 

High leverage, which is an inherent part of trading currencies, can be either good or bad, depending on how it is used. Many traders struggle with overleveraging, which is one of the fastest proven ways to lose an account. Traders have confessed to having lost 25% of their accounts in the past, and some have even gone beyond 50%. Even with a loss of smaller proportions and of a lower percentage, after two losses in a row, all of a sudden, this person is down by nearly half of their account, which means that they need to double that return to get that back. Even if they do get wins, the losses in between can be so heavy that they enter a downwards spiral causing their account to gradually fall down in value. 

While it is increasingly wise not to start with a lot of leverage, it is also incredibly important to get used to adding leverage to the winning trades. The Forex market is truly exceptional because it proved the traders with the highest leverage power among all markets; however, it is at the same time one of the greatest challenges for forex beginners. It is because of these hidden dangers that traders need to use a strategy and determine where to put a limit. For example, you can limit your leverage to 5%, but there is no need to go all in all at once. You can start slow and buy one lot, and if this turns out to be a good trade, you can then buy another lot and repeat the process again and again. Most importantly, if this trade keeps going your way, you may end up buying five lots in the end, but you do not need to hit your limit right at the start. This is extremely significant advice, as you will be much better off if you gradually build up your position. That way, even if you do take a loss, it is minimal, whereas you leave room for your wins to get really big.

Some additional benefits of the FX market include low transactional costs, low accounts minimums, and above-average profit potential. The amount of cost to execute trades has dropped considerably in recent years. Nowadays, there are no exchange fees and clearing fees since forex is an over-the-counter market. Additionally, individuals today can get started with a minimum account for as little as $500 and there is no doubt that forex trading has massive potential regardless of where you are on this planet.

Currencies

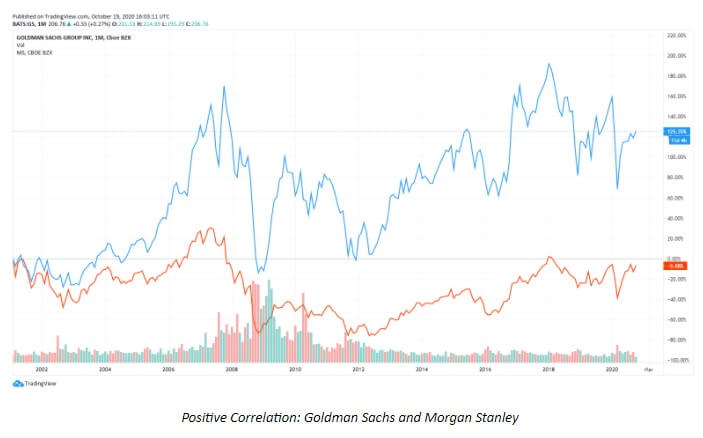
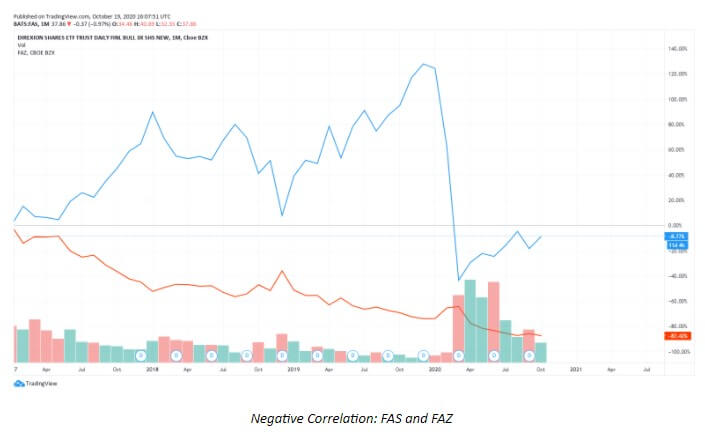
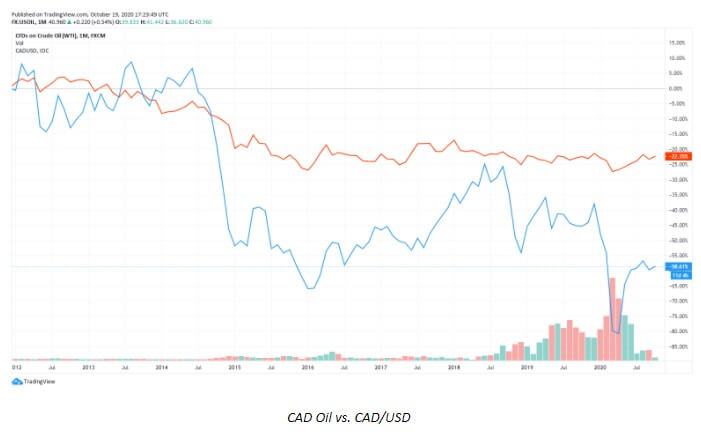
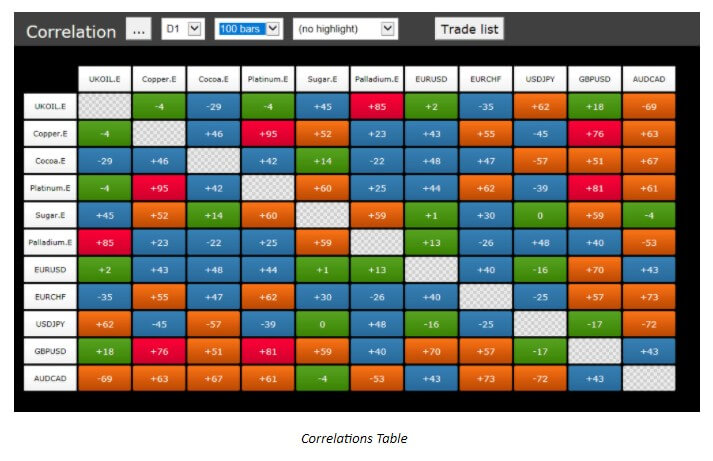
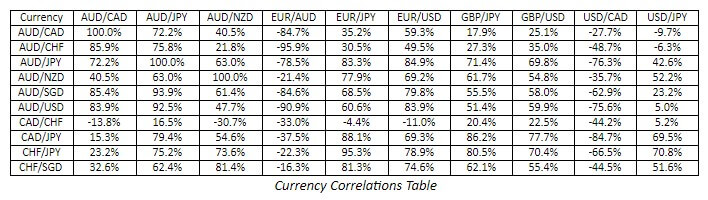
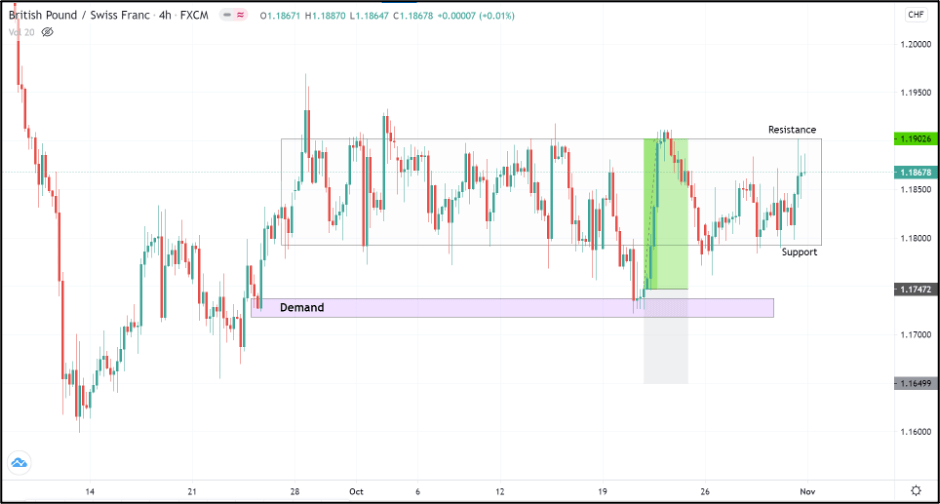
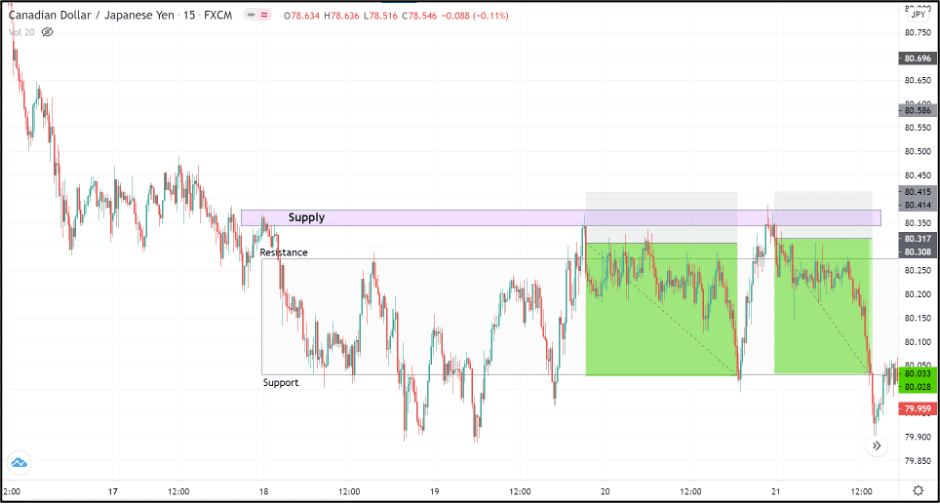
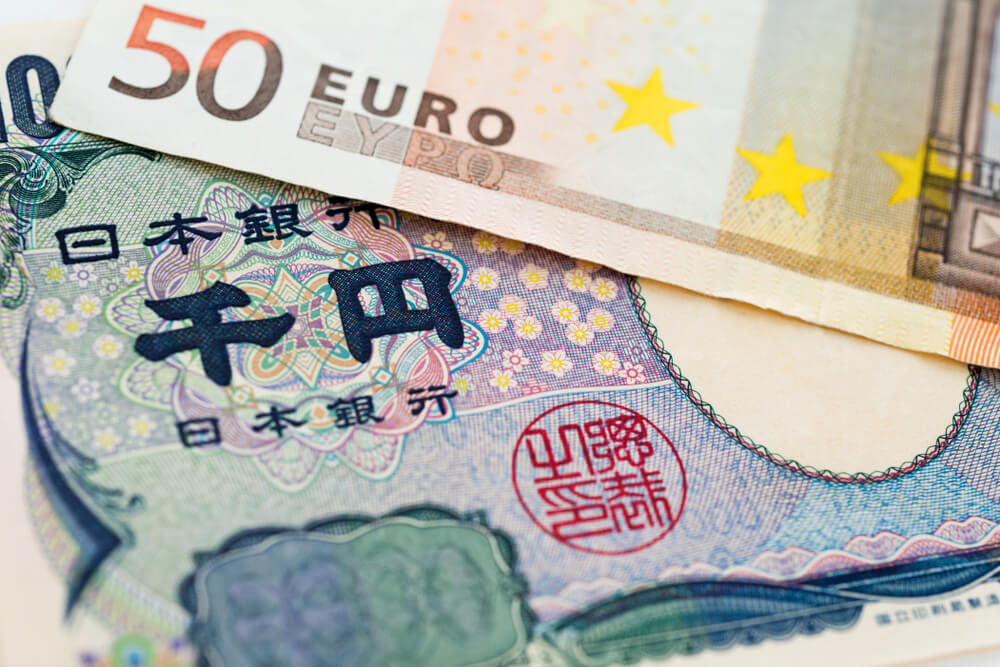
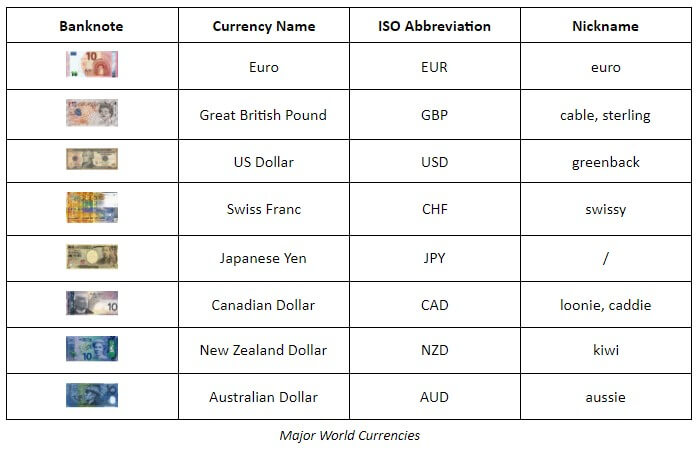
Today, there are more than 80 currencies in the world and, understandably, we cannot possibly trade them all. Despite this diversity and abundance, we only want to trade the most liquid currencies. We have no desire to trade some obscure currencies such as the Indonesian rupiah because there is a lack of volume, the spreads are wide, and there is a lot of slippage involved. Traders are advised to focus on the major eight currencies – the EUR, the USD, the JPY, the CHF, the GBP, the AUD, the NZD, and the CAD. Some people also like to add currencies such as the Swedish krona to this list, which may not make a lot of sense because this currency is highly correlated to the EUR. This essentially means that if the EUR goes up, the krona will do too. Therefore, if either one of them goes down, the other one will follow as well, so experts would typically recommend traders to just trade the EUR in this case. Similarly, a person wishing to trade the Hong Kong dollar might want to know that this currency is pegged to the USD, so trading the latter would simply be more sensible.

As traders should always focus on the major currencies, they should also strive to learn as much as possible about them, including their nicknames. The alternative name for the GBP, for example, is cable, which is completely understandable considering the currency’s history. Back in the 1920s, the very first telecommunications line was laid across the ocean from London to New York City in order to get quotes in real-time. Therefore, whenever someone wanted to get a quote on the exchange rate of the GBP, they had to go through that cable stretched across the Atlantic Ocean. Soon enough they started asking “What’s the quote on the cable?” and the rest is history. It became common knowledge that whenever someone would refer to the cable, this person was referring to the GBP in fact. Additional names for the GBP also include the sterling or the pound sterling, while some other currencies such as the EUR do not have any nicknames. Nicknames can get quite creative, such as the greenback for the USD, and we may see how certain alternative names are often derived from the actual name of the country (e.g. swissy). 

Some traders even shared that when they heard some currencies’ nicknames (e.g. loonie for the CAD), they assumed that they referred to an unstable person due to the meaning of the word. The loonie, clearly, is not a name for someone who is challenged in any way, but the name of the C$1 coin, which originates from the name of the bird (loon) engraved on the front of the coin, which is why the Canadian $2 coin is called the toonie. Each one of these currencies will also have a symbol, and most of them are acronyms or first letter abbreviations that are used frequently in writing and in speech. 

Pairs Trading

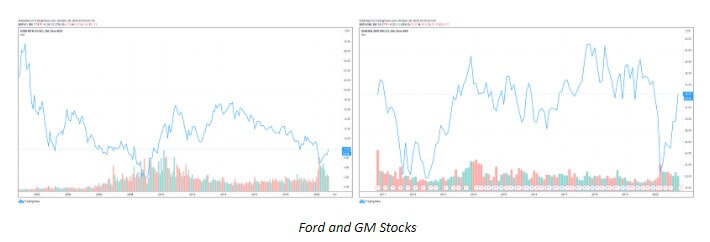
Pairs trading is a strategy that consists of going long on one thing and short on something else, which means that traders will always enter two trades at the same time. For example, a trader can show interest in Ford and GM stocks (the two companies’ charts are shown below) and decide to go long on Ford and short on GM. This concept entails that the undervalued stock is bought while the overvalued one is sold short because of the premise that one is a better stock than the other. By doing so, the profit does not depend on market activity any longer because both of these stocks are going to go down if the stock market starts to sink. Should the market go up, however, both of them will also rise in value. In addition, if money starts pouring into the Automobile sector, it will reach both of these stocks too. This is called a market-neutral strategy which entails the effort to reduce the impact of all the things that make stocks move up and down in value. If you do a pairs trade with Ford and GM stocks, you are taking all the components affecting these stocks out of the equation. That way you will inevitably make money if your premise is right. Even if both of these stocks crash, which is what happened in 2009 when GM almost reached zero and Ford went down by 42%, your short position made a profit of 60%.

To further clarify the previous strategy and provide additional information, it is also vital that we practically explain what going long and going short entail. The two are found among the most important concepts to remember because trading will always involve one of the two if not both at the same time. Whenever a trader goes long, he/she actually buys something first only to sell it after. Traders always look for a discrepancy in price, so they may buy something for $50 and sell it after for $5 more. This concept is something that most beginners in the forex market seem to comprehend effortlessly. However, early on, traders seem to have difficulty with understanding the other concept because it seemingly differs from what most people are accustomed to. When we go short, what we actually do is sell first and buy second. This is what traders do when they, for example, believe that a stock is going to go down, so they may sell it for $50 (which is allowed), which then makes them short. If the stock goes down to $45 and the trader buys it at that price, he/she makes a $5 profit. Unfortunately, if its value goes up, this person will find himself/herself at a loss. This is the essence of going long and short in trading.

Forex Brokers

Any trader who is ready to make use of his/her system and buy a specific cross must do so through FCM which handles all such transactions. FCM is in fact a name for a broker in the stock market which acts as an intermediary between the two sides. As traders cannot possibly visit the nearest stock exchange and buy 100 shares of a company, they actually have to go through an individual, a broker, having a seat on the New York Stock Exchange. The same applies to the forex market where all traders pass through an FCM because the entire process is regulated in the same manner. Hence, any trader wishing to get to the market must do so through a broker.

In the world of currency trading, there are several brokers traders may already know of. The largest currency trading firm in the world is FXCM, which is also known for its infamous moment when they almost went out of business due to the Swiss national bank decision to pull their peg to the EUR in 2015. The company ended up losing more money than what they had in their accounts, thus threatening all clients’ finances. Luckily for everyone involved, FXCM managed to emerge from the potential catastrophe unharmed as they were bailed out. The company is no longer operating within the United States after it was banned by the Commodity Futures Trading Commission (CFTC) which revealed some fraudulent behavior on behalf of the company. The entire turmoil over the event and disclosure of the information was settled in 2017 when FXCM agreed to pay a $7 million fine and never seek to register with the CFTC again.

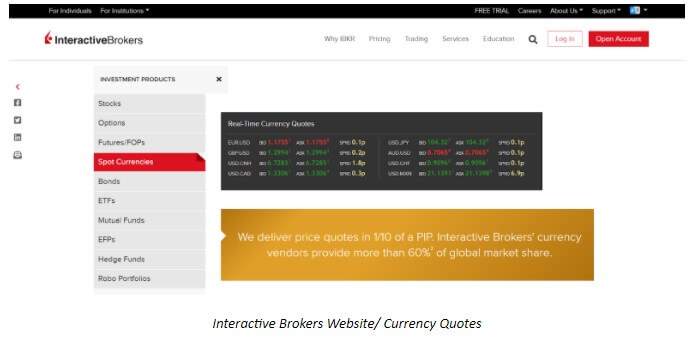
Another well-known brokerage firm is IB (Interactive Brokers), which is a huge multinational company often praised for their professionalism. The benefit of collaborating with such a company lies in the fact that it is used to dealing with currency traders and currencies. Besides, Interactive Brokers always wins all the awards for the fastest execution and the lowest cost alongside having been rated first by Baron’s, a US weekly magazine/newspaper published by Dow Jones & Company. Along with that, since all brokers, or FCMs, always publish the percentage of their profitable currency traders, IB usually displays between 15% and 20% of such winning traders although this percentage is at about 50% almost every single month. The company is also preferred by expert traders owing to its professional and fast execution as well as the greatest spreads and fees.

Apart from choosing a broker you wish to collaborate with, it is also necessary to create a demo account after you have worked on your simulator and perfected some of your strategies. Different people will always use different systems, so some traders might opt for MetaTrader for example. MetaTrader operates similarly to IB and traders should expect to become conformable using the platform after a week’s time. Traders are simply required to get used to having and using a demo account; besides, it is typically the place where professionals go too. 

Interactive Brokers also offers multiple trading platforms and they have the best mobile trading platforms (e.g. TWS or Trader Workstation) for which they have already been awarded in the past. These platforms are truly applauded by many forex trading experts who used to have difficulty making a work-life balance in the past due to technological limitations of the time. Most professionals nowadays actually first started to trade in the 1990s, when it was impossible to use phones to check or manage trades unless they were physically behind a system. The internet was a luxury at the time and it was mostly available in the offices only, which meant that traders would have to leave their homes or other social engagements to be able to know where the market was and what was happening, get quotes, or close out a position. 

Mobile trading alleviated most of these problems, so traders are not obliged any longer to go into their offices at night and close their positions which they did not want to keep overnight. These platforms also give traders the freedom to do business wherever they please, and some experts even say how they have had the experience of trading in some unusual places such as a cave or an island. As mobile trading allows you to trade regardless of your current location, it does bear a negative side to it as well. Similarly to the nature of the forex market, which is always open, mobile trading platforms may put extra pressure on traders who are prone to making rash decisions and overtrading. Traders need to have discipline and set up strict rules to prevent making mistakes when they feel bored or compelled to enter a trade, which understandably never leads to success in most cases.

While MetaTrader is undeniably the most popular platform, it typically does not function as an FCM although it can be attached as software to one. Aside from FXCM and IB, traders can also have an account with TDM or ETrade, which equally allow you to make money because they are going to the same place or the same market. Regardless of which platform or broker you chose to use, the rules are always the same. If a trader is unable to trade well and keeps making mistakes taking many losses, he/she will not be able to earn a profit through either of them and vice versa.   

Professionals vs. Amateurs

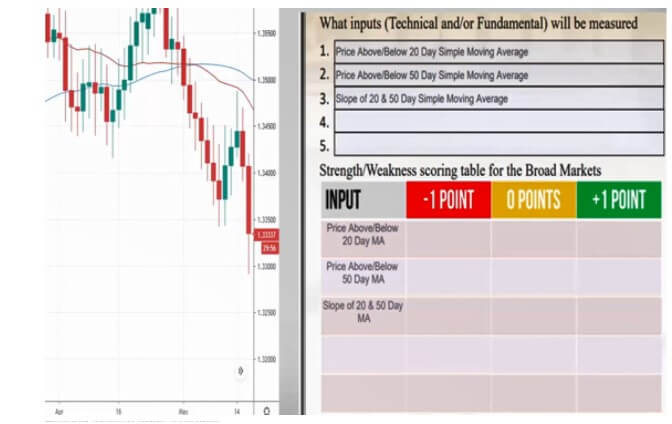
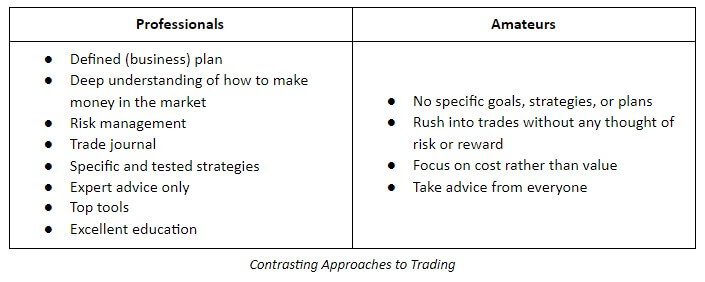
In order for any trader to make it in this market, every single participant needs to treat the entire process as a professional and set the ground for the next steps. Naturally, in order for anyone to be able to see trading from a different perspective, he/she also needs to grasp the difference between the professional and the amateur approach to trading shown in the table below. Professional traders always have clear trading plans with set goals which may vary between daily, weekly, monthly, and even yearly ones. They also know how to make money in the market and manage their risk through the use of stops/hedges. To ensure consistent and continual growth, experts always keep their records making it a habit despite the difficulty. Moreover, professional traders rely on strategies, which is the biggest difference between the professionals and the amateurs, who are likely to jump on any opportunity. As amateurs are likely to be drawn to any movement they notice without a previously devised plan, they are highly exposed to failure because this approach rarely works since traders need to have specific entry and exit points. Furthermore, amateurs are prone to taking advice and tips from any individuals, while professionals in the market strive to consult with other professionals seeking expert opinion. The more advanced traders have also already made their selection of tools and they insist on using the best suitable ones which have emerged top after thorough testing. Furthermore, they have invested in getting informed and educated on topics that may relate to forex. The essence of prosperity in this market lies in having a plan and as you can see, the moves that amateurs make are not only fewer in terms of numbers but are completely opposite from what professionals do to remain on the top of the game. As a professional, everything is clearly designed and set up, which further entails that traders cannot just click buttons whenever they feel like it.

Trading Plan

Before any decision is made, it is crucial to design a trading plan which lies in the basis of any and every activity a trader wishes to take. Simply put, a trading plan translates as the steps you are going to take in every possible situation. It also includes decisions on specific moves you may take on a particular day when an important news announcement is supposed to come out. These choices are never made randomly because they all comprise your trading plan. Every trading plan consists of a number of such decisions that have been drawn and written before any event takes place as a result of your own action or occurring independently in the market. Professional traders predetermine everything and if you do the same, you will know that the market is aligning with your intentions rather than going against you. With a plan and discipline, every trader can achieve success in the forex market.

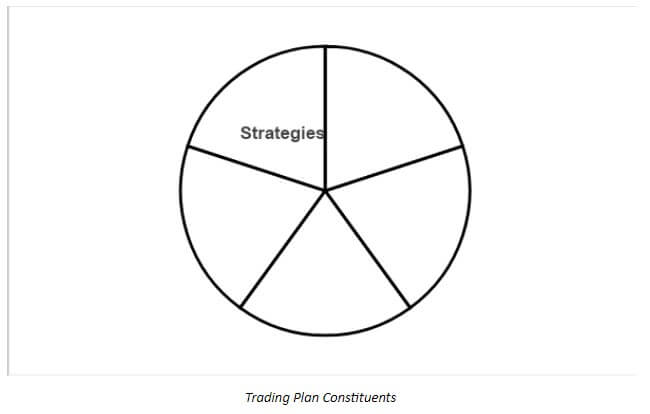
To better explain what a trading plan is, we need to precisely separate its consistent parts and discuss each one separately. Firstly, the initial part of the trading plan always boils down to several questions: why am I am going to do something; how am I going to achieve this; and, what my hours are going to be? The beginning stages always involve the type of questions that concern the trader alone, while the following parts will mostly have to do with your strategies. Naturally, as there are numerous ways to earn a profit, you may need to ask yourself if you are willing to trade breakouts, cup and handles, hammer candles. It is vital that you assess and predetermine what you are going to trade, letting go of all other options. Traders who fail usually assume that it is enough to just sit down and trade without giving it any thought before, but as you can see, the planning stage is essential for achieving success and each part of the picture is equally relevant. 
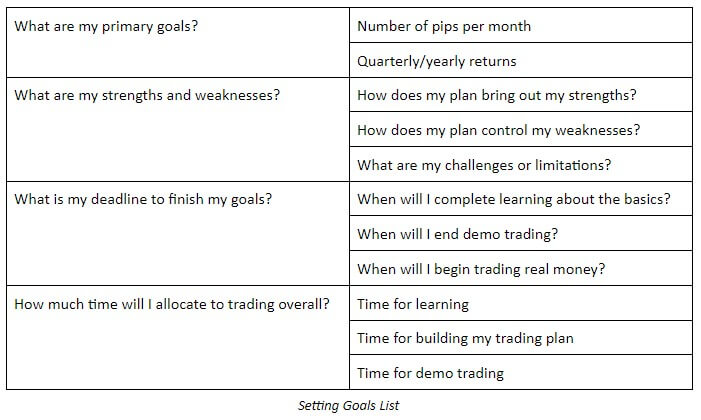
Goals

Before proceeding to read the importance of having clear goals, you can use a pen and paper and create an outline based on these instructions. The first step in your trading plan should be to write about you and determine when you want to complete each stage of the process. For example, when are you going to start demo trading or live trading? When are you going to leave time for education? Is it going to be a span of a few hours on a specific day or will you divide this time frame into several days? You can make use of the list of questions below and fill it with your own answers. Of course, allocating time to clearing up what you want and how you are going to achieve your goals may not be a particularly fun activity but it is the only way to properly build a foundation for your future trading. 

Education

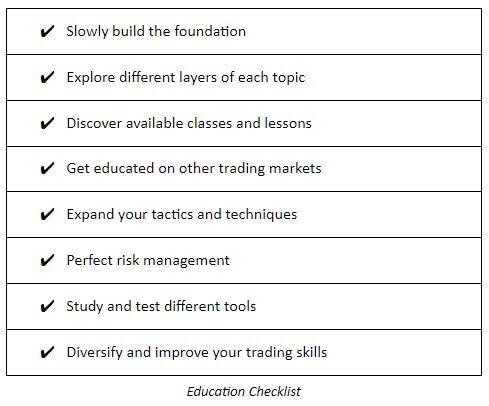
Whenever we discuss education, it is necessary that we first accept that we do not know everything and remain open to being molded and shaped by the information we absorb. Many people turn to professionals for help, but all they are truly looking for is not education but money, wishing to amass a fortune quickly and effortlessly. In trading, however, there are no quick fixes, so if someone already claims to know everything, we may naturally wonder why this person does not already enjoy the abundance that should naturally spring from this richness of information they supposedly possess. When you are open to learning, you reveal that you are a humble individual and that you understand how there are areas you may need to clean up to make room for prosperity. 

While being open to learning is important, it is also vital that you create your own style of trading because no one can trade exactly like someone else. Everyone is different, thus having different psychology, triggers, and personality. Therefore, adopting someone else’s choices and positions might be an unnerving experience, which is why it is important to realize what you can accept, apply, and control. Nonetheless, it is a must for any trader to build his/her foundation slowly and thoroughly. Understand that, as with anything else, there are layers to knowledge on trading, and you can come up with ideas with time how and when you want to learn different things. You should strive to explore classes and lessons that are available and seek professional advice. Expand the tactics and techniques you can apply, and also get educated on other markets where you can trade such as options or futures for example. Last but not least, keep building on your risk management, tools, and skills.

Go through this process and see how the information you take in corresponds to your own personality and traits. Some people may like trading the hourly chart, but you are free to choose any other time frame instead if you feel like that is too slow for you. Most importantly, learn how to use all the knowledge in a practical manner and test it via a demo account. Soak in as much as you can because the more you know, the greater the protection from your own self-sabotaging mechanisms is and, hence, the healthier your trading plan will be.

Risk Management

As we all understand by now, every trader is unique, which is why some people are going to want to enter the daily chart, while some others will prefer different time frames. Although these questions are open to interpretation and depend on personal preferences, time management is an area where such variations must not exist. Especially when you start working as a prop trader and you are given someone else’s money, you are expected to treat that money with respect. Nevertheless, one cannot build this kind of attitude unless it is initiated from the very beginning. 

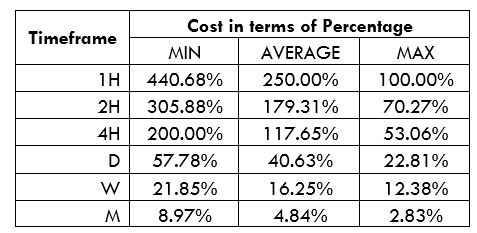
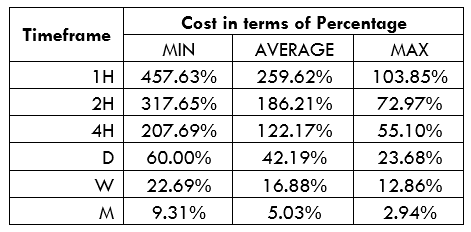
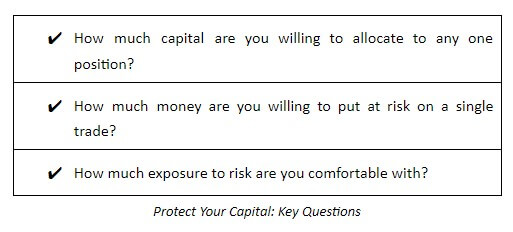
You need to know your rules and as things can quickly turn against you in trading. How can you control the situation and yourself? If you see that a trade is turning sour, when will you draw the line and decide to exit? Also, when you want to enter a trade, how much are you willing to risk if it turns out to be a winning or a losing one? When a particular pair you are trading breaks up above or goes below a certain price, when are you getting out? How much in terms of percentages does it need to pull back for you to exit the trade? All of these points are incredibly important and you need to be aware of them and know the answers in advance. 

Many amateurs start trading immediately, without any preparation, only to realize how they should have learned and figured out everything before they started investing their capital. What this means is that the majority approaches trading as gamblers, not knowing what they want to achieve, how much is at stake, and how much they are willing to risk. As the first rule of trading is to protect your capital, consider the following questions:

Strategies

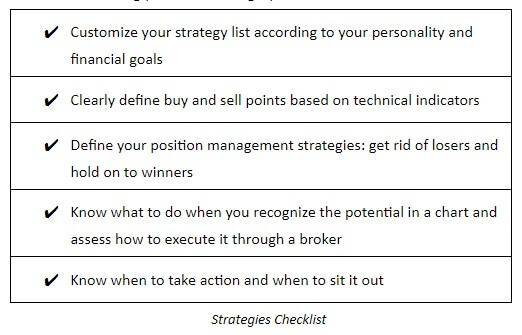
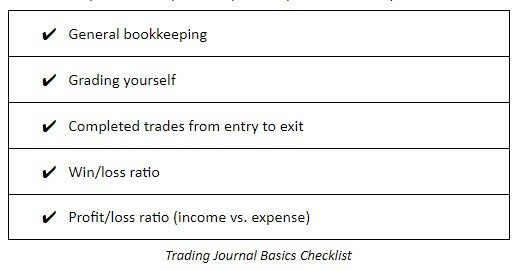
Strategies may vary from person to person and they can, in fact, turn out to be vastly different from what other participants chose to use in trading. When creating your own array of strategies, always think of the question of when you want to enter and exit the market. It is vital that you be as specific as possible and explain to yourself every step you may take at some point. For example, some traders only trade specific circumstances such as high breakouts during some events. While this may seem like a narrow option, it is still an excellent approach because these traders clearly defined the circumstances, their goals, and their actions both for a winning and for a losing trade. Even if you wish to try something new, always make sure that you test it before you incorporate it into trading. It is all these points that your strategy list should consist of and, as long as you test everything out with your system and through your demo account, you and your finances are safe. You can also consider the checklist added below to serve you as a reminder when creating your own strategic plan.

Analysis

With so much room for making mistakes, trading must be kept under close control. To achieve that level of scrutiny, each trader must keep a trading journal. Trading journals are the most effective way in which a trader can keep track of past actions and develop himself/herself. It also allows traders to learn from their mistakes and not repeat them while revealing which behaviors turned out to be beneficial in the past and should be used in the future as well. 

During this process, while you are learning from different materials, taking tests, using a simulator, developing a trading plan, and testing it all through a demo account, you still need to know what your results are. All traders need this form of analysis to know that they are going to make money before real trading begins. Keeping a journal may be the most difficult part of the process for some people, but at the same time, it is difficult to understand why anyone would want to invest real money without any preparation, backtesting, forward testing, and without realizing whether those actions can lead up to any profit. Being detailed and meticulous is a must if you desire to become a professional trader.

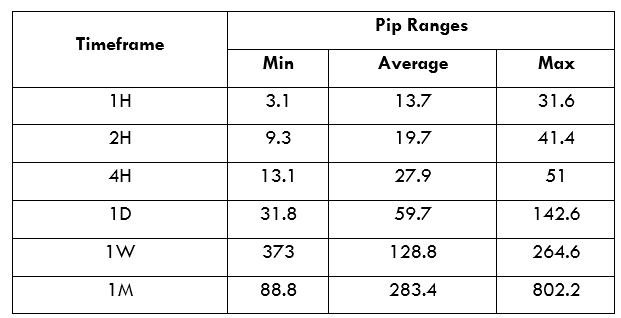
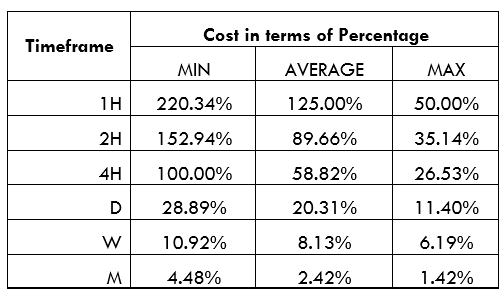
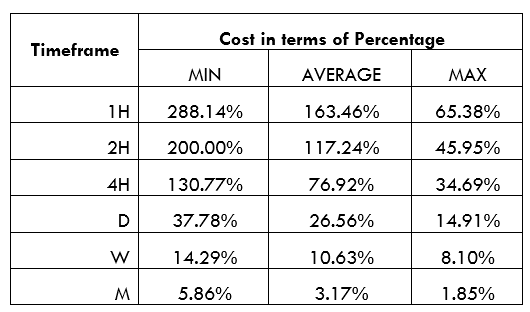
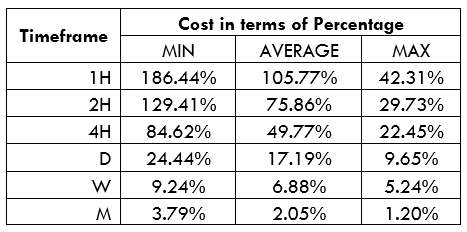
Trading journals are essentially Excel sheets where you enter your trades, your win/loss ratio, risk and rewards, percentage of gain, pip gain, and profit/loss ratio. These pieces of information help you know how many pips you earned this month and what your growth percentage is. Journals may differ based on what you want to keep track of – for example, you may keep different journals for a simulator and for your demo trades. 

If you happen to lack this kind of information and do not keep track of these numbers, you are not trading but gambling. However, if you know that after 100 trades, you win 55 and lose 45 of them; if you are aware of the averages you are making on both winning and losing trades and you can compare them effectively, this no longer falls under gambling. Even if your results have not reached the level of satisfaction or success you want to have while trading, by possessing this information, you are already ahead of the majority of traders who go into this business blindly. Keeping your records and tracking your progress is an immensely important topic and one of the major stepping stones to becoming a professional trader where you can independently follow your rules and system.

While we discussed a number of different aspects that make the essence of a trading profile and portfolio, understand that this is also the very foundation. You should, therefore, view today’s lessons both as one of many facets that constitute any professional trader as well as an approach to trading that makes it possible for anyone to keep trading. In order to complete our trading plans, we also need to educate ourselves on forex basics, currency pairs, and margins, and pips, thus helping ourselves understand the forex market. After we take in all the information and absorb whatever knowledge we had the chance of learning, the time for practice comes. Practice is not only about trading with a demo account but space where you have room to test yourself and see if you are ready to take on the next level. Practice is also where you should stress your tracking skills and use the time for deep analysis that will prepare the ground for the real game. The matter of fact is that, while all these processes may seem dull and too detailed, all effort will pay off the moment you start trading real money. If you desire to be on top and bear the fruit of the market, you must devote time and prepare to get out of the comfort zone. Use today’s tips and advice as practical steps you can take and as an outline on which you can base your trading plan.

Finally, remember that if you could get over your weaknesses on your own, without seeking expert advice, you would have already managed to do so by now. Understand that some faults and flaws cannot be fixed and that we go into detailed planning so as to create a trading plan that could go around those negative aspects of our personalities. See this process as the most useful way in which you can use your personality, knowledge, and skills to evade your weaknesses, stop repeating the same negative patterns, and get the most from trading in the forex market.

Categories
Forex Psychology

Why Conspiracy Theories in Forex Might Only be Half-Truths

A conspiracy is definitely one of the terms that arise a lot of pros and cons among people, depending on the way of their thinking and using their common sense and healthy logic and presumptions. The majority of the crowd get into the endless world of conspiracy theories once they start getting older and being disappointed with society, limited by life responsibilities, and faced with their own failures. By blaming someone else behind the curtain, the one who we actually cannot affect and who is pulling the triggers is one of the paths to enter the wide world of conspiracy theories. These people believe that there is always something suspicious going on behind the scene in every single fragment of their life, without actually being able to prove most of their beliefs. 

On the other hand, many individuals among us completely deny the existence of any conspiracy and these are usually people that buy everything being served to them via media, commercials, press, celebrities’ statements, etc and not having developed their critical thinking or use of logic in their mindset. They even use the term “conspiracy theory” in a pejorative sense, dismissing the possibility to consider other side arguments. 

None of these two aspects can actually be either proved or denied totally, but one thing stands for sure – conspiracies do exist, at least in a form of financial scandals, political affairs, or related fields where power and money play main roles. The games with big money are controlled by people having big money, influence, and power and that is the only certain conclusion proofed by nowadays so many times. Large funds and institutions are usually connected with placing news on the market, which hence provokes adequate moves on the market. 

And let’s remind ourselves for the moment that these moves are made, for instance, through the Bloomberg terminals. The abovementioned terminals belong to partnership Bloomberg L.P., which is 88 percent owned by Michal Bloomberg, the US Democratic party member, and a former mayor of New York City. The entity, together with its subsidiaries makes about USD 10 billion of revenue annually, providing necessary information to the people doing business in finance all over the world through its Bloomberg terminals. Over 320,000 people pay the subscription for use of this software and this is not the only company he possesses through its subsidiaries Bloomberg news and television as well.

It is not therefore hard to assume that someone with that much influence and money imperia would be capable to affect the market and place the news of his own interest, especially considering the fact that M. Bloomberg belongs to the Democratic party, lacking, however, to have the Trump’s charisma, speech and in general capacity to beat him on the Presidential elections. On the other hand, he would be probably capable to set the stock market circumstances and trade trends in the favour of his party, simply because he is in a position to control these factors. It would not be hard to imagine that he could easily start the recession or another financial crash, not him personally of course but by using that great influence he has. But this is something that is yet to be seen. 

On the other side, the US Democratic party itself has used the allegation of another conspiracy theory-surprisingly-through Bloomberg news, as a weapon against Trump’s administration. They alleged that the so-called QAnon internet movement, being supporters of Donald Trump and part of his voting body could potentially become very dangerous or even an inspiration for domestic terrorism acts. Although it remains unknown who is actually Q, the allegations described him as a -positioned governmental officer, supporting Donald Trump and having access to very confidential peace of information related to US national security, nuclear weapons. The QAnon movement originates actually from a connection with another conspiracy theory in the past – during the US Presidential elections campaign back in 2016.

As we can remember, Trump’s opponent and the democratic candidate was Hillary Clinton. The affair that occurred at that time was so-called PizzaGate, and it pertained to the sex trafficking involving children around pizza restaurant in Washington. The conspiracy theory was relating the leading democratic politicians to this affair and Hillary Clinton among them as well. It is, however, difficult to prove how massive is the crowd that supports this theory, especially because they seem to get their support mainly via the internet and online.

Let us, though, come back to the financial conspiracies, which seem to affect the trader’s daily life and certainly have a large impact on the common people’s loss of money, their capital, or retirements. Why are the crowd and the common trends usually the ones that we follow, without having a second thought that the result may not be so brilliant as it may seem in the beginning?

If we understand the control and the power on the forex market it may be easier to prevent the traps and find ourselves in a way better position. The so-called Big Banks are the ones controlling the fluctuance and the times of raises and falls on the stock market, controlling that way the prices going up and down. The Interbank, being the network of all banks present at the market, cca 45 of them, is consisted of a couple of major ones:

Deutsche Bank, Citi Bank, JP Morgan, HSBC, and some of the Chinese banks. As the banks are in constant need of liquidity, they need extra money to put it out there in a market. But their main advantage in relation to traders is that these banks are aware a priori where each order sits, in which direction it goes, does it have tendencies to go long or short on the market, and in which time frame. This is something that puts them in a position to control the market, and once they do, it becomes very hard to respond. Banks are also well connected to the people of great influence, and once they publish information, the major crowd is going one way, for example going long for a certain type of currency.

The banks then cut that trend and start going short and this is the point where people lose their money. Not always, though. In order to continue this game and to keep playing the traders must also win sometimes. But sometimes only, and this is the so-called “Black Jack theory”. It is a small win, with a strong psychological impact: makes one feels good, smart, and capable to do so much more. And this is the momentum where the majority of people, instead of taking their money and invest in something else, keep playing. And they usually lose in the end, but the game goes on. A good comparison with the forex market here would be a casino, that functions the same way.

How dangerous it is to follow the crowd may be shown on the example of the EUR/CHF crash back in 2015. That was the pure example of how can banks affect price going one way while traders are going the other way. At the aforementioned time, the Swiss National Bank had ordered a pegging of CHF to EUR, meaning that CHF will not drop below the EUR 1.2. Pegging is the way of controlling one country’s currency rate by fixing it to another, presumably more stable currency. As a result of this, the common thought of the majority of traders was to put long on EUR/CHF with the thought in their mind that CHF could only go up and not down. What happened next was that the above mentioned banks used their influence, power, and capital and persuaded the Swiss National Bank to remove that peg. And the swiss national currency went down, provoking one of the biggest financial crashes in a newer history. Not only traders had lost after this happened, but entire platforms and funds crashed and closed and it all happened in a time frame of one day. Afterward, the CHF started going up again slowly, but that was not enough to repair the damage.

The common people cannot compete with big banks, the banks will always be one step further, if not for anything else then because of the fact that they had the information prior to simple individual trading on the stock market. There is, however, a way that one can profit and make smaller benefits from time to time, by using the market moving in waves and by going out with a profit and investing again somewhere else at the right timing. This would be like turning the above-mentioned BlackJack theory in his own favor and there are tools in a market that can help with this.

One of the theories in trading against the crowd is the so-called contrarian trading approach and is worth mentioning in the context of what is being said so far. Contrarian trading is trading against the current market sentiment. The market sentiment is shown on some financial platforms that show the indicators in which direction traders are positioning all over the world, showing the percentage of traders going long and going short or whether the market signals are bullish or bearish. This is being used as some sort of a prediction, to anticipate prices direction in a market and make a proper move timely. 

Hence, trading against the current market sentiment would actually mean that if the present situation on a market shows that the majority of the investors are going short, the contrarian will go long and vice versa. Such a way of trading requires, of course, in-depth knowledge of the market circumstances, updated information, experience and follow up of the client sentiment indicators mentioned above. In that sense, one will be able to figure the exact entering and exiting points while trading, in conjunction with other indicators. Trends get to some point when they become exhausted and recognizing that moment is vital for contrarian trading-if the masses are going one way, contrarian will do the opposite but at the right timing. That is why some prior experience is needed here, in order to be able to recognize such moments.

To put a bottom line and pull out a conclusion here, it is important to say that we should not ignore conspiracy ideas and theories completely but to be able to determine their impact on money, power, influence because it all ends up for these motives. Should be aware of fake news, half-true news at certain moments and open up our minds and think of the reason why such information is placed to us right now, and how this affects the behavior of the investors, politicians, etc. Conspiracies had existed through numerous affairs and historical happenings in the US for many decades now, from JFK murder to the aliens and bunch of secret agents working together for evil purposes or whatsoever.

However, it is very important to sort out the information, and if we talk about market trading – to avoid following the masses. 

Categories
Forex Basics

What No One Else is Telling You About a Real Trader’s Daily Routine

What’s the secret to trading success that you won’t read about in books or won’t even hear mentioned too often?

It’s kind of funny but there are some things traders almost never talk about – even among themselves – but when you start to quiz them about these topics, they actually love talking about. They just somehow don’t seem to bring them up on their own. Well, one of these topics is a trader’s daily routine. You’ll never hear a trader start talking about their daily routine and the number of people talking about this versus just about any indicator or trading tool is vanishingly close to zero. And yet, if you ask an experienced trader about their trading routine, you may as well settle down for the long haul because they can talk about this sort of thing for hours and go into great detail.

In fact, we recommend you do talk to more experienced traders about this because the amount of things you’ll be able to learn is equivalent to a small goldmine of knowledge and hints and tips. And the beauty of it is that this is the sort of stuff you’re never going to learn about in books and that nobody really talks about on the forex internet. Instead, most traders sort of work this out by themselves, usually over many years of trial and error. And both the trials and the errors can amount to a painful learning curve that will not only leave you stressed out and dissatisfied, it could also cost you potential gains.

But ultimately, having a well-worked out and systematic daily routine to your trading could mean the difference between being an amateur who’s just playing around with trading for a few extra bucks and a proper, professional forex trader who has made this activity into a veritable career. In other words, into someone who has committed to forex trading on a fulltime basis and is determined to see it through until they retire or – as is the case with most people who have made a genuine commitment to trading – well beyond their retirement and probably until the day they die. In many ways, at one point being a forex trader ceases to be something you do and becomes something you are.

Well, one of the steps along the way to that transition is working out a reliable and consistent but manageable daily routine. You can think about it like this: If you wanted to be a professional in any other business or walk of life, you would have a schedule of working hours and tasks that would shape every day you’re working. 

It’s different when you’re just starting out, of course. That’s when trading has an excitement to it and the adrenaline will keep you going through a lot of bumps on the road for many years. But when you’ve been doing this for many years – over a decade, say – the excitement gets worn down somewhere along the way. Thankfully, it takes a few other things with it. The stupid beginner mistakes are also gone, as are the sleepless nights or the nights spent staring at the charts. Also gone is the undercurrent of anxiety you feel about making mistakes or making the wrong decision. Instead, all of this is replaced by a steady, often repetitive, daily grind. In other words, a routine that makes trading feel more like a business.

Well, part of working out your daily trading routine is making the mental shift from thinking of trading as an activity you do on the side, to thinking of yourself and your trading as a business. And that’s not a bad thing. Making forex trading into a legitimate business – filing business taxes, managing business bank accounts, keeping track of business expenses – makes it seem like a different activity to when you’re just a lone wolf out there on your own, trying to learn how to make trading work for you.

As with any legitimate business, there are going to have to be those few things you have to do regularly and, if you want to be successful, you’re going to have to do them well. Most successful businesses will have set hours – not based on when they want to work but dictated by external factors, such as when it’s optimal to work. Say you have a small restaurant, you’re going to want to catch the lunchtime rush and the evening dinner crowd. It’ll hurt your business if you miss these peak times of the day while your competitors are taking your clientele and you’re still paying rent on the space. And you need to know when those peak times are every day so that you can plan in advance and have everything set up. It’s no good to you if your lunchtime customers are coming in but you’re still cleaning tables and getting the kitchen set up.

Most people don’t treat forex trading like a business – at best they treat it as a side-gig or, at worst, as a hobby. And most people don’t manage to make forex trading successful. But if you do want to make it work for you, you have to make that switch. Therefore, setting out a comprehensive daily routine is a huge part of becoming a truly professional forex trader. The absolute worst thing you can do is go in with no plan, no structure, and no routine. With no routine, you will inevitably end up sitting in front of your system all day long, which will have a few very negative knock-on effects. First, you will not be using that time constructively and most of it will be wasted in endless loops of, “should I trade now? …Or now? …Or now?” And not only this but you will almost certainly end up falling into the trap of over-trading – i.e. trading too often, out of boredom, or because you feel the pressure to make all the time you’re investing count for something.

In a manner of speaking, traders who focus all their energies on equities have it easy. Stock markets are only open for seven and a half hours per day, which is actually very useful. First of all, it gives you a set structure right there – your trading is limited to this window and someone else has decided for you when this window will open and when it will close. Secondly, it only gives you so many hours in which to be an idiot. This is especially useful when you’re starting out because making mistakes will be a big part of what you do. But with forex trading, on the other hand, you have almost all the time in the world to be an idiot and make mistakes because the markets are open for neigh on 24 hours per day. You can sit yourself down in front of your system at just about any time of your choosing and make a mistake. Also, you can get sucked into checking on the markets at all kinds of times of the day. Hey, we’ve all done it. It’s three in the morning but why don’t I just check the markets one more time, just in case. We’ve all been there. But thankfully, because you’re now reading this and with a bit of luck some of it’s getting through, maybe you can recognize this behavior when it crops up and avoid doing it for years on end.

Going from part-time trading to full-time is a tricky business. Your instinct is to think that now things are going to be easier because you have fewer commitments preventing you from trading. But actually, the opposite will turn out to be true – unless you have a strict routine.

Ultimately, this is a question of self-discipline. Those traders who work this out somewhere along the line – whether it is sooner or later will depend on their own personal make-up – will have a much better shot of turning their trading into a successful business. Those who never figure it out will eventually fail and be left by the wayside.

Part of the problem is the essential rhythm inherent to trading. The markets have their own ups and downs, periods of activity, and lulls where nothing is happening. There will be days – sometimes several in a row – where you simply end up doing no trading. The danger here is that you will start to get itchy fingers and will probably end up pulling the trigger on a trade or on several trades that you should have stayed out of. All because you end up feeling like that time you put in just waiting is wasted and you get eager to make up for it. Part-timers don’t suffer from this in the same way because the time they have for trading is more limited by other factors (like their day job) but it is a bit pitfall for full-time traders.

The smarter traders out there will use some of the time they spend in front of their system to run tests of tools or indicators that might end up becoming useful tweaks to their system in the future. That goes some way to alleviating that sense of wasted time.

Designing Your Routine

How you design your daily trading routine will depend on a lot on you. It isn’t entirely up to you because you won’t be able to completely avoid those times when the markets are lively or those news events that come in from time to time to give the price of a pair of currencies a kick in one direction or the other. But you will need to tailor your routine to fit with other parts of your life. Lots of traders out there have families and children and those are a good example of commitments that are external to your trading but that are ultimately more important. You will need to find a balance that works for you and enables you to still live your life the way you want and keep in mind the needs of your family.

But what do you do with those conflicts that are going to crop up from time to time? Say there’s a big news event coming up and it clashes with something else important in your life – say your daughter’s recital for example. This is where that self-discipline comes in because you are going to have to be strict with yourself. If you are a professional forex trader, you will essentially be trading for the rest of your life. That means you will likely see hundreds of similar news events and have plenty of opportunities for those juicy trades. You can get a hold of your fear of missing out and go to your daughter’s recital.

At the end of the day, if you don’t take control of your trading, your trading will take control of you. Everyone out there who has been trading for any meaningful length of time will have had this feeling like the market has begun dictating things in their life. Though you have to factor in big market events into your routine, you also have to make sure that the whims of the market and your desire to always be trading don’t start to impact your quality of life. We all got into trading because we want our lives to be better – if it starts going the other way, you need to be aware of that and you need to rein it in.

One of the ways you can begin to do that is to plan each trading week out in advance. Sit yourself down on Sunday night and go through your calendar of market events for the coming week. If you see gaps where there are likely to be quiet periods in the markets during the week, prepare some testing and research you can do during these times. In order to do this properly, you will need to be on top of the news cycle for the currencies you are trading. You can’t possibly account for the unexpected news events that will come out of the blue – that’s why they’re unexpected. But you do need to have a calendar of the regular news cycle that can become part of how you plan your trading schedule. 

Set up a calendar of regular news events such as central bank announcements, national GDP reports, and other economic forecasts made by governments and the major financial institutions. You can treat this calendar as a constant work-in-progress project. You can constantly be updating it and also you can use it to cross-reference past events so that you build up a good sense of how they affected the markets.

Plan ahead so you can be trading and taking advantage of these times when there is energy in the market as long as they fit into the schedule you set yourself.

Every individual trader will have timeslots when they prefer to be trading – some prefer to trade the European market opens, like the London open, while others prefer to trade the Asian or American opens. How that fits into your schedule will depend on your other life commitments and also the time zone you’re in and trading different peak times in market activity will affect your lifestyle so you need to be sure you are making a conscious decision about when you trade.

Downtime

When you’re planning your week, you also need to plan times when you are away from your system. This is perhaps the hardest part of all. You will know after a while that there are times during the day when there is usually no real benefit to sitting in front of your system and entering trades. These are those times when the markets lose energy and become choppy and you will learn after a time when they usually happen. They can be quite annoying these periods because they usually come in the middle of the working day you set for yourself but they feel like wasted time.

This is where you can put your daily routine to work and schedule yourself tasks that take you away from trading during those quiet times. Doing this has multiple benefits. First, you cut down the chance that you will start entering trades or messing with your stops just out of sheer boredom. Second, it gives you a chance to go and do something other than trading, which will help you come back to your system with a clearer head at a time when actually entering trades is going to be more useful in any case. Thirdly, you won’t have a sense of wasted time and will give yourself a chance to make sure the anxiety this can cause doesn’t build up and make your trade out of panic.

So when you’re sitting down to plan your week, schedule some other activities during those lulls in the market to help you get through each trading day. Lots of traders will use this time to get away from the computer completely. Some use these times to run a second business, while others head down to the gym or go for a long walk. The determined traders will make use of these times to run backtesting on a technical indicator or review past trades. But all of these activities are ultimately beneficial because they stop you from spending those periods just waiting for things to pick up again and, at the end of the day, you won’t feel like that time is wasted.

The Take-Away

Planning your daily routine is one of the hardest things to figure out. In the old days, people were just left to their own devices and had to try to do it by trial and error. You’re lucky that you have read this article because even though it won’t change your life overnight, it will give you an awareness of how important your routine is to your trading. That’s gives you a chance to skip forward a few steps if you are willing and able to put some of this advice into action.

The way to design a workable routine is to treat your trading activities as a legitimate business, with office hours, daily tasks, weekly schedules, and proper planning. Doing this will help you to cut down on those usually terrible trades made out of boredom, out of panic, or for other emotional reasons.

Not only will your trading improve, but your life outside of trading will also improve. You will have to be strict with yourself but every time you are, you will be exercising your self-discipline muscle. In the end, this will make you more effective and ultimately more successful.

Categories
Forex Technical Analysis

Forex and Elections: Opportunity or Uncontrollable Risk?

Forex and all other markets surge with volatility during the US elections. Many promote this event as an opportunity to earn quick money although, in the end, it is the promoter who wins in some way. Traders who have an understanding of how we approach uncontrollable risk coming out from election events know we choose to avoid rather than to bet. The plan we put in place for such occasions is adequate for those who follow our trading ways and systems, however, the tips we are about to present are for everyone. Traders should take these recommendations as they fit, they are just a part of one technical prop trader group researching an experience. One is certain, only when we have a plan or rulebook we also reduce the risk of completely busting our accounts during elections. In our case completely protected since such uncontrollable risk is avoided by simply not trading. We will tackle different markets where buy and hold strategies are applied and a plan for all major 8 currencies regarding elections or other significant events such as Brexit. 

Losing a major part of your hard and slow gains in just a few election days is also very discouraging for traders. But, as our prop traders used to say, you have a decision to make. Decide if you want to have control over your account or leave it to somebody else. By somebody else we mean the big banks, news, how people interpret the news, “experts”, and so on. Technical traders dislike fundamentals, everything out of their technical analysis is detrimental and a risk to change trends before they hit their first targets. Whatsmore, according to this trader group, fundamentals do not always drive the market in a logical way. Fundamentals info will just mess with your trading and this is very amplified during elections. We want as much control over our account as possible and for that we need caution some might consider as too conservative. However, now we are here for the steady long-term trading returns, and the election period does not deserve a chance to ruin that work. So instead of entering the storm and trying to drive through, we just stop and wait for it to pass. If we enter the storm we are leaving the majority of control to its mercy. 

Let’s start with the non-USD currency pairs plan. Elections are one of the biggest market disruptors but other events can also have a similar impact, like viruses, wars, or Brexit, for example. In all such scenarios stop trading all currency pairs that contain that country currency involved. So if New Zealand is having elections, stop trading all NZD pairs. Trades already going should be closed, be it on breakeven, in profit or loss. Stop trading 4 days prior to the event, and 4 days after. Still, if you see things are not calming down, consider waiting some more. 

USD currency pairs are largely dominated by the USD movements. If elections or other major events are related to the United States, shut down all of your trades, from all currency pairs. The avoidance plan also involves 4 plus 4 trading days (not weekends) before and after the event. Now you may wonder why this 4+4 plan. Well, before elections there is a lot of positioning by the big banks, investors, algo traders, and other market participants and prepare to enter the event. This may not shake the market as the election trading itself but still can shake our trades off the direction. You do not want to let others control the trends so you avoid them altogether. Hopefully, revenge trading is not your thing, especially during elections, it is an easy way to bust the account.

So this is why 4 days before the elections and of course, during the elections spreads are extreme, movements do not make any sense and you see some strategies to pop up how to trade this event on social media. These strategies do not follow any trends, in any timeframe because they do not exist. Extreme spikes can crush any predictions or trades you may have in a single candle. Four days after the election the markets exhibit reactionary price action or the shakeout. All this is uncontrollable, the big banks can force the move wherever they see fit and have the media to explain the move with whatever reason tied to elections. 

Market manipulation by these big players in the forex is very present during elections. Let’s take a look at the charts on election day in November 2016:

The ATR (14) value on a daily time frame on the day before the elections (candle marked by a yellow circle) was 65 pips. Election day candle moved down about 100 pips on this EUR/USD pair at price close. This movement pip value does not imply anything unusual. It is the spike that knocked out every possible Stop Loss levels in the emerging downtrend. The spike is about 275 pips on the upside and about 100 down to close the day. The price action like this reminds of flash crashes except this one is on election day we all know when it is going to happen. Interestingly, the price action does not make any deviations if we take into account the range from open to close. It is the intraday action that wreaks havoc. We use the daily timeframe for reasons already explained in previous articles so the indicators used in our algorithm structure do not get thrown off on this chart. But let’s get onto another currency pair without the USD – EUR/GBP.

The same US election day in 2016 is not the flash crash a few weeks before but the day marked in a yellow circle. Notice similar price action on this non-USD currency air, a Stop Loss spike to the up, and then candle close like normal. Flash crashes on the GBP might have thrown some indicators off to the point they are not reliable until they get normal values in balance. According to the ATR (14), volatility before the election day was 67 pips. The move down was about 120 pips and the spike up 121 pips. Even on cross pairs unrelated to the US elections, the big banks have a free pass to whipsaw Stop Losses. Exactly the reason why technical prop traders suggest shutting down all trades before and after US elections on all currency pairs. If we go far away from the USD and pick, for example, AUD/NZD, the situation is the same: 

The election day candle is marked in a yellow circle and has the same properties – with a big Stop Loss hunting wick. The day after has a long wick to the upside in case anyone went short. The next example is on the S&P 500 index, it is not only present on forex. 

Here we see a Stop Loss triggering with an extremely long wick for anyone in a long position on this emerging bullish trend. Even on a weekly timeframe, this push would trigger concentrated Stop Loss levels all traders considered to be at optimal positions. These pending orders were created before the election day since the markets were closed for trading. Traders could just observe how their far Stop Loss gets triggered only to return everything to normal before day close. It is logical to put Stop Loss orders some distance below the last candle lows, in case the equities market crashed. However, this scenario did not happen, yet traders took the loss as it had. The trend continued but without long positions in it. The avoidance plan protects traders from this risk if you are trading on daily and weekly charts. 

Understand that every election is different. This date is specific because Trump won the elections he was not supposed to. In previous elections, Obama was expected to win and he did without much drama. Chaos during the last elections was caused by several drivers and the one in 2020 is going to be for other reasons. If we get very big candle bodies during the next elections, depending on the system you have made, traders may need some time before the elements get back into nominal reading, maybe even more than our proposed 4 days. Accordingly, you will have to adapt to new conditions. Your ATR, confirmation, and volume indicators get out of normal reading consequently setting you money management out of optimal ranges. 250 to 350 pip candles during elections will definitely do this, since ATR is set to 14 periods, you may need to wait for a week to get into normal. Similarly to when flash crashes happen, the procedure is the same. 

These rules might test your patience if you have a habit to have more trades open. Patience will reward you, it is just 8 days out of the 4 years after all. Apart from the good setups for trading during the elections, you might be tempted to trade by social media too. The networks will be full of strategies on how to profit from the election’s hyper movements, causing the fear of missing out on many amateur traders. Prop traders have mastered how to manage feelings like this long ago, and you should follow despite what you read on social networks. This is not the long term game we play. 

Elections in 2020 are going to be very specific also because it seems the final results will be known several days after the election day. According to certain headlines, North Carolina is allowed by Federal court to accept mail-in ballots nine days after polls close. If the results are tight and these polls are decisive we will have chaotic price action on more than one day. How the big banks and investors will react to all this fundamental stimulus is unknown. So even a 4 plus 4 days plan might not be enough since every election is different. Technical traders will have to pay attention to fundamentals too now, adapt to the specifics of every election. After all calms down, usual trading may resume. 

Twitter is a good source to follow like-minded investors who do not involve election trading. If you are not really well informed or follow headlines, follow people that are. Tweeter has several groups that know about the risks and are well informed fundamentally. YouTube can be a second source although you will have to dig through the more popular all-in election trading top lists. 

In other markets, precious metals, oil, crypto, and the like, most of the assets are expressed in the USD, meaning the same avoidance plan applies to them too. However, you may wonder should you make any adjustments to buy and hold strategies investors usually apply to precious metals and crypto. These strategies have such long term goals elections are just an abysmally small period and volatility spark does not affect them at all. If you are true to your buy and hold strategy, you are not going to change anything, elections will be a temptation. These strategies should be designed to last for years. Do not try to make sense to invest more into gold or crypto during elections, chaotic periods logically should drive these safe assets higher, but elections moves do not follow any logic.

If for some reason gold or other non-fiat safe heavens drop more than 10% in the coming weeks, this is actually a good time to average down, look to buy more of these assets as they are likely setting up for a long-term bull rally. Averaging is not something you do in forex trading, however, long term strategies like buy and hold are very good for averaging down. Of course, this is just an opinion from prop traders who are into investing, you can do whatever you want. As a general tip for elections, stay out of trading with a plan, be patient, and know every election is different. Forget what social networks and portals are saying, stay patient, and prudent in your investing. The long game result will prove you are right even if it does not seem so at the moment.


Categories
Forex Elliott Wave Forex Market Analysis

Can EURUSD Re-Test the Level 1.20?

The EURUSD pair advances in an unfinished impulsive formation that raised the common currency from 1.06359 till 1.20114. The price action started to develop a corrective sequence, still progressing, corresponding to its fourth wave of Minor degree. Explore with us what should be the target of the fifth impulsive wave.

Market Sentiment

The long-term market sentiment of the EURUSD pair based on the 52-week high and low range unveils the price moving in the extreme bullish zone. 

The following daily chart illustrates the common currency moving above the 60-day linear weighted moving average, confirming the extreme short-term upward bias prevalent in the current price action.

Likewise, the consolidation formation bounded between 1.16121 and 1.18566, appearing after the rally from mid-May to early September, leads us to anticipate the take-profit activity of big market participants. In other words, the price could begin a new movement toward the 52-week high zone, creating a euphoric sentiment for the euro before developing a corrective move.

Elliott Wave Overview

 EURUSD pair’s long-term outlook under the Elliott Wave perspective reveals the upward advancement of the common currency in an unfinished impulsive wave, which currently progresses in its fourth wave of Minor degree, suggesting further highs.

The following daily chart exposes de uptrend developed by the EURUSD since the March 23rd low located at 1.06359, where the price found fresh buyers, who remain in control of the long-term uptrend.

The Elliott Wave point of view illustrates the EURUSD pair developed and completed a third extended wave of Minor degree labeled in green when the price reached 1.20114 on past September 01st. Once the common currency found resistance at 1.20114, the EURUSD started to develop its fourth wave of Minor degree identified in green.

Considering that the second corrective wave was simple in terms of price and time, by the alternation principle of the Elliott Wave theory, the fourth wave should be a complex correction. In this regard, the complexity could be in terms of price, time, or both.

If the correction were complex in price, the formation could be a flat pattern like an irregular flat. If the complexity were in terms of time, the corrective pattern could be a triangle formation. Finally, if the correction develops a combination of price and time complexity, the structural series could be a double three or a triple three pattern.

Short-term Elliott Wave Outlook

Once the fourth wave ends, the common currency should advance in its fifth wave, shown in green in the following chart. Considering that the third wave is the extended wave, two potential scenarios exist for the fifth wave target.

The first scenario considers the advance slightly higher than the top of the third wave, which could reach the area between 1.2065 and 1.2257.

The second scenario may arise if the fifth wave’s bullish pressure fails and finds resistance in the supply zone, which is located between 1.19361 and 1.20114.

To conclude, the invalidation level corresponding to this bullish scenario is a close below 1.11639.

Categories
Forex Money Management

Effective Strategies For Financial Leverage That You Can Use Starting Today

We’ve already talked about leverage in other articles, and we’ve given a very precise explanation of what it is and how it works. Today begins the most interesting, Is the leverage good? Is it bad? Is it true that it ruins all traders? We’re going to find out what’s behind all the doubts and myths about financial leverage.

To do so, I will cite the phrases and opinions that I have been able to collect from the Internet.

“Leverage multiplies your losses.”

This phrase is not true, the 1:100 leverage allows me to operate as if I had 100 times more capital than I have, but this does not imply that I use all my credit to gamble on the stock market.

Effectively if I use all my buying potential in a single trade and I lose it I will be ruined, but never (go or not leveraged) you must play more than 1-2% of your trading account and only in a trade, if you are a daytrader then 1% is already quite risky to my understanding.

For example, I have created a 1:100 leveraged $1000 account (I have credit up to $100,000) but as a sensible trader, I don’t want to gamble more than 1% on my next trade. 1000$ * 1% = 10€

On Forex accounts you can play from 1 micro lot, then the value of each pip is 0.10$. So $10/ $0.1 would allow me to put the Stop Loss up to 100 pips away, but from here I should accept losses greater than 1%. As you can see a daytrader with a Stop Loss at about 30 pips can play 0.3% of his account and at the same time be leveraged 100 times.

“Leverage is what will make you rich.”

NO, of course not. Leverage is a very useful way to enter the stock market with little capital and be able to diversify your account better but to gain the important thing is your constancy, practice, constructive self-criticism, and positivity in front of the market.

“People without leverage work for those who do have leverage.”

I don’t think so, people without leverage look for the long term and they help themselves from the liquidity that we provide intraday and short-term traders to enter the market with better conditions and with more security. Leveraged traders tend to focus on the long term and rarely affect leverage.

“People with leverage work for those who are not.”

In the sense that short-term traders give liquidity to the market, yes, I have no doubt. But in a “we earn the money they lose” sense of course not! If Buffet had leveraged 3 times, today it wouldn’t be 3 times richer; it would be ruined. And the phrase is right. According to Warren himself:

“Unless you can see your stock drop 50% without causing a panic attack, you shouldn’t invest in the stock market.”

Obviously, no one who thinks like that should use leverage, if you don’t know how far you are going to take the losses you should seriously consider using leverage. On the other hand, to a short-term investor, the leverage comes from fable, in fact, there are professional traders who are dedicated to looking for commissions in exchange for giving liquidity to the market (the so-called rebates). These traders charge for every trade they open and usually look for 0 to 2 market ticks, no more. The leverage they use can reach 1:1000 without problems.

Well-used leverage means that a person with knowledge, work, and understanding of markets can come up with a very large portfolio that would otherwise be impossible. Personally, I want to highlight an interesting phrase that I have read:

“It’s not the bullet that’s dangerous, but the speed it’s carrying.”

In my humble opinion, this is not exactly so. The velocity of the bullet is not the key, it is the use you give it. If you’re a hunter who uses the bullet to feed the family, you’ll be using this speed to not die and still be alive. If you’re unconscious and you’ve never been taught to use a gun, you’re going to accidentally shoot yourself in the foot and complicate your life.

In trading the same happens, a bad trader is short and long term, the only difference is that in the short term you will take less time to make 100 trades and be out. In the long run, your agony can last 2-3 years and hopefully a bullish market can make you believe you’re good for a while… Then things like this happen…

“The problem with leverage isn’t speed, it’s how we use it.”

In summary, leverage can help you in the short term to operate in multiple markets at once without putting your personal economy at risk. You can diversify your portfolio better and have absolute control of risk. You can make interesting profits with much less capital and the same level of risk, but be careful, you need many hours of experience and rational use of leverage.

In the long run, leverage is only a good ally if you use a guaranteed Stop Loss and have a clear strategy. If you rely on buying and enduring (because of course, we all know that someday this will rise), then leverage will be your worst enemy.

From here on, everyone draws their own conclusions, we hope that with this article we have brought a little more light to leverage and that we have all taken a positive part of this debate.

Categories
Forex Basics

What Dirty Little Secrets Can Be Revealed by Speaking With a Forex Trading Coach?

Having an experienced trading coach to go to with questions is always a plus when you’re trying to learn everything you need to know about trading. If you’re lucky enough to have a personal coach, you’ll want to use your time wisely and be sure to ask important questions to help get the most out of your experience. Here are a few examples of questions you could ask your coach…

Question #1: Approximately how long have you been trading forex?

You might want to ask this question to ensure that you’re dealing with a qualified, experienced coach that actually knows what they’re talking about. If your coach has been at it for a while, they will have more advice when it comes to dealing with the market because they were personally trading during many major market events. While more experienced coaches might charge a higher price, you can expect to receive a better quality of advice thanks to their experience. 

Question #2: What strategies do you use while trading?

This question might be basic, but it can give you a good insight into the strategies that have helped your trading coach to become successful. It would help to ask how they evaluate the market and choose when to enter, exit strategies, how they manage their risk, and so on. This can also give you some insight into whether your coach prefers short-term or longer-term strategies, although you should keep in mind that different things work for different people. 

Question #3: Have you ever learned any hard lessons?

One of the best ways to avoid making mistakes is to learn from the mistakes of others. This is especially true when it comes to trading, where mistakes result in financial loss. Maybe your instructor risked and lost a lot of money early in their career, or they might have made another big mistake along the way. If you ask about it, you might be able to avoid falling victim to the same problem yourself.

Question #4: Which trading style seems right for me?

Your coach will need to spend some time talking with you before they can answer this question, but it shouldn’t take too long for them to figure out what kind of trader you are. You might even be surprised at their answer! Some of us aren’t always as observant when it comes to our own personality, so allow your coach to figure out whether you seem disciplined, timid, fast-paced, etc. 

Question #5: What are the best ways to analyze the market?

Different traders decide to enter trades based on different data. Some lean more towards technical analysis, while others analyze fundamentals, and some look at a mixture of the two. Your trading coach should be able to tell you which market analyzing tools and strategies are best, along with the ones you’ll want to stay away from. This can save you a great deal of time and money because you won’t have to learn what doesn’t work through trial and error. 

Question #6: How much do you recommend I risk per trade?

Many beginners make the mistake of risking too much money at the beginning of their careers. This is why it’s a good idea to ask your coach how much they think you should personally risk since they can consider the amount of money you actually have in your account and your goals. If they suggest an amount that is lower than what you had originally planned, you may want to reevaluate your risk-management plan to ensure that you don’t go in risking way too much money.

Categories
Forex Fundamental Analysis

Foreign Securities Purchases Impact on Forex Currencies

Introduction

For the longest time, the performance of a country’s financial and capital markets has been touted as an indicator of economic health. On the other hand, foreign investors’ participation in the local financial and capital market can be taken as a sign of confidence in the local economy. Therefore, monitoring foreign securities purchases can be used as a gauge of investors’ confidence in the local economy.

Understanding Foreign Securities Purchases

Foreign securities purchases measure the involvement of foreigners in the domestic financial and capital markets. It includes the value of local bonds, stocks, and money-market assets bought by foreigners over a particular period.

The financial market is considered the backbone of any economy. Every sector of the economy is interconnected with the financial market, not just by transactions. Companies, businesses, and governments use the financial and capital markets as a source of funds. Through IPOs, companies can raise funds that will be used for business expansions. Governments issue bonds and treasury bills in the money markets, which are used to fund government expenditures. In the secondary markets, however, these financial assets’ prices tend to reflect investors’ sentiments.

Therefore, foreign investors’ level of participation in the local financial markets can be used as a leading indicator of economic sentiment.

Using Foreign Securities Purchases in Analysis

Primarily, the data of foreign securities purchases shows foreign interest in the domestic economy. This data has various applications to government agencies, investors, and even forex traders.

The stock and money markets are driven by sentiment. The basics of how the financial market works is that; you buy a financial asset when prices are low and sell when prices are high. For example, in the stock markets, the price of a company’s stock is tied to its financial performance. So, when its performance is well, the share price will rise, and when the performance is deteriorating, the share price will fall. Another critical factor that drives the fluctuation in share price is a sentiment about the company’s performance.

When traders anticipate that the company will have a windfall – either increased demand for its core products or the launch of a new product line – the share price will rise. The rise in the share price is driven by the fundamental laws of demand and supply. The price will rise when there is an increased demand from investors to buy the shares, which means that those buying exceed the number of those selling. The price will fall when investors are selling the shares, which increases its supply relative to those demanding to purchase it.

Using this aspect of the stock markets, when foreign investors flood the domestic market to purchase shares, it means that they anticipate that the companies will perform better soon. As we have explained, a better financial performance by a company could result from increased demand for its products or expansion in business operations.

Since the stock market is forward-looking, increased buying activity can be interpreted as a vote of confidence that economic conditions are going to improve. Let’s take the example of the S&P 500. On October 19, 2020, the index closed just above 3400 from lows of 2237 on March 23, 2020, at the height of the Coronavirus pandemic.

Therefore, a rebound in the stock markets can be taken as a sign that investor confidence is increasing and improving economic conditions.

Source: St. Louis FRED

However, note that there is a disconnect between the GDP and the performance of the stock market. Most people tend to make the mistake of assuming that the growth of the stock market is synonymous to an increase in the GDP. While this might be true in some cases, it is purely coincidental, because the stock market is only one component of the economy. While the economy’s growth tends to encompass all aspects ranging from the growth of the labor market to household consumption, the stock market is majorly a reflection of corporate profits. For example, while the S&P 500 recovered from March to October 2020, the GDP was on a steady fall.

Source: St. Louis FRED

The other way foreign securities purchases can be used for analysis is through the purchases in the money markets, especially government bonds and treasury bills. When foreigners swam the domestic market to purchase government securities, it can be taken as a sign that the domestic economy is offering better returns compared to other international economies.

Furthermore, increased foreigner participation in the domestic money markets can be taken as a sign that the local economy is regarded as a safe heaven. It is a vote of confidence that the domestic economy is stable and comparatively less volatile, which means that their investments will receive a steady return and no chances of an outright loss of capital.

Impact on Currency

As a leading indicator of economic sentiment, foreign securities purchase data can show what investors think about economic recoveries. When the foreign securities purchases increase in times of economic recessions or slump, it can be taken as a vote of confidence by the investors that the economy will rebound in the near term. The logic behind this is that no one would want to invest in an economy bound to fall or one that has no signs of recovery. In such an instance, the currency will appreciate.

Similarly, the local currency will appreciate relative to others since an increase in foreign securities purchases implies that the domestic economy offers better returns. These higher returns could be a direct result of higher interest rates. Higher interest rates mean that the local currency will appreciate.

Conversely, when the foreign securities purchases data is on a decline, it shows that investors are fleeing the domestic economy. They can either get better returns on investment in other economies or believe that the local economy is headed for rough times. In this case, the local currency will depreciate relative to others.

Sources of Data

Statistics Canada collates and publishes foreign securities purchases data in Canada. The data published is of the prior two months. A more in-depth and historical review of the foreign securities purchases in Canada is available at Trading Economics.

How Foreign Securities Purchases Data Release Affects Forex Price Charts

For this analysis, we will focus on the August 17, 2020, release of the foreign securities purchases data at 8.30 AM EST. The data can be accessed from Investing.com. Moderate volatility is expected when the data is released.

In June 2020, Canada’s net foreign securities purchases were -13.52 billion compared to 22.39 billion in May 2020.

Let’s see what impact this release had on the CAD.

GBP/CAD: Before Foreign Securities Purchases Release on October 17, 2020, 
Just Before 8.30 AM EST

From the above 5-minute GBP/CAD chart, the pair was trading in a steady downtrend before the release of the data. The 20-period MA was steeply falling with candles forming further below it. This trend shows that the CAD was strong during this period.

GBP/CAD: After Foreign Securities Purchases Release on October 17, 2020, 
at 8.30 AM EST

The pair formed a long 5-minute candle upon the release of the data. As expected, the negative net foreign securities purchases in Canada resulted in the weakening of the CAD. Subsequently, the pair traded adopted a subdued uptrend with the 20-period MA slightly rising and candles forming just above it.

Bottom Line

The foreign securities purchases data is a moderate-impact economic indicator. Since it only serves to show investor confidence in the economy, it does not result in high volatility when released. Cheers!

Categories
Beginners Forex Education Forex Basics

Unknown Facts About Forex Mini Accounts as Revealed By the Experts

There are a lot of different kinds of forex brokerage account types out there, from more common options like mini and standard accounts to gold, platinum, and diamond accounts, and the list goes on. At the top of the list, you’ll find the elusive VIP account, which is reserved for serious traders that can afford to invest a whole lot of money. Today, we will take a more detailed look at the mini account, which might also be referred to as a cent or micro account. 

Pros

  1. One of the things that make mini accounts so attractive is low entry barriers, which usually fall anywhere from $1 to $100. These are usually the cheapest accounts offered by brokers with multiple types to choose from, so they are ideal for beginners that might not feel ready to make a larger deposit. 
  2. Traders trade mini lots instead of standard lots when operating a mini account, which gives them more control over the trade and how much they are risking.
  3. Mini accounts typically offer very flexible leverage options, especially when compared to the other account types a broker offers.
  4. Mini accounts are often used by those that are learning to trade because they provide more control and help limit risk, and they are also beneficial to more experienced traders looking to test strategies and systems for these reasons.  
  5. Since mini accounts do not require a large deposit, it won’t hurt your wallet as badly if you do blow your account, and you’ll be less likely to give up on trading thanks to the softened financial hit. 
  6. A mini account is a great place to start as a beginner before working your way up to an account with a larger deposit requirement. 

Cons

  1. Most brokers charge higher spreads and commission fees on their mini accounts, with better offers on their accounts that require larger deposits. This is understandable, but traders need to be aware that 1.5 pips is an average spread on the pair EURUSD. Some mini accounts we’ve seen list a spread more than twice that for the pair. 
  2. Mini account holders don’t usually get as many benefits as higher account holders through a broker. This means you might miss out on the chance to receive bonuses, you might not get an account manager where other accounts do, etc. 
  3. While you’re risking less when trading on a mini account, you’re also more likely to make less profits. This makes mini accounts less attractive to those that want to trade forex for a living, or anyone that has big goals they are trying to meet. 
  4. Mini accounts are more limited when it comes to the maximum allowed trade size, however, many beginners aren’t affected by this. 

The Bottom Line

Forex mini accounts are great for beginners and can even be useful to more experienced traders that are looking to test strategies and systems. In addition to offering low entry barriers, these accounts help traders to manage their risk and take more control of their trades with flexible leverage options and less financial risk. On the downside, you might wind up paying higher fees on your mini account and missing out on some extra perks offered by your broker, like bonuses, promotional offers, etc. You will also be restricted to smaller maximum trade sizes and to make a smaller amount of money than you would on a more substantial account type. Still, a mini account is a great place to start before working your way up to another account type.

Categories
Beginners Forex Education Forex Basics Forex Psychology

Achieve Total Forex Competence in These 4 Simple Stages

The “four stages of competence” psychology model was created by management trainer Martin Broadwell back in 1969. It is used to describe the different kinds of psychological states one goes through when progressing from incompetence to competence with a skill. While this widely popular psychological guideline can be applied to a variety of different skills, it is especially useful when describing what one goes through on the journey from a forex novice to a truly competent trader. Stay with us as we explain each of the four stages and how they apply to traders.  

Stage 1: Unconscious Incompetence

This stage is simply a fancy way of saying that you don’t know much about what you’re doing, which applies to pretty much any skill you try for the first time, from playing an instrument to opening a trading account. Even if you have some trading activity under your belt, you’re likely still in this stage if you haven’t done much research and don’t put much thought into what you’re doing. Maybe you made a big bet and won so you keep it up, without realizing that your winnings are due more to coincidental luck than they are to your own competence of trading. You might even have the mindset that trading is easy because you don’t fully understand everything that goes into making smart trading decisions just yet.  

Stage 2: Conscious Incompetence

In this stage, you might actually realize that trading is harder than you thought. Perhaps simply reading this article has brought you to the stage of conscience incompetence! You still aren’t very knowledgeable about trading in this stage, but this is where you admit that and start making an effort to learn more about what you’re doing. When it comes to trading, you might pay more attention to fundamental or technical analysis, test different indicators, start keeping a trading journal and spend more time doing general research about trading. As you progress through this learning stage, you should be able to find a strategy that actually works for you before moving on to the next stage of competence. 

Stage 3: Conscious Competence

By the time you reach this stage, you will have spent enough time learning and testing out strategies to have a good idea of what does and doesn’t work for you. This doesn’t mean you’ve achieved perfection, but you likely have a detailed trading journal right beside you with an idea of different profitable strategies you could use and you’ll have implemented risk-management rules you intend to follow. While you may have issues following these rules exactly, this stage is about progress and you should be able to keep a clear head when losing trades while understanding that consistent execution is better than simply winning trades. During this stage, you may put in extra thought and overanalyze things in an effort to make better trading decisions. 

Stage 4: Unconscious Competence

Once you reach this stage, you’ll switch into autopilot when you’re trading. Think of when you first started driving, how you were probably aware of your exact speed or how you had to remind yourself to turn on your car’s headlights at night. Later on, you become so used to driving that you switch on your headlights without consciously thinking of it or you look down and realize you’ve been speeding without realizing it. This stage of trading works in the same way – you can identify trends and patterns efficiently without much thought, you get good or bad feelings about trades that you should enter, and you know when something needs to be changed when it comes to your strategy. At this point, you don’t have to put conscious effort into trading because it comes to you naturally. However, you should remember that a trader’s work is never done, so don’t make the mistake of assuming that you’ve mastered trading once you reach this stage. Never stop pursuing knowledge and don’t make the mistake of becoming overconfident. 

Now that you’ve learned about the four stages of trading competence, which stage do you think you fall under? Perhaps this can shed some light on what you need to do as a trader to move on to the final stage.

Categories
Forex Fundamental Analysis

The Impact of ‘Gross Domestic Product Estimate’ Economic Indicator On The Forex Market

Introduction

In most economies globally, the GDP data is published by governments or government agencies quarterly. This would mean that analysts, economists, and households would have to wait for a full quarter to know how the economy is performing. Naturally, this long wait can be frustrating and, in some cases, inconveniencing. Therefore, having some form of estimate as to what the GDP might be can be quite useful.

Understanding Gross Domestic Product Estimate

As the name suggests, the GDP estimate serves to estimate an economy’s GDP before the release of the official government-published GDP report.

These estimates are arrived at by surveying the industries within the country. In the UK, for example, the following industries are surveyed; production, manufacturing, mining and quarrying, agriculture, construction, private services, and public services. Most estimates adopted globally use the bottom-up methodology.

Source: National Institute of Economic and Social Research

In the UK, the National Institute of Economic and Social Research (NIESR) publishes a rolling monthly estimate of the GDP growth using the bottom-up methodology. Hence, its GDP estimate covers the preceding three months. Since the GDP estimates are published monthly, it means that NIESR releases at least four GDP estimates before the government’s publication. Using the bottom-up analysis to estimate the GDP, NIESR uses statistical models to aggregate the most recent trends observed within the GDP subcomponents. The statistical models are fed the latest trends, and they forecast the most probable outcome in these subcomponents. Note that these forecasts are only short-term.

While the GDP estimates are not always accurate to the exact decimal percentage, they provide an accurate GDP representation.

Using the Gross Domestic Product Estimate in Analysis

The GDP estimate data can be used in the timely analysis of economic performance. Here is how this data can be used.

In many countries, the macroeconomics policies are usually set more frequently than quarterly. However, since the economic performance is the centerpiece in any macroeconomic policy-making, it is vital to know the most recent GDP data. By tracking the trends of the top components of the GDP, the GDP estimates can provide the most recent data. Therefore, this will help the policymakers to implement more informed policies. Let’s see how the contrast between the GDP estimate and the actual GDP can make a difference in policy implementation.

For example, during the second quarter of 2020, governments and central banks wanted to implement expansionary fiscal and monetary policies. At this point, the only GDP data available to them is the actual GDP for the first quarter of 2020. But for most economies, the 2020 Q1 GDP showed economic growth. On the other hand, the more recent GDP estimates could show that contractions were already visible in the economy.

In this scenario, if policymakers were to use the actual data available to then – the Q1 GDP – they would have made undesirable policies. These policies would have further harmed the economy. On the other hand, if the GDP estimates would have been used to aid the policy implementation, chances are, the most suitable and appropriate monetary and fiscal policies would have been adopted. Here, the GDP estimate would have helped them make relevant policies and ensuring that these policies are implemented timely.

Furthermore, the GDP estimates can also be used to establish whether the policies implemented are working as expected. If expansionary policies are implemented, their primary goal is to spur demand and stimulate economic growth. Using the GDP estimate, policymakers can track to see if there are any changes experienced in the economy. Some aspects like inflation take a long time to adjust, but demand generated by households is almost instantaneous. Therefore, the GDP estimate can be used to gauge the effectiveness of the implemented policies. Take the stimulus packages adopted in Q2 2020 after the pandemic; they were meant to stimulate demand by households, which would lead to economic recovery. With the GDP estimate, we could tell whether the stimulus package worked or not.

When accurate, the advance GDP estimate can be a leading indicator of the actual GDP. Therefore, the GDP estimate data can be used to show the prevailing trends in the economy. For instance, it can be used to show looming periods of recession and any upcoming recoveries. Say that the trailing three months captured by the GDP estimate shows that the economy’s major subcomponents are struggling with demand and contracting. This data can be taken to mean that for that quarter, there is a higher probability that the overall economy would contract. Conversely, when the subcomponents being tracked show growth, it can be expected that the overall economy would have expanded in that quarter.

It’s not just the governments that can benefit from the GDP estimate data. The private sector as well can use the data to plan their economic activity. Take the example that the GDP estimate shows that a particular sector in the economy has been contracting for the previous three months. Investors in this sector can presume that the demand for goods or services from the sector is depressed. In this instance, to avoid venturing into loss-making businesses, investors can make informed decisions about where and when to invest their money.

Impact on Currency

When the GDP estimate shows that the short-term economy is expanding, the domestic currency will appreciate relative to others. A short-term expansion indicates that demand levels in the economy are higher, which implies that unemployment levels are low and households’ welfare is improving.

The domestic currency will depreciate if the GDP estimate shows that the economy is contracting. The primary driver of a contracting economy is decreased expenditure by households contributing almost 70% of the GDP. The decline in demand can be taken as a sign of higher unemployment levels.

Sources of Data

In the UK, the National Institute of Economic and Social Research publishes the monthly and quarterly UK GDP estimate.

How GDP Estimate Release Affects The Forex Price Charts

The most recent UK GDP estimate published by NIESR was on October 9, 2020, at 11.10 AM GMT and accessed at Investng.com. Moderate volatility on the GBP can be expected when the NIESR GDP estimate is published.

During this period, the UK GDP is estimated to have grown by 15.2% compared to 8.0% in the previous reading.

Let’s see how this release impacted the GBP.

EUR/GBP: Before NIESR GDP Estimate Release on October 9, 2020, 
just before 11.10 AM GMT

Before the release of the NIESR GDP Estimate, the EUR/GBP pair was trading in a subdued uptrend. The 20-period MA transitioned from a steep rise to an almost flattened trend with candles forming just above it.

EUR/GBP: After NIESR GDP Estimate Release on October 9, 2020, 
at 11.10 AM GMT

After the GDP estimate release, the EUR/GBP pair formed a 5-minute bullish ‘inverted hammer’ candles with a long wick. This candle represents a period of volatility in the pair as the market absorbed the data. Subsequently, the pair traded in a neutral trend before adopting a steady downtrend with the 20-period MA steeply falling.

Bottom Line

The GDP estimate is not just relevant to investors and policymakers; as shown by the above analyses, it can result in periods of increased volatility in the forex market when it is published. Cheers!

Categories
Forex Assets

Costs Involved While Trading The AUD/RUB Forex Exotic Pair

Introduction

AUD is the Australian Dollar, and RUB is the Russian Ruble; AUD/RUB is thus an exotic currency pair. When trading this pair, forex traders should expect relatively high volatility due to its exotic nature.

In this pair, the AUD is the base currency, and the RUB is the quote currency. It means that the AUD/RUB pair’s price represents the amount of Russian Ruble that one Australian Dollar. If the AUD/RUB price is 55.813, it means that you can buy 55.813 Russian Rubles using 1 Australian Dollar.

AUD/RUB Specification

Spread

For the AUD/RUB pair, the spread is the difference between the price at which you can buy the pair from a broker and the price at which you can sell it to the broker.

The spread for the AUD/RUB pair is:

ECN: 10 pips | STP: 15 pips

Fees

If you have an ECN account, different brokers will charge you varying fees per trade, depending on the size of your position. For most STP accounts, however, there are no fees levied whenever you open a position.

Slippage

In the forex market, slippage occurs when you open a position, but it is executed at a price different than the one you requested. The primary determinants of slippage are market volatility and your broker’s speed of execution.

Trading Range in the AUD/RUB Pair

Throughout the day, the price of a currency pair fluctuates. This fluctuation, as observed from different timeframes, is known as the trading range. In forex, the trading range can help a trader determine the volatility of a currency pair, hence assess the risks it carries.

The Procedure to assess Pip Ranges

  1. Add the ATR indicator to your chart
  2. Set the period to 1
  3. Add a 200-period SMA to this indicator
  4. Shrink the chart so you can determine a larger period
  5. Select your desired timeframe
  6. Measure the floor level and set this value as the min
  7. Measure the level of the 200-period SMA and set this as the average
  8. Measure the peak levels and set this as Max.

AUD/RUB Cost as a Percentage of the Trading Range

We can combine volatility, slippage, and trading fees to determine the cost of trading a currency pair across different timeframes.

Below are cost percentages for both the ECN and the STP forex accounts. These percentages are in terms of pips.

ECN Model Account

Spread = 10 | Slippage = 2 | Trading fee = 1

Total cost = 13

STP Model Account

Spread = 15 | Slippage = 2 | Trading fee = 0

Total cost = 17

The Ideal Timeframe to Trade the AUD/RUB

In the analyses above, we notice that lower timeframes have low volatility, accompanied by higher trading costs for the AUD/RUB pair. With either the ECN or the STP account, costs are highest when volatility is at the lowest, 3.1 pips. The lowest costs are incurred when volatility is the highest at 802.2 pips.

We can observe that longer-term traders generally enjoy lower trading costs. However, shorter-term traders can reduce their trading costs by trading the AUD/RUB pair when volatility is above average; since costs are lower.

If traders use pending orders, they can eliminate slippage, which lowers the trading costs. Here’s an example with the ECN account.

Total cost = Slippage + Spread + Trading fee

= 0 + 10 + 1 = 11

You can notice that there is a significant reduction in trading costs. For example, the highest trading cost for the ECN account has reduced from 220.34% to 186.44%.

Categories
Forex Course

169. Which Trading Timeframe Should I Choose?

Introduction 

In the previous lesson, we covered how to trade multiple timeframes in the forex market. So, what timeframe should you choose to trade?

The timeframe you chose to trade will be entirely determined by the type of forex trader you are. Therefore, in this lesson, we will cover the timeframe to trade depending on the type of forex trader you are, i.e., position trader, swing trader, day trader, or a forex scalper. It is worth noting that you should consider trading three timeframes in Forex.

Timeframes for a Forex Position Trader

If you are a forex position trader, it means you intend to have your trading position open for several months to years. Therefore, you should trade the monthly and weekly timeframes. These frames give you a long-term perspective of the market trend while filtering out the hourly and daily “noises” of the price spikes.

Timeframes for Forex Swing Trader

For a forex swing trader, your goal is to have your positions open overnight to just a few weeks. With such a strategy, while performing your multiple timeframe analysis, you should start with the daily timeframe to establish your selected currency pair’s dominant trend.

On the chart, the daily timeframe will cover several weeks, which will help you establish the support and resistance levels over this period. With this perspective, you will quickly identify the high and low extremes. Narrow down to a 12-hour timeframe to see if this timeframe lines up with the observed trend, then finally use the 4-hour timeframe to find the entry point for your trade.

Timeframes for Forex Day Traders

If you are a forex day trader, that means you enter and exit all your trades within 24 hours. In this case, you should trade the 4-hour, 1-hour, and 15-minute timeframes. With the 4-hour timeframe, you will be able to establish the support and resistance levels for the past few days for your selected currency pair. The 1-hour timeframe will help you identify if the intra-day price trend aligns with the observed dominant trend. Finally, the 15-minute timeframe will enable you to narrow down the best entry and exit points for your trades, depending on the current price trend.

Timeframes for Forex Scalpers

For the forex scalpers, the smallest minute-by-minute price spikes count. Therefore, you should trade the 30-minute, 15-minute, and 5-minute timeframes. With the 30-minute timeframe, you get to identify the prevailing short-term trend with the selected currency pair. The 5-minute timeframe narrows down the tend to show how the most current price spikes build-up to the short-term trend. This timeframe also serves as your trigger timeframe for entry and exit.

[wp_quiz id=”89150″]
Categories
Forex Forex Elliott Wave Forex Market Analysis

Is CADJPY Ready for a New Rally?

Overview

The CADJPY cross advances mostly sideways in an incomplete triangle pattern. The corrective structure that remains in progress suggests the possibility of further upsides in the coming trading sessions.

Market Sentiment

The market sentiment on the CADJPY cross looks neutral, although during the overnight trading session, although the US presidential election is driving up volatility.

The following daily chart shows the long-term market participants’ sentiment unfolded between the 52-week high and low range. The figure reveals the price action currently moving on the neutral zone, which moves near the level of 79.274. 

In this context, the neutral sentiment is confirmed by the sideways channel, which began in early June, and the price action moving below the 60-day moving average Nevertheless, the bullish wide range candle of November 02nd leads to expect further upsides in the following weeks.

Technical Big Picture

The CADJPY cross moves in a sideways upward structure that belongs to an incomplete upward sequence that began last March 17th when the price found fresh buyers at 73.803.

The 2-day chart shown below illustrates the big picture of CADJPY under the Elliott Wave analysis perspective. The figure reveals the pair’s action advancing in an incomplete third wave of Minute degree labeled in black.

The consolidation structure of the CADJPY cross, in progress, suggests the possibility of a bullish continuation. Likewise, in terms of the Elliott Wave theory, if the current upward sequence corresponds to an incomplete impulsive sequence, the price could develop an extended wave. Nevertheless, a signal of confirmation of the potential new rally will occur if the price breaks and closes above the pivot level located at 79.823.

The short-term supports and resistance levels are as follows:

  • Resistance 1: 80.542
  • Resistance 2: 81.448
  • Resistance 3: 82.634

Pivot Level: 79.823

  • Support 1: 78.502
  • Support 2: 77.573
  • Support 3: 76.526

Short-term Technical Analysis Outlook

The CADJPY cross in its 4-hour chart unveils the course in a corrective structure that resembles a triangle pattern (subdivided into 3-3-3-3-3). This potential triangle pattern remains unfinished and could be developing its wave (d) of Minuette degree labeled in blue.


From the previous chart, both the breakout and close above the descending trendline connect the top of wave (b) of Minuette degree with the end of wave b identified in green as the close above the level 79.872 could confirm the turning bias from neutral to bullish.

The advance in its wave (d) identified in blue could find resistance between 81.448 and 81.909. Once the potential triangle pattern completes, the price could advance toward 84.739 and even extend its gains until 86.677.

Finally, the upward scenario’s invalidation level is located below the end of wave (a) of the Minuette degree labeled in blue.

Categories
Forex Fundamental Analysis

The ‘Sentix Investor Confidence’: Revealing Market Sentiment

Introduction

The economy, financial, and forex markets are mainly driven by sentiment. Abstract aspects of demand and supply primarily drive these markets. A financial asset’s value will appreciate if a majority of investors believe that its future cash flows will increase. Conversely, the value of the asset will lower if these investors have a negative outlook on it. Therefore, knowing how most investors feel about the outlook of the economy can help you plan your future investments properly.

Understanding Sentix Investor Confidence

Investor confidence indexes are usually estimated by conducting surveys on investors and analysts throughout the economy.

In the EU, for example, the investors’ confidence is gauged using the ‘EU Sentix Investor Confidence’ index. Sentix is a German marketing and research firm predominantly dealing with behavioral finance. This index is compiled through a survey of about 2800 investors and analysts from across the 17-EU member countries. The primary role of the index is to obtain the confidence of the business people about the current economic climate and their anticipation about the future economy.

Sentix Investor Confidence Methodology

The Euro area Sentix economic report is categorized into the current situation and Expectations.

Current situation: This part of the report polls how the investors and analysts feel about the prevailing economic conditions. Ongoing geopolitical aspects inform the current economic conditions to the prevailing market conditions.

Source: Sentix

Expectations: As the name suggests, this part of the report concerns the future. Investors and analysts are polled to see what they think the future economic conditions will be. Do they expect the current conditions to improve, remain the same or deteriorate?

Both these parts of the report accommodate various economic indicators about the economy. The investors and analysts are asked their sentiments on various aspects of the economy, from the ease of doing business, labor conditions, interest rates to geopolitics.

As mentioned, Sentix surveys up to 2800 people who are mostly employees and investors in the private sector. The survey is conducted to ensure inclusivity of all economic sectors, thus obtaining a representative perspective about the state of the economy.

The results from the questionnaires are collated and indexed on a scale of -100 to 100. Readings of below 0 indicate that investors and analysts are pessimistic about the economy, with the severity of their pessimism increasing as the index approaches -100. On the other hand, a reading of above 0 shows optimism. The higher the index, the more optimistic the investors are about the economy.

Source: Sentix

Using Sentix Investor Confidence for Analysis

Keep in mind that the polled people for this index are experts – presumably authoritative in their various fields. Therefore, by following

Sentix

level of confidence in the economy can be incredibly helpful in making predictions about the economy at large.

Investments, in any economy, forms a major part of economic growth. When investors have a positive outlook about the economy, current, and future, we can expect them to make more investments in various sectors of the economy. Naturally, these investments create more jobs in the economy, increasing economic output, improving households’ welfare, and growing the GDP.

On the other hand, when the investors hold a negative outlook about the economy, they will halt any further investment plans. Some may go as far as cutting back on their investments. In this scenario, the industries in which they have invested in will be forced to scale down their operations. Consequently, the economy can expect a higher unemployment rate, depressed demand in the economy, reduced output, and a general contraction in the GDP.

Note that the current and the expectations of investor confidence aren’t always aligned. Policymakers can use this knowledge to make informed decisions on monetary and fiscal policies. When investors are confident about the current economic conditions but pessimists about the future, theoretically, governments and central banks could implement expansionary policies. Such policies will stimulate the economy and prevent any job losses, or adverse contractions of the economy in case investors shy away from further investing.

Furthermore, Sentix investor confidence is a vital indicator of recessions and recoveries. Let’s take the example of the ongoing coronavirus-induced recession. Towards the end of the first quarter of the year, investors were pessimistic about the future. They anticipated that the ravaging effects of the coronavirus would severely affect the economy. And true, as anticipated, the economy was ravaged. New investments during the months following the outbreak were at historic lows, and the unemployment levels globally were the highest ever witnessed. The Sentix investor confidence forestalls the current recession.

Similarly, the Sentix investor confidence index can be used to show signs of economic recoveries. Let’s still consider the example of the recent coronavirus pandemic; the Sentix investor confidence has been accurately used to show economic recovery signs. After governments and the European Central Bank (ECB) put in place economic expansionary measures, the Sentix investor confidence became less and less pessimistic. This showed that investors anticipated that the economy would recover.

Source: Sentix

Impact of Sentix Investor Confidence on Currency

As we mentioned earlier, sentiment is one of the major drivers of currency fluctuations. When the investor confidence is highly optimistic or improving from extreme pessimism, the domestic currency will appreciate. This appreciation is because investor confidence signals improvement in the economic condition, followed by lower unemployment levels, better living standards, and higher GDP levels.

Conversely, dropping levels in the Sentix investor confidence leads to the depreciation of the domestic currency relative to others. The depreciation is because forex traders will anticipate that adverse economic conditions will follow.

Sources of Data

Sentix conducts the surveys and publishes the Sentix Investor Confidence index for the Euro area.

How Sentix Investor Confidence Index Release Affects The Forex Price Charts

Sentix released the latest EU investor confidence index on October 5, 2020, at 8.30 AM GMT. The release of the index can be accessed at Investing.com. Since the investor confidence index is a low-impact indicator, low volatility is expected on the EUR.

In October 2020, the Sentix Investor Confidence index was -8.3 compared to -8.0 in September 2020. However, the October reading was better than the expected  -9.5.

Let’s find out how the October 2020 Sentix Investor Confidence index’s release impacted the ERU/USD price action.

EUR/USD: Before the Sentix Investor Confidence Index Release on October 5, 2020, 
just before 8.30 AM GMT

Before the release of the Sentix Investor Confidence Index, the EUR/USD pair was trading in a steady uptrend. The above 5-minute chart shows candles crossing above the 20-period MA and forming further above it.

EUR/USD: After the Sentix Investor Confidence Index Release on October 5, 2020, 
at 8.30 AM GMT 

After the release of the index, the EUR/USD pair formed a 5-minute bearish candle. However, the pair subsequently adopted a strong uptrend. The 20-period MA rose steeply with candles forming further above it. This trend shows that the EUR became stronger after the release.

Bottom Line

In the forex market, the Sentix Investor Confidence index is a low-impact indicator. In the current economic climate, however, this index can prove invaluable in predicting the directions of the economy – to show whether the Euro area economy is bouncing back from the effects of the coronavirus pandemic.

Categories
Forex Assets

Trading The AUD/INR Forex Exotic Pair & Analysing The Costs Involved

Introduction

AUD/INR is an exotic currency pair in the forex market, with the AUD representing the Australian Dollar and the INR representing the Indian Rupee. Here, the AUD is the base currency, and the INR is the quote currency. That means that the AUD/INR price represents the amount of INR which 1AUD can buy. For example, let’s say that the price of the AUD/INR is 52.2654. It means that 1 AUD can buy 52.2654 INR.

AUD/INR Specification

Spread

When you go long in forex trading, you have to buy the currency pair from your forex broker. Now, if you decide to sell back the pair to the broker, they will buy it at a lower price than they sold to you. The difference between these two prices – also known as “bid” and “ask” – is the spread.

The spread for the AUD/INR pair is:

ECN: 20 pips | STP: 25 pips

Fees

Some brokers charge a commission for positions opened using ECN accounts. They vary depending on the size of the trade. STP accounts are rarely charged any trading fees.

Slippage

Slippage in Forex is the difference between the execution price of a market order and the price at which that order was placed. The slippage comes about due to increased market volatility or inefficiency on the part of your broker.

Trading Range in the AUD/INR Pair

When a currency pair fluctuates, its volatility varies across different timeframes. The analysis of this volatility in different timeframes is done using the trading range. It can help the trader identify the most suitable timeframes for a particular currency pair.

The trading range is expressed in pips. It shows the value of pips you stand to gain or lose on various timeframes.

The Procedure to assess Pip Ranges

  1. Add the ATR indicator to your chart.
  2. Set the period to 1
  3. Add a 200-period SMA to this indicator
  4. Shrink the chart so you can determine a larger period
  5. Select your desired timeframe
  6. Measure the floor level and set this value as the min
  7. Measure the level of the 200-period SMA and set this as the average
  8. Measure the peak levels and set this as Max.

AUD/INR Cost as a Percentage of the Trading Range

Expressing the total trading costs of a currency pair as a percentage of the trading range helps to understand the trading costs that pair on multiple timeframes. It shows how the trading costs change with volatility.

Below are the trading costs for the AUD/INR  pair on ECN and STP accounts.

ECN Model Account Costs

Spread = 20 | Slippage = 2 | Trading fee = 1

Total cost = 23

STP Model Account

Spread = 25 | Slippage = 2 | Trading fee = 0

Total cost = 27

The Ideal Timeframe to Trade AUD/INR Pair

From the above analyses, we can observe that the lowest trading costs of the AUD/INR pair are on longer timeframes. The lowest trading costs for both the ECN and the STP accounts are when the AUD/INR volatility is at the highest – 518.3 pips. While the shorter timeframes have higher trading costs, intraday traders can take advantage of the maximum volatility periods during these timeframes.

Furthermore, traders can reduce the trading costs by implementing forex limit orders instead of market orders, which are prone to slippages. Here is an example of how the limit orders remove the slippage costs.

ECN Account Using Limit Model Account

Total cost = Slippage + Spread + Trading fee

= 0 + 20 + 1 = 21

You can notice that the forex limit orders lowers the overall costs by making the slippage cost 0. In this scenario, the highest trading cost has been reduced from 389.83% to 355.93%.

Categories
Forex Course

168. Learning To Trade Multiple Timeframes In The Forex Market

Introduction 

In our previous lesson, we discussed multiple timeframe analysis in forex means. Now, let’s find out what forex trading with multiple timeframes means. In case you are wondering, trading multiple timeframes in forex does not mean that a trader is opening several positions using different timeframes. We are not saying you can’t do this, you if you have the money; but that is not what trading with multiple timeframes in forex means.

Trading multiple timeframes in Forex means using different timeframes to establish the trend and support and resistance levels of a currency pair to determine the best point of entry and exit of a trade. Let’s use a few examples to show how trading with multiple timeframes in forex occurs.

As we had mentioned in our previous lesson, the timeframes you use for your analysis depends on which type of forex trader you are. The best way of trading multiple timeframes in the forex market is by using the top-down technique. With this approach, you first observe the longer timeframes for the general market trend, then use the smaller timeframes to establish more current trends.

Let’s take the example of a forex day trader. You will start by using the 1-hour timeframe to establish the primary market trend. Say, a day trader wants to open a position on September 9, 2020, at 11.00 AM GMT, using the 4-hour timeframe, the market shows an uptrend.

4-hour timeframe for EUR/USD

1-hour timeframe for EUR/USD

The 1-hour timeframe confirms that the pair’s intermediate trend is consistent with the uptrend observed in the 4-hour timeframe.

15-minute timeframe for EUR/USD

The 15-minute timeframe can then be used to select the best entry point.

Determining the market limits: the longer timeframes will enable you to determine the support and resistance levels of a currency pair. The resistance levels help you set your exit points while the support levels will help you timing your market entry.

Establish the trend momentum: While the larger timeframe gives you the overall market trend, the smaller timeframes will help you establish the spikes in the price of the currency pair. These spikes will help you to establish the short-term strength of the trend compared to the longer-term trend.

Helps avoid the lagging effect of some technical forex indicators: Most technical Forex indicators are lagging, meaning trend changes signaled by the indicators lags the real change in the price of the currency pair. Therefore, price-action can be said to be leading the technical indicators in the forex market.

We will cover these three reasons in detail in our subsequent lessons.

[wp_quiz id=”89146″]
Categories
Forex Assets

Exploring The Costs Involved While Trading The AUD/KRW Exotic Pair

Introduction

The AUD/KRW is an exotic currency pair where AUD is the Australian Dollar, and KRW is the South Korean Won. This article will cover some of the essential elements of the AUD/KRW pair that you should know before you start trading this exotic pair.

The AUD is the base currency, and the KRW is the quote currency in this pair. Hence, the pair’s price represents the amount of KRW that can be bought using 1 AUD. For example, say the price of AUD/KRW is 795.89, it means that for every 1 AUD, you can buy 795.89 KRW.

AUD/KRW Specification

Spread

In forex trading, your broker will sell a currency pair to you at a higher price than the one they will buy from you if you sold it back to them. These prices are “bid” and “ask,” and the difference between them is the spread. The spread for the AUD/KRW pair is:

ECN: 21 pips | STP: 26 pips

Fees

STP type accounts incur no trade commissions. For the ECN accounts, the fees charged depend on your broker and the size of your position.

Slippage

When placing a forex market order with your broker, that order might be executed at a different price. The difference is slippage and is due to higher volatilities or execution delays by the broker.

Trading Range in the AUD/KRW Pair

The trading in forex aims to show the trader how a currency pair fluctuates across multiple timeframes. This analysis is used to determine volatility associated with the pair.

If. For example, the trading range of the AUD/KRW across the 4H timeframe is ten pips; it means that a trader can expect to gain or lose  AUD 12.6; since the value of 1 pip is AUD 1.26.

Here’s the trading range of the AUD/KRW  across multiple timeframes.

The Procedure to assess Pip Ranges

  1. Add the ATR indicator to your chart.
  2. Set the period to 1
  3. Add a 200-period SMA to this indicator.
  4. Shrink the chart so you can determine a larger period
  5. Select your desired timeframe
  6. Measure the floor level and set this value as the min
  7. Measure the level of the 200-period SMA and set this as the average
  8. Measure the peak levels and set this as Max.

AUD/KRW Cost as a Percentage of the Trading Range

Here, we calculate the total trading costs that a trader can incur trading the AUD/KRW across different timeframes under different volatility.

The trading cost is expressed as a percentage of the volatility, which is in pips.

ECN Model Account Costs

Spread = 21 | Slippage = 2 | Trading fee = 1

Total cost = 24

STP Model Account

Spread = 26 | Slippage = 2 | Trading fee = 0

Total cost = 28

The Ideal Timeframe to Trade AUD/KRW Pair

From the above analyses, we can observe that the highest costs in both the ECN and the STP accounts are incurred at the 1H timeframe when volatility is at the minimum 58 pips. Although the trading costs decline as the timeframe becomes longer, you can notice that the costs are lower when volatility is at the maximum across all timeframes. Therefore, for intraday traders trading the AUD/KRW pair when volatility approaches, the maximum will help lower the costs.

Using the forex limit order types can also help to reduce the overall costs since it eliminates the risks of slippage encountered in market orders. Here’s an example.

ECN Account Using Limit Model Account

Total cost = Slippage + Spread + Trading fee

= 0 + 21 + 1 = 22

Notice how the overall trading costs have been lowered in all timeframes. When volatility is at the minimum at the 1H timeframe, the highest trading cost has declined from 406.78% to 372.88%.

Categories
Forex Course

167. Multiple Timeframe Analysis – Key to your Success

Before defining what multiple timeframe analysis is, we first need to understand what timeframe in forex means.

What is Timeframe in Forex?

In the forex market, the timeframe shows the change in a currency pair’s price over a given period. For example, a 1-minute timeframe shows how the price of a given currency pair changes minute by minute, while a 1-month timeframe shows monthly changes in the pair’s price.

No matter which trading platform you use when trading forex, there are several timeframes provided. For example, the screengrab below of an MT5 platform shows the different timeframes provided to forex traders.

Therefore, in the forex market, multiple timeframe analysis is a chart analysis technique that involves observing a currency pair’s trend under different timeframes.

Importance of Multiple Timeframe Analysis in Forex

Another type of forex trader would employ a different timeframe analysis to determine their trade entry and exit positions. Any forex trader knows that the price of a currency fluctuates continuously. Thus, the trend observed in a 1-minute timeframe will be different from the 5-minute timeframe and so forth. The table below shows different timeframes for different types of forex traders.

In timeframe analysis for forex markets, it is advisable to adopt a top-down technique. This technique involves beginning your analysis with a larger timeframe, depending on your trading style, to establish the overall price trend. Subsequent smaller timeframes then follow to show how the observed trend can be broken down to find preferable entry points.

Let’s take a forex day trader, for example. Such traders do not hold an open position overnight. Thus, for their timeframe analysis, they would start with the 8-hour timeframe, then to 4-hour the 1-hour timeframe.

With multiple timeframe analysis in forex, the larger timeframes, like the 1-month timeframes, are used to show a longer-term trend of a currency pair. In a single glance, you can see how the pair has been trading for years.

GBP/USD 1-Month Timeframe Analysis

From the above 1-month chart of the GBP/USD, you can notice the pair’s longer-term downtrend from August 2014 to August 2020. Short timeframes are ideal for showing the more recent changes in the price of a pair. Most forex traders use shorter timeframes to find opportunities to enter a trade and identify ideal exit points.

[wp_quiz id=”89128″]
Categories
Forex Elliott Wave Forex Market Analysis

EURJPY: Can we Profit Short-Term?

Overview

The EURJPY cross advances in a corrective sequence that began on September 01st; this corrective movement looks incomplete. The short-term Elliott wave outlook foresees a limited recovery prior to its a coming decline corresponding to its fifth wave.

Technical Big Picture

The EURJPY cross, in its 12-hour chart, illustrates an incomplete downward sequence that began on September 01st when the price found fresh sellers at level 127.075. 

The previous figure exposes an upwards structural series subdivided into three-wave identified in Minute degree and labeled in black, which began on the May 06th low located at 114.397 and ended on the September 01st high when the price topped 127.075. 

Once the price found fresh sellers at 127.075, the cross started to retrace, developing a three-wave sequence identified in the Minuette degree labeled in blue. Until now, wave (c) doesn’t show bullish reversal signals, which lead us to expect further declines.

The short-term key supports and resistance levels are as follows:

  • Resistance 1: 123.160
  • Resistance 2: 124.233
  • Resistance 3: 124.999
  • Pivot Level: 122.377
  • Support 1: 121.144
  • Support 2: 120.271
  • Support 3: 119.311

Technical Outlook

The short-term outlook for EURJPY illustrated in its 3-hour chart reveals the intraday consolidation, which coincides with the progress of its fourth wave of Subminuette degree labeled in green.

In this regard, the market participants could mostly drive the price toward the supply zone between 122.550 and 122.890, from where the EURJPY cross could start developing the next decline corresponding to its fifth wave identified in green.

The potential target zone of the next decline locates between 121.038 and 120.051, which coincides with the base-line of the descending channel that extends from the September 01st high to date. 

Finally, the invalidation level of the downward scenario locates at 123.402.

Categories
Forex Basic Strategies Forex Daily Topic

Trade Ranges Like A Pro with this Effective Forex Trading Strategy

Introduction

The market does not move in random directions. It either trends or consolidates. As many would not know, the market is like a closed circle, and the same states keep repeating over and over again. Thus, in trading, one must learn how to become pro at reading these market states.

On that same note, we shall be going over an effective strategy when the market is in a consolidation/ranging state. However, before jumping right into the strategy, it is important to understand the basics and related concepts.

What is a consolidation phase in a market?

There are several ways to comprehend the consolidation phase of the market. There is logical reasoning behind the occurrence of this state, and is not simply a random pattern that shows up quite often.

The consolidation state is that phase of the market when the market moves in a sideways direction. This state is also referred to as a range. The reason for its occurrence is related to the strength between bulls and bears.

Comprehending a Range

There are two parties in the market – the bulls and the bears. Their strength is what describes the state of the market. In a trending market, either of the parties is powerful. For instance, if the market is going up, it simply means that the bulls control the market. In a consolidation state, both bulls and bears show equal strength. The bulls show strength by pushing the market higher, while the bears show power by taking the price right back down. As a result, the prices in both directions – which we refer to as a range.

How to draw a range?

To trade this range strategy, it is vital to understand how a range is drawn. A range is made up of two levels:

  • Support
  • Resistance

Thus, drawing the correct support and resistance levels will result in a perfect range.

Another point considered is the size of the range. The larger the range, the better. The other small consolidations in the market are ignored. Following is an example of how we pick an ideal range.

In the above example, both are ranges as the market is moving in a sideways direction. However, we do not consider range-1 as a range for our strategy. This is because a single line going up and down fails to depict the market’s price action.

Supply and Demand Range Strategy

What is the usual approach to trading a range? It is to buy at the support and sell at the resistance. But we’re going to step the game a little bit. The supply and demand range strategy uses the same principles of a typical range, in addition to other factors.

Step by step procedure to trade the Supply and Demand Range Strategy:

  1. Find a legitimate range in the market. Mark the Support and Resistance levels appropriately.
  2. Determine the direction of the market prior to the range.
  3. Find a potential supply/demand level.
  4. Get in when the market breaks through the range and reaches the supply/demand zone.

Buy Example

Consider the below chart of GBPCHF on the 4H timeframe. We see that the market has been ranging between 1.1902 and 1.1800. Observe that the support and resistance levels have been marked by cutting off the false market breakouts.

To trade this market, our job is not simply to hit the buy at the support and sell at the resistance. As mentioned, we take into account the preceding direction and the supply and demand levels around it.

The direction of the market prior to the range was an upside, indicating that the bulls were in control previously. A point to note is that, despite the market being in a range, it does not change the fact that the bulls are still powerful. Thus, we rather look for buying opportunities than shorting signals.

To do so, we wait for the price to drop below the bottom of the range and hold at any one of the demand zones. Once the market begins to reverse its direction from south to north around the demand zone, we can go long. The same scenario has been illustrated in the chart below.

Placements

Stop Loss – Well below the demand zone would be decent.

Take Profit – Top of the range would be an ideal spot to take profits.

Sell Example

Consider the chart of CAD/JPY on the 15min timeframe shown below. The recent market price action depicts that the market is moving sideways. The market’s overall trend is down, indicating that the bears are in control of the market.

Since the scenario is opposite to the previous example, we wait for the market to break through the resistance and reach any potential supply level. In the below example, we can see that the price broke through the resistance twice reacted off from the supply, as shown. Thus, we can look for entries when the market begins to switch direction to the downside.

Placements

Stop Loss – Above the supply zone

Take Profit – Bottom of the range

Conclusion

The only way to trade a range is not by buying and selling from the top and bottom of the range. It can be professionally traded with the application of other factors. And this range strategy particularly dealt with the strength of the bulls and bears and the concept of supply/demand.

We hope you were able to comprehend our Supply and Demand Range strategy. Do test them out for yourself and let us know your results in the comments below. Happy trading!

Categories
Beginners Forex Education Forex Basics

Forex Mini (and Micro) Trading Accounts Explained

Many forex brokers offer multiple types of trading accounts so that they can cater to the needs of different kinds of clients. For example, a VIP account is usually designed for big-league clients that can afford to make a very large deposit (somewhere in the ballpark of $25,000, $100,000, or more). The broker might reward these clients with lowered spreads and commission fees or other benefits for making such a large investment with them. A Mini account is one common account type that is more suitable for entry-level traders. This account also might be referred to as a Cent or Micro account.

Conditions with every broker are different, but there are a few things you can expect to see with a Mini account type:

  • A low deposit minimum: Some brokers will allow you to deposit $5, while others might ask for a larger amount of around $100 or so. Still, the required minimum for these accounts is often much lower than the asking amount for a Standard account or other type of account that the broker offers. This makes these accounts more attractive for beginners.
  • A smaller minimum trade size: Most mini accounts will allow you to make a trade that is one micro lot (0.01) in size. Other larger accounts often require a minimum trade size of one mini lot (0.1) or one lot, especially accounts with larger deposit requirements. 

Mini accounts are attractive options for beginners because they offer the ability to open a trading account with a smaller deposit while taking a reduced risk through smaller contract sizes on trades. Traders usually have access to the same assets, trading platforms, support options, and other features offered by the broker, so this can be a great option for those that are just starting out.

If you’re considering a Mini account, you do need to be aware of some of the dangers associated with these account types. While trustworthy brokers will provide you with average conditions or better, some brokers take advantage of entry-level traders that can’t afford to make a big investment right out of the gate. Here are some things to watch out for:

  • Make sure the broker’s asking deposit is low. You should never have to deposit $500 or more to open a mini account. Even $250 is a lot considering that many standard accounts can be opened for around $100 to $200. 
  • Check the spreads on the account – the average spread is 1.5 pips on the pair EURUSD. If you see spreads of 3 pips or more on this pair, you should look at other options. You shouldn’t be charged an arm and a leg to make a trade just because you have an entry-level account, and many other brokers won’t try to overcharge you. Of course, do expect to see higher spreads than what might be offered on a Platinum, VIP, etc. account that requires a much larger deposit.
  • Look at commission fees to be sure that they are reasonable as well. Be sure to add spreads and commission fees so that you know the total cost of placing a trade.
  • Some shady brokers withhold certain features from lower-tiered accounts, even though those benefits should be available to everyone. For example, VIP clients might be provided with instant support, while Mini account holders are only able to talk to support through email. Having a dedicated account manager is one thing but being denied basic customer service options is unacceptable.

A Mini account can be a great option for traders that are just getting started. This account type accepts low entry-level deposits and will allow you to make smaller trades. Although profits are on a smaller scale, clients that are still learning will benefit more from this less risky account type. There are a few things to watch for before opening a mini account, however, as some brokers might try to charge you high fees or take advantage of beginners. As long as you open a mini account through a trustworthy brokerage, you will be able to reap the benefits without losing your investment as easily as you could on another type of account. Once you become more acquainted with trading, many brokers will allow you to move on to another account type that supports larger trades and offers more benefits.

Categories
Beginners Forex Education Forex Basics

Forex VIP Trading Accounts Explained

A VIP account is a type of trading account that is offered by many forex brokers. If you’ve heard of them, you might already know that these accounts are reserved for high-roller clients that can afford to make a significant investment with a broker. If you didn’t know, just check the ‘Account Types’ page with any broker and you’ll find that VIP accounts require a huge initial deposit.   

How much is a “significant” investment? Well, the answer differs depending on the broker, but one thing is for sure – a VIP account is usually the best account offered by a broker and thus requires the largest deposit they ask for. If the broker’s Premium account asks for a $25,000 deposit, you can bet that the VIP account requires double that or more to be opened. We’ve seen brokers ask for $25,000, $50,000, $100,000, and anything above, below, or in-between.

If you’re disappointed to see how much it costs to open a VIP account, don’t worry. Many brokers offer at least one or more accounts that ask for a smaller, more reasonable deposit. You should be able to find beginner-friendly accounts for $5 to $250 if you’re just starting out. 

Still, you might aspire to become a successful high-roller trader one day that can afford to open a VIP account. If you’ve had your eye on one of these exclusive accounts, there are actually several benefits you should know about that are related to opening a VIP account:

  • Brokers might place maximum balance caps on their other accounts, but VIP accounts can hold an unlimited balance. 
  • Most brokers offer special discounts to VIP account holders – oftentimes, spreads start from 0-1 pip(s) and commissions are low. The best trading conditions are often reserved for these clients alone. 
  • Additional perks are often provided to VIP clients. A dedicated account manager and one-on-one webinars with an expert are some of the perks we’ve seen, but these special offers vary widely depending on the broker.
  • Brokers tend to be more concerned about their VIP clients – it’s all in the name, after all. If you’re having an issue and need to speak to support, you can expect to hear back quickly. Your broker will want to do everything they can to keep you as a client. 
  • Some brokers provide VIP clients with expedited withdrawals and/or zero withdrawal fees. 

As you can see, VIP clients are provided with certain advantages, like lowered fees, more responsive customer support, special perks in the form of an account manager or other extra options, and the ability to hold an unlimited account balance. You also might see benefits that are exclusively offered to VIP clients, like lightning-fast withdrawals or fee-free withdrawals, even though other account holders have to wait and pay for their withdrawals. 

Don’t be discouraged if you don’t see yourself as a VIP client anytime soon. Know that most brokers offer multiple account types that can be used as steppingstones up to their very best account. Beginners can start out at the entry-level account and graduate to a better account as their balance grows, earning more benefits, and paying lower fees with each upgrade. Eventually, you could find yourself at the top with a lot of hard work and dedication. We aren’t saying that everyone can have a VIP account – but you can find yourself there one day if you invest your money and spend time educating yourself and perfecting your strategy. Also, be sure to compare brokers to make sure that you get the best trading account that your money can buy right now.

Categories
Forex Money Management

Three Vitally Important Money-Management Tips

It simply isn’t possible to become a successful Forex trading without implementing a solid money management plan. Fund management and market analysis are indeed the keys to successful trading. Here, we provide you with three vitally important tips for managing your funds while trading FX.

Tip #1: Figure Out If you Have a Spending Problem

Consider how much money you make, how much you spend on bills, and where the rest of your money goes. Do you have money in savings? How much do you eat out on a monthly basis? Do you frivolously blow money on random things that you don’t even use? Or perhaps you’re prone to paying those pesky overdraft fees after overspending if you have a bank account. If you do use a bank, try looking at your previous spending over the last few months and figure out your monthly total. You might be surprised just how much you spend on unnecessary items, eating out, overdraft fees, subscriptions you don’t use, and so on. You can then move on to create a record of your spending habits. A pie chart is useful for this, as it can break down just where your paycheck is going. 

Tip #2: Create a Budget

Once you figure out where your money is going, you need to give yourself a realistic budget that you can actually stick to. Don’t deprive yourself of everything you like but try to cut down in some places. For example, if you spend $100 eating out every month, try to lower that amount by at least $20. You could also cancel some of those old subscriptions that you barely use to save $10 or more every month. It’s easiest to cut down on frivolous spending but take a look at some of your bills as well. Maybe you could be saving on car insurance, home insurance, your cell phone bill, or something else. You might even realize that you barely use your cable service and consider canceling in favor of streaming services. Once you analyze your budget and make cuts, you’ll have more money to save.

Tip #3: Invest in Trading

Once you have more money in hand, you could always follow traditional means by putting it up in a savings account. However, you could also consider investing this money to make more money. This can also lead to more benefits down the road, as it can contribute to paying for family vacations, Christmas, and can even help you float through retirement someday. You won’t get rich overnight if you do decide to take up trading, but we highly suggest it if you’re willing to put in the hard work. After all, you’ve already thought about your spending and where you could cut back, so why not invest the money you’re saving? This is one of the best financial tips out there for anyone that is looking to make more money without getting a second or third job. 

Categories
Forex Basics

How to Start Trading Forex for Free

Stumbling upon an article or piece of information about forex trading can be exciting, if not mysterious at first. People ask a lot of questions regarding trading regarding issues about whether or not it is possible, if it can make you rich, or if it is even worth it. While many aspiring traders gain their own perception of what trading will be like from information on the internet, many of them never go on to open a trading account or make that first deposit. While some of these traders don’t take the step because they have decided it isn’t worth it, many others just can’t bring themselves to make that first deposit when they don’t know if trading will actually make them any money.

Maybe you’re looking into trading because you desperately need another source of income, but you’re imagining that forex trading is reserved for wealthy people that can afford to invest large sums of money. After all, how are you supposed to make money if you don’t have anything to invest in? Or you might have a few hundred dollars (or more) that you could afford to invest, but you can think of a million other things you actually need. If you invest the money into a trading account and lose it, wouldn’t you have been better off spending it on something else? Even if you have a ton of money to spare and wouldn’t really miss it, nobody wants to give away their money with nothing to show for it. 

There’s good news if you’ve found yourself facing this problem – you can actually start trading for free by opening a demo account through almost any broker. A demo account works just like a live account in that it simulates the same environment traders on live accounts are experiencing, with the one key difference being that a demo account allows you to trade with virtual currency. You can enter and exit trades just like you would on a live account and trade with the same spreads and prices offered by the broker, only you don’t have to risk anything financially. This is a great way to see what kind of results you would get if you did decide to make a deposit, and there’s no risk because you can simply abandon the demo account at any time if you decide that it isn’t for you.

If you’re eager to open an actual trading account but you still don’t have the money to invest, there are a few other options. Some brokers will actually give you a welcome bonus to open a live account with them without asking that you deposit anything. If you lose the bonus, you don’t owe anything to the broker and you don’t ever have to make a deposit. However, it can sometimes be difficult to find promotional offers that don’t require anything on the trader’s behalf. Some of these promotions might be offered from time to time, so be sure to check online often if you have trouble finding one. Another option that isn’t entirely free would be to find a broker that offers a deposit bonus so that you can get more out of the deposit you make. This type of promotion is much more common and many brokers will match what you deposit up to a certain amount. So, if you only have $100, your broker would add another $100 to your account balance, giving you more money to trade with. This would be a good option for those that don’t have a lot of money to invest.

So, if you want to start trading for free, you have a handful of options. You should start with a free demo account, which will allow you to gain practice, test out any strategy you’re planning to use, and trade without any financial risk whatsoever. When you’re ready to move on, you can find a broker that will offer a welcome bonus and allow you to open an account for free, or you could find a broker with a deposit bonus to get more out of your initial deposit. If none of these options work for you, keep in mind that many brokers will allow you to start small with a deposit of around $10 or less, which is affordable for any aspiring trader.

Categories
Forex Psychology

The Supreme Discipline of the Forex Trader

Although the currency market is the largest market in the world, there are still many traders who have no idea how it works. So, the reality is that there’s a fair amount of prejudice against currency trading. Some traders even fear the market. If you’re one of those traders, be sure to read this article carefully.

In it, we will present to you the most important basic concepts of the currency market or Forex trading and show you the possibilities it offers. But even for readers with a lot of experience in this market, this article will be an interesting read, in which they will still be able to learn a little more.

Anyone who has made the decision to prove himself in the supreme discipline of traders must become intensely familiar with the currency market. If you know how the market works and what tools are available, you can optimally plan your operations and succeed.

Which players are represented in the market, how should risk and money be managed, what are the possibilities of analysis, and what are the most proven strategies? In this article, we want to work step by step on the most important points so that you can finally start successfully in the currency market (Forex).

What is Forex?

In the Forex market (currencies), currencies (currencies) are traded on the OTC market (over the counter). In other words, there is no central market but only OTC operations. The foreign exchange market is made up of banks, large companies, central banks, funds, intermediaries, and private investors. The Forex market gives the trader a chance to actively trade in the currencies of different countries, with private traders who can only actively trade in the foreign exchange market since the mid-1990s.

Previously, it was available only to institutions. The special feature of this currency market is that it is open on Sunday afternoons and remains active until Friday evening. During this time, it is open 24 hours a day, with a daily trading volume of around $6,000 billion, much more than any other market. Of course, it has its advantages. For example, you can trade when you have time currency pairs that are actively trading.

For example, suppose you live in Germany and have a window of opportunity from 08:00 to 10:00 when European stock exchanges open. In this case, for example, the currency pairs GBP/USD and EUR/USD could be very interesting. In general, the Forex market is very flexible and is able to create a timeline based on individual criteria.

What Moves the Market?

Economic data, in particular, has a significant impact on the Forex market, especially if a particular message deviates significantly from analysts’ and investors’ expectations. In some cases, however, a central bank could take a completely unexpected step at a certain point, leading to a dramatic price change in the currency market. Therefore, a position that is opened immediately before the central bank meeting is not advisable.

As with any trade, you should always remember to limit your losses through a limit on the Forex market, and consider what can happen when you post a specific message that moves the price directly to your loss limit. The amount lost due to a certain position is the question that must be asked again and again.

Entering the Currency Market

Currency pair trading can be done in different ways. Private investors, by choosing a suitable intermediary, gain access to various products with which they can directly or indirectly implement their trading ideas in the Forex market. In the case of cash trading, the two partners trade foreign currencies among themselves. For example, if Bank A with Bank B exchanges EUR 10 million/USD at an exchange rate of 1.30, Bank A will have to transfer USD 13 million. The A will receive 10 million euros from Bank B. The classic currency transaction is also available in a slightly modified form in private Forex trades under the name Spot Business.

Some brokers also offer trading with Forwards. Both methods are usually transactions based on a margin deposit; that is, with leverage. However, compared to cash trading in the interbank market, the foreign currency is not delivered but is “transferred” until the position is closed with an opposite order.

Costs Incurred 

Since the foreign exchange market is an interbank market and therefore does not incur additional fees to the stock exchange services, its trading is relatively cheap. Therefore, depending on the broker model, the trader only has to pay the differential or a combination of fork and commission. The tighter the hairpin, the better for the trader.

Since the currency market is very liquid, the odds of tight ranges are usually quite good. At the same time, dispersion is an important criterion when selecting the broker (in combination with commissions). However, traders need to know if the hairpin is fixed or flexible. In turbulent times, it can be a significant disadvantage when it suddenly reaches an expansion.

In addition, there may also be large differences between individual intermediaries in terms of corporate policy. Therefore, make sure that your broker guarantees the execution of the order and the setting of your loss limit. You should also make sure to include redundant systems to protect your hardware and software so that your commands always run, even if the server fails you during an operation. It should be noted that even in the less regulated currency market there are regulators who supervise many intermediaries, for example, the NFA (National Futures Association) in the U.S. The U.S. and the FCA (Financial Conduct Authority) in England.

On their websites, investors receive full information about private currency trading. Operators should be careful if the agent is in a peripheral country.

Trading Practice – Fundamental Analysis

The fundamental analysis analyses the causes that influence supply and demand in a given currency and thus determine the exchange rate. In assessing supply and demand, they consider, inter alia, the economic situation, and developments in the two currency areas included in each currency pair.

The development of factors such as interest rates, inflation, politics, and society, as well as economic growth plays an important role. Using models, it is possible to assess in a long-term context how a change in certain influencing factors affecting a given currency would affect and whether the current exchange rate seems justified. The exchange rate, which results from the models, is however only a theoretical guide.

In fact, prices may deviate from this, as particularly difficult future expectations to measure are included in price formation. Basically, however, it applies to the analysis: if the current price is below the value of the model, there is talk of an undervaluation, in the opposite case of an overvaluation.

Interest Rate Parity

The simplest model is interest rate parity. It requires traders to invest where they can achieve the highest return. Investment opportunities should have a similar level of liquidity and comparable risk. Capital flows between the two countries are based on the interest rate spread between the two currency areas, according to the interest rate parity model. If the interest rate is higher abroad, traders transfer their money there at the current exchange rate.

Later, the money is transferred back to the source at the current exchange rate. Depending on how the exchange rate develops during the investment period, it will have a positive or negative impact on profitability. If there were no exchange rate movements, the return would simply correspond to the foreign interest rate. Then, later, each investor would keep their money in the currency offering the highest interest rates.

Balance of Payments

In contrast to interest parity theory, the balance of payments attempts to explain exchange rates with a holistic approach. The focus is not on the return efforts of investors, but on the flow of goods and capital flows between the respective economies of a currency pair. The balance of payments is a systematic record of economic transactions between private and public households, as well as businesses and banks at home and abroad. It consists mainly of the current account and the capital account. The current account records all transactions in the goods market.

The current account balance is often defined as the “external contribution”. In other words, it’s about the difference between exports and imports of goods and services. If a country has a positive external contribution, domestic capital increases as a result of net capital inflows. If, on the other hand, imports exceed exports, money flows out of the country and domestic assets diminish. The capital account records accounts receivable and household liabilities vis-à-vis other countries. Here, a distinction is made between capital imports and exports.

The difference is also called the net export of capital. If the performance and financial balance are not the same, an imbalance between the supply and demand of a currency is created. The resulting movement of the exchange rate returns the relation to the equilibrium point. Fixed exchange rate systems may also have long-term imbalances in the balance of payments.

Purchasing Power Parity Theory

The third model, the absolute theory of purchasing power parity (also known as purchasing power parity, PPP), compares the purchasing power of 2 currencies. The key message of the theory is that one currency that has been changed to another in the corresponding country will have the same purchasing power and therefore the same real value.

The external price level after conversion of the exchange rate should correspond to the domestic price level. If the exchange rate deviates significantly from this equilibrium, there should be a tendency to return to equilibrium according to this model, since in principle there is a possibility of a gain.

If, for example, a computer in the U.S. (In Euros) costs less than in the Eurozone, it would be worth buying it in the U.S. and reselling it in Europe. It’s worth it. The difference between the purchase price (converted to euros) and the sale price continues to provide a profit.

However, to purchase a computer in the United States, you will need dollars. The supply of the euro and the demand for the dollar will subsequently lead to an appreciation of the dollar, with the result that purchasing power in both monetary areas is adjusted. A popular example of this model is the so-called Big Mac index. This is a simple-built index of people’s buying power published regularly by The Economist.

The basis for calculating purchasing power is a comprehensive description of the prices of a standardized and readily available product: the Big Mac at a McDonald’s restaurant. For example, if a Big Mac in the U.S. costs $ 5.28 on average, while the price in Germany is $ 3.95, the theoretical exchange rate is $ 5.28 / € 3.95 = 1.34. If the current exchange rate deviates significantly from the theoretically determined value, it would be adjusted to this long-term value according to purchasing power parity. In reality, the purchasing power parity theory considers not only a good but a complete shopping cart. Moreover, not all price differences generate an opportunity for profit, as taxes, transport costs and customs duties must be considered.

Many goods cannot be marketed worldwide, especially services or haircuts which are not transferable. Therefore, the shopping cart should only contain marketable products worldwide.

Technical Analysis

A general topic of controversy is whether the technical analysis in the currency market makes sense. On the one hand, there are so many price adjustments that many patterns can arise. On the other hand, the market is so inefficient that these patterns (theoretically) cannot function sustainably. However, most of the tools provided by Technical Analysis (TA) are well used in foreign exchange trading.

Classic graphics formations, such as trend channels or resistance and support lines, can be used, as well as the most advanced techniques of trend recognition, indicators, and oscillators, as well as candle formations. Due to the trend behaviour of the currencies, a relatively unknown type of graph is offered for the correct exchange rate analysis: the so-called “Graph of points and figures” (P&F – Point and Figure). This is a variant of alternative representation to the bars and candles graphics that are widely used.

In the foreground of the P&F table is no longer the movement of price in temporal terms, but the development of movement. Times when only small price changes (i.e., lateral movements) occur are filtered out of the table. A variant of similar representation, but more visually understandable, are the so-called Renko graphics. Both types of charts work with trend lines, indicators, and formations. When using it, you should always keep in mind that the time axis, unlike the “normal” graphics, is variable. Therefore, it may happen that the chart does not change over a longer period of time, if price fluctuations were too low or if a significant movement has not developed.

Various Time Levels

The methodology of integrating several time windows into the analysis and the resulting trading decisions are mentioned in the trader jargon as multiple time frame analysis. Due to the speed of the Forex market, this technique is particularly suitable. The concept derives mainly from 2 approaches. First, many operators check the situation in the main time window (for example, small time window: minutes chart, main time window: time chart) before entering a new position.

Only when the hourly chart does not have the resistance or support at the same level as the minutes chart and the exchange rate does not move in an opposite trend, will it enter the market. Second, many traders use this approach to enter into a long-term trend.

The smaller window often allows for a better entry time. However, once the entry is made, the operation will be managed in the longer-term chart. However, the danger of over-operation will be threatened. Instead of focusing on the long-term vision, many operators observe the position in the subordinated time frame, even after starting, and take unnecessary risks. If you consider support and resistance, you should start at the highest available time window and advance to the smallest primary unit in time.

Intermarket Analysis

The dollar, of course, is the most important currency in the world’s financial system. Consequently, the dollar index is excellent for analytical purposes. Just look at the index to read the strength or weakness of the dollar against the main currencies: if the index rises, the dollar shows strength against the other currencies. If the dollar index falls, this indicates a weakness against the other major currencies. To measure even how a known currency is developed one compares its value with a basket of 6 coins. Specifically, this is the weighted geometric average of the US currency in euros, Japanese yen, British pounds, Canadian dollars, Swedish krona, and Swiss francs.

Market observers, who are interested in the interactions of different asset classes, know that the United States dollar plays an important role in cross-market analysis. From the historical development of the price, it can be clearly deduced that the global currency has a long-term negative correlation with the commodity market.

You can see how commodities entered a massive bearish trend, as the dollar index had a brilliant rally in mid-2014. For this reason, the United States dollar or the associated concept of the United States dollar index plays an important role in cross-market analysis, which examines the interactions between markets.

Appropriate Strategies – Long-Term

Now that we have learned a lot about currency market theory, we also want to deal with its practical application. To this end, we present two strategies that are interchangeable, on the one hand, in the long term and, on the other hand, in the short term. The carry trade is well known in exchange operations. Behind it is a simple system: funds are generated in a low-interest currency and invested in a high-yield currency. The difference between interest rates and the change in price is most important.

If the exchange rate does not change during the investment period, the return on the carry trade equals the interest rate spread. Also, a rise in the price of high-interest rates versus low-interest rates will lead to a further increase in revenue. In this case, the return on the interest rate advantage is further increased by the favourable development of the exchange rate. On the contrary, a devaluation of the currency in which it is invested leads to a reduction in yield.

If the percentage devaluation is above the interest rate spread, the trader loses money. If there are significant fluctuations in exchange rates to the detriment of the investment currency, the strategy could incur correspondingly high losses.

Carry trade is a popular strategy for hedge funds, as they are suitable for large sums of investment. Fund managers seek to identify macroeconomic developments at an early stage and make cost-effective use of appropriate strategies. In the same context, there is often debate about leveraged carry trades. Only part of the negotiated sum is deposited as collateral, taking advantage of existing capital. A Deutsche Bundesbank study in 2005 based on carry trade in euros against the dollar shows an average yield of 15 %, a multiple of the interest rate spread. A maximum of 71% profit would be possible.

However, annualized yields can vary widely and be markedly negative from month to month. Although carry trade is a long-term currency strategy it represents an interesting trading approach in the past and today. However, due to the high potential for detractions, the risk should not be underestimated. Rapid market movements can wipe out accumulated earnings in months or even years.

Appropriate Strategies – Short-Term

For short-term traders who want to generate profits in the volatile phases of the market, there is the breakup strategy of Maite Krausse. Breakage trading is a strategy used by many professional traders that offer satisfactory results in both swing and intraday trading. The best results are achieved in the volatile market phases or in strong trends, with uncertainty between market participants and continuous sidesteps minimizing the likelihood of successful entries. First, the range is displayed from 24:00 to 08:00 Central European Time (CET) on the 15-minute chart.

At this time, the maxima and minima are determined. Highs up to 8:00 a.m are considered the upper limit or resistance range, and lower prices represent a support level. If the price is now above the minimum marked or below the minimum, a purchase order is placed between 2 and 5 pips above the maximum, a sales order of 2 to 5 pips below the minimum.

This range is only valid during the respective day, after which it must be redefined and is therefore ideal for intraday traders. Orders are still valid until around 21:00. Thereafter, all pending orders are removed and redefined the next day. Once a purchase/sale order is activated, the transaction is carried out throughout the day, with a risk/probability ratio (CRV) of around 2:1 on mostly quiet days and a CRV of 4:1 on economically important days, given that the interest rate is a country’s decision.

For example, the loss limit (SL) can be set between 20 to 30 points. Profit-taking (TP) ranges from 40 to 100 pips, depending on market fluctuations. Therefore, a smaller TP will be chosen in the quiet phases of the market, and a higher estimated TP in days of interest rate decisions and global political events. Trading management is simple and must be set with an automatic limit of approximately 15 to 25 pips. In addition, in the 1-hour chart, you should pay attention to the areas of resistance or support in the area of the alleged inputs.

Therefore, a purchase order above the resistance, and a sale order below the support will be established. The most likely to benefit from this strategy lies mainly in the evolution of macro-influenced prices. Then, it is very useful to have a look at the daily economic calendar, as the greatest fluctuations are accompanied by surprises and new knowledge about the economic situation of a country and, therefore, the respective currency.

Particularly interesting are central bank decisions or protocols that provide directional indications. In those days, sometimes the profit can be generous around 100 or more pips. Inputs can be further improved by including breakdowns of price patterns such as upward and downward triangles, double floor/roof, and head and shoulders formations.

If the price has formed as a pattern, you should be careful and tune your inputs, because the buds of these patterns are often traded and are volatile. Another way to identify good break opportunities is through certain candle patterns that have formed on the daily chart. For example, the inner bar candle (also known as Harami bassist/bassist), can predict an imminent break, both in trend and in reverse, which is often used.

There is an inner bar formation when the next daily sail is of a different colour (day 2) and has its maximum and minimum price within the previous day’s sail (day 1). The entry is set on day 3 above/below the maximum/minimum sail of the second day.

Conclusion

The Forex market offers interesting trading opportunities that allow private traders to benefit from exchange rate changes. Whether it’s in the area of classic day-to-day operations, as well as to protect against price fluctuations or as a mix of separate strategies in the custody account. The advantages lie in the high liquidity and flexibility of the market and its 24-hour operation.

Moreover, foreign exchange markets always offer clear short-term trends. With trading margin and leverage, Forex is especially interesting for low capitalization traders. Operators also have the opportunity to choose between a more flexible interbank market, on the one hand, and standardised products, on the other. An investor will be able to choose from numerous trading instruments and strategies and combine them if necessary.

Categories
Forex Basic Strategies

How to Build a Scoring System

Scoring system is a tool some professional traders use for decision making for their trades. A lot of factors are accounted for in the system eventually producing a score for a particular asset. Based on these scores traders know where opportunities are, effectively cutting down false signals of any trading system you may have developed. The Scoring system should tell you the best currency pairs to search for strong, emerging trends. And we all know by now that trend following is scientifically proven as the most probable method for a winning trade. Of course, some market environments ask for a strategy switch but the Scoring system is all about guiding you to fertile lands. 

Prop firms like to use hunting analogies for this system. Hunters first need to do some research before they start hunting for a game. They first need to know where to go, which location for finding the game is most probable. What weapons to carry, what time of day is good, how to spot trails, and so on. Once the hunter is positioned he will find a bunch of other animals that are not particularly interesting. A hunter/trader will need to wait patiently for the game to show up. It comes down to pull the trigger only when we assess the conditions, the signal, and put our capital at risk for that high probability trade.

The Scoring system will need some input. Giving a particular currency a score of -1 or +1 will have to depend on some analysis, be in indicators, or some other fundamental factor you think is relevant for your trading or asset (trading session, for example). Once you have your symbol picks and analysis set, the final scores for each asset are compared, thus giving you an overview of where to place your trades. Now, you should have a trading system in place for trade entry confirmation, exit, and so on, Scoring system is just a first step so you do not search for signals at the wrong place/asset. 

The Scoring system should rank your trading assets or currencies as weak, neutral, and strong. Sometimes, you will not have particularly weak or strong currencies. The scoring system is there to tell you that even if you have a signal from your trading system, that currency pair does not contain weak and strong currency but maybe ranging ones. This is not a high percentage trade, you may easily find out that the signal was a false breakout or just a temporary move. What a trader wants to find is a strong currency against a weak one and vice versa. Pairing these currencies carries the best opportunity and minimized risk it is a false signal you have found in your trading system. 

Now, once you know where to look, how do you find weak and strong currencies? While some traders think your trading system should have enough filters so you know the right currency pairs to trade even without the Scoring system, prop firms usually have a Scoring system using currency baskets as well. This may mean less trading frequency as an additional element is used but high-quality decisions are what differentiates pros from others. Currency baskets or Indexes give us chart representation of how strong a currency is compared to other major 7 currencies. Currency baskets are easily built on tradingview.com but there are also indicators built for Metatrader platforms, although they are not that common. Some brokers may offer Dollar or Euro Index symbols but other currencies like the AUD or GBP Indexes are not offered. It is important to know when we build the baskets, equal weight should be accounted for each currency. EUR basket formula below should give you an idea of how to make for the other 7 major currencies. 

Note that in some cases you will need to enter non-standard pairs like NZD/EUR to have a correct ratio for the index calculation and also pay attention to the JPY decimals as they are not as other currencies with 4 or 5 decimal presentation.

Prop firms advice to look at the bigger picture. Let’s say you are on the battlefield with thousands of participants, if you are a single soldier, you cannot see planes, warships, or artillery far away from your sight but they have an immense contribution to the battle outcome. As a trader, you need to see these factors by looking at two steps higher time frames from your target timeframe. If your system is giving a signal on a 1-hour timeframe, take a look at the daily. By doing this to each currency basket, for example, you may see your signal might be just an emerging correction of a larger trend and thus your probabilities of a winning trade are reduced since you are going against a major trend on a higher timeframe. Again, since the trend following method is considered the best, you want to have your trades aligned with the major trend direction. As a general view, a daily time frame gives you long term trends, 4H is intermediate and 1H is a short time overview of trends. Of course, you can find trends in every timeframe, but it is imperative your trades belong to a higher timeframe trend direction. When all timeframes, your target timeframe, and two steps higher are aligned, your odds are increased. 

This is a simple guide on how to find the best trades. On some occasions, you may find a one-time frame is not aligned with the other two, and it does not mean you should not take the trade. Reversal patterns are most successful in the intermediate time frame, for example. At this point, if you have a system in place for reversal strategies, you may look out for a major trend continuation setup on 4H when your target hourly time frame and long term timeframe are aligned. It is likely the 4H timeframe will also get aligned to the major trend and a trader can take this trade even if it is not strictly by the rules. There are also exceptions on the target timeframe but prop firms emphasize all timeframes alignment conditions on the bullish or bearish trend for the best trade setups.

Trader’s patience is tested at this point. Waiting for all timeframe alignment means fewer trades and less exciting trading. Know that forex changes and this alignment is not going to happen, you may feel you missed your shot. Fear of missing out is another enemy of profitable trading in tandem with impatience. As with hunting, the best game is usually not in plain sight the moment we are in position. The experience will always remind us and motivate us to wait, alas experience requires trial and error many times. To sum up, small major trend continuation trades are the best practice according to professionals. 

The Scoring system will have a set of measures based on which scores are made. If you are new to trading, start with simple measures and score range. Experienced traders already have a system they are accustomed to. Once you implement a scoring system, forget about all other info. Let’s say you have a signal on your MACD and the price is above your MAs. All is set up for a trade entry but you find out about a news report on Bloomberg tv that puts doubt in your decision. Waiting out might seem to be the right choice here but know there will always be some info for and against your decision. Put aside your thinking and feelings and just go with your system. When you set a +1 point if your MACD signals a long trade, +1 for MAs and +1 for other studies like Price Action pattern, agree you are looking at a bullish currency trend. Find a weak basket and look for that currency pair. Nothing else matters, keep it simple. 

Now, here is an example of how to build a Scoring system. Start with a set of indicators or fundamental analysis you will measure. Each will give you a bullish or bearish score you can mark in your table. 

Daily charts are considered as the best to start from to gauge trends. Start the scoring from this point. Applying this on a currency basket you determine which currency is weak, neutral, or strong against other major 7. Whatever you may think about this currency or political opinion about the country using it, is irrelevant. Know that you can win a trade even when your favorite team, company, or political party is losing. You may love your iPhone but know Apple Inc stocks are not always bullish, the score might be giving you -3 points. Separating your opinion from your trades will only provide you with more pips from your trading. Your Scoring could have more points and more inputs, it is up to the trader how many factors are accounted for. Setting up your rules based on scores is also subjective but know the point is to trade the strongest against the weak and vice versa. Testing your rules and the Scoring and trading system synergy is a must. Confirming your systems work can only be done by putting them in demo practice after backtesting. 

The Scoring system makes finding the best trades easy. Interestingly few traders actually do it. It may be because basket or currency indexes are not a common sight. Making one in the TradingView platform is possible but we have found out the formula is not easily found. Most new traders to this free platform do not even know they can customize the chart presentation with different formulas, let alone create a basket currency formula. Metatrader platform is known as customizable with thousands of free indicators, yet index currency calculation indicators are not numerous. Some forums mention basket trading yet the topics are not extensively developed. So a trader without the tips found in this article may even just rely on this, non-basket trading setup which is generating more false signals. Traders without the Scoring system will more often than not trade currency pairs without strong or longer trends, regretting they had not taken that other cross currency. It may be somewhat hidden knowledge, but traders that try new things, who are curious, not conservative, will find about this sooner or later. This points to another key trait a trader needs to have a relentless hunt to improve the system. 

To wrap up, the Scoring system is there to point you in the right market. Choose your timeframe, align the trend with 2 higher time frames, and look for continuation setups. If you are new you may not know your preferred time frame. This decision will have to be made according to your personality, needs, risk tolerance, and other factors. Try completing the trader personality test to know your pros and cons. Create your inputs for the scoring and sum up what currency is strong, neutral, and weak. Go trade the crosses with the biggest score differential. Now your trading system is put to work, combining the Scoring system result with your set of entry, exit, position management, and ranging filter indicators creates high probability trading setups. All you need to do is follow this checklist. Following simple rules seem to be, interestingly, the hardest thing to do.

Categories
Forex Technical Analysis

Forex Technical Trading – Basic Algorithm Guide

You may feel that you have explored every possible source on indicators, learned about the best ways to combine them, and actually even started trading real money. However, you can always explore some new and innovative approaches to trading that may seem like an entirely new dimension despite having experienced success in the past. Whether they are beginners or whether they have already accumulated some experience, traders may still find some intriguing, refreshing, and stimulating facts and tips that can help them to collect more pips and considerably save time.

Lack of knowledge on some of these areas can even be held responsible for your previous losses or the fact that you might not have progressed as fast as you had hoped. Primarily, what we are going to be focusing on in this article is the proper way to read charts and manage the trades you are already in. As the title suggests, today’s advice will heavily rely on indicators, as the right use, aside from proper selection, directly influences a trader’s success and prosperity levels. 

We will first start with the general algorithm structure, which some traders are already aware of as it contains various measured trading categories. It is just an example you can follow right now for swing trading. Such an algorithm consists of six different indicators: the ATR is taking the first spot and the confirmation indicator holding the third one, while the exit indicator is positioned last. As this is an unfinished list, you should, upon extensive research and testing, make your own selection of indicators that can take the available places and complete the algorithm, as this article will not focus on it. What is more, you can keep searching for better options to adjust your current list, but make sure that you are confident regarding each tool’s purpose.

The ATR indicator is the very foundation of every trade that you will ever enter and since there is an extensive body of research on this particular tool, you should definitely put effort into learning as much as possible. It covers the volatility category and therefore also solidifies our position management. Next, the confirmation indicator’s job is to provide a signal so that you would know whether to go short, go long, or simply stay put and do nothing. The last one, the exit indicator, allows for you to exit trades before it knocks off any of your stops. However, even with this knowledge and after extensive research and use, traders can make fundamental mistakes that can outweigh the potential of the algorithm they have worked towards completing.

The ATR Indicator

The first step is to understand what the correct way of reading the chart is. We will first analyze the ATR indicator and pay special attention to where we want to focus on the chart to obtain the most accurate items of information. The image below is the example of the GBP/CAD daily chart, which can be considered as one of the more volatile currency pairs there are. The previous candle closed approximately an hour ago and this fact is the one piece of information you will always want to record and rely on in your trades. Some professional traders start analyzing the chart a little before the close of the daily candle as they can still discover information that will hardly change at that point, although the approach we are suggesting today is also equally important for everyone looking to enter a trade one hour after. Whether you choose to start assessing your options right before or slightly after the daily candle closes, what you should truly concentrate on is the candle that gives you data that you will be using in your next trade.

GBP/CAD Daily Chart: The Penultimate Candle

As the chart above reflects how one trading day ends and a new one begins, the place where we need to look is the penultimate candle in this chart or the candle which was last complete. Since the last candle that closed is not the last candle in this chart, make sure that you do not get confused as to where your focus of attention should be. We should not be then interested in the tiny candle indicating a day that has not ended yet (compare the last two candles marked by the yellow circle pointer), as it has only been one hour upon closing of the daily candle. The differences between the two will be valuable for your trading analysis and will still be relevant for other indicators as well.

The ATR of the currency pair in question equals 158 pips according to the indicator information provided on the left side of the chart below the white line. Nevertheless, forex experts insist that this is not the most relevant information, as the ATR value can be much higher. The reason for this lies in the data that is factored in the calculation of this value, so we need to pay attention to which 14 periods (ATR default setting) we are actually including in the average. Therefore, we should not make this ATR value on the left our focal point, but the value we get from the last candle that closed, which is the penultimate candle we marked yellow in the previous image. Since the trading day has just begun an hour ago, the last candle will never sufficiently add to the 14-candle average, throwing it off lower than should truly be. To obtain the information we need, we need only move the cursor over to the last closed candle for the white text box to appear, showing in this case the expected higher value of 162 pips. Therefore, this is the number we need to take into consideration to be best prepared to enter a trade.

This approach is how every trader can read the ATR properly regardless of whether they started trading slightly before or after the close of the daily candle. Some professional traders prefer to enter trades approximately 20 minutes before the candle closes due to the fact that they feel certain about having all the information they need at that point. Even if some changes occur, these experts point out that differences in terms of numbers would not be greater than one or two ATR pips maximum. Also, in the hour following the daily close spreads turn out to be changing drastically, so experts choose to start trading prior to these circumstances. This is an excellent perspective because it allows traders not to have to constantly worry about incorrect data or go back to find accurate information. This way you can access all relevant data and see it for what it truly is. 

In case you are ever unable to start trading at the time around the close of the daily candle, you can always rely on the ATR value shown on the left side of the chart. This data is far from incorrect because it is very close to the penultimate candle’s value. Therefore, you should not feel stressed about timing if your job-related duties or place of living, among other factors, do not allow you to be present at the time when you should factor in the data we discussed above.

Other Indicators 

What you should definitely pay attention to is the correct interpretation of other indicators, which involves several steps you need to understand properly. Many professionals lay emphasis on waiting for the candle to close in order to be fully able to read any indicator. If you allow yourself to be drawn up and down across the chart before a candle closes, your data will vary quite significantly. Some indicators may provide too many signals telling you to buy or sell several times in one day while the candle is forming. However, the only data you should be concerned with is the data you can access once this formation process is over, on the candle close. You can still choose to look at the numbers slightly before the close, but strive to be fully focused so as to be looking at the right candle and the right data.

The EUR/USD daily chart added below uses the Stochastics indicator, which is not a general recommendation but only a useful tool for a case study. If you focus on the blue and red lines in the following chart, you will see the yellow circle over the point where the blue line crosses downward the red one. When this phenomenon occurs, Stochastics is giving a trader an official signal to go short. Here, however, you may be surprised if you looked for the proof of the signal upon the close of the candle – the lines are close, but not actually crossing just yet. This is a clear indication that you should not be entering a trade at this point and you need to be very careful with how you interpret the chart. You will also not be including the last unfinished candle because, again, it would affect the 14-period average. The line connecting the candle with the red and blue lines of the Stochastics indicator below cannot be drawn perfectly straight, but it is a crucial point for traders to see how they, in fact, never received a real signal. 

The catch here is always to wait for the candle to close first because you need every piece of information pertaining to the candle and we can only obtain it upon candle close. From the perspective of now, we cannot know exactly what would happen with the price the following day – it might even go up really fast. Nonetheless, without having both conditions met – the signal and the candle close – you need to sit out and wait, refraining from taking any action at that point. In this case, as we noticed how the candle above the two-line cross was not a real signal, we would need to wait out for the next candle to close. Therefore, if you look below at the EUR/USD chart, the penultimate candle really does show the blue line crossing down beyond the read on, which is an official signal to go short. This information is only available upon candle closing or, what some professional traders do, trade 20 minutes prior to the close of the daily candle when you can expect little to no changes, and have a real chance of seeing how the lines would move next. Remember that your indicator is not really telling you the truth until a candle closes or is close to this point.

EUR/USD Daily Chart: Signal or No Signal?

How to Read Your Charts Fast

After accumulating knowledge on how to analyze what your charts and indicators are telling you, the very next step is to learn the ways in which you can quickly zoom through your trades. Professional traders, for example, can be trading as many as 28 currency pairs at the same time, but this does not in any way imply that they take more time to do so. Contrary to what one may expect, experts have actually managed to create a routine of trading approximately 15 minutes a day. Some of them claim to only trade 20 minutes before the close of the daily candle and many also trade across different markets too (e.g. forex and metals).

You may be wondering how a quarter of an hour can suffice with such a staggeringly high number of trades and information to read and process. The experts, in fact, manage their trades in a very similar fashion as everyone else with regard to the action they take – they observe the charts to see if they should make any changes, checking whether any trade should be closed out, half of the position taken off, or a stop loss adjusted, etc. Sometimes, your daily trade need not include any action as none is required, and being at peace with this is also a very important skill.

Professional traders also look for the opportunity to enter new trades every day, which can be done easily right after taking care of the trades they are already in. Here they advise traders to ensure that they are using the best possible confirmation indicator and invest time in looking for one should this step still pose as a challenge. The confirmation indicator is perceived as the backbone for almost every step of trading and is vitally important for increasing your efficiency in managing your trades. 

If your number one confirmation indicator is telling you not to proceed and enter a trade, any other indicators you are using will not be relevant. Since your main confirmation indicator is not giving you a signal to either buy or sell, you should stay put and accept this information. You should not at this point look elsewhere to find additional confirmation for what has already been confirmed, as it will only deplete your energy and waste your time. Any further clarification will only confuse you especially since this happens extremely rarely that your confirmation indicator does not give out any buy/sell signals.

Should your number one confirmation indicator tell you to enter a trade, you can look at the remaining parts of your structure. Here is where you can actually make use of other indicators to find additional proof that you should proceed and start to trade. If every indicator is telling you to go long or short, it is time for you to enter a trade. The process is, therefore, very simple as long as you follow these steps. 

To observe how this approach functions in reality, we will rely on the EUR/USD daily chart below. Here we are using the RSI indicator, which is another tool we do not recommend that you use despite its popularity among forex traders. The relevant information you are looking for when you are using the RSI essentially comes from a price moving into the oversold/overbought territory and returning to the middle area. This is the only signal this indicator will give you so focus on the line coming up/down and then coming back to the middle of the chart. One such example is surely the curve we see below the white pointer. However, should you ever get a signal of a few candles before the end of the chart, you should not pay attention to that. Rather focus your attention on the penultimate candle, which is this chart does not show any signals.

EUR/USD Daily Chart: RSI

You can also experience situations in which you happen to see the line going below the middle, for example, and you can tell that there is a high probability of it crossing back into the middle despite the daily candle being just about an hour old. From this standpoint, we can only predict based on the potential of the line crossing back some time later on that day, but we should never focus our actions based on prediction. If you use the RSI indicator, always wait for the daily candle to close, for it will generate real clues of where the line is going to end up eventually. Always remember that a false signal, despite how strongly we feel about it, is not a signal at all and we should not enter a trade based on impression or emotion but actual, real signal.

The steps provided above comprise the typical daily trading responsibilities of every professional trader. What you should do is simply apply these when going through your charts and there is no need for it to last long. If you start debating whether a signal is truly a signal or not and start giving in to your emotions, your trading experience will neither be fast nor lucrative. Look for the information your main confirmation indicator is offering and decide on your next step according to the signal, or the lack thereof. 

By following this approach, your trading should not last more than 10—15 minutes each day. The part where you assess the trades you are already in should approximately last up to two minutes, while the remainder is generally consumed by entering into new trades. Sometimes you will not initiate any new trades at all and just manage the existing ones. This mentality and these practical steps are absolutely the way to save your time and be more efficient in every respect.

To conclude, you should always make sure that you wait until the candle closes or start interpreting the chart just about 20 minutes before it happens in order for you to be able to get the most accurate information. Should you find time to be a precious commodity as well, always lock on your main indicator on each chart you are looking at. Should the number one confirmation indicator endorse you to move forwards, consult with your other tools. This is the easiest and the fastest approach to entering new trades and handling the existing ones, which will take only up to a quarter an hour of your time each day. 

Finally, do not give in to your impulses and desires, hoping for something to be a signal when it actually is not. Prevent any future failure with your firm reliance on technical support, clear rules, and discipline and stay away from predicting potential. Forex trading can be exceptionally easy if we leave out self-sabotaging tendencies and apply strict strategies that are supported by a fine selection of tools. Therefore, in order for you to use your indicators the best possible way, you really need to put effort into finding the right ones to complete these elements of the example algorithm, as well as use the facts and advice we shared with you today to propel your trading skills and maximize your rewards as a result. Other indicator categories that should be included in your algorithm is Volatility/Volume, on chart Baseline, and additional confirmation indicator belonging to a different theory. These elements and their function will be covered in another article, but the current basic algorithm example should point you in the right direction already.

Categories
Forex Education Forex System Design

How to Optimize a Trading Strategy

Introduction

Once the developer successfully ends both the multi-market and multiperiod test of a trading strategy, he can move to the optimization process. However, there are some risks associated with its execution that the developer should recognize.

In this educational article, we’ll present the different stages of a trading strategy’s optimization process.

Preparing for the Optimization

After passing the multimarket and multiperiod test, the developer has verified that the trading strategy works. Therefore, he could move toward the next stage that corresponds to the trading strategy optimization.

Optimization is used to determine the optimal parameters for the best result of a specific process. In terms of trading strategy, the optimization corresponds to selecting the most robust parameter set of a strategy that would provide the peak performance in real-time markets. 

Nevertheless, selecting the highest performance that provides the most robust set of parameters can result in challenging work. This situation occurs because each set of parameters will correspond to a specific historical data range used in each simulation.

In this regard, the developer’s top parameter selection must be part of a set of evaluation criteria defined before executing the optimization process.

Risks in Optimization

The optimization has pitfalls that the developer must consider at the time of its execution; these traps can lead to increased risks when applying the trading strategy.

The first risk is overconfidence that the results obtained during optimization will produce the same market results in real-time. The developer must understand the strategy and each effect of the results obtained in each part of the optimization stage.

The second risk involves excessive overfitting of the strategy’s parameters. This risk is due to the execution of the optimization without considering the guidelines and appropriate statistical procedures.

Finally, using a wide range of parameters can lead to obtaining extremely positive backtested results. However, such positive returns generated during the optimization stage do not guarantee that they will happen in real-time markets.

Optimizing a Trading Strategy in MT4

In a previous educational article, we presented the development process of a trading strategy based on the crossings of two moving averages, which corresponds to a linear weighted moving average (LWMA) of 5 periods and a simple moving average (SMA) of 55 periods. 

This example considers the execution of an optimization corresponding to both moving averages, and the optimization’s objective will be to find the highest profit.

Before executing the optimization, the developer must select the Strategy Tester located in the toolbar, as illustrated in the next figure.

Once picked the trading strategy to optimize, it must select “Expert Properties,” where the developer will identify and define the parameters to optimize.

The next figure illustrates the “Expert Properties” box. In the first tab, the developer will select the Testing properties, where the “Custom” option will provide a broad range of outputs for each scenario obtained during the simulation stage. 

After the Testing selection criteria, the developer can select the parameters to optimize during the historical simulation. In the example, the parameters to optimize will be the fast (LWMA(5)) and the slow (SMA(55)) moving averages. The developer must consider that as long as it increases the parameters to optimize simultaneously, the simulation will increase its length of time.

Once the “Start” button is pressed, the Strategy Tester in the “Optimization Results” tab will reveal each parameter variation’s output. In the case illustrated in the following figure, the results are listed from the most to less profitable. 

The results also expose the Total Trades, Profit Factor Expected Payoff, Drawdown ($), and Drawdown (%), and the inputs for each historical simulation.

In conclusion, the trading strategy based on the cross between LWMA(6) and SMA(192) in the historical simulation returned $1,818 of profits with a Drawdown equivalent to 5.77% or $688.17. Likewise, these parameters are valid only for a 4-hour chart

Nevertheless, analyzing the criteria described by Robert Pardo, which considers that a trading strategy should provide three times the drawdown, the strategy should generate three times the dropdown, in this case, the parameters applied into the model returned 2.64 times more profits over the drawdown. 

Next Tasks After the First Optimization

Once the first optimization was performed, the developer should analyze the trading strategy behavior with non-correlated assets and its performance in other timeframes. 

If the strategy passes this stage, the developer could make a walk-forward analysis. Among other questions, the strategist should answer whether the strategy will make money in real-time trading.  He also should evaluate the strategy’s robustness, where he would determine if the strategy is sufficiently robust and ready to trade in real-time.

Finally, once these stages are successfully passed, the trading strategy should be tested with paper money before its implementation in the real market.

Conclusions

In this educational article, we presented the steps for executing a simple optimization corresponding to a trading strategy based on the cross between two moving averages.

Before starting to optimize a trading strategy, the developer must weigh both the risks involved by the optimization process and the optimization analysis’s objective as the results that the study will generate.

Finally, although the optimization process reveals that the trading strategy is robust, the developer must continue evaluating if it can generate real-time trading profits.

Suggested Readings

  • Jaekle, U., Tomasini, E.; Trading Systems: A New Approach to System Development and Portfolio Optimisation; Harriman House Ltd.; 1st Edition (2009).
  • Pardo, R.; The Evaluation and Optimization of Trading Strategies; John Wiley & Sons; 2nd Edition (2008).
Categories
Forex Course

166. Introduction To Obscure Currency Crosses & Why It Is Very Risky To Trade Them?

Introduction

Trading currency crosses an excellent way to make money from forex trading when major currency pairs do not make a good move due to the US economy’s corrective momentum. However, the US dollar is a global reserve currency of every country. Therefore, it can provide enough liquidity to make money where the obscure currency crosses have some risks due to insufficient liquidity.

What is Obscure Currency Cross?

We can find currency crosses when we eliminate the US dollar from major and commodity currencies. However, among the cross currencies, the Euro and the Japanese Yen are mostly traded. Therefore, if you trade any Euro and Yen related cross pair, you might see the price to have adequate liquidity. But, what happens if the currency cross does not have Yen or Euro?

Any cross currency pairs that do not have Japanese Yen or Euro as a first or second currency is called an Obscure currency cross. Examples of obscure currency crosses are GBPCHF, NZDCAD, AUDCHF, CADCHF, NZDCHF, NZDCAD, etc.

Why are Trading Obscure Currency Crosses Risky?

The forex market is run through a decentralized network where no one can dominate any market. Therefore, the movement of a currency pair depends on the supply and demand of that currency pair. When the supply or demand increases, the currency pair starts to move. On the other hand, when there is less volume, the currency pair may move within a correction.

The liquidity remains lower in the obscure currency pair than major, commodity, and EUR/YEN related currency pairs. Therefore, there is a risk of market volatility and correction. In some cases, obscure currency pairs consolidate for a long time, and if we take any trade on that pair, we might have to hold the trade for a considerable time.

Conclusion

In conclusion, we can say that trading obscure currency pairs have some reason to worry due to not having enough liquidity to provide a decent movement. However, it is a great way to make money from obscure currency pairs if we can read the price action well and identify the price is moving within a trend. Overall, maintaining a profitable and robust trading strategy is the key to make a consistent profit from the forex market.

[wp_quiz id=”86520″]
Categories
Forex Course

165. Knowing More About Trading The Euro & Yen Crosses

Introduction

In cross-currency trading, the Euro and Japanese Yen are the most traded currency. Therefore, after major currencies, EUR and JPY has the highest liquidity in the forex market. Overall, trading in the Euro and Yen crosses are secure compared to the other cross currencies.

Understand the European Economy

When trying to trade in any Euro cross pairs, we should understand the European economy even if we only follow technical analysis. In technical analysis, traders can make decisions based on previous price movements. Therefore, many traders think that there is no need for fundamental analysis.

However, in trading, we aim to increase the probability of our analysis. Therefore, when we add Europe’s economic condition, we will have a better outlook of trading Euro crosses like- EURCHF, EURAUD, EURNZD, etc.

The European economy consists of several countries, including France, Italy, Germany, etc. Therefore, trading in the Euro cross requires to know interest rate decisions, retail sales, employment export-import, GDP, and other economic releases of these countries.

Moreover, in Euro cross trading, we should focus on other currencies that combine with the Euro. For example, if we want to trade in the EURCHF pair, we should focus on Switzerland’s economic condition.

Understand the Japanese Economy

In Yen cross trading, we should have extensive knowledge of the Japanese economy. Japan is an export-oriented country. Therefore, it tries to depreciate its value against other major currencies by keeping the interest rate lower.

Overall, any increase in interest rate, retail sales, employment, and GDP are suitable for the Japanese economy.

Besides the Japanese economy, we need to understand the economic condition of the Japanese Yen combination. For example, trading in the CADJPY pair requires a fundamental analysis of both the Japanese and Canadian economies.

Conclusion

Overall, the Euro and Japanese Yen cross are mostly traded currency in currency crosses. Therefore, to trade Euro and Yen crosses, we should know these two countries’ economic conditions. Even if we don’t trade based on fundamental analysis, having good knowledge is essential to have an overall outlook of the economy. Cheers.

[wp_quiz id=”86515″]
Categories
Beginners Forex Education Forex Basics

Healthy Trading Habits to Try Today

Forex trading is a great way to put extra money in your pocket or to earn an unconventional income without having to worry about working a 9 to 5 job. However, the results that one gets depends on a variety of factors, including time spent researching, effort, trading strategies and plans, and so on. Revenge trading, overtrading, and other bad habits can wreak havoc on your trading profits and cause some traders to walk away forever after losing their investment. If you’re currently practicing bad habits, or if you haven’t started trading yet, consider trying these healthy trading habits if you want to see your profits improve significantly.

Habit #1: Reviewing Closed Trades

It’s important to take a look at your results after every closed trade, even winning ones. This helps to distinguish what you’re doing right and wrong, or where your trading plan is or isn’t working. Some traders might pay more attention to these details in the beginning but get lazy with reviewing their trades later on. Don’t fall into the bad habit of letting things go out of sheer laziness, or else you might start to miss things that could be changed to improve your results. Our best advice for this healthy habit is to keep a trading journal, which is used to log important details about each trade for review. This is the easiest and most organized way to keep up with your trading activity and to track improvement over a period of time. 

Habit #2: Only Enter Trades for a Reason

Some traders fall into the bad habit of overtrading because they are looking for the emotional rush of entering a trade, even if evidence doesn’t support it. Others might make the mistake of feeling lazy if they don’t trade on a certain day and enter a trade so that they feel as though they are doing something productive. The best traders actually recognize when it isn’t a good time to enter the market and know when to do nothing. If you want to practice this healthy habit, you need to start by outlining the reasons why you will enter trades in the first place. You might base this on economic data, fundamental analysis, technical analysis, or other pieces of factual information. If you don’t see the signs you’re looking for, simply don’t enter the trade. Remember that it’s better to do nothing than it is to enter a losing trade for the sake of doing something.    

Habit #3: Don’t Let Your Emotions Get the Best of You 

Trading when you’re emotional is a very bad habit that can cause you to make clouded decisions that will likely lead you to lose money. It’s true that many professional traders can control their emotions and don’t get bent out of shape over losses, however, it takes time to become disciplined enough to keep those emotions at bay. If you feel yourself getting anxious, fearful, or overly excited, you should take a deep breath and step away from the computer for a moment until you feel more level-headed.

If you find that a certain emotion is affecting you often, consider doing research online for tips that can help you deal with that exact problem. This is another habit that revolves around the need to recognize when it’s best not to trade. Like with our 2nd healthy habit, you can also double-check that the trade you want to make meets the criteria you’re looking for if you’re feeling out of your element.

Categories
Forex Basics

The Most Common Reasons Why Forex Traders Lose Trades

As traders, we are driven to do our best and to walk away with a profit, otherwise, what’s the point? While the market presents vast opportunities for profit and growth, it is also unpredictable and isn’t shy about throwing us a curveball when we’re least expecting it. Of course, there are some ways that you can limit the losses you take, starting with understanding the most common reasons why forex traders lose trades in the first place. 

Reason #1: They Don’t Know Enough

One of the greatest things about trading is that just about anyone can do it with a few dollars and an internet connection. The downside is that many newbies jump in too quickly and open a trading account before they really know what they’re doing. If you don’t understand key indicators, know the best times to trade, or understand how the market works, how do you expect to make money? These traders are also more likely to experience frustration when trying to figure out how to work their trading platform. All of this leads to lost trades but this problem can be avoided if beginners would spend more time learning. If you’re experiencing this problem, you should take a break from trading and spend some more time becoming acquainted with everything you need to know. Then, you’ll be ready to come back and actually start making real money. 

Reason #2: They Don’t Have a Plan

Traders need a detailed plan to follow. This plan needs to think about what they will trade when they will trade, how they will trade, and so on. Failure is often contributed to trading without a strategy or deviating from your plan once it’s in place. Those that don’t skip this step really know what they’re doing and they can avoid problems such as being unsure of whether to enter a trade because their plan tells them what to look for. A plan also gives you a place to start when it comes to improvement because you can go back to analyze your results, figure out strengths and weaknesses, and make changes when needed.

Reason #3: They Risk too Much

Some traders are tempted to take big risks in order to win big, but this isn’t gambling. We have to remember that part of the success of being a forex trader involves limiting your losses in addition to having winning trades. In some cases, you might even have a higher number of losing trades but come away with a profit because those losses were controlled. Many professionals recommend keeping your risk tolerance to 1-2% of your account balance per trade, but this really does come down to personal preference. Still, you should not be risking big chunks of your account balance on each trade, as this is a surefire way to lose your investment. 

Reason #4: They Don’t Understand Trading Psychology

Traders that don’t understand the ways that emotions can affect trades might not pick up on big mistakes they’re making. For example, if you’re feeling greedy, you might be prone to overtrading. Those that are anxious or fearful avoid entering winning trades or pull out too early out of the fear of losing money, some traders take up revenge trading when they are angry that they’ve lost money, and so on. Trading psychology is a broad field that covers several different topics, so all traders should be sure to invest some time into learning about it. This way you’ll be more likely to spot emotional mistakes and you’ll know where to look for tips to overcome them. 

Reason #5: They Trade on Bad Days

Some traders keep losing because they just don’t know when to quit. If you’ve had a horrible day with a string of losses, for example, perhaps you should take a break and clear your head so that you can come back to trading with a fresh start. This would also be a great time to review your recent losses in your trading journal to figure out what the issue is. A bad day could also be at fault of the market, where there just aren’t any good moves to enter. Instead of forcing trades that could end badly, this is another time when traders should just sit out and wait for better opportunities.

Categories
Forex Basics

Real-Life Lessons We Learned as First-Time Traders

Making the decision to become a forex trader is an empowering one, and while some of us are apprehensive about opening a trading account, others find it exhilarating. After all, if you’ve spent quite a lot of time researching and you feel that you’re totally prepared, then you’re ready to make money. This was how I felt when I opened my first trading account – I had an image in my mind of how it was going to be and how much money I was going to make. The good news is that I did make money, but I learned some lessons in the process. 

Lesson #1: Don’t Be too Sure of Yourself

Self-bias is a common problem that affects many traders. We tend to look for information that supports our hypothesis to enter a trade, while ignoring evidence that suggests we shouldn’t. We also might trick ourselves into thinking that a trade is guaranteed to be a winner because we feel overly confident. I made this mistake once and lost way too much money on a trade because it seemed like I just couldn’t lose thanks to the information I was receiving from my indicators. If I had remembered that the market is unpredictable and tightened my stop loss, I could have cut back on those losses. 

Lesson #2: Don’t Trade Just Because You Feel Like it

I woke up one morning, had a cup of coffee, and felt like being productive. However, the market just wasn’t showing me any good moves and there wasn’t any evidence that I should enter a trade. After sitting around for a while, I just couldn’t stand it anymore – so I entered a trade to feel like I was doing something. The trade lost money and I learned a valuable lesson in that sometimes it is better to do nothing. If you want to avoid this problem, always ensure that there is supporting evidence to enter a trade based on your trading plan, and don’t trade just to feel the rush. 

Lesson #3: Be Careful How Much You Risk

In the beginning, it can be tempting to risk too much money partly because you don’t realize that it’s too much. In reality, you shouldn’t be risking more than 1-2% of your total account balance on each trade, especially in the very beginning when you’re more likely to make mistakes. While I only risked slightly more than I should have, I did learn to tone it done after taking a couple of hits. Remember, being a successful forex trader is as much about managing your risk as it is about winning trades. 

Lesson #4: Don’t Open Too Many Trades

On another productive morning, I decided to enter multiple trades at once to increase my chances of making a profit. Unfortunately, I got stressed out rather quickly and had trouble watching over each open position. Some of us may be better at multitasking than others, but you shouldn’t push it in the beginning. It’s better to stick with a couple of positions at a time until you get the hang of it, or for good if you’re easily stressed.

Categories
Forex Basics

Forex Trading: Is there a Holy Grail?

When you decide to become a trader, you might start looking for a magic answer that is “guaranteed” to be profitable. This is only natural, as humans are accustomed to looking for cheat codes. If there’s an easier way to do something, we’re all for it, especially where money is involved. This is why beginners are often drawn in by brokers that promise you’ll make a profit or by similar claims that come in the form of forex strategies or robots that will magically trade for you without ever losing money. At least, these products are advertised in this way, but it’s important to know that these are false advertisements. 

If you’ve been trading for some time, you may have already gotten burned by a shady broker or invested a few hundred dollars into a forex robot that lost money. Or maybe you took advice from someone online that claimed to have figured it all out. We’re not saying that everything you read online is a lie, but it is impossible for anyone to promise that you won’t lose money trading. Allow us to explain why.

First, nobody can accurately prepare for all of the uncertainties that come with the trading market, even if they are developers or very experienced traders. In order to know these things, that person would need to be able to predict what financial institutions will say in the future, predict national disasters, and prepare for other unexpected circumstances ahead of time. Obviously, this isn’t possible.

Another cause of market unpredictability is the fact that it is moved by humans. One person might interpret an economic release in a different way than another while some might hold onto a position longer than others. You can’t always predict what other humans are going to do because different traders think differently. It’s also hard for software like trading robots to predict because they don’t think like humans, who are susceptible to emotions and other uncalculated factors.

Many trading systems that you read about online do work well under certain market conditions, but they don’t perform well under others. Things might go in your favor for a while, then you’ll start losing money when the price shifts into another pattern. This doesn’t mean that these tools and systems aren’t useful, only that they can’t be 100% right all of the time. You can also add to your problems by making mistakes like using too many indicators, which can cause delayed trading decisions or make you feel overwhelmed. 

At the end of the day, every trader needs to know that there is no holy grail in forex trading. Some strategies, robots, and systems work much better than others, that much is true. You can also find some golden advice online, while others may not give you the best suggestions. The key is to figure out what works best for you, develop a solid trading plan, and to manage your risk. Also, always remain cautious when someone promises or guarantees that they can make you rich when it comes to trading.