You may feel that you have explored every possible source on indicators, learned about the best ways to combine them, and actually even started trading real money. However, you can always explore some new and innovative approaches to trading that may seem like an entirely new dimension despite having experienced success in the past. Whether they are beginners or whether they have already accumulated some experience, traders may still find some intriguing, refreshing, and stimulating facts and tips that can help them to collect more pips and considerably save time.

Lack of knowledge on some of these areas can even be held responsible for your previous losses or the fact that you might not have progressed as fast as you had hoped. Primarily, what we are going to be focusing on in this article is the proper way to read charts and manage the trades you are already in. As the title suggests, today’s advice will heavily rely on indicators, as the right use, aside from proper selection, directly influences a trader’s success and prosperity levels.
We will first start with the general algorithm structure, which some traders are already aware of as it contains various measured trading categories. It is just an example you can follow right now for swing trading. Such an algorithm consists of six different indicators: the ATR is taking the first spot and the confirmation indicator holding the third one, while the exit indicator is positioned last. As this is an unfinished list, you should, upon extensive research and testing, make your own selection of indicators that can take the available places and complete the algorithm, as this article will not focus on it. What is more, you can keep searching for better options to adjust your current list, but make sure that you are confident regarding each tool’s purpose.
The ATR indicator is the very foundation of every trade that you will ever enter and since there is an extensive body of research on this particular tool, you should definitely put effort into learning as much as possible. It covers the volatility category and therefore also solidifies our position management. Next, the confirmation indicator’s job is to provide a signal so that you would know whether to go short, go long, or simply stay put and do nothing. The last one, the exit indicator, allows for you to exit trades before it knocks off any of your stops. However, even with this knowledge and after extensive research and use, traders can make fundamental mistakes that can outweigh the potential of the algorithm they have worked towards completing.
The ATR Indicator
The first step is to understand what the correct way of reading the chart is. We will first analyze the ATR indicator and pay special attention to where we want to focus on the chart to obtain the most accurate items of information. The image below is the example of the GBP/CAD daily chart, which can be considered as one of the more volatile currency pairs there are. The previous candle closed approximately an hour ago and this fact is the one piece of information you will always want to record and rely on in your trades. Some professional traders start analyzing the chart a little before the close of the daily candle as they can still discover information that will hardly change at that point, although the approach we are suggesting today is also equally important for everyone looking to enter a trade one hour after. Whether you choose to start assessing your options right before or slightly after the daily candle closes, what you should truly concentrate on is the candle that gives you data that you will be using in your next trade.
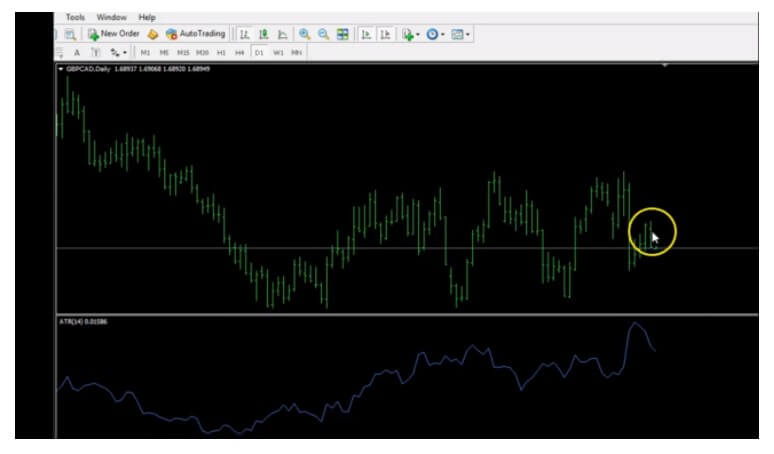
As the chart above reflects how one trading day ends and a new one begins, the place where we need to look is the penultimate candle in this chart or the candle which was last complete. Since the last candle that closed is not the last candle in this chart, make sure that you do not get confused as to where your focus of attention should be. We should not be then interested in the tiny candle indicating a day that has not ended yet (compare the last two candles marked by the yellow circle pointer), as it has only been one hour upon closing of the daily candle. The differences between the two will be valuable for your trading analysis and will still be relevant for other indicators as well.
The ATR of the currency pair in question equals 158 pips according to the indicator information provided on the left side of the chart below the white line. Nevertheless, forex experts insist that this is not the most relevant information, as the ATR value can be much higher. The reason for this lies in the data that is factored in the calculation of this value, so we need to pay attention to which 14 periods (ATR default setting) we are actually including in the average. Therefore, we should not make this ATR value on the left our focal point, but the value we get from the last candle that closed, which is the penultimate candle we marked yellow in the previous image. Since the trading day has just begun an hour ago, the last candle will never sufficiently add to the 14-candle average, throwing it off lower than should truly be. To obtain the information we need, we need only move the cursor over to the last closed candle for the white text box to appear, showing in this case the expected higher value of 162 pips. Therefore, this is the number we need to take into consideration to be best prepared to enter a trade.
This approach is how every trader can read the ATR properly regardless of whether they started trading slightly before or after the close of the daily candle. Some professional traders prefer to enter trades approximately 20 minutes before the candle closes due to the fact that they feel certain about having all the information they need at that point. Even if some changes occur, these experts point out that differences in terms of numbers would not be greater than one or two ATR pips maximum. Also, in the hour following the daily close spreads turn out to be changing drastically, so experts choose to start trading prior to these circumstances. This is an excellent perspective because it allows traders not to have to constantly worry about incorrect data or go back to find accurate information. This way you can access all relevant data and see it for what it truly is.
In case you are ever unable to start trading at the time around the close of the daily candle, you can always rely on the ATR value shown on the left side of the chart. This data is far from incorrect because it is very close to the penultimate candle’s value. Therefore, you should not feel stressed about timing if your job-related duties or place of living, among other factors, do not allow you to be present at the time when you should factor in the data we discussed above.
Other Indicators
What you should definitely pay attention to is the correct interpretation of other indicators, which involves several steps you need to understand properly. Many professionals lay emphasis on waiting for the candle to close in order to be fully able to read any indicator. If you allow yourself to be drawn up and down across the chart before a candle closes, your data will vary quite significantly. Some indicators may provide too many signals telling you to buy or sell several times in one day while the candle is forming. However, the only data you should be concerned with is the data you can access once this formation process is over, on the candle close. You can still choose to look at the numbers slightly before the close, but strive to be fully focused so as to be looking at the right candle and the right data.
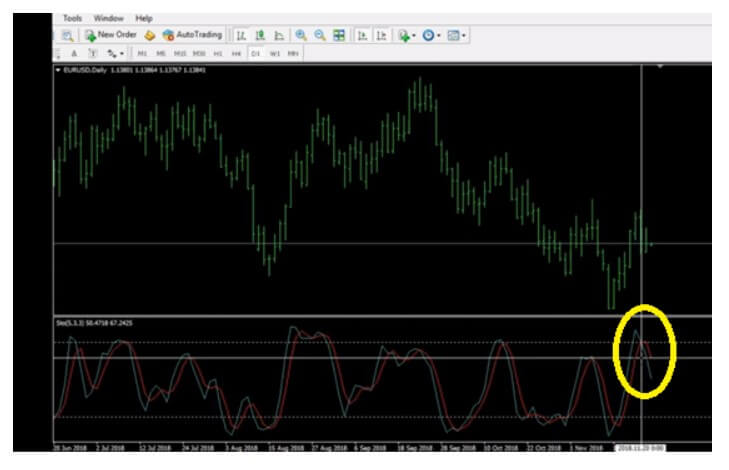
The EUR/USD daily chart added below uses the Stochastics indicator, which is not a general recommendation but only a useful tool for a case study. If you focus on the blue and red lines in the following chart, you will see the yellow circle over the point where the blue line crosses downward the red one. When this phenomenon occurs, Stochastics is giving a trader an official signal to go short. Here, however, you may be surprised if you looked for the proof of the signal upon the close of the candle – the lines are close, but not actually crossing just yet. This is a clear indication that you should not be entering a trade at this point and you need to be very careful with how you interpret the chart. You will also not be including the last unfinished candle because, again, it would affect the 14-period average. The line connecting the candle with the red and blue lines of the Stochastics indicator below cannot be drawn perfectly straight, but it is a crucial point for traders to see how they, in fact, never received a real signal.
The catch here is always to wait for the candle to close first because you need every piece of information pertaining to the candle and we can only obtain it upon candle close. From the perspective of now, we cannot know exactly what would happen with the price the following day – it might even go up really fast. Nonetheless, without having both conditions met – the signal and the candle close – you need to sit out and wait, refraining from taking any action at that point. In this case, as we noticed how the candle above the two-line cross was not a real signal, we would need to wait out for the next candle to close. Therefore, if you look below at the EUR/USD chart, the penultimate candle really does show the blue line crossing down beyond the read on, which is an official signal to go short. This information is only available upon candle closing or, what some professional traders do, trade 20 minutes prior to the close of the daily candle when you can expect little to no changes, and have a real chance of seeing how the lines would move next. Remember that your indicator is not really telling you the truth until a candle closes or is close to this point.
How to Read Your Charts Fast
After accumulating knowledge on how to analyze what your charts and indicators are telling you, the very next step is to learn the ways in which you can quickly zoom through your trades. Professional traders, for example, can be trading as many as 28 currency pairs at the same time, but this does not in any way imply that they take more time to do so. Contrary to what one may expect, experts have actually managed to create a routine of trading approximately 15 minutes a day. Some of them claim to only trade 20 minutes before the close of the daily candle and many also trade across different markets too (e.g. forex and metals).
You may be wondering how a quarter of an hour can suffice with such a staggeringly high number of trades and information to read and process. The experts, in fact, manage their trades in a very similar fashion as everyone else with regard to the action they take – they observe the charts to see if they should make any changes, checking whether any trade should be closed out, half of the position taken off, or a stop loss adjusted, etc. Sometimes, your daily trade need not include any action as none is required, and being at peace with this is also a very important skill.
Professional traders also look for the opportunity to enter new trades every day, which can be done easily right after taking care of the trades they are already in. Here they advise traders to ensure that they are using the best possible confirmation indicator and invest time in looking for one should this step still pose as a challenge. The confirmation indicator is perceived as the backbone for almost every step of trading and is vitally important for increasing your efficiency in managing your trades.
If your number one confirmation indicator is telling you not to proceed and enter a trade, any other indicators you are using will not be relevant. Since your main confirmation indicator is not giving you a signal to either buy or sell, you should stay put and accept this information. You should not at this point look elsewhere to find additional confirmation for what has already been confirmed, as it will only deplete your energy and waste your time. Any further clarification will only confuse you especially since this happens extremely rarely that your confirmation indicator does not give out any buy/sell signals.
Should your number one confirmation indicator tell you to enter a trade, you can look at the remaining parts of your structure. Here is where you can actually make use of other indicators to find additional proof that you should proceed and start to trade. If every indicator is telling you to go long or short, it is time for you to enter a trade. The process is, therefore, very simple as long as you follow these steps.
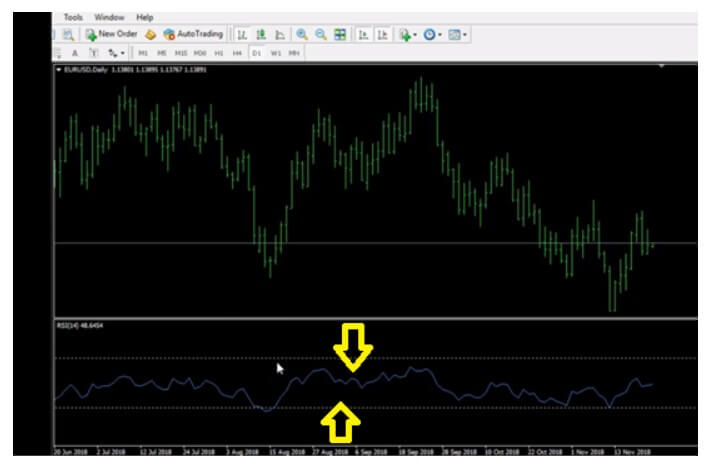
To observe how this approach functions in reality, we will rely on the EUR/USD daily chart below. Here we are using the RSI indicator, which is another tool we do not recommend that you use despite its popularity among forex traders. The relevant information you are looking for when you are using the RSI essentially comes from a price moving into the oversold/overbought territory and returning to the middle area. This is the only signal this indicator will give you so focus on the line coming up/down and then coming back to the middle of the chart. One such example is surely the curve we see below the white pointer. However, should you ever get a signal of a few candles before the end of the chart, you should not pay attention to that. Rather focus your attention on the penultimate candle, which is this chart does not show any signals.
You can also experience situations in which you happen to see the line going below the middle, for example, and you can tell that there is a high probability of it crossing back into the middle despite the daily candle being just about an hour old. From this standpoint, we can only predict based on the potential of the line crossing back some time later on that day, but we should never focus our actions based on prediction. If you use the RSI indicator, always wait for the daily candle to close, for it will generate real clues of where the line is going to end up eventually. Always remember that a false signal, despite how strongly we feel about it, is not a signal at all and we should not enter a trade based on impression or emotion but actual, real signal.
The steps provided above comprise the typical daily trading responsibilities of every professional trader. What you should do is simply apply these when going through your charts and there is no need for it to last long. If you start debating whether a signal is truly a signal or not and start giving in to your emotions, your trading experience will neither be fast nor lucrative. Look for the information your main confirmation indicator is offering and decide on your next step according to the signal, or the lack thereof.
By following this approach, your trading should not last more than 10—15 minutes each day. The part where you assess the trades you are already in should approximately last up to two minutes, while the remainder is generally consumed by entering into new trades. Sometimes you will not initiate any new trades at all and just manage the existing ones. This mentality and these practical steps are absolutely the way to save your time and be more efficient in every respect.
To conclude, you should always make sure that you wait until the candle closes or start interpreting the chart just about 20 minutes before it happens in order for you to be able to get the most accurate information. Should you find time to be a precious commodity as well, always lock on your main indicator on each chart you are looking at. Should the number one confirmation indicator endorse you to move forwards, consult with your other tools. This is the easiest and the fastest approach to entering new trades and handling the existing ones, which will take only up to a quarter an hour of your time each day.
Finally, do not give in to your impulses and desires, hoping for something to be a signal when it actually is not. Prevent any future failure with your firm reliance on technical support, clear rules, and discipline and stay away from predicting potential. Forex trading can be exceptionally easy if we leave out self-sabotaging tendencies and apply strict strategies that are supported by a fine selection of tools. Therefore, in order for you to use your indicators the best possible way, you really need to put effort into finding the right ones to complete these elements of the example algorithm, as well as use the facts and advice we shared with you today to propel your trading skills and maximize your rewards as a result. Other indicator categories that should be included in your algorithm is Volatility/Volume, on chart Baseline, and additional confirmation indicator belonging to a different theory. These elements and their function will be covered in another article, but the current basic algorithm example should point you in the right direction already.