Categories
Forex Fundamental Analysis

What Should you Know About Commitments of Traders (COT) Report?

Introduction

One of the most significant uncertainties for policymakers is the future economic performance. All the policies adopted by governments and central banks are geared towards influencing the future’s economic performance. Economists, financial analysts, and forex traders alike use models and economic indicators to predict future economic performance. The commitment of traders (COT) report gives some insight into future economic performance.

Understanding the Commitments of Traders Report

In the US, the COT report is published by the Commodities Futures Trading Commission (CFTC). The COT report shows participation in the future market.

The COT report is comprised of four different types of reports. They are:

Legacy reports: This report breaks down the open interest positions of commercial, noncommercial, and retail traders into long, short, and spread positions. The report shows the total interest positions that are open along with the changes from the previous reporting period. This report is broken down into the long and short versions of ‘Futures Only’ and ‘Futures-and-Options-Combined’ segments. The Legacy COT report shows the open interests for 17 exchanges.

Supplemental reports: This report document contracts 13 agricultural commodities. These contracts are of both futures and options positions for noncommercial, commercial, and index traders together with nonreportable positions.

Disaggregated reports: This report covers the following five sectors; agriculture, petroleum, and its products, natural gas and its products, electricity, and metal. This report’s market participants are categorized into; producers, swap dealers, managed money, and ‘Others.’

Producers are entities whose core business activities involve the production, processing, and handling of physical commodities. These producers use the futures market to manage or hedge against risks potential to their core operations.

Swap dealer is one who enters into an agreement to exchange cash flows of a given commodity over a specific period. They use the futures market to manage and hedge against risks inherent in their swaps.

Money manager, as used in this report, means a registered commodity pool operator, an unregistered fund, or a registered commodity trading advisor identified by CFTC. They participate in the futures markets on behalf of their clients.

Others represent all other participants in the futures markets who cannot be placed in the above categories.

Traders in Financial Futures (TFF) report: This report shows the participants in the futures market for currencies, stocks, US Treasury securities, VIX, and Bloomberg commodity index. It categorizes market participants into; dealers, asset managers, leveraged funds, and others.

Dealer/ Intermediary is a participant on the ‘sell-side’ of a trade. Although they do not exclusively participate in the futures market, they have matched books meant to offset their risks. They are made up of large banks.

An asset manager is an institutional investor such as pension funds and insurance companies whose clients are predominantly institutional.

Leveraged funds hedge funds, registered commodity pool operator, an unregistered fund, or registered commodity trading advisors. Their activities in the futures market involve arbitrage across and within markets and taking outright positions.

Others include all reportable traders who cannot be placed in the above categories.

Using the Commitments of Traders (COT) Report in analysis

The COT report can be used to show whether investors are going long or short in the futures market. The CFTC collects the data used in making the COT report from reporting firms such as Futures Commission Merchants, foreign brokers, exchanges, and clearing members. Individual traders can also self-report by filling out the CFTC Form 40.

The COT report shows the open interests in the futures and options market as of Tuesday of each week. Since the COT report also shows the changes in the open positions, it can be used to show the sentiment about the economy over time. It is worth noting that the market positioning of the commercial traders and the noncommercial (speculative) traders is always the opposite of each other.

Commercial traders handle physical commodities. For them, it is natural to expect that the future price of their commodities will rise. In the futures and options market, commercial traders are hedging against risk; thus, they go short just in case prices fall. The noncommercial traders do not handle the underlying physical commodities, and thus, they are participating in the futures market speculatively and can either be long or short. Therefore, by looking at the behavior of noncommercial traders in the futures markets, we can gain insight into future price trends and the economy.

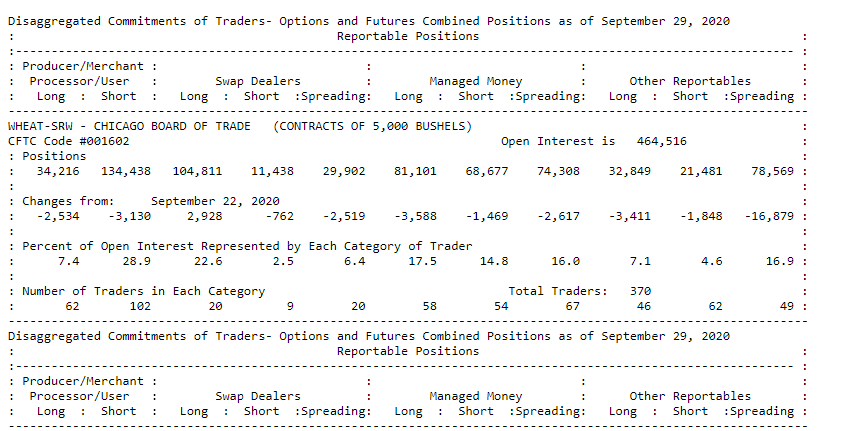
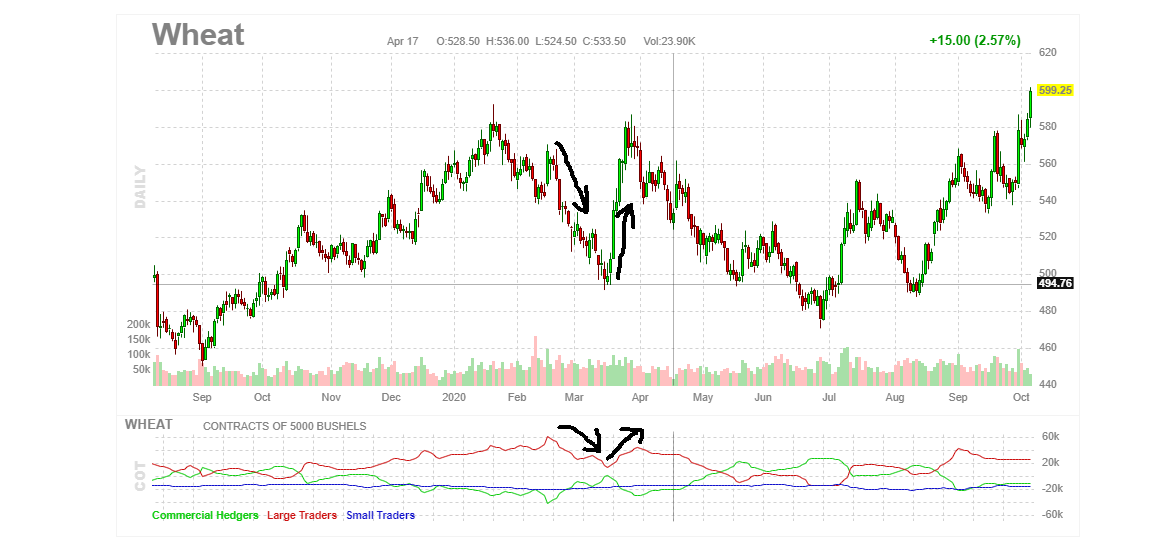
Take the above example of wheat futures, when the noncommercial traders are net short positioned in the futures market, the prices of wheat falls. Consequently, the wheat farmers and traders receive lesser pay for their products. In this case, their purchasing power is lowered, which decreases the aggregate demand in the general economy.

Impact on Currency

Forex traders pay close attention to the noncommercial traders in the financial futures. These speculative buyers tend to lead the market. When they are net long in a particular currency, it means that the demand for that currency will increase and, with it, its value relative to others. For most forex traders, the best way to trade forex using the COT report is by establishing the overbought and the oversold regions. These are the regions where trend reversal is imminent – when the noncommercial traders are at the lowest point could indicate a period of sustained short selling, and a reversal could follow.

The COT report can also be used to show a trend. For example, let’s take an instance where noncommercial traders are continuously net long on a particular currency in the futures market while the price for that currency steadily increases. With this strategy, forex traders can use noncommercial traders’ market positioning as confirmation of a trend.

Sources of Data

The US CFTC publishes the COT report.

How the publication of the COT Report Affects Forex Price Charts

The latest publication of the COT report was on October 2, 2020, at 3.30 PM ET. The release of this publication can be accessed at Investing.com.

The screengrab below is of the weekly CFTC speculative net positions of the AUD from Investing.com. To the right is a legend that indicates the level of impact the fundamental indicator has on the AUD.

As can be seen, moderate volatility is to be expected.

As of Tuesday, September 29, 2020, the AUD’s speculative net positions was 8.9K compared to the previous Tuesday’s of 16.3K. Noncommercial traders are net-long in the AUD futures, which should be positive for the AUD.

Now, let’s see how this release made an impact on the Forex price charts.

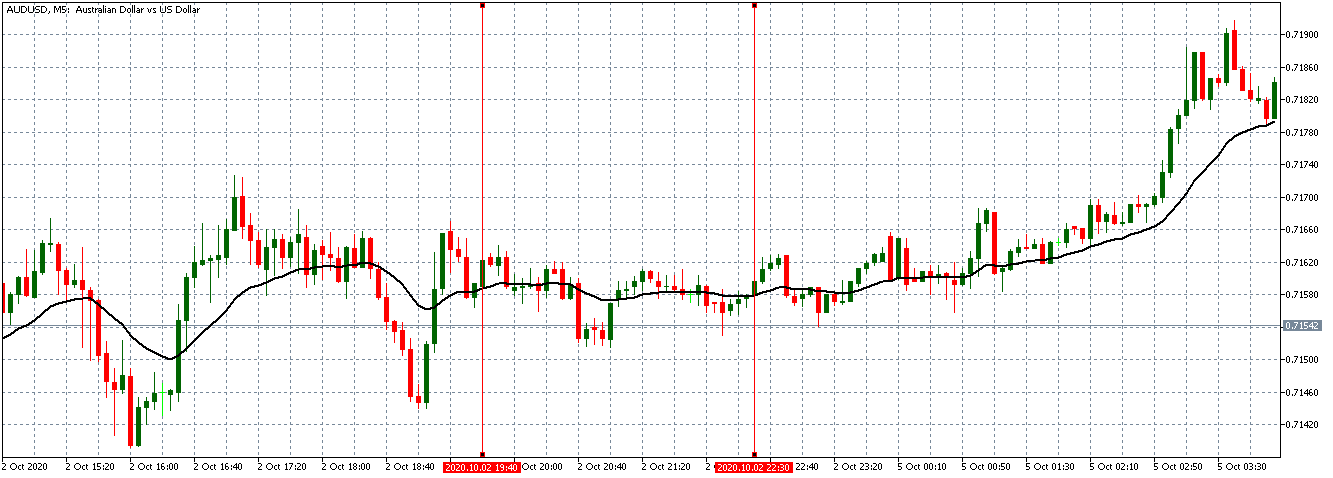
AUD/USD: Before the COT Report Release on October 2, 2020, Just Before 3.30 PM ET

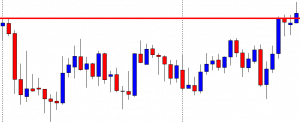
The AUD/USD pair was trading in a neutral position before the release of the COT report. The 20-period MA was flattened with candles forming just around it.

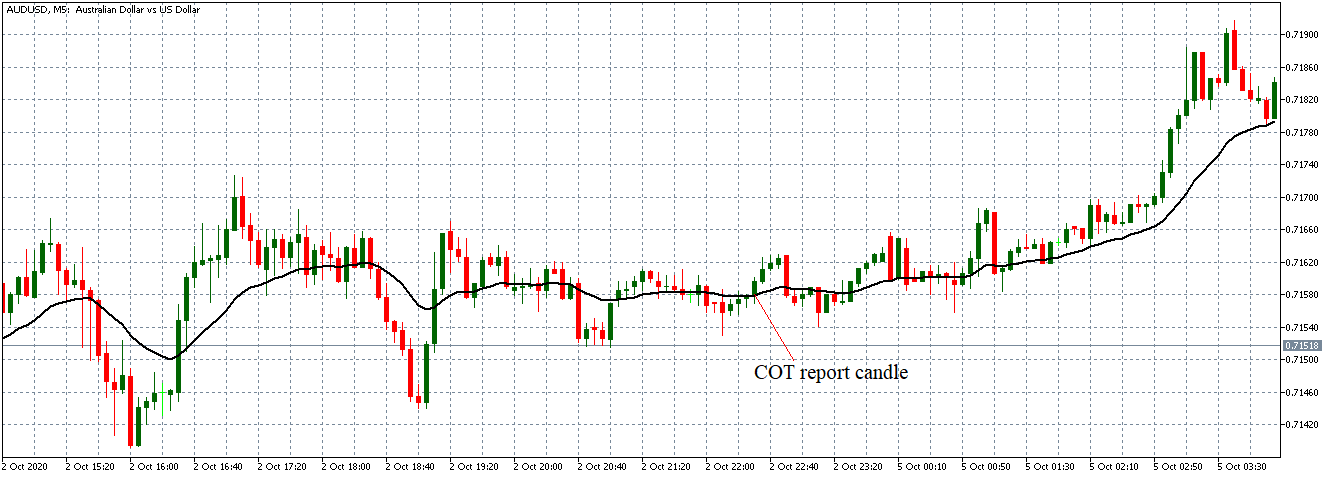
AUD/USD: After the COT Report Release on October 2, 2020, at 3.30 PM ET

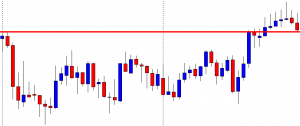
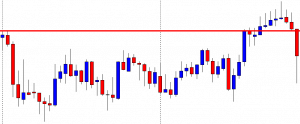
The AUD/USD pair formed a -minute bullish candle after the COT report’s release indicating that the AUD had appreciated relative to the USD. However, the pair could not sustain a bullish trend since it later continued trading in a neutral trend.

The effects of the COT report are long-term. For this reason, the weekly publication of the report has little impact on the short-term forex market.

Categories
Crypto Videos

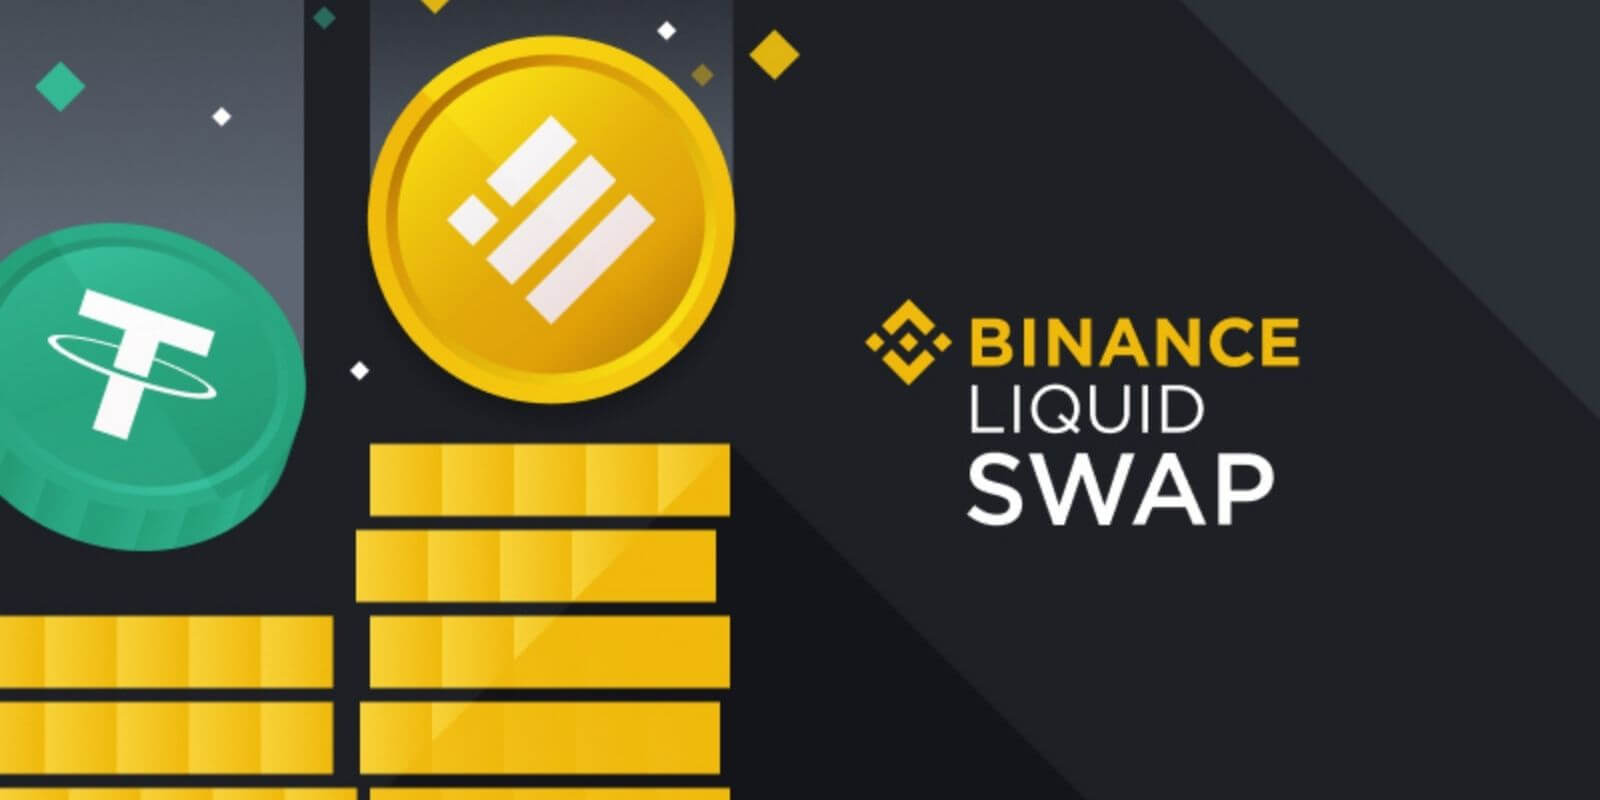
CRYPTO! A Closer Look At Tether’s $1 Billion Bitfinex To Binance Swap!

A closer look at Tether’s $1 billion Bitfinex-to-Binance swap

A Tether swap worth $1 billion and involved Bitfinex, Binance, and Tron blockchain happened on Aug 20.
Tether stablecoin burned some of its supply on one blockchain only to mint it anew on another one. While this may sound easy enough, in reality, this operation involves quite a bit of planning as well as, more importantly, trust.

How was this performed?

During the six-transaction swap that occurred between two blockchains and took 1 hour and 1 minute to bring to completion, the Tether and Bitfinex side was never at risk. This was due to Binance being the initiating party. On the two occasions – right after the first transaction and then after the fourth one, Binance, as the initiator, was down $400 and $600 million, respectively. This type of risky operation either shows great trust among the involved parties, or perhaps the possibility of some additional mechanisms that were involved and that the public was are not aware of.

Another necessary condition for this swap was the fact that Binance had to have a surplus of $1 billion TRON-based USDT, which it was willing to trade for the equivalent amount of Ethereum-based USDT. Even though Binance has met this criterion, it is unclear whether the funds used belonged to the exchange or consisted of user deposits.

Tether, Binance, and controversy

Tether has been at the forefront of controversies in the cryptocurrency space, as the crypto community knows well by now. On top of that, Binance has been accused of making shady deals with many projects. While this particular example is most likely nothing to worry about, the crypto space has to be aware of centralized institutions traversing the crypto sector.

Categories
Crypto Videos

What Is Uniswap? In Depth Analysis part 1!


What Is Uniswap: In-Depth Analysis (part 1/4)

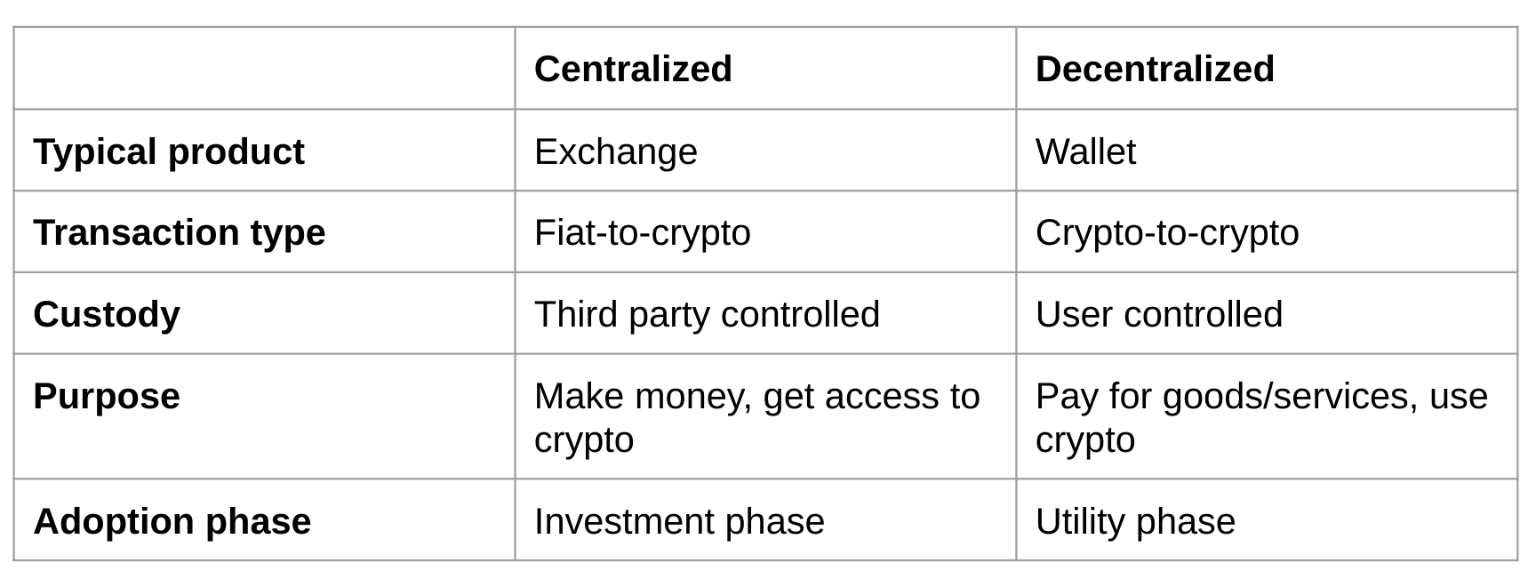
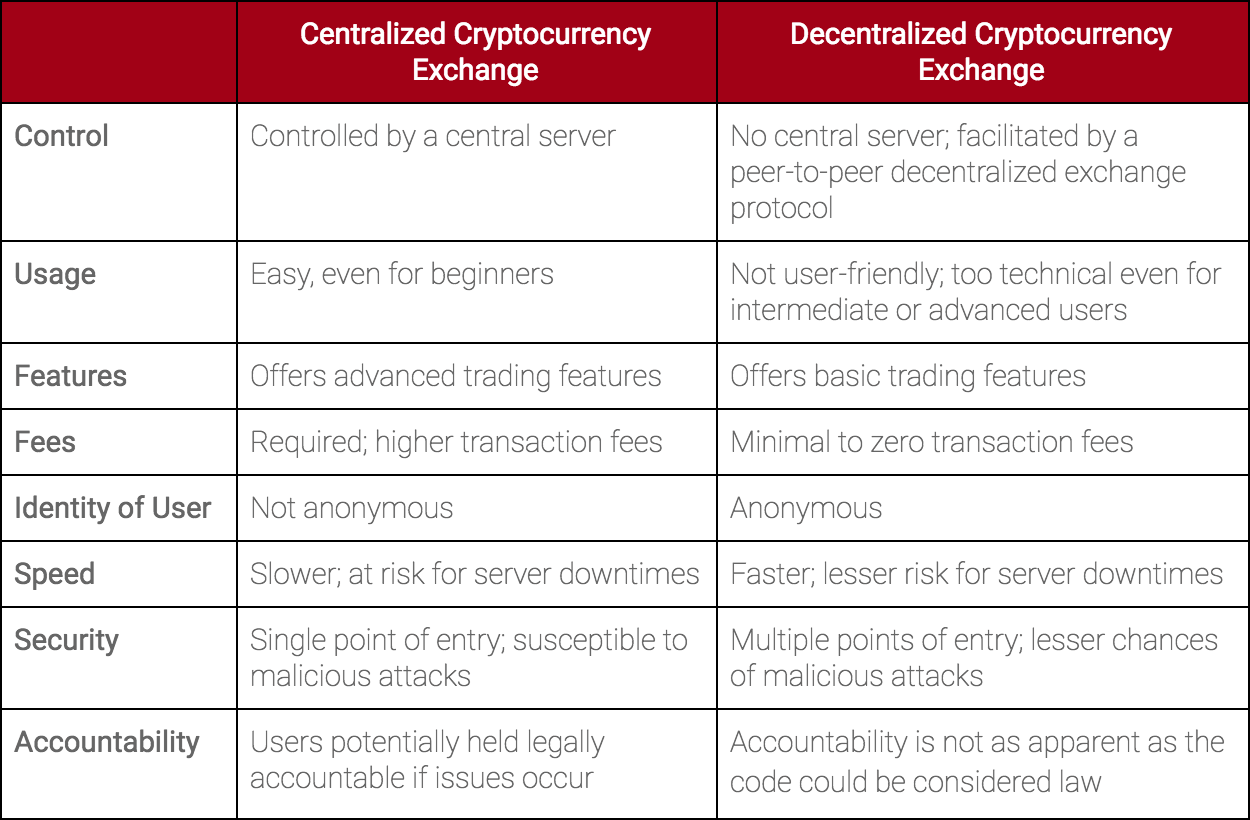
Centralized exchanges have been the foundation of the crypto market for years. They offer extremely fast settlement times, high trading volume, as well as continually improving liquidity. However, it is clear that they defeat cryptocurrencies’ purpose, as they are centralized and hold your keys. Over time, developers have come up with a solution in terms of decentralized exchanges. These exchanges require no custodians or middlemen to facilitate trading.

Due to blockchain technology’s current limitations, building DEXes that can actually compete with their centralized counterparts is extremely difficult. One of the pioneers in the decentralized exchange sector is Uniswap. As a result of the innovation they brought to the sector, Uniswap has become one of the most successful DEX projects.

Uniswap – Explained

Uniswap is a decentralized exchange built on the Ethereum blockchain. To be even more precise, Uniswap is an automated liquidity protocol. What’s important to know is that no order book or centralized party is required to make trades. Uniswap allows its users to trade without intermediaries and provides a high degree of decentralization as well as censorship-resistance. It is also open-source, which is one of the pillars of the decentralized finance space.
Uniswap users can seamlessly swap between many ERC-20 tokens without any need for an order book.
Unlike centralized exchanges, Uniswap protocol doesn’t list certain tokens on the exchange, while denying it for others. Any ERC-20 token can be listed on it as long as there is a liquidity pool available. As a result, Uniswap doesn’t charge listing fees.

So how does it all work?

Uniswap completely leaves behind the traditional architecture of digital exchanges in that it has no order book. Instead, it implemented a Constant Product Market Maker design, an iteration of an Automated Market Maker model.

An automated market maker is a smart contract that holds liquidity reserves that traders can trade against. They are being funded by liquidity providers. Liquidity providers are users who deposit an equivalent value of two tokens in the pool. When trading, traders pay a fee to the pool distributed to liquidity providers, all according to their share of the pool.
If you want to learn more about Uniswap and its token, how it all works, and how the platform makes money, check out the next part of our guide.

Categories
Forex Fundamental Analysis

Understanding ‘Employment Trends Index’ and The Impact Of Its News Release On The Forex Market

Introduction

In any economy, the employment rate can be said to be the primary driver of economic growth. Due to its importance, several fundamental indicators track the labor market changes and many more attempting to predict the future of the labour market. Government and central banks’ policymakers may feel comfortable poring through all these economic indicators for the labour market, but for regular forex traders and households, keeping track of all these labour market indicators can be tiresome and even confusing. The Employment Trends Index (ETI), one of the most relevant labour market indicators, is making it easier to understand the labor market trends.

Understanding the Employment Trends Index

The Employment Trends Index is made by aggregating eight labour market economic indicators. The ETI report breaks down which labour market indicators positively impact the ETI and ranks them from the most positive to the least. Through the aggregation of these indicators, the “noise” in the labor market trend is filtered out. It is worth noting that these labour market indicators have shown to be accurate in their areas. These indicators are explained below.

Initial unemployment claims: This labour market indicator is collated and published by the U.S. Department of Labor. The indicator is published the Thursday of every week, and it shows the number of people who filed for the unemployment benefits for the first time. It is thus considered the latest indicator of unemployment.

Job openings: The U.S. Bureau of Labor and Statistics publishes this economic indicator. These job vacancies show the gap in the labour market that needs to be filled. It indicates the unfulfilled demand in the labour market and the desirable skills sought by employers. It further shows the potential of households to be gainfully employed in the short term.

Number of Employees Hired by the Temporary-Help Industry: The U.S. Bureau of Labor Statistics publishes this statistic. It shows the relationship between the labour market and business cycles since most businesses hire more temporary workers during peak periods and expansion phases.
The ratio of Involuntarily Part-time to All Part-time Workers: Published by the U.S. Bureau of Labor Statistics, this indicator shows the number of employees who are forced to work part-time. The indicator can be correlated to sub-optimal economic conditions, which would make filling positions full time uneconomical. An increasing ratio indicates worsening economic conditions.
Industrial Production: This indicator shows the level of output in sectors such as mining, manufacturing, and energy. The U.S. Federal Reserve Board publishes it. An increasing industrial production indicates that the employment levels are increasing while dropping industrial production levels signals higher levels of job loss.

Source: St. Louis FRED

Percentage of Respondents Who Say They Find “Jobs Hard to Get”: This indicator shows the scarcity of employment opportunities in the economy. Higher percentage signals either a stagnating or a shrinking economy. The Conference Board Consumer Confidence Survey publishes it.
Percentage of Firms With Positions Not Able to Fill Right Now: This statistic shows the lack of particular expertise in the labour market. It is published by the National Federation of Independent Business Research Foundation.
Real Manufacturing and Trade Sales: This indicator shows the level of engagement in the labour market, and the U.S. Bureau of Economic Analysis publishes it.

How to use the Employment Trends Index an analysis

The fact that the ETI aggregates most of the crucial labour market indicators makes it an ideal tool for analyzing the economy.

Since the labour market is considered one of the primary drivers of the economy, monitoring its trend can be used to detect the onset of recessions or recoveries. Here’s how. When the ETI is continually dropping, it indicates that the labor market conditions are worsening progressively. This condition is accompanied by a constant drop in the aggregate demand and supply, most consumer discretionary industries will go out of business, and the economy will progressively contract. Conversely, during a period of economic recession, an increase in the ETI signifies that the economy is on a recovery path.

An increase in the ETI does not necessarily mean that each of the underlying eight labour maker indicators improved. A higher ETI could mean that most of these indicators were positive, or they all were. In either of these instances, it means that the overall labour market is improving – it shows that labour conditions are improving. One of the most notable impacts of an improving labour market is the improvement of households’ welfare, which increases the aggregate demand and supply in the economy.

Source: St. Louis FRED

Conversely, a dropping ETI could be caused by a majority of the underlying labour market indicators being negative or all of them being negative. In either of these instances, the labor markets’ conditions are deteriorating, a condition usually punctuated with higher unemployment levels.

Impact on Currency

The ETI could be associated with contractionary and expansionary monetary and fiscal policies. Here are some of the ways that the ETI could impact a country’s currency. A continually increasing ETI means that the labour market has been enjoying a long period of constant growth. Such an instance signifies that the economy has been expanding, the welfare of households improving, and the unemployment levels low.

In any economy, if these conditions are not sustainable, an overheating economy with unsustainable levels of inflation becomes prevalent. In this case, the governments and central banks may be induced to implement contractionary monetary and fiscal policies. Thus, in the forex market, an increasing ETI can be a precursor for higher interest rates, which makes the currency appreciate relative to others.

A constantly dropping ETI is negative for the currency. The dropping ETI means that the overall labour market has been performing poorly. It means that more people are losing their jobs, wages are low, overall aggregate demand is dropping, and the economy is shrinking. With higher unemployment levels, governments and central banks tend to implement expansionary fiscal and monetary policies to stimulate demand and prevent the economy from sinking into a recession. These expansionary policies, such as lowering interest rates, makes the currency drop in value relative to others. In the U.S., the ETI data is published monthly by The Conference Board.

How the Employment Trends Index Report Release Affects Forex Price Charts

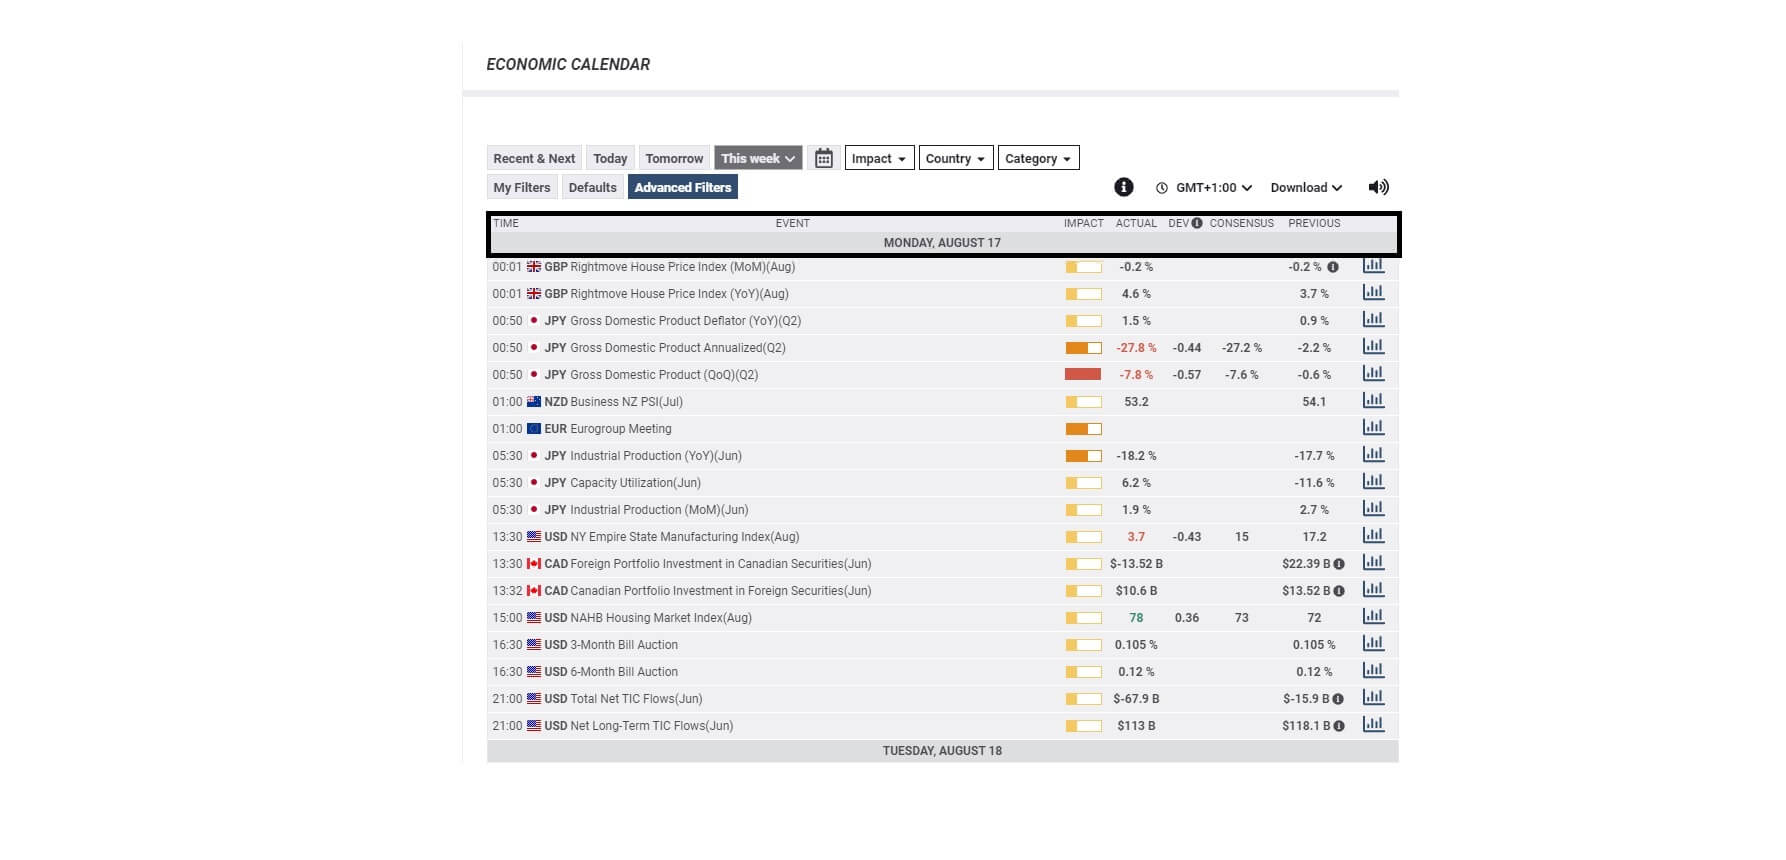
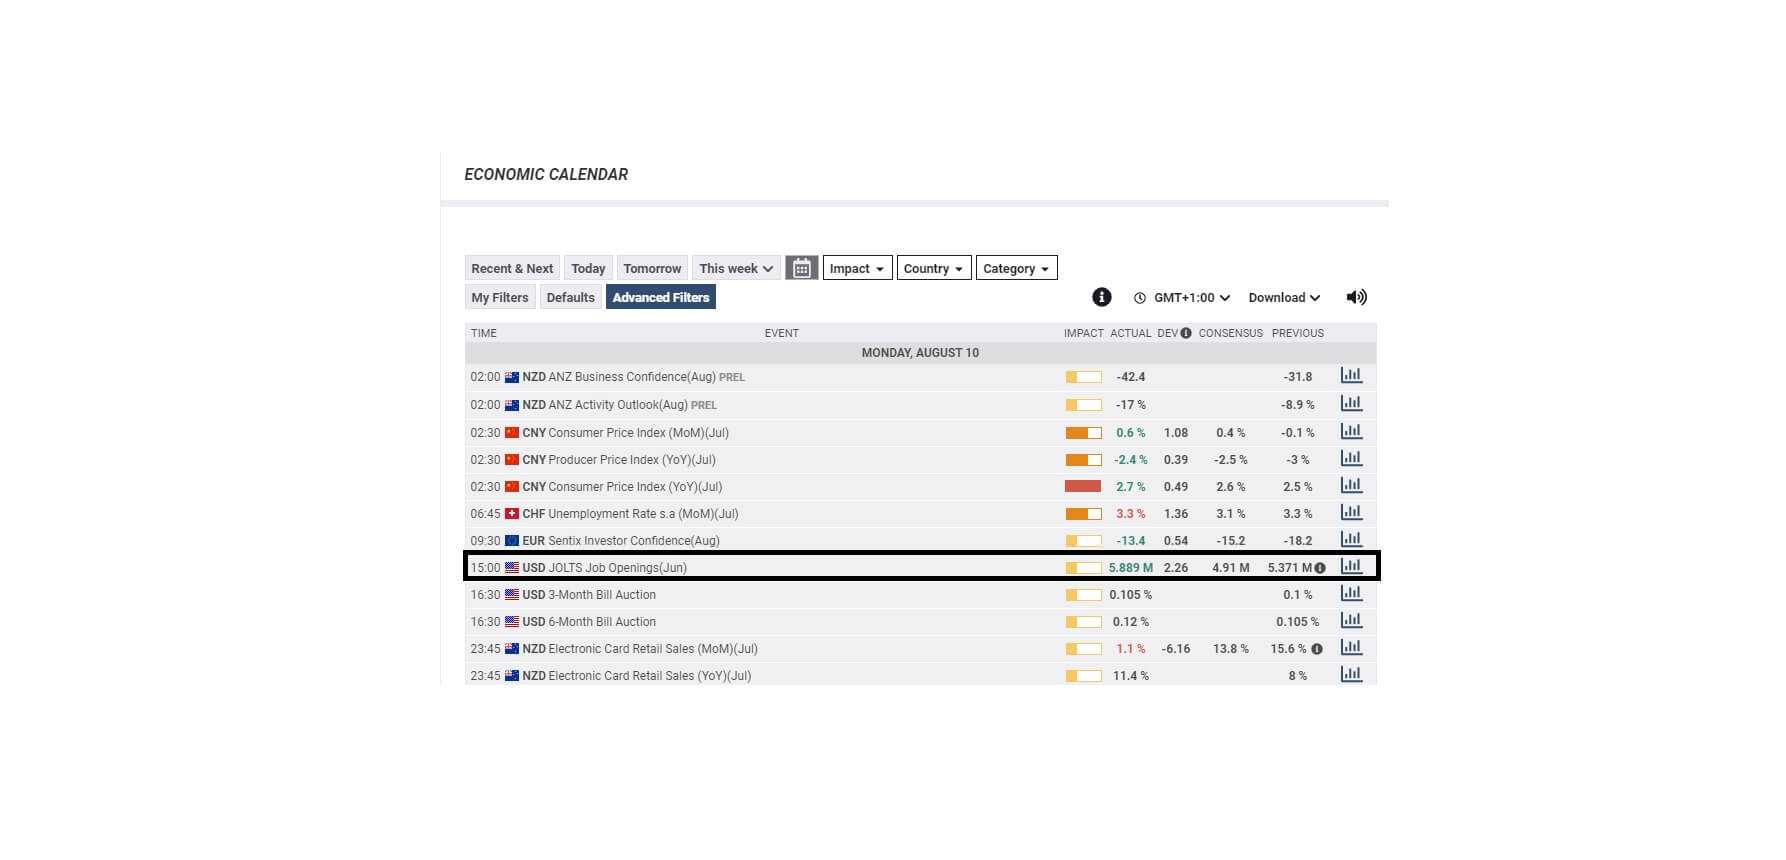
The latest release of the ETI report was on September 8, 2020, at 10.00 AM ET and accessed at Investing.com. The screengrab below is of the monthly ETI from Investing.com. To the right is a legend that indicates the level of impact the fundamental indicator has on the USD.

As can be seen, low volatility is to be expected.

In August 2020, the ETI was 52.55 and increase from 51.37 in July 2020.

Now, let’s see how this release made an impact on the Forex price charts.

EUR/USD: Before the ETI Report Release | September 8, 2020. Before 10.00 AM ET

As seen in the above EUR/USD chart, the pair went from trading in a neutral trend to a steady downtrend. The 20-period M.A. is steeply falling with candles forming further below it.

EUR/USD: After the ETI Report Release on September 8, 2020, at 10.00 AM ET

After the ETI report release, the pair formed a bearish 5-minute “Doji” candle. Subsequently, the pair adopted a weak bullish trend with candles forming just above the 20-period M.A.

Bottom Line

In the forex market, traders rarely pay close attention to the ETI. Most traders prefer gauging the underlying aggregated indicators separately, which explains the lack of impact by releasing the ETI report since the index shows what traders already know. It only serves to show the trend.

Categories
Cryptocurrencies

MyCrypto Wallet Review: Is MyCrypto The Most Secure Eth-Based Wallet?

In early 2018, Tyler Monahan – a co-founder of MyEtherWallet – was not pleased with how the wallet was managed. She reacted by changing MEW’s twitter handle to MyCrypto wallet before apologizing for the act and leaving the company to start MyCrypto wallet. Tyler forked off the open-sourced MEW code and used it to create the MyCrypto Wallet, launched in May 2018.

And since it forked off MEW, MyCrypto not only serves as MEW’s greatest competition but has also integrated most of its features. It is open-sourced, allows for easy interaction with the Ethreum blockchain, integrates hardware wallets, and is a client-side tool.

This review will detail these features and tell you if MyCrypto is indeed the safest wallet for storing your Ethereum. We also provide you with a step-by-step guide on how to activate and use MyCrypto wallet and compare its effectiveness with that of its fiercest competitor – MyEtherWalet.

MyCrypto key features:

Cross-platform wallet: MyCrypto wallet is available as a web wallet as well as a desktop app. The app is highly versatile and compatible with virtually all the popular computer operating systems, including Windows, Linux, macOS, Linux, and a Stand-Alone app.

Multi-currency: MyCrypto is a multi-currency wallet that supports a wide range of Eth-based cryptocurrencies and tokens. Moreover, there is no limit to the number of wallet addresses you can create on MyCrypto.

Inbuilt exchange: MyCrypto doesn’t have a proprietary crypto exchange infused into the desktop app. The platform has, however, integrated the Shapeshift exchange that allows users to purchase crypto using Fiat as well a Coinbase Buy Widget where wallet users can exchange cryptos and tokens.

Integrates hardware wallet: You can integrate the MyCrypto wallet app with the more secure hardware wallets like Trezor and Ledger and get to enjoy such additional services as additional coins and wallets.

Track portfolio: The desktop wallet app features a tracking tool for your portfolio that you can use to monitor your crypto inflows, outflows, and available balances in real-time. The tool is versatile and can be tweaked to monitor a single cryptocurrency/token or the entire portfolio.

Integrates MyCrypto debit card: MyCrypto wallet developers recently launched the MyCrypto debit card that allows users to spend their crypto balances in stores and download cash from ATM. The card works at both crypto-friendly and regular stores/ATMs as it auto-converts your funds from crypto to fist currency at the best conversion rate.

Security features:

Password: Your MyCrypto wallet is secured with a password (minimum 8 characters) that you set when setting up the wallet and creating a user account.

Wallet backup and recovery: There are three primary ways of backing up a MyCrypto wallet. First, you will be provided with a recovery seed phrase when creating a user account on either the Web or desktop app wallet. Secondly, you can back up your private keys by moving them to the integrated hardware wallet. Thirdly, you can write the sensitive wallet data (wallet address, private keys, and Keystore files) on a piece of paper and save it offline.

Non-custodial: MyCrypto wallet does not store your information on the company servers. Rather, this data is highly encrypted and stored within your device.

Counter-Phishing feature: A common tactic that is increasingly used by crypto hackers today is creating phishing sites that resemble the actual crypto wallet website. MyCrypto understands this and has since placed a link within the website that you can use to know if you are on the legit MyCrypto Wallet website.

How to set up and activate MyCrypto wallet:

Step 1:  Start by downloading the MyCrypto wallet desktop app from the developer’s official website or GitHub.

Step 2: Install and launch the app, and since you are using the app for the first time, chose to create a new wallet.

Step 3: Click on the “Generate a New Wallet” icon.

Step 4: Chose a backup and recovery option for the wallet. It can be either a mnemonic phrase or a Keystore file. If you decide to back it up with Key Store files, save the private key and paper keys offline, and if you choose a mnemonic phrase, write it down and save it offline.

Step 5: The wallet will now present you with a list of public wallet addresses. Choose your preferred address.

Step 6: The MyCrypto wallet is now active and ready for use

How to add/receive crypto to the wallet:

Step 1: Log in to your MyCrypto wallet and tap on the “Receive” icon on the user dashboard

Step 2: Copy the wallet address displayed and forward it to the party sending you eth-based coins

Alternatively:

Step 3: Click on the Buy tab and choose Changelley if you wish to convert your crypto or Fiat currency into eth-based coins/tokens and load them to MyCrypto.

Step 4: Choose Coinbase if you wish to buy from Coinbase.

Step 5: Follow the prompts to create a user account on either crypto exchange and proceed to make your purchase.

How to send cryptos from the wallet:

Step 1: Log in to your MyCrypto wallet and click on the “Send” icon.

Step 2: On the transfer window, enter the recipient’s wallet address and the number of coins you want them to receive

Step 3:  Confirm that these details are correct.

Step 4: Send

MyCrypto wallet ease of use

MyCrypto is a multi-lingual wallet that’s available in over 20 international languages. It also features a straightforward onboarding process and equally easy crypto sending and purchasing process. You don’t even need to leave MyCrypto Wallet to make a purchase. Just follow the links to Shapeshift for crypto/fiat currency swaps or use the Coinbase Buy Widget.

Supported currencies and countries

MyCrypto, like its Fork, is a multi-currency eth-based wallet that supports Ethetreum, Ethereum Classic, and such eth-based altcoins as the ERC 20 tokens.

Though its parent company has its headquarters in Australia, MyCrypto wallet is currently available in 12 countries.

Wallet cost and fees:

MyCrypto wallet is free to download and use. Fiat deposits and withdrawals are also free, and you won’t be charged MyCrypto card transactions at the point of sale or ATM withdrawal.

Both crypto and token outbound transactions will, however, attract network fees (GAS). These charges are dynamic whereby a higher transaction charge attracts faster transaction fees while reduced fees translate to slower transaction speeds.

Wallet customer support:

MyCrypto wallet maintains an elaborate Help and Support page that outlines different how-to guides, troubleshooting manuals, and general wallet information for both developers and users.

You can also email their support team, raise a support ticket using the contact us button, or direct-message them on social media.

What are the pros and cons of using MyCrypto wallet:

Pros:

  • It has embraced several effective security measures, including anti-phishing tactics.
  • It allows for both fiat-to-crypto and crypt-to-crypto exchanges.
  • It’s a free wallet and allows for free Fiat deposits and ATM withdrawals.
  • MyCrypto has a highly responsive customer support team.

Cons:

  • It will only support a limited range of Ethereum based altcoins and tokens.
  • One might consider the transaction charges higher than on most other wallets.

Comparing MyCrypto wallet with other Ethereum based wallets

MyCrypto vs. MyEtherWallet

MyCrypto was forked off MyEther wallet’s source code. But this is not the only similarity between these two crypto wallets. They both are also eth-specific wallets designed to support coins and tokens built on the Ethereum blockchain. They also share several operational and security features, including integrating hardware wallets and third party exchanges, support for multiple backup options.

MyCrypto wallet, however, takes securing the wallet a notch higher by not only subjecting its users to KYC and AML procedures but also helping them detect and avoid falling prey to phishing attempts.

Verdict: Is MyCrypto wallet safe?

MyCrypto wallet has put in place highly effective measures to help you maintain control over your digital assets. It starts with securing your wallet with a password, providing you with multiple wallet backup and recovery options, and setting up strategies that help you identify and avoid phishing scams. These, plus the fact that you can integrate the wallet with hardware and software wallets, makes MyCrypto a relatively safe eth wallet.  

Categories
Crypto Daily Topic

Serious Crypto Trading Mistakes and How You Can Avoid Them

The crypto market has made people millionaires overnight. It has also caused others to lose a large amount of their portfolio in the same time span. And it’s stories of the former that have newbie traders jumping on the ship every single day. However, the same reason some have gotten uber-lucky is the same one others have found themselves at the cleaners. 

What’s the reason? Well, the sheer unpredictability of the crypto market makes the markets subject to dramatic changes in the blink of an eye. This volatility means when dealing with the crypto market, lots of extra caution is needed. 

In this article, we’ll detail exactly how. It’s an examination of the most serious mistakes traders are not to make, and how you can avoid them to stand a better chance with your trades. 

#1. Relying on too Many Indicators

Trading indicators are one of the most obvious tricks to get ahead in any kind of trading – at least at first. Soon enough, though, you could easily find yourself lost in the myriad of available indicators available. From Bollinger Bands to MACD, to Stochastic, to EMAs, to RSI and plenty more, it’s so easy to get caught up without any tangible benefits. 

Most beginner traders and even experienced ones often make the mistake of thinking that they must understand all these indicators. Apart from indicators of having the ability to contradict each other, some overlap, meaning there’s no need to use so many. 

The reality is, many of the most successful traders get on while relying very little, if at all, on indicators. 

Instead, they observe things like volume and price action – which give them lots of clues on how to make the next move. 

#2. Trading as Much as You Can

In most crypto trading circles, the mantra is the more you trade, the better your chances. This couldn’t be further from the truth. Success in trading arises from strategy and well-executed trades. 

When you don’t overtrade, you can avoid losses caused by, let’s say, the market being down. Also, things like setting for yourself a fixed number of trades that you must meet daily are actually harmful because they force you to make decisions just to tick the list. In such a scenario, it’s very easy for you to take uncalculated risks that could lead to losses. 

What to do instead? Use your well-curated strategy to enter those particularly promising trades. Remember that your strategy need not be written in stone. What worked last week, last month, and so on might not necessarily work next time. So always change up your strategy in response to market realities. 

#3. Going Against the Trend

Trading against the trend is not a no-no. Many successful traders do that all the time. However, it’s harder for a beginner to pull this move successfully. For instance, it would be folly to buy when the market is bearish. While sometimes it can rebound, most times, profitable opportunities are highly uncertain. 

In most cases, when the market is on a downtrend, better to go short than long. When you become more acquainted with the intricacies of the market, you can make bolder moves. 

#4. Placing The Stop Loss Order Too Close

Stop losses are an indispensable tool of modern-day trading. They can help you limit losses in a security position. But in certain conditions, a stop-loss order can actually hold you back. An example is when you place the order too close to the buying price. 

In the highly-volatile cryptocurrency market, the price can go practically any direction in a very short time. As such, it’s very easy to trigger a stop-loss order before the price has stretched sufficiently. The scenario of the market taking a deep before climbing again is all too common. That’s why you need to give room for the price to test both support and resistance levels. 

#5. Acting on Hype

The cryptocurrency space is riddled with hype and “pump and dump” groups, caused by entities who pose as highly knowledgeable in crypto trends when in actuality, they are scam groups. Pump and dump is a crypto scam where a trader(s) hypes a coin as the next big thing, creating excitement about it in the market. 

The idea is to get unsuspecting traders to rush and purchase the coin. When this happens, the hype masters will offload the coin. Because it’s now flooding in the market, it loses value, and the unsuspecting traders are stuck with a valueless coin.

When you spot this kind of hype, take it with a generous pinch of salt. Do your own research before you invest in any coin. Reliable websites and reputable traders’ social media accounts are good places to start. 

#6. Diving Headfirst

You wouldn’t plunge into new waters without knowing the depth, so why would you do it with your money? One of the surefire ways to lose money in crypto trading is to blindly follow a strategy without knowing the mechanics of it. 

Instead, practice your strategy before applying it to real money. Most trading platforms will allow you to conduct demo trading, trading with virtual money instead of real cash. It’s highly recommended that you use these to rigorously experiment before trading in the real world. 

#7. Being Overconfident

The most successful traders will tell you confidence is part of their recipe. Confidence means carefully calculating a move and proceeding to execute it. And while confidence is great, overconfidence is not. 

Overconfidence can cause you to take unnecessary risks and lose money. It can make you enter trades at every turn while ignoring price direction. Fear is not the only emotion causing traders to lose money. Overconfidence is another. And both are detrimental to the process. 

So what should you do? Be confident, instead. One way to cultivate confidence is to study the markets regularly. The crypto market can change in an instant, and when you have beforehand knowledge of what to do in such a scenario, you can make a better-informed decision. 

One thing to know is that what might work when the markets are falling might not be applicable when they’re on an upturn. Another is that the overall market sentiment should outweigh yours at any point. If the market is falling, it makes no sense to go in and make a trade. Better wait for when the trend is more bullish. 

Another way to be confident? By staying on top of the news. The crypto market is highly sensitive to the news – and this means the news of many events – not just finance news. This could be the outcome of a major election, a natural disaster, and so on. And mind you –  this news never has to be true. Even a rumor could send the markets flying in the opposite direction. What does this mean? Sentiment analysis is key, too. If your sentiment analysis game is on top, then you’ll be more confident in your trades. 

#8. Having a Poor Risk-to-Reward Ratio

A risk-to-reward ratio could make the difference between miserable trades and profitable ones. Most beginner traders think scoring more profitable trades than losing ones is what makes a successful trader. In truth, you can lose more than you win and still come out on top. 

For instance, let’s say you have an 80% winning strategy. Even with such a strategy, a terrible risk-to-reward ratio, such as 1:1, will still lose you money. On the other hand, you can have a 40% winning strategy and with a healthy risk-to-reward ratio like 3:1, flip the tables in the best way. 

What does this mean? Better to have a superior risk-to-reward ratio with a lower winning strategy than a huge strategy with a poor risk-to-reward ratio. 

#9. Being Greedy

Humans are naturally predisposed to want it all – whenever possible. This, in its bare bones, is being greedy. And greed in trading is one of the surest ways to lose. 

Every trader will tell you of a time they entered a profitable position and held on for too long – waiting for it to double or triple. Then the markets changed at the flip of a coin, and they lost the position. What this means is sometimes it’s best to lock in a trade even when it’s rising, because a flash crash is an everyday occurrence in the world of crypto. And you simply never see it coming. 

So the key is to be realistic with your trades. Try to increase your portfolio methodically, rather than trying to make quick gains. 

#10. Entering More and More Losing Positions

This is when a trader insists on buying a  digital asset even though it’s clearly falling in value. In cryptoverse, it’s easy to get attached to a particular asset and continue to buy, even though the asset is taking a beating. While it’s good to trust your judgment, let your decision be based on evidence rather than personal bias. 

Go by this rule: if the market is in a general bearish mode, it’s a good idea to ‘buy the dip.’ But if the asset has been on a downtrend for months, even years, better hold out. Generally, buying into a position of strength works better than buying the dip because a currency is dear to your heart.

Categories
Crypto Videos

When Will Bitcoin Push Towards $20,000


When Will Bitcoin Push Towards $20,000?

Bitcoin remaining relatively stable above $10,000 despite a major cryptocurrency exchange getting hacked is certainly a positive sign for the market’s maturity. While major volatility was expected several times throughout the past couple of weeks, this didn’t really happen, even with all the macro-economic uncertainty surrounding the sector.
The question remains, is boring price action becoming a new reality for Bitcoin?

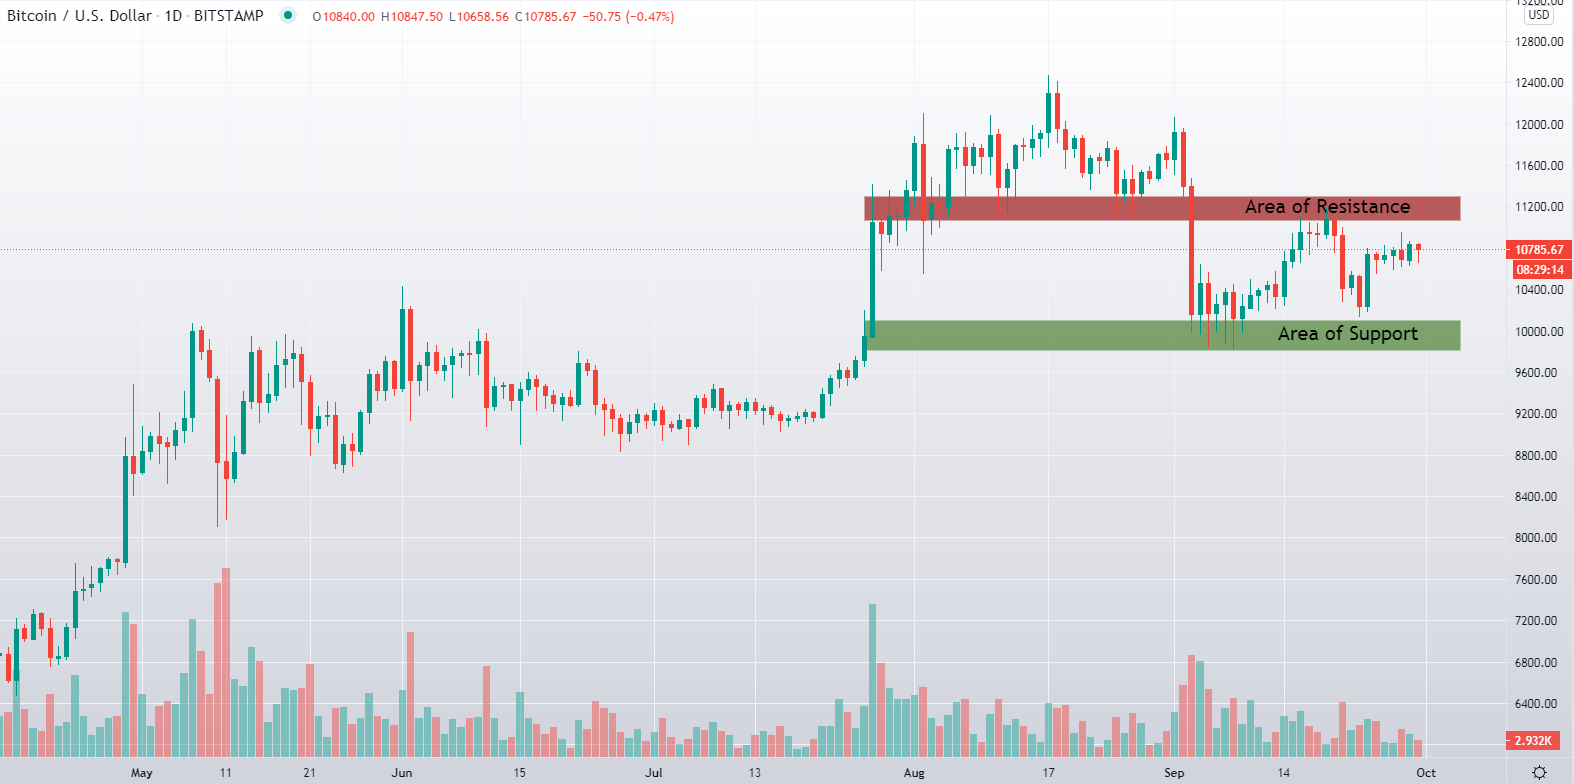
Bitcoin is range-bound on the daily chart

Sometimes, charting can be quite simple and straightforward, and this is one of those cases. Bitcoin’s price fell below $11,090 resistance at the start of the month, establishing new support at $10,000-$10,360. The $11,090-11,300 zone that has been lost is now confirmed resistance.
When taking a look at the downside, a potential drop towards the $9,300-$9,600 zone wouldn’t be completely unexpected as the level around the $9,600 mark is still untested with the lingering CME futures gap.

Crypto sector market capitalization looking for support

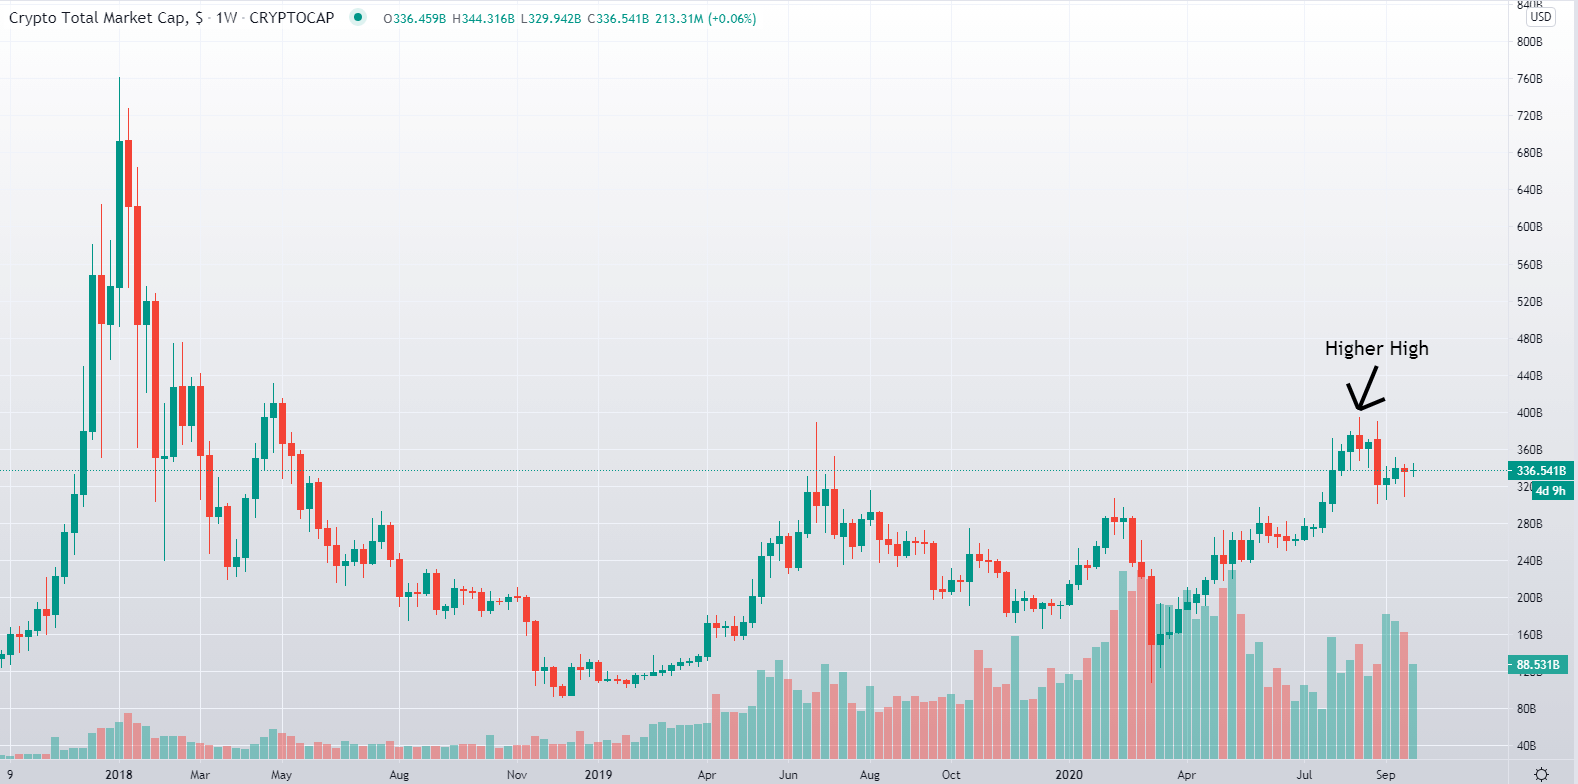
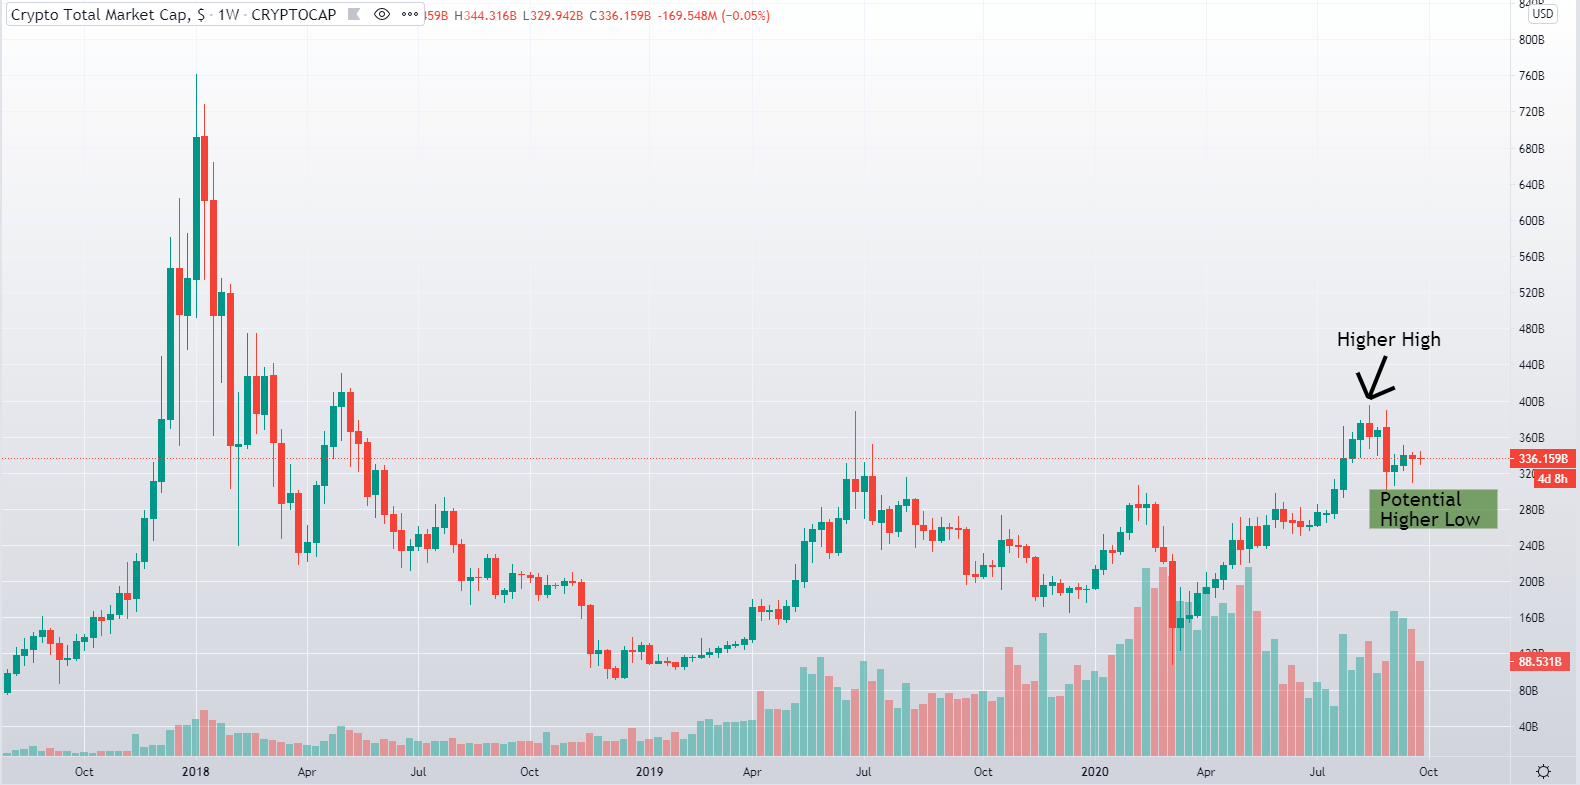
The 1-week chart of the crypto sector market capitalization is showing a clear pattern by posting a higher high in the previous months, marking the potential start of a brand new uptrend.

After a higher high, the market needs to set a new higher low in which a range-bound structure can be defined. While the new possible higher low might be the $300 billion mark, it is also possible for the sector to pull back to the previous resistance zone, which is between $250-275 billion.
However, the price has possibly found resistance at the $320 billion mark, which is where it hit the 100-day moving average. While this bounce is extremely bullish and unexpectedly high, the move is not over yet, and the crypto sector market cap might end up going lower.

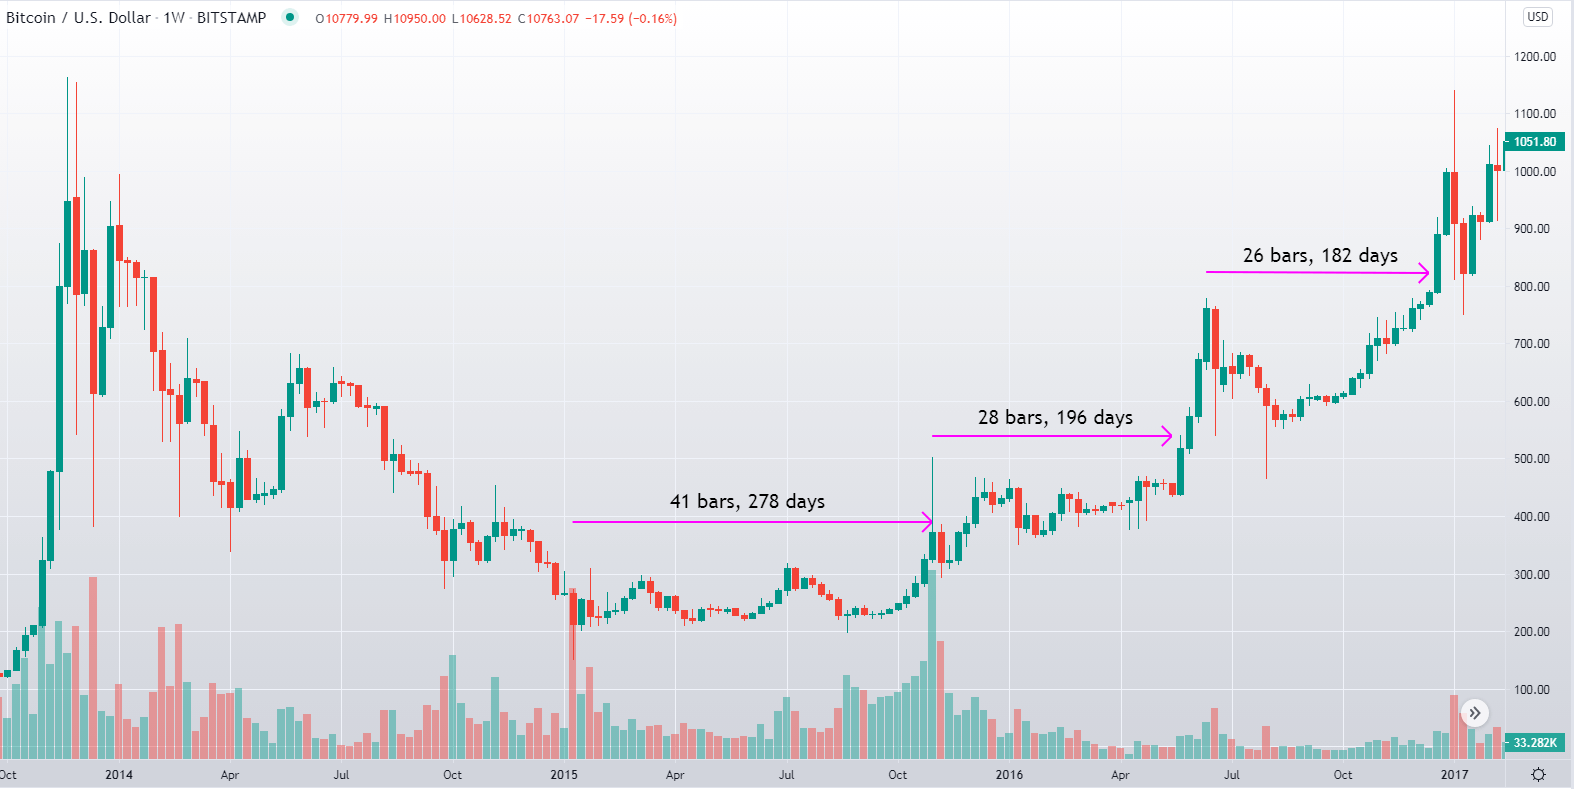
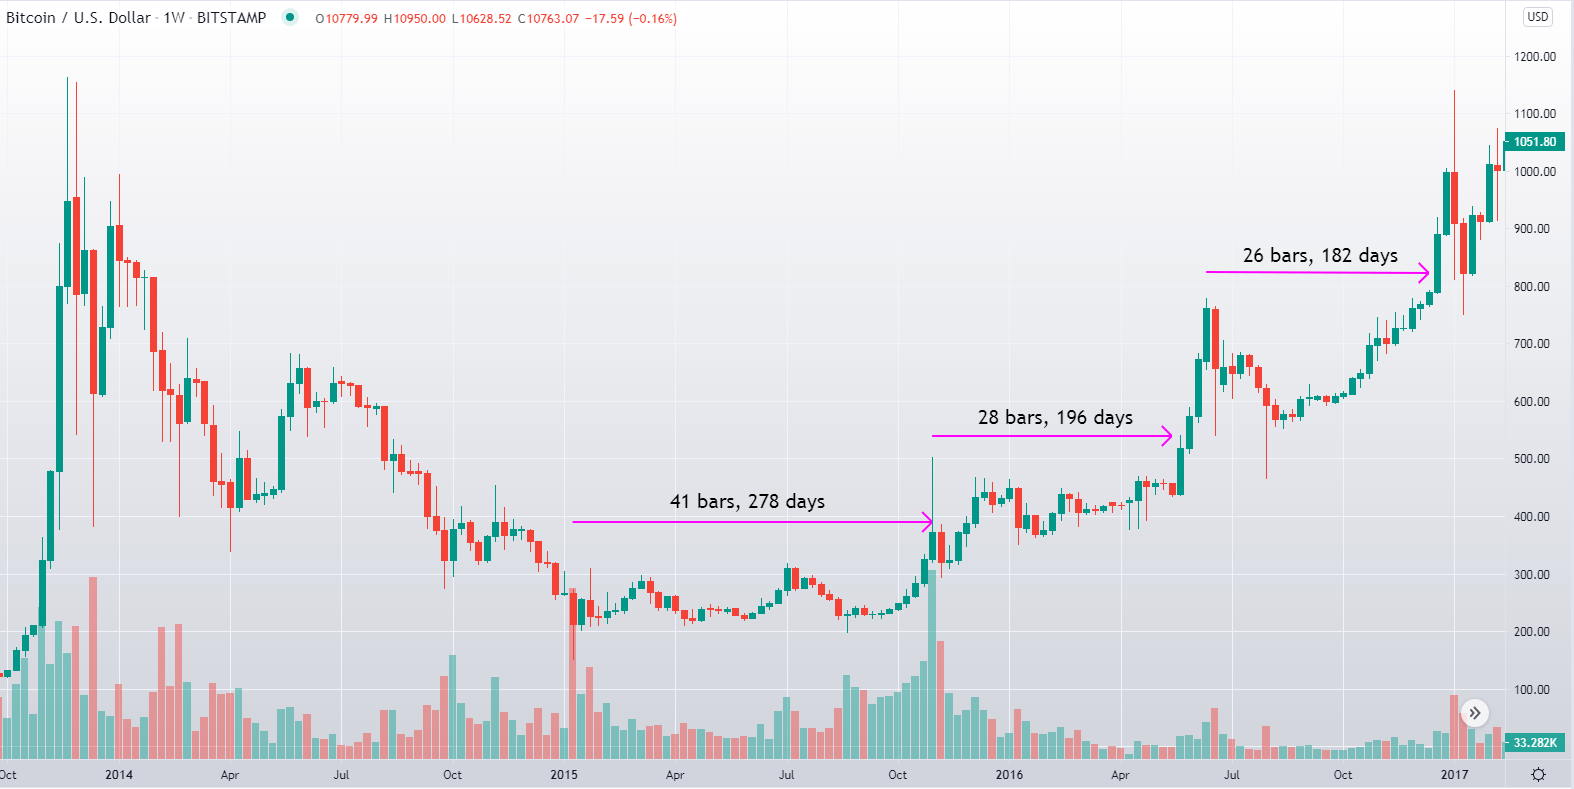
If the given area holds, it also shows how the beginning of a new cycle can be relatively dull. With each new start of a fresh market cycle, levels are flipped as support and resistance, after which we can see months of range-bound trading periods. We can use the price movement of Bitcoin in 2016 as an example, as that year was also a halving year.

During these periods, Bitcoin’s price stabilized in an accumulation range all throughout 2015. After the accumulation range has ended, Bitcoin’s price broke out and pushed towards the next zone of resistance.
This rally ended up with a sideways range that lasted for six months. A new breakout occurred, followed by another sideways range that lasted for six months. The current market sentiment, as well as price movement, is comparable with that period. The real excitement will come only when the total market capitalization of the sector, as well as Bitcoin itself, break into price discovery, as new potential parabolic runs can come back into play at that point.

A Bull case for Bitcoin

It should be noted that the scenarios shown here are based on lower time-frames (specifically the 4-hour time-frame) and, therefore, should be considered a short-term outlook.
As Bitcoin’s price is currently stuck in a range and is currently facing strong resistance, it’s more likely to anticipate a pullback to the $10,360 area, which is the vital area to hold for any form of bullish continuation.
If Bitcoin’s price holds at least that level and creates a higher low, we can expect a strong push towards the upside. If the price decides to just shoot up, the crucial breaker would be the $10,850 area. If Bitcoin breaks that area with confidence, we may see a rally towards the $11,090 or even 11,300 area.
While it would be unexpected to see a massive breakout that would surpass the aforementioned area, that would warrant an even stronger case for the Bitcoin bulls, and even possible highs of above-$20,000.

A Bear case for Bitcoin

The same levels surround the bearish scenario as well. A failure to break the $10,800 zone with confidence would present a potential test of the $10,360 area.
As we discussed in the bullish case for Bitcoin, a potential higher low can fuel the bulls and rally, even more buying power. However, if Bitcoin falls below the $10,360, further downward momentum should be expected, even including the still-open CME gap. However, very few people are expecting Bitcoin to fall below $9,000 any time soon, if ever.

WASHINGTON, DC – SEP. 27: U.S. President Donald Trump reacts to a journalist question during a news conference in the Briefing Room of the White House. Trump is planning for the first presidential debate with Democratic Nominee and former Vice President Joe Biden on Sep. 29 in Cleveland, Ohio. Joshua Roberts/Getty Images/AFP

Bears are mostly making their case based on the economic and political events, such as the U.S. presidential elections, U.S. President Donald Trump announcing that he is ill from COVID-19, as well as events in the crypto space such as the BitMEX platform fallout due to the U.S. government charges against it.

Who is in the right?

While we have no way of finding out who is currently in the right and where Bitcoin will head in the short-term, we can look at its day-to-day price movement as well as fundamentals and sentiment to get a clearer view.
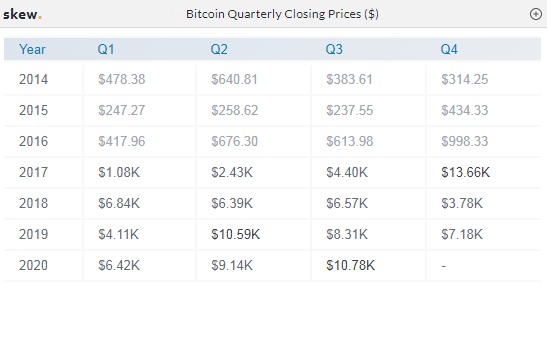
Bitcoin is on track for its best Q3 ever, as Skew’s data shows. According to this on-chain analytics resource, Bitcoin’s Q3 closing price will be stronger than any Q3 before.

BTC/USD traded at somewhere in the $10,700 range on Sep. 30. That number very comfortably beats any other Q3 close on record, with the next highest one being 2019’s close of $8,310. On top of that, Bitcoin has sealed the second-best quarterly close in general, as it beat Q2 of 2019, which had a closing price of $10,590.
On top of that, network fundamentals also speak to Bitcoin’s overall strength, with the network difficulty itself at all-time highs and set for another push towards the upside. Hash rate, a measure of the estimated computing power that is being directed to mining, is also trending back towards its all-time-high levels.

Conclusion

While there are many discussions on whether Bitcoin will retrace to sub-$9,600 levels or push past $11,000, one thing is certain: Bitcoin’s dull price movement will not remain like this for good. Whether its short-term movement will be tilted towards the upside or downside is irrelevant, Bitcoin is here to stay, and good times remain ahead.

Categories
Forex Daily Topic Forex Price Action

Weekly High/Low Breakout Trading: The Chart You May Want to Avoid

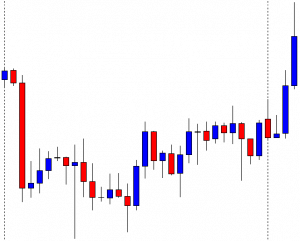
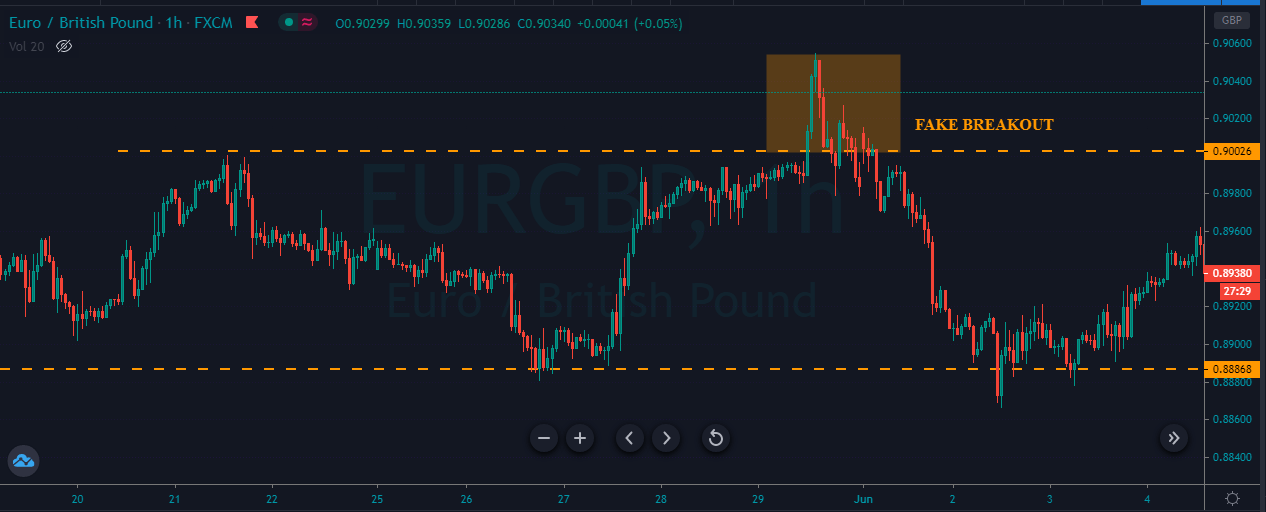
In today’s lesson, we are going to demonstrate an example of a breakout at a weekly high. The price consolidates afterward but fails to make a breakout at consolidation resistance. Thus, the price does not head towards the North. Let us find out how that happens and what lesson it holds for us.

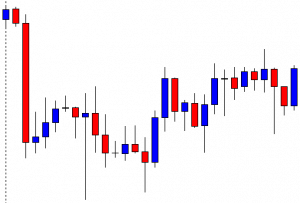
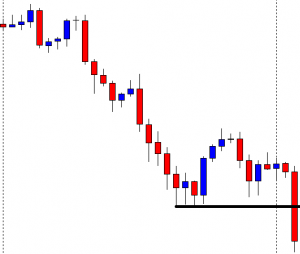
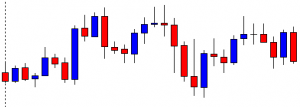
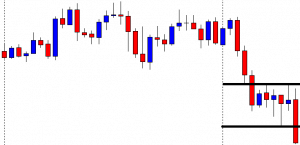
It is an H4 chart. The chart shows that the price makes a strong bearish move to start its trading week. Then, it gets choppy for the rest of the week. The chart closes its week, producing a bullish engulfing candle. Let us proceed to see how the next week goes.

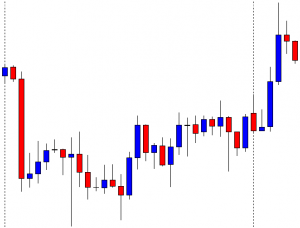
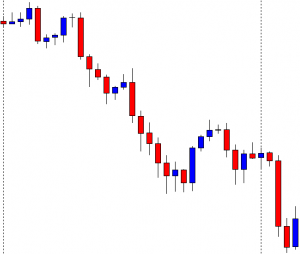
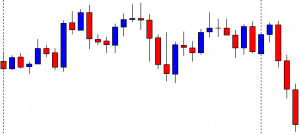
The chart produces a bullish candle to start its trading week. However, it produces three consecutive bullish candles and makes a breakout at the last weekly high. The buyers are to wait for the price to consolidate and produce a bullish reversal candle closing above consolidation resistance to go long in the pair.

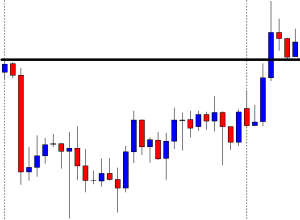
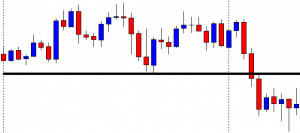
The chart produces two bearish candles closing within the breakout level. A bullish reversal candle closing above consolidation resistance is the signal for the buyers to trigger entry. They must keep their eyes on this chart.

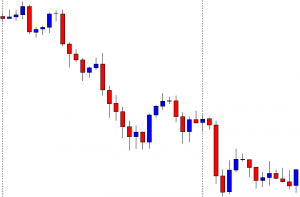
The chart produces a bullish inside bar. It is a bullish reversal candle but not a very strong one. Since it closes within consolidation resistance, the buyers are to wait longer for the chart to produce a bullish candle closing above consolidation resistance.

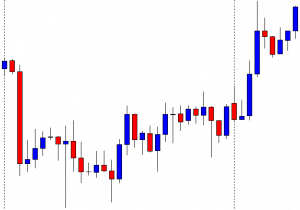
The chart produces two more bullish candles. However, it has not made a breakout yet. It has been taking too long to produce the signal candle. Let us wait and see what it produces afterwards.

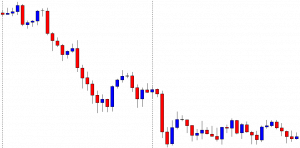
It produces a bearish inside bar at the consolidation resistance. It does not look good for the buyers. The price has a rejection at the level, and it produces a bearish inside bar. It means it is a double top resistance. A breakout at the last swing low may change the equation and attract the sellers instead. Let us proceed and see what happens next.

The price does not make a breakout at the last swing low, either. It produces a doji candle followed by a bullish engulfing candle at the last swing low. It means the chart keeps traders waiting for the next breakout. The bull holds the edge but weekly high/low breakout traders do not love to see such price action after a breakout. It is best to avoid taking entry on a chart like this.


Categories
Crypto Daily Topic

Blockchain and Sports: A Comprehensive Guide

If you have been following – even in the remotest way possible, advances in banking and investment, you must have heard of cryptocurrencies and blockchain. Indeed, since its invention in 2009, blockchain has extensively experimented with cryptocurrencies, but sports? 

Well, the global sports industry is fast realizing the potential that lies in the adoption of blockchain. Today, startups such as Fight to Fame have come up with interesting use cases for blockchain in the sports industry. 

This article will look at some of these use cases and the benefits of blockchain for sports. We’ll also look at how blockchain can impact different areas of operation in the sports industry. 

Blockchain use cases in sports

#1. Fan Engagement

Continuously engaging fans is key to making them happy and keeping them consuming sports entertainment. Also, without fans, the sports industry would not succeed. Blockchain’s transparency and speed can be leveraged to enhance the customer experience in the sale of tickets and merchandise. 

#2. Smart Contracts 

Smart contracts were designed to enable automated transactions. This is particularly useful when transactions involve complex arrangements. On the business side of sports, there is a myriad of processes that can be automated using blockchain. For instance, sports investors can enter into agreements to finance athletes and, in turn, use them as tokens for future profitability.

#3. Sports Betting

While betting has existed for ages, blockchain ideals can transform the way fans bet. Since betting is similar to investing, digital tokens and cryptocurrency derivatives can be used in place of fiat money. This paradigm shift will not only create new possibilities, but it will also make betting more sophisticated and exciting.

#4. Anti-doping Control

Considering how doping adversely affects gaming, solutions that can intelligently address the issue are most welcome. Blockchain won’t be the panacea to the problem, but it will significantly enhance the integrity of doping tests. This can be achieved by maintaining test results on a public land immutable edger. In such an event, we might begin to see more accountability from athletes and their promoters when it comes to the use of performance-enhancing substances.

#5. Securing Athletes’ Data

Blockchain, being an immutable public ledger, can be used as a secure decentralized database for storing athletes’ information. Allegations of sportspersons changing their particulars over the course of their careers – usually done to gain some form of advantage – are common. But with an athletes’ registry backed by blockchain, such cases will be a thing of the past.

#6. Memorabilia Authentication

Badges, trophies, cups, signed merchandise and other memorabilia have great sentimental value in sports, which makes them prone to counterfeiting. Blockchain can be used to assign identity and verify the authenticity of such memorabilia.

#7. Tokenization of Sports Teams

Blockchain has made it easier for sports teams to tokenize their assets, such that investors can easily purchase these tokens from their favorite teams. Just like with traditional share purchases, this can be used to boost the liquidity of teams.

Benefits of Adopting Blockchain in Sports 

The sports industry will derive the following benefits from blockchain: 

  • The creation of new revenue streams through enhanced watching experiences, team tokenization, loyalty programs, and more
  • Easier crowdfunding for athletes which can be achieved through income share contracts between athletes and their fans
  • The creation of new betting models that might attract new audiences
  • The development of new incentives models that can be used to enhance fan engagement

How Blockchain Will Impact Fan Identity

The idea that fans can have digital identities is exciting. These digital identities can form a basis for crowdfunding, fan recognition, and digital collectibles. With such identities in place, the path to stardom will become clearer to many fans. And since superfans can be verified, there will be much more prestige associated with being a notable supporter. Fans will be more loyal, and teams will be able to better identify and reward such loyalty. As you can see, blockchain will elevate fan identity to a whole new level, where serious fans can be separated from casual followers.

How Blockchain Will Impact Incentivizing and Rewarding Fan Interaction

First, since it will be easier to identify fans, rewarding them for their interaction will be pretty straight forward. We will begin to see the rise of loyalty programs that can both identify and reward high levels of engagement. Tokens earned through loyalty programs can be redeemed for tickets or even exchanged for money. 

How Blockchain Will Impact Memorabilia Authentication

Just like fans, memorabilia can also acquire digital identities. For example, manufacturers can collaborate to create a standard for encoding the particulars of given memorabilia. These particulars can then be maintained on a blockchain ledger. Once this is achieved, verifying the authenticity of a trophy or medal will be as easy as looking upon the blockchain. 

How Blockchain Will Impact Digital Collectibles

Blockchain will give sports organizations the ability to generate digital collectibles and sell them to collectors. The beauty of it is that organizations will have control over the scarcity of collectibles. On the other hand, fans will have the ability to verify the authenticity and reputation of a collectible before buying it.

How Blockchain Will Impact Crowdfunding

With blockchain, crowdfunding will certainly become easier for athletes and sports organizations. Athletes and sports organizations can create tokens and sell them to fans, who can then redeem these tokens in the future for money, tickets, or other available options.

How Blockchain Will Impact Gaming and E-sports

Gaming has significantly grown in the recent past, and organizations are scrambling to satisfy consumer needs with new and exciting innovations. Introducing tokenization in blockchain-based games will change the game as players will now be able to trade the tokens among themselves or in the open market. 

The adoption of smart contracts will also transform betting by reducing payout time and transaction costs. This can be achieved through direct payouts for betting proceeds.

How Blockchain Will Impact the Tokenization of Teams

The tokenization of teams will become easier than ever before. Sports organizations will be able to create tokens that represent company ownership and sell them to their supporters. This will enable teams to grow even without relying on corporate sponsorship, as is traditionally the case.

Final Thoughts

The applications of blockchain are gradually expanding to industries beyond finance. As it’s adoption begins to sip through the global sports industry, changes in fan identity and engagement, loyalty programs, crowdfunding for athletes, and the trade of collectibles are inevitable. It will be a thrill to watch how the two spaces evolve together. 

Categories
Cryptocurrencies

GreenAddress Wallet Review: Is This The  Safest Bitcoin wallet app?

GreenAddress wallet is a bitcoin-only wallet created in 2013 by Lawrence Nahun and Jerzy Kozera. It is run by GreenWallet – a technology company registered in Malta – but was in 2016 acquired by Blockstream. On the GreenAddress website, the company is described as a safe wallet that gives you control of your wallet. It also adds that GreenAddress adopts a multi-faceted approach to keeping crypto coins safe and ease of use doesn’t let you “choose between security and convenience” or “compromise your privacy.”

It has integrated numerous security and operational features, geared towards making GreenAddress the safest and most intuitive bitcoin wallet. But what are these features, and how have they impacted the wallet’s safety and convenience?

We detail the GreenAddress key features here, vet its ease of use, list its pros and cons, and compare it with other Bitcoin-only wallets before telling you if it really is the safest Bitcoin wallet.

GreenAddress key features:

Cross-platform: Though it started with Android and iOS mobile apps, the GreenAddress wallet recently launched a Google Web extension for the wallet.

Address book: The GreenAddress wallet also features an address book for saving wallet addresses for individual and exchange wallets you interact with regularly. It goes a long way in helping you avoid the often-costly errors of getting the wrong wallet address.

Instant confirmation: When sending or even receiving cryptos in and out of your GreenAdress wallet, you will have the option to turn on the Instant Confirmation feature that notifies you immediately a transaction is confirmed, effectively eliminating the possibility of double payment.

Hardware wallet support: You also have the option of integrating the GreenAddress hot wallet with a hardware wallet. This not only boosts the wallet’s security but also increases the number of coins you can interact with.

GreenAddress security features

Password + PIN: When setting up the wallet and creating a user account, you will be required to set a passphrase and a PIN code. The passphrase gives you access to the private access and doubles up as the encryption tool while the PIN code opens the wallet’s watch-only mode.

Two-factor authentication: There are three verification methods supported by the GreenAddress wallet’s two-factor-authentication functionality. You can choose to authorize transactions via an SMS alert, email notification, or a robocall.

Hierarchically deterministic: The process of generating wallet addresses for new transactions is hierarchically deterministic. And this comes in handy when you want to throw off trackers and ensure that the parties you interact with don’t get to view your past and future crypto transactions.

Open source: The wallet address is also open-sourced and open to vetting and auditing by both wallet users and the rest of the crypto community. This privacy guarantee ensures that the wallet is free of bugs, security loopholes, and malicious codes.

Non-custodial: The GreenAddress website claims that the wallet will “Never store your private keys, not even (when they are) encrypted.” They are encrypted and stored within your mobile or computer device, giving you total control.

Watch-only mode: When using public wi-fi or suspicious internet connection, you can access the wallet in a watch-only mode that allows you to view balances and accept transfers in. When using the watch-only mode, you don’t have access to the private keys and any sensitive wallet information, you cannot send coins, and you cannot alter the app settings.

How to set and activate the GreenAddress wallet (web wallet)

Step 1: Open the official GreenAddress wallet website (https://greenaddress.it/en/) and click on the ‘Create Your Wallet’ icon on the upper right corner of the homepage

Step 2: A warning will pop up asking if you want to continue with the registration via the web site or you wish to download the GreenAddress wallet app

Step 3: If you chose ‘Continue Using Webpage’ you will receive the mnemonic backup phrase that forms the recovery seed

Step 4: Write them down on a piece of paper and save them offline. Acknowledge that you have noted them down and press continue

Step 5: Verify that you have accurately written them down and in the right order by filling in the missing words.

Step 6: Activate the two-factor authentication and verify your identity by linking the web wallet with your Google authenticator, adding your email address, or phone number.

Step 7: Enter the verification code you receive on your chosen 2FA method

Step 8: Set the wallet PIN (between 5 and 15) numbers

Step 9: Tap on the “PIN set, ready for step 3” to complete the process

Step 10: The wallet is now active and ready for use

How to add/receive Crypto into your GreenAddress wallet

Step 1: Log in to your GreenAddress wallet and click the “Receive” tab on the user dashboard.

Step 2: If you have multiple wallet addresses, chose the one you want to use

Step 3: Copy the wallet address and forward it to the person sending you Bitcoins.

Step 4: Wait for the coins to reflect.

How to send Crypto from your GreenAddress wallet

Step 1: Log in to your wallet and click “Send” on the user dashboard

Step 2: If you have multiple wallet addresses, choose the one you would like to use

Step 3: Enter the recipient’s address and the number of Bitcoins you wish to send on the transfer window.

Step 4: Review the transaction details and hit send.

GreenAddress wallet ease of use

GreenAddress is a highly intuitive and customizable Wallet. You can easily customize most aspects of the wallet, including themes, set your preferred exchange rate, and change the privacy and notification settings. It also allows you to change the denomination of your wallet’s base currency from Bitcoin to mBTC, uBTC, or Bits. You can also choose between the 12 language settings, determine the daily/weekly/monthly transaction limits, add more user accounts or wallet addresses, and even incorporate advanced wallet security settings.

GreenAddress wallet supported currencies and countries.

GreenAddress will only support Bitcoin cryptocurrency.

GreenAddress wallet cost and fees

GreenAddress is a free wallet. It is free to create a user account and store coins here. You will only have to pay the Bitcoin network fee charged when you send coins to another wallet or exchange.

What are the pros and cons of using the GreenAddress wallet?

Pros:

  • There is no limit to the number of wallet addresses or Bitcoins you can hold in your GreenAddress
  • Allows you to incorporate advanced security settings
  • The wallet is relatively easy to use
  • It can be easily integrated with hardware wallets
  • It gives you absolute control over your private keys

Cons:

  • GreenAddress is a Bitcoin-only Crypto wallet
  • GreenAddress does not give wallet users a choice in choosing the multi-signature partner
  • One may consider the signup process to be laborious and the wallet not beginner-friendly

Comparing GreenAddress wallet with other Bitcoin-only wallets

GreenAddress wallet vs. Blockchain Core

GreenAddress and Bitcoin Core are both Bitcoin-only wallets. But while GreenAddress is a mobile/web crypto vault, the Bitcoin Core is a full-stack desktop client wallet. Additionally, while both wallets are hierarchically deterministic, the GreenAddress wallet generates a new address for new transactions automatically while address-generation for Bitcoin Core is manual.

Although Bitcoin Core may be considered safer as it integrates more effective security measures, GreenAddress carries the day for convenience. It only takes up limited storage space and even more intuitive.

Verdict: Is the GreenAddress Wallet safe?

Well, we consider the security measures GreenAdress wallet has put in place adequate for individuals looking for short-term storage for their coins or active traders. However, we find fault with their multi-signature functionality that does not present users with any other choice of a signee other than GreenAddress itself. Further, GreenAddress is a hot wallet and thus susceptible to the inherent threats associated with online wallets.

Categories
Crypto Daily Topic

Games to Play and Earn Cryptocurrency

In our real-world, fun and making money don’t always go together. What if that changed? How amazing would it be if you could earn money just playing games in the comfort of your couch? 

Well, that’s now possible thanks to blockchain tech. Blockchain and gaming is the near-perfect combination of amazing gaming experience. If you are a cryptocurrency and gaming enthusiast, you probably won’t need to spend thousands of dollars on ridiculously expensive mining rigs to earn crypto.

We made a list of some of the best games to play and earn cryptocurrency. 

#1.Worldopoly

In 2018, Qubit AG released the first blockchain-driven mobile augmented reality game, Worldopoly. This is a multiplayer strategy board game that resembles Monopoly, but with its in-game economy. It is a real estate simulation game that utilizes DAG (Direct Acyclic Graph), MMORPG (Massive Multiplayer online crypto-coin Game), augmented reality, and geopositioning for a frictionless gaming experience.

Worldopoly turns the whole world into a game of Monopoly. Players can buy cities, streets, build buildings, restaurants, and hotels. The players can equally sell part of their empire, rent out shop fronts to advertisers, and earn crypto-tokens worth real money. Every structure bought can be improved and sold to bring additional income. Gamers can raid or even torch down competing players’ properties. Similarly, players can cooperate with other players to build or buy large projects together. The game uses data from Google Maps and open street maps to give players access to every city and other places of interest across the globe. 

Worldopoly’s game concept uses three currencies; Worldopoly Tokens (WTP), gold, and coins. Gold and coins can only be used in the game. Gold helps players quicken the completion of their projects while coins are used to buy and renovate buildings. Players can earn WTP from selling or leasing their properties. Similar to the real world, the more property a player has, the more profit generated. These tokens can be withdrawn from the game directly to the users’ wallet. One WTP has a per-token value of around $0.12.

#2.Cryptokitties

Cryptokitties is a game that was created as an attempt to deploy blockchain technology for recreation; Cryptokitties was created. Developed by Axiom Zen, the game was launched in 2017. It is one of the earliest blockchain-based games, and it comes packed with impressive animation, huge rewards, and great graphics for an exciting gaming experience. 

Cryptokitties involveS collecting, purchasing, breeding, and selling virtual cats. There are more than 3 million cats to choose from, each with a unique avatar. Users get to create their Cryptokitties and put them up for sale. Players can interact with their kitties either by selling, buying, or breeding them. Different breeds of kitties have different market valuations. 

These breedable cats have unique numbers and different attributes called ‘cattributes’. Cattributes can be passed on to their offsprings after breeding. In total, there are 12 cattributes for any given kitty. Some of these include fur color, eye color, mouth shape, and pattern. A rare breed cat is worth more tokens than the others. 

Trading and breeding cryptokitties unlocks rare cat traits that can be traded for higher earnings. Players can further crack puzzles, create their own cat collections, and play games to earn extra rewards. Until November 2018, developers created a new supply of cats, but since then, new cats were created through breeding by the users.

Gamers earn various rewards, including ETH tokens. The rewards go directly to the players’ wallets and can be later withdrawn for real money.

#3.Splinterlands

Splinterlands is a popular multiplayer, digital collectible trading card game. With over 2,500 users daily, this blockchain-based game is integrated with the Wax blockchain platform. In the game, players can easily sell, buy, and trade digital cards. 

Splinterlands is an epic fantasy card game where gamers battle with monsters to gain control of a world in disarray. Players are expected to collect cards and come up with strategies that will strengthen their deck against their opponents. If a user plays their cards right and scores a win, they will be awarded crypto-tokens. 

Every card in the game is individually owned – not even creators of the game can take a card away from any player. The game enables players to see how many of each card exists in the game. Additionally, different cards in the game possess different elements. Therefore, players are free to buy and sell their cards, depending on what their deck needs.

By trading cards, winning tournaments, quests, and ranked plays, gamers are rewarded in cryptocurrency. A high-level tournament winner is rewarded with Steem tokens. Gamers earn more cryptocurrency trading in cards than winning tournaments.

#4.Privateers Life

The creators of Privateers life developed this game in an attempt to mirror the world’s actual economy. The game is based on the life of a pirate in the 17th century who uses tactics and strategy to survive in harsh conditions. The ultimate goal of this game is to survive by using the resources in the game. 

A player needs to constantly monitor the pirate to ensure his survival – he must be fed regularly. Food can be acquired through hunting, collecting wild plants, fishing, or cultivating their own land. Food gained can alternatively be sold in exchange for cryptotokens worth real money. To earn more, players can manufacture or process products and put them for sale in the premium store. Similar to the real world, raw materials are obtained through harvesting, mining, or foraging on their territories. Alternatively, players can purchase raw materials from the premium store.

A player can buy goods from other players or the premium store using Ludum tokens (LDM), the in-game currency. The goods in the premium store are crafted by other players in the game. Players earn Ludum crypto-tokens from selling their products and ceding their territories.

5.Alien Run

Alien run is another crypto-based mobile game available on Android and iOS which utilizes Bitcoin technology.

Remember those arcade games back in the day? Alien run is built using that same concept. If you enjoyed these classic games, then you should check this one out. A player assumes the role of an alien that needs to run to safety, avoiding obstacles on its path. 

The game is simple and easy to play, but quite addictive. As the player makes progress through the levels, the alien develops new skills. These skills are useful in maneuvering through the game as the difficulty increases as one levels up.

Players receive rewards in the form of cryptotokens after completing each level. The cryptocurrency earned is in Bitcoins, and it goes directly into the players’ eWallet. With the increase in the game’s difficulty, there is an increase in the amount of Bitcoin rewards. 

Final Thoughts

Games like these allow players to interact with the crypto and blockchain world. It’s one of the many shining points about blockchain – the ability to allow people to have fun while earning real money.

Categories
Forex Daily Topic Forex Price Action

Weekly High/Low Breakout Trading: Count the Breakout Candle’s Attributes

In today’s lesson, we are going to demonstrate an example of an H4 breakout at the last week’s high. However, the price does not head towards the North as it usually does. Let’s find out why that happens.

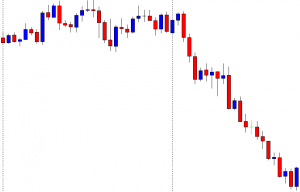
The chart shows that the price after making a strong bearish move gets choppy. The H4 traders may wait for the price to make a breakout at either side. A bullish breakout may attract the buyers to go long in the pair. On the other hand, the sellers may wait for the price to make a bearish breakout.

The price produces a bearish candle to start the next week. The price finds its support, and it heads towards the North. However, the last weekly high is still intact. The buyers must wait for the breakout at the level to go long.

The price finds its intraweek resistance. It comes down. Intraweek support holds the price and produces a bullish inside bar. It is not a strong bullish reversal candle. However, it is produced at double bottom support. Let us wait and see whether it makes a breakout at the neckline or not.

The price heads towards the North and makes a breakout at the neckline. The candle closes within the last week’s high and consolidates. It then produces a bullish candle closing above the last week’s high. However, the candle has a long upper shadow. Considering its upper shadow, traders do not usually get attracted to trade upon such a breakout candle.

As anticipated, the chart produces some bullish candles with long upper shadow after the breakout. The price heads towards the North with a sluggish pace. It then produces a bearish Pin Bar and drives the price towards the breakout level again. A bullish reversal candle closing above consolidation resistance may attract the buyers to go long in the chart again. Let us find out what happens next.

The chart produces a long bearish candle with long lower shadow. The pair is trading within the last week’s range again. The H4 buyers have lost their hope. They may skip eying on the chart to concentrate on somewhere else.

If we look back, a double bottom, along with a breakout at the last week’s high, do not push the price towards the North. Most probably, this is because of the breakout candle’s attributes. We may still keep an eye on such a chart, but it would be wise to concentrate more on those charts, which makes a breakout with a commanding candle.


Categories
Forex Market Analysis

How Elliott Wave View of NASDAQ Anticipates Trump’s Coronavirus Outcome

Overview

The NASDAQ 100 Index fell 2.2 percent on Friday’s trading session on the news of the US President Donald Trump’s positive coronavirus test. Still, the price action unveiled the wave B completion, suggests further declines for the US technologic benchmark in the following trading sessions.

Market Sentiment Overview

During the last trading week, the NASDAQ 100 volatility has been driven by market participants’ expectations facing the first presidential debate between US President Donald Trump and former Vice President Joe Biden.

The advance experienced by the technology index was boosted by the expectation of new economic stimulus, driving the NASDAQ 100 to raise over 4%. However, its gains were lowered after the announcement of President Trump’s positive Coronavirus test, leading it to ease up to 2.74% on Friday’s trading session.

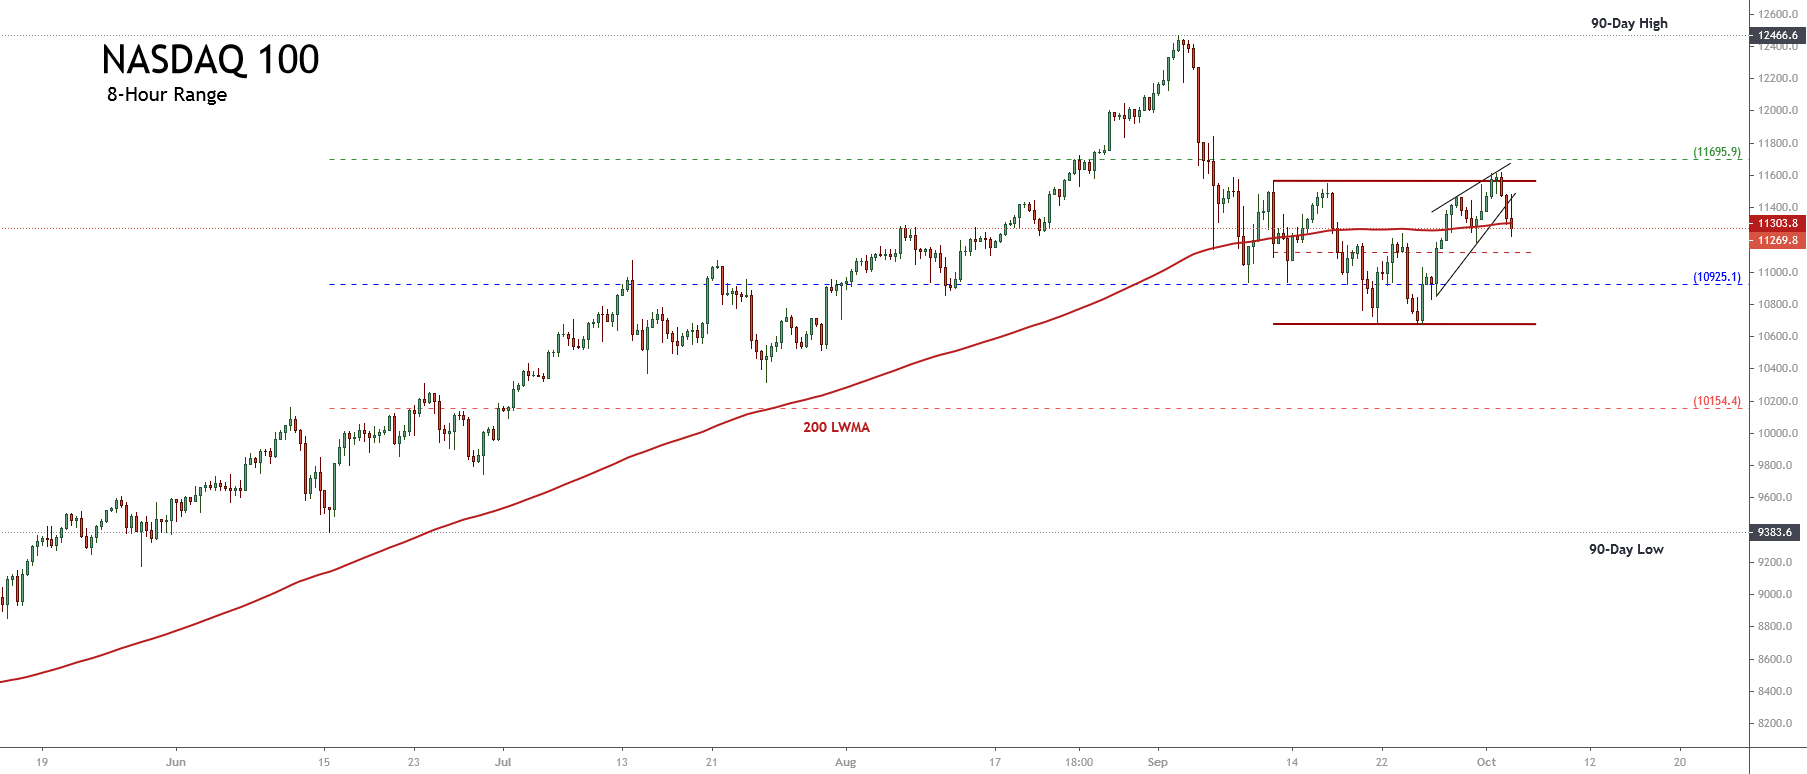
The following 8-hour chart of NASDAQ 100 reflects the 90 days high and low range. In the figure, we distinguish that the price halted its advance towards the extreme bullish sentiment zone, closing the trading week in the bullish market sentiment area and under the weighted 200-day moving average. This market context leads us to weight a neutral market sentiment.

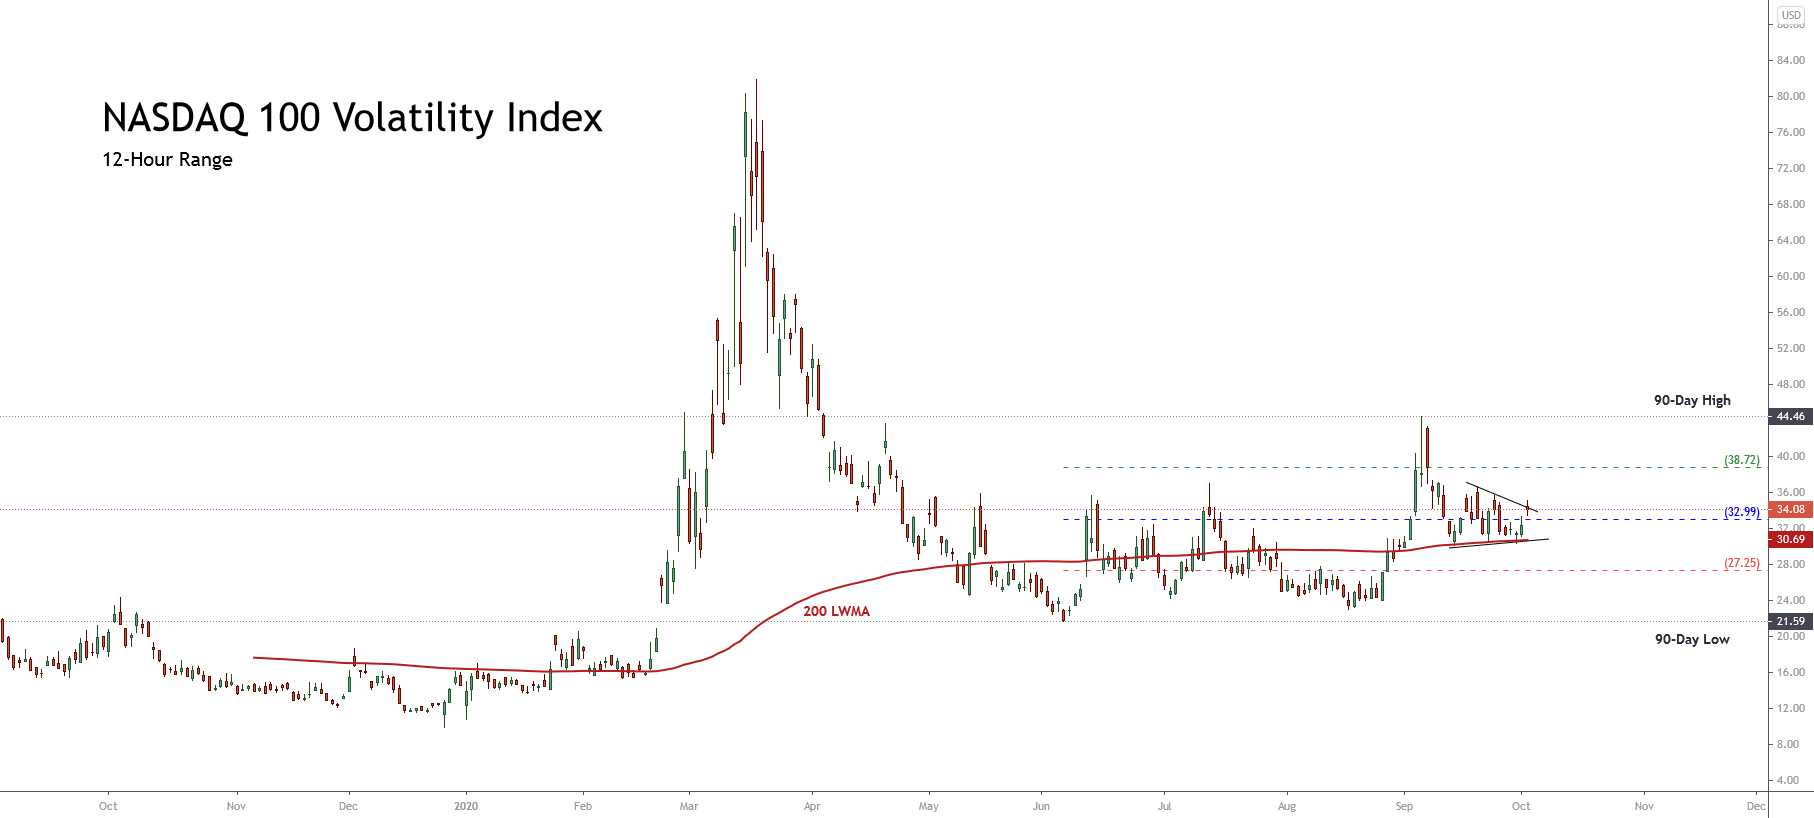
On the other hand, the 12-hour chart corresponding to the NASDAQ 100 Volatility Index shows the 90 days high and low range where we distinguish a sideways movement consolidating above the 200-period weighted moving average. This volatility context of the NASDAQ 100 index, added to the new test of the upper-line of the consolidation structure, leads us to expect an increase in volatility within the coming trading sessions.

Summarizing, NASDAQ 100’s market sentiment unveils that this index and its volatility figures will be driven by the news on the upcoming presidential elections on Tuesday, November 03. In particular, NASDAQ 100 could turn bearish in the following trading sessions.

Elliott Wave Outlook

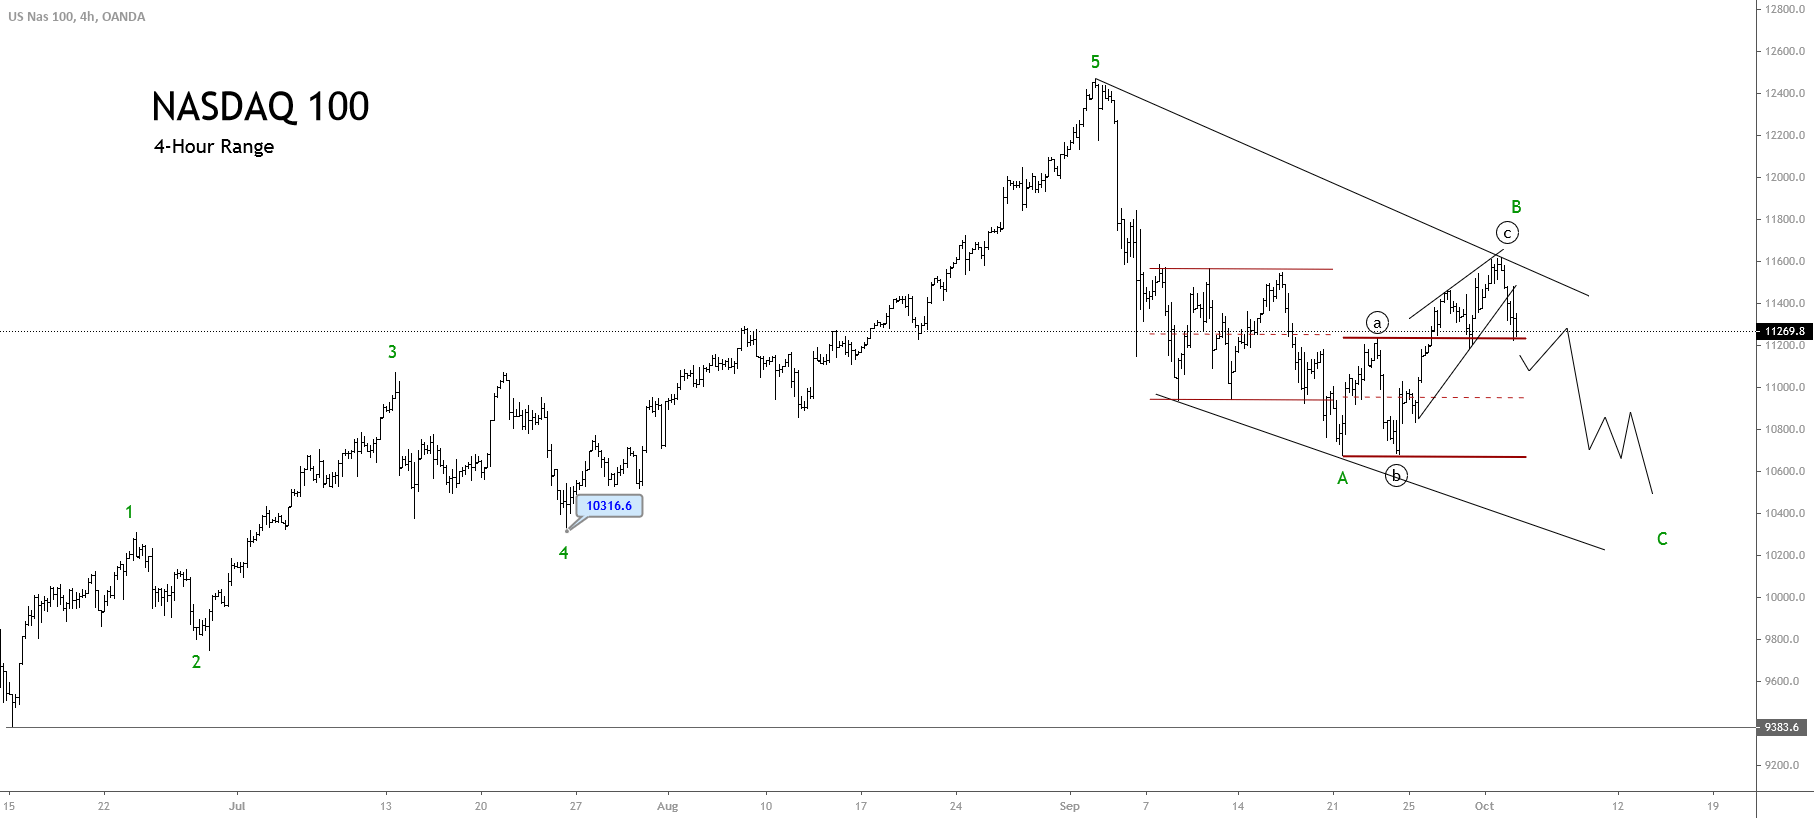
The overview of NASDAQ 100 shows the full development of a five-wave bullish sequence, which began on June 15, when the price found fresh buyers at 9,383.6 pts pushing the price towards new record highs September 02 at 12,466.6 pts. Once reached the all-time high, the technological index began to perform a bearish corrective movement, which remains in progress.

The following chart shows the NASDAQ 100 in its 4-hour timeframe, where we distinguish that the price has completed a five-wave impulsive structure of Minor degree labeled green. At the same time, we can confirm that the Elliott wave theory rule, stating that there must be only one extended wave. In this case, the NASDAQ 100 index developed a fifth extended wave that ended on September 02 when the price found resistance at 12,466.6 pts. Once the fifth wave of Minor degree concluded, the NASDAQ 100 began performing a corrective sequence, which remains in progress.

In particular, the completion of the wave ((c)) of Minute degree identified in black, which completed the wave B of Minor degree, coincided with the news media release concerning the US President Trump’s positive test, activating the beginning of the wave C, labeled in green.

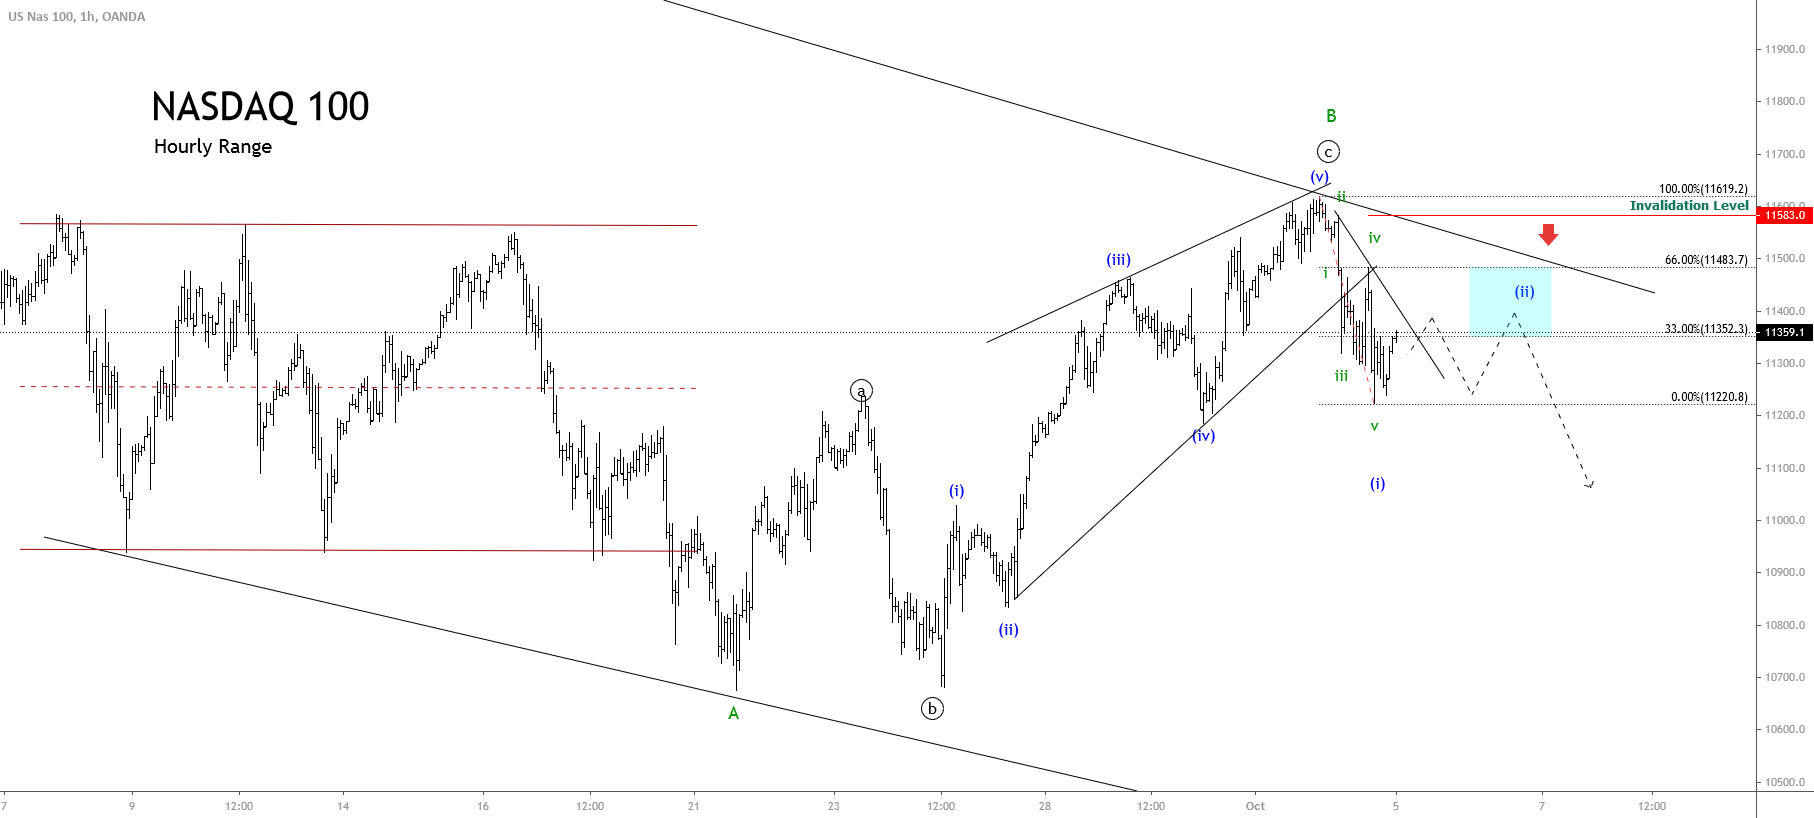
The following hourly chart of NASDAQ 100 illustrates the first bearish movement’s internal structure corresponding to its wave (i) of the Minuette degree identified in blue. This first downward wave reveals a drop in five moves of Subminuette degree identified in green in its internal formation. Once this second move has been completed, the technological benchmark should resume its declines.

Finally, considering that wave (i) of Minuette degree completed its descending move at 11,220.8 pts on Friday 02nd, the price could retrace, forming its second wave of the same degree. In terms of the Dow Theory, this retrace could be between 33% and 66%, or between the 11,352.3 pts and 11,483.7 pts, where NASDAQ 100 might start to develop a new decline, corresponding to wave (iii) in blue.

Categories
Crypto Daily Topic

How to Buy Bitcoin with PayPal

The crypto community celebrated when it emerged in June that PayPal would be supporting Bitcoin. Bitcoin is the most popular cryptocurrency, representing 57.5% of the crypto market at the time of writing. Thus, when PayPal, one of the biggest payment processes in the globe, announced its support, it was a turned page for the Bitcoin community. 

However, many fans of the currency still do not have an idea of how to purchase bitcoin through PayPal. In this article, we’ll explore ways on how you can do that. We’ll also see the pros and cons of each method so you can decide which one would work best for you.

1. eToro

Buying Bitcoin from eToro with PayPal is one of the simplest methods. This is especially if you’re trying to profit from price fluctuations rather than getting the actual coins. 

Pros 

  • Requires low fees
  • Fully regulated in several nations
  • High-level security
  • If you are a first-time buyer, the limits are quite favorable

Cons

  • It can be quite confusing if you do not have the handle on it. 
  • Not available globally

How to Purchase Bitcoin through eToro

As stated above, buying Bitcoins through eToro is quite simple. After loading the eToro homepage, scout for the ‘Get Started’ button. Next, choose the ‘Sign Up’ option. Here, enter your full details. 

Once you have an account set up and you’re logged in, click on the ‘Deposit Funds’ option. Indicate the number of funds you wish to deposit, then select the ‘PayPal’ option. From here, you will be redirected to the PayPal website to complete the transaction.

You now have funds in your account, move on to scour for the ‘Bitcoin’ option at the very top of your page. Click on the ‘Trade’ option.

You’ll need to fill in the amount of Bitcoin you want in your local currency. After doing so, click on ‘Buy.’ 

2. Paxful

Paxful is known for its simple and friendly interface. Users can purchase Bitcoin on Paxful through a variety of ways, i.e., Amazon gift cards and Skype credits. With PayPal, the steps of acquiring Bitcoin through Paxful take a very short time.

Pros

  • Diverse sellers

Cons

  • A rather high exchange rate

How to Purchase Bitcoin through Paxful

Head to the Paxful homepage. Create an account by filling in your crede. Select your desired payment method – in this case, PayPal. This is after inputting the amount of money you want to spend. 

Now that you have funds available choose your seller. You can either do this manually or let Paxful select one for you.

Once you click on ‘Trade’, the website opens up a window where you can chat with your chosen seller. Here, you will finalize the trade deal by indicating that you have sent your payment. At this point, the seller’s Bitcoins will be held in ‘escrow.’ The seller will then release the Bitcoins into your wallet.

There is an approximately thirty-minute window that allows you to complete this transaction. Failure to do so within this time frame will lead to the transaction getting canceled. 

3. LocalBitcoins

LocalBitcoins allows people from more than 200 countries to sell and buy Bitcoin. Its wide use can be attributed to the more than twenty payment methods it supports, which of course, include PayPal.

Pros

  • Secured – both seller and buyer are protected by escrow
  • Simple sign up process
  • A variety of sellers accept payment from PayPal

Cons

  • Because of the risk the seller might incur, they tend to charge higher rates.
  • Sellers might request your verification credentials. This is largely because of the chargeback risks posed by PayPal. 

How to purchase Bitcoin through LocalBitcoins

Head to the LocalBitcoins homepage and create an account. Once again, you are encouraged to fill in your information as honestly as possible. This is advised in order to find a seller who is willing to accept payment through PayPal. 

With your new account, scour for the ‘Buy Bitcoin’ option at the very top of the page.and click on it. Enter your local currency, then proceed to select the country where you want to buy your Bitcoins from. Once you have secured your country, look for a drop-down box with the option of ‘All Online Offers’. Select ‘Search’. 

A list with varied sellers who are willing to allow payments through PayPal will appear. Here, you will have to make a decision based on the detailed information provided on the sellers. The sellers are ranked by the price that they are willing to accept, the total amount of trades conducted by the sellers, and also the feedback from their previous customers.

Once you select a seller, click on ‘Buy.’ Also, include the rate and the amount you wish to purchase. On the right side, you will see specified information by the sellers. Read through this information and see if you can meet these terms. 

If you do, click on ‘Send Trade Request’. The moment the seller accepts your Bitcoin PayPal request, their coins will be locked in an escrow. A PayPal address will be released to you. As soon as you have done the payment, click on ‘Payment Sent’. 

When the seller receives the payment, the Bitcoin will be released to your LocalBitcoins wallet.

Final Thoughts

It’s exciting that Bitcoin users who also use PayPal can now seamlessly use the payment processor to sell and buy Bitcoin. It’s a milestone for the crypto space that helps push the idea to the mainstream, and it remains to be seen how the two will be useful for each other going forward. If you intend to use PayPal to buy/sell Bitcoin, then def do your own research (DYOR) to identify the method that best suits you. 

Categories
Cryptocurrencies

DropBit wallet Review: Is Dropbit A Legit Bitcoin Wallet Or A Crypto Scam?

DropBit wallet is a highly innovative Bitcoin wallet app developed by Coinninja Technology Company and introduced to the crypto community in 2018. According to its developers, the mobile wallet is specially designed to make it as user-friendly as possible without alienating experienced crypto traders/investors. But even more importantly, it was designed with convenience in mind. It is the first crypto wallet app to make it possible for you to send crypto to mobile phone numbers and twitter handles.

This convenience extends to the speed with which Bitcoin transactions are confirmed and the security measures around the wallet and your private keys.

But how effective are all the operational and security measures put in place by the Bitcoin app? Is the DropBit app as legit and functional as it claims, or is it just another crypto scam?

We answer these questions by detailing its features and everything else you need to know before creating a user account with the wallet in this review.

DropBit Wallet key features

Mobile-only wallet: DropBit is a mobile-only wallet. It is only accessible via mobile phones. You can download this crypto vault app on the official Coinninja website, Google Play Store, or Apple app store.

Integrates Lightning network: Though the wallet was initially designed to facilitate Bitcoin blockchain transactions, it recently integrated the Lighting network that champions ultra-fast crypto transfers. However, note that you will have to create an account on the lighting network and fund it if you wish to enjoy instantaneous bitcoin transfers. Plus, the account for the Lightning network, unlike the Dropbit user account, is custodial.

Integrates the phone’s address book: Dropbit doesn’t just make sending cryptocurrencies as easy as sending an SMS or posting on twitter. It also makes it possible to send cryptos to mobile numbers and twitter handles. The recipient doesn’t even need to have a crypto wallet. Since the wallet can be integrated with your phone contacts and twitter portfolio, you only have to select their phone number or twitter handle. Dropbit will send them a message asking them to download the app to receive the coins. If they download and install the wallet within 24 hours, you will get a notification asking you to complete the transfer.

Fee-free transactions: You only have to pay transaction fees for the outbound crypto transfers that were verified and confirmed on the Bitcoin blockchain. The transactions conducted on the ultra-fast lightning network are free.

Tracks your crypto portfolio: The Dropbit wallet dashboard features the balance and history tabs. The balance tab lets you monitor your crypto balances for all the wallet addresses hosted on Dropbit in real-time while the history tab outlines your crypto inflows and outflows for a given period. Both play a key role in helping you make sound financial decisions.

Dropbit Wallet security features

Password + encryption: The DropBit wallet app is secured by a multi-character password that not only helps you secure the app but also helps serve as an encryption tool.

Recovery seed: Dropbit will also provide you with a wallet backup and recovery option. When creating a user account, the wallet provides you with 12 random phrases (the recovery seed) that you can use to restore the wallet and private keys on another mobile device.

Hierarchically deterministic: Dropbit is privacy-conscious. For every new transaction initiated on the platform, Dropbit auto-generates a hierarchically deterministic wallet address, making it impossible for other individuals to track your wallet address and view your past crypto transactions.

Open source: DropBit wallet is also built on an open-sourced technology. Anyone, including its users and blockchain experts, can view and scan the wallet for malicious codes or security loopholes.

Non-custodial: Ideally, DropBit doesn’t store any of your personal information – private keys included – in its servers.

User anonymity: Even though DropBit wallet makes it possible for you to integrate your phone contacts and twitter profile, it doesn’t record or store any of the information contained here on its servers. It also allows for anonymous user registration and anonymous trading.

How to set and activate the DropBit wallet

Step 1: Start by downloading the Dropbit wallet app on the Coinninja website or your phone’s play/app store.

Step 2: Install and launch the app.

Step 3: Since you are using Dropbit for the first time, click on the “Create New Wallet” tab

Step 4: Create a password for the wallet

Step 5: Dropbit Wallet will then provide you with the mnemonic phrase, write it down on a piece of paper and save it offline

Step 6: The wallet is now active and ready to use

How to add/receive crypto into your DropBit wallet

Step 1: Log in to the Dropbit wallet and click on the “receive” icon.

Step 2: On the deposit window displaying your public address and QR code, copy either, and send it to the individual sending you coins.

Step 3: Wait for the Bitcoins to reflect on your Dropbit wallet.

How to send crypto from your DropBit wallet

Step 1: Log in to the Dropbit wallet and tap on the “send” icon

Step 2: On the transfer window, choose to either send to a contact address, a twitter handle or simply key in the recipient’s wallet address

Step 3: Enter the number of coins you wish to send

Step 4: Check the accuracy of these transaction details and hit send

DropBit wallet ease of use

Dropbit is an easy-to-use bitcoin-only wallet. It has eliminated all the complexities surrounding the process of installing a crypto wallet. It has also made sending cryptos to your phone contacts and social media acquaintances quite easy.

It also features a clean and easily navigable user interface that appeals to the newbie crypto traders and experienced investors.

DropBit wallet supported currencies.

Dropbit is a Bitcoin-only crypto wallet that will only host Bitcoins on the wallet.

DropBit wallet cost and fees

DropBit is a free wallet to the extent that downloading the crypto vault, creating a user account, and storing coins therein is fee-free. Network fees that are collected by the Bitcoin blockchain miners, however, apply when you send Bitcoins to another wallet or exchange.

What are the pros and cons of using the DropBit wallet?

Pros:

  • Dropbit wallet maintains an easy to use and beginner-friendly interface
  • It integrates the lightening network that provides ultra-fast crypto transfers
  • Dropbit promotes user privacy as it is non-custodial and its servers don’t access your private information
  • It introduces a unique method of sending and receiving crypto via SMS and Twitter

Cons:

  • Its anonymous trading feature is limited as you will need to verify your phone number if you want to send crypto via SMS and twitter
  • Dropbit is dogged by numerous unsolved customer complaints on their Google Play Store page
  • It has a sluggish and unresponsive customer support team

Comparing DropBit wallet with other Bitcoin-only wallets

DropBit wallet vs. Bitcoin Core

Dropbit and Bitcoin Core are similar in that they are both Bitcoin-only crypto wallets. They also share a common commitment to privacy and transparency. That is, they both are non-custodial wallets. They are also open-sourced, allowing for regular vetting and auditing by both the wallet users and blockchain experts.

But while Dropbit is a mobile-only wallet app, Bitcoin Core is a full-stack desktop client that synchronizes the wallet activities with the blockchain network in real-time. One may also consider Bitcoin Core safer and less controversial. Dropbit wallet app nevertheless carries the day when it comes to the ease of use and user-friendliness.

Verdict: Is DropBit wallet safe?

Dropbit wallet app has placed several premium safety and privacy measures, including hierarchically deterministic wallets, anonymous registration and trading, non-custodial wallets, password encryption, and recovery seed. The effectiveness of these security and privacy measures has, however, been dwarfed by the constant controversies surrounding the wallet.

First is the mountain of unanswered user complaints about the app’s ineffectiveness, missing cryptocurrencies, and a non-existent customer support team. Just recently, Dropbit founder and CEO – Larry Harmon – was arrested and charged with using the Bitcoin wallet for money laundering. These incidences have significantly injured Dropbit’s reputation and put a dent on its reliability. On Google Play Store, for instance, the app has a 2.6-star rating. 

Categories
Crypto Videos

What Are The Key Components of DeFi?


Key Components of DeFi

The crypto and DeFi sectors are growing exponentially, and there are currently more DeFi apps than ever. These projects are already saving businesses and customers both time and money. In fact, DeFi platforms started to emerge across nearly every branch of the financial sector. As the DeFi sector expands, it is important to understand what characteristics all DeFi applications have in common, and what they offer.

Open-Source

DeFi applications have to be open-source, or they are not truly decentralized. Open source coding means that the project’s code is made public. By being open-source, these apps can be audited it and its functionalities, security, and capabilities validated. Open-source codes are more stable and secure than fully-private codes simply because of community interaction. Additionally, being open-source provides more confidence in the platform as users can rest assured that no malicious coding is hidden in the background.

Transparent

DeFi projects provide the world with new levels of transparency. As most DeFi apps operate on public blockchains such as Ethereum, all transactions are fully available on the public ledger. As a matter of fact, all activity on the blockchain is completely public. The main difference in this approach vs. a traditional bank account is that the accounts are not bound to anyone directly. Instead, user accounts are pseudo-anonymous and list only a numerical address rather than show identity.

Global

While this characteristic is not only bound to Dapps, it is an extremely important one. Anyone can participate in DeFi platforms from anywhere across the globe. All you need is a smartphone with internet access.
Consequently, DeFi Dapps have the ability to solve the problem of certain areas being unbanked or underbanked, as they can bring them the financial services they are looking for. This openness is a major upgrade from the current banking system, which leaves around 40% of the population without any form of banking.

Permissionless

The DeFi sector operates without gatekeepers. As such, anyone can create a DeFi application and offer it to the world. On top of that, anyone can participate in DeFi apps without any concern for approval. This strategy is a massive change from the current financial system that requires every single potential user to be a part of many regulatory verification systems before even participating in the global economy.

Interoperable

Another trait of the DeFi space is interoperability. Interoperability is critical as it ensures that, as more developers enter the space, all the previous work is not suddenly lost. Instead, users can stack their own DeFi products to expand exposure. As an example, it’s common for a single user to utilize stablecoins, decentralized exchanges, as well as wallets. This strategy is only possible due to the seamless integration that DeFi applications possess.

Flexibility

Due to the open nature that DeFi provides, developers are able to exercise way more flexibility in their platforms than they ever could. Users gain considerable options by integrating third-party application integrations as well. If the current options are insufficient, users can even choose to build their own interfaces.
Check out the next video in our DeFi series, where we will show examples on how DeFi is used.

Categories
Forex Videos

FOREX – Fundamental Analysis for Novices – US JOLTS Job Openings!


Fundamental Analysis for Novices: US JOLTS Job Openings


Thank you for joining the fundamental analysis for novices’ educational video. In this session will be looking at United States JOLTS job openings. Jolts defines job openings as all the positions that are opened on the last business day of the month. The criterium is that a specific position exists and that there is work available for that position.


If it’s the first time that you have seen one of our fundamental analysis videos for novices, we strongly recommend that you use an economic calendar every day if you are not already doing so. An economic calendar should act as your Bible in order to trade around it while avoiding high impact news data releases which may have a negative impact on your trades.


The key components of any economic calendar are the time of the release, the day and date, the type of event, and the impact that any such data release will likely have on the market, which is typically low, medium, and high. And where we can see an impact bar here displaying various levels of impact from low, which is in light orange, to medium shown in a darker orange and taking up a third of the box, to the full red impact box, which means that any data release is likely to cause extra volatility on its release.
Most economic calendars will also show you the previous period’s data release, which might be weekly monthly, quarterly, or annually, and also a general consensus of where market analysts believe the data statistics will be upon its release. And then we have the actual release data, which will be populated upon the release of the data. Most brokers will provide this information almost instantaneously to help your trading decision making.


Here we can see an example of the US JOLTS job openings for June 2020, which was released on Monday the 10th of August and came out at 3 p.m. BST and we can see the various data details including May’s release, the forecast or consensus, and the actual number of 5.89 million, which was higher than the consensus and higher than the previous for May.
Although the impact bar for this particular news release was set at low, because of the implications of the virus fallout, especially within the United States, which has suffered a huge economic collapse and massive unemployment, the market will be looking for any signs that jobs are rebounding, and this is a positive sign that job openings are appearing on the market.
This means that United States companies are confidence that they are recovering from the pandemic and that they are growing to a certain extent and need extra labour manpower to fill those vacancies which have been created within those organisations.

Typically, any increase in job openings is good for the United States economy, and therefore you might expect that United States stock indices to increase and where this is also good for the US dollar. However, when we see that job openings are lower, this would be bad for the United States economy and also bad for the US stock markets and the United States dollar.

Therefore, in these unprecedented times, we should not take for granted even US data releases, or from any economy, such low-impact status data, which at any normal time in history be met by a neutered response from the marketplace. Sometimes even low impact releases can cause extra volatility, and you should bear that in mind, especially until such time as the pandemic as gone away and things returned to some kind of normality.

Categories
Cryptocurrencies

Best Blockchain Affiliate Programs

Affiliate programs allow you to earn by simply referring friends to a product. Since they are commission-based, the more friends you introduce to the product, the more you earn. While it is a legitimate way of earning, many people do not trust affiliate programs due to how complex some are. Others fear them because they might sound a lot like pyramid schemes. 

Blockchain or cryptocurrency affiliate programs pay you for referring customers to them. This is an unregulated industry, and a company may run the program however it wishes, but of course, within wider legal limits of its jurisdiction.

Nevertheless, several platforms pay exceptionally well, and they are the focus of this article.

Before looking at the top-paying platforms, let’s first see how these programs work. 

  • You first register on a cryptocurrency website that offers a referral program. Most of them are crypto exchanges, but it could be any company that sells crypto assets.
  • You get a unique referral link or code.
  • You share the link or code on any platform on the web. Links are easier to work with as they take your targets straight to the company’s website.
  • Someone sees your link and clicks on it. If they follow through to using the company’s services, you earn a commission.

Top Paying Affiliate Programs

#1 Coinbase

Coinbase is the largest US-based crypto exchange. If you are a merchant who accepts cryptocurrencies, Coinbase can also help you with the collections. 

Their affiliate program pays you 50% of trading fees raked from your referrals for three months. Payments are made daily, and there is no minimum earning requirement for payouts. This means that you can opt-out of the program anytime without forfeiting your earnings, however little. You can also check on reports for your referrals if you need to follow their use of the platform closely. 

#2. LocalBitcoins.com

LocalBitcoins.com is a peer-to-peer cryptocurrency trading platform – you can buy and sell Bitcoins directly from other platform users. 

You get a 20% commission on the trading fees earned from each trade made by your referrals on this program. Since the website charges 1% of the transaction value, you can expect to earn 0.2% of whatever your referral buys or sells through the website. Like Coinbase, you keep earning for up to 3 months starting from the day your referral joins the platform. There’s also no minimum earnings required for your payment to be processed. 

#3. Bitbond

Bitbond is a platform that facilitates the issuance, settlement, and custody of bonds but using the blockchain. The company makes money when financial institutions use their platforms to issue or settle bonds. 

For every transaction your referral makes, you earn up to 30% of the origination fee for two years. Two years may seem like a long duration, but remember, bonds are settled only once in a long while, maybe even annually. Nonetheless, settlements typically involve large sums, and 30% is more than a decent commission. Partial reports on your referrals are also available. 

#4. Paxful

Paxful allows individuals to buy and sell Bitcoins from each other, from which they charge commissions. 

Their affiliate program has among the highest rates in this sector – for direct affiliates, they pay you half of the commissions charged on their transactions. For affiliates recruited by your affiliates, you earn 10% of the commission charged on their transactions. Payouts are instant, and there are no minimum earnings required for you to receive your payment. The only downside with Paxful is you only get partial referral reports, and transfers to your Bitcoin wallet are manual.

#5. Coinmama

Coinmama is another platform that allows people to buy and sell cryptocurrencies and pay using cards, Apple Pay, and other options. It is also available in 188 countries – that covers almost the entire globe.

Coinmama runs an affiliate program that pays out a 15% commission on all purchases made by your referrals. The best part is that you will earn from your referrals for the rest of your life. This program can be lucrative if your referrals are stable businesses, likely to keep buying and selling cryptocurrencies even in the future.

Coinmama payouts are done monthly, but there are no minimum earnings required to process your payments. You also need to manually initiate payments transfer to your crypto wallet. Reports on your referrals are available. 

#6. Trezor

Trezor is known as one of the most secure crypto-wallets. The company develops and sells hardware wallets, which they sell through their official website. If you refer a friend to purchase a Trezor, you can earn between 12 and 15 percent of the sale value. Trezors go for around $170 and $270, so you can do the math. 

Commissions are earned once per transaction. You need to accumulate at least 0.1 BTC to transfer your earnings to your wallet, but the earnings are automatically transferred to your wallet.

#7. Bitpanda

Bitpanda is a retail broker for major cryptocurrencies. It allows users to buy and sell various digital assets using multiple payment methods. However, it only targets European customers. 

The company operates an attractive affiliate program where subscribers earn up to 20% of commissions charged from their affiliates’ transactions. What makes this program attractive is that you will keep earning commissions for as long as your referrals transact through the platform. Instant payouts and no minimum balances mean you can withdraw your earnings anytime, although you need to transfer earnings to your wallet manually. You can also get partial reports on your referrals. 

#8. Coinhouse

Coinhouse is a French-based crypto exchange. It allows users across Europe to easily buy and sell cryptocurrencies.

The platform’s affiliate program has among the most lucrative earnings – 30% for life. In other words, users will earn 30% of transaction fees from their referrals’ purchases for the rest of their existence. Payouts are done weekly, but there are no minimum balance requirements. Partial reports are available, and earnings are automatically transferred to your crypto wallet.

Final Thoughts

These are just a sample of the top-paying cryptocurrency affiliate programs. As we have seen, they offer between 10 and 50 percent revenue share from referrals’ commissions. Also, some programs have one-time payouts, while for others, payouts last a lifetime. All in all, these marketing programs change from time to time, and it’s only clever to look out for new offerings.

Categories
Crypto Videos

What Is DeFi Used For?


What is DeFi used for?

The Decentralised finance sector has been flourishing in the past few months, with more and more interest coming both from the side of retail and institutional investors. However, the current system isn’t exactly clear on what DeFi actually brings to the table. This video will hopefully bring a bit more clarity on how DeFi works.

DeFi in Lending

One of the sectors affected the most by the introduction of DeFi is certainly the lending sector. If you have ever applied for any type of loan, you surely know the process is both intense time-consuming. Worst of all, you are forced to use lending companies specifically designed to maximize their returns. On the other hand, the DeFi community produced some interesting ways to improve this sector.

Compound

A good example of a DeFi lending platform is Compound. The Compound platform showcases the true power of DeFi and its ability to transform how the world envisions the financial market in the future. Compound allows users to lend their cryptocurrencies out to other users. In exchange for providing the loan, these users receive interest in the form of cryptocurrency. The platform utilizes smart contracts that match lenders and borrowers. Additionally, these smart contracts make interest adjustments based on the market’s current state automatically.

Decentralized Exchanges

Many consider decentralized exchanges (DEX’s for short) as the logical next step in the evolution of the crypto exchange sector. DEX’s are peer-to-peer trading platforms that provide users with a more streamlined UX, tighter security, as well as more flexibility. Traditional exchanges operate via a centralized organization that monitors, facilitates, and approves all trades within the platform, which defeats the purpose of cryptocurrencies. On top of that, users of centralized exchanges are vulnerable to attacks and hacks, as history has shown us. There were numerous occurrences of exchange hacks in which the central organization, as well as its users, suffered huge losses.
DEX’s eliminate many of these concerns. The platform doesn’t include the assets directly, but rather via a smart contract. This way, there is no “weak spot” that a hacker could exploit.

Uniswap

We will use the Uniswap platform as our example of a decentralized exchange. It introduced an innovative mechanism now known as Automated Market Making. This new protocol enables near-instant settlement between different parties. The protocol will try to close trades as close as possible to the current market value.

DeFi Prediction Platforms

Another interesting development in the DeFi sector is the creation of prediction platforms. These platforms are used to analyze the current public opinion regarding a certain event.
Guesser
One good example of this type of decentralized application is Guesser, as it allows you to make various predictions and examine other people’s results in the pool. You even earn crypto for participation by being right with your prediction.

DeFi is Here to Stay

As the main systems of our society are currently undergoing a transformation towards decentralization, the demand for DeFi applications will rise. These new applications continue to disrupt the financial space in remarkable ways.
Decentralized applications are certainly something that is able to set the new standard for the worldwide economy moving forward.

Categories
Forex Assets

Everything About Trading The CAD/SGD Forex Currency Pair

Introduction

CAD/SGD is a Forex exotic currency pair where CAD represents the Canadian Dollar and the SGD, – the Singapore Dollar. For this pair, the CAD is the base currency, and the SGD is the quote currency. Therefore, the price attached to the pair is the quantity of the SGD that can be bought by 1 CAD. If the price of the CAD/SGD pair is 1.0289, it means that 1 CAD dollar buys for 1.0289 SGD.

CAD/SGD Specification

Spread

In forex trading, the difference in pips between the buying price (bid) and selling price (ask) is the spread. Forex brokers primarily generate their revenues through the spread. The spread varies depending on the type of trading account. The spread for the CAD/SGD pair is:

ECN: 7 pips | STP: 12 pips

Fees

For every individual trade made on an ECN account, one has to pay a commission. This fee varies with the broker and depends on the type of trade executed and the currency being traded. STP accounts do not have fees.

Slippage

In forex trading, slippage is the difference in the price in which a trader initiates a trade and the price at which it is executed. Slippage is a direct result of the brokers’ speed of execution and market volatility.

Trading Range in the CAD/SGD Pair

In forex, the trading range shows the fluctuation of a currency pair within s specific timeframe. The trading range is useful to estimate potential profit or loss from trading different timeframes. For example, if the CAD/SGD pair fluctuates ten pips in the 2-hour timeframe, it means that a trader can expect to either gain or lose $97 by trading one standard lot.

Below is a table showing the minimum, average, and maximum volatility of CAD/SGD across different timeframes.

The Procedure to assess Pip Ranges

  1. Add the ATR indicator to your chart
  2. Set the period to 1
  3. Add a 200-period SMA to this indicator
  4. Shrink the chart so you can determine a larger period
  5. Select your desired timeframe
  6. Measure the floor level and set this value as the min
  7. Measure the level of the 200-period SMA and set this as the average
  8. Measure the peak levels and set this as Max.

CAD/SGD Cost as a Percentage of the Trading Range

Cost expressed as the Percentage of the trading range helps a forex trader establish the anticipated trading costs under different market volatility across different timeframes.

Total cost = Slippage + Spread + Trading Fee

The tables below show the percentage costs to be expected when trading the CAD/SGD pair. The costs are expressed as a percentage of pips.

ECN Model Account

Spread = 7 | Slippage = 2 | Trading fee = 1

Total cost = 10

STP Model Account

Spread = 12 | Slippage = 2 | Trading fee = 0

Total cost = 14

The Ideal Timeframe to Trade CAD/SGD

We can see that in both the ECN and the STP accounts, costs are higher when volatility is at a minimum across all timeframes. Furthermore, we can observe that these costs tend to reduce when the volatility increases to the maximum.

For the CAD/SGD pair, costs are highest when volatility is at the lowest at 0.02 pips during the 1-hour timeframe. Conversely, the trading costs are lowest at the 1-month timeframe when volatility is at a maximum of 8.7 pips. Since high volatility can be risky and low volatility less profitable, forex traders should consider trading during times of average volatility.

More so, traders can increase their profitability by eliminating the costs associated with slippage. By using limit instead of market orders, forex traders can avoid experiencing slippage when entering and exiting positions.

Let’s have a look at how zero slippage cost affects the total costs.

ECN Account Using Limit Model Account

Total cost = Slippage + Spread + Trading fee

= 0 + 7 + 1 = 8

Notice that using the limit order type reduces the overall costs. The highest cost, for example, has reduced from 169.49% to 135.59%.

Categories
Forex Basic Strategies

Filtering The Most Profitable Trading Signals Using The ‘Zig-Zag’ Forex Trading Strategy

Introduction

In today’s article, we discuss a strategy that is based on the unfamous zig-zag indicator. The zig-zag indicator serves to shows changes and continuation in trends that occur in price movements. Usually, this indicator is used by traders to look for reversal points in the market. But in today’s strategy, we will use the zig-zag indicator to trade the continuation of a trend. However, if we think a little deep, this type of trading is also a form of ‘reversal trading’ where we will be finding the reversal points in a smaller trend within the larger trend.

At first glance, the indicator appears very simple but is not easy to understand by novice traders. The trading strategy that uses this indicator is not special because it uses this indicator, but since we are imparting various other concepts of technical analysis such as chart patterns, trend lines, and price action. But using this indicator alone too can generate good trading signals provided the trader is having good skill of this indicator properly.

Time Frame

The ‘zig-zag’ strategy can only be applied to the ‘Daily’ time frame. Hence, this strategy is not for intraday and short-term traders. We need to have a longer time horizon to trade using this strategy.

Indicators

We use two technical indicators in this strategy

  • Simple Moving Average (20-period)
  • Zig-Zag (default setting)

Currency Pairs

We can apply the following strategy on both minor and major currency pairs. Liquidity and volatility will not be a major issue here as we are trading on higher time frames.

Strategy Concept

We are basically using the zig-zag indicator to identify classic chart patterns of technical analysis and trade them. The indicator is very effective in reducing the noise by helping the technical trader in viewing the larger picture and general market direction. Here, we look for appropriate chart patterns and associated price action indications within the context of a trend.

When these patterns are formed just anywhere on the chart, they do not hold much value as there is no logic to that. Once we identify a trend using the simple moving average (SMA), we wait for trend continuation signs provided to us by the zig-zag indicator and the chart pattern. The formation of the chart pattern is the first sign of trend continuation. Once price action develops and the market moves in the direction of the major trend, we look for ‘entry’ signals and then only enter into a trade.

One of the astounding features of this strategy is it’s risk-to-reward (RR) ratio. Trades executed this strategy have high risk-to-reward (RR) because we are trading with the major trend and the need for a smaller stop-loss. Not only is ‘RR’ of trades high, but also the probability of winning is much higher in this strategy due to stricter rules and time given for a trade setup to be formed. Now that we got a gist of the strategy, let us find out the actions required to execute the strategy.

Trade Setup

In order to execute the strategy, we have considered the ‘Daily’ chart of the USD/JPY currency pair, where we will be illustrating a ‘short’ trade. Here are the steps to execute the strategy.

Step 1: Firstly, we have to identify the trend of the market on the ‘Daily’ chart. This can easily be done with the help of the simple moving average (SMA) indicator. If the price stays below the SMA for a long period of time, we say that the market is in a downtrend. And if it remains above the SMA for a sufficient period of time, we say that the market is in an uptrend. It is worthwhile to note that zig-zag is not being used for establishing the trend.

The below image shows that the market is in a strong downtrend in the case of USD/JPY.

Step 2: After identifying the trend of the market, we wait for the market to form a ‘head and shoulders’ pattern in a down-trending market and an ‘inverse head and shoulders’ pattern in an up-trending market. Here’s where the application of the zig-zag indicator comes into the picture. The chart pattern should essentially be indicated by the zig-zag pattern—the lines of indicator show the ‘real’ formation of the pattern in the market. In addition to this, we plot a trendline that connects the ‘lows’ (head and shoulders) or ‘highs’ (inverse head and shoulders) of the pattern as indicated by the indicator. This completes the execution of 80% of the strategy’s rules.

Step 3: We enter the market for a ‘buy’ or ‘sell’ after the price breaks the trendline and ‘tests’ it on the other side. In simple words, in a ‘head and shoulders’ pattern, we enter for a ‘sell’ when price breaks the ‘support’ trendline and re-tests after making a ‘lower low.’ While in an ‘inverse head and shoulders pattern,’ we enter for a ‘buy’ when price breaks the ‘resistance’ trendline and re-tests after making a ‘higher high.’

The below image shows how a ‘short’ entry is taken.

Step 4: Now, let us determine the stop-loss and take-profit levels for the strategy. When ‘short,’ we place a stop-loss above the right shoulder of the ‘head-and-shoulder’ pattern. Similarly, when ‘long, stop-loss is placed below the right shoulder of the ‘inverse head-and-shoulder’ pattern. Take-profit will be set at the ‘lower low ‘of the major downtrend and at the ‘higher high’ of the major uptrend. The risk-to-reward (RR) of trades executed using this strategy will be at least 1:1.5.

The below image shows the result of sample trade executed using the zig-zag strategy.

Strategy Roundup

Even though the above strategy takes a lot of time to present a potential trade, the risk-to-reward and probability of winning of these trades are worth waiting for. There are many applications of the zig-zag indicators. Traders make use of other technical indicators like the Stochastic Oscillator and Relative Strength Index (RSI) together with the zig-zag indicator to locate the overbought and oversold conditions of the market.

Categories
Crypto Daily Topic Cryptocurrencies

The FIO Protocol: A Beginners Guide

Everyone who has interacted with crypto one way or another knows how daunting it can be – especially if they’re just beginning. This is due to the complexity of crypto transactions and the knowledge that your funds could be gone forever with a tiny mistake. 

What if there was a seamless way that you could operate your account? What if you could interact with crypto using an everyday name instead of an intimidating public address? 

Launched in April this year, FIO protocol (Foundation for Interwallet Interoperability) is an initiative that wants to make this possible. FIO says it wants to “make crypto products easier so anyone can use them.” It’s a platform that integrates exchanges, wallets, and more so people can have a better experience dealing with cryptocurrency. The FIO team believes the blockchain-based value wave is the inevitable future, and that “the masses are coming and we owe it to them to give them the experience they deserve.” 

In this article, we’ll examine the FIO protocol from a closer vantage point. We’ll also look at the utility token of the protocol and what role it plays. 

What Problem is FIO Hoping to Solve?

FIO’s vision for the blockchain space is based on actual research. The team conducted a survey in 2018 to establish the challenges that crypto users face – whether just operating their own account or sending money to others. They were then able to come up with the following feedback: 

  1. Almost every user finds using public addresses such a hassle
  2. Almost 75% of users are uncomfortable or less than confident when sending crypto
  3. Nearly 1 in five users has conducted a failed transaction or one that led to the loss of funds 
  4. 1 in 20 people has witnessed an attempted man-in-the-middle attack on their public address

The team then concluded that interacting with crypto generally is pretty stressful and requires a user to be extremely vigilant. 

What are the Goals of the FIO Protocol? 

The FIO team wants to create a better way for people everywhere to interact better with blockchain assets. This way encompasses several features, which are: 

  • Human-meaningful – enable users to interact with crypto using identifiers that are easy to understand and remember, e.g., “tom@trustwallet” or “alice@bitcoin” 
  • Decentralized – supported by a public blockchain that doesn’t rely on a centralized entity or third parties
  • Secure – FIO transactions are conducted securely since they require an FIO non-custodial private key
  • Private – sensitive information like transactions’ metadata and public addresses is cryptographically encrypted on the blockchain
  • Interoperable – the FIO platform is capable of working with any blockchain crypto network once it’s integrated with any wallet
  • eCommerce ready – the FIO protocol enables fast, safe, wallet-to-wallet and immutable payments with all metadata kept private

Features of FIO

The FIO protocol can support a variety of features – which we’ll look at below. 

i) FIO Addresses – intelligible wallet identifiers such as tom@trustwallet” and “alice@bitcoin,” which are more friendly to use. With the addresses, users will not come across public addresses. The icing on the cake? The addresses can support any crypto in any wallet or exchange.  

ii) FIO Requests – a functionality that allows users to request funds from any wallet via simple approvals. The requests are cryptographically secured and are only seen by the involved parties. FIO requests will not interfere with underlying blockchain transactions in any way

iii) FIO Data – this is encrypted metadata that can accompany transferred funds in transactions

These are just the current features of FIO. The network hopes to add more in the near future.

Technical Makeup of FIO

The FIO protocol utilizes delegated proof of stake (DPoS) for network consensus. Token holders are responsible for choosing block producers (BPs). Anyone can sign up to be a BP if they can garner enough votes. Every voting round is known as an epoch, and it involves the generation of 126 blocks. The BP selection process is repeated after every epoch – which involves 42 BPs – half active and a half on standby. 

After each block is produced and recorded on the chain, the network mints new rewards. 40% of the reward is equally shared among the 21 active BPs, while 60% goes to all 42 BPs in a manner proportionate to the number of votes each BP received. 

Additionally, BPs can change system settings if they have two thirds plus one (at least 15) majority. 

How Do You Use the FIO Protocol? 

As of now, the FIO protocol supports wallets, exchanges, and payment processors. The team is also planning to develop a suite of software development kits and APIs for developers that desire to use them. 

Now for the everyday user – using FIO is so simple. You just need to register an FIO address and immediately access loads of FIO capabilities. 

The FIO Token 

FIO token is the utility token of the FIO platform. It will be used as payment for transactions done on-chain. Other uses include fees for registering addresses and staking so as to vote for block producers. To hold FIO tokens, all you need is a pair of private/public keys. Transfers can be done through an FIO public key – which means one can hold FIO tokens without relying on a complex process. 

The team envisages demand for FIO arising from:

  • Platform users needing the token to register for addresses and other fees
  • Users needing to stake in the token so as to vote on on-chain governance and block producers
  • The possibility for some entities such as wallets and exchanges compensating users who have staked in the token 
  • Future software upgrades that will create more demand for the protocol and with it, the token

How Was FIO Distributed?

  • 16.42% went to equity investors
  • 0.04% went to the first private sale
  • 0.04% went to a second private sale
  • 1.33% went to the third private sale
  • 17.53% went to the team
  • 22.01% went to the FIO Foundation
  • 0.32% went to the foundation service provider
  • 3.59% went to the future token sales reserve
  • 12.5% went to the bounty program
  • 11.39% went to Integration Incentives
  • 12.5% went to the FIO address giveaway
  • 1% went to block producer incentives
  • 0.28% went to the airdrop program

Tokenomics of FIO

FIO traded at $0.162027 on September 14, 2020. It ranked at #402, with a market cap of 14.6 million, a 24-hour volume of $1,520,360, and a circulating and total supply of 90,017,353 and 714,376,155 respectively. FIO has a maximum supply of 1 billion. Its all-time was $0.425260 (July 31, 2020), while its all-time low was $0.083187 (July 19, 2020). 

Where to Buy FIO

The FIO token can be bought/exchanged at a variety of exchanges, which include Binance, BitMax, BitHumb, HotBit, Binance.KR and Hoo. 

Closing Thoughts

FIO might just deliver the most important of all crypto initiatives: making it extremely easy to send and receive crypto. Interacting with crypto may sound like a walkover, but the story is starkly different for many users. FIO’s solution is simple yet potentially revolutionary. For us here, it will be thrilling to watch the project evolve. 

Categories
Cryptocurrencies

What’s WINk (WIN) All About? 

Gaming has been a favorite pastime for millions of people across the world. And with the blockchain, online gamers are set for an even more phenomenal experience – honest payouts, transparency, cryptographically-secured infrastructure, and more. 

Multiple blockchain-based gaming platforms have emerged in recent years, seeking to offer gamers a fundamentally different experience. WINk (formerly TRONbet), a project based on the Tron blockchain, is one such platform. 

The WINk team has created an entire ecosystem to provide users with high-level gaming experiences. On the platform, developers can also build decentralized applications (DApps) with a raft of available tools.

In this article, we’ll explore the WINk platform as well as its utility token, WIN. 

How WINk Works, and Participants 

#1. Developers 

WINk features a set of development tools for developers to create high-performance DApps while the network handles the rest. Developers then pay a small fee out of their DApp income back to the system. 

#2. Community

These are users of the platform. The more a user plays, the more tokens they can earn. Users can choose their favorite DApps and stay loyal to them in exchange for rewards, promotions, and special access.

#3. Token HODLers 

Token holders are the backbone of the WINk network. DApps on the platform will share their wins with WIN holders through the “WinDrop” program, whereby users are incentivized through TRX tokens. The amount of TRX tokens awarded to a user depends on how much Win Power they hold. 

The WINk Ecosystem

The WINk team believes the future of blockchain is made of decentralized autonomous organizations (DAOs), cryptographic voting systems, and up-to-date collaboration interfaces. This is a responsibility that WINk intends to tackle head-on by providing high-performance DApp creation tools. 

On the platform, users can choose the most premium games, with the certainty that their money is safe in a rigorously tested environment. The user community will be actively involved in projects and have a say on what updates to be made. 

With that, the WINk ecosystem will support the following features.

#1. Developer Portal

WINk will enable the latest software development kits, application programming interfaces, and the latest technology to seamlessly connect everything. This photo will also feature tools for developers to use the blockchain, join mining pools, use social tools, and more. With these, both experienced and beginner developers can enjoy the creative process – for the benefit of the whole network. 

#2. DApp Store

The DApp store is where developers will deploy their DApps distribution. If a DApp passes the approval, it will be listed in the store. The editorial team at WINk will also review DApps and provide feedback to users from time to time. 

Developers can also pay for ads on the DApps to attract new users to their games. Part of the payment will go to WIN holders based on how much Win Power they have. 

#3. Payment Services

Developers can deploy WINk’s payment service into their applications, making for easy and frictionless payments. And users can make payments with crypto, as well as with their credit and debit cards. They can also withdraw their crypto to Fiat money at any time. 

#4. Wallet 

The WINk team will create first-class wallet services that are optimized for the WINk ecosystem and community. There’s also plans to expand access for the platform so that any crypto holder, no matter which crypto it is, can take part in the ecosystem. 

#5. Regulatory Compliance

The WINk team will play by the regulations for different jurisdictions and obtain the requisite licenses to operate in these jurisdictions. This is geared towards preventing the platform from being shut down by authorities and so that the platform continues to provide value to gaming fans all over the world. 

Some of WINk’s Key Products

As a gaming platform, WINK has already on-boarded a variety of super fun products for users. Some of these include the following: 

#1. Dice 

Dice fans can be assured of a good time on the WINk platform. The game was the platform’s flagship product when it started in 2018. 

#2. Moon

Care to experience some of that exhilaration of the crypto market? Then Moon is the game for you. You get paid by a multiplier that begins at 1x and can go all the way to 250x. The multiplier increases slowly but can come crashing down to the lows of zero at any point. You can cash out at any multiplier level, depending on your appetite risk.

#3. Ring and Duel 

This game lets you “cross your fingers and go for the gold.” The game is pretty simple, but you stand a chance to reap a 50x payday. The game involves choosing which color you think the wheel will land on. Grey rewards you two times the wager, red three times, blue five times, and gold 50 times. 

#4. Slots

WINk has teamed up with first-rate slots machine developers to give users a genuine casino experience. Games like Bison Trail are a ubiquitous feature in the casino world, and now you can enjoy it, together with over 30 more slot games. 

#5. Table Games 

If you’re a table game fan, you find all your favorites, including sic bo, blackjack, roulette, baccarat, and Russian poker. 

#6. Poker 

WINk also features poker, and the platform helps to add more exciting features like tournaments to its already vibrant poker atmosphere. WINk hopes to become the go-to blockchain poker hub, injecting decentralization, transparency, and affordability to the game. 

#7. Hyper snakes 

Developed by MixMarvel, the acclaimed creator of Hyper dragons, Hyper snakes is a thrilling and competitive game that allows you to win crypto just for participating. You can also stake TRX and gain access to compete for massive prizes. The Hyper snakes game’s mechanics go like this: control your avatar, connect dots to become the biggest snake in the arena, and defeat other snakes to walk away alive – but only if you’re good enough. 

The WINk Token 

WIN is the native cryptocurrency of the WINk platform. It’s based on Tron’s blockchain, which the team picked due to its high scalability and free transactions. WIN holders are the core users of the platform and are rewarded for their support of the token. The token has the following uses: 

  •  As a staking and governance mechanism
  • When users HODL WIN, they help preserve resources by decreasing the cost of transactions
  • Much like in gaming establishments in the real world, WIN token holders will gain access to exclusive experiences and treats
  • WIN holders will get the benefit of gameplay discounts in various forms

WIN’s Distribution

WIN’s distribution was done in the following fashion: 

  • 3.75% to the project’s reserve account
  • 5% to the launchpad sale
  • 7% to future platform development
  • 9% to gaming partnerships
  • 6.25% to strategic partnerships
  • 5% to the airdrop program
  • 12% to the initial community
  • 15% to the seed sale
  • 10% to the team
  • 27% to the ecosystem reserve

Tokenomics of WIN

As of September 2020, WIN traded at $0.000106, with a market cap of $33,356,866 that placed it at #187 in market rank. The token’s 24-hour volume was $2,628,280, its circulating supply was 313,607,571,387, and its total supply was 999 billion. WIN’s all-time high and all-time low was $0. 000472 (Aug 01, 2019) and $0.000041 (March 13, 2020) respectively. 

Buying and Storing WIN 

You can find WIN tokens in a variety of reputable exchanges, including Binance, Poloniex, PoloniDEX, DigiFinex, BitHumb, DragonEX, KuCoin, JustSwap, HitBTC, and more. The token can be found paired with USDT, TRX, and BNB. 

WIN is based on Tron, meaning it can be stored on any wallet that supports TRX. Examples include TronLink, imToken, Trust Wallet, Ledger, Huobi, and Cobo Wallet. 

Final Thoughts

Gaming fans are guaranteed a ton of fun in the safe, secure, decentralized environment that is WINk. Not only does it feature your favorite games, but you also get to earn crypto for simply participating. The WINk platform is worth keeping an eye on.

Categories
Forex Daily Topic Forex Price Action

Breakout at Weekly High/Low, Wait for Consolidation

In today’s lesson, we are going to demonstrate an example of an H4 breakout at the weekly low. The chart produces a strong bearish candle to make the breakout. The Bear looks good to make a strong move towards the South. However, the price does not head towards the downside. It rather gets choppy. Let us find out the reason behind it.

It is an H4 chart. The chart shows that the price makes a strong bearish move. It has a bounce at a level of support twice. If the price makes a breakout at the neckline, the buyers may look to go long in the pair upon bearish correction. On the other hand, the sellers may wait for the price to make a breakout at the week’s low to go short upon consolidation and getting a bearish reversal candle.

The chart produces a strong bearish candle breaching through the last week’s low. The breakout length is good as well. It means that the sellers may wait for the price to consolidate and to get a bearish reversal candle to go short in the pair. It seems that the sellers may dominate in the pair in this week as well.

The chart produces another bearish candle followed by a bullish engulfing candle. Producing a bullish engulfing candle to consolidate is not a good sign for the sellers. However, if the next candle comes out as a bearish engulfing candle closing below consolidation support, the sellers will be right on the track.

The chart does not produce a bearish engulfing candle. It rather produces another bullish candle. It seems that the price is having a bullish correction. When the H4 chart makes a breakout at the weekly low/high, the price is supposed to consolidate and produce a reversal candle to offer entry. If it makes a long bullish/bearish correction, it is assumed that the traders are not confident to take the price towards the trend. The chart shows that the price is obeying the level of support, where it has its first bounce.

The choppy price action continues. The H4 traders may wait for the price to make a breakout in the next week. The level of support becomes daily support now. Thus, weekly-H4 traders must wait to find the next direction.

We must remember when a pair trades within last week’s high and low, the price usually makes a correction. When it makes a breakout, it consolidates. If it takes too long or too many candles to make a breakout, traders may skip taking entry on that chart.

Categories
Crypto Guides

Understanding Crypto Trading Bots & The Pros/Cons of Using Them

Introduction

Crypto trading bots are gaining popularity with rapid digitalization happening all across the globe. The automated trading programs built and designed for trading different cryptocurrencies are called trading bots. They have gained popularity because cryptocurrency trading has been expanding like never before.

Trading bots are very useful and can serve ample benefits because they are programmed to study and analyze complex data, including prices, market volume, trends, and trades. Also, a trading bot is employed 24*7, and the user will not have to worry about the holdings all the time. Crypto trading bots are generally used by users who do not have the physical time to analyze the market all the time. 

One should also remember that not all the cryptocurrency trading bots available in the markets are the same. There are only a few features that are found common in all of them. The crypto trading bots implement four aspects when they work i.e.

  • Backtesting
  • Strategy implementation
  • Execution
  • Job scheduler

Backtesting collects different market data, like slippage and fees, for analysis purposes. During strategy implementation, different strategies are implemented for generating returns. Execution allows users to test their ideas and strategies in real-time. Once the execution is done, then its time for the automation of the entire process and set-up a job scheduler.

Why can Crypto Trading Bots be the best decision? 

A Crypto trading bot brings a plethora of benefits to help a user. Apart from 24*7 monitoring of market data, these bots can analyze pre-defined criteria as well as complex metrics in a short period of time. A bot is responsible for conducting a lot of multi-tasking, but the best thing is that this multi-tasking is super-efficient. Another reason why crypto trading bots can be the best decision is the fact that they are immune to the emotional side of trading and human errors. Hence, a bot will never trade out of greed or disappointment. 

Why can Crypto Trading Bots be the worst decision? 

There are a lot of advantages that have been discussed until now, but sometimes, a crypto trading bot can become the worst decision of a user. To start with, they are extremely expensive. Hence, before choosing a crypto trading bot, it is necessary to conduct proper research and ensure that the bot they intend to use is reliable and profitable. There are a lot of developers who provide dodgy bots that cannot be trusted.

If a user is not experienced with trading in cryptocurrency, then it is not advisable to use a bot because it requires ace level skills to do configuration and monitoring. Also, if there is a failure to set stop-loss limits, then it can cause a lot of troubles for the inexperienced users. There are also some security concerns in the past associated with cryptocurrency trading bot. For example, Bitconnect has been labeled as one of the biggest cryptocurrency scams, and it was claimed that a trading bot was in use. 

Conclusion

Trading bots have different advantages as well as disadvantages. Going with a bot can either be your best decision or the worst decision. However, if a user has professional experience and expertise in configuration and monitoring, then he or she can use a trading bot to gain maximum benefits. Doing the proper research before selecting a bot is also important. 

Categories
Crypto Daily Topic

Bitcoin Sets a Record 63 Days Closing Above $10k

According to CoinDesk, Sep 27 ended with Bitcoin setting a new record of closing above $10,000 in 63 days straight since Jul 27. Messari, a crypto analytics firm, reported that the cryptocurrency giant closed with $10,793 last week. CoinDesk relayed that the price range of Bitcoin within the 63 days sat between $10,000 and $12,500.

The last time Bitcoin achieved this record was on Dec 1, 2017. This good fortune stretched into Jan 31, 2018, when Bitcoin set a record of being valued above $10,000 in 62 consecutive days. Coinbase recorded the highest price at $19,900 during that period.

According to CoinDesk, Bitcoin hasn’t had such a streak in a while, with the closest dates being 28 days in July 2019, followed by 25 days in June of the same year. 

Short-term Pullback

The past week has proven somewhat rocky for the top cryptocurrency, with its price falling to the depths of $9,800. Bitcoin has suffered difficulties surrounding the rising above of $10,600. Skew Analytics pointed out that the reason why prices fell beneath $11,000 is because of the low volatility registered over the whole of September. A chart provided by Coinbase shows that Bitcoin’s volatility has scaled downwards significantly, reaching as low as 49% and 47% within the past ten days.

Technical analyst and crypto trader Josh Rager shared his sentiments on Twitter regarding how people are viewing the pullback. 

“Weekly close looks good, and I don’t know why people continue to be overly bearish. Bitcoin got a short-term pullback, and – 20% is nothing unusual.”

Morgan Creek Digital Antony Pompilano also shared his sentiments on the matter, claiming that the market is ‘proving’ the bears wrong. He highlighted the fact that Bitcoin managed to pull prices above $10,000 for 63 consecutive days, which should be proof enough that it’s likely to soar even higher in the near future.

Bitcoin has stabilized at an $11,000 trading corridor since it lost its momentum after hitting $12,500 in August 2020. There is concern surrounding this short-term pullback as people worry that BTC/USD might still dive to fill the last remaining CME futures ‘gap,’ which stands at $9,600.

The Third Quarter

Skew, and on-chain analytics resource, relayed that this year should have Bitcoin producing the strongest Q3 in history. On Sep 30, Bitcoin traded $10, 680 beating every other Q3 on record. The Q3 figure on record that has come close to this particular figure is $8,310, which was recorded last year.

Skew Analytics strongly believes that Bitcoin may seal the second-best quarterly close of its lifetime. Of course, this can only be achieved if it stays above last year’s Q2, which amounted to $10,590. 

“One more day to go and still looking like its second-best quarterly close for bitcoin, but it’s a close call with Q2 2020,” said Skew. 

At the time of writing (Sep 30, 2020), Bitcoin is trading at $10,780.52. 

Categories
Forex Basic Strategies

Generating Profitable Forex Signals Using The ‘Indicator-Price Action’ Combo Strategy

Introduction

Few strategies discussed previously focussed on chart patterns and indicators. Now let us a strategy that is based on two of the most powerful indicators in technical analysis. We already know how to trade using these indicators separately. But using any technical indicator in isolation will not generate a great amount of profit.

Therefore, it becomes necessary to combine at least two indicators and use them in conjunction to produce signals. In today’s article, we not only combine two indicators but also provide a price action edge to it that will make this one of the best strategies of all time. This particular strategy gives traders an insight into both volatility and momentum in the forex market.
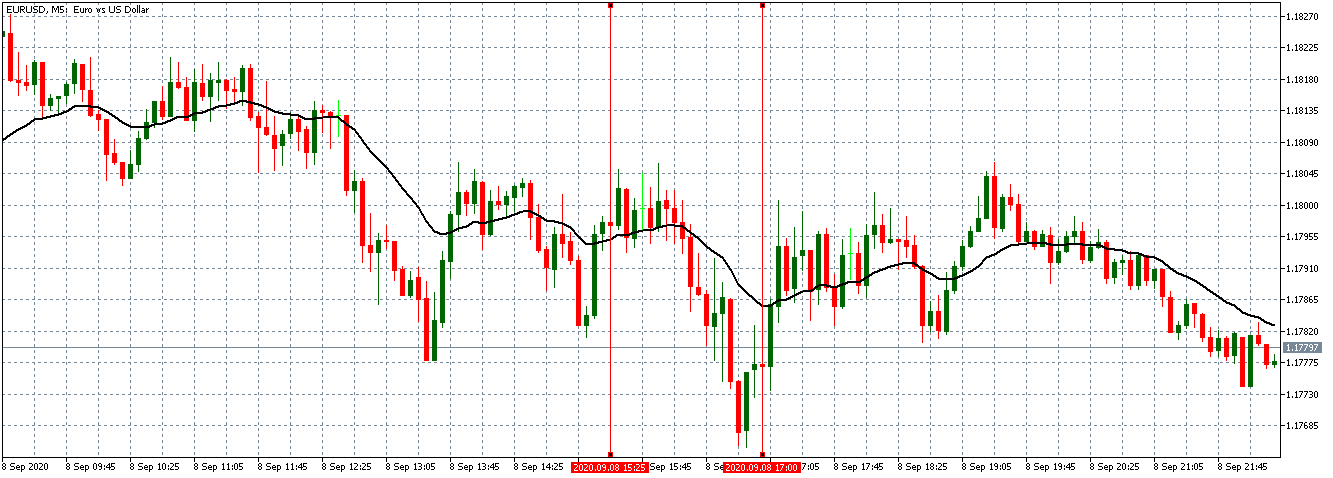
The two indicators we will using are Bollinger Band (BB) and MACD. Using the two indicators together can assist traders in taking high probability trades as they gauge the direction and strength of the existing trend, along with volatility. Let us find out the specifications of the strategy and how we imbibe concepts of price action here.

Time Frame

The strategy is designed for trading on longer-term price charts such as the 4 hours and ‘Daily.’ This means the strategy is suitable for the swing to long-term traders.

Indicators

As mentioned earlier, we use Bollinger Band and MACD indicators in the strategy with their default settings.

Currency Pairs

We can apply this strategy to both major and minor currency pairs. However, pairs that are not volatile should be avoided.

Strategy Concept

In this strategy, we first identify the trend of the market and see if the price is moving in a channel or not. When looking for a ‘long’ setup, the price must move in a channel below the median line of the Bollinger band. The lesser time price spends above the median line of the Bollinger band better for the strategy.

The reason behind why we chose to have the price below the Bollinger band is to verify that the price is moving into an ‘oversold’ zone. When price moves into the zone of ‘overbought’ or ‘oversold,’ it means a reversal is nearing in the market. Similarly, in a ‘short’ setup, the price should initially move in an upward channel above the median line of the Bollinger band. This indicates that the price is approaching an ‘overbought’ area.

The MACD indicator shows when a true reversal is taking place in the market. The histogram tells about the momentum and strength of the reversal. Depending on the level of the bars, we ascertain the strength of the reversal. Not only is the strength of the reversal important, but also the ’highs’ and ‘lows’ it makes. Once price crosses previous highs and lows, we enter the market at an appropriate ‘test.’ Let us understand in detail about the execution of the strategy.

Trade Setup

In order to execute the strategy, we have considered the 4-hour chart of the GBP/JPY pair, where we will be illustrating a ‘long’ trade. Here are steps to execute the strategy.

Step 1: Firstly, we have to identify the trend of the market. In a ‘long’ trade setup, we need to look for series of ‘lower lows’ and ‘lower highs’ below the median line of the Bollinger band, and in a ‘short’ trade setup, we need to look for series of ‘higher highs’ and ‘higher lows’ above the median line of Bollinger band. When this is confined in the channel, the trend becomes very clear, and reversal can easily be identified.

Step 2: We say that an upward reversal has taken place when we notice a bullish crossover in MACD along with a positive histogram. While in an uptrend, we say that a reversal has occurred when we notice a bearish crossover in MACD along with a negative histogram. Once reversal becomes eminent in the market, it is necessary to confirm that the reversal is ‘true,’ and thus, we could take a trade in the direction of the reversal.

The below image shows a downtrend reversal, as indicated by MACD.

Step 3: In this step, we should make sure that the price makes a ‘high’ that is above the previous ‘lower high,’ in an upward reversal. While in a downward reversal (reversal of an uptrend), the price should make a ‘low’ that is lower than the previous ‘higher low.’ When all these conditions are fulfilled, we can say that the reversal is real, and now we will look to trade the reversal.

We enter the market for a ‘buy’ or ‘sell’ when price ‘tests’ the median line of the Bollinger band after the reversal and stays above (‘buy’) or below (‘sell’).

Step 4: Finally, after entering the trade, we need to define appropriate levels of stop-loss and ‘take-profit’ for the trade. The rules of stop-loss are pretty simple, where it will be placed below the lowest point of the downtrend in a ‘long’ position and above the highest point of the uptrend in a ‘short’ position. ‘Take-profit’ will be set such that the risk-to-reward (RR) of the trade is at least 1:1.5. Once the price starts moving in our favor, we will put our stop-loss to break-even and extend our take-profit level.

Strategy Roundup

The combination of the Bollinger band and MACD is not suitable for novice traders. Since it involves complex rules and indicators, we need prior experience of using the indicators and charts before we can apply the strategy successfully. Traders should pay attention to every rule of the strategy to gain the maximum out of it. As there many rules and conditions, there is a tendency among traders to skip some rules, but it is not advisable.

Categories
Crypto Guides

A Brief Guide to PancakeSwap – A Food Themed DeFi Protocol

Introduction

PancakeSwap is a food-themed new DeFi protocol. It is a cryptocurrency platform for direct exchange under the Binance Smart Chain (BSC). It has introduced many food-based farming associates in the crypto industry. Pancake allows community governance and investors to earn tokens by serving as a liquidity provider under the staking mechanism.

The whole protocol is executed on the Ethereum blockchain because it supports blockchain smart contracts, and it has huge community support who are continuously putting efforts to build decentralized applications. Pancake DeFi exchange allows swapping of BEP20 tokens. If you are familiar with SushiSwap, then you can easily grasp the PancakeSwap concept because both of them have the same incredible design. 

The PancakeSwap Exchange

The exchange platform works on an Automated Market Maker Model(AMM). In this model, the investor can trade with his digital assets and can invest in the liquidity pool. In these pools, users deposit funds and, in return, get Liquidity Provider tokens. With these earned tokens, they can reclaim their share from the trading commission. In PancakeSwap, the LP tokens are known as FLIP tokens. 

Staking Chain

In PancakeSwap, you are allowed to trade with a secondary token known as CAKE. On the farm, if you stake your LP tokens and lock them for the further process, then you will get CAKE in reward. You can deposit these different LP tokens listed below:

  1. CAKE-BNB FLIP
  2. BUSD-BNB FLIP
  3. ADA-BNB FLIP
  4. BAND_BNB FLIP
  5. DOT-BNB FLIP
  6. EOS-BNB FLIP
  7. LINK-BNB FLIP
  8. BAKE-BNB Bakery LP
  9. BURGER-BNB FLIP

There is one more token in this protocol known as SYRUP. If you have deposited funds to get LP tokens and have used these tokens to receive CAKE. Further, you can stake this CAKE token to earn a SYRUP token, which would provide you with governance functionality. 

Adding Liquidity

To access all the features of PancakeSwap, you need to unlock your crypto wallet. With this wallet, you can interact Binance smart chain based on Ethereum web applications. 

The BEP20 tokens movement will require your approval. You simply have to fix the amount you want to keep on stake, and you need to confirm the transaction. Then you can check the CAKE you have earned, and you can withdraw the amount anytime you want with the harvest option. To earn SYRUP, you have to keep your CAKE on the stake with the ‘Approve Cake’ option. Once you have staked your CAKE, you will get back an equal amount of SYRUP and can earn CAKE passively. 

Conclusion 

The Google of crypto – Binance jumped in Defi by introducing a new food protocol – PancakeSwap. PancakeSwap is launched by BSC, which is supported by a centralized exchange. It includes AMM, DEX, farms, and native token-CAKE. There are nine liquidity pools where you can deposit your funds. 25% of CAKE commission share is distributed to the SYRUP token holders. The anonymous developer team behind the PancakeSwap has warned that the smart contract is still unaudited and has high inherent risk. The fund invested in smart contracts always has a risk of bugs so, never deposit the amount if you can’t afford its loss. 

Categories
Crypto Daily Topic Cryptocurrencies

What Exactly is Botnet Mining?

In recent times, cryptocurrency mining has exponentially increased both as a topic and an activity. All this can be attributed to the surge of crypto in the last few years. 

Crypto mining involves a series of computational processes to earn crypto. Usually, the mining process requires high amounts of computing power – with more computing power translating to more gains. 

As a result, individuals have come up with ingenious ways – both honest and dishonest, to acquire more computing power. One of the honest ones is joining a mining pool. Another not so honest one is botnet mining. 

Botnet mining is one of several ways that black hat hackers continue to commandeer unsuspecting users’ computing power to mine cryptocurrency. It’s a rather novel, yet highly effective way for cyber hackers to earn crypto without breaking a sweat. 

What’s Botnet Mining? 

A botnet is a collection of various internet-connected devices, ranging from desktops to PCs to mobile phones to IoT devices – injected with malicious software and then controlled by the malware from that point on. The owners of these devices are seldom aware that their machines are being controlled by foreign software. A botnet enables the malware owner to get a payday at the oblivious devices’ owners’ expense. 

How Do Botnets Work? 

Botnets are automated computer programs specifically designed to corrupt a computer system to the liking of its creator. The malware surreptitiously sneaks into the victims’ device and utilizes the devices’ computing power, internet bandwidth, electricity to mine crypto. The malware is purposefully engineered to infect any device that plugs into the same network. The computing power of all these devices is then harnessed to mine even more cryptocurrency. A high computational power tremendously boosts the mining output, resulting in more earnings for the malware owner(s). 

What Are Some Examples of Mining Botnets?

As the practice gains a foothold, several botnets have cropped up over the years. However, some have managed to stick out just for their notoriety. Here, let’s have a look at three of the most famous mining botnets: 

#1. Smominru Botnet

Created in May 2017, the Smominru miner botnet is estimated to have mined over 9,000 Monero coins worth more than $3.6 million at the time of writing. Within a span of slightly over three years, Smominru has infected more than 600,000 devices. 

Smominru miner botnet is observed to have spread to a global scale, with the majority of its presence being in Russian, Taiwan, Brazil, and India. Its regenerating nature has made it quite elusive to contain despite multiple efforts. This is because the malware creators, suspected to be based in China, keep registering new domains after the old ones are banned. 

Monero seems to be the most preferred coin by the Botnet, thanks to its anonymity and privacy-oriented features, which make it hard to track the destination address of the mined coins. 

#2. DDG Botnet

Created in March 2017, the DDG botnet has mined in excess of $1.5 million worth of Moreno. To date, it has infected over 4,000 devices harnessing their collective processing power. The DDG botnet utilizes OrientDB and Redis servers because these have more CPU than the average PC. 

DDG was created specifically to target servers. The 4,000 target devices accumulate Redis and OrientDB database servers. The majority of the infiltrated servers are located in China and the US, with the rest scattered across the globe.

Studies show DDG uses a script called i.sh that makes the Botnet’sBotnet’s architecture super flexible. This feature allows the malware creator(s) to download and infect vulnerable servers with it. 

#3. ADB.Miner

The ADB. Miner botnet was discovered in the early months of 2018. This BotnetBotnet is unique since it’s coded to target Android devices to mine, Monero. 

The creators of this botnet aim at compensating the low CPU power in phones with a large target scope. It is estimated to have infected more than 6,000 devices within the first few days, with this figure doubling every 12 hours. 

What’s more, the creators are also targeting smart TVs that have more processing power than phones. The BotnetBotnet infects a device through port 5555. This port is deployed by the command-line software Android Debug Bridge. By default, port 5555 is usually disabled on all Android devices. As such, only users who manually enable it risk the breach. 

The vast majority of ADB.Miner botnet victims are in China and South Korea. 

Huge Gains for Little Effort?

Mining cryptocurrency legitimately is complicated and intensive work. Therefore, botnet mining is becoming more popular with cybercriminals since it’s less risky and offers huge returns. The botnets programs are automated; thus, so little work is put into it. 

We already established that botnets have massive returns. And as of now, there isn’t exactly a viable plan in place to contain the menace. VP of Threat Operations told News.com.au that “Taking down the botnet is very difficult given its distributed nature and the persistence of its operators.” In this state of affairs, botnets are set to increase, and with them, their ill effects. 

Crypto Scammers Leverage the COVID Pandemic

The majority of these botnets gain access to their targets’ devices using undetected methods. The most common methods are embedding malicious code in a link sent as an email. Victims are enticed to click on the link based on the content of the email. Secondly, computer users who are not exactly tech-savvy are, in more ways than one, negligent to the importance of cybersecurity. Therefore, they leave their devices open for hacking.

In this COVID-19 season, cyber crooks are taking advantage of unsuspecting internet users more than ever. They are now impersonating health bodies such as the World Health Organisation so that when users visit such a site, they’re redirected to potentially click on malicious links that could trap them in a botnet and other scams of the nature. As an internet user, being aware of such malicious intentions is the first step to avoiding them. 

Final Thoughts

As otherworldly as the concept seems, botnets are real, and the tech world is yet to come up with ways to tackle them. It’s almost impossible to contain one at the individual level, but keeping an eye on the various processes your device is running should go a long way. 

Categories
Forex Assets

Costs Involved While Trading The ‘CAD/TWD’ Forex Exotic Currency Pair

Introduction

The CAD/TWD is an exotic currency pair where CAD is the Canadian Dollar, and the TWD is referred to as the Taiwan New Dollar. In this pair, CAD is the base currency, and the TWD is the quote currency, which means that the exchange rate for the pair shows the quantity of TWD that can be bought by 1 CAD. In this case, if the exchange rate for the pair is 21.864, then 1 CAD buys 21.864 TWD.

CAD/TWD Specification

Spread

In the forex market, the spread is considered a cost to the trader. It is the difference between the ‘bid’ and the ‘ask’ price. Here are the spread charges for ECN and STP brokers for CAD/TWD pair.

ECN: 29 pips | STP: 34 pips

Slippage

When trading forex, slippage occurs when the execution price is below or above the price at opening the trade. The primary causes of slippage are the brokers’ speed of execution and market volatility.

Trading Range in the CAD/TWD Pair

The trading range in forex is used to analyze the volatility of a currency pair across different timeframes. This analysis gives the trader a rough estimate of how much they stand to gain or lose by trading that pair over a given timeframe. For example, say the volatility of the CAD/TWD pair at the 1-hour timeframe is 20 pips. Then, a trader can anticipate to either profit or lose $91.4

The trading range for the CAD/TWD pair is shown below.

The Procedure to assess Pip Ranges

  1. Add the ATR indicator to your chart
  2. Set the period to 1
  3. Add a 200-period SMA to this indicator
  4. Shrink the chart so you can determine a larger period
  5. Select your desired timeframe
  6. Measure the floor level and set this value as the min
  7. Measure the level of the 200-period SMA and set this as the average
  8. Measure the peak levels and set this as Max.

CAD/TWD Cost as a Percentage of the Trading Range

For us to understand the trading costs associated with the volatility, we will determine the total cost for both ECN and STP accounts as a ratio of the above volatility.

ECN Model Account

Spread = 29 | Slippage = 2 | Trading fee = 1

Total cost = 32

STP Model Account

Spread = 34 | Slippage = 2 | Trading fee = 0

Total cost = 36

The Ideal Timeframe to Trade CAD/TWD

From the above analyses, we can conclude that it is costlier trading the CAD/TWD pair on shorter timeframes when volatility is low. Longer timeframes, i.e., the weekly and the monthly timeframes, have lesser trading costs. Therefore, it would be more profitable trading the CAD/TWD pair over longer timeframes.

However, for intraday traders, opening positions when the volatility is above the average will reduce the trading costs. More so, using forex limit orders instead of market orders will reduce the trading costs by eliminating the costs associated with slippage. Here’s an example.

ECN Account Using Limit Model Account

Total cost = Slippage + Spread + Trading fee

= 0 + 29 + 1 = 30

You can notice that using the limit orders significantly reduces the cost as a percentage of the trading range.

Categories
Forex Indicators

Everything About ‘Treasury Bill Auction’ Macro Economic Indicator

Introduction

One of the primary ways any government funds its budget is through debt – borrowing. When borrowing, a government can do this from the international markets or locally, from its citizens and businesses. When taking debt locally, a government uses treasury bills and bonds. As is with any form of debt, borrowing using treasury bills, the government is obligated to pay interest upon the maturity date.

The interest rate that the government offers for its treasury bills gives an invaluable insight into the confidence investors have in the economy. Therefore, to understand the borrowing patterns of the government, the interest rates it is obligated to pay, we need to understand treasury bill auctions.

Understanding Treasury Bill Auction

To better understand how the treasury bid auction works, we first need to understand a few terms.

Treasury bill is a short-term debt instrument used by governments to borrow money over a short period – usually less than one year. Because the central banks back the treasury bill, they are considered to be of lower risk and secure form of investment.

Treasury bill auction is a weekly public offering of treasury bills by the central government with maturities ranging from one month to one year. The auction is the official avenue through which central banks issue their treasury bills.

Maturity is the maximum time that a treasury bill holder can hold it before they are eligible for redemption. Treasury bills have maturities ranging from days up to one year. Note that the longer the maturity period of a treasury bill, the higher the interest rate will be.

Discount is the difference between the price at which the treasury bills are issued and the face value of the treasury bills. It is customary for the treasury bills to be issued at a discount and be redeemed at face value upon maturity.

During the auctions, participants are generally divided into two categories – competitive and non-competitive bidders. Before the auctioning process begins, the central banks make public the following information about the treasury bills: the date of the auction; the day of the treasury bill issue; eligibility of auction participants; the amount of the bills being auctioned; and the time when the bidding ends.

When the auction begins, the competitive bids are accepted first to determine the discount rate for the treasury bills. These competitive bills are submitted on a pro-rata share of every Treasury bill auction. It is worth noting that the winning bid determines the interest rate that will be paid out on each issue of a treasury bill. Furthermore, the demand for treasury bills is determined by the prevailing market and economic conditions and sentiment. It is this demand and the interest rate that will be of importance in our subsequent analyses.

Since the pricing of the treasury bills is done through a bidding process, the winning bid is usually one that has the lowest discount rate. Such bids are preferred to ensure that the interest rate the government pays investors is kept as low as possible.

After investors have purchased the treasury bills, they are then free to sell, trade them, or hold until maturity.

How can treasury bills auction be used for analysis?

Using the auction of the treasury bills in the analysis is relatively straightforward. The biggest draw of the treasury bills is because of the presumed zero risks of default since the government backs them. As we mentioned earlier, the primary determinant of the discount rate at the treasury bill auction is the demand. This demand is driven by factors such as macroeconomics, market risks, and monetary policies.

When other markets such as equity markets appear to be less risky or offer better returns, investors in the treasury bills will demand higher discounts. The higher discount translates to a higher interest rate attached to the treasury bills. Furthermore, when the rate of inflation is rising, investors will demand a higher discount rate for the treasury bills to offset the effects of inflation.

Source: St. Louis FRED

When there is rapid economic growth, investors have several options that could earn them higher returns. Therefore, they will demand a higher discount from the government, which results in a higher rate. Similarly, when the economy is heading towards a recession, investors deem treasury bills as safe-haven investments. The resulting excess demand for the treasury bills leads to lower discounts received by the investors.

Thus, the change in the yield attached to the treasury bills gives us significant insight into the state of the economy.

Impact on currency

We have seen that the rate of the treasury bills being auctioned is a reflection of the prevailing market conditions or anticipated economic performance.

When the rate received at auction is higher, it signals that the economy is performing well. Furthermore, higher rates for the treasury bills imply that there will be increased interest in investment opportunities in the country, which results in increased demand for the local currency. Higher rates could also translate to the increasing rate of inflation, which forestalls contractionary monetary and fiscal policies. For the forex market, this translates to a well-performing economy hence the appreciation of the currency relative to other currencies.

Conversely, when the rate of treasury bills at auction are falling, it implies that the economic fundamentals are performing poorly. There will be a net outflow of capital and investment. Furthermore, the forex market would anticipate expansionary monetary policies, which result in the depreciation of the currency relative to others.

Sources of Data

In the U.S., the treasury bills are auctioned by the U.S. Department of Treasury. You can access the latest data on the auction of treasury bills here. The data on the upcoming auction of the U.S. treasury bills can be accessed from TreasuryDirect, which allows you to buy and redeem securities directly from the U.S. Department of the Treasury in paperless electronic form. You can access the in-depth review of the current and historical data on the U.S. treasury bills from St. Louis FRED. You can access the global data on Treasury bills from Trading Economics.

That’s about Treasury Bill Auction and the respective details related to this fundamental indicator. We did not see any reaction at all on the Forex price charts related to this indicator, but as explained above, we know the relative impact. We hope you have found this article informative. Cheers!

Categories
Crypto Videos

The Craze Behind DeFi – Explained!


The Craze Behind DeFi – Explained

There are many reasons that the DeFi sector has been experiencing a surge of interest lately.
First off, we need to mention that the regulators have been behind the curve in terms of DeFi, which has been able to flourish in this vacuum. As an example, in traditional unsecured lending, a legal requirement that lenders and borrowers know one another’s identities exists. On top of that, the lender always assesses the borrower’s ability to repay their debt. In DeFi, on the other hand, there are no such requirements. Instead, every part of the process is about mutual trust and preserving privacy.

Regulators always have to weigh the delicate balance between deterring innovation and failing to protect society from risks. In July, the US SEC made a major shift towards embracing decentralized finance by approving an Ethereum-based fund called Arca.
This is welcome and extremely important since one of the major challenges with financial innovation is the hostile environment that is created by archaic regulations. This had caused many cryptos and DeFi projects to fail, including major ones such as Basis, which returned $133 million to investors back in 2018 when it concluded that it couldn’t work within the SEC rules.


The second reason for the DeFi craze is that mainstream players are not-so-slowly and surely getting involved. Many financial institutions are beginning to accept DeFi, as well as seeking ways to participate. Seventy-five of the world’s biggest banks are now trialing blockchain technology to speed up their payment system as part of the Interbank Information Network, led by JP Morgan, Royal Bank of Canada, and ANZ. Even though most of these banks are testing centralized versions of blockchain, this is one step closer to DeFi than the current system.
Major asset management funds are starting to get interested in DeFi seriously as well, with the most prominent one being Grayscale, the world’s largest crypto investment fund.

The third reason for the craze is the effect of COVID-19. The pandemic has evidently driven global interest rates even lower, with some jurisdictions, such as the eurozone, now offering negative interest rates.
DeFi potentially offers much higher returns on investment to savers than high-street institutions. As an example, Compound has been offering an annualized interest rate of 6.75% for people that save with stablecoin Tether. Not only do you get the interest, but you also receive Comp tokens, which adds to the attraction of this offer. With as much as two-thirds of people without bank accounts having a smartphone, DeFi also has the potential to offer its services to the so-called unbanked.

One final reason for the surge in people putting money into DeFi projects is FOMO – fear of missing out. Many tokens are worth nothing or very close to nothing in terms of their utility, so we see a lot of irrational investment and pure speculation. But, people see certain tokens rise in value exponentially and want to turn their life around as well.
Like it or not, we are certainly heading towards a new financial system that will be more liberalized and decentralized than before, and DeFi will be at the forefront of these changes.

Categories
Crypto Videos

What Is DeFi – Beginners Edition!


What Is DeFi –Beginners Edition

One area in cryptocurrencies that have recently attracted huge attention is certainly DeFi or decentralized finance. DeFi refers to financial services using smart contracts, automated enforceable agreements that work without intermediaries like banks or lawyers. Instead, they use online blockchain technology.
Between September 2017 and now, the total value locked up in DeFi contracts managed to go from $2.1 million to over $7 billion. The hype it has gotten in the past couple of months has risen over $3 billion.

This has, in turn, driven a massive rise in the valuation of all the tradable tokens that are using DeFi smart contracts. The total market cap of DeFi projects now exceeds $15 billion, almost doubling the value it had in July. Numerous tokens have exploded in value this year. For example, Synthetix Network Token has increased its valuation by more than 20-fold, while Aave did an almost 200-fold increase. So if you had bought $1,000 worth of Aave tokens in August 2019, your position would now be worth nearly $200,000.

So why is DeFi so disruptive, and what does it bring to the table?

DeFi projects are mostly built on the Ethereum blockchain network. They are the next step in the financial technology revolution that began 11 years ago with Bitcoin. One area in which these decentralized applications have taken off is cryptocurrency trading on DEX’s (short for decentralized exchanges) such as Uniswap. These exchanges are entirely peer-to-peer, without any person, company, or other institution behind the platform.
Other DeFi services allow you to:
Borrow and lend cryptocurrencies in order to earn interest using platforms such as Aave or Compound Bet on the outcome of certain events using Augur Create and exchange real-world asset derivatives such as currencies or precious metals on platforms such as Synthetix.
Buy stablecoins, a type of cryptocurrencies that are pegged to the value of a particular currency or commodity.

DeFi is often called “Lego money” because you can stack decentralized applications together to maximize your returns. As an example, you could buy a stablecoin such as DAI and then lend it on the Compound platform to earn interest.
Though many of today’s decentralized applications are niche, future applications could have a massive impact on everyone’s day-to-day life. As an example, you will probably be able to purchase a house or a piece of land through a DeFi platform under a mortgage smart-contract whereby you repay the price over a certain number of years.

The deeds would be tokenized on a blockchain ledger as collateral, and they would shift to the lender automatically in the event of you defaulting on your repayments. Because no lawyers or banks would be required in the process, it could make the whole process of buying and selling houses cheaper, smoother, and easier.

To learn more on how DeFi works, check out our next video where we will talk about the current DeFi craze and how it came to be.


Categories
Forex Daily Topic Forex System Design

Designing a Trading Strategy – Part 5

Introduction

In a previous article, we presented the effect of incorporating additional rules in a trading strategy during the design process. In particular, we intuitively proposed a rule that opens a position using a size considering a percentage level of equity in the trading account.

In this educational article, corresponding to the last part of the series dedicated to designing trading strategies, we will expand position sizing concepts.

Position Sizing

The determination of the position size in each trade corresponds to the third element of a trading strategy. This decision will determine the capital that the investor will risk in each trade.

The position sizing corresponds to the volume committed in each trade. This volume can be the number of contracts, shares, lots, or another unit associated with the asset to be traded. The complexity of the position sizing is based on the efficient determination of the position to ensure maximum profitability with an acceptable risk level for the investor.

Programming the Position Sizing

To visualize the difference between some methods of position sizing, we will apply the criteria to the strategy of crossing moving averages analyzed in previous articles:

Fixed Size: This method is probably the most typical when developing a trading strategy. The rule consists of applying a fixed volume per trade. For example, consider the position size of 0.1 lot per trade, the code for our strategy is as follows:

extern double TradeSize = 0.1;

   //Open Buy Order, instant signal is tested first
   if(Cross(0, iMA(NULL, PERIOD_CURRENT, Period1, 0, MODE_LWMA, PRICE_CLOSE, 0) >
 iMA(NULL, PERIOD_CURRENT, Period2, 0, MODE_SMA, PRICE_CLOSE, 0))
 //Moving Average crosses above Moving Average
   )
     {
      RefreshRates();
      price = Ask;
      SL = SL_Pips * myPoint; //Stop Loss = value in points (relative to price)   
      if(IsTradeAllowed())
        {
         ticket = myOrderSend(OP_BUY, price, TradeSize, "");
         if(ticket <= 0) return;
        }
      else //not autotrading => only send alert
         myAlert("order", "");
      myOrderModifyRel(ticket, SL, 0);
     }
   
   //Open Sell Order, instant signal is tested first
   if(Cross(1, iMA(NULL, PERIOD_CURRENT, Period1, 0, MODE_LWMA, PRICE_CLOSE, 0) <
 iMA(NULL, PERIOD_CURRENT, Period2, 0, MODE_SMA, PRICE_CLOSE, 0))
 //Moving Average crosses below Moving Average
   )
     {
      RefreshRates();
      price = Bid;
      SL = SL_Pips * myPoint; //Stop Loss = value in points (relative to price)   
      if(IsTradeAllowed())
        {
         ticket = myOrderSend(OP_SELL, price, TradeSize, "");
         if(ticket <= 0) return;
        }
      else //not autotrading => only send alert
         myAlert("order", "");
      myOrderModifyRel(ticket, SL, 0);

Percentage of Risk per Trade: this criterion considers the account’s size given the account’s capital and estimates the stop loss distance needed to execute the trade according to the devised strategy. The common practice is to risk 1% of the equity currently available in the trading account. In this case, the implementation of the strategy is as follows:

double MM_Percent = 1;
double MM_Size(double SL) //Risk % per trade, SL = relative Stop Loss to
 calculate risk
  {
   double MaxLot = MarketInfo(Symbol(), MODE_MAXLOT);
   double MinLot = MarketInfo(Symbol(), MODE_MINLOT);
   double tickvalue = MarketInfo(Symbol(), MODE_TICKVALUE);
   double ticksize = MarketInfo(Symbol(), MODE_TICKSIZE);
   double lots = MM_Percent * 1.0 / 100 * AccountBalance() /
 (SL / ticksize * tickvalue);
   if(lots > MaxLot) lots = MaxLot;
   if(lots < MinLot) lots = MinLot;
   return(lots);
  }

Position Sizing to Equity: this method executes the trading order according to the trading account’s equity. For example, the developer could place one lot per $100,000 in the trading account. This method will increase or reduce each transaction’s volume as the capital of the trading account evolves.

extern double MM_PositionSizing = 100000;
double MM_Size() //position sizing
  {
   double MaxLot = MarketInfo(Symbol(), MODE_MAXLOT);
   double MinLot = MarketInfo(Symbol(), MODE_MINLOT);
   double lots = AccountBalance() / MM_PositionSizing;
   if(lots > MaxLot) lots = MaxLot;
   if(lots < MinLot) lots = MinLot;
   return(lots);
  }

There are other methods, such as martingale and anti-martingale, discussed in a forthcoming educational article. For now, we present your definition.

  • Martingale: this rule is based on the money management of gambling. This method doubles the position size after each losing trade and starts at one position after each win. This method is extremely dangerous and should be avoided.
  • Anti-Martingale: this method opposes martingale, that is, doubles the position size after each winning trade and starts with a position after a losing trade. This method plays with what the trader considers to be “market’s money.” It is advisable to reset the size after a determined number of steps since the logic bets on a winning streak, which will end at some point. A 3-step is good enough to increase profits substantially. 4-step may be an absolute maximum on most trading strategies.

Conclusions

Position sizing is one of the critical decisions that the trading strategy developer must make. This choice will influence both the trading account’s growth and the capital risk to be exposed in each trade.

On the other hand, we have seen three examples of position sizing, representing a criteria guide that the trading strategy developer can use.

Finally, the developer of the trading strategy should explore and evaluate which is the best option of position sizing to use, taking into account the benefits of each of the impacts on the strategy’s execution.

Suggested Readings

  • Jaekle, U., Tomasini, E.; Trading Systems: A New Approach to System Development and Portfolio Optimisation; Harriman House Ltd.; 1st Edition (2009).
  • Pardo, R.; The Evaluation and Optimization of Trading Strategies; John Wiley & Sons; 2nd Edition (2008).
Categories
Cryptocurrencies

What’s IRISnet (IRIS)?

Contractual relationships have been part of society since time immemorial. Relationships inherently require trust, and in modern society, trust is costly. From lawyers to intermediaries to hours and hours of verification processes, it’s expensive to achieve trust. 

Blockchain, a tech that entered the space 11 years ago, unleashed an era of trustless transactions. They are trustless because everything is available on the public blockchain for every participant to see. They’re also trustless since when records go on the blockchain, they are irreversible and hence fraud-proof. 

The drawback is that blockchain, like any new tech, is still experiencing growing pains. We’re talking about scalability issues that impact performance, security issues, lack of interoperability, etc. The result is that these drawbacks prevent the technology from going mainstream. 

IRISnet is a blockchain framework that wants to enable businesses to capitalize on the potential of blockchain. It’s a safe, secure, and decentralized platform for building enterprise applications, thus bridging the gap between blockchain and the business world. 

The IRIS network takes its name from the Greek goddess Iris, who’s viewed as the personification of the rainbow and messenger of the gods.  

This article will look at IRISnet’s infrastructure and how it hopes to accomplish this mission. We’ll also examine the network’s native token – IRIS, and its place in the picture.

Who are the Participants of the IRIS Network? 

The IRIS network has three kinds of players: consumers, providers, and profilers. 

#1. Consumers

These are users who utilize off-chain services by relaying requests to and getting feedback from the chain. 

#2. Providers

These are users who monitor and process off-chain requests and relays them on-chain. Providers can also be consumers of other providers’ services. Providers charge fees – dominated in IRIS – for their services

#3. Profilers

These are users that execute various processes on behalf of the IRIS Foundation. Profilers maintain accurate profiles of providers so that consumers can make informed choices when selecting them.

IRISnet: Roadmap and Stages

IRISnet hopes to accomplish its grand vision in several stages, with its roadmap being as follows: 

HUOYI: Beyond July 2021

This will be the fourth stage, and it will focus on things like more innovation, tailored software development kits, mobile clients, and more engagement with the developer community.

KUAFU: November 2019 -to June 2021

The IRIS team will connect the IRIS Hub with application blockchains such as Ethereum to enhance interoperability between blockchains. During this stage, the team will also carry out upgrades to the network to support advanced services. 

NÜWA: April 2019 to October 2019

The IRIS team added more models to support the creation of decentralized finance (DeFi) DApps – things like multisig accounts, support for multiple currencies, etc. 

PANGU: Jan 2018 to March 2019

This was the very first stage of the project. The goal was to kick IRIS Hub into motion. The team created the fundamental IRIS Service Layer and other ground-up functionalities. 

Recent TidBits of IRISnet

  • September 2020: IRISnet announces its DeFi and interchain testnet – Bitfrost, is going live on September 2
  • August 2020: IRISnet partners with digital wallet platform MYKEY to help secure user funds even further and expose users to DeFi applications
  • July 2020: Bianjie Al, the Core Development Team, joins the Blockchain-based Service (BSN) Network Development Association. 
  • June 2020: IRISnet teams up with KAVA to integrate the cryptolending platform
  • June 2020: IRISnet teams up with OKChain to develop a DeFi protocol and an interchain ecosystem
  • April 2020: IRISnet’s Brockton Enterprise is appointed by BSN to power the latter’s interchain ecosystem
  • April 2020: IRISnet teams up with Chainlink to integrate the latter’s oracle service
  • April 2020: IRISnet announces the Community-centric Delegation Campaign and its token burning plan
  • March 2020: IRISnet announces that its enterprise blockchain, IRITA, is now open source 

Current Community Strategy of IRISnet 

  • Expand community-building efforts to China, Korea, and Europe
  • Conduct the Validator Jumpstart Program to facilitate the validated with knowledge and skills to maintain and secure network
  • Equip node runners with the requisite info to improve user experience
  • Conduct programs to support developers so they can build apps around IRIS Hub
  • Inform the community bi-weekly on technical updates
  • Contact ambassador programs to connect with local communities
  • Actively engage with fans and the community on social media

Tokenomics of IRIS 

The IRIS network will be supported by a dual-token system: the staking and fee tokens.

i) Staking Token 

IRIS will be the staking token for the IRIS Hub. In order for network participants to be chosen as delegators and block validators, they have to stake in IRIS tokens. Also, participants who want to become voters for the future direction of the platform have to stake in IRIS. 

ii) Fee Token 

There are two types of fee tokens in the network: network fee and service fee tokens. The network fee token is used to help ward off spam and as payment to validators for securing the network. The service fee token is used to pay service providers. 

How was IRIS Distributed? 

The IRIS token was distributed as follows: 

  • 6.14% went to the seed sale
  • 13.96% went to the private sale
  • 4.9% went to the strategic private sale
  • 15% went to the team
  • 15% went to the IRIS Foundation
  • 0.18% went to advisors
  • 10% went to the Tendermint team
  • 5% went to the Cosmos Hub
  • 29.82% went to the ecosystem development reserve

Tokenomics of IRIS

As of September 14, 2020, IRIS traded at $0.068849, with a market cap of $56,823,777 that placed it at a market rank of #141. IRIS has a 24-hour volume of $4,700,152 and a circulating and total supply of 825,335,778 and 2,000,855,038, respectively. The token’s all-time high and all-time low were $0.194640 (April 22, 2019) and $0.008254 (March 13, 2020), respectively. 

Buying and Storing

The IRIS token is paired with currencies such as USDT, BTC, and ETH in exchanges like Bibox, Binance, MXC, Huobi Korea, Huobi Russia, Bittrex, Coinsuper, HotBit, and Gate.io.

You can store IRIS at Rainbow wallet

Closing Thoughts

IRISnet is yet another blockchain project to take on the challenge of closing the chasm that exists between blockchain tech and business. The team believes that blockchain can be used outside the finance world to better society, and for now, it’s focusing on businesses. With blockchain, businesses can unleash so much potential, and IRISnet is at the forefront, helping them realize this. It will be interesting to watch the project’s growth. 

Categories
Crypto Videos

Blockchain Can Shield Banks From Trade Scandals! The Banks Mass Adoption Of Blockchain Is Coming!


Blockchain Can Shield Banks From Trade Finance Scandals

Blockchain word as symbol cryptocurrency in chrome chain.

The pressure created by the ongoing economic crisis, mounting geopolitical tensions, and obsolete trade finance systems is pushing the trade finance industry all across the globe down a rabbit hole. To add fuel to the fire, recent trade finance scandals that involved major players such as Hin Leong, Agritrade, ZenRock, and Hontop Energy netted a combined loss of almost $6 billion. To limit exposure to such threats, major banks such as ABN Amro, Société Générale, and BNP Paribas have all withdrawn completely from the sector, while others stayed in the sector but raised the bar on their funding processes.

Samir Neji, founder, and CEO of Dltledgers, said: “For traders and other businesses that involve moving goods around the world, capital is now much harder to come by. This is bringing the sector that is already in difficulty further down.” By implementing blockchain, Neji pointed out. Traders can negate the paperwork, email exchanges, and phone calls that are now required to secure trade finance.
Distributed ledger technology (DLT for short) has the potential to bring transparency to the process of trade execution by sharing information in real-time, he added.

When all sides immutably record everything from trade participants, goods, documents, contracts, and payments on a single safe platform that provides tracking and authentication, the chances of a trade being fraudulent would plummet, or perhaps disappear altogether. Neji also said: “If banks see their trades carrying less risk, which they do when using DLT, the trader will be in a much better spot to get financing, and in many cases, will even end up paying lower rates.”
Apart from regaining the banks’ trust to fund global trade, blockchain would also allow traders to easily, smoothly, and safely execute their trades during the ongoing pandemic.

Conclusion

Regarding the adoption of blockchain technology by trade finance and supply chain players, Neji stressed that it was important to stop just talking about blockchain to customers and that they should just see the benefits the technology would offer themselves.
According to the exec, just as with using a smartphone, it is not important for people to know all the technicalities of the underlying technology if they want to actually benefit from it. He said that his company, as well as other companies in the sector, are working to incorporate blockchain in trade finance, but that they need to work together more so they could fight the common foes, such as paper documents, outdated processes, as well as fraud.

Categories
Crypto Videos

Binance Is Entering the DeFi Space!


Binance Entering the DeFi Space

Crypto exchange giant Binance has announced that it will be delving deeper into the world of DeFi products with its latest offering, which is an automated market maker named Binance Liquid Swap.

Aimed directly at its competitor Uniswap, as well as at its clones, Binance will launch an AMM liquidity pool that will allow its users to provide liquidity by depositing tokens. Just like Uniswap, which is the world’s most popular decentralized exchange, newly-created Binance Liquid Swap will also enable users to earn interest as well as a cut of the trading fees for the pool.

Binance’s product is the first AMM pool on a centralized exchange, and will, as such, be integrated into the Binance.com exchange. This will allow users of the Binance platform to pool tokens in their wallets to earn rewards.

The AMM pool will use a pricing module instead of an order book so they could provide more stable prices as well as lower transaction fees according to the announcement Binance made. The company is currently prioritizing liquidity for its own tokens, which means that the first pools offered on launch will be BUSD/DAI, USDT/BUSD, and USDT/DAI.

Earnings from the AMM pool will be accrued with a corresponding seven-day annual percentage yield (APY for short) with returns converted into the assets in their respective pools. Transaction fees, as well as prices, will be determined by the number of assets gathered in the liquidity pools.


Binance CEO stated that the new product is aimed to attract more volume and participants. He said:

“We hope we can further the growth of the DeFi space and empower our users with more earning power and easy liquidity through a centralized AMM pool. The pool’s main characteristics are credibility, safety, and security, which are all provided by Binance,”

Uniswap is, at the moment, the world’s most popular token swapping protocol as well as a decentralized exchange, with more than $1.8 billion in liquidity.

Binance Liquid Swap is actually the second venture into DeFi that the company has made within a week. On Sept 1, the crypto exchange took aim at Ethereum by launching ‘Binance Smart Chain,’ a new Ethereum smart contract that is compatible with the existing Binance Chain.

The company stated that the blockchain was optimized for DeFi, with the goal of low-cost transaction fees that can go as low as 1 cent.

Categories
Crypto Guides

Is EOS A Better Investment Than Ethereum Right Now?

Introduction

EOS and Ethereum both are popular blockchain smart contract platforms. To know whether EOS is a better investment or Ethereum, we will need to compare the two technologies by exploring basic concepts and comparing their mechanisms to draw out the necessary conclusions. After Ethereum was introduced in the crypto industry, two years later, EOS was launched and claimed to fix the flaws in Ethereum. EOS is a strong, scalable contender and might outperform Ethereum. The battle of EOS vs. Ethereum is the most interesting and happening space in the crypto industry. 

What is Ethereum?

Ethereum is a blockchain platform launched in 2015 by Vitalik Buterin. It allows users to send and receive funds independently without the assistance of any third party. It was the first blockchain project to install the smart technology contract. In this technology, some predefined conditions are applied, and users are needed to justify the conditions to proceed with transactions without the need for an intermediate body. This decentralized blockchain has its own cryptocurrency called Ether (ETH), which is tradable in most of the crypto exchanges. 

What is EOS?

EOS is a new blockchain platform that can also manage smart contracts. The Block.one company launched this project in 2017. It has created history by raising the highest Initial Coin Offering(ICO), worth more than $2.5 billion. It has its own EOS coin, which can be transferred from wallet to wallet. EOS aims to become the most scalable, cheapest, and fastest blockchain platform. 

Scalability

Presently Ethereum can support 15 transactions per second, whereas EOS can serve up to at least 10,000 transactions/second. EOS using IoT provides for inter-blockchain communication, which creates blockchains to allow more transactions. Ethereum is working on two protocols called “Plasma” and “Sharding” to increase transaction numbers per second. 

Transaction Cost

On Ethereum, users need to pay gas for each transaction, but EOS works completely in a different way. EOS blockchain users deposit their token to cover the bandwidth required for the transaction. 

Consensus Mechanism

Ethereum is based upon the proof-of-work model, and EOS follows the proof-of-stake model. The transactions are verified without the support of any intermediate system. Ethereum generates random puzzles at every node before confirming the transactions. These puzzles are so difficult to solve that you need to take the help of experts called “Miners.” While EOS offers to stake your coins to verify transactions, the stakers have a chance to earn the rewards. 

EOS Vs. Ethereum: Who holds the future?

Ethereum, just after Bitcoin, is the most popular cryptocurrency across the world. EOS, right from its initial days, is performing exceptionally well. EOS is yet to achieve growth that Ethereum has already achieved, but EOS is significantly better than Ethereum. EOS is a more user-friendly cryptocurrency than ETH. It’s still too early to think about how far EOS will go because the blockchain ecosystem is highly unpredictable. 

Conclusion 

EOS is younger than Ethereum and has improved scalability and transaction fees as compared to Ethereum, but still, it’s under so much controversy because of its more centralized layout. If Ethereum successfully implements the proof-of-stake mechanism, then EOS might not be able to outperform it. On the other hand, if Ethereum doesn’t reduce it’s transaction costs, then EOS will easily overtake Ethereum soon is what crypto experts believe. Cheers! 

Categories
Forex Course

147. How To Detect A Fakeout like a professional Forex trader?

Introduction

It is a general perception among Forex traders that the fakeouts are caused by the banks and large institutional players to stop retail traders players from moving the market in their desired directions. Although there is no evidence to prove this theory, we believe it is true. The manipulation is done by the big players. A fakeout is simply a failed breakout, and most of the time, they occur at significant areas like support, resistance, trend lines, Fibonacci retracement levels, and chart patterns, etc.

Typically, fakeouts are the result of a battle between both the parties on the price chart. So if you are witnessing a range and if we see both the parties printing aggressive candles, we can expect more fakeouts. The same applies to the trending markets as well. The aggressive battle between the buyers and sellers for domination leads to frequent fakeouts.

Trading Fakeouts

It is a common perception that it is impossible to trade these fakeouts, but that is not true. We can trade fakeouts, but a lot of market understanding is required to do so.

#1 Strategy 

The image below indicates a fakeout followed by an actual breakout in the EUR/GBP Forex pair.

As we can see below, when the price breaks above the breakout line, it started to hold there. If it didn’t hold, it means that the price goes above and came back into the range. So in our case, hold above the breakout line confirms that the price is not going to fake out, and riding the buy trade from here will be a good idea.

#2 Strategy 
Buy Example

The image below indicates a false breakout in this Forex pair.

As you can see below, we choose to enter a buy trade after the price action fakes below the major support area. We can see that it is eventually coming back and holding at the support area. This holding support clarifies that the sellers failed to move the market.

Now buyers are coming back and holding the market to go for a brand new higher high. We can see that price action respecting the trendline for a while, but then it breaks above the line, printing a brand new higher high.

Sell Example

The image below indicates the appearance of a faker on the EURGBP sixty-minute chart.

The image below represents our entry, exit, and stop-loss in this Forex pair. The pair was in an uptrend, and as it tries to go above the resistance line, it immediately came back and stated holding below the resistance line. This confirms the faker, and after our entry, prices go back to the most recent lower low.

That’s about identifying Fakeouts and how to trade them. Please be sure to trade these fakeouts only when you are absolutely sure about them. All the best.

Categories
Forex Basic Strategies

Trading Forex Majors and Crosses Using The ‘Awesome’ Strategy

Introduction

The Bollinger Bands is a technical analysis tool that uses a statistical measure of the standard deviation to establish levels of highs and lows in a trend. The upper band shows a level that is statistically high, and the lower band shows a statistically low level. The width correlates to the volatility of the market. This means, in volatile markets, Bollinger bands widen while in less volatile markets, the bands narrow.

In today’s strategy, we utilize this feature of the Bollinger band to anticipate a reversal in the market. But Bollinger bands alone are not sufficient in generating reliable signals. Along with the Bollinger bands, we use the Awesome Oscillator to confirm the reversal of a trend. Let us understand how both indicators can be combined to generate reversal signals.

Time Frame

Time frames suitable for trading this strategy are 1 minute, 5 minutes, and 15 minutes. Therefore, this a perfect strategy for ‘Scalpers.’

Indicators

Three indicators are applied to the chart listed below.

  • Bollinger bands (20,2)
  • Bill Williams’ Awesome Indicator
  • Exponential Moving Average (EMA)

Currency Pairs

The ‘Awesome’ strategy should ideally be traded with major forex currency pairs only. Liquidity and volatility are especially necessary for the strategy to work at its best, which is provided only by major pairs. Some preferred ones are EUR/USD, USD/JPY, AUD/USD, GBP/USD, GBP/JPY, EUR/JPY, CAD/JPY, and NZD/USD.

Strategy Concept

Apart from the Bollinger band, we use the awesome oscillator indicator that attempts to gauge whether bearish or bullish forces are driving the market. It market momentum indicator, which compares recent market movements to historical movements. It uses a line in the center, either side of which price movements are plotted according to a comparison between two different moving averages. We use this awesome oscillator to forecast a shift in market momentum and whether the prevailing trend will continue or reverse.

We look for ‘buy’ opportunities when EMA crosses up through the middle Bollinger band. At the same time, the Awesome Oscillator should be crossing above the zero levels. This is the first part of the reversal. We execute a ‘long’ trade at the ‘test’ of the previous ‘lower high’ that is a part of the earlier trend.

For ‘sell’ trades, we are looking for the opposite conditions of buy trades. The first condition being that the EMA crosses below the middle Bollinger band. At the same time, Awesome Oscillator also crosses below the zero-line. Finally, we enter at the ‘test’ of the ‘higher low’ of the previous trend.

A stop-loss a placed below the lowest point of the downtrend in an upward reversal while it will be above the highest point of the uptrend in a downward reversal.

Trade Setup

In order to execute the strategy, we have considered the 5-minute chart of AUD/USD, where we will be illustrating a ‘long’ trade. Here are the steps to execute the strategy.

Step 1: The first step is to identify the direction of the market. We can do this in two ways. If the price is making higher highs and higher lows, the market is said to be in an uptrend. While if the price is making lower lows and lower highs, the market is in a downtrend. The trend becomes clearer when price moves in a channel and plot the same on the chart.

In the case of AUD/USD, we have identified a downward channel, as shown in the below image.

Step 2: After identifying the direction, we need to wait for a reversal in the market. We can say that a reversal is taking place in the market when price breaks the trendline and starts moving in the same direction. Trendline break is not enough. Here’s where the indicators Bollinger band, EMA, and Awesome Oscillator come handy.

In case of a downtrend, the reversal is confirmed when EMA crosses above the middle line of the Bollinger band, and the Awesome Oscillator moves from negative to positive zone. While in an uptrend, the reversal is confirmed when EMA crosses below the middle line of the Bollinger band and Awesome Oscillator goes below the ‘zero’ level. However, we do not enter the market soon after this, where we need one last thing before that.

The below image shows that when the price is not able to make another ‘lower low,’ it reverses to the upside and breaks out of the channel. At the same, price EMA crosses above the middle line of BB, and Awesome Oscillator becomes ‘positive.’

Step 3: Now, let us discuss how to enter a trade. In a downtrend reversal, we enter the market for a ‘buy’ when the price tests the ‘lower high’ of the earlier trend and puts up a bullish candle. This is when we enter with an appropriate stop-loss and take-profit. Similarly, in an uptrend reversal, we enter for a ‘sell’ when price tests the ‘higher low’ of the previous trend and puts up a bearish candle.

As shown in the below image, we enter ‘long’ only when the price reacts from the ‘lower high’ of the previous downtrend and moves higher.

Step 4: Lastly, we determine the stop-loss and take-profit levels for the strategy. In a ‘buy’ trade, the stop-loss is placed below the lowest point of the previous trend, nothing but the lower low. While in a ‘short’ trade, it is placed at the highest point of the previous trend, nothing but the higher high. The take-profit is set in a manner where the risk-to-reward of the trade is at least 1:1. But since we are trying to grab a major reversal of the market, we move our stop-loss to break even once the market gets closer to the take-profit area.

Strategy Roundup

While it can get take a lot of effort to apply all the rules of strategy, it gets easier after little practice. Pay attention to the Awesome Oscillator, where it clearly indicates the shift in momentum in the market. Aggressive traders can also enter the market without waiting for additional confirmation from the ‘lower high’ or ‘higher low.’ All the best.

Categories
Forex Assets

Trading The ‘CAD/MYR’ Forex Exotic Currency Pair

Introduction

The CAD/MYR is an exotic Forex currency pair where CAD is the Canadian Dollar, and the MYR is the Malaysian Ringgit. In this pair, CAD is the base currency, while the MYR is the quote currency. The price associated with this pair represents the amount of MYR that can be traded for 1 CAD. For example, if the price of the CAD/MYR is 3.1163, it means that 1 CAD can purchase 3.1163 MYR.

CAD/MYR Specification

Spread

When trading a currency pair, the ‘bid’ price and the ‘ask’ price are different. This difference constitutes the revenues that brokers earn, and is called the spread. Below is the spread charges for ECN and STP brokers for CAD/MYR pair.

ECN: 4 pips | STP: 9 pips

Fees

Fees represent the charges that brokers impose on forex traders when opening a position. These charges vary on the ECN account, depending on your forex broker. STP accounts usually do not charge fees for trading.

Slippage

Sometimes we intend to complete a trade with a prevailing price, but instead, the trade is executed at a different price. The difference between the two prices is slippage, and it is a result of market volatility and your broker’s speed of execution.

Trading Range in the CAD/MYR Pair

The trading range shows the volatility of a currency pair across different timeframes from minimum to the maximum expected volatility. The knowledge of market volatility can help a trader estimate possible gains or losses for different timeframes. Let’s say that the maximum volatility for the CAD/MYR pair at the 1-hour timeframe is 20 pips. A forex trader trading one standard lot of this pair can expect to gain or lose $64.2

Below is the trading range for the CAD/MYR pair.

The Procedure to assess Pip Ranges

  1. Add the ATR indicator to your chart
  2. Set the period to 1
  3. Add a 200-period SMA to this indicator
  4. Shrink the chart so you can determine a larger period
  5. Select your desired timeframe
  6. Measure the floor level and set this value as the min
  7. Measure the level of the 200-period SMA and set this as the average
  8. Measure the peak levels and set this as Max.

CAD/MYR Cost as a Percentage of the Trading Range

When the cost of trading is expressed as a percentage of the trading range, it can help a forex trader implement proper risk management measures. Below are cost analyses of the CAD/MYR pair for both the ECN and the STP accounts.

ECN Model Account

Spread = 4 | Slippage = 2 | Trading fee = 1

Total cost = 7

STP Model Account

Spread = 9 | Slippage = 2 | Trading fee = 0

Total cost = 11

The Ideal Timeframe to Trade CAD/MYR

In both the ECN and STP accounts, the 1-hour timeframe during minimum volatility of 0.1 pips has the highest trading cost. Generally, the 1H, 2H, 4H, and daily timeframes have higher trading costs compared to the weekly and the monthly timeframes. Therefore, longer-term traders of the CAD/MYR pair enjoy lesser trading costs.

However, the intraday traders can reduce their trading costs by initiating trades when the volatility for the 1H, 2H, 4H, and daily timeframes is above average. They can further lower these costs by using the forex limit orders, which eliminates the slippage costs. Here’s an example with the ECN account.

ECN Account Using Limit Model Account

Total cost = Slippage + Spread + Trading fee

= 0 + 4 + 1 = 5

You can notice that the overall trading costs have reduced when the limit orders are used. For example, the highest trading cost has been lowered from 118.64% to 84.75% of the trading range. Cheers.

Categories
Crypto Daily Topic

What’s Illicit Crypto Mining?

The value of cryptocurrencies has been on a steady rise in recent years. Even if the market itself has experienced a downturn, the collective idea of crypto as an asset continues to be alluring, driving in more interested investors. 

There are several ways to earn cryptocurrency, with one of those being mining. Cryptomining is the process of generating cryptocurrency using computational and energy resources, and it’s usually a rigorous process that requires tremendous effort. And like anything else where money is involved, certain people would rather cut corners than put in honest work. These are people who fraudulently mine cryptocurrency using illegitimate methods in what’s known as illicit cryptomining.

How Does Illicit Cryptomining Work? 

Illicit cryptomining involves cyber-crooks tricking unwitting victims’ to have their computer or phones infiltrated with malicious malware that gives them (the crooks) access to their devices. They then use the devices’ CPU power to mine cryptocurrency with the returns going to them.

There are two main ways through which illicit cryptominers get into people’s devices: 

#1. Binary-based – involves tricking the victims into clicking on a malicious link sent to their email or downloading and installing corrupted applications. These links and apps have cryptomining code that immediately embeds itself into the victim’s device as soon as they click on the link or install the app. 

#2. Browser-based – this is when hackers infect websites and ads with malicious JavaScript code. Once a victim visits the websites or clicks on ads, the code is almost immediately loaded in their computer, and the script automatically launches the crypto mining code. Once this code runs on the unsuspecting victims’ device, the hacker gains access to the computer to begin surreptitiously mining cryptocurrency.

Which Cryptocurrencies are Illicitly Mined?

While any cryptocurrency could be the subject of illicit cryptomining, Ethereum and Monero are the most targeted. The two cryptos possess certain features that make them attractive to illicit cryptominers instead of, let’s say, Bitcoin. 

For one, both cryptocurrencies can be mined with regular GPUs and CPUs. Second, the two cryptocurrencies, Monero especially, offer a relatively high level of transaction anonymity. 

Is Illicit Cryptomining a Victimless Crime?

While illicit crypto mining does not target any specific person, it’s by no means a victimless crime.

In most cases, victims are often oblivious to the mining software embedded in their devices. If they are not keen enough to, for instance, notice reduced performance in their devices, they will never know what they were exposed to. Also, this cryptomining malware may overwhelm a device, causing users to experience low performance. And in extreme cases, the malware can permanently damage the device’s hardware. 

What Factors are Enabling Illicit Cryptomining?

  • Cryptocurrencies have exponentially increased in value, making illicit mining an attractive trade to cybercrime perpetrators
  • Very few people and organizations invest in cybersecurity software, leaving a loophole for illicit crypto miners to exploit
  • With the introduction of cryptocurrencies that offer transaction anonymity, illicit miners funnel crypto directly to their wallets without being traced
  • Illegitimate mining tools are easily available on the dark web. In addition to this, the crypto mining malware is also a fairly simple code to write
  • The increased practice of pool mining

How Can You Avoid Falling Victim?

To avoid falling victim to these cyber-attacks, you can follow some basic security guidelines;

  • Download software only from reputable and authorized websites.
  • Avoid clicking on random and anonymous email links or attachments.
  • Install premium and legit antivirus software. Antivirus detects, removes, and protects your PC from any form of malware.
  • Refrain from using easy passwords. Avoid setting up a password with your name, pet name, or birth date, followed by numbers. Stronger passwords are made of more than 15 characters
  • Sharing or storing your login information on your device increases the risk of becoming a victim.
  • Be keen to notice any abnormal PC behavior. High fan usage is usually a good giveaway.
  • A downloadable browser extension such as NoCoin protects your PC against browser-based cryptocurrency mining. Ad-blocking extensions are equally important in preventing malware attacks since websites’ ads deliver some illicit mining malware. Such ad blockers can detect and stop cryptomining scripts.
  • Regularly update software and the operating system to lock out attackers from exploiting known loopholes in the old versions.
  • Check regularly to see if there are any changes in your computer’s sleep and hibernate functions. Any weird patterns might indicate interference with the cycle
  • If you’re more tech-savvy, you can check existing crypto mining command lines and put up a firewall to prevent underhanded connections to mining pools. You can find a list of malicious websites here
  • If you’re an organizational user, use the principle of ‘least privilege’. Users should have device accounts that allow them to perform only the necessary tasks. This lowers cryptomining risk by limiting the possibility of admins being duped into installing malicious software 
  • Use application controls that permit apps to run to a minimum. This measure would greatly curtail any cryptomining malware

Final Thoughts

Illicit crypto mining is one of the many scams used by people who want to earn cryptocurrency dishonestly. And while it may appear harmless, the fact is your programs are being slowed down, and your device is handling more than it was designed to do, potentially damaging it prematurely. And like any hacking trick, illicit crypto miners will continue finding new ways to carry out the attack. If you’re a device user, following the above simple guidelines should go a long way to protecting yourself. 

Categories
Forex Fundamental Analysis

What Should You Know About ‘Social Security Rate For Companies’ Forex Fundamental Indicator?

Introduction

Social Security Program is one of the most extensive Government programs in the world that pays out billions of dollars to its citizens each year. Social Security is a macroeconomic program intended to act as a safe-net for active workers of the United States. Changes related to this program tends to affect the majority of the population. Hence, understanding its role and impact on the living conditions of people can give us a better insight into how such programs work.

What is Social Security Rate For Companies?

Social Security Program: The Social Security Program is designed to facilitate retirement benefits, survivor benefits, and disability income for the citizens of the United States. It is run by the federal agency known as Social Security Administration. Social Security is the word used for the Old-Age, Survivors, and Disability Insurance (OASDI) program.

The program was born on August 14, 1935, where President Franklin D. Roosevelt signed the Social Security Act into law of the United States. Since then, the program has continuously evolved and changed significantly over the years. It is a government insurance program designed to act as a safety net for the working population in the United States.

To be eligible for the Social Security retirement benefits, the worker must have an age of 62 at a minimum and should have enrolled and paid into the program for ten years or more. Workers who wait till later ages like 66 or 70 receive higher and higher benefits accordingly.

Apart from the worker himself, a divorced spouse can also be eligible for benefits provided she has not remarried, and their marriage lasted over ten years. Similarly, children of retirees can also be eligible until the age of 18, which can be longer in the case of disability or child being a student.

Social Security Tax: It is the tax levied upon both the employer and employee to fund the Social Security Program (SSP). It is collected as a payroll tax as mandated by the Federal Insurance Contributions Act (FICA) and the Self-Employed Contributions Act (SECA).

Social Security Rate: For the year 2020, the Social Security Rate is 12.4% that is evenly divided between the employee and the employer. It implies the Social Security Rate for Companies is 6.2%.  Social Security Tax is levied on the earned income of employees and self-employed taxpayers. Employers generally withhold this tax from the employee’s paycheck and forward it to the Government.

It is also worth mentioning that there is a tax cap to the Social Security Fund. For 2020, the Social Security tax cap is $137,700, meaning any income earned above 137,700 is not subject to the Social Security tax.

How can the Social Security Rate For Companies numbers be used for analysis?

Social Security is regressive, meaning it takes a more significant percentage of income from low-income earners than their higher-income counterparts. It occurs because of the tax cap, as mentioned earlier, due to which higher-income earner’s portion of income is not subject to this tax deduction.

The collected funds are not stored for the currently paying employee; instead, they are used for the retirees currently eligible for collection. Some have raised concerns on this way of approach when the baby boomer generation starts to collect its benefits, then the ratio of paying to the collecting people would be tipped off. It would mean that more people are collecting benefits than the people paying into it.

Hence, a common worry in the 21st century is the insolvency of the Social Security Funds due to the increased life expectancy of people and decreasing worker-retiree ratio. Proposed solutions to this from analysts were to increase the current rate to keep the program funded. Still, politicians are hesitant to endorse it due to fear of backlash or negative sentiment outburst from the public.

The 2020 report from the OASDI trustees projects that the retirement funds would be depleted by 2035 and disability funds in 2065. When that occurs, the taxes would not be enough to fund the entire Social Security program, and the Government needs to fill this gap. It may result in higher taxes on workers, fewer benefits, higher age requirements, or a combination of these.

For companies, an increase in Social Security Taxes directly cut down their profit margin, and hiring is more expensive. As a result, companies would be forced to keep employees only when required to avoid losses. Hence, Tax rates have a cascading effect on business profitability for companies as well as employment rates for the United States. When Social Security Taxes increase, the income offered to the employees is also affected, which can discourage personal consumption and spending for the working citizens.

Impact on Currency

The Social Security Rate for the Companies and the employees are revised every year. For consecutive years it tends to remain constant and tends to change in small incremental steps over a few years at a time. Hence, the volatility induced in the currency markets is almost zero to negligible most of the time unless significant changes occur. The changes also would be priced in through news updates into the market long before we receive official statistics.

Hence, Social Security Rate is a low-impact indicator and can be overlooked for more frequent statistics for the FOREX markets.

Economic Reports

The U.S. Social Security Administration provides the complete historical data of the Social Security tax rates for both the employee and employer on its official website. The Organization for Economic Co-operation and Development (OECD) also maintains the same for its member countries on its official website.

Sources of Social Security Rate For Companies

Social Security Rates for companies can be found on the Social Security Administration website.

Social Security Rates for employees can be found on the OECD’s official website.

Social Security Rates for companies (similar policies with different names) across the world can be found on Trading Economics.

How Social Security Rate for Companies News Release Affects Forex Price Charts

By law, companies are required to contribute half of the social security rate that their employees contribute. In the U.S., this rate for companies in 7.65% for each employee on the payroll for up to $ 137,700 per employee. This rate is reviewed annually and has remained unchanged in the U.S. for the past 25 years. For forex traders, this release of this rate in the U.S. is considered a non-news event since it is not expected to impact the forex market.
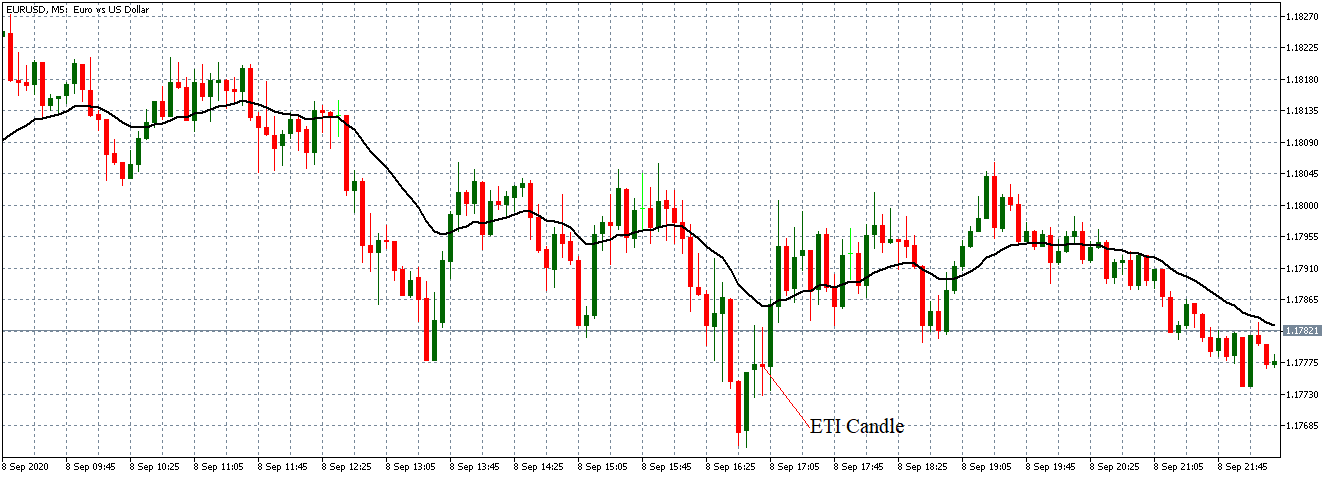
The screen capture below shows the current social security rate for companies in the U.S. taken from Trading Economics.

The latest review of the U.S. social security rate was on October 10, 2020, at 4.00 PM ET, and the press release can be accessed here.

Now, let’s see how this news release made an impact on the Forex price charts.

EUR/USD: Before social security rate release October 10, 2020, 
just before 4.00 PM ET

As can be seen on the above 15-minute EUR/USD chart, the pair is on a weak downtrend before the news release. This downtrend is evidenced by the candles forming slightly below the 20-period Moving Average between 12.00 PM and 3.45 PM ET. Furthermore, the Moving Average appears to be flattening.

EUR/USD: After social security rate release October 10, 2020,
at 4.00 PM ET

As expected, there was no market volatility after the news release about the social security rate for 2020. The chart above shows a 15-minute “Doji” candle forming after the news is released. The pair later traded on a neutral pattern as the 20-period Moving Average flattened. The news release about the social security rate for companies did not have any impact on the price action of the EUR/USD pair.

Let’s quickly see how this new release has impacted some of the other major Forex currency pairs.

GBP/USD: Before social security rate release October 10, 2020, 
just before 4.00 PM ET

Before the news release, the GBP/USD pair is on a steady uptrend, as shown by the chart above. An hour to the release, the uptrend became subdued, and the pair adopted a neutral pattern.

GBP/USD: After social security rate release October 10, 2020, 
at 4.00 PM ET

After the news release, the pair forms a 15-minute “Doji” candle. It continues to trade in the neutral pattern observed earlier.

AUD/USD: Before social security rate release October 10, 2020, 
just before 4.00 PM ET

 AUD/USD: After social security rate release October 10, 2020, 
 at 4.00 PM ET

The AUD/USD pair shows a similar neutral trading patter as the EUR/USD and GBP/USD pairs before the news release. This trend is evidenced by the 15-minute candlesticks forming around a flattening 20-period Moving Average between 1.00 PM and 3.45 PM ET. After the news release, the pair forms a 15-minute “Shooting star” candle and continues to trade in the same neutral pattern as before.

From the above analyses, it can be seen that the news release of the social security rate for companies does not have any impact on the price action.

Categories
Cryptocurrencies

All You Need to Know About Contentos (COS)

In today’s world, we consume carefully-crafted media content for mass appeal. The creative muses and authenticity of content creators are muffled by the need to make content that will generate the most attention and sales. 

On top of that, the big part of sales goes to content platform owners, while the content owners get scrapings. Content creators end up getting the raw of the deal on both ends: they can’t express themselves freely, and they still get reaped. 

Contentos aims to decentralize everything surrounding content creation, consumption, and distribution, and ensure everyone is getting their fair share. Since it uses the blockchain, everything is transparent and irreversible, promoting fairness. 

This article will get a closer look at the Contentos platform and its utility token, COS. 

Understanding Contentos

Contentos is a blockchain-based platform that aims to empower content creators, consumers, and other relevant parties to earn fair dues for their contributions. Today’s content landscape is largely centralized, with platforms relying on advertising as a lifeline. The result is that content creators have to come up with “marketable” content instead of staying true to their creative spirit.  

This ad-driven content world stifles creators’ creativity. Is their true creative direction being traded for surface-level mass appeal? And at the end of the day, where is most of the money going? Indeed, the lion share of revenue is pumped to the corporate owners, leaving scraps for the influencers/creators. Needless to say, this kind of model is extremely unfair to the creators. The platform owners reap the biggest benefits, while the actual content producers walk away with pennies. 

The Contentos team wants to help change this because they believe every contributor to a content platform deserves their fair dues. Thus, Contentos takes advantage of blockchain-enabled tokenization to create fairer and more democratic content ecosystems. Creators, curators, distributors, verifiers – and more are rewarded with Contentos’ native token, COS. 

Contentos says its vision is to “build a decentralized, global digital contact community that allows content to be freely produced, distributed, rewarded, and traded while protecting author rights.” 

What are Contentos’ Core Features? 

#1. Identity authentication – the identifying info of every member is recorded on the publicly and transparently available on the blockchain

#2. Content copyrights: Contentos’ public blockchain records everything in the life cycle of content creation. Community members can check the ownership, generation, and transaction history of a creation

#3. User credibility: Contentos’ user credibility system permanently records the credentials of every user on the public chain – a system that holds everyone accountable for their actions

#4. Smart contracts: Contentos’ public chain implements smart contracts via its Contentos Virtual Machine (CVM)

#5. Storage mechanism: Contentos’ chain will, in the future, support content storage in various formats in exchange for COS tokens

What are Some of Contentos’ Key Highlights?

#1. Public blockchain – Contentos runs a public chain optimized for the content industry to support the voluminous interactions of the space, the platform’s self-adaptive Byzantine Fault Tolerance consensus (saBFT) – which facilitates fast and affordable transactions

#2. Reward model – Contentos’ features an inbuilt reward model to encourage good behavior. The model is designed to be democratic such that it’s not dominated by the biggest token holders

#3. Open platform – Contentos is actively involved with various apps such as PhotoGrid and LiveMe, which is the easy way to introduce individuals everywhere to the blockchain world

What’s the Technical Makeup of Contentos? 

The Contentos architecture is made of three core layers that complement each other to bring out the best of the system. These include the protocol, API, and application layers.

  • Protocol layer – this layer oversees core operations such as the consensus protocol, the public ledger, the gossip network, and so on.
  • API layer – this layer defines the business possibilities for Contentos. It oversees account management, block generation, content publishing, and the tipping and rewards model.
  • Application layer – Contentos supports a decentralized and safe DApp environment complete with a one-click deployment feature.

Participants in the Contentos Ecosystem

#1. Content creators 

These are the core users of the platform. The Contentos team believes they should get the highest share of the revenue. On the platform, content creators can earn cryptocurrency by publishing original content. If more than one person owns the right to the content, the user can specify this and how much each owner is owed. When content is uploaded, the owner will be rewarded based on how many times it’s viewed. Advertisers can also place ads in the content, upon which the content owner will personally determine the payment.

#2. Content distributors

These are participants who recommend and deploy content to the right audience. If they get it right, they stand to earn tokens as well. 

#3. Content consumers

These are the target audiences for content. They make their contribution to the ecosystem through liking, sharing, and commenting on content. Consumers can also gift content creators to show their satisfaction with content. They can also subscribe to content, thereby incrementally paying creators. Alternatively, they can purchase content in a one-off payment. 

#4. Community operators

These are users who can earn tokens by reporting/flagging inappropriate or illegal content. They can also classify content so that it’s correctly matched with the target audience. 

#5. Developers

These are participants who contribute to the Contentos public chain and earn tokens. This can include fixing bugs and updating software.

#6. Bookkeepers

These are participants who are chosen by the community through a voting process. The bookkeepers are responsible for producing blocks, with 21 of them participating in every round. If a bookkeeper, for whatever reason, fails to generate a block within 24 hours, they are removed from the roll call and replaced by the next one in line. Bookkeepers are rewarded in COS tokens. 

saBFT Consensus

Contentos utilizes a self-adaptive Byzantine Fault Tolerance consensus (saBFT) mechanism, in which the BFT voting process is done separately from the generation of blocks. Block producers are chosen via voting. The more tokens a voter holds, the more meaningful and powerful their vote. A block is recorded on the blockchain when it’s confirmed and agreed upon by a two-thirds majority in two-round voting. 

What’s the COS Token? 

COS is the native token of the Contentos network. The token is used for the following ends: 

  • Voting – COS holders can make their voice heard on the future direction of the protocol as well as when choosing block producers.
  • As payment for gas fees after the initial free “energy” runs out.
  • As a means for consumers to purchase gifts for creators to express their enjoyment of the content
  • As payment for advertising done on content

Distribution of COS

COS token was distributed in the following manner: 

  • 9.5% went to the strategic sale
  • 11.32% went to the seed sale
  • 15% was awarded to the Contentos team
  • 0.5% was awarded to advisors
  • 18.68% went to the foundation reserve
  • 5% went to the app jumpstart reward reserve
  • 35% went to the ecosystem reward reserve
  • 3.5% went to the community development reserve
  • 1.5% went to the token treasury

Key Metrics

At the time of writing (Sep 14, 2020), the Contentos token traded at $0.007950, with a market cap of $17,061,271 that placed it at #373. The token’s 24-hour volume was $1,515,380, while it’s circulating and total supply were 2,146,128,511 and 13.5 billion, respectively. COS’s highest and lowest-ever price was $0.085274 (Jul 08, 2019) and $0.004264 (Mar 29, 2020). 

Buying and Storing COS

You can find COS tokens in a variety of exchanges, including Binance, Gate.io, Coinone, BitHumb, WazirX, Bitrue, Binance DEX, and CoinDCX. 

The COS token is compliant with the BEP-2 standard, meaning it can be stored in any wallet that supports the standard. Great choices include Atomic Wallet, Trust Wallet, Trust Wallet, and BNB wallet. 
Final Thoughts

Contentos seeks to democratize a space that has been dominated by powerful centralized entities that flourish at the expense of creators. In the platform, the people who keep the system going – the creators- get the biggest share of revenues. In a snapshot, Contentos returns the power to those who deserve it the most. 
Categories
Crypto Guides

Is Investing In Binance Coin a Good Decision In 2020?

Introduction

Binance coin is a widely known cryptocurrency made by the Binance exchange. It is by far the world’s largest cryptocurrency exchange and offers a wide range of crypto-to-crypto pairs. This cryptocurrency runs on the Ethereum blockchain with ERC 20 standard. Binance coin is also responsible for expanding the scope of the operation of the Binance exchange because the currency supports various utilities on the platform like paying for exchange fees, trading fees, listing fees, and other fees that are payable on the Binance exchange. 

It was made available to the users for the first time during an Initial Coin Offering (ICO) on July 25, 2017. Angel investors were offered 10% of the BNB tokens, the founding team was offered 40% of the tokens, and the various other participants were offered the remaining 50% of the tokens through the ICO process. The funds raised through the ICO process were planned to be allocated for various purposes like: 

  • Branding and marketing of Binance
  • Development of the Binance platform.
  • Upgradation of the Binance ecosystem. 

During April 2018, the market cap of the Binance coin was $1.4 billion.

The Binance coin has also collected support with the help of partnerships that have helped the usage period of the coins. One such partnership was done with Uplive, a premier live-video streaming platform of Asia that sells virtual gifts to the users in exchange for BNB tokens to an extensive user base of 20 million on Uplive. 

Is Binance Coin a Good investment or not?

There are a lot of factors that help to determine whether an asset will be a good investment or not. Market structure, daily trade volume, and USPs (Unique Selling Points) are some of the most relevant factors to make this judgment. Market structure can be defined as the macro price activity of an underlying asset. In the case of BNB, the market structure seems promising.

The currency took off in the year 2019 at an approximate price of $6 and climbed its all-time high price of $38.54 as of June 21, 2019. After that, the price has been significantly retraced along with the rest of the cryptocurrency market and has maintained a good price. Also, at any point in time, the price action of BNB coin remains above the key price levels as well as market structure. 

The daily trading volume of BNB is also impressive. At the time of writing this article, the last 24-hour trading volume $2,193,941,846. Apart from the market structure and daily volume, there is an important factor, i.e. tokenomics, that can help to determine whether an asset will be a good investment or not.

Tokenomics means the design of the cryptocurrency and its characteristics that impact its value. These characteristics include game theory, economic incentives, computer science, and cryptography. The tokenomics of Binance coin are very strong. It has been designed in a way that allows easy adoption and utilization, which increases the price of the coin even more. 

Conclusion

Binance Coin (BNB) is a popular cryptocurrency and can always be found ranked on the top 10 spots of the CoinMarketCap platform. It is a leading token in the crypto exchange ecosystem and is utilized on a large scale on the Binance platform. If Binance will continue to invest efforts in expanding the products, it has to offer and onboards new users. Then there won’t be any reason to classify Binance coin under the ‘not a good investment’ category.

Categories
Forex Daily Topic Forex Price Action

Weekly High/Low Offers a Better Reward in the H4 Chart Trading

We are going to demonstrate an example of a trade setup on the H4 chart. The price, after breaches the last week’s low; it consolidates and produces a strong bearish reversal candle. It then heads towards the South with extreme bearish momentum. Let us find out how that happens.

It is an H4 chart. Look at the vertical line on the left. It is the beginning of the week. The chart shows that the price gets trapped within two horizontal levels. The pair is about to finish its trading week. The chart suggests that both the sellers and the buyers are going to keep their eyes on the chart next week to get the breakout and trade.

The pair produces two bullish candles consecutively to start its trading week. However, it produces a bearish engulfing candle and drives the price towards the South. Do you see anything here? Yes, the pair makes a breakout at the last week’s low. It means that the Bear may dominate on the H4 chart. Ideally, traders are to wait for the price to consolidate or make a bullish correction followed by a bearish breakout to go short in the pair.

The price consolidates. It produces some bearish reversal candles such as spinning top, hammer, Doji candle. However, it does not make a breakout at the last swing low. The sellers must wait for an H4 candle to close below consolidation support. Let us wait for more and see what the price does.

The chart produces a bearish engulfing candle closing well below consolidation support. The sellers may trigger a short entry right after the last candle closes. They may set their stop loss above consolidation resistance and set their take profit with 2R. This is the beauty of using weekly high/low and the H4 chart. It offers an excellent reward. Let us now proceed and find out how the entry goes.

The price heads towards the South with good bearish momentum. It produces three bullish inside bars in this move. The last candle comes out as a bullish engulfing candle. The sellers may consider closing their entry and come out with the profit. If we count, we find that the entry offers more than 2R reward. This is what usually happens when the price makes an H4 breakout at the last week’s high/low. Deep consolidation and a strong reversal candle add more fuel to its journey as usual. In our fore coming lessons, we will learn to integrate Fibonacci levels in this strategy to determine our target with better accuracy. Stay tuned.

Categories
Cryptocurrencies

Introducing Cartesi (CTSI) 

Decentralized applications (DApps) are the future of the internet. But the existing blockchain cannot power a decentralized internet – thanks to a lack of scalability and high fees of operations. 

To unleash the true power of blockchain, we need scalability solutions and an affordable and easy-to-use DApp creation platform. 

Many blockchain projects have jumped into the fray to help address these issues. Cartesi, a layer-2 solution, is one such project. The Cartesi platform provides a decentralized Linux environment for the scalable and programmable creation of DApps. 

In this article, we’ll explore the project more deeply and also look at CTSI, the project’s native token. 

What is Cartesi (CTSI)?

Cartesi is a DApp platform capable of supporting complex, off-chain calculations in a Linux infrastructure. The Cartesi team wants to make DApps more cost-effective and cheaper and easier to develop. With the current blockchain setup, the creation of DApps is held back by scalability issues and high fees, and with it, their leap into the mainstream. 

Cartesi hopes to accomplish this by supporting several characteristics:

  • Scalable: Complex and intensive applications can be carried out off-chain while being accorded the same security levels as on-chain
  • Programmable: DApps run on a Linux environment, with thousands of software kits to explore with
  • Adoptable: Barriers to entry such as high fees and new and complex software stacks are removed
  • Decentralized: Consensus is reached in the safe and secure underlying blockchain
  • Portable: Cartesi will make DApps more portable across relevant blockchain networks
  • Private: Application state can be made private and available only to relevant participants

Recent Tidbits of Cartesi

  • August 2020: Cartesi partners with MixMarvel to leverage blockchain for gaming
  • July 2020: Cartesi announces the launch of Decartes software development kits to enable developers to create DApps on Linux
  • April 2020: CTSI holds its token sale on Binance Launchpad
  • March 2020: Cartesi announces Creepts
  • February 2020: Cartesi announces partnership with Newfang, a decentralized file sharing, and storage network
  • January 2020: Cartesi launches the Community Adoption Program – a program to reward community members for promoting the network
  • January 2020: Cartesi creates Telegram channels for the Russian, Chinese, Vietnamese, and Korean user base

Some of Cartesi’s Key Products

#1. Creepts 

Creepts is a decentralized tower defense game built on Cartesi’s blockchain. It’s the first of such a game to be decentralized, and it showcases Cartesi’s blockchain power. In the game, players race against each other for the highest score in a Tower Defense game map. It features tournaments that players can participate in at a minimal fee. 

Creepts features cheat-proof components, and it can run entirely off-chain and still provide the security and decentralization of the blockchain tech beneath. This is possible because the game was designed to be able to play outside of any particular virtual environment.

#2. Cartesi Machine 

This is a Reduced Instruction Set Computer Version 5 (RISC-V) emulator that powers off-chain computations. The Cartesi Machine can handle way more calculations than those executed directly as smart contracts. On the Cartesi Machine, too, developers can use already-familiar software to build DApps. 

#3. Cartesi Side Chain

The Cartesi Side Chain is a new technology by the Cartesi team that addresses the scalability problem without compromising decentralization. It’s an alternative to sharding and a more tailored approach. 

The Cartesi side chain will solve the Data Availability Problem (DAP) in which the processing of transactions will be done as soon as data is available to all relevant parties. Also, not every participant will need to download the whole blockchain. The side chain will implement a ‘Locality’ solution, but this time, users will have more control as opposed to a fixed protocol. 

Another major feature of the Cartesi side chain will be Garbage Collection. What this means is Cartesi will not have to keep the entire transaction history of the network – a factor that would weigh it down for very little or no real benefits. Cartesi will also employ an embedding protocol – which means it will use the underlying blockchain to carry out the basics as it focuses on more complicated processes such as randomizing transactions, ordering of packages, voting, and so on. 

Use Cases of the Cartesi Protocol

The following is a snapshot of the possible use cases for the Cartesi network. 

#1. DeFi – Since Cartesi will be able to handle multiple, complex computations, DeFi applications will be free from the scalability problems of the existing blockchain set up. It will also support interoperability among blockchains and a variety of services.

#2. Gaming – Cartesi will support new possibilities for the gaming world – from developers being able to use already available tools to affordability to computational scalability. 

#3. Machine Learning – Cartesi will create a decentralized environment for emerging techs like machine learning, artificial intelligence, and more.

#4. Optimizing Logistics: People in professions such as logistics and transportation all over the world can use Cartesi’s platform to hire and get hired very affordably and without the need for intermediaries. 

#5. Research: Cartesi will massively support research in fields such as science, health, 3D rendering, and other types of research that require computational intensity. This will be possible because people across the globe can rent their idle computing power.
The Cartesi Token 

Cartesi, stylized as CTSI, is the native cryptocurrency of the Cartesi network. CTSI is the native token of Cartesi network, playing the following roles: 

  • As a mechanism to incentivize good behavior in Cartesi Core
  • As payment for temporary data storage on the Cartesi side chain
  • As a staking mechanism for the network’s proof-of-stake consensus. The more tokens you own, the higher the probability that will be selected to participate in block production
  • As a powering mechanism for the Data Availability Protocol

How Was CTSI Distributed? 

CTSI was distributed in the following manner: 

  • 10% went to the Launchpad Sale
  • 2% went to the Seed Sale
  • 5% was used in the Private Sale
  • 0.67% was channeled to the Strategic Sale
  • 15% went to the Team
  • 2.11% was channeled to Advisors
  • 40.22% to the Foundation Reserve
  • 25% went to the Mining Reserve 

Cartesi: Key Metrics 

The Cartesi token traded at $0.052403 at the time of writing (Sep 11, 2020). It ranked at #490, with a market cap of $10,396,93, a 24-hour volume of $2,619,247, a circulating supply of 198,403,548, and a total supply of 1 billion. CTSI’s highest and lowest price ever was $0. 129832 (Aug 18, 2020), while its all-time low was $0. 026751, (May 10, 2020). 

Buying and Storing CTSI

You’ll find CTSI listed on several exchanges as a market pair with USDT, BTC, USD, BNB, BUSD, ETH, WETH, etc. Some of the exchanges include Binance, BitMax, Hoo, Binance.KR, HotBit, and BitHumb. 

CTSI is supported by several wallets, including MyEtherWallet, Trust Wallet, Atomic Wallet, and Ledger wallet. 

Closing Thoughts

Cartesi wants to contribute to the future of a decentralized internet by creating a scalable environment for DApps. It has the inherent advantage of letting the underlying blockchain do the heavy lifting while focusing solely on DApp operations. The platform also lets developers utilize their already familiar skills, enhancing their experience. Will Cartesi stand the test of time in a cut-throat blockchain space? Only time will tell.

Categories
Forex System Design

Designing a Trading Strategy – Part 4

Introduction

In our previous article, we presented diverse types of filters, which work as additional rules. We also showed how to incorporate these filters into a trading strategy so that they can help improve its performance. 

In this educational article, the fourth section of the series dedicated to developing a trading strategy, we will discuss the profit management.

Profit Management

Profit management is an aspect of risk management that characterizes by its high level of complexity. The difficulty lies in that profit management seeks to preserve the profits obtained during the trade and also to prevent a premature exit from a market that still moves in a trend not over yet.

There are two available methods with which the trading strategist may manage the profits realized in an opened position. These are the trailing stop and the profit target order.

Trailing Stop

This type of order is dynamic. It moves only in the same direction of the position as it moves in the direction of the trend. In other words, a trailing stop will move upward in a buy positioning and downward in a sell trade. 

Another characteristic of the trailing stop is that it steadily advances during the life of the trade. It will never retrace when the price develops a movement against the trade’s direction.

The trailing stop has two components, which are detailed as follows:

  • Trailing stop: corresponds to the number of pips in which the stop loss order will move once the price moves in the trade direction. For example, if an order has set a 40-pip stop-loss, and the price advances 30 pips in favor of the trend, the new stop-loss will shift to 10 pips below the opening price. In general, there are several ways to establish a trailing stop: by fixed pip variation and by volatility using the Average True Range (ATR) indicator, or using SAR (Stop and reverse) stops. 
  • Step: this corresponds to the variation in pips that the dynamic stop will move behind the price when it has been activated.

Profit Target Order

The second mechanism to manage profits is by using a profit target order. This type of order is conditioned to the prince advance to a predetermined level. Likewise, compared with the trailing stop case, this order is not affected by the price decrease. However, its activation is subjected to the price reaching a specific level.
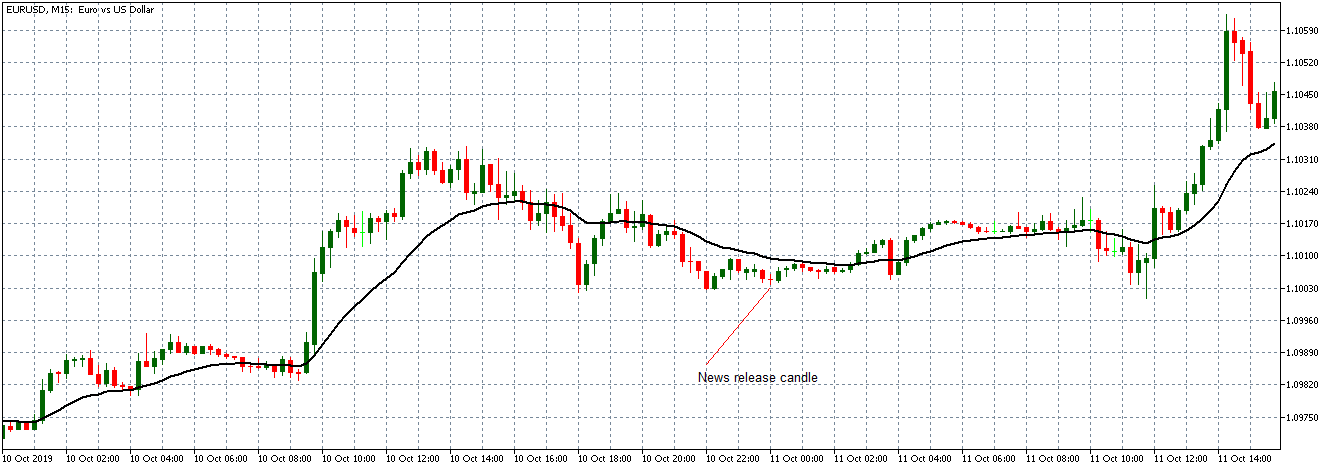
 A profit target order can be set using a specific number of pips, by a multiple of the Average True Range (ATR), a percentage of price increase ( or decrease), specific levels of resistance or support, or a specific dollar gain.

Using the Trailing Stop in a Trading Strategy

This example illustrates the impact of using a trailing stop with a two moving averages crossover strategy, corresponding to LWMA(5) and SMA(55) periods using the EURUSD pair.

 We have evaluated the performance of a 40-pip trailing stop with a variable step from 1 to 15 pips. The results are as follows.

In the table above, we distinguish the impact on drawdown reduction with respect to the base scenario, after the incorporation of a trailing stop rule to the MA crossover strategy. The base case, on which the exit rule is the MA cross in the opposite direction to the opening of the position, exhibits a 22.66% drawdown. However, the addition of trailing stops led to a reduced 10.44% drawdown and a net profit of -525.88 (USD).

Each trailing stop step variation scenario, including the base exit scenario of the trading strategy, is shown in the following figure.

Finally, we observe that a 7-pip step provides the lowest losses. We also highlight that as the step increases, the drawdown also increases, confirming the growing losses.

Conclusions

The application of Profit Management represents a significant challenge for the developer of the trading strategy. This complexity arises due to a wide variety of combinations that can be used to ensure the strategy’s gains as each trade moves in the trend direction.

In this context, as we have seen, the parameter setting to be considered, the trailing stop, profit target orders, or its combination, should be carefully evaluated before applying them to the trading strategy, to ensure the optimal settings.

In the next educational article, we will present the fifth and last part of the series dedicated to developing trading strategies that will explain the position sizing process.

Suggested Readings

  • Jaekle, U., Tomasini, E.; Trading Systems: A New Approach to System Development and Portfolio Optimisation; Harriman House Ltd.; 1st Edition (2009).
  • Pardo, R.; The Evaluation and Optimization of Trading Strategies; John Wiley & Sons; 2nd Edition (2008).
Categories
Cryptocurrencies

Introducing TomoChain (TOMO)

Ethereum brought a ton of possibilities to the blockchain space. Before it, the world didn’t know that blockchain could be used for so much more than a digital currency platform. The Ethereum initiated support for decentralized applications (DApps) – a new kind of applications that are totally free of any kind of centralized control. This means users also have total control over their privacy and data. 

Thanks to DApps, totally unprecedented types of markets are now in play. From virtual real estate to the ability to breed cute virtual cats, we’re seeing the idea of games and making money pushed to new and exciting boundaries.

But as with any emerging technology, Ethereum faces serious scalability issues. No single event illustrates this better than the CryptoKitties saga, where the game grew so popular as to nearly bring the Ethereum network to its knees. 

Several solutions have emerged in the past few years to address this issue. Most of these are independent blockchain projects that want to support DApps in a far more scalable environment than Ethereum’s. 

One of these solutions is Singapore-based TomoChain. Launched in Dec 2018 and, TomoChain intends to tackle the problem of blockchain scalability. So, how is it different? What unique solution does it bring to the table? In this guide, we’ll answer those questions in a detailed version. We’ll also look at the platform’s native crypto: TOMO. 

Understanding TomoChain

TomoChain is a public blockchain ecosystem that aims to support the highest levels of privacy, usability, and speed for various projects. The TomoChain team wants to accomplish this while still adhering to the tenet of decentralization. To do this, they’ve deployed a Proof of Stake Voting (PoSV) consensus mechanism. 

TomoChain says their mission is “to accelerate the onboarding of millions of users by empowering today’s applications with technology that masks the friction of blockchain all the while retaining its underlying benefits.” 

To achieve this, TomoChain employs a variety of features, including: 

  • A PoSV Consensus: this is a consensus mechanism enabling fair voting, fast confirmation times, and rigorous security 
  • Double Validation: This involves confirming the authenticity of a block twice. When a masternode creates a block, another randomly selected masternode must verify it before it’s added to the blockchain.
  • TomoZ: A frictionless payment protocol through which users can pay for transaction fees
  • TomoZ: A highly-secure and decentralized crypto exchange protocol
  • TomoP: A privacy-oriented transaction protocol featuring an anonymizer and high transaction speeds

We’ll be looking at these features in more depth from here on out. 

TomoChain’s PoSV and Masternodes

The TomoChain network is maintained by 150 masternodes via the PoSV consensus. Masternodes are participants in the network who are chosen by token-holders to produce and confirm blocks. To become a master node, you need to stake at least $50,000 TOMO tokens. 

Each block creation period is known as epoch. Masternodes take every block through the double validation process. After every epoch, voters who voted in the participating masternodes are rewarded, as are the masternodes. 

Generally, for every block, the rewards are distributed as follows: 

  • 40% for masternodes
  • 50% to voters, with each voter’s reward based on how much contribution the masternode they voted for, has made for the last 900 block
  • 10% goes to the Masternode Foundation

Double Validation

TomoChain utilizes a double validation process to achieve an almost unassailable security level. When a block is produced by a masternode, it must be verified by one more masternode before it’s pushed to the blockchain. The second verifying master node is randomly selected from the pool of masternodes. 

The double validation mechanism enhances the security and stability of the TomoChain platform. It reduces the probability of hard forks, nothing-at-stake attacks, and ”garbage blocks”. 

Some Decentralized Apps by TomoChain

  • TomoMaster: this is a staking DApp that allows token-holders to vie to become a masternode, or to vote for such candidates. This is accomplished through the use of wallets such as TomoWallet, Ledger, MetaMask, and so on
  • TomoSwap: this is a decentralized exchange protocol integrating Kyber Network. With TomoSwap, users can seamlessly exchange assets among each other and various applications
  • TomoPool: this is a service that allows users to earn dividends on their staking yield
  • MaxBet: this is a decentralized, secure, and transparent gambling game 

What’s Tomo Token? 

TOMO is the native cryptocurrency of the TomoChain network. It was initially created as an ERC20 token before moving to the mainnet in Dec 2018. TOMO plays essential roles in the TomoChain ecosystem, for instance: 

  • As a reserve currency for DApps
  • As funding for the future development of the TomoChain protocol
  • As an incentivizing mechanism for developers to contribute to the ecosystem
  • As a governance mechanism of the network

TOMO was distributed in the following manner: 

  • 15.65% went to the seed sale
  • 31.45% went to the private sale
  • 4% went to the public sale
  • 15.9% went to the team and advisors
  • 16% went to the token treasury reserve
  • 17% went to the mining rewards reserve

Key Metrics of TOMO

As of September 3, 2020, TOMO traded at $0.813238, with a market cap of $58,396,765, a 24-hour volume of $10,737,756, a circulating supply of 71, 807, 725 and a total supply of 100 million. TOMO’s highest-ever and the lowest-ever price is $2.30 (April 29, 2018), and $0.140721 (March 13, 2020). 

How to Buy and Store TOMO

TOMO token can be purchased from a range of exchanges, including Binance, BitForex, MXC, KuCoin, TomoDEX, WazirX, VINEX Network, Gate.io, CoinDCX, Beaxy, BitAsset, FTX, ATOMARS, and more. 

TOMO tokens can be stored in any of these wallets: TomoWallet, Atomic Wallet, Coinomi Wallet, MetaMask, Trust Wallet, and industry favorites Ledger Nano and Trezor.

Final Thoughts

TomoChain brings new concepts to the blockchain space like PoSV consensus and double validation. These and more innovative protocols by the TomoChain team sets it apart from the sea of projects looking to best Ethereum. It remains to be seen whether the project can thrive in the ultra-competitive crypto and blockchain space.

Categories
Forex Videos

Forex Position Sizing Part 8 – Optimal F Revisited – Why You Must Know it?

Position Sizing VIII – Optimal F Revisited: Why You Must Know it?

Now that we know the properties of optimal f, many of you may ask why we bother with this theme, that Optimal f is just a theoretical limit nobody would even approach.

Well, that may be true ( or not). Nonetheless, information is power, and knowing the optimal f of our strategy or system is quite informative. To begin with, maybe unknowingly, you are trading beyond the optimal point.

The next graph shows several distributions’ f-curves with different percent winners and payoff (reward/risk ratios) that may match different trading systems.


In the graph, we can see that one of them, shown in red, is unprofitable, so the best position size is zero. The first profitable distribution shows its optimal f in the vicinity of 5%. That may indicate the system is poor, and a trader will be beyond its optimal f when several simultaneous trades are taken.
By knowing the optimal f of the strategy we are using, we can assess its quality and figure if we breach the optimal trading limit, risking too much. Thus, optimal f will allow us to compare the real power of a trading system, measured by its geometric mean. The best attainable geometric mean will indicate which trading system to choose among a list of candidates.

A safer way to compute optimal f?

Ralf Vince defines Optimal f as the divisor of the biggest loss, the result of which is divided by the total cash to know how many pips or contracts to have in the next trade. But he assumes that the worst loss has already happened. It is much better for a trader to assume it has not happened.

Due to the properties of the random processes, the statistical properties vary from sample to sample. There is no way to assess the real value, and that is true for all statistical distributions of trading systems.

Montecarlo resampling

With the use of computers and high-level programming languages such as Python, we have on our hands the possibility to create variations of the sequence of trades we took in real life. The use of Monte Carlo resampling will show a more realistic picture of a trading system, signaling its limits and allowing us to be on the safe side.
As an example, let’s examine the performance of forex.academy’s Live Signal service.
The system shows the following basic stat parameters:
STRATEGY STATISTICAL PARAMETERS :

Nr. of Trades: 145.00
Percent winners: 67.59%
Profit Factor: 2.41
Reward Ratio: 1.16

The code to create several thousand different histories is simple. We use Cython to speed up the process. Cython translates Python into C:

The gethistories() function returns a container with the desired number of trade histories, and with the number of desired trades on each history. This function returns just wins and losses, not capital accumulation.

Using a fixed trade size of 0.1 lots, applied to 10,000 paths, resulting from the Monte Carlo resampling of the original path, on a hypothetical account starting with $5,000, we obtain the following graph, representing about one year of trade activity.


The “smoke cloud” seen is typical of resampling. In the figure, we can see that some paths are luckier than others. The less lucky path shows a final equity of about $19,200, while the most profitable goes over $29,700. This will result in differing optimal f values. That happens because the laws of chance change the sequence’s values; so, every sequence will have its optimal fraction. We look for the lowest optimal f, which will minimize the risk of overtrading.

Finding a safer opt f

This procedure will also help us better assess the optimal f. That means we will compute all the optimal f of the resampled paths. As shown in the histogram below, we obtain a distribution of values that follows a normal distribution.


We can, then, compute the mean, max, and min of the optimal f collection. In this case, are:

  • max opt f: 0.915
  • mean opt f: 0.672
  • min Opt f: 0.39

What we look for with this procedure is to find out the minimum opt f value, since we want to minimize the risk of overtrading. In this case, our min opt f is 0.39, which is large enough to be on the safe side when using multiple positions.
For computer geeks, this is the Python code to do optimal f

Using these three functions, we can easily compute the opt f values of a collection of trade sequences in just one line of code. The second line is just to plot its histogram.


Here rawHist is a container of these sequences or histories. Optf is used to store the values obtained.
Stay tuned! The next episodes will explore more position sizing strategies.