
Introduction
In any economy, the employment rate can be said to be the primary driver of economic growth. Due to its importance, several fundamental indicators track the labor market changes and many more attempting to predict the future of the labour market. Government and central banks’ policymakers may feel comfortable poring through all these economic indicators for the labour market, but for regular forex traders and households, keeping track of all these labour market indicators can be tiresome and even confusing. The Employment Trends Index (ETI), one of the most relevant labour market indicators, is making it easier to understand the labor market trends.
Understanding the Employment Trends Index
The Employment Trends Index is made by aggregating eight labour market economic indicators. The ETI report breaks down which labour market indicators positively impact the ETI and ranks them from the most positive to the least. Through the aggregation of these indicators, the “noise” in the labor market trend is filtered out. It is worth noting that these labour market indicators have shown to be accurate in their areas. These indicators are explained below.
Job openings: The U.S. Bureau of Labor and Statistics publishes this economic indicator. These job vacancies show the gap in the labour market that needs to be filled. It indicates the unfulfilled demand in the labour market and the desirable skills sought by employers. It further shows the potential of households to be gainfully employed in the short term.
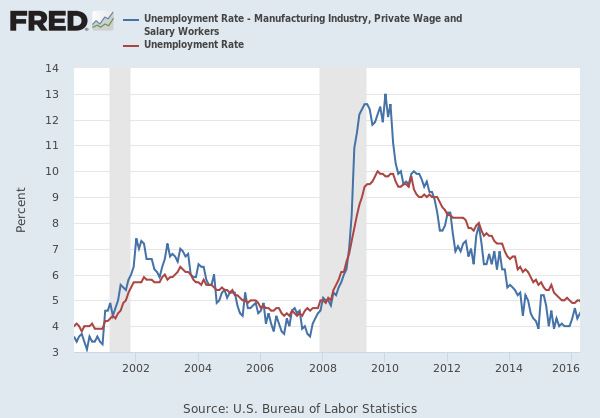
Source: St. Louis FRED
How to use the Employment Trends Index an analysis
The fact that the ETI aggregates most of the crucial labour market indicators makes it an ideal tool for analyzing the economy.
Since the labour market is considered one of the primary drivers of the economy, monitoring its trend can be used to detect the onset of recessions or recoveries. Here’s how. When the ETI is continually dropping, it indicates that the labor market conditions are worsening progressively. This condition is accompanied by a constant drop in the aggregate demand and supply, most consumer discretionary industries will go out of business, and the economy will progressively contract. Conversely, during a period of economic recession, an increase in the ETI signifies that the economy is on a recovery path.
An increase in the ETI does not necessarily mean that each of the underlying eight labour maker indicators improved. A higher ETI could mean that most of these indicators were positive, or they all were. In either of these instances, it means that the overall labour market is improving – it shows that labour conditions are improving. One of the most notable impacts of an improving labour market is the improvement of households’ welfare, which increases the aggregate demand and supply in the economy.
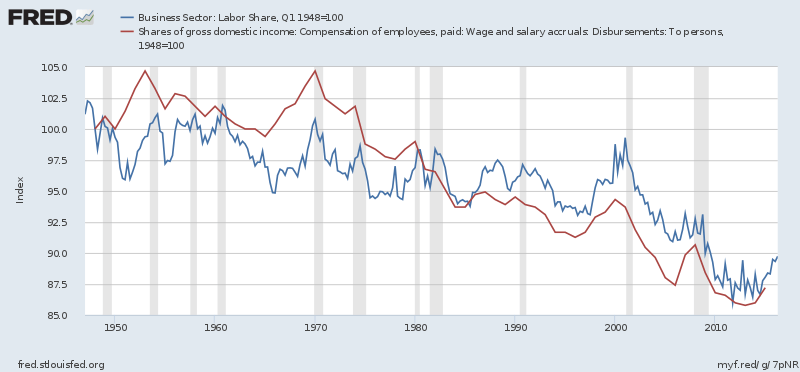
Source: St. Louis FRED
Conversely, a dropping ETI could be caused by a majority of the underlying labour market indicators being negative or all of them being negative. In either of these instances, the labor markets’ conditions are deteriorating, a condition usually punctuated with higher unemployment levels.
Impact on Currency
The ETI could be associated with contractionary and expansionary monetary and fiscal policies. Here are some of the ways that the ETI could impact a country’s currency. A continually increasing ETI means that the labour market has been enjoying a long period of constant growth. Such an instance signifies that the economy has been expanding, the welfare of households improving, and the unemployment levels low.
In any economy, if these conditions are not sustainable, an overheating economy with unsustainable levels of inflation becomes prevalent. In this case, the governments and central banks may be induced to implement contractionary monetary and fiscal policies. Thus, in the forex market, an increasing ETI can be a precursor for higher interest rates, which makes the currency appreciate relative to others.
A constantly dropping ETI is negative for the currency. The dropping ETI means that the overall labour market has been performing poorly. It means that more people are losing their jobs, wages are low, overall aggregate demand is dropping, and the economy is shrinking. With higher unemployment levels, governments and central banks tend to implement expansionary fiscal and monetary policies to stimulate demand and prevent the economy from sinking into a recession. These expansionary policies, such as lowering interest rates, makes the currency drop in value relative to others. In the U.S., the ETI data is published monthly by The Conference Board.
How the Employment Trends Index Report Release Affects Forex Price Charts
The latest release of the ETI report was on September 8, 2020, at 10.00 AM ET and accessed at Investing.com. The screengrab below is of the monthly ETI from Investing.com. To the right is a legend that indicates the level of impact the fundamental indicator has on the USD.
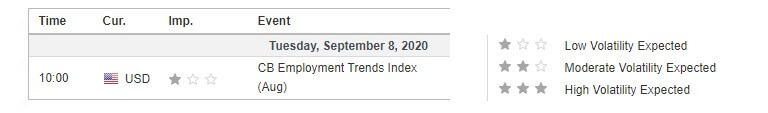
As can be seen, low volatility is to be expected.

In August 2020, the ETI was 52.55 and increase from 51.37 in July 2020.
Now, let’s see how this release made an impact on the Forex price charts.
EUR/USD: Before the ETI Report Release | September 8, 2020. Before 10.00 AM ET
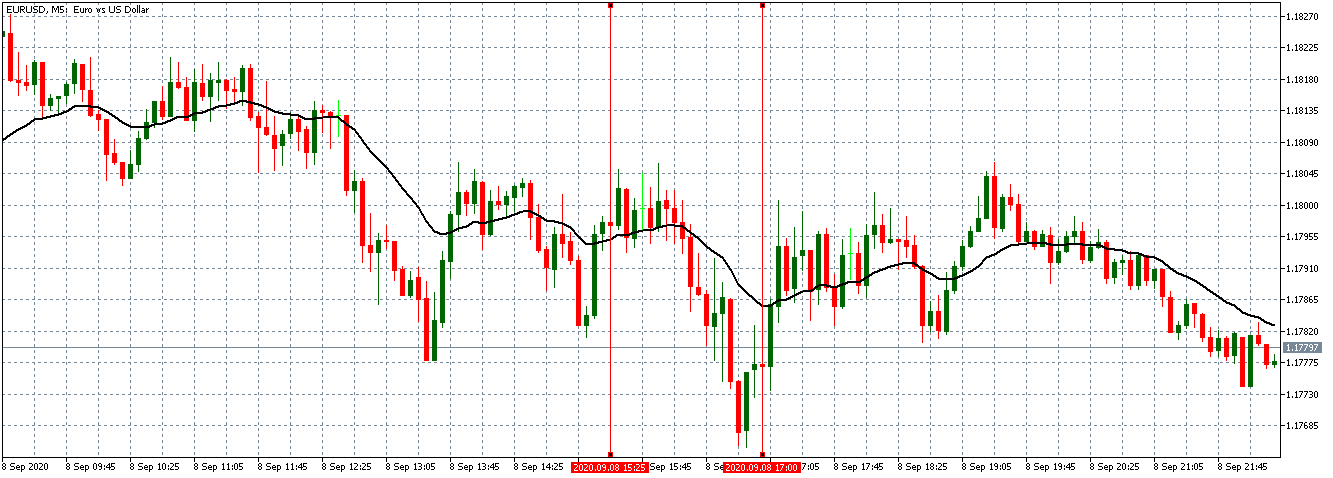
As seen in the above EUR/USD chart, the pair went from trading in a neutral trend to a steady downtrend. The 20-period M.A. is steeply falling with candles forming further below it.
EUR/USD: After the ETI Report Release on September 8, 2020, at 10.00 AM ET
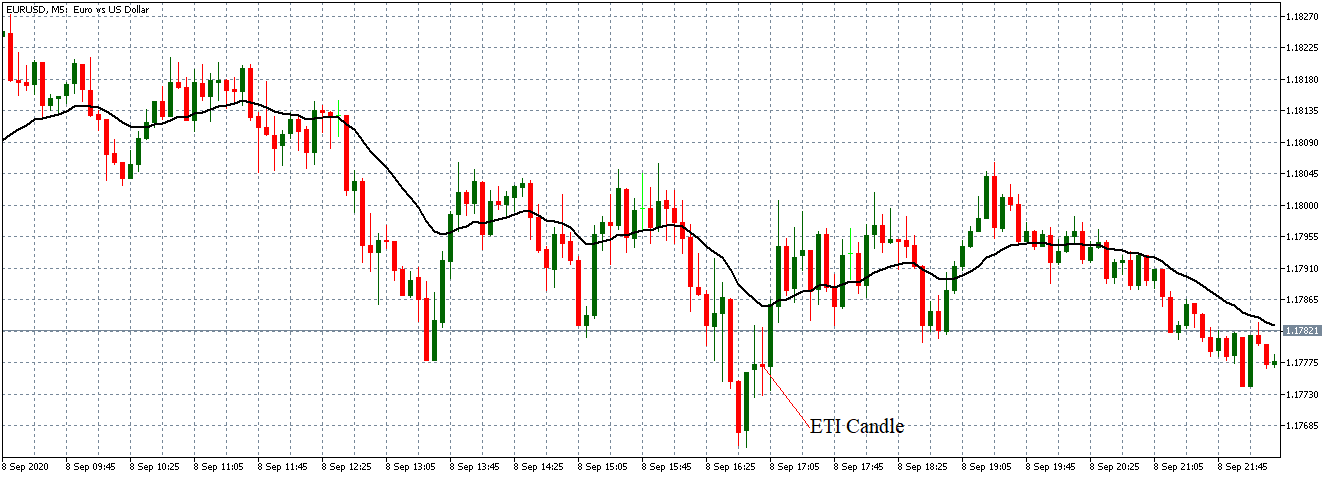
After the ETI report release, the pair formed a bearish 5-minute “Doji” candle. Subsequently, the pair adopted a weak bullish trend with candles forming just above the 20-period M.A.
Bottom Line
In the forex market, traders rarely pay close attention to the ETI. Most traders prefer gauging the underlying aggregated indicators separately, which explains the lack of impact by releasing the ETI report since the index shows what traders already know. It only serves to show the trend.