Categories
Forex Videos

Analysing Price Cycle & Market Structure

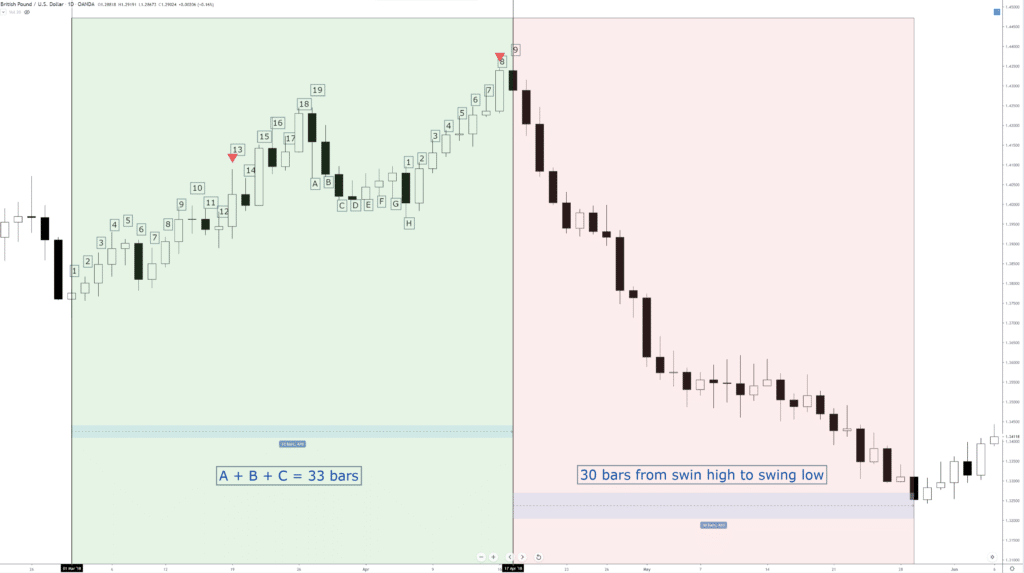
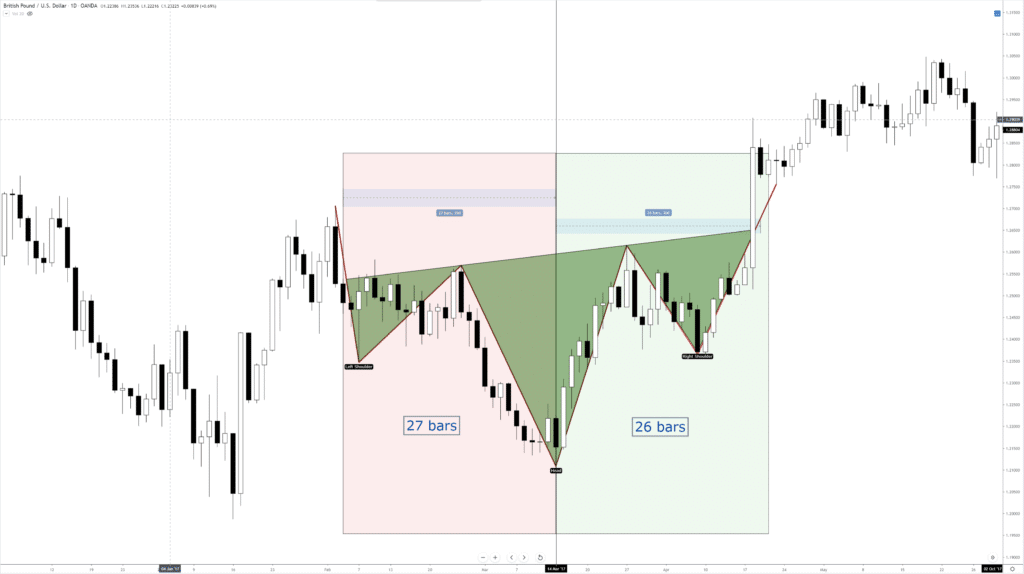
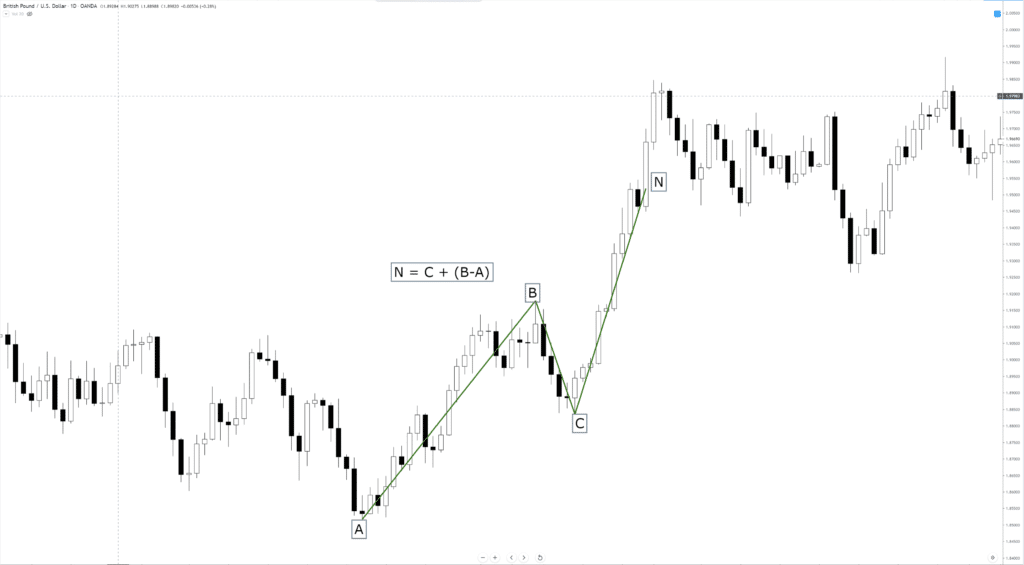
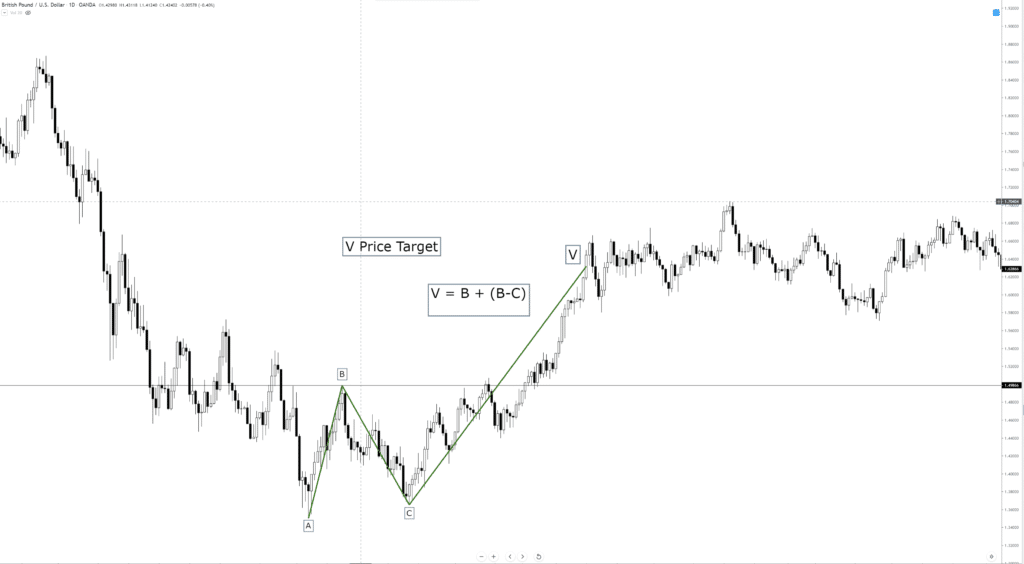
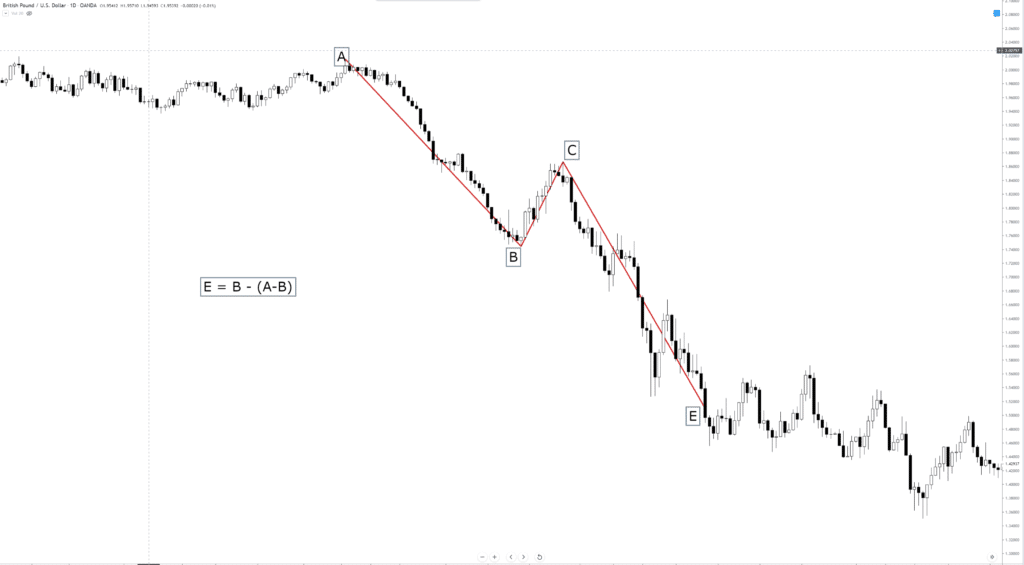
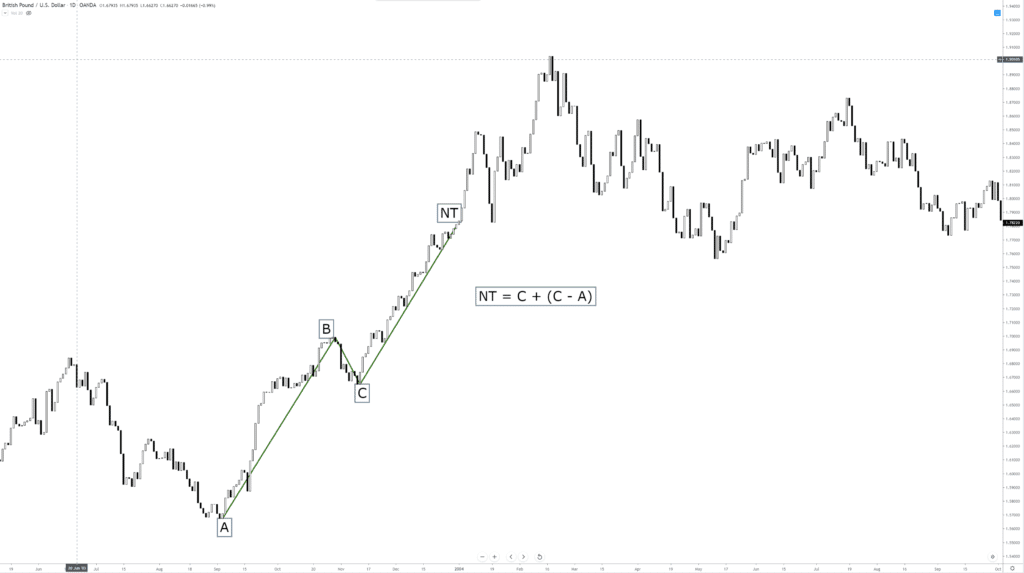
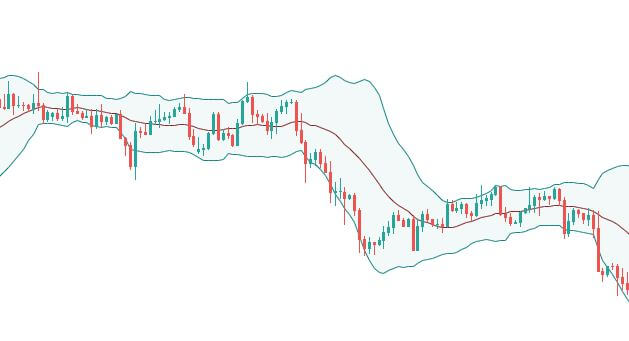
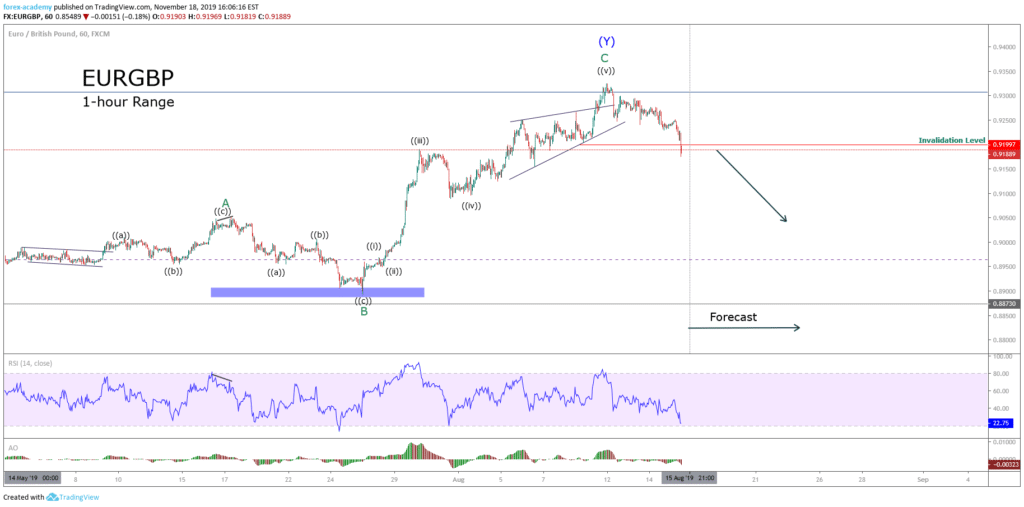
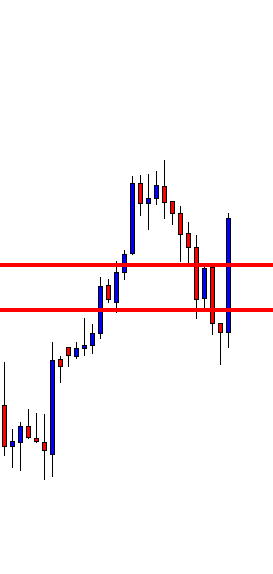
Price Cycle – Market structure

In this section, we will be looking at technical market structures. Professional traders are continually looking out for technical market structures that occur when a currency pair has achieved a swing high – or structural high – followed by a swing low – or structural low – and vice versa. Traders gain great inside in the relationship between these highs and lows.
These swing highs and swing lows can be found on any time frame, including the 1 minute, the 5-minute, 15-minute, 1-hour, even the 1-month time frame. And herein lies one of the most problematic aspects of trading the forex market: because a swing high might occur on one timeframe, while actually forming the basis of a swing low on a different time frame!
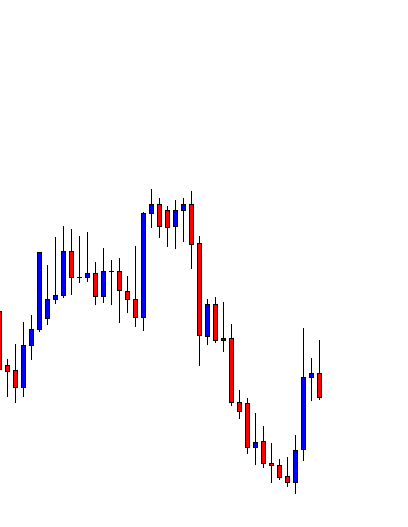
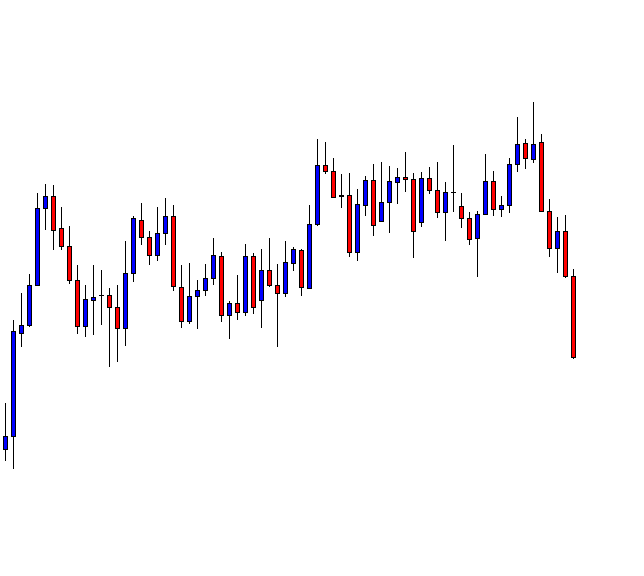
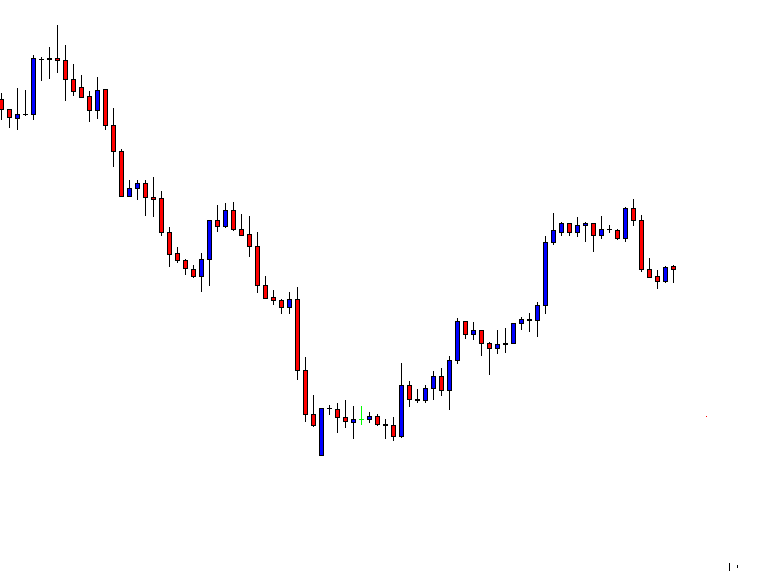
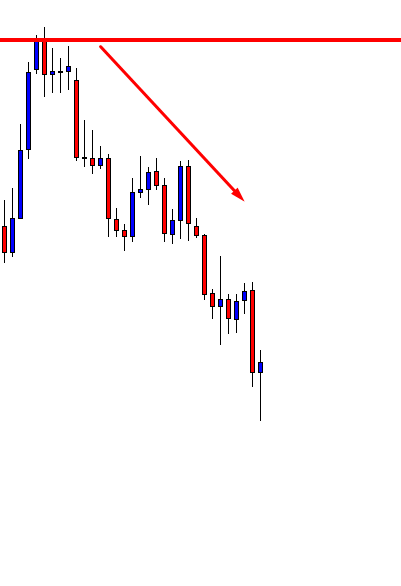
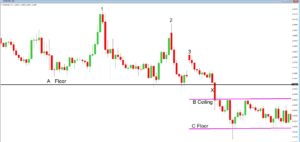
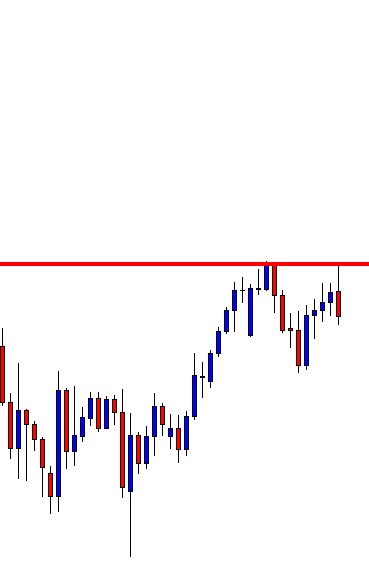
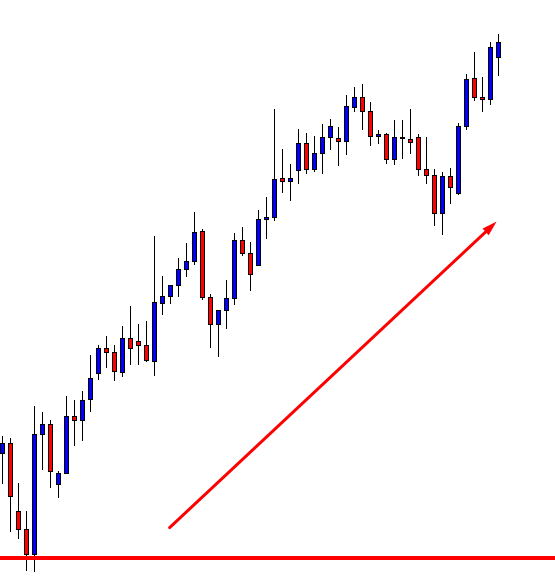
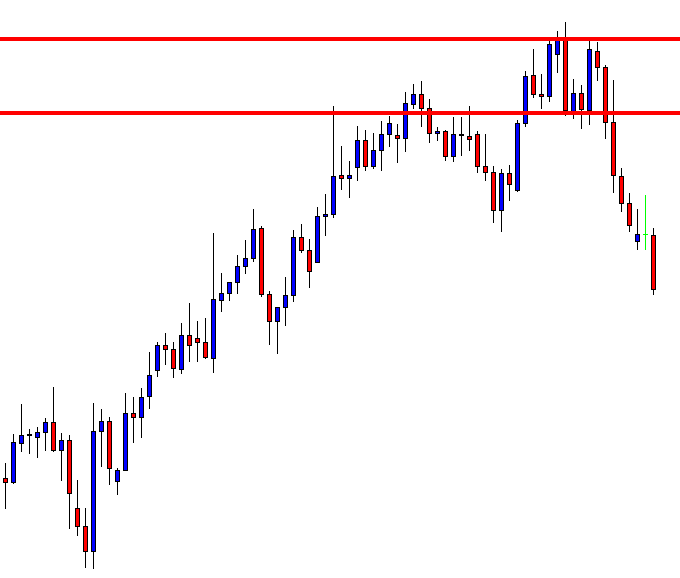
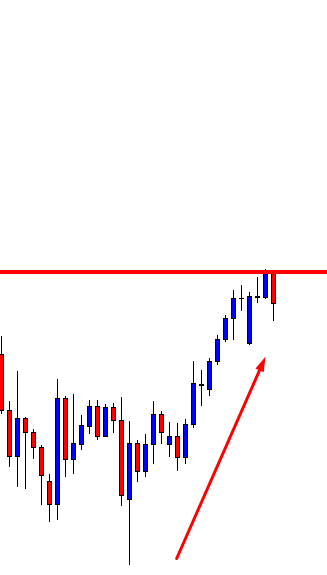
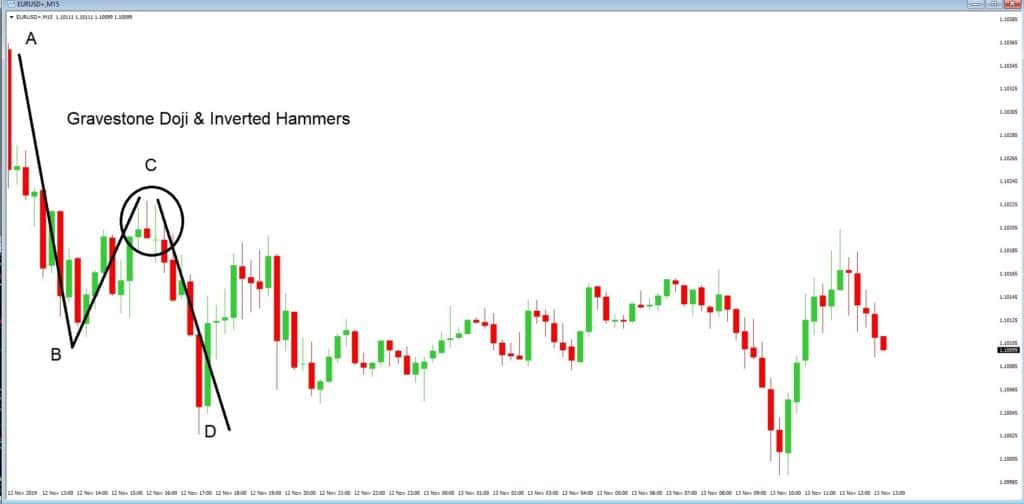
Example A


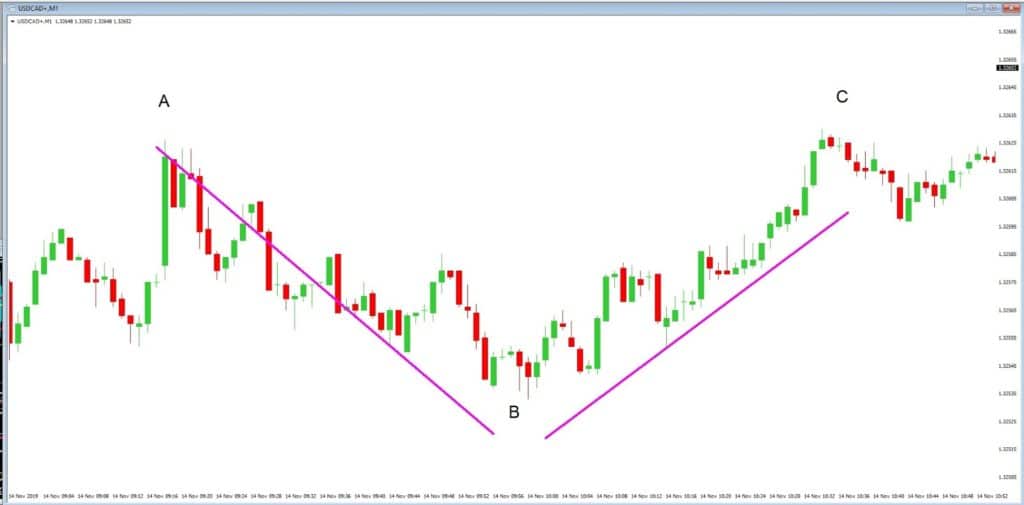
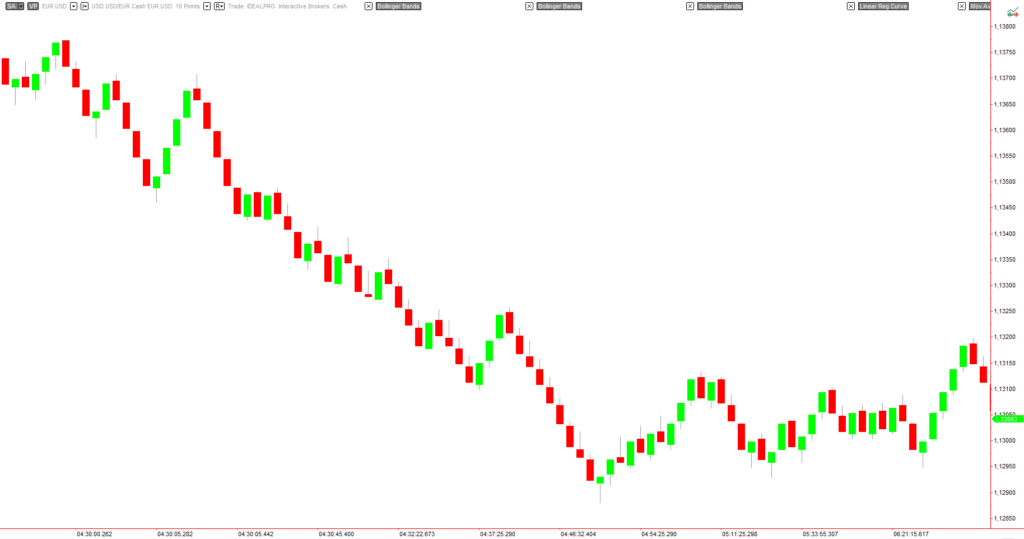
Let’s take a look at example ‘A’, which is a 1-minute chart of the USDCAD pair, and where we can see price action, as denoted by our Japanese candlesticks, has formed a swing high at position ‘A’, followed by a swing low at position ‘B’, and then a swing high to position ‘C’. In total, this A, B, C, swing high, to swing low price and swing high price action move presented traders with an overall 20 pip trading opportunity. This is not an unsubstantial amount of pips!
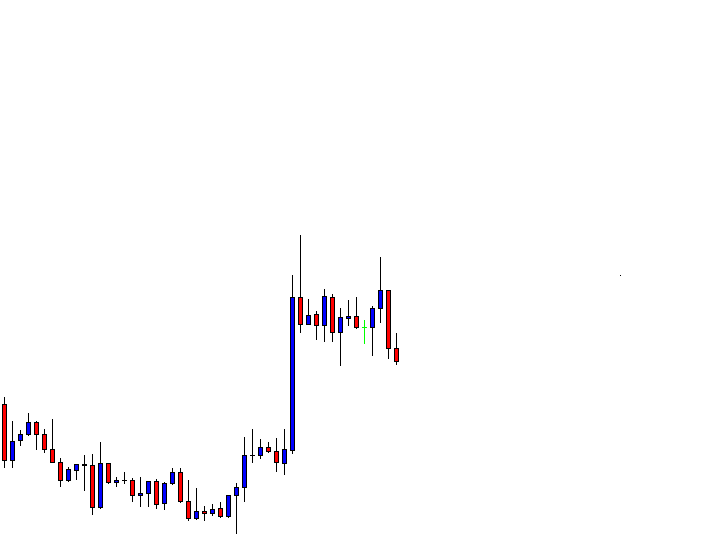
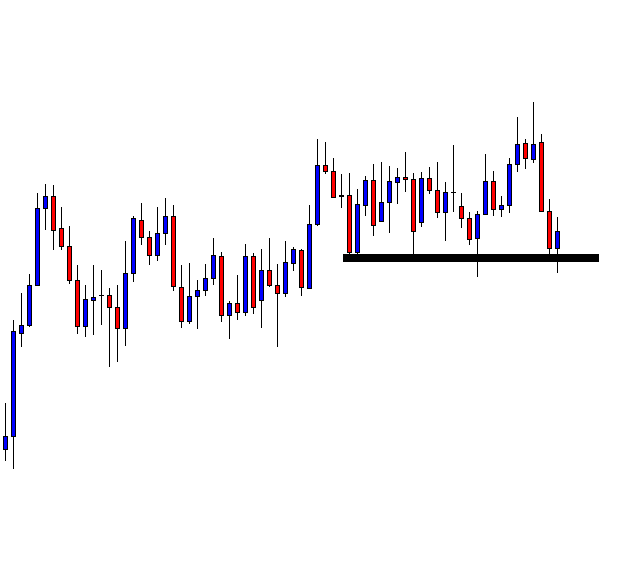
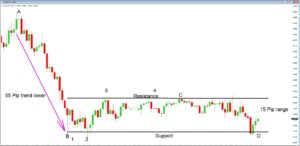
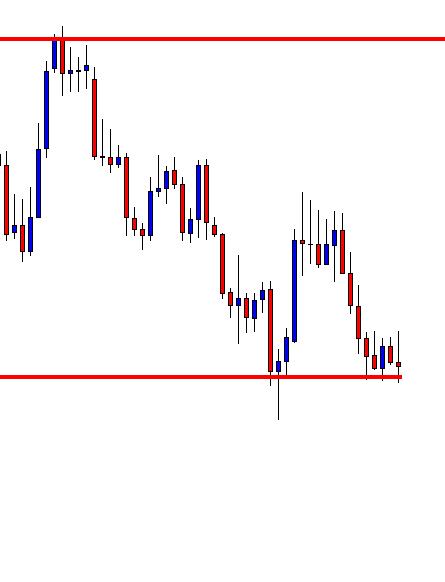
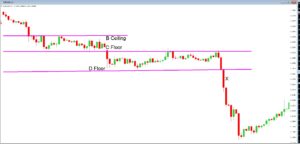
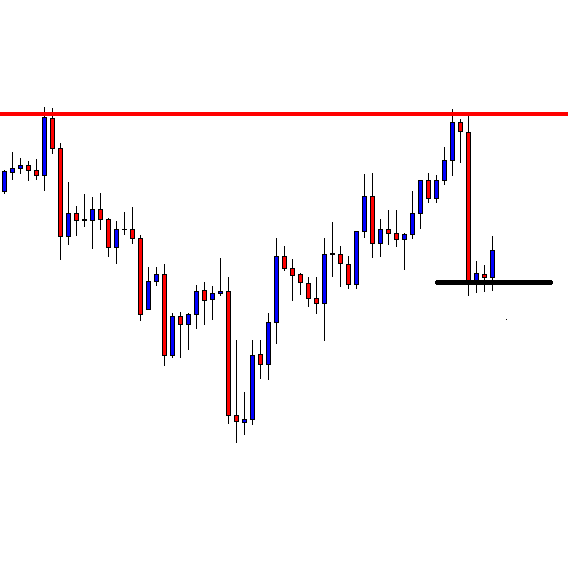
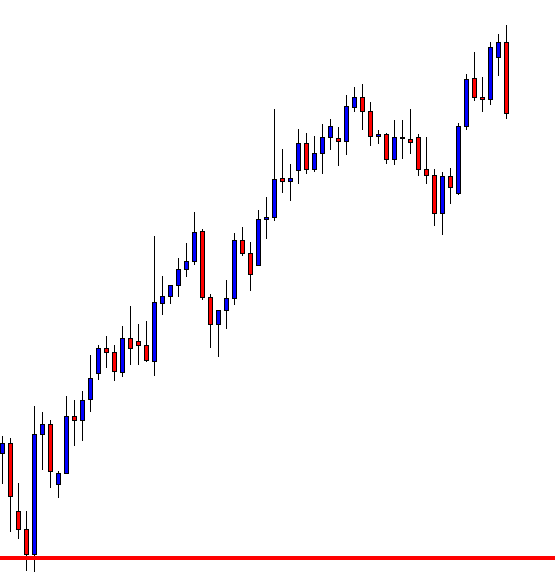
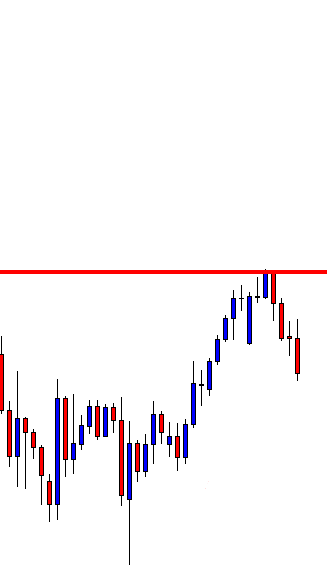
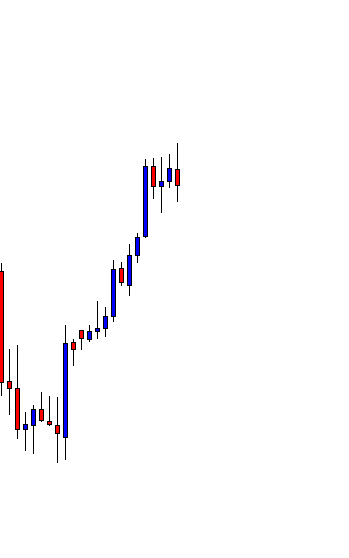
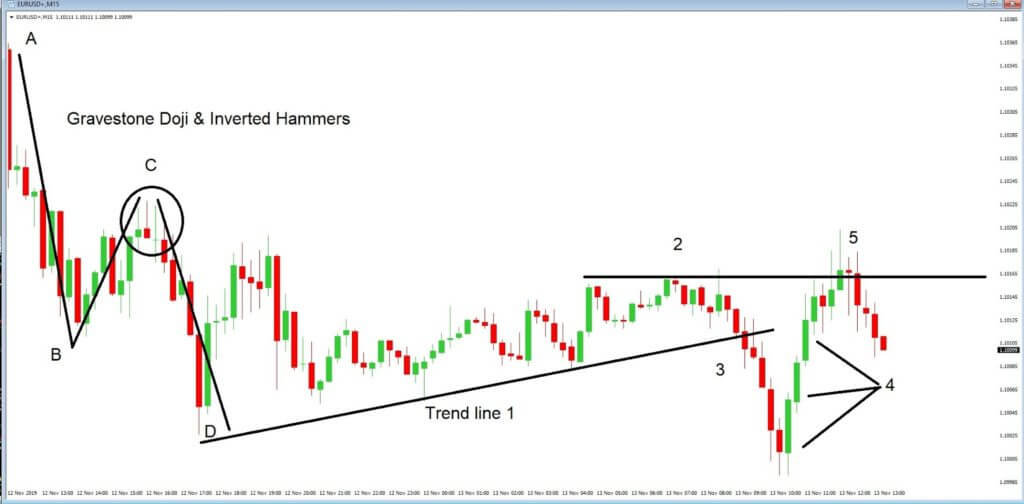
Example B


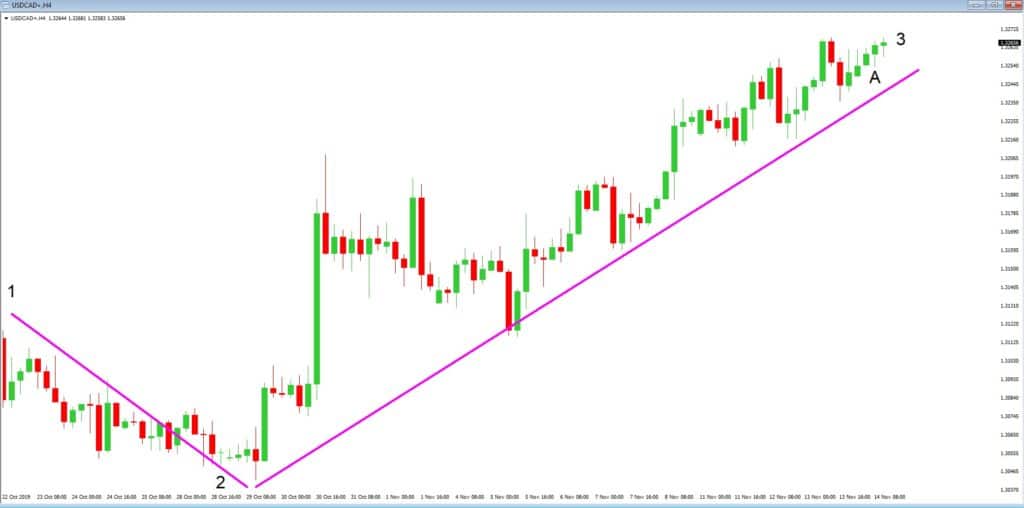
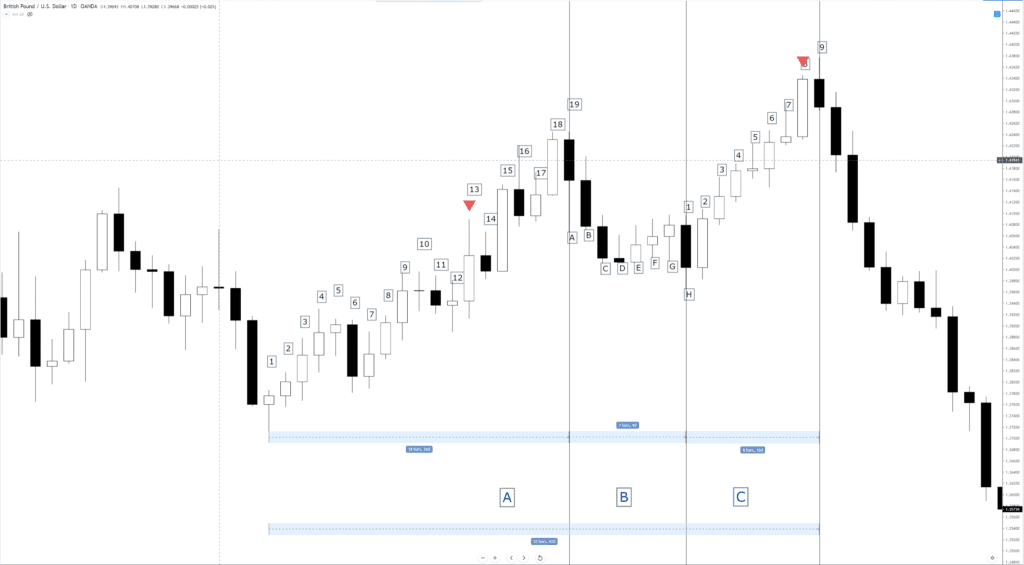
Now let’s look at the example ‘B’; this is a 4-hour chart of the same USDCAD pair. In this example, we have used position ‘1’ to show a previous structural, or swing high, followed by position 2, which is a structural or swing low and then followed by a structural , or swing high, to position 3. This overall move presented traders with a 300 pip price action swing. A huge swing, and an extremely profitable one, if you got it right!. However, sat all on its own, in the top right-hand corner of the chart, as they noted by position ‘A,’ is the exact same position of our swing high, swing low, swing high on our 1-minute chart.

All of the timeframes present trading opportunities when it comes to identifying structural highs and structural lows. However, it is advised that traders are mindful as to what is going on in various other time frames on any given currency pair! But one thing is for sure, and self-evident from the two examples, that the larger the timeframe is, the more important significant the market structure becomes.
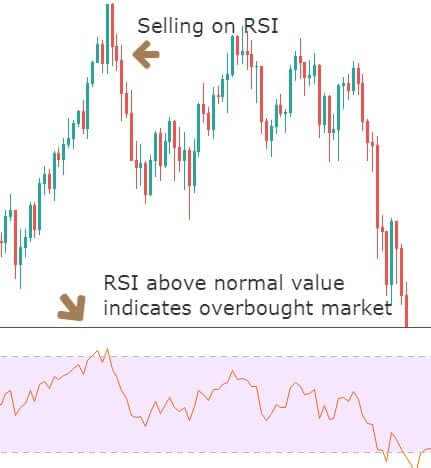
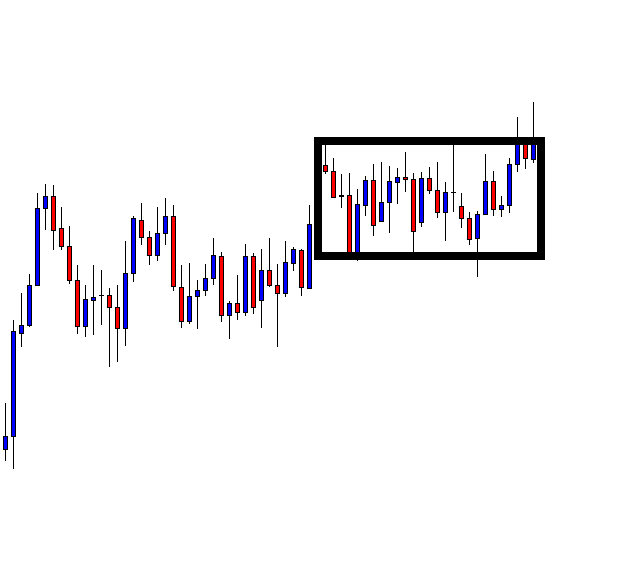
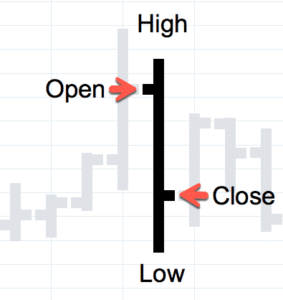
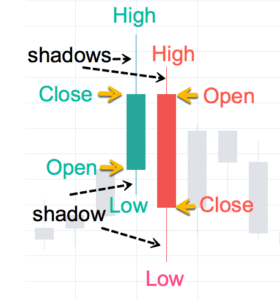
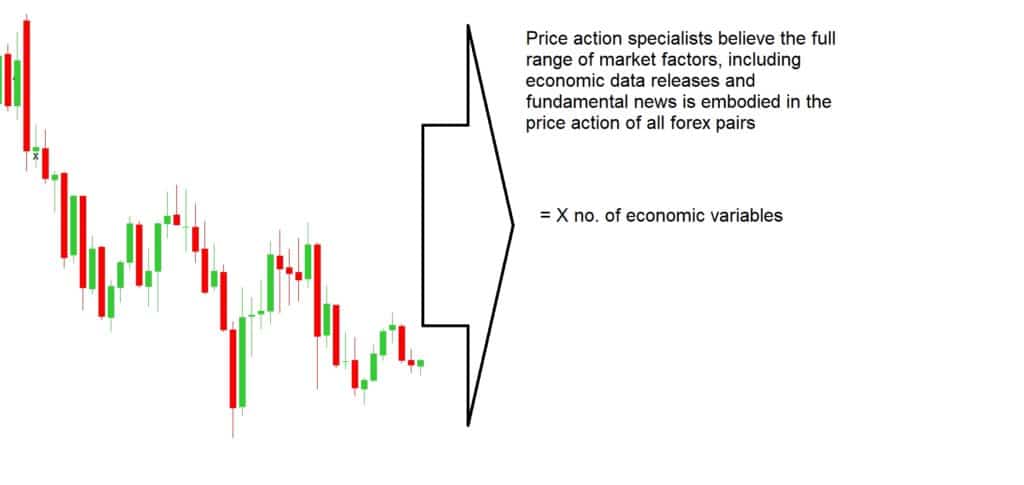
Technical traders will keenly observe price action at structural highs and structural lows, because they present trading opportunities, such as pullbacks and reversals, continuations in price action, or price consolidation and subsequent breakouts. They can use a number of tools, such as Fibonacci retracements, moving averages, stochastic oscillators, and Moving Average Convergence and Divergence or MACD, however, the best tool is price action itself, and the most common method to determine price action is via the use of Japanese candlesticks.
Traders don’t need to load their chats up with lots of technical indicators, because more often than not, all the information is already on the charts, and we can use a few lines that we draw onto the charts ourselves in order to show us where the structural highs and lows are.
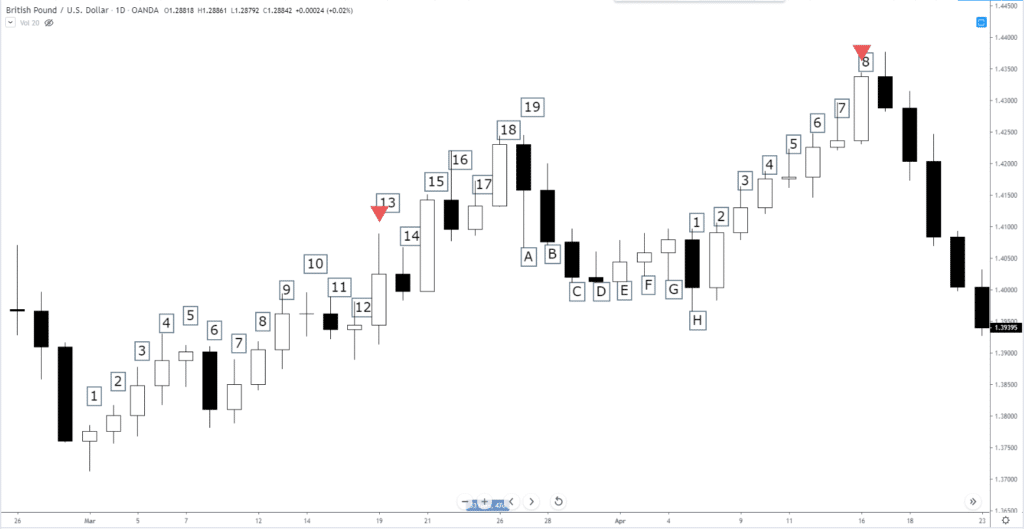
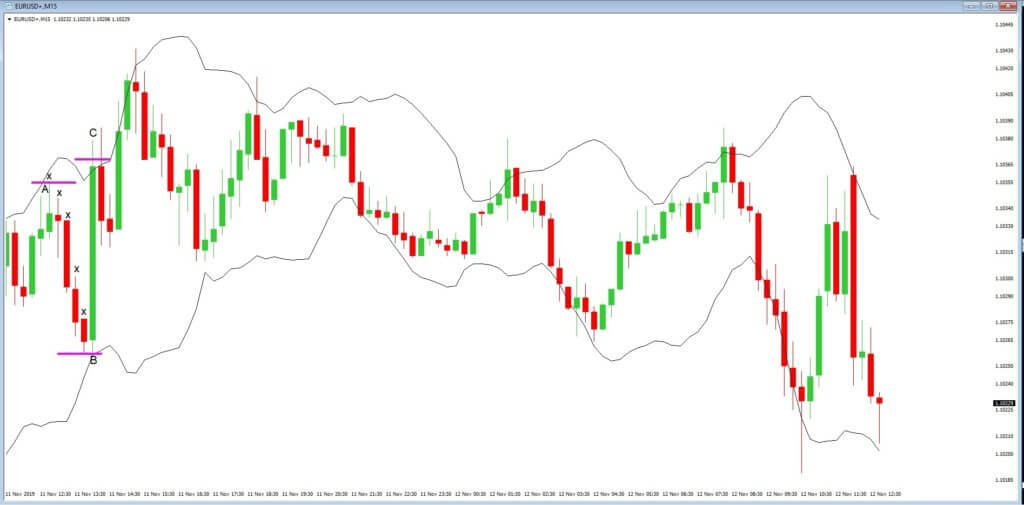
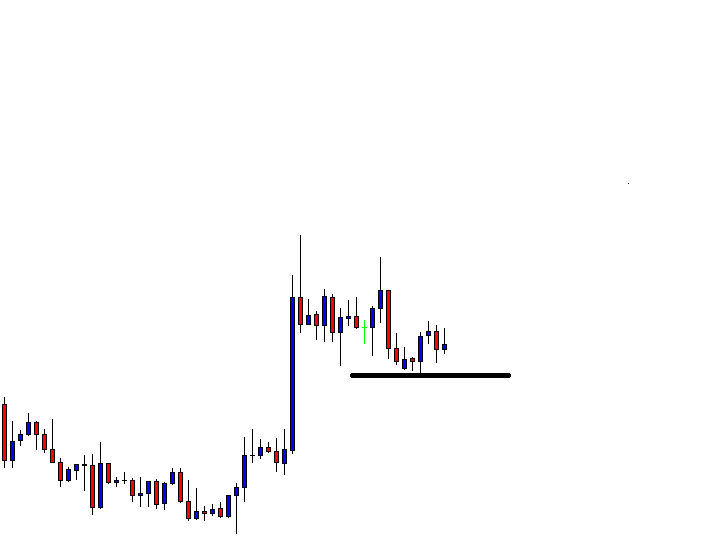
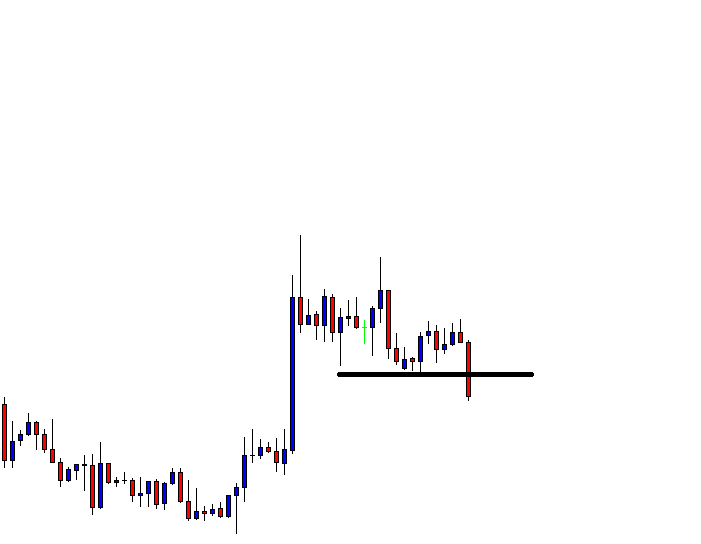
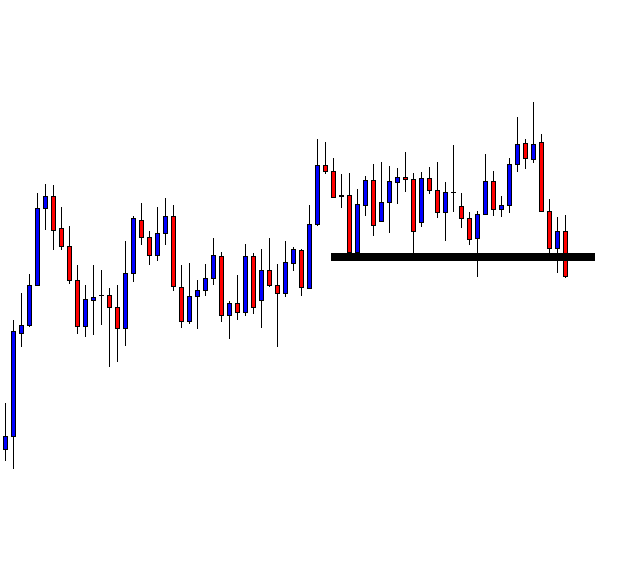
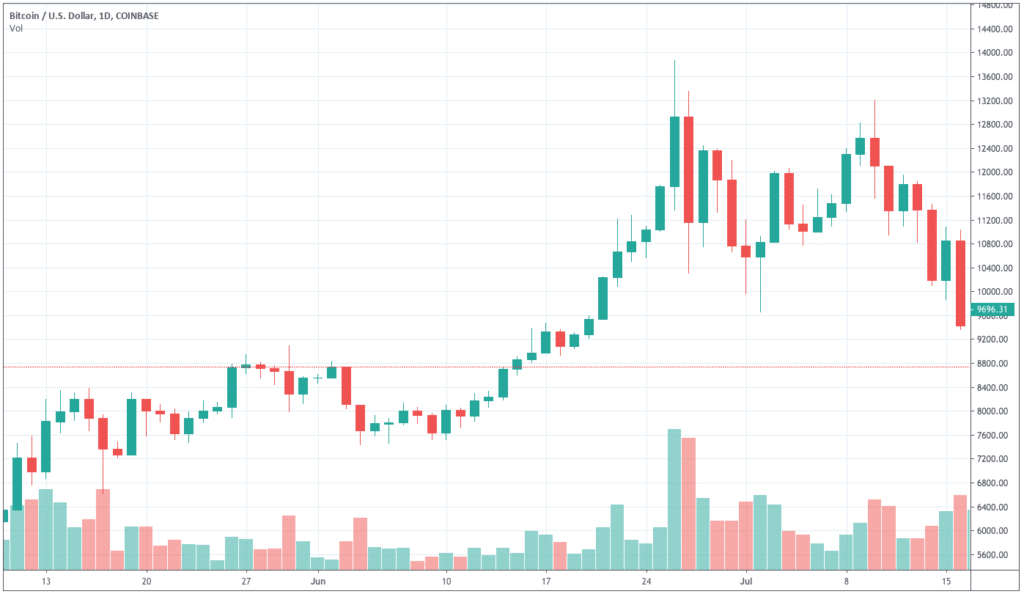
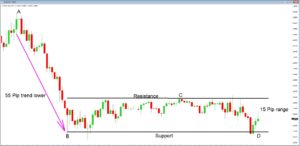
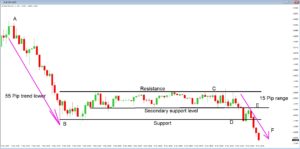
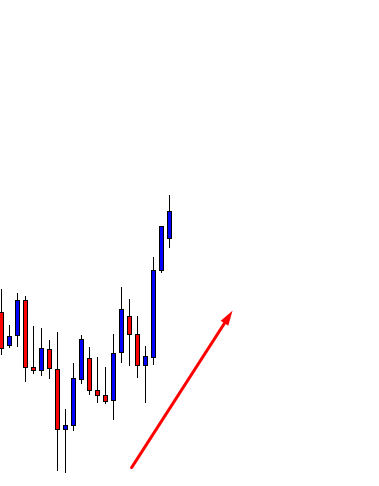
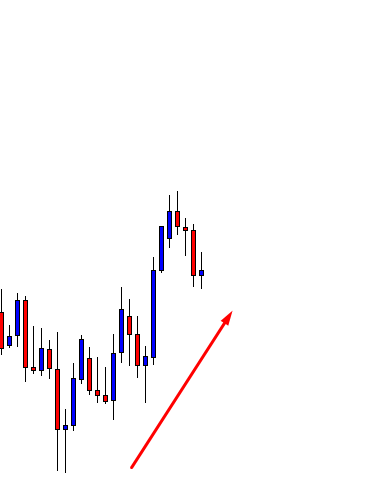
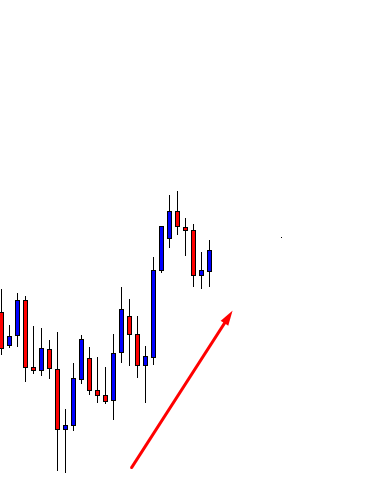
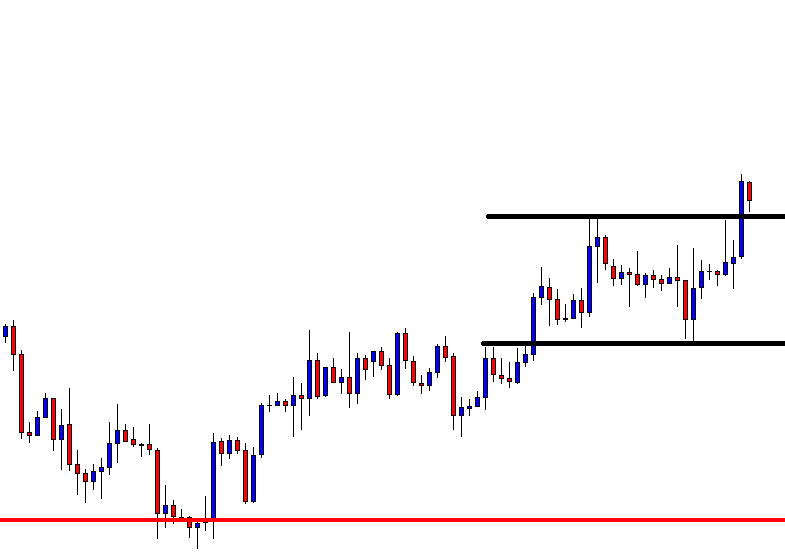
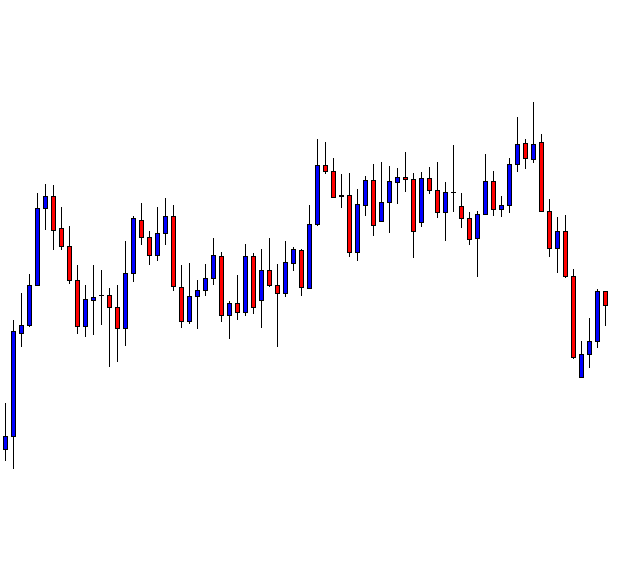
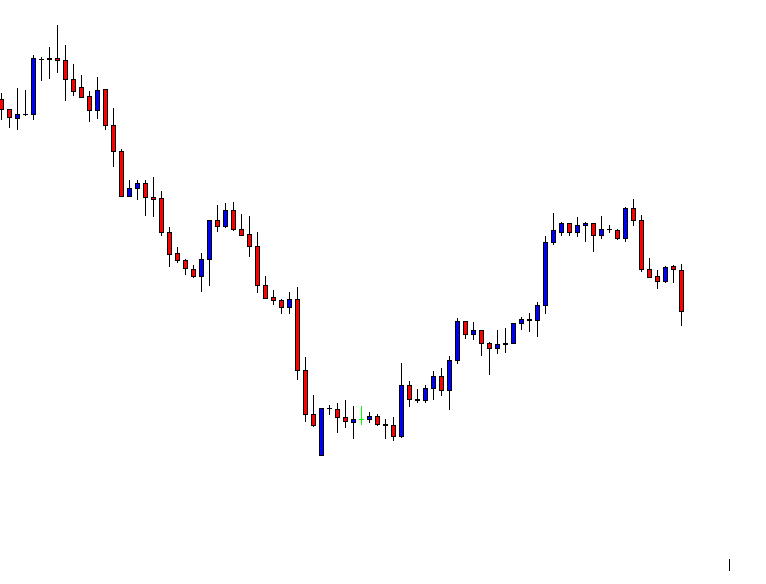
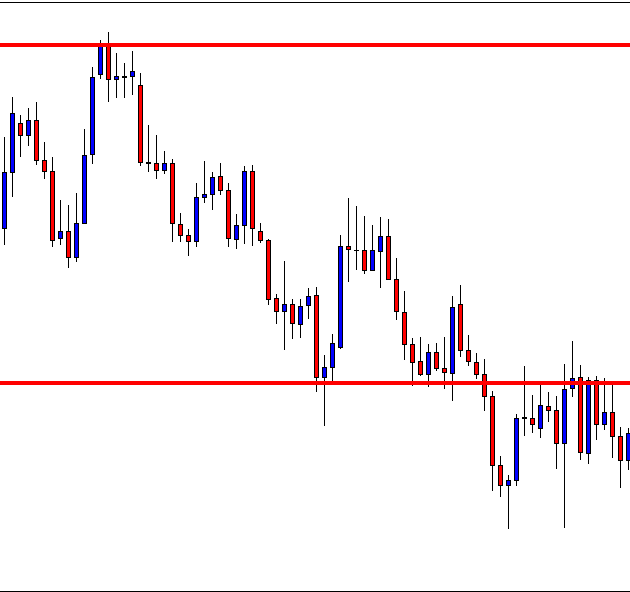
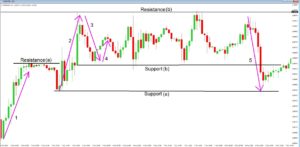
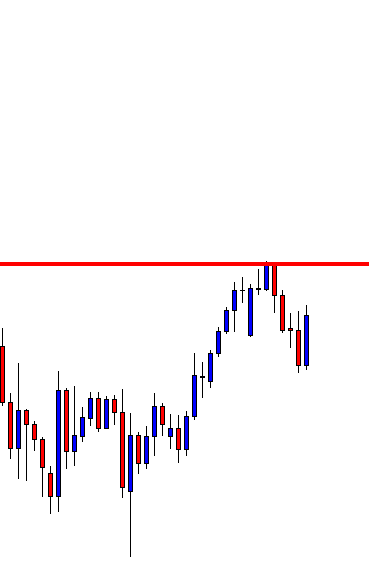
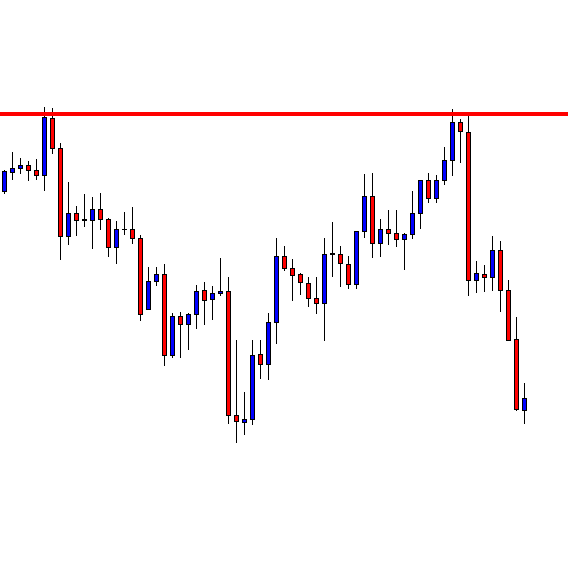
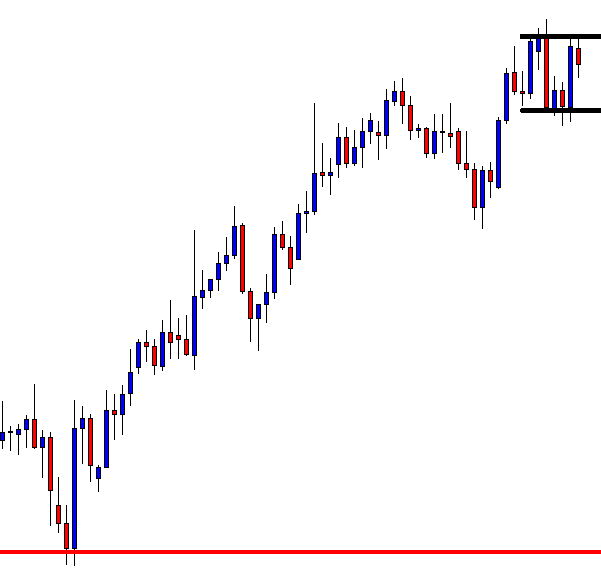
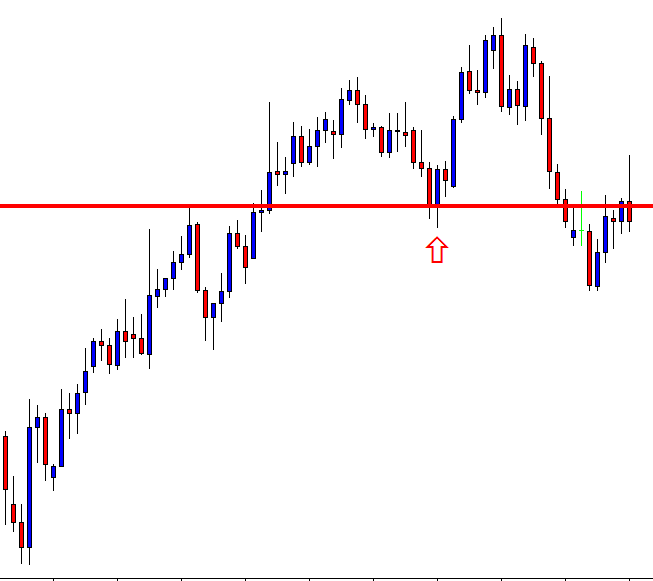
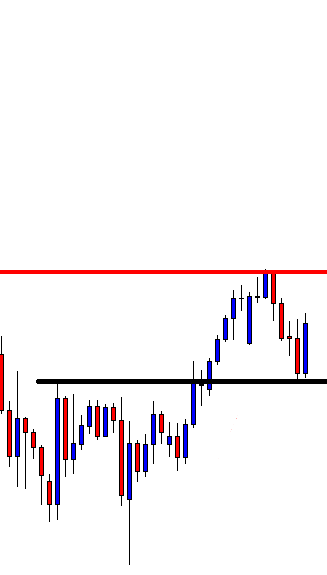
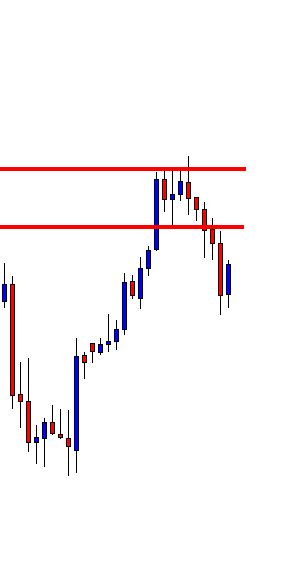
Example C


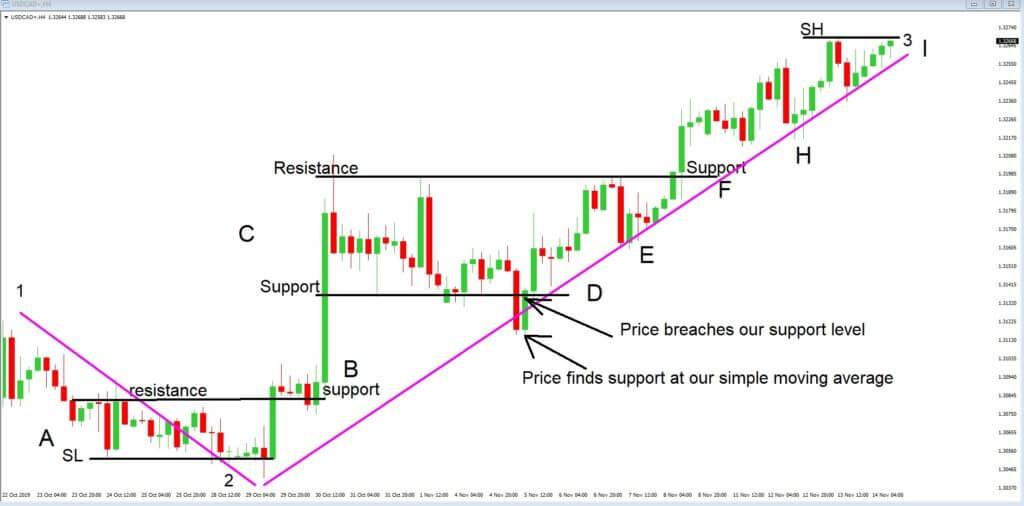
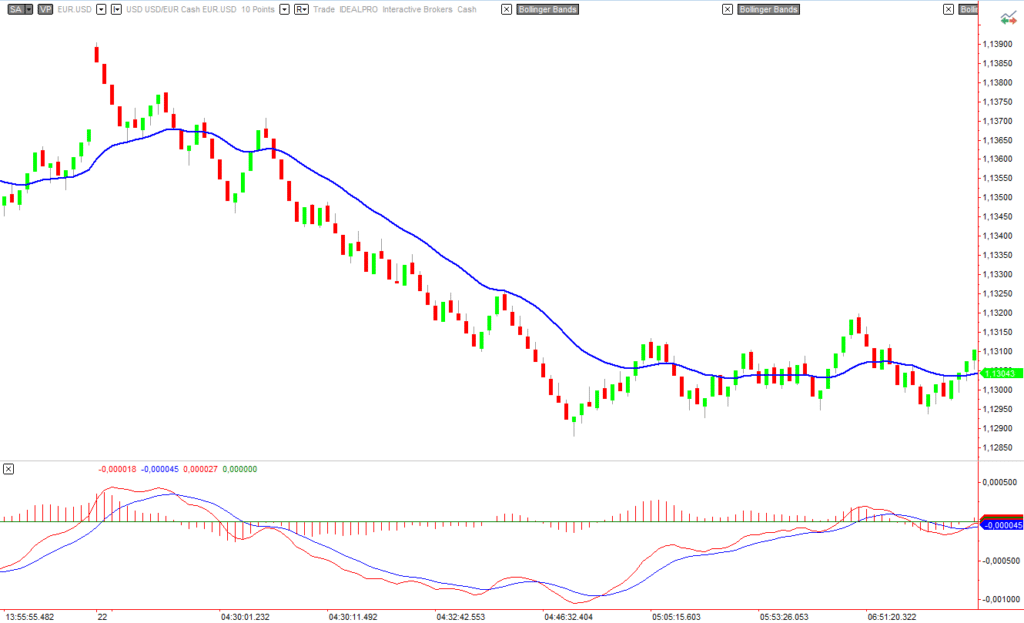
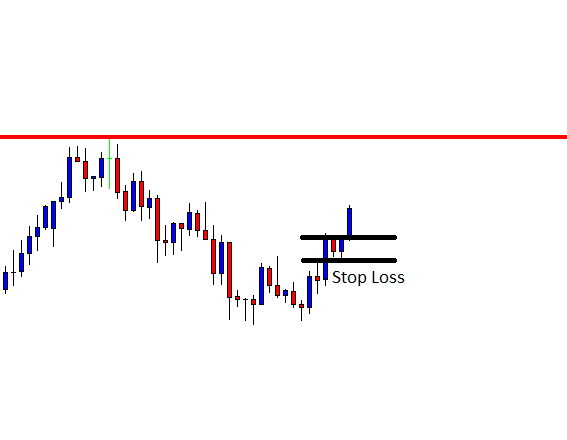
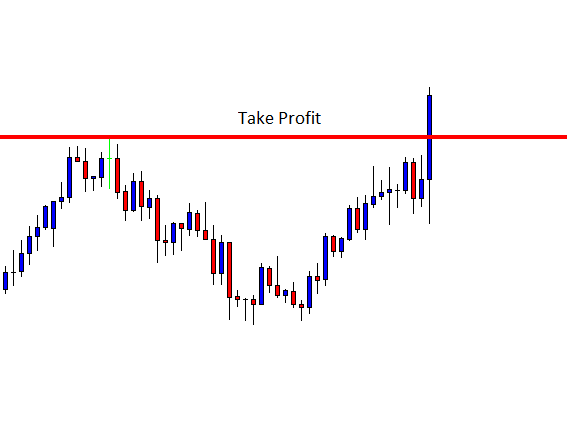
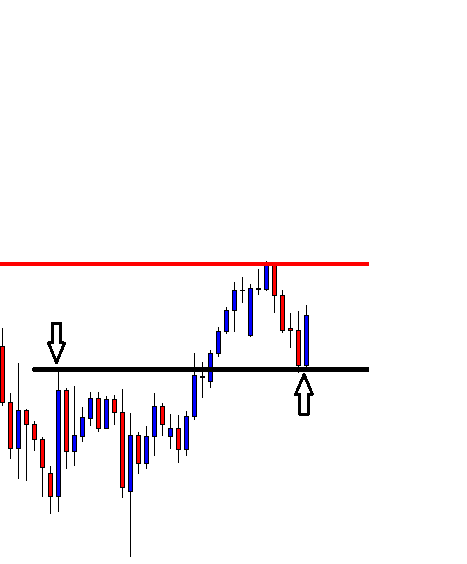
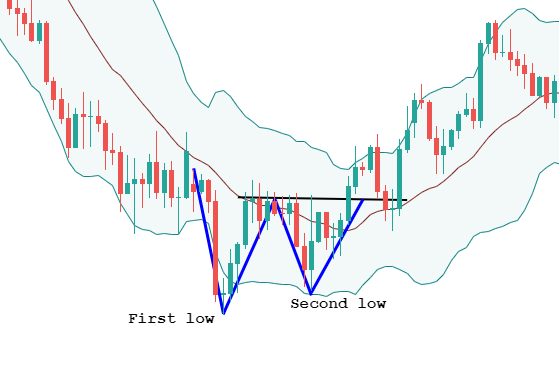
So let’s look at example C, where we have added a few lines to the same 4-hour chart of the USDCAD pair. First of all, at position ‘A’ on the bottom left of the screen, we can see a structural low, or SH, where price action has failed to go any lower. Price action enters a consolidation, or sideways pattern, between this low, and the area of resistance just above it.
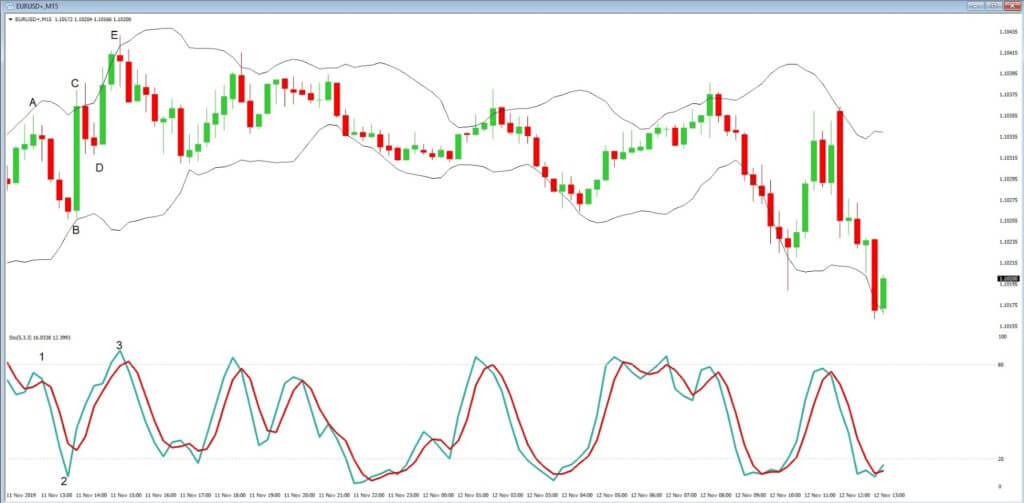
Price, as it will always do, eventually brakes out of this range at position ‘B,’ where we find that our previous area of resistance has become an area of support. The major structural low has failed, and price action moves to the upside as denoted by the very large bullish candlestick, which tells traders that a large amount of liquidity or volume has entered this pair and moved it up to position ‘C.’ Again we see some consolidation of price action, but where are an initial pullback below the support level at position ‘D’ is curtailed when price action bounces off our ascending magenta simple moving average, and where we can see price action hugging this line all the way up to position ‘I.’ Because position ‘I’ is the highest point in this range it is considered to be a structural high or SL on our chart.. Traders will now be looking to establish if price action moves underneath the simple moving average, or if it will continue above the structural high. And if this becomes a support level, buyers may take advantage of an upward trend continuation.
Here at Forex.Academy, we emphasize to new traders, to be patient, understand their technical analysis, and that an awful lot of information is already on the chart. It does not need to be overloaded with too many technical analysis tools. And that to be a successful
trader, one needs to be patient. What is more, that a multi time-frame approach should be observed to help maximize win to loss ratios.

Categories
Forex Market Analysis

Gold’s Ascending Triangle Plays – Is It Good Time to Buy?

On Tuesday, gold slid erasing profits from 1,470 t0 1,464 level earlier in the session, as a temporary respite from Washington for China’s Huawei increased confidence for a trade agreement between the nations and increased risk sentiment.

The yellow-metal prices dropped during the last week mainly due to the Commerce Secretary Wilbur Ross and White Hosue’s economic adviser Larry Kudlow hinting that the United States and China were close to signing the deal. That sent the three major stocks indexes to record highs on Wall Street.

On the other hand, Donald Trump met with Federal Reserve Chairman Jerome Powell and Treasury Secretary Steven Mnuchin at the White House overnight to discuss the economy and the greenback weakness.

Powell’s remarks were consonant with his statements at his congressional hearings last week the Fed said in a statement released after the meeting. In contrast, the United States President Donald Trump said the meeting was “very good.”

Risk appetite was shaken due to the news that Trump and Fed Chairman Powell had met to discuss the tendency of the dollar. There were rumors of a CNBC report that Chinese officials were involved over prior comments concerning tariffs from Trump.


XAU/USD – Daily Technical Levels

Support Resistance 

1,460.54    1,478.16

1,449.67    1,484.91

1,432.05    1,502.53

Pivot Point 1,467.29

Gold is trading at 1,468 level, bouncing off above 1,464 support level. On the 4 hour timeframe, it has formed an ascending triangle pattern, which is extending its resistance around 1,474. While the bullish trendline is likely to support the pair around 1,464 level. 

The recent bullish closing above 1,464 level is suggesting the market to retrace back upward until 1,472 level. While on the flip side, a bearish breakout of 1,464 can lead gold prices towards 1,456.

All the best!

Categories
Forex Harmonic Forex Trading Guides

Harmonic Patterns – Start Here

Harmonic Patterns – Start Here

Harmonic Patterns are an advanced form of analysis and require more than a basic understanding of the technical analysis of financial markets. For those of you who have familiarized yourself with the application of Fibonacci levels, Harmonic Pattern Analysis will, perhaps, be of use to you. The following is a list of the Harmonic Patterns available for learning here at Forex Academy. The suggested order of learning about these patterns is below.

Phase One – Basic Harmonic Patterns

AB = CD

The Gartley Pattern

Phase Two – Advanced Patterns

The Butterfly Pattern

The Bat Pattern

The Alternate Bat Pattern

The Crab Pattern

The Deep Crab Pattern

The Shark Pattern

The Cypher Pattern

The 5-0 Harmonic Pattern

Phase Three – Application

Harmonic Pattern Walkthrough

The article above provides an example of how to use Harmonic Patterns in your own analysis and trading.


Sources: Carney, S. M. (2010). Harmonic trading. Upper Saddle River, NJ: Financial Times/Prentice Hall Gartley, H. M. (2008). Profits in the stock market. Pomeroy, WA: Lambert-Gann Pesavento, L., & Jouflas, L. (2008). Trade what you see: how to profit from pattern recognition. Hoboken: Wiley

Categories
Forex Elliott Wave

How to Analyze a Fast Market Using the Elliott Wave Principle – Part 2

In our previous article, we introduced the concept of “fast market.” Also, we commented about the importance of watching the big-picture to support the market’s general overview. In this educational article, we’ll review the analysis of the fast movement.

Disclosing the Speed

Once the market moved following our forecast, the price action developed its next sequence in a fast way. To aid in building our analysis in the EURGBP cross, we’ll use the RSI indicator to identify each swing.

From the EURGBP hourly chart, we observe the bullish sequence started on May 05. The RSI use, allows us to identify each swing of waves 2 and 4, and divergences the end of waves 3 and 5.

Until now, the movement developed by EURGBP corresponds to a 5-3 sequence; thus, the next path should develop in five waves. In consequence, our new hypothesis could be the next move a wave three or be the second leg of a zigzag pattern.

The second EURGBP chart exposes the progress in an ending diagonal pattern. This Elliott wave formation is a motive wave built by five internal legs that overlap each other.

On the other hand, the new big-picture structure observed on the EURGBP cross unveils a 5-3-5 sequence. Thus, according to the Elliott wave principle, this formation corresponds to a zigzag pattern.

Another observation comes from the alternation between the first and second bullish leg. Both segments moved on a different relationship price and time. In other words, while the first leg ascends in a fast step, the second one progress at a slower price/time relation.

Now, from the Elliott wave principle, the next path from the EURGBP should be a corrective move in three waves. If the price breaks below the invalidation level, the correction should be more profound.

On the following chart, we observe an incomplete corrective move developed in two internal waves labeled in black. In consequence, the next movement should be a wave ((c)) in black. The completion should complete a new wave A labeled in green.

Until this moment, the price action bounced above the invalidation level, which makes us observe two things:

  1. The EURGBP cross is running in a complex corrective structure, likely a double three pattern. This Elliott wave structure is labeled as WXY, follows a 3-3-3 sequence, and develops seven swings.
  2. Probably according to the alternation principle, the next corrective structure could be a flat pattern.

The following chart exposes the waves A and B labeled in green completion. As can be noted, wave A holds three internal legs, wave B retraces between 81% and 100% of A. Thus, the Elliott wave structure should correspond to a regular flat pattern.

Finally, the next EURGBP chart illustrates the end of the last segment of the wave C from the regular flat pattern, which is part of a complex corrective sequence, in this case, the formation corresponds to a double three structure.

As a learned lesson, the use of the RSI indicator is useful to support the wave identification process. Similarly, to apply the Elliott Wave Principle is essential to know the basic corrective patterns to follow any market. Finally, remember that the market has only two ways to move: it moves in three or five waves.

Categories
Forex Psychology

A Lesson from a Failed Entry

In today’s lesson, we are going to demonstrate an example of a failed entry. We usually explain winning trade setups in our lessons. It teaches us how to win a trade on a setup like that and gives us more confidence as well. We are going to talk about a failed entry, which may hurt our confidence. However, the lesson that it teaches that may help us be a batter trader.

The price heads towards the North with good bullish momentum. Ideally, we shall look for long opportunities here upon consolidation and at a breakout at resistance. Let us find out what happens next.

The price consolidates, but it does not make any breakout. The last candle looks very bearish. The door is open for both the bull and the bear. Traders shall go long on an upside breakout and go short on a downside breakout. Let us find out which way it makes its next breakout.


The price heads towards the downside after making a breakout at support. It is a different ball game now. Traders are to look for short opportunities upon consolidation and downside breakout. Let us proceed to the next chart to find out what happens next.

Here comes the corrective candle. It is an Inside Bar. Thus, to sum up, the whole equation, the price consolidates after being bullish, makes a breakout at the support, the trend continues, produces a corrective candle (an Inside Bar). A bearish engulfing candle closing below the lowest low is the signal to go short here.

This is what I have meant. A bearish engulfing candle forms right after the corrective candle. The candle closes below the support, where the price reacted three times recently. If we consider the momentum of the last bearish candle, that gets ten on ten as well. Let us trigger a short entry.

Oh! The price goes another way round than our expectations. It hits the Stop Loss. We are to encounter a loss here. The first thing we shall do after a losing trade, we shall write all the details about the trade in our journal. If there is anything that we have missed from our trading strategy, we must find that out and write it in our journal.

As far as I am concerned, there is not anything wrong with the entry. It is an entry; I would take ten times out of ten opportunities. I have been working with the strategy for a long time. Thus, I can assure you I would win at least six entries out of those 10. This is the faith that a trader needs to have. A trader must not lose his faith in his proven strategy.

The Bottom Line

Never lose your faith in yourself and in your proven strategy. Do not let a losing trade hurt you psychologically.

Categories
Forex Market Analysis

Daily FX Brief, November 19 – Major Trade Setups – U.S. China Trade War Plays! 

The U.S. Dollar Index fell 0.1% on the day to 97.82, extending its decline to a third session. The euro gained 0.2% to $1.1072, and the British pound advanced 0.3% to $1.2947. The USD/JPY slipped 0.1% to 108.67.

After Federal Reserve Chairman Jerome Powell met with President Donald Trump and Treasury Secretary Steven Mnuchin to discuss the economy, the Fed released a statement saying Powell’s comments were consistent with his remarks at his congressional hearings last week.

Economic Events to Watch Today

Let’s took at these fundamentals.


EUR/USD – Daily Analysis

The EUR/USD currency pair overall flashing green and consolidates in the narrow range of 1.1063 – 1.1076 due to renewed trade tensions leaving the selling pressure on the greenback. As of writing, the EUR/USD currency pair rose by 0.10% at 1.1060 and hit a high level of 1.1076.

As we all well aware that the pair extended its bullish trend for the 3rd session in a row, extending its recovery trend from the recent 5-weeks lows of 1.0990/85 range, mainly due to the selling pressure in the greenback and some fresh trade tensions.

At the Sino-US trade front, the Chinese legislators showed some attention during the earlier session regarding the singing of the Phase one deal after the United States President Donald Trump announced to ruled out the rollover of some tariffs. In the consequences, due to these concerns, the U.S. Treasury yields turned into lower and some resurgence cities in the safe-havens, weakening further the greenback sentiment.

According to the schedule, the ECBs C.Lagarde is scheduled to deliver the speech in Frankurt later in the week, whereas the investors should keep their eyes on the ECB minutes and the preliminary figures of November PMIs in core Euroland as well.

It should b noted that the pair is increasing the recovery from the last week lows in sub-1.10 range, mainly due to the renewed weakness of U.S. Dollar and hopes of the United States a China fair trade deal. 

On the other hand, the outlook in the Euroland continues weak and does nothing but justify the failure for the more extended monetary policy by the European Central Bank and the bearish outlook on the single currency in the medium term, at least. So, from this point of view, all eyes will be on the publication of flash PMIs figures for the current month later in the week.

Daily Support and Resistance

S3 1.1

S2 1.1036

S1 1.1054

Pivot Point 1.1072

R1 1.109

R2 1.1108

R3 1.1144

EUR/USD– Trading Tips

The EUR/USD displayed bullish behavior to examine the resistance mark of 1.1090. Today extension of buying biases can direct the EUR/USD prices towards 1.1125 areas. While support lingers around the 1.1065 area.


GBP/USD– Daily Analysis

The GBP/USD currency pair trading on the bullish track and takes buying to 1.2950 in the wake of fresh hints of political stability, and the successful Brexit keeps the cable pairs strong. As of writing, the pairs consolidate in the range of 1.2944 – 1.2967 dring the Asian session.

The GBP/USD currency pairs recently got the support from the Brexit party decrease of candidates, whereas also avoiding the Bank of England’s dovish bias.

Apart from the continued support for the tory leadership during the December election, as defined by the major surveys, the recent decision regarding the ban of liberal Democrats and the Scottish National Party form the T.V.’s cross-party political discussion also speaks louder for the Conservative’s position in the United Kingdom.

Challenges are surrounding Prime Minister Boris Johnson avoid to release documents regarding Russian interference in the Brexit election stop to cuts the British locals, including Tories, highly criticize corporate tax. Moreover, the European Union stable on the decision does not change the Brexit deal gains less of market attention.

Whereas, the trade and political headlines regarding the United States and China and ITVs debate will likely keep the entertaining investors of markets, as well as, all eyes will be on the November month CBI Industrial Trends Survey data from the U.K., the U.S. Building Permits, Housing Starts and speech from the President of the Federal Reserve Bank of New York, John C. Williams.

Markets are looking for CBI industrial orders to increase from October’s multi-year low of -37 to -30 during November. We think that risks lie toward a more significant gain because the October survey hopefully didn’t capture the improvement in sentiment because Brexit success chances were increased.

The market expects housing starts to have rebounded to 1,320k in October, reflecting a firm 5.1% m/m jump. This would follow a notable -9.4% tumble in September, which was primarily driven by a sharp -28.2% m/m contraction in the volatile multifamily segment,” says T.D. Securities.

Daily Support and Resistance


S3 1.2826

S2 1.289

S1 1.2922

Pivot Point 1.2954

R1 1.2986

R2 1.3018

R3 1.3081

GBP/USD– Trading Tips

The GBP/USD is consolidating with a bullish bias, and it surged to test resistance mark around 1.2970 level. The GBP/USD pair is now facing a double top resistance level at 1.2975 on the 4-hour chart. Typically, the pair becomes bearish below the double top. Therefore, the GBP/USD may exhibit bearish retracement unto 1.2925 ere driving the bullish trend to 1.2975. 

The MACD and RSI are staying in the bearish zone, suggesting chances of bearish trading in the GBP/USD trading today. 


USD/JPY – Daily Analysis

The USD/JPY currency pair consolidates in the narrow range between the 108.60 and 108.70 so far. As of writing, the currency pair is currently trading near the 108.60.

The USD/JPY currency pair has been capped due to markets presuming a soft dollar policy from the United States administration, whereas trade discussions between the United States and China are on the close track, but the tension still surrounding the market.

The USD/JPY currency pair dropped from 109.05 in early N.Y. to just above 108.50. As for United States treasury yields, the United States’ two-year yields have been on the buying from 1.60% to 1.63% before dropping back to 1.59% due to the US-China trade doubt. The 10-year yields also dropped from 1.85% to 1.80%. 

On the technical side, the USD/JPY pair now tries to re-test 50% Fibonacci retracement of April-August drops at 108.40. However, a confluence of 50 and 100-day Exponential Moving Average (EMA) around 108.30/25 will be the key to limit the pair’s further bearish sentiment. The Japanese Trade Minister was on the wires last minutes, also telling the need for an extra budget of around JPY 10 trillion.


Daily Support and Resistance

S3 107.63

S2 108.19

S1 108.44

Pivot Point 108.75

R1 109

R2 109.32

R3 109.88

USD/JPY – Trading Tips

The USD/JPY is trading at 108.60, completing 61.8% Fibonacci retracement level at 108.550. For now, this level also works a double bottom support level as the USD/JPY prices are pushing higher. 

On the uppers side, the USD/JPY may find resistance at 108.700, and bullish breakout of this level can extend buying until 108.900 level today. Consider taking sell positions below 108.900 to target 108.500 today. 

All the best!

Categories
Forex Videos

Technical indicators Vs Price Action – Which Is Best For High Probability Forex Trades


Technical indicators V. Price Action


The foundation of price action trading is based on the discipline of making all trading decisions based on chart analysis only. A chart, relating to a specific period of time, or time frame, reflects the beliefs of traders in the form of ‘price action.’
Technical traders believe that economic data and other global news events are the catalysts for price action movement. Technical trading assumes that we don’t need to fundamentally assess such data in order to trade the forex market successfully. The reason for this is because all economic data and related world news that causes price movement are ultimately reflected in the price seen on a chart.

Example A


In example ‘A’, the candlestick formation shows an elevated price action at the beginning of the charts on the left-hand side, and then falls lower and traders believe that the market news is ‘in the price’ and therefore they are safe to trade the charts on the basis that their technical indicators are telling them that the price action is overbought, or oversold, and that therefore their chart indicators have a greater probability of offering winning trade set-ups until the next release of economic including such things as unemployment, CPI and inflation, gross domestic product or GDP, interest rate changes and political events and conflicts.


Example B


How do we analyze the price action? Let’s look at the example ‘B.’ This is a 15-minute time frame chart of the EURUSD pair. Each of the Japanese candlesticks presents 15 minutes of price action. Traders always read their charts from left to right, and in the case of Japanese candlesticks trading, they try to decipher the meaning of each candlestick, either individually or as part of a trend.


Example C

In the example ‘C,’ we have highlighted some Gravestone Doji’s and Inverted Hammers, which traders look out for because they tend to occur at times of price action slowing just before a reversal.


Example D

In example ‘D’ this is made much clearer by the use of some technical lines to identify an A, B, C, D, price action, and where at position C, technical traders would be looking for a push lower to the ‘D’ position, purely based on the gravestone and inverted hammer candlestick formations.


Example E


Now let’s look at example E, we have now added a trend line at position 1, and we can see a clear trend which is moving to the upside, and where price action bounces off our trendline as it gradually pulls back from the lows of the previous A, B, C, D, price swing. However, price action begins to flatten out at position 2, and when the price breaks through our trend line at position 3, our bear traders will no doubt be wondering if there is going to be a continual push lower to add to the overall trend of this chart. But the push lower is short-lived, and price reverses during position 4, and where these three candlestick formation is known as three Bullish soldiers and typically denotes a strong bullish trend. Price action falters at position 5, and this becomes an area of resistance, or a ceiling because technical traders will have drawn a trendline, such as ours, and noted that price failed to go above this level on three previous occasions at position 2. Indeed price action begins to fall lower from position 5.

So, in these examples, we can see just how important price action alone, in the form of Japanese candlesticks, and a few lines drawn onto our charts can be so effective in analyzing the ‘clean’ price of an exchange rate. There is an abundance of information when we drill down and look for it. But this can only be truly established by learning about how Japanese candlesticks can define price movements, the stalling, and reversal of price movement, and the indisputable evidence they provide of support and resistance on the basis that these candlestick shapes and formations simply repeat themselves time after time. Price action is a leading indicator, whereas technical indicators, which are overlaid onto chats and follow a statistical measurement of price, are lagging indicators. While technical indicators are an extremely effective tool in technical analysis, they often throw up false signals, or simply leg behind price action so far as to be unreliable when used on their own and without factoring in price action.

Here at Forex.Academy we recommend that new traders learn about the significance of Japanese candlesticks, and study their charts, and read them from left to right, because they tell a story of where price action has been, and where it is likely to move to in the future, based on the fact that all the relevant fundamental data is already encapsulated in the exchange rate of a particular price action.

Categories
Forex Trading Guides

Ichimoku Kinko Hyo Guide – Start Here

Ichimoku Guide – Start Here

The Ichimoku Kinko Hyo system is a powerful, tested, and vetted trading system. This guide will lead you in the direction of the articles you should follow.

Phase One – Start Here

Ichimoku History

In this article, you will learn a short history of Japanese technical analysis. It is not necessary to read this article to understand the Ichimoku Kinko Hyo system, but I would suggest reading it.

Ichimoku Kinko Hyo System

Learn the Ichimoku Kinko System and its components. Learn how it works.

Phase Two – Beginners Strategies

Ichimoku Strategies

Ideal Ichimoku Strategy

Learn your first Ichimoku Strategy, the Ideal Ichimoku Strategy.

K-Cross Strategy

Learn the Kijun-Cross ‘Day Trading’ strategy.

Phase Three – Advanced Ichimoku Kinko Hyo Theory

The Two Clouds Discovery

Learn about Manesh Patel’s powerful discovery, an extremely useful addition to your Ichimoku trading strategies.

The Three Principles

Wave Principle

Price Principle

Time Principle

Learn about the three principles in Ichimoku Analysis. Ichimoku analysis has a Wave, Price, and Time principles.


Categories
Forex Trading Guides Ichimoku

Ichimoku Kinko Hyo Guide – A walk through a trade.

Ichimoku Kinko Hyo Guide – A walk through a trade.

I want to preface this guide with a screenshot of my account.

Trade History
Trade History

The screenshot is a series of some of the trades I’ve made in early April 2019. I do this because this guide on trading with Ichimoku will target the trade that is highlighted. Additionally, I think it is important that if I am showing you an example of a trade for a guide, I should show that I had skin in the game. There are a great many guides and strategies that authors, analysts, and traders suggest, but few will share if they took the trade. The highlighted trade for the EURGBP is the trade I will be using for this guide. It is a great example of the trading methodology I use with the Ichimoku System.


Multiple Timeframe Analysis – Daily, 4-Hour, and 1-Hour

The Ichimoku Kinko Hyo system is most effective when utilizing multiple timeframes. It is the only way that I use the Ichimoku system. In my trading, I use the Daily, 4-hour, and 1-hour time frames. Multiple timeframes are extremely useful in filtering your trade entries and ensuring higher probability trade setups. The process below will go through the process I used to take the trade.

Step One – Daily Chart Check: Price greater than Kijun-Sen, NOT inside the Cloud.

Step One - Check Daily Cloud
Step One – Check Daily Cloud

The very first thing I check is the daily chart. If the price is inside the Cloud on the daily chart, I skip the chart. It’s dead to me. If the price is not inside the Cloud, I then look for where the price is in relation to the Kijun-Sen. The daily chart determines my trading direction. If the price is above the Kijun-Sen, I only take long trades. If the price is below the Kijun-Sen, I only take short trades.

Step Two – 4-Hour Chart Check: Price above the Cloud, Chikou Span above candlesticks.

Step Two - Check 4-hour chart.
Step Two – Check the 4-hour chart.

If the daily chart determines the direction of my trading, the 4-hour provides the filter for the entry chart (the 1-hour chart). The only things I am concerned about with the 4-hour chart is that the Chikou Span is above the candlesticks, and that price is above the Cloud. Preferably, the Chikou Span would also be in ‘open space’ – but I don’t use it as a hard rule. I have not found the open space to be as important during the change of a trend or corrective move.

(a note about ‘Open Space’ – Open Space is a condition where the Chikou Span won’t intercept any candlesticks over the next five to ten trading periods. When the Chikou Span is in open space, this represents ease of movement in the direction of the trend with little in the form of resistance (or support) ahead.)

The EURGBP trade we are analyzing is a good example of why, at the current position, I don’t consider the open space as strict as I would on the hourly. I want to refer you back to the daily chart. If, on the daily chart, both price and the Kijun-Sen are below the daily cloud, but price moves above the Kijun-Sen – I don’t consider the open space variable as important on the 4-hour chart.

Step Three – 1-Hour Chart Check

Step Three - 1-hour Entry
Step Three – 1-hour Entry

The 1-Hour chart is my entry chart. As long as Step One and Step Two are true, the 1-hour chart is where the bread and butter of the trading occurs. My entry rules are this:

  1. Future Span A is greater than Future Span B.
  2. Chikou Span above the candlesticks and in ‘open space’ – for five periods.
  3. Tenkan-Sen is greater than Kijun-Sen
  4. Price is greater than the Tenkan-Sen and Kijun-Sen.

I generally look for a profit target of 20-40 pips, depending on the FX pair. For example, on the NZDUSD, I would look for 20 pips, and on the GBPNZD, I would look for 40 pips. But there are some hard technical reasons to leave a trade before that profit target is hit. The list below represents my exit rules on the 1-hour Chart – I exit the trade if any of these conditions occur.

  1. Exit if Chikou Span below candlesticks for more than three consecutive candlesticks.
  2. Exit if price enters the 1-hour Cloud.
  3. Exit if Tenkan-Sen below the Kijun-Sen for more than five candlesticks.

Step Four – Reentry Rules

Step Four - Reentry
Step Four – Reentry

Entry rules are fine, but the problem isn’t always finding the entry. One of the hardest problems is creating rules for re-entering a trade. Mine are as follows:

  1. Tenkan-Sen and Kijun-Sen must be above the Cloud.
  2. Chikou Span above the candlesticks.
  3. Price greater than Kijun-Sen and Tenkan-Sen.

A quick summary of steps taken

  1. Checked the daily chart, the price was above the daily Kijun-Sen. The trade direction is long/buy.
  2. Check the 4-hour chart, the price was above the Cloud, and the Chikou Span was above the candlesticks.
  3. All 1-hour rules confirmed an entry; profit taken at 40 pips.
  4. Re-entered trade on 1-hour chart, exited when price entered the 1-hour Cloud.


Sources: Péloille, Karen. (2017). Trading with Ichimoku: a practical guide to low-risk Ichimoku strategies. Petersfield, Hampshire: Harriman House Ltd.

Patel, M. (2010). Trading with Ichimoku clouds: the essential guide to Ichimoku Kinko Hyo technical analysis. Hoboken, NJ: John Wiley & Sons.

Linton, D. (2010). Cloud charts: trading success with the Ichimoku Technique. London: Updata.

Elliot, N. (2012). Ichimoku charts: an introduction to Ichimoku Kinko Clouds. Petersfield, Hampshire: Harriman House Ltd.


Categories
Forex Market Analysis

Daily FX Brief, November 18 – Major Trade Setups – Risk-on Sentiment In Play

On Monday, the market trades with a risk-on sentiment over the faded safe-haven appeal. Significant forex pairs indicated time on Monday as traders observed to whether Washington and Beijing can promptly approve an agreement to end a trade war that has been a drag on word’s economic growth.

  EUR/USD – Daily Analysis

The EUR/USD currency pair hit the bullish track and currently trading at 1.1061, As of writing, the pair consolidates between the range of 1.1048 – 1.1065 on the day and hit the weekly highs at 1.1065 mainly due to greenback weakness against the bucket of currencies. The buyers join the latest bullish trend, awaiting fresh trading clues and keep their eyes on ECB-speak.

On the EUR-side of the equation, the Eurozone October inflation came in as expected, up by 0.7% YoY and core CPI up by 1.1%, which supported the continuing bullish drive in the common currency.

Looking forward, the buyers target the 100-DMA now located at 1.1093 should the recovery momentum continue. On the other side, the 50-DMA at 1.1042 could defend the downside if the ECB speakers support dovish expectations. However, the United States and China’s trade progress will keep under the spotlight for getting the fresh impulse.


Daily Support and Resistance

S3 1.0957

S2 1.0999

S1 1.1026

Pivot Point 1.1042

R1 1.1069

R2 1.1084

R3 1.1126

EUR/USD– Trading Tips

The EUR/USD proceeds to trade higher, violating the resistance level of 1.1000, which now is working as a support. On the 4 hour timeframe, the EUR/USD has three white soldiers candlestick pattern, which is signaling chances of further buying in the EUR/USD. At the moment, the EUR/USD is holding at the resistance level of 1.1065 as above this; the pair can continue to soar until 1.1080. So consider staying bullish above 1.1065 and bearish below the same level today.

GBP/USD– Daily Analysis

The GBP/USD currency pair consolidates in the range of 12909 – 1.2933, representing 0.20% gains on the day. As of writing, the pair is currently trading at 1.2925 and faced a month old falling trend line resistance due to the increasing expectations of Tory leadership after the December elections. As well as the hardship for the United Kingdom Prime Minister Boris Johnson, limit the further pair’s upside.

The market’s trade sentiment still slows with the United States’ ten-year treasury yields taking rounds to 1.82%, whereas most Asian shares are flashing mixed signals.

Looking forward, traders will now keep their eyes on British prime minister Boris Johnson’s speech at Confederation of British Industry’s annual conference for getting a new direction to move ahead. At the economic calendar front, the US NAHB Housing Market Index figures for November, expected to remain at 71, will keep the thin line of statistics. However, trade and political headlines will keep under the spotlight.


Daily Support and Resistance

S3 1.2793

S2 1.2845

S1 1.2874

Pivot Point 1.2897

R1 1.2926

R2 1.2949

R3 1.3001

GBP/USD– Trading Tips

The GBP/USD continues to trend upward to test our previously suggested upper corner of a wide trading range of 1.2970 – 1.2780. 

The MACD and RSI are lingering in overbought territory as their values linger at 0 and 50, respectively. Besides this, the chances of bullish correction are becoming very strong. 

At the time, the GBP/USD trades at 1.2940 level, and it may find support immediate support around 1.2920. I will consider taking buying positions above 1.2920 and bearish positions if this level breaks on the lower side. 

USD/JPY – Daily Analysis

The USD/JPY currency pair consolidates in the narrow range between the 108.75 and 109.00, mainly due to intensifying tensions in Hong Kong and lack of trade war hopes.

So, the risk-off sentiment raises so far, with S&P 500 futures down -0.15%, Treasury yields falling almost 0.50%, whereas the Asian equity markets trade with moderate losses. The Japanese Yen currency still on the supported track and keeping a break above the 109 range.

If talking about the greenback, the U.S. Dollar still on the bearish track due to the losses in the Treasury yields. As in result, this situation sending lower the USD/JPY currency pair. Moreover, the investors are on the waiting mood and await some transparency regarding the United States and China trade deal and FOMC minutes for fresh trading direction, because the United States economic calendar seem light during this week.

As of writing, the U.S. Dollar Index traded 0.1% lower to 97.810. The Federal Reserve will announce the minutes of it’s October meeting on Wednesday, and several Federal Reserve policymakers are scheduled to speak before the upcoming Thanksgiving holiday.


Daily Support and Resistance

S3 107.96

S2 108.33

S1 108.55

Pivot Point 108.7

R1 108.93

R2 109.08

R3 109.45

USD/JPY – Trading Tips

The USD/JPY is trading at 108.90, crossing over 61.8% Fibonacci retracement level. This level also marks a double bottom resistance level, but that has now been violated and may keep the USD/JPY pair supported today.

The violation of the 108.90 level can extend buying until 109.200. The MACD and RSI are also supporting the bullish trend in the USD/JPY pair. 

All the best!

Categories
Forex Elliott Wave

How to Analyze a Fast Market Using the Elliott Wave Principle – Part 1

The speed is a characteristic of nature; in the same way, some markets tend to be faster than others. The problem arises when a market moves sharply. In this educational article, we’ll introduce how to analyze a fast market using the Elliott Wave Principle.

Price and Speed

Both price and speed are individual characteristics of each market. Depending on specific factors, one market could be faster than another.

The problem arises when, in an active market, the price moves faster than usual. R.N. Elliott, in his Treatise “The Wave Principle,” wrote:

“In fast markets, it is essential to observe the daily as well as the weekly ranges; otherwise, characteristics of importance may be hidden.”

In other words, when the market studied in a specific timeframe doesn’t allow to identify any pattern. It is useful in these cases to observe the market in a higher time frame, for example, the daily or weekly timeframes.

The Case of Study

Consider the EURGBP cross in its 4-hour chart, which shows a rally developed from early May until the middle of August 2019. The remarkable observation is that the first part of the rally was faster than the second part of the range of study.

As a first step, let us observe the big-picture; in this case, we will study the EURGBP cross in a weekly timeframe. As can be noted, the EURGBP developed an extended Wave 3.

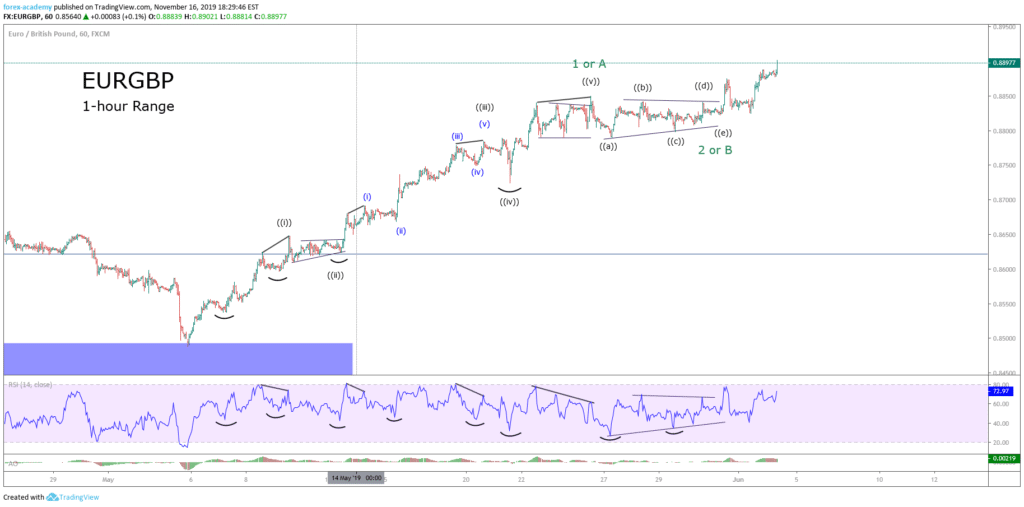
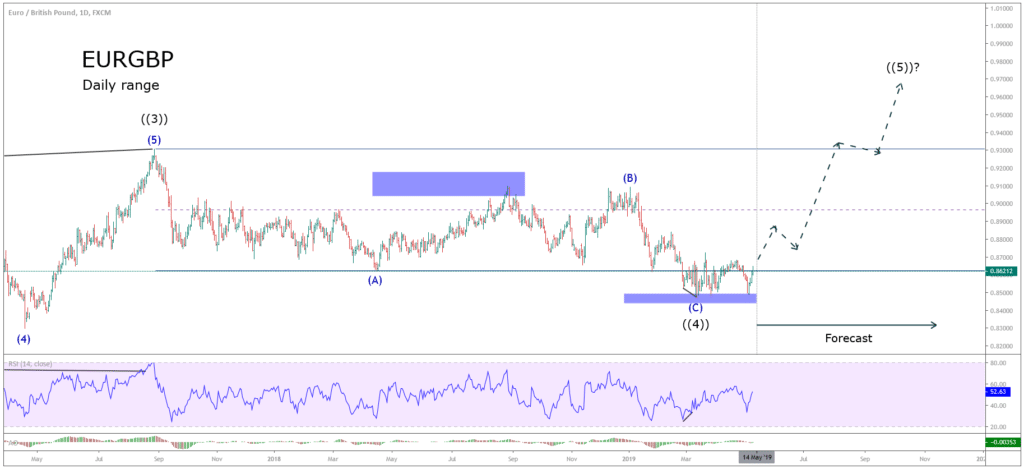
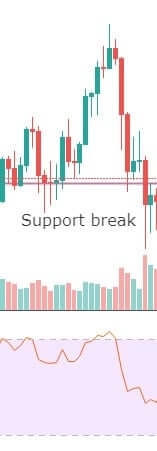
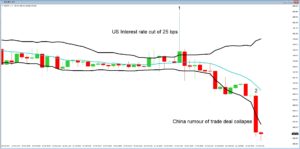
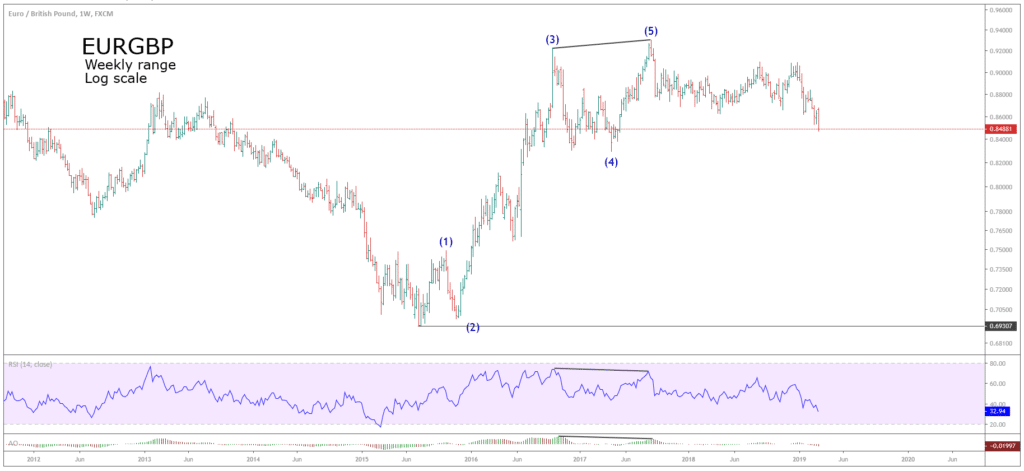
Both the RSI and the Awesome Oscillator display a bearish divergence, that helped us to identify waves (3) and (5).
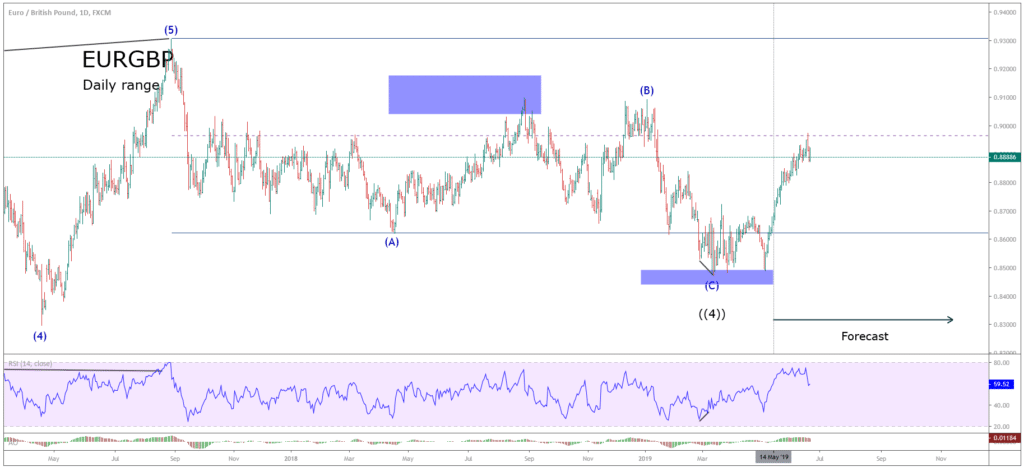
In consequence, in view that the five-wave sequence has been completed, it is time for a corrective movement in three waves.

The next chart shows the possible recount of the EURGBP cross.


In the above figure, we observe that the cross could have fully completed a cycle that, as we know, includes a motive impulse and its corrective sequence. Thus, if our market hypothesis is that the EURGBP has completed a cycle, then our forecast should consider a new five-wave rally.

The following chart unveils the upward movement developed by the EURGBP from its bottom, established in early May.


In the next educational article, we will expand the analysis on how to decipher a fast market using the Elliott Wave Principle.

Categories
Ichimoku

The Three Principles – Timespan Principle

The Three Principles – Timespan Principle

In another correlation to Western analysis, Hosada’s Ichimoku Kinko Hyo system has a timing component within the system. The numbering system used in Ichimoku is unique when compared to Western analysis. The reason for the numbering and counts in Ichimoku is related to the cultural importance of some numbers in Japan versus others. Numbers that would be considered ‘lucky’ in Japan are the same numbers in the West and many other cultures – particularly 7 and 9. But those numbers themselves are not what is important. How, exactly, this numbering and count system came to be developed in the fashion that it was developed I do not know. The following is directly from Ichimoku Chats – An Introduction to Ichimoku Kinko Clouds by Nicole Elliot – I heavily suggest getting her book (the 2nd edition). The important numbers are:

9, 17, 26, 33, 42, 65, 76, 129, 172, 257

If you ever study the work of WD Gann, then these numbers are not only familiar but non-random.

Numbering

Numbering the candlesticks in a pattern is done with traditional Arabic numbers (1,2,3,4,5, etc.) and English letters (A, B, C, D, E, etc.). When counting how many candles are in a trend/wave, the last candle in an uptrend is counted as the first in the down wave and vice versa. See below:

Timespan Principle - Candle Counts
Timespan Principle – Candle Counts

Notice that candle 19 is also A, candle H is also 1. Also, notice that the time counts (total number of candles) in this ‘N’ wave all represent essential numbers in the Ichimoku number system. 19 is close to 17, H is close to 9, and 8 is close to 9.

Kihon Suchi – ‘Day of the turn.’

Nicole Elliot’s work is fantastic – it’s refreshing to read an analyst and trader who updates her work and goes through the grueling process of keeping it relevant. Kijun Suchi (‘the day of the turn’). The Kihon Suchi is the Hosada’s Timespan Principle put into practice. It is very similar to the use of Gann’s cycles of the Inner Year or horizontal Point & Figure counts to identify turns in the markets. Let’s use the image above again as an example. Below, I’ve separated the ‘N’ wave into A, B, and C.

Timepsan Principle - Combined Counts
Timespan Principle – Combined Counts

When adding the number of bars in A, B, and C, we always subtract 1 from each wave after the first. For example, if we counted five waves and the total was 100 bars, we would subtract 4 from 100; 96. On the chart above, the total number of bars of A, B, and C is 33 bars. We subtract 2 from 33 to get 31. This is where the Timespan Principle using Kihon Suchi comes into play. We should be able to project the end of the down drive that will occur after wave C. Does it work? Let’s see.

Timespan Principle - A+B+C = D
Timespan Principle – A+B+C = D

Below is another example. In reality, the use of the Timespan Principle is a very simplified version of a phenomenon known as a foldback pattern. But Japanese analysis focuses on the quality of equilibrium, so it makes sense to see this kind of behavior from a method that focuses on balance in all things.

Timespan Principle - Symmetrical Inverse Head & Shoulder Pattern
Timespan Principle – Symmetrical Inverse Head & Shoulder Pattern


Sources: Péloille, Karen. (2017). Trading with Ichimoku: a practical guide to low-risk Ichimoku strategies. Petersfield, Hampshire: Harriman House Ltd.

Patel, M. (2010). Trading with Ichimoku clouds: the essential guide to Ichimoku Kinko Hyo technical analysis. Hoboken, NJ: John Wiley & Sons.

Linton, D. (2010). Cloud charts: trading success with the Ichimoku Technique. London: Updata.

Elliot, N. (2012). Ichimoku charts: an introduction to Ichimoku Kinko Clouds. Petersfield, Hampshire: Harriman House Ltd.


Categories
Ichimoku

The Three Principles – Price Principle

The Three Principles – Price Principle

This will be the shortest article over the three principles, mainly because it is the same as many other Western styles of price projection. I do not need to go into any significant detail here. If you want further detail into this method, I would suggest Nicole Elliot’s book, Ichimoku Charts – An Introduction to Ichimoku Kinko Clouds (2nd Edition).

Elliot identified four price target methods from Hosada’s work: V, N, E, and NT. Elliot does mention that she (myself included) does not use this analysis and relies instead on traditional Western methods. However, she does cite that for investors and traders with short time horizons that this Japanese method of the Price Principle is superior to many techniques.


V Price Target

V = B + (B – C)

Inverse: B – (B+C)

Price Principle - V Price Target
Price Principle – V Price Target


N Price Target

N = C + (B – A)

Inverse: C – (B + A)

Price Principle - N Price Target
Price Principle – N Price Target


E Price Target

E = B – (A – B)

Inverse E: B + (A + B)

Price Principle - E Price Target
Price Principle – E Price Target


NT Price Target

NT = C + (C – A)

Inverse NT: C – (C – A)

Price Principle - NT Price Target
Price Principle – NT Price Target


Sources: Péloille, Karen. (2017). Trading with Ichimoku: a practical guide to low-risk Ichimoku strategies. Petersfield, Hampshire: Harriman House Ltd.

Patel, M. (2010). Trading with Ichimoku clouds: the essential guide to Ichimoku Kinko Hyo technical analysis. Hoboken, NJ: John Wiley & Sons.

Linton, D. (2010). Cloud charts: trading success with the Ichimoku Technique. London: Updata.

Elliot, N. (2012). Ichimoku charts: an introduction to Ichimoku Kinko Clouds. Petersfield, Hampshire: Harriman House Ltd.


Categories
Forex Videos

Technical Analysis Defined – Using Past Price & Technical Tools To Predict The Future

Technical Analysis Defined

Technical analysis is the study of historical exchange rate price action, which forex traders study in order to predict future price movement. Traders can look at historical price movements on charts with various time frames in order to determine the current trading conditions, including volume and liquidity and possible price movement. Technical analysts use screen charts because they are the easiest way to visualize historical data!

Example A


In the example ‘A,’ we can see a very basic screen 15-minute time frame chart of the EURUSD pair where the elapsed time is shown on the X-axis along the bottom and where the change in exchange rate price fluctuations is shown on the vertical Y-axis to the right of the chart.
Many professional technical traders are of the opinion that the fundamental reasons that might affect a currency exchange rate, such as the latest economic data releases, including interest rates, will all be encapsulated within the current exchange rate, as seen on the chart. But of course, everybody’s opinion differs and when you Factor in market sentiments and expectations from future events, plus institutions creating extra markets liquidity by ducking in and out of various currency pairs. This is just one of the reasons why exchange rates seldom stay static.
But, essentially, traders use past chart data in order to try and determine future exchange rate direction.

Example B

Let’s look at an example ‘B.’ This is the same 15-minutes charts of the EURUSD pair, and the only tool we have on the screen is Japanese candlesticks. Some Traders only have candlesticks on the charts because they are often the best indicator of all when it comes to historical price movement. In our example, we can see that to the left of the screen at position A there was a self in the pair to position B, and then a complete reversal to position C, where one single bullish candlestick engulfed the price activity of the previous elven time frames. Therefore, due to the size of this candlestick, it would have been considered to be a strong indication that the market was going to continue to move higher.

Example C


In example ‘C’, we are sticking with the initial A, B, C move, to try and identify what traders might have been looking for during the move from position B to position C. As such we have added some X’s, which mark areas, usually a couple of pips above entry points where the short-selling traders in our example may well have placed their stop losses, during periods mini stop losses are taken out, it can increase volatility, And so Traders will be aware where of where the stop losses lay.

Example D


In example ‘D’, we have added Bollinger bands to our chart. This is another tool favored by technical analysts. Something clearly interesting can now be seen at point ‘A,’ which is at the top of the bands, and often features as a selling opportunity to traders. And at position ‘B,’ we can see price action bounce off the bottom of the bands and move up to position C. Again, price action had reached the top of the bands again before pulling back slightly, but not to the bottom of the bands this time. And this was most likely due to the fact that the move from b to c was seen as a bullish move and where several stop losses were taken out along the way.

Generally speaking, over 90% of price action will remain within the Bollinger bands.
In example ‘B’ we have added another favourite tool that technical Traders use the stochastic oscillator, which is a momentum indicator and tells traders when a pair might be overbought, for example when the two lines moved above the 80 axis line, and when the pair were likely oversold, which would be when the two lines crossed underneath the 20 axis line.


Here we can see that at position ‘A,’ the stochastic was close to the 80 axis line, and therefore overbought. We subsequently see at position B, that our stochastic had gone below the 20 axis line and the market then moved higher to position C. We think we know why there was only a short pullback from position C to position however D, and then position E coincides with our stochastic being overbought at position 3. From here, we then see a fall back in price action.

One of the most common mistakes that new traders make is to load up their screens with many and various technical tools. In the case of technical analysis, we find that less is more when it comes to using technical trading tools.
This is a short example of the power of technical analysis. However, there is a caveat, which is that indicators are just that, indicators! They are not a guarantee of future price action and must be used with caution. The best indicator is price action itself, and even this is not a guarantee that price action will not stop dead in its tracks and completely reverse without warning.

Categories
Forex Market Analysis

Gold’s Bullish Channel Supports – U.S. China Sentiments Remains Mixed!

On Friday, gold prices declined the demand for safe-haven assets fell remarks from White House economic adviser Larry Kudlow that the United States is pretty close to settling an interim trade agreement with China.

Fresh certainties regarding the United States and China trade deal returned after the goodwill gestures by the Dragon nation as China lifts the restrictions on the United States poultry imports. Additionally, the headlines of the restart trade talks later on the day also improve the risk-on market.

At the Kudlow front, the latest comments from the White House Economic Adviser Kudlow announce that we are very close to getting the trade deal with China, so in the consequences, the bounce-back came in the U.S. Treasury yields and S&P 500 futures.


XAU/USD – Daily Technical Levels
Support Resistance
1,465.42    1,476.06
1,459.45    1,480.73
1,448.81    1,491.37
Pivot Point 1,470.09

On the 2 hour chart, the yellow metal gold is trading in a bullish channel, which is supporting it around 1,461 level along with a resistance level of 1,473. The new 2-hour candle is bullish marabou, which signals the chances of a bullish trend in gold.

The leading indicators, such as MACD and RSI, are still trading below 0 and 50 level, supporting the bearish bias in gold. With that being said, gold prices may drop further until 1,452 level of it manages to give us closing below 1,460 level.

Likewise, the bullish breakout of 1,473 resistance opens further room for buying until 1,479.

Categories
Forex Basics

Importance of Timing in Trading

Timing is an essential factor in trading. Price action traders take entry on signal candle’s/bar’s attributes and support/resistance breakout. Many traders ignore the timing factor. However, it is an important factor when the signal candle is produced. In this article, we are going to demonstrate an example of the importance of timing in trading.

This is a daily chart. The price keeps going towards the South. Traders shall only look for selling opportunities in this chart on upward price correction/consolidation. Let us go to the next chart and find out what happens next.

The chart produces an engulfing bullish candle. It is a sign that the price may go towards the North. Intraday buyers such as 5M, 15M, H1 traders may look for long opportunities in this chart. The daily chart traders must wait for the correction/consolidation to get over upon a daily bearish reversal candle.

The price heads towards the North with good bullish momentum. The intraday buyers have made full use of the engulfing candle here. However, upper shadow and an Inside Bar suggest that a bearish reversal may come soon.

Here it is. A bearish engulfing candle suggests that it is time to look for short opportunities. It is a daily chart, so we shall flip over to the H4 chart to look for short opportunities.

The H4 chart shows that the price consolidates and makes a bearish move. However, support is still intact. The sellers must wait for a breakout at the support to go short on this chart. Let us draw the support line on the chart.

With an upward adjustment, the support lies at the black marked level. One of the H4 bearish candles is to breach the level for the sellers to get engaged in selling. Let us proceed to the next chart.

Concentrate on the chart. The chart has produced six candles since we have flipped over to the H4 chart. Six H4 candles mean a trading day is passed. Does it have any message to give us? We dig into the message later. Let us proceed to the next chart.

Wow! We have a breakout. Some traders may want to trigger an entry right after the candle closes. Let us find out what happens next.

The price starts heading towards the North. The price hits the Stop Loss. It even breaches the highest high of the wave. This is a different ball game now. If it were a technically right entry, we would not have talked about it. The thing is this one was a wrong entry, as the signal candle forms at the wrong time.

The signal candle does not form within the next trading day. It takes nine H4 candles to make the breakout. If the signal came within the first six candles, it would have been a valid trade. Since it comes at the ninth candle, it means the support has become daily support. Thus, an H4 breakout is not enough to drive the price towards the South. It goes towards the upside instead. The lesson we have learned here is, “A breakout is not a breakout if it does not take place at the right time.”

Categories
Forex Basic Strategies

Learning The Art Of Fading In Trading

What is Fading?

Fading involves placing trades against the trend to profit from a reversal. Using the concept of fading, a trader will short sell, expecting the momentum to fade when the market is in an uptrend. Likewise, he/she will buy a currency pair with the expectation that the move will fade away and reverse when the market is in a downtrend.

The fading strategy involves three assumptions:

  • The price is either at the overbought or oversold condition.
  • Early buyers or sellers are getting ready to take profits.
  • Current position holders might be at risk.

Overbought and oversold conditions can be identified using technical indicators such as the Relative Strength Index (RSI). Momentum shows the signs of shifting of forces from bulls to bears or vice-versa. And as these signs develop, current holders of the asset start to rethink their positions.

These conditions get exaggerated after an earnings announcement or news release. This may lead to a knee-jerk reaction on the part of other traders to sell the currency pair. As a result, this reaction gets overextended, and a mean-reversion takes place.

Now let us see how does the strategy work and what are the necessary steps you need to take to profit from the strategy:

The Fading strategy

Step 1 – Identify market extremes from the daily time frame 

The first step is identifying overbought and oversold zones using technical indicators or chart patterns.

The popular indicators used for identifying the zones include:

The overbought and oversold conditions are indicated by reading above or below a certain level. For example, the market is said to be in an overbought condition if the RSI is above 70, and it is said to be in oversold condition if the RSI is below 30. This can help traders in identifying fading opportunities.

In the above chart, we can see how the RSI indicator was crossing the normal range when the market gets into the overbought zone. One can find trading opportunities just using the RSI indicator stand-alone. But to trade like how professionals trade, we need to use a lot more tools.

Traders may also use familiar chart patterns or analysis based on price action and watching the price continuously.

Step 2 – Look for signs of capitulation

The second step in the strategy is to look for early signs of capitulation or change in the short-term trend using momentum. This can be mostly done by using candlestick patterns or price action with a volume indicator. We suggest looking for price action signals.

Some other signs to watch for include:

  • When technical indicators start to fade or move away from their extreme overbought or oversold levels.
  • The volume of the significant trend starts decreasing, or the volume of the opposite trend starts increasing.
  • Bearish candlestick patterns appear (in case of an uptrend), or critical support and resistance are broken.

It’s essential to identify these signs early to maximize profit and avoid mistakes.

The signs mentioned above can be explained better with the help of some figures.

Image 1

In the above image, we clearly see that the market is in an uptrend and has been trending from a few days (as it is a daily chart). The volume of the significant trend is also high with the decreasing volume of the sellers, which is a good sign for bulls. But in the end, the volume starts to decrease. The RSI declines sharply after entering the overbought zone for a while.

Image 2

Immediately we see an increase in the volume of sellers with a drastic drop in the RSI indicator (Image 2). The signs are getting stronger for a reversal, and this trend can continue. All the traders who are holding the currency pair start exiting the market. This could be one of the most reliable signs for us to take appropriate action.

Image 3

Finally, we see a break in the ‘support’ by the bears with high volume. Now we have combined all the tools, and each of them is indicating a reversal. Hence, we should take a position in the opposite direction. This is precisely the kind of setup that you need to be looking for every time.

Image 4

In order to find the exact entry, we need to magnify the chart. For this, you need to go on a lower time frame to analyze and set your stop-loss or target based on that time frame. This is mandatory for getting precise entries. The above figure is the lower time frame chart of the explained example.

Note: Images 1, 2 & 3 belong to the daily timeframe, whereas Image 4 belongs to the 4H timeframe.

Step 3 – Enter the trade with a stop-loss and take-profit

The last step is to enter the market with a compulsory stop-loss and take profit to ensure risk management is in place. In this strategy, a stop-loss order can be placed above the price where the RSI enters the overbought/oversold zone. Avoid putting small stop-loss as you can prematurely get stopped out from the trade.

Profit can be booked when the volume of your trend starts to decrease. Now, the stop-loss and target would be placed, as shown in the above chart. This trade would result in a risk-to-reward ratio of a minimum of 1:5. Traders can also use a moving average or any other indicator to set a profit-taking price level. Limit orders are almost used by all traders to avoid any slippage or other issues, particularly in less liquid assets.

Bottom line

Fading strategies can be considered as risky as you are going against the trend. It is always a good idea to take a trade if the risk to reward ratio is favorable. These strategies are commonly used by short to medium term traders to capitalize on short term reversals. Even though it seems risky, it can be extremely profitable if appropriately used. This is because the market has reached a saturation state, and there has to be some balancing force. This is why fading strategies are also known as contrarian strategies. Because they work on the assumption that prices deviating far from the trend, tend to reverse and revert back. That’s about Art Of Fading. If you have any queries, let us know in the comments below. Cheers.

Categories
Forex Market Analysis

Daily FX Brief, November 15 – Major Trade Setups – Core Retail Sales In Focus! 

The US greenback has stretched back a little versus the Japanese yen, as risk-off sentiment dominated the market. That being said, this market is highly sensitive to risk appetite, so with the multitude of problems that the global economy has right now/ Friday is a calm day ahead of the data aspect. There are no economic figures due from the United Kingdom to give the Sterling with direction.

Economic Events to Watch Today

Let’s took at these fundamentals.


EUR/USD – Daily Analysis

A day before, the EUR/USD currency pair traded on the bearish track as on the way a stable support level of 1.0990 was there to stop its movement. As we know, the German Q3 GDP showed the Eurozone’s largest member miss entering Techincal slowdown but overall look still darker. 

As of writing, the EUR/USD currency pair seen on the bearish track and losing almost 160 ticks during the last ten trading session. At the starting of the month, we observed the 200-day Moving Average as a robust range for the EUR/USD pair to hit, which it proved, and any support from the 50 and 20-day Moving Average proved short-lived.

As of now, the EUR/USD currency pair continues to move lower with the 1.1000. The EUR/USD currency pair on the overselling track, but this may well slow down and not change its direction. A double at the 1.0879, while these targets remain near and achievable. 

Daily Support and Resistance

S3 1.0936

S2 1.0974

S1 1.0998

Pivot Point 1.1013

R1 1.1037

R2 1.1052

R3 1.109

EUR/USD– Trading Tips

The EUR/USD continues to trade lower, maintaining a bearish bias after violating the support level of 1.1000. On the 4 hour timeframe, the EUR/USD has inside down candlestick pattern, which is signaling chances of further sell-off in the market. 

For the moment, the EUR/USD is holding above a crucial trading level of 1.0990 as below this; the pair can continue falling until 1.0960. So consider staying bearish below 1.0990 level today.


GBP/USD– Daily Analysis

The GBP/USD currency pair sideways and taking round to 12840 mainly due to optimism surrounding the United Kingdom political plays face the greenback strength ahead of the United Kingdom Retail Sales Data for October. 

Friday is a calm day ahead of the data aspect. There are no economic figures due from the United Kingdom to give the Sterling with direction. The shortage of fundamentals leaves the Pound firmly in support of UK politics and the general voting opinion polls. At the moment, the Pound was down by 0.02% to $1.2879.

The GBP/USD was range-bound since Monday, in what has been a dull week, but the Cable showed a dramatic surge to 1.2880 level. The pair is still finding support around 1.2870, and below this, the GBP/USD can drop until 1.2860 level. On the higher side, we see resistance at 1.2925, which is defending the symbolic level of 1.3000.

Daily Support and Resistance

S3 1.2767

S2 1.2806

S1 1.2829

Pivot Point 1.2845

R1 1.2868

R2 1.2884

R3 1.2923

GBP/USD– Trading Tips

The GBP/USD has come out of a broad trading range of 1.2970 – 1.2780 to trade at 1.2870 level. The MACD and RSI are holding in an overbought zone as their values stay at 0 and 50, respectively. With this, the odds of bearish correction are becoming very strong. 

At the time, the GBP/USD trades at 1.2880 level, and it may find support immediate support around 1.2870. I will consider taking buying positions above 1.2875 and bearish positions if this level breaks on the lower side. 


USD/JPY – Daily Analysis

The US greenback has dropped a bit versus the Japanese yen, tearing through the 200 day EMA but has a vital sum of support just below as well. I think we maintain the very slovenly trading, as markets have multiple concerns to trade with at the same time.

The US greenback has stretched back a little versus the Japanese yen, as risk-off sentiment dominated the market. That being said, this market is highly sensitive to risk appetite, so with the multitude of problems that the global economy has right now, it’s not difficult to imagine a situation where the Japanese yen remains to be a market that traders jump in and out of.

The latest update on the global macro figures is presenting a not so definite hint of the pernicious influence the protracted US-China trade war is becoming on the global economy.

Daily Support and Resistance

S3 107.87

S2 108.37

S1 108.57

Pivot Point 108.86

R1 109.06

R2 109.36

R3 109.85

USD/JPY – Trading Tips

The USD/JPY is trading at 108.50, right below the 38.2% Fibonacci retracement level. This level also marks double bottom support and may keep the USD/JPY pair supported today.

The violation of the 108.500 level can extend selling until 108.200. The MACD and RSI are also supporting the bearish trend in the USD/JPY pair. 

All the best!>

Categories
Forex Chart Basics

Unusual Candlestick Chart Types

In our previous article, we have seen the mainstream chart types, out of which the candlestick charts are the most prevalent in the current markets. But traders devised other ways to represent the price action in their search to get an edge over the rest of the traders. In this article, we are going to describe two popular variations of the basic candlestick chart.

Tick Charts

Tick Charts look similar to a candlestick chart, and every bar indeed is a real candlestick. But a Tick Chart does not depict a linear time scale. Instead, the chart moves to another bar every time a determined number of ticks have been reached.
And what is a tick? A tick is defined as one trade. So a 100-tick chart changes to a new candle every 100 trades, no matter its size.

Advantages of Tick charts

The main advantage of tick charts is that it allows spotting bars mostly populated by non-pro trades. Since every bar is made of the same number of trades, it is easy to detect bars with low volume, caused mainly through retail accounts. That allows pros to fade them and collect their money.

Tick charts homogenize the potential volatility on every bar because all bars represent the same number of trades. Therefore, it compresses low liquidity time segments into a few or one candlestick and expands hyperactive times into several candles. That way, amoving averages, and other indicators are more accurate. Also, the price action can be better appreciated, breakouts appear earlier, and chart cycles show up better.


Range Charts

Range charts are a convenient kind of chart. It also gets rid of the temporal method to move to the next bar. The idea of a range chart is to switch to a new bar once the chart has covered the assigned range. On the example supplied, the EURUSD is drawn using a 10-point range. Every candlestick covers ten pips and moves to the next bar. If the instrument is stuck inside a tight range, that candle may last for hours, until volatility comes back and the price creates a breakout.

Advantages of Range Charts

A range chart acts as a filter for ranging periods if the range size is adequately set, so trades can more easily avoid choppy market action, and only act on trendy segments.
Range charts also homogenize volatility.

Trends can be spotted more quickly as a result, and the trader can act on breakouts sooner than with regular candlestick charts. As happens with tick charts, indicators such as moving averages, MACD, and Stochastics work better with range charts.

The key to a proper range setting is to see when a relevant range starts a trend. It is easy to experiment until the adequate range hides most of the sideways action and takes away these harmful periods of inactivity. Looking at the average true range indicator on the timeframe of reference can help with the decision. The style of the trade should be taken into account. A scalping trading style calls for shorter ranges than a 4-hour trader.

To trade using range charts, we can add trend lines, averages, and other indicators. Range charts, as said, are excellent charts for the early entry of breakouts. Finally, range charts are very handy to spot momentum, so trade strategies based on volatility work better using them.


Categories
Forex Basic Strategies

Even a Choppy Price Action Offers Entries

The market moves in three ways upward, downward, and sideways. In today’s lesson, we are going to demonstrate an example of a Rectangle breakout and an entry from a choppy price action. Let us have a look at the chart below.

The price action is choppy in this chart. Typically, traders avoid this kind of price movement. However, if we want to take trading as a full-time business, we are to widen our eyes. An entry can be found even in this market. Concentrate on the rectangle drawn here. After all these bounces, rejections the price finds its support and resistance within the rectangle.

The chart produces a bearish engulfing candle right at the resistance of the rectangle. This is a sign that something may happen. Let us assume a bearish move may occur. The first candle of the bearish trend looks good. A downside breakout with good momentum is the second thing that the sellers may wait to get.

The next candle comes out as a bearish candle followed by an Inside Bar. Things are getting better for the sellers. A bearish engulfing candle closing below the support would be the signal to go short for the sellers.

Here it is. The breakout candle is a bearish Marubozu candle. We may trigger a short entry right after the candle closes. Let us find out where we will set our Stop Loss.

Many traders may suggest setting the Stop Loss above the resistance of the rectangle and setting the Take Profit with the same distance. This is a good idea. However, we may set our stop-loss just above the resistance of the last consolidation. The reason is the price consolidates before making the breakout at the support. If the price made a breakout without the consolidation, we would have set our Stop Loss differently. By setting Stop Loss above the last consolidation’s resistance, we are to keep an eye with our Take Profit level.

We may set our Take Profit all the way down at the last swing low. The price may have kept going towards the major support. Look at the chart above. What do you think? The price is still very bearish but it produces a bullish reversal. That is too with a gap. The price action traders do not like price gaps. Considering the fact that we have set our Stop Loss as close as it can get, thus it may be the time to close our trade and come out with the profit.

The Bottom Line

Even a choppy market ends up producing an excellent trading signal. Our first choice shall be trending markets to look for entries. However, if we can spot out some entries from the choppy market, it would surely make us be more profitable.

Categories
Crypto Market Analysis

Daily Crypto Review, Nov 14 – Markets slightly down, NEO still gaining in value

The cryptocurrency market was in a slight red, though many cryptocurrencies gained some value. While most of the cryptos are losing value in the 1%-2% range, quite a lot of gainers increased in price 5%-6%. If we take a look at the past 24 hours, Bitcoin went down 0.69%, and it is now trading at $8,688. Ethereum gained 0.28%, while XRP went down 1.59%.

Of the top100 cryptocurrencies by market cap, the biggest gainer is Noah Coin, with 328.96% daily gain. The biggest loser of the day was Aurora, which lost 30.53% of its value.

Bitcoin’s dominance remained at the same place from the last time we checked the markets. Its dominance now sits at 65.9%, which is a decrease of 0.02% from yesterday’s value.

The cryptocurrency market as a whole now has a market capitalization of $239.7 billion, which represents a decrease of $0.5 billion from yesterday’s value.

What happened in the past 24 hours

There was no big fundamental news that could spark up any moves to the upside or downside in the past 24 hours. As a result of that, the markets kept consolidating, and the price of most cryptocurrencies didn’t move.

However, a more bearish outlook on the cryptocurrency market resulted in most cryptocurrencies being in the red. That being said, bullish news coming from the east are still strong and cryptocurrencies like NEO are having no problem defying the markets.

_______________________________________________________________________

Technical analysis

_______________________________________________________________________

Bitcoin

When compared to yesterday’s values, Bitcoin’s price is slightly lower. It is now right above the $8,640 support line, which actually got tested a couple of times. Each time it got tested, the bulls rallied and managed to keep the price above it. There were no attempts at breaking 8,820 yet.


Bitcoin’s volume is lower than yesterday, with RSI approaching oversold territory. The key levels remained the same.

Key levels to the upside                   Key levels to the downside

1: $8,820                                           1: $8,640

2: $9,120

3: $9,250                                            


Ethereum

Unlike Bitcoin, Ethereum was in a slight green if we compare the price to the one from the past 24 hours. Its price is still contained within a range between the resistance line of $193.5 and a support line of $185. Ethereum had a great day for the majority of the day, having one green candle after another. However, the price suddenly dropped to the support line, which is when the bulls rallied.


The key levels remain the same as Ethereum is back in the same position as it was yesterday.

Key levels to the upside                   Key levels to the downside

1: $193.5                                          1: $185

2: $198                                             2: $178.6

3: $163.5                                          3: $167.8


XRP

XRP did not have a good day. Even though its price is contained between the support level of $0.266 and resistance standing at $0.285, it managed to drop in value quite a bit. As the range between its key support and key resistance levels is bigger than with Bitcoin’s current support-resistance distance, the price’s ability to move is somewhat bigger. Still, there was almost no movement in the past 24 hours. The $0.266 line did not get tested, but we can see that bulls are already standing still near that price line.


XRP’s volume is still slightly elevated, while its RSI value is approaching oversold levels.

Key levels to the upside                   Key levels to the downside

1: $0.285                                           1: $0.266 (major support)

2: $0.31                                             2: $0.245

3: $0.325

Categories
Forex Market Analysis

Daily FX Brief, November 14 – Major Trade Setups – German Prelim GDP In Focus! 

On Thursday, the safe-haven demand remains high as the trader’s eyes stay on the United States and China trade news to observe the impact on the riks sentiment, which continues to play an impactable role in the USD/JPY currency par prices. The market will closely be observing the US producer Prices Index an Unemployment Claims data, which is scheduled to release ahead of day 2 of Powell’s testimony.

At the Hong Kong front, the Hong Kong civil unrest and violence take the worst turn for the 4th-straight day on Thursday, after the police reported that a man dressed in black and aged in his 30s died.

Economic Events to Watch Today

Let’s took at these fundamentals.


EUR/USD – Daily Analysis

The EUR/USD currency pair currently trading near the level of 1.1006 on the day. Even after the pair spot staying below 200-bar Simple Moving Average, the EUR/USD currency pair bounces off 61.8% Fibonacci retracement of its October month upward. 

However, the buyers will likely wait for a bullish break of 200-bar moving Average at 1.1058 now, followed by 38.2% Fibonacci retracement and late-October lows surrounding 1.1065/75, to target 1.1100 marks.

On the positive side, if the GDP positive release, the pair may attempt recovery of 1.1040 and 1.156, the confluence zone of the 50 and 10-DMA. Buyers will likely try for the test of the 100-day Moving Average at 1.1100 on a continues break above the last. 

On the technical side, the pairs Techincal st up continues to favor the buyers because the EUR/USD pair still on the track to test the immediate support of mid-October lows near the 1.0991. While the break bellow will likely escalate selling pressure, because of the buyer’s eyes 1.0950 as the next support, the more bearish trend in pairs could hit the multi-year lows of 1.0879 over again.

Daily Support and Resistance

S3 1.0958

S2 1.0983

S1 1.0996

Pivot Point 1.1008

R1 1.1021

R2 1.1033

R3 1.1058

EUR/USD– Trading Tips

The EUR/USD continues to trade lower, maintaining a bearish bias after violating the support level of 1.1000. On the 4 hour timeframe, the EUR/USD has inside down candlestick pattern, which is signaling chances of further sell-off in the market. 

For the moment, the EUR/USD is holding below a crucial trading level of 1.1000 as below this; the pair can continue falling until 1.0960. So consider staying bearish below 1.1000 level today.


GBP/USD– Daily Analysis

The GBP/USD currency pair sideways and taking round to 12840 mainly due to optimism surrounding the United Kingdom political plays face the greenback strength ahead of the United Kingdom Retail Sales Data for October.

Brexit party leader Nigel Farage’s denial of the Conservative’s request of standing down more than 317 candidates, earlier promised, will likely negatively affect the British Prime Minister (PM) Boris Johnson’s popularity. The United Kingdom’s (UK) PM Boris Johnson was recently hackled during a speech to the flood-affected area. Whereas, surveys regarding the December election keep showing Tories holding power.

Looking forward to October, UK Retail Sales could boost the GBP/USD demand if it hit the upbeat predictions. However, the market’s rush to risk-safety can increase the USD gains if the Fed Chair support upside momentum during his Testimony 2.0.

Overview of UK Retail Sales, the UK retail sales, scheduled to be released later this session at 0930 GMT, is forecasted to come in at 0.2% MoM in October, after no increase seen in September. Total retail sales are seen coming at 3.7% over the year in the reported month, up from 3.1% booked previously.

Daily Support and Resistance

S3 1.2767

S2 1.2806

S1 1.2829

Pivot Point 1.2845

R1 1.2868

R2 1.2884

R3 1.2923

GBP/USD– Trading Tips

The GBP/USD is consolidating in the broad trading range of 1.2970 – 1.2780, while if we narrow it down, it becomes 1.2870 – 1.2785. The MACD and RSI have passed above 0 and 50, sequentially, indicating the probabilities of a downward movement in the GBP/USD. 

At the moment, the GBP/USD trades at 1.2835 level, and it may find support around 1.2785. I will consider taking buying positions above 1.2845 and selling below the same level today. 


USD/JPY – Daily Analysis

The USD/JPY currency pair failed to hit the recovery track from thee 6-days lows of 108.65 and still stands near the range of 108.80 area, mainly due to on-going trade uncertainty between the United States and China. On the other hand, the pairs didn’t get any impact by the Japans Q3 GDP because of the renewed Sino-US trade war.

The Japanese Preliminary Q3 GDP rate slightly increased even less-than-expected across the time limit. However, the Japanese yen currency gave little attention to the sluggish figure releases. The Japanese yen continued getting support from the risk-off sentiment in Wall Street’s futures and global equities mainly after the United States and China trade tension again escalated during the overnight trading hours.

Trader’s eyes stay on the United States and China trade news to observe the impact on the riks sentiment, which continues to play an impactable role in the USD/JPY currency par prices. The market will closely be observing the US producer Prices Index an Unemployment Claims data, which is scheduled to release ahead of day 2 of Powell’s testimony.

At the Hong Kong front, the Hong Kong civil unrest and violence take the worst turn for the 4th-straight day on Thursday, after the police reported that a man dressed in black and aged in his 30s died.

Despite the Hong Kong confusion and renewed US-China trade tensions, the market mood looks to be developing over the last, with S&P 500 futures having flashed green as well as the Japanese stocks. This has helped put a minor buying under USD/JPY that is now trading in session highs near the 108.85 regions.

Daily Support and Resistance

S3 107.87

S2 108.37

S1 108.57

Pivot Point 108.86

R1 109.06

R2 109.36

R3 109.85

USD/JPY – Trading Tips

The USD/JPY is trading at 108.70, right above the 50% Fibonacci retracement level. This level also marks double bottom support and may keep the USD/JPY pair supported today.

The violation of the 108.700 level can extend selling until 108.500, the 61.8% Fibo level today. The MACD and RSI are also supporting the bearish trend in the USD/JPY pair. 

All the best!

Categories
Forex Chart Basics

All you need to be introduced to Trading Charts – Part 1: Line, Bar, and Candlestick Charts

Why Technical Analysis?

The expression “technical analysis” originated from the belief that price action is all that is required to make sound trading decisions. Fundamental analysts believe that fundamental or structural influences are already incorporated in the history of the price. The concept of price action analysis is credited to Charles Dow, the author of the Dow theory, around 1900.

Starting from there, TA began to rise in importance to traders. The idea that price movement discounts all new information seemed rational. Concepts such as price trending, price confirmation, support, resistance, divergence, and volume confirming price started to emerge.

TA practitioners believe that the current price represents the instantaneous consensus of value. It’s the cost at which someone is ready to buy and a different person to sell. That agreement depends on the different beliefs persons hold about the prevailing market situation. A potential seller believes that odds the price continuing moving up are minimal or that it will surely go down shortly. Opposing this view, a buyer, maybe trading in a different timeframe, might think it is the right place for the asset to start an uptrend. There’s a third category of people: Traders that are expecting to detect another price level to make a decision.

Charts

Traders using technical analysis record prices in charts. Since thousands of transactions happen every minute, chartists accumulate the market action in packets called timeframes. The x-axis registers the passing of time, while the Y-axis register the prices. Usually, volume bars are added at the bottom of the graph.

When traders and investors had to draw the charts on graphical paper, the usual was to use a daily timeframe and follow the daily closings. With the advent of personal computers and dedicated charting packages, we can find charts from sub-minute timeframes to hours, days, weeks, and months. Precisely, the MetaTrader 4 platform allows timeframes of 1 min, 5 min, 15 min, 30, min, 1 hour, 2, hours, 4 hours, one day, one week and one month.

Line charts

The most basic chart is the line chart. Line charts connect the ending price of every frame with a line.

Fig 1 – Line chart of the Bitcoin in a daily timeframe.

Bar charts

Line charts are useful to see trends but lack the information about how volatile was the session. To record this kind of information, chartists decided to draw vertical bars in every time segment, showing four critical elements: The open (O), the high (H), the Low (L), and the Close(C) prices of every segment of trading activity. That’s why sometimes they are called OHLC charts.

Fig 2 –  The same Bitcoin segment of history in a daily bar chart.

As we already stated, every bar is composed of four prices. The Open price is shown as a horizontal mark on the left side of the bar. A close price is depicted as a horizontal mark on the right side of the bar. The high is the highest point of the bar, and the Low price is the lowest part of a bar. The Close is the most crucial level, followed in importance by the Open, and then the high and the low.

Fig 3 – Bar anatomy.

The most probable price path for the bar shown above is the price moving from Open to High, then descending to the Low and finally having the strength to close higher. But we don’t know for sure. It might have moved from open to low, from there to a high to descend to the closing level, finally.  What we know for sure is that the sellers had the strength to drive down the price.

Candlestick charts

Candlesticks are a relatively new way to draw charts. They were introduced to the western world by the work of Steve Nison on the Japanse charting and trading methods.

They use the same four points, OHLC, but a body of the candle is formed between the Open and the Close. The rest of the price action, beyond that range, is left as a line called wick or shadow.

Fig 4 –  The same Bitcoin segment of history in a daily candlestick chart

 Traditionally a bullish candle was drawn hollow or white, while the bearish candle is drawn in black. Now we can assign any color to it. On figure 4, the upward candlesticks are depicted in turquoise, and the red candles denote descending prices.

Candlestick charts are much more graphical, and traders can see immediately if the trend is up or down. During the uptrend seen in fig 4, the turquoise color is prevalent, while the color shifted to red in the downtrend that followed.

Fig 5 –  The candlestick Anatomy

On candlestick charts, the Open and close prices are deducted by the context. The ascending candlestick moves from a lower open to a higher close, while the descending one moves from a higher open to a lower close.

The next article will be dedicated to introducing other forms of charting, such as Renko, three-line break, and point and figure.


Categories
Forex Market Analysis

Gold Violates Bearish Channel – Positive CPI Weights 

During the European session, the yellow metal gold prices climbed following a speech by U.S. President Donald Trump. Most of the safe-haven appeal triggered after President Trump denies rolling back tariffs, denting the hopes for a positive indication on a U.S.-China trade agreement, provoking traders to explore safe-haven assets.

Just a few minutes back, the U.S. Consumer Price Index accelerated 0.4% in October on a seasonally adjusted data after being stable in September. 

Over the year, the all items index grew 1.8% ere seasonal changes. The energy index rose 2.7% in October following recent monthly drops and deemed for more than half of the rise in the seasonally adjusted all items index. The positive surge in CPI is weighing on the gold prices, and it may keep gold bearish during the U.S. session until the release of Fed Chair Powell. 

XAU/USD – Daily Technical Levels

Support     Resistance 

1,447.89     1,462.71

1,439.38     1,469.02

1,424.57     1,483.83

Pivot Point 1,454.2

Technically, gold prices have violated the bearish channel, which was extending resistance at 1456 area. The bullish breakout has lead gold prices below 1,466 level, which also marks the double top level. The RSI and MACD here are in favor of a bullish bias. 


So here’s a thing, the buyers may enter for further buying above 1,467 level to target 1,474. Elsewhere, gold can trade bearish below 1,466 level today. On the lower side, support can be seen around 1,454. All the best!  

Categories
Forex Videos

Assessing Forex Price Consolidation Like A Pro

Price Consolidation


In any market, but specifically, the Forex market, when we talk about price consolidation, we are referring to the price action, or the up and down movements, of exchange rates of a particular currency pair that occurs between defined levels of support and resistance.
These areas of consolidation are typically seen after, or during trend cycles, either to the upside or downside or during time zone crossovers. At these times, price action will usually become slightly muted and whereby volume in terms of liquidity dries up.

Some people refer to these areas of price consolidation as the markets taking a breather, or times of indecision. At these times, traders will look at what has been happening on a currency pair after a defined trend in either direction, due to technical or fundamental analysis. At which point traders will be wondering if the trend will continue or if there will be a reversal. And therefore, liquidity is taken out of the market until such time as traders pile into the next move.
Therefore, price consolidation can only be identified via technical analysis.

Example A


And so let’s look at the example ‘A,’ which is a fairly typical example of what you can expect in the Forex market on an all too regular basis. This is a 15-minute time frame of the EURUSD pair. We are using Japanese candlesticks and some trend lines which we have drawn it onto our chats.
We always read our chats left to right, because they tell a story of where the pair has been moving too and from. We can see that from position ‘A’ there was a bearish trend which is clearly defined by our red candlesticks. Traders pushed the pair lower by 55 pips during this move, before price action pulled back slightly due to indecision by traders.

Position ‘B’ then becomes an area of support, and price action consolidates between this support level and a clearly defined area of resistance, where price action fails to go any higher than position ‘C.’ We then have a period of sideways movement or price consolidation, and where the overall movements between these two lines is restricted to a very small 15 pip range. In the middle of this section we can see that some of the candlesticks are very small, and during some of those 15-minute time frames, price action moves no more than a couple of pips. This is a clear sign that price action is in a consolidation mode, and where traders will be looking for the next breakout from this narrow range.


Example B

Let’s go back to that chart as per example ‘B,’ which is a few time frames later than the previous. Here we have added a secondary support level. This level was not breached during the midsection of this consolidation period. However, as price action begins to fade to the downside of the consolidation period and breaches the secondary support level and also breaches the original support level briefly before moving up to the secondary support level, which then becomes an area of resistance at position ‘E.’ Price action then falls back to our original support level. We can see that the size of the candlesticks has become larger, and during this later stage where the sellers’ candlesticks engulf those of the final two bullish candlesticks in the series. This indicates to traders that buyers are starting to stay on the sidelines and where sellers believe that they will see a continuation of the trend lower and which originally started at position ‘A.’ Therefore, the activity around positions ‘D’ and ‘E’ become selling opportunities and where a secondary trends lower has been established from this period of consolidation. The longer the period of consolidation, the more likely the market will react with an explosive breakout. Remember, at some stage, the market simply must move on.

Example C

So how do we know if support and resistance is applicable to our chart? Have a look at the example ‘C.’


The best way to determine if support and resistance is happening is to establish at least two positions on our chats where the market fails to go lower, and this will be the support or floor, and two positions on our chats where price fails to go higher, and this an area of resistance, or a ceiling. As we can see in our diagram, price action fails at position B’s bearish trend, and we have now called this position 1, Traders try to push the pair lower again and failed at position 2. The move action pushes higher to position 3. A subsequent move fails to go higher at position 4. Therefore this could be considered to be acceptable areas of support and resistance.
We can now use these levels of support and resistance in our risk management strategy, should we wish to take on a trade in either direction with this pair. If we believe the market is likely to break out to the downside eventually, then we should place our stop loss a couple of pips above the highest candlestick formation adjacent to our resistance line.

On the flip side, if we believe the market will reverse the original trend lower, and move to the upside, we would simply need to place our stop loss a couple of pips under the lowest candlestick adjacent to our support line. This is typically how professional traders place this stop losses when trading out from areas of consolidation.

Categories
Forex Basics Forex Daily Topic

Stop Loss: An Art to be Learned Well by Traders

Setting Take Profit and Stop loss in the right areas are essential factors in trading. A trader does not survive in the market by placing Stop Loss and Take Profit at the wrong places. In today’s lesson, we are going to demonstrate an example of an entry with the level of Stop Loss and Take Profit.

This is a daily chart. The price heads towards the North with good bullish momentum. The buyers are to look for long opportunities at the pullback. Let us wait for the price to make a pullback.

The price starts having a downside correction with an Inside Bar. It produces two more candles that are bearish. After that, it forms a Spinning Top right at a flipped support. This is a bullish reversal candle but not a strong one. A breakout at the top of the Spinning Top attracts the minor charts’ buyers to go long on the pair. However, major charts’ traders may want to wait for a stronger daily bullish reversal candle.

The next candle comes out as an Engulfing candle. This reversal candle attracts more traders to look for long opportunities here. Since it has not made an upside breakout, thus, to take an entry, traders shall flip over to the H4 chart.

This is the H4 chart. The price has a rejection at the red marked level on the daily chart. Thus, this is the level where the price may find its resistance on the H4 chart. This shall be the level to count in setting Take Profit. The H4 chart shows that the price starts having a pullback. Things are getting better for the buyers.

Let us draw the resistance. If the price consolidates and makes a breakout at the black marked level, a long entry may be triggered. However, the buyers must wait to get the level of support.

Here it comes. A bullish reversal candle forms at a flipped support followed by a breakout candle. A long entry shall be triggered right after the last candle closes. Stop Loss may be placed right below the support where the price forms the bullish reversal candle. Many traders set their stop loss right below the breakout candle. In my experience, this offers a better risk-reward, but it often brings more losing trades.

Have you noticed that the price came back and then headed towards the North? If we had set our Stop Loss right below the breakout candle, our Stop Loss would have been hit. Rather than making some profit, we would make a loss here.

The Bottom Line

Setting Take Profit is important, but setting Stop Loss is more important. In my opinion, it is an art. It needs a lot of practice to be well acquainted with the art of setting Stop Loss as immaculate as it can get.

Categories
Forex Market Analysis

Daily FX Brief, November 13 – Major Trade Setups – Fed Chair Speech In Focus! 

On Wednesday, the global financial markets await the Fed Chair speech along with the CPI (Consumer Price Index) data from the U.K and the U.S. The United States and China trade front, the trade concerns between the United States and China are getting severe, with the Trump administration warned to increase the tariff but not until the deal gets confirmation.

We look for CPI to decline from 1.8% y/y in September to 1.5% in October (mkt 1.6%), in line with the BoE’s forecast from November. Let’s take a more in-depth look at the technical side of the market. 

Economic Events to Watch Today

Let’s took at these fundamentals.


EUR/USD – Daily Analysis

The EUR/USD currency pair found on the high range of 1.10 handle, as of now, the pair consolidate in the narrow range around the 1.10 handle because tye buyers await for the key inflation report and Federal Reserve Chair Powells statement for the next move.

As of writing, the currency pair is found slightly supported from the pause in the greenback strength after the United States President Trump’s latest comments failed to offer any detail on the United States and China trade agreement and due to this partial trade deal’s uncertainty increased. The U.S. Dollar index trades flat near the 98.30, consolidating the increase to a 4-week high of 98.42.

On the technical side, the 5-Moving Average barrier at 1.1025 is could to reduce the recovery attempts, whereas the bearish sees the next support around the 1.0950 level. The sub-1.1000 levels could be tested on a likely increase in the U.S. Consumer Price Index (CPI), which is scheduled to release at 1330 GMT.

Daily Support and Resistance    

S3 1.0944

S2 1.0981

S1 1.0995

Pivot Point 1.1017

R1 1.1031

R2 1.1053

R3 1.1089

EUR/USD– Trading Tips

The EUR/USD is trading with a slightly bullish bias since it violated the resistance level of 1.1025. On the 4 hour timeframe, the EUR/USD has formed a bullish engulfing candle, which is signaling chances of further buying in the market. 

For the moment, the EUR/USD is concentrating on a critical trading level of 1.1060, which is probable to hold the EUR/USD bearish below this mark. Below this level, the EUR/USD may gain support at 1.1025 and 1.1000 level today. 


GBP/USD– Daily Analysis

The GBP/USD currency pair found near the 1.2850, notably the lack of significant impetus from the United Kingdom, has recently limited the cable pairs movement, as well as the market traders on the waiting track ahead of the critical data and events. 

After the mixed figures of the British employment details, the GBP/USD currency pair saw another pressure on the United Kingdom Prime Minister Boris Jonhson to release a report regarding the Russian interference in the 2016 Brexit referendum. 

On the United States and China trade front, the trade concerns between the United States and China are getting severe, with the Trump administration warned to increase the tariff but not until the deal gets confirmation.

We look for CPI to decline from 1.8% y/y in September to 1.5% in October (mkt 1.6%), in line with the BoE’s forecast from November MPR. The complete deceleration in inflation is due to energy prices; household energy prices will be affected by the OFGEM cap, while fuel prices may decline a bit on a y/y basis. Stripping out the volatility, we’re looking for core CPI to hold steady at 1.7% y/y (Mkt 1.7%).

Daily Support and Resistance

S3 1.2728

S2 1.2787

S1 1.2816

Pivot Point 1.2845

R1 1.2875

R2 1.2904

R3 1.2962

GBP/USD– Trading Tips

The GBP/USD appears to have broken the bearish trendline resistance of 1.2825 upon the release of optimistic GDP figures. The MACD and RSI have crossed above 0 and 50, respectively, implying the odds of a bullish bias in the GBP/USD. The Cable may find immediate support at 1.2845 level. But the closing of candles above 1.2845 area suggests a strong chance of buying trend continuation. 

Consider taking buying positions above 1.2845 and selling below the same level today. 


USD/JPY – Daily Analysis

The USD/JPY currency pair still consolidates in the bearish range of 109 handles, and traders are found on the waiting track even after the latest updates regarding Hong Kong protests and the United States and China trade deal.

Whereas the intensifying uncertainty between the United States and China trade deal as well as the protest unrest in Hong Kong, keep leaving bearish pressure on the USD/JPY currency pair, the overall hawkish sentiment at the Federal Reserve limits the bearish off-late.

Officials from the United States, including President Donald Trump and White House Economic Adviser Larry Kudlow, just show a willingness to raise the tariff on the Chinese goods if the round-1 talks fail. Moreover, the political also did clear that the existing tariff could reduce but not until the deal gets confirmation.

Market traders are now planning for the Federal Reserve Chairman Jerome Powells statement in front of the Joint Economic Committee, and traders will closely follow Fed speak, whereas the market is also waiting for the October month Consumer Prices Index.

Daily Support and Resistance

S3 108.33

S2 108.7

S1 108.86

Pivot Point 109.07

R1 109.23

R2 109.44

R3 109.81

USD/JPY – Trading Tips

The USD/JPY pair is forming higher’s high and higher’s low pattern on the 4-hour chart, which suggesting bullish bias among traders. The USD/JPY has immediate support at 108.900 and resistance at 109.400. 

The MACD is forming histograms in the bearish zone, but the recent histogram is likely to develop above 0, and it may drive more buying until 109.450 today. 

All the best!

Categories
Forex Elliott Wave

Understanding the Flat Pattern

The flat pattern is a corrective formation that runs in a 3-3-5 sequence. Also, compared with other Elliott wave patterns, it has the most extensive variations. In this educational article, we will review the characteristics of the flat correction and its varieties.

The Broad Concept

The flat structure is one of the three basic corrective patterns described by R.N. Elliott in his hork “The Wave Principle.” This formation has an internal 3-3-5 sequence. The next figure illustrates the basic concept.

The main characteristic of the flat pattern is that wave B tends to extend more than 61.8% of wave A.

Even wave B can surpass 100% of wave A. Depending on its extension, wave B will be weak, regular, or strong. As a summary,

  • Wave B is Weak if wave B retraces between 61.8% and 81% of wave A.
  • Wave B is Regular if wave B retraces between 81% and 100% of wave A.
  • Wave B is Strong if wave B retraces more than 100% of wave A.

On the other hand, wave C must be above or equal to 38.2% of wave A. Additionally, wave C tends to variate its extension depending on the wave B strength.


  1. Strong Flat: If wave B retraces over 100% and less than 127.2% of wave A, likely, wave C completely retraces wave B.
    In case that wave B retraces more than 127.2% of wave A, it is highly probable that wave C does not retraces completely wave B.
  2. Regular flat: It occurs when wave B retraces between 81% and 100%. In this case, it is highly likely that wave C retrace completely wave B.
  3. Weak flat: In case that wave B retraces between 61.8% and 81% of A, it is possible that wave C retrace over 100% of wave B.

Measuring the Flat Pattern

The Gasoline daily chart illustrates a flat structure. The measuring process of wave A makes us observe that wave B retraces between 618% and 81% of wave A.

In consequence, as said previously, the corrective pattern corresponds to a weak flat structure. Thus, we should expect a wave C that retraces over 100% of wave B, as shown in the following chart.


In summary, the measuring process of wave B of a flat pattern is a useful process that could allow you to identify the potential extension of wave C.

Categories
Forex Market Analysis

Gold Bearish Channel Dominates – U.S. China Trade Issue Trending!

On Tuesday, the precious metal gold prices edged lower as forecasts of resolute trade discussions between the United States and China supported risk desire, while traders pocketed profits ahead of further updates.

The precious metal gold also sank 0.2%, to $1,454.20 per ounce as investors moved their funds into the stock markets, the higher-yielding assets these days. Consequently, the global stock indices surged higher on Tuesday as traders anticipated a speech by President Trump on trade policy during the U.S. session.

Investors will be closely following Trump’s speech to have a clear stance on the U.S. China tariff rollover, and the EU auto industry tariffs delay.

EU leaders said Trump was supposed to declare this week he was holding the tariff ruling on cars and auto parts shipped from the European Union probably for another six months. That’s raising anticipations about the president’s speech following in the day about the long-drawn trade war with China.

XAU/USD – Daily Technical Levels

Support Resistance
1,452.53    1,469.27
1,446.03    1,479.51
1,429.29    1,496.25
Pivot Point 1,462.77

Gold is trading in a bearish channel, which is keeping it supported around 1,448 level. It’s also extending resistance at 1,456 area. The bearish channel clearly suggests strong chances of further sell-off in the gold prices.

On the lower side, the bearish breakout of 1,448 level can extend selling further until 1,444 level. But for the bearish breakout, we need a solid reason that we can’t expect after looking at today’s economic calendar.

Therefore, consider staying bearish below 1,456 and bullish above 1,448 to capture choppy trading in gold. All the best!

Categories
Forex Price-Action Strategies

An Engulfing Candle at a Flipped Resistance

An Engulfing candle is a strong bearish reversal candlestick. This makes traders look for trading opportunities. In today’s lesson, we are going to demonstrate an example of how an Engulfing candle creates an entry. Let us proceed.

This is a daily chart. The price heads towards the downside with good bearish momentum. Traders shall wait for the price to have consolidation or an upside correction followed by a bearish reversal candle or pattern.

The price starts having the correction. It produces a bearish reversal candle after three consecutive bullish candles. The bearish reversal candle is an Inside Bar. This is not a strong bearish reversal candle. However, we still may flip over to the H4 chart (this is a daily chart) and wait for an entry.  The H4 chart does not produce any bearish momentum. Thus, the price goes towards the upside instead. Have a look at the chart below.

This is one strong bullish candle. However, the candle closed within the level, which the price breached earlier. Traders must be patient here to find out what the price does around this level. Does it make an upside breakout or produce a bearish reversal pattern?

It produces a Doji candle right at the flipped resistance followed by an Engulfing candle. This surely attracts traders to keep an eye on the pair to look for short opportunities. The question is, how do we find out entries? When the price is at correction, if we have such a bearish reversal candle at the valuable area, we shall flip over to a minor chart. This is a daily chart. Thus, we shall flip over to the H4 chart. Let us flip over to the H4 chart and find out how that looks.

The H4 chart looks bearish. We are to wait for consolidation and a downside breakout to take a short entry. This is what comes out after a while.

The price produces two bearish candles followed by a bullish one. Any bearish reversal candle breaches the support of the consolidation is the signal to go short here.

This is it. A bearish engulfing candle breaches the support of consolidation. A short entry may be triggered right after the candle closes. Let us find out how the trade looks like in a nutshell.

We may set our Stop Loss above the resistance of consolidation. The Entry-level is very explicit, as it has been explained a bit earlier. We may set our Take Profit at the last lowest low where the price started its correction on the daily chart. Alternatively, we may wait for the price to produce a bullish reversal candle. In this chart, we may come out with our profit right after the last candle (bullish) closes. The choice is yours regarding ‘Take Profit.’ Both have merits and demerits.

The Bottom Line

In the above examples, we have learned what to wait for when to flip over a chart, and on what entry shall be triggered. It does look and sound easy. Trust me. It’s never as easy as it looks when you are to deal with the live market. However, having a lot of practice, and with experience, it surely becomes easier.

Categories
Forex Market Analysis

Daily FX Brief, November 12 – Major Trade Setups – Trump’s Speech Ahead! 

The buck slipped along with the global stock, which plunged on Monday following the U.S. President Donald Trump’s comments during the weekend tore investor confidence that Washington and Beijing would immediately reach an agreement to settle their debilitating trade war.

At the Sino-US trade front, the United States and China trade tension flashing continuously, whereas the United States interference in the Hong Kong protests awaits China’s response fro fresh risk-off. The market’s risk-tone continues slowly, with the United States ten-year treasury yields being around 1.92%, with most Asian stocks flashing mixed signals. 

Economic Events to Watch Today

Let’s took at these fundamentals.


EUR/USD – Daily Analysis

The EUR/USD currency pair consolidates in the narrow range of 1.1030 and 1.1050 due to the greenback continues its recovery rally. As of writing, the pair mostly trades near the 1.10 range during on the day, because of USD strength. As we all well aware, the uncertainty surrounding the United States and China trade deal and Hong Kong’s civil protest worries resurged the demand for safety, so that’s why the market was favoring the U.S. currency.

Whereas, on the EUR-side of the equation, the uncertain result of the Spanish general election combined with Eurozone economic growth worries continues to remain a bearish impact on the common currency.

Markets now traders keenly await the German macro news and some new transparency on the US-China trade front for fresh trading impulse, whereas Trump’s speech scheduled today at 1700 GMT will likely also direct the next moves in the spot.

Daily Support and Resistance  

S3 1.0953

S2 1.0992

S1 1.1006

Pivot Point 1.1031

R1 1.1045

R2 1.107

R3 1.1108

EUR/USD– Trading Tips

The EUR/USD is trading with a slightly bullish bias since it violated the resistance level of 1.1025. On the 4 hour timeframe, the EUR/USD has formed a bullish engulfing candle, which is signaling chances of further buying in the market. 

For the moment, the EUR/USD is concentrating on a critical trading level of 1.1060, which is probable to hold the EUR/USD bearish below this mark. Below this level, the EUR/USD may gain support at 1.1025 and 1.1000 level today. 


GBP/USD– Daily Analysis

The GBP/USD currency pair got limited benefits from the United Kingdoms’ optimism because the pairs await fresh hints from the monthly employment figures whereas taking the buying to 1.2865. As of writing, the GBP/USD currency pair currently trading at 1.2865.

At the Sino-US trade front, the United States and China trade tension flashing continuously, whereas the United States interference in the Hong Kong protests awaits China’s response fro fresh risk-off. The market’s risk-tone continues slowly, with the United States ten-year treasury yields being around 1.92%, with most Asian stocks flashing mixed signals. 

There will likely be a moderate weakness in Claimant Count estimates amid no change in Unemployment Rate and Average Earnings. After the data, the speech from the United States President Donald Trump and Federal Reserve speech will be closely followed to decide the future of the United States and China trade relations and the U.S. Federal Reserve futures moves, respectively.

Daily Support and Resistance   

S3 1.2676

S2 1.2732

S1 1.2754

Pivot Point 1.2789

R1 1.281

R2 1.2845

R3 1.2901

GBP/USD– Trading Tips

The GBP/USD appears to have broken the bearish trendline resistance of 1.2825 upon the release of optimistic GDP figures. The MACD and RSI have crossed above 0 and 50, respectively, implying the odds of a bullish bias in the GBP/USD. 

On the lower side, the GBP/USD may find immediate support at 1.2845 level. But the closing of candles above 1.2845 area suggests strong chance of buying trend continuation. 

Consider taking buying positions above 1.2845 and selling below the same level today. 


USD/JPY – Daily Analysis

The USD/JPY currency pair found on the bullish track and taking buying near the 109.20 on the day, despite the trade tension between the United States and China, and protest in Hong Kong. The greenback strength could be the reason behind the pair’s bullish trend. Notably, the recovery of U.S. bond trading, greenback sent higher.

However, investors broadly avoided the United States’ expectations regarding the tariff roll back from the European Union automobiles and positive comments from the Japanese Economy Minister Yasutoshi Nishimura as well.

Whereas the traders will keep their eyes on trade and Hong Kong worries, as well as the United States President Donald Trump comments from the Economic Club of New York, lunch will also keep under the eyes. The United States President is broadly expected to clarify the much needed United States and China trade relations and the U.S. tariff policy.

Looking forward, Focus will be on Trump’s speech and speeches by the Federal Reserve officials, which is scheduled to speak later on Friday, in the absence of relevant macro data out of the U.S. President is scheduled to speak at the Economic Club of New York around 1700 GMT.

Daily Support and Resistance   

S3 108.48

S2 108.88

S1 109.08

Pivot Point 109.28

R1 109.47

R2 109.68

R3 110.07

USD/JPY – Trading Tips

On the 4 hour chart, the USD/JPY pair is forming higher’s high and higher’s low pattern, which suggesting bullish bias among traders. The USD/JPY has immediate support at 108.900 and resistance at 109.400. 

The MACD is forming histograms in the bearish zone, but the recent histogram is likely to develop above 0, and it may drive more buying until 109.450 today. 

All the best!

Categories
Forex Price-Action Strategies

Trading is the Hardest Way to Make the Easiest Money

Financial traders need to be very alert and patient to deal with the market. These two components are vital for a trader to be successful in trading. In today’s lesson, we are going to demonstrate an example of alertness and patience. Let us get started.

The price heads towards the South. Ideally, a trader shall look for short opportunities in a chart like this. The last candle comes out as a bullish reversal candle. It is time for consolidation and waiting to get a downside breakout to take a short entry.

The price seems to go too far. It consolidates and produces a bearish engulfing candle. We may flip over to the H4 chart to find an entry since this is a daily chart. The support level looks strong since it created a long bullish move. The price may play around the level for a while.

As expected, the price stalls at the level of support. Things are different now. A downside breakout would make the pair bearish. A bullish reversal candle would make the traders look for long opportunities. This is where traders must be alert and never be rigid with their initial thought.

A bullish reversal candle forms right at the level of support. Traders may want to flip over to the H4 chart to look for long opportunities. We are not flipping over to the H4 chart this time since I know what happens afterward. Our trading lesson today is going to emphasizes something else.

The price heads towards the South instead. The H4 chart does not offer any entry after that daily bullish engulfing candle. Now, the price action is choppy. It seems that it is a chart to avoid for a while.

Not really, be alert. The price obeys a down-trending channel. Thus, any rejection at the upper band may create short opportunities. The price heads towards the resistance. Let us wait for a bearish reversal candle at the upper band (resistance of the channel).

The price makes a breakout at the upper band instead. It consolidates and produces a Spinning Top. Again, we are to change our trading direction. This time we are to go long.

The last candle breaches the horizontal resistance after consolidation. A long entry may be triggered right after the candle closes. Let us proceed to find out what happens next.

Two consecutive bullish candles form right after the breakout candle. Formation of a bearish reversal candle signals that it may be time to come out with a profit. At last, we make some green pips by going long.

The Bottom Line

This is an example of why we must not be rigid with our direction and how important it is to be alert with price patterns. Trading is never easy. As they say, “Trading is the hardest way to make the easiest money”. If we work hard in learning, only then we will be able to make money easily.

Categories
Forex Market Analysis

Daily FX Brief, November 11 – Major Trade Setups – U.S. China Trade War In Play!

The U.S. dollar was marginally softer against the single currency euro and safe-haven currency Japanese yen, following some traders caution that the agreement could still unravel. The dollar index traded at $1.1020 versus the shared currency euro and 109.23 against the Japanese yen

Whereas the Chinese yuan was marginally lower in the offshore business, but still on the strong opponent of 7-per-dollar at 6.9892 in foreign trade. 

Economic Events to Watch Today

Let’s took at these fundamentals.


EUR/USD – Daily Analysis

The EUR/USD currency pair stops its further declining streak after a 5-day losing trend. As of writing, the pair is currently trading above the 1.1000, having hit the 3-weeks low of 1.1017 last Friday. Notably, the EUR/USD pair remains cautious, mainly due to the greenback strength.

As of now, the pair is fluctuating up and down between a 10-pips narrow range during the Monday. The markets await fresh clues regarding the United States and China trade relations for a new direction, as well as the big economic releases from both sides of Atlantic the week ahead for the next direction. The United States docket discusses the releases of the CPI data and Federal Reserve Chairman Powell’s testimony, whereas the EUR calendar headlines the Eurozone growth figures.

Looking ahead, the pair could keep its range trade steady mainly due to the holiday in the United States, the markets of the United States closed in the wake of Veterans Day. However, the greenback will continue its progress due to fresh trade-related development.

Daily Support and Resistance

S3 1.0953

S2 1.0992

S1 1.1006

Pivot Point 1.1031

R1 1.1045

R2 1.107

R3 1.1108

EUR/USD– Trading Tips

The EUR/USD is consolidating with a bearish bias since it broke the bullish trendline support around the 1.1025 area. On the 4 hour timeframe, the pair has formed strong bearish channels, which are signaling chances of further selling in the market. 

At the moment, the EUR/USD is focusing on a crucial trading level of 1.1060 level, which is likely to keep the EUR/USD bearish under this. Below this level, the EUR/USD may gain support at 1.1025 and 1.1000 level today. 


GBP/USD– Daily Analysis

The GBP/USD currency pair hit the 3-week low mainly due to Moodys cut the United Kingdom outlook unfavorable. By the way, the pair stop its further bearish movement because of UK GDP. As of writing, the GBP/USD currency pair currently trading around 1.2793.

The U.S. Dollar continues its recovery rally due to the global investors try safety and cautious in the wake of intensifying uncertainty surrounding the United States and China trade deal and protests in Honk Kong. Moreover, the reason behind the greenback safe-haven demand could be the geopolitical tension in the Middle East.

On the other hand, Chancellor’s defeat to justify the criticism of the opposition Labour party’s spending plan increased the uncertainties regarding the United Kingdom Prime Minister Boris Jonson’s lead during the snap elections, which is scheduled to happen in December.

As of data, the UK GDP is expected to increase to +0.3% from -0.2% on QoQ; the YoY figures might decrease to 1.1% from 1.3%. Moreover, Manufacturing Production could shrink -0.2% against -0.7% prior, whereas Industrial Production could increase to -0.1% from -0.6%.

Daily Support and Resistance

S3 1.2676

S2 1.2732

S1 1.2754

Pivot Point 1.2789

R1 1.281

R2 1.2845

R3 1.2901

GBP/USD– Trading Tips

The GBP/USD seems to have violated the sideways channel following the Bank of England policy decision. The MACD and RSI have crossed below 0 and 50, respectively, suggesting the chances of a bearish trend in the GBP/USD. On the downside, the GBP/USD has closed one of the candles below 1.2785 area, which suggests strong chances of a bearish trend continuation. 

Next support prevails around 1.2750, and the violation of this level can extend sell-off until 1.2685. 


USD/JPY – Daily Analysis

The USD/JPY currency pair remained on the bullish track and got the additional boost and reached near the multi-month high mainly due to Japan Machinery Orders declined below the expected figures. As of writing, the USD/JPY currency pair currently trading at 109.20 on the day.

Japan’s September month Machinery Orders against market forecasts on MoM and YoY basis. Whereas the monthly numbers dropped below +0.9% expected and -2.4% before -2.9%, yearly numbers seem a bit less negative with +5.1% growth figures against 7.9% consensus and -14.5% earlier readouts.

While looking at the lack of the United States traders from markets, mainly due to the Veterans Day holiday, along with the recent data, US investors have no key event and statistics for publishing on the economic calendar.

Notably, the lowest inflation figures from the United States and the Federal Chairs’ testimony may also force the traders to keep away from the big position before the event.


Daily Support and Resistance

S3 108.48

S2 108.88

S1 109.08

Pivot Point 109.28

R1 109.47

R2 109.68

R3 110.07

USD/JPY – Trading Tips

On the technical side, the USD/JPY currency pair had shown the wrong direction to the buyers of the market during the last 48 hours as you know the pair dropped in 48 hours against the buyer’s expectations. The pair closed above the 200-day M.A. on Monday to fall back below the long-term M.A. in the overnight trade. Consider staying bearish below

109.100 today to target 108.850 and 108.700. 

All the best!

Categories
Forex Videos

Mastering Price Action Part 2 – Becoming A Full Time Forex Trader


Mastering Price Action

Price action is the fluctuation in currency exchange rates, which are constantly moving up or down, relative to the exchange rate, and where these movements form trends, which are typically called ‘bullish,’ where price action moves in an upwards direction, or bearish when price action moves in a downward direction.
However, currency exchange rates do not move in a straight continuous line. Therefore, Traders use technical analysis tools in order to decipher the direction of price action on their charts.
By carefully selecting technical analysis tools Traders are able to drill down further into the fluctuations of exchange rates and where it becomes much easier to identify when a particular price action move is about to stall and reverse direction.

Example A

Let’s look at the example ‘A.’ This is a 1-hour chart of the EURUSD pair. Always read your charts from left to right, because they tell a story of where price action has been, and where it is likely to go in the future. In the chart, we are using Japanese candlesticks, and where are the green candlesticks denote bullish price action, and where red candlesticks show a bearish price action.

Example B

Now let’s look at the example ‘B,’ which is the same 1-hour chart of the EURUSD pair. And like other professional technical analysis traders, we have added a few lines which highlight some interesting areas on the chart, and which would have led to several trading opportunities.
First of all, we note a strong bullish move at position 1, where we see predominantly bullish candlesticks. However, this price action trend to the upside fades, and where we have drawn in a ceiling, or level of resistance marked ‘A.’ The bulls have essentially thrown in the towel. Some traders would be taking a profit at this stage, and price action begins to fall lower. This is a period of consolidation. But it is not long until the bulls regain control again, and an overall trend forms to the upside, as per the arrow at position 2, until price reaches our resistance line marked ‘B.’ Importantly, this line is the 1.10 exchange rate, a key level.

Incidentally, note that our resistance A-line causes some confusion for traders until price action reaches the key 1.10 exchange rate. While some see the resistance continuing to hold, it eventually becomes the beginning of support line ‘B.’
The overall move from the beginning of position 1 to the top of position 2, which is our key 1.10 exchange rate, is around 100 pips, a fairly substantial move. Again, bull traders will be looking to cash in and take a profit at this level while assuming that there will be limit orders in place here to go short at this level and therefore drive the price action lower. And that is exactly what happens as per arrow number 3, where sellers take a hold, and price action moves lower to our secondary support level marked support ‘B.’
Price action then begins to fluctuate between our support level B, and our resistance level ‘B.’ During this phase, technical Traders will be wondering if price action can breach the key

resistance level at 1:10, and where that might become an area of support at which point bulls would be expected to come in and drive the market to the next level of resistance.
After three consecutive attempts to breach the key 1.10 resistance level, bull traders at position 5 fail to reach the 1.10 level and they begin to fear that price will again be rejected at the 110 level, and price action pulls back to support level B, which is then breached, until price action finally finds support at level ‘A’.

During the time frame of this chart, from the 2nd to the 9th of October, 2019, we are presented with clear buying and selling opportunities with the EURUSD pair, simply by the use of Japanese candlesticks and a few trend lines that we have added to our chart to identify support and resistance levels. We can see sideways price action where traders are uncertain if there will be a complete reversal in the upward trend, and there are clear lines of interest, such as the 1.10 exchange rate.

And so, support lines become lines of resistance, and these fluctuate throughout the day depending on the level of liquidity and also market sentiment and other factors based on fundamentals of the relevant currencies within the pair.

Simply by understanding that these lines exist and where traders are driving the market too, and fears of where reversals lurk will give you a better understanding of mastering price action.

Categories
Forex Market Analysis

Daily November 08– Major Trade Setups – Risk on Sentiment Dominates 

The United States and China trade deal optimism supported the risk-on markets and came to a massive increase in the US Treasury yields, sent the greenback higher.

A report came that both countries decided to cancel some existing tariff if the round-1 trade deal happened on a positive outcome. It should be noted that the United States’ ten-year yields increased from 1.80% to 1.97%. This is the highest level since August 1.

Economic Events to Watch Today

Let’s took at these fundamentals.


EUR/USD – Daily Analysis

The EUR/USD currency pair remains to flash red and dropped for the 4th-consecutive day but didn’t hit below the 50-day average level. Moreover, the bullish trend could be seen in the pair because the Treasury yields are increasing in the wake of mild losses in the US dollar index futures.

As we all well aware, the shared currency faced many selling pressure yesterday, as anticipated, and fell near the 50-day average range at 1.1038. The US Treasury yields increased, sent the US Dollar higher, due to the fresh United States and China trade optimism. 

A report came that both countries decided to cancel some existing tariff if the round-1 trade deal happened on a positive outcome. It should be noted that the United States’ ten-year yields increased from 1.80% to 1.97%. This is the highest level since August 1.

Currently, the futures on the S&P 500 are reporting a 0.18% decline, and the United States ten-year yield is seen at 1.91%, down 6-basis points from Thursday’s high.

On the flip side, the German trade balance and the US Michigan Consumer Sentiment Index are scheduled to release and will likely leave an impact on the EUR/USD pair. As well as, the China trade data fro October release during the Asian trading hours represented declines in the imports.

Daily Support and Resistance

S3 1.1018

S2 1.1047

S1 1.1056

Pivot Point 1.1075

R1 1.1084

R2 1.1103

R3 1.1131

EUR/USD– Trading Tips

The EUR/USD is consolidating with a bearish bias since it broke the bullish trendline support around 1.1125 area. On the 4 hour timeframe, the pair has formed strong bearish channels, which are signaling chances of further selling in the market. 

At the moment, the EUR/USD is focusing on a crucial trading level of 1.1060 level, which is likely to determine the further direction of the pair. Below this level, the EUR/USD may gain support at 1.1040 and 1.1010 level today. 


GBP/USD– Daily Analysis

The GBP/USD currency currently flashing green, but the overall sentiment remains bearish. As of writing the GBP/USD currency pair presently trading at 1.2822, having increased just more than ten pips a few minutes ago because the banks of England’s monetary policy decision has calm down now.

The main reason behind the GBP/USD currency pairs bearish sentiment is that the monetary policy decision by the bank of England. The rates hit the weakest level since September 24 at 1.2793 due to the Bank of England MPC maintained the interest rates, whereas two members of Bank of England voted for a rate cut.

The wary comments from the Bank of England Governor Carney also hurt the GBP. He warned during signaling the risk of a global economic downturn that there would be losses in jobs and business closure in the wake of no-deal Brexit.

On the other hand, the United States and China trade deal optimism supported the risk-on markets and came to a massive increase in the US Treasury yields, sent the greenback higher. So, the GBP/USD currency pair also was seen at the bearish track due to the rise in demand for the US dollar.

Daily Support and Resistance

S3 1.2758

S2 1.2812

S1 1.2832

Pivot Point 1.2865

R1 1.2886

R2 1.2918

R3 1.2971

GBP/USD– Trading Tips

The GBP/USD hasn’t improved enough as it extends to trade sideways ahead of the Bank of England policy decision. The MACD and RSI have crossed below 0 and 50, respectively, suggesting the chances of a bearish trend in the GBP/USD. But the thing is, investors are staying out of the market ahead of BOE rate. On the downside, the GBP/USD may see next support around 1.2786, and the violation of this level can extend sell-off until 1.2690. 


USD/JPY – Daily Analysis

The USD/JPY currency pair is flashing green even after the positive Japanese data and the risk-on sentiment in the equity markets. As of writing, the USD/JPY currency pair is currently trading at 109.35 and consolidates in the narrow range. By the way, the pair hit the high of 109.49 during the overnight trade. Notably, the pair gained its15-pips in the last few minutes.

As of data, Japan’s Household Spending surged 9.5% year-on-year in September, crossed the expected rise of 7.8% by a big margin and up significantly from the preceding month’s 1% rise. Labor Cash Earnings also rose 0.8% in annualized terms, bettering the 0.4% estimate.

However, the Japanese yen is not supportive, mainly due to the fears that the buyers spent more ahead of the October tax hike. Notably, the spending had increased by 7.2% in March 2014, month ahead of the prior sales tax increase, only to fall sharply and stay negative for more than a year.

According to the forecasting view, the USD/JPY currency pair will likely keep its tracking the action in the primary equity markets and US Treasury yields. The ten-year yield increased to 1.97% in the overnight trade since 3-months highs. China’s trade data may also affect the demand for the Japanese yen.

Daily Support and Resistance

S3 108.34

S2 108.66

S1 108.82

Pivot Point 108.98

R1 109.14

R2 109.3

R3 109.62

USD/JPY – Trading Tips

On the technical side, the USD/JPY currency pair had shown the wrong direction to the buyers of the market during the last 48 hours as you know the pair dropped in 48 hours against the buyer’s expectations. The pair closed above the 200-day MA on Tuesday to fall back below the long-term MA in the overnight trade. Consider staying bullish above 

108.700 today.

All the best!

Categories
Forex Market Analysis

Gold’s Bearish Trend Continues – Eyes On Double Bottom Pattern

On Friday, the precious metal gold prices crept lower, exhibiting one of the sharpest weekly drops in two and a half years. The stronger greenback pressured on gold prices while confidence about U.S.-China trade negotiations depressed bullion’s safe-haven bid.

Gold is declining as the buck is performing great, and few traders who purchased gold as a haven are running out. The dollar index was directed for a weekly profit as it profited from the report that China and the United States had admitted to rolling back taxes as part of a possible preliminary agreement to settle their trade war.

Nonetheless, some uncertainties arose as administrators inside and outside the White House rejected the idea of bending up punitive tariffs. The uncertainty limited bullion’s decline.

Meantime, European stock benchmarks departed from the prior session’s speak as contradictory signs from China and the United States on development made in trade discussions collapsed market expectations of a near-term truce.

Gold – XAU/USD – Daily Technical Levels

Support Resistance 

1,484.27    1,495.6

1,477.98    1,500.64

1,466.65    1,511.97

Pivot Point: 1,489.31

On Friday, gold prices may find immediate support around 1,457 level. This level is extended by a double bottom level on the 4-hour chart. The MACD and RSI are exhibiting sharp bearish bias. 

Today, the closing of the 4-hour candle above 1,457 area is likely to offer us a bullish retracement. Until then, we can stay bearish below 1,467 area. All the best! 

Categories
Forex Videos

The Most Powerful Forex Technique – Trading Breakouts

Trading Breakouts


In the area of financial trading and in particular within the Forex market, the movement of a currency pair, or price action, does one of three things: it moves up, it moves down, or it moves sideways. Within these types of moves, especially when the price action is moving up and down, we will find trends forming. We also find pullbacks, or price reversals, continuations, slowdowns in volatility, and pauses and hesitations, which are also known as periods of consolidation. Typically at these times you might see very small movements, where price moves sideways in a narrow range. In other words, currency exchange rates in the Forex market do not travel in a continuous straight line. And this is what makes trading so difficult to predict.
Each time you pull the trigger and execute a trade, and especially as a retail trader, you are up against institutional traders, including sovereign wealth funds, hedge funds, governments and their central banks and high net worth individuals, all of whom might well have a different price move expectation than yourself and be trading in the opposite direction, i.e, against you!

This is why it is so important to learn the peculiarities, twists, and turns, the dynamics and unpredictability of the Forex market. And the best way to do this is to study your charts and to study the markets and to practice on a demo account. In other words, learn the ropes, find the best time of day to trade that suits your trading style and methodology, try to determine when the aforementioned big guns are all likely to be singing from the same hymn sheet, in other words when the majority are trading in the same direction.

One of the most popular and rewarding styles of trading the Forex market is identifying breakouts. This type of trading relates to technical analysis only. That Is not to say that we can take our eyes off of the fundamentals, because these events can be triggered by economic data releases. However, after periods of consolidation, where price action becomes narrow and congested, and show a lack of direction, traders look for potential breakouts to test new levels, and these events regularly occur purely on technical analysis, alone.
Because breakouts are so popular, price action can be extremely volatile at these times. It’s almost as if everybody pounces to trade at the same time and either buys or sells a particular currency pair because their charts tell them so. This tends to cause strong moves, as price breaks out of bottlenecks and where quite often those entities who are trading counter to the breakout may be stopped out of their trades. This is often because breakouts regularly happen at, or close to, round numbers. At these levels, traders tend to place their stop losses or limit orders to buy or sell. This can often result in a spoof breakout, where price action breaks out of a period of consolidation only to reverse quickly and start a trend in the opposite direction. And therefore, some breakouts can be short-lived, and which are also known as false breakouts.

Example A

Let’s turn our attention to example ‘A.’ This is a 1-hour chart of the EURUSD pair. Always read your charts from left to right, because it tells you a story of where price action has been, and where it is possibly going to go in the future.


In this example, we can see that we have drawn a horizontal line at position ‘A.’ This has become an area of support; it is effectively a floor. Although we have a high, as marked at the position marked 1, and where price action moves back to our floor, the second move higher at position 2 becomes a lower high than at position 1. This tells us that the market is running out of momentum to the upside, and where indeed price action returns to the floor after this push higher falters. And then, price action forms a new lower high at position 3. This now tells us that bull traders have effectively thrown the towel in, and then, when price again returns to the floor, we see a breakout, as marked by the X, which punches through the floor, or support level. Therefore, this would have been the breakout candlestick that traders were looking for In order to go short on this pair.

Price action continues to move to the downside. However, we now see a new floor at position C, and a new ceiling at position B. And where price action consolidates in a sideways trading fashion.
In the example ‘B,’ we have moved the charts along to the next session. Price action continued to trend sideways between the ceiling marked ‘B’ and the floor marked ‘C’ until it becomes a second breakout occurs and where price action punches through to a new floor marked ‘D’ and where the previous floor, ‘C’ has now become a ceiling.

Again, price action returns to a consolidation or sideways momentum, until, eventually, at candlestick marked X – a series of strong bearish candlesticks form another breakout to the downside. Had we entered a short trade at the first breakout to the downside in example A, we could have realised a profit of over 180 pips.
An important lesson to learn from this section is that breakouts often occur when price action punches through floors and ceilings, and which are also known as levels of support, being the floor, and resistance being the ceiling.
So keep an eye out for possible breakouts and especially at key technical levels when support and resistance levels begin to fail. They will be far stronger in momentum after extended periods of consolidation.

Categories
Forex Basic Strategies

A Twist in the Tale

The Forex market can be very unpredictable. It is a game of probability. With more experience and knowledge, a trader increases the chance to be right in making a trading decision. Having immaculate risk management is another aspect that keeps a trader safe with his investment. In today’s lesson, we are going to talk about the unpredictability of the market.

Let us start with a daily chart of a Forex pair.

The price makes a bullish move and finds its resistance. After four daily candles, the daily chart produces a bullish engulfing daily candle. This is a powerful bullish reversal candle, which forms right at a flipped support. Have a look at the chart below.

The chart above shows that the bullish engulfing candle forms at the flipped support. This means buyers on this chart are to go long on a chart pattern called ‘ABC’ or ‘123’. This is a lucrative and consistent chart pattern, which price action traders love to trade. Let us find out what happens next.

The price stalls and has a rejection at the same level. The buyers would love to get a breakout here to go long and grab some green pips. However, the chart produces a bearish engulfing candle instead. What do you think a trader should do here?

He shall start looking for short opportunities. This is the daily chart. Thus, he shall flip over to the H4 chart to find out a short opportunity.

This is how the H4 chart looks. A very strong bearish candle followed by a little Inside Bar. The trader (the seller) is to wait for consolidation and a bearish reversal candle to go short.

The price consolidates more. It produces a good-looking bullish candle. Let us find out how the next candle comes out. Do not forget that the sellers are waiting to get a bearish reversal candle breaching the lowest low.

This is it. A bearish engulfing candle closes below the level of support. The sellers have been waiting to get a signal candle like this. A short entry may be triggered right after the last candle closes. Let us find out what happens next.

As expected, the price heads towards the South with good bearish momentum. We see the first H4 bullish reversal candle forming at the daily support as well. This may be time to take out the profit.

The Bottom Line

Do you notice how things change within a candle? Before that bearish engulfing daily candle, the pair looks extremely good for the buyers. An upside breakout would make them go long on the pair and push the price towards the North. However, that does not happen, but the price comes down instead. This is what I call “Twist in the tale.” Forex traders often get these twists.

Categories
Forex Basic Strategies

You Must Definitely Try These Most Promising Bollinger Bands Strategies

Understanding Bollinger Bands

Bollinger Bands is one of the most famous indicators out there, developed by a technical analyst named John Bollinger in the 1980s. This indicator primarily identifies the volatility level of a currency pair. Bollinger bands are volatility bands placed below and above a moving average. These bands are designed such that they automatically widen when the market volatility increases and narrow or contract when volatility drops.

One of the important purposes of the Bollinger bands is to determine the relative high and low prices of the market. As simple as it gets, the prices are comprehended to be low at the lower band and high at the higher band. With this definition, we can come up with trading patterns that can help predict the upcoming market trend.

Calculation

Bollinger bands have three bands, namely, the upper band, the middle(mean) band, the lower band. And they are calculated as follows:

Upper Band = Middle band + 20-day Standard deviation x 2

Middle Band = 20-period the moving average (20 SMA)

Lower Band = Middle band – 20-day Standard deviation x 2

Below is a chart that has the Bollinger Bands embedded in it.

Setting up the Bollinger band

Every trading platform will ask you for the length of the Bollinger band. By default, the value is set to 20. And it is highly recommended to keep the default configurations to obtain optimal results from the indicator.

Now, let’s put all of the above information into action by analyzing some great strategies.

Strategy 1: Double Bottom Setup

One of the most popular trading strategies using the Bollinger bands is the double bottom setup. This is because John Bollinger himself said that, “Bollinger bands can be used in pattern recognition to define pure price patterns such as “W” bottoms, “M” tops, momentum, shifts, etc.”.

In this strategy, we will be discussing the “W” bottoms, and “M” tops.

W-Bottoms

This strategy can be applied when the market is coming from a predominant downtrend. There are four stages to consider to trade the W-bottom (double bottom) Bollinger band strategy.

  1. The reaction low must form around the lower band.
  2. From the lower band, there must be a bounce up to the middle band.
  3. Thirdly, there should be a new low, which must hold above the lower band. The hold above the previous low confirms the inability of the sellers to push the prices lower.
  4. Lastly, the price must move off the low and break the previous resistance. This confirms the start of bullishness in the market.

Example

In the below chart, the market was in a downtrend. It made a low at the lower band and went up until the middle band and held. This satisfies the first two considerations in the W-bottom strategy. Moving forward, the price comes down again, but this time, it holds above the lower band. This confirms the third consideration, as well. Finally, the market shoots up and breaks the resistance (black line), indicating a buy signal.

M-top

M-top is the opposite of the W-bottom strategy. But, the working of this strategy remains the same. That is, firstly, the price must try to go above the upper band. Secondly, the price should drop down to the middle band. Thirdly, it must go up again but not higher than the previous high. And finally, the market must drop below the support line. And once all these scenarios take place, we can prepare to go short.

Example

In the below chart, the market went above the upper band, pulled back to the middle band, shot up again, but could not go higher than the upper band, and finally, the price dropped below the support (black line). So, this is when we can confidently hit the sell.

Strategy 2: Return to the Mean or Middle of the band

If you wish to extract only small profits from the market, then this strategy will be apt for you. This strategy mainly focusses only on small movements rather than big swings. An advantage of this strategy is that you will be able to pull off consistent profits and reduce risks significantly.

The principle of this strategy is to go long when the price comes down to the middle line. However, to reduce the risk, there are some factors which are implemented when trading this strategy. Below, we have mentioned some of the techniques to trade this strategy.

In the below chart, we can see that the market shot to the upside, pulled back to the middle line, and again shot up north. Here, if we were buying at the middle line, we would have made a profit out of it. But, not always will this work in your favor.

There are some points you must consider before trading this strategy. Firstly, the initial buyers must be very strong. Secondly, the sellers (pullback) must be weaker than the preceding buyers. Thirdly, the price must hold around the mean line. The occurrence of patterns like doji, hammer, spinning top, etc. around the mean line can give additional confirmation on the trade. Therefore, once all the criteria are satisfied, you can go for the buy.

Bottom line

Bollinger band is an excellent indicator to determine the direction of the market. The bands indicate if the market is at a relatively high or low. And these highs and lows help in predicting if the market is continuing its trend or preparing to reverse. Also, chartists combine this indicator with other indicators to have an extra edge over their trade.

We hope you understood these strategies. It is highly recommended to try these in your daily trading activities. With practice, you can master this indicator and can make consistent profits if used correctly. Let u know if you have any questions in the comments below. Happy Trading!

Categories
Forex Ichimoku strategies Ichimoku

Ichimoku Strategy #1 – The Ideal Ichimoku Strategy

The Ideal Ichimoku Strategy is the first strategy in my series over Ichimoku Kinko Hyo. There are two sides to a trade, and so there will be two different setups for long and short setups. This strategy comes from the phenomenal work of Manesh Patel in his book, Trading with Ichimoku Clouds: The essential guide to Ichimoku Kinko Hyo technical analysis. Buy it, don’t pirate.

Patel identified this strategy as the foundational strategy. Because it uses all of the components of the Ichimoku system, I believe that this is the strategy that people should be able to know so well, that they can glance at a chart and understand what is happening. You should see this strategy and be ready to trade it profitably before you transition into trying other Ichimoku strategy. If you don’t, you can run the risk of being disenfranchised with the system and believe that it is another trading system that doesn’t work.

Moving on to the other strategies without mastering this strategy first is very dangerous to your trading development and your understanding of the Ichimoku Kinko Hyo system.

Ideal Ichimoku Bullish Rules

  1. Price above the Cloud.
  2. Tenkan-Sen above Kijun-Sen.
  3. Chikou Span above the candlesticks.
  4. The Future Cloud is ‘green’ – Future Senkou Span A is above Future Senkou Span B.
  5. Price is not far from the Tenkan-Sen or Kijun-Sen
  6. Tenkan-Sen, Kijun-Sen, and Chikou Span should not be in a thick Cloud.
Bullish Ideal Ichimoku Strategy Entry

Ideal Ichimoku Bearish Rules

  1. Price below the Cloud.
  2. Tenkan-Sen below Kijun-Sen.
  3. Chikou Span below the candlesticks.
  4. The Future Cloud is ‘red’ – Future Senkou Span A is below Future Senkou Span B.
  5. Price is not far from the Tenkan-Sen or Kijun-Sen.
  6. Tenkan-Sen, Kijun-Sen, and Chikou Span should not be in a thick Cloud.
Bearish Ideal Ichimoku Strategy Entry


Sources: Péloille, Karen. (2017). Trading with Ichimoku: a practical guide to low-risk Ichimoku strategies. Petersfield, Hampshire: Harriman House Ltd.

Patel, M. (2010). Trading with Ichimoku clouds: the essential guide to Ichimoku Kinko Hyo technical analysis. Hoboken, NJ: John Wiley & Sons.

Linton, D. (2010). Cloud charts: trading success with the Ichimoku Technique. London: Updata.

Elliot, N. (2012). Ichimoku charts: an introduction to Ichimoku Kinko Clouds. Petersfield, Hampshire: Harriman House Ltd.


Categories
Forex Videos

Trading Price Momentum – Becoming A Forex Trader

Trading Price Momentum

One of the biggest keys to understanding how trading in the forex market works is to know how momentum affects price action. Traders need to gauge the market extremely carefully as price action can turn in direction, in a split second, based on a momentum occurrence, such as an economic data release, market rumours, and economic news commentary. It is essential that traders have contingency plans in place in the event of huge momentum moves. This could be by implementing stop losses, limit orders, hedging strategies, but importantly, being aware of market conditions and potential events that might cause huge liquidity and momentum shifts in price action.

Causes of trading price momentum are such things as government elections, war, OPEC meetings, and announcements pertaining to oil prices, commodity forecasts, government policy, currency devaluations, exchange rate pricing, debt defaults, market collapse, the US Federal Reserve, political referendums and economic data releases. During these events we will usually find a great deal of speculation due to market sentiment, risk-on and risk-off events, institutional investments including position-taking, and stop-loss activity.

The big players cause the big moves because of their size and liquidity, and they typically include hedge funds, sovereign wealth funds, governments, and their central banks. When these guys come to the market, it is not unusual for them to trade in sizes of over 100,000 US dollars per pip in the Forex market. This type of size causes market makers – that’s those who provide the bids and offers – to very quickly adjust their liquidity support in the market, which further adds to the momentum.

Example A


Let’s take a look at the example ‘A,’ this is a 1-hour chart of the USDJPY pair covering the last couple of days. At position 1, we note a huge spike higher in the pair with the 1-hour candlestick breaching the Bollinger bands, whilst spiking through an area of resistance caused by the sideways trading of this pair, and which reaches across, to the left of our chart. Even though the Federal Reserve cut their short-term interest rate by 25 basis points – the third cut this year – which caused this market reaction.
One might have thought that the US dollar would have lost ground against the Japanese Yen because of a lowering in interest rates, which, of course, is less than appealing to investors holding dollars. However, traders took into account that the subsequent forward guidance speech given by Federal Reserve Chairman, Powell, gave no indication that further interest rate cuts were imminent this year. Also, Federal Reserve governors voted 8 to 2 in favour of the cut. This shows that there is some conflict within the Federal Reserve regarding monetary policy.
Indeed the next hourly candlestick shows a pullback in this pair, thus negating the 30 or so pip move to the upside. This spike would have caused many institutions to suffer from a stop loss as price action moved above the key 109.00 level, while traders tried to decipher the implications of the rate cut, and what messages could be gained from Fed Powell’s speech.

Now let’s turn our attention to position 2, we can see a strong bearish candlestick just below position 2, which was a result of a news release stating that a Chinese official reported that the long-awaited part 1 of the Chinese & US trade agreement might not be signed next month as per market expectations. The Chinese official also stated that there was a risk that the deal may collapse due to what they said was a divisive attitude to the agreement by President Donald Trump.

These are just two examples of how price momentum can cause huge amounts of volume and volatility, and whereby in a relatively short time frame, we can see swings in the price action of over 100 pips in this example.

Example B


Let’s look at example B. This is a one-hour chart of the US DOW Jones 30. In position 1, we can see a surge in the price action to the upside after the announcement of the 25 basis points rate cut. This is important because US companies can borrow money more cheaply with lower interest rates. We subsequently see a slight pullback of price action inside the Bollinger bands and a consolidation to position 2. The bearish candlestick at this point takes out most of the previous day’s bull trend as soon as the rumour from the Chinese official that the US-China trade deal could collapse. The upshot of these two events was a 400 point swing in price action!
Here at Forex.Academy, we always advise traders to be aware of potential momentum moves in price action. This can only be achieved by having a good overall market awareness, and learning the art of expecting the unexpected, and by having contingency plans in place in the event of such events.

Categories
Ichimoku

Ichimoku Strategy #2 – K-Cross, The Day Trading Strategy

The Kijun-Sen Crossover (Crossunder) Strategy is the second in my series over Ichimoku Kinko Hyo. There are two trades setups provided for the long and short side of a market. This strategy also comes from Manesh Patel’s book, Trading with Ichimoku Clouds: The essential guide to Ichimoku Kinko Hyo technical analysis.

Patel called this the day-trading strategy. He warned that this trading strategy has the lowest risk factor out of all of his strategies. The positive expectancy rate is lower, and so being stopped out of trades is a normal consequence of this strategy. He also indicated that the win/loss ratio could be extremely high.

Kijun-Sen Cross Bullish Rules

  1. Price crosses above the Kijun-Sen.
  2. Tenkan-Sen greater than the Kijun-Sen.
    1. If the Tenkan-Sen is less than the Kijun-Sen, then the Tenkan-Sen should be pointing up while the Kijun-Sen is flat.
  3. Chikou Span in open space.
  4. Future Senkout Span B is flat or pointing up.
    1. If Future Senkou Span A is less than Future Senkou Span B, then Future Senkou Span A must be pointing up.
  5. Price, Tenkan-Sen, Kijun-Sen, and Chikou Span should not be in the Cloud. If they are, it should be a thick cloud.
  6. Price not far from the Tenkan-Sen or Kijun-Sen
  7. Optional: Future Cloud is not thick.
K-Cross Strategy Bullish Entry


Kijun-Sen Cross Bearish Rules

  1. Prices cross below the Kijun-Sen.
  2. Tenkan-Sen less than the Kijun-Sen.
    1. If the Tenkan-Sen is less than the Kijun-Sen, then the Tenkan-Sen should be pointing up while the Kijun-Sen is flat.
  3. Chikou Span in open space.
  4. Future Senkou Span B is flat for pointing down.
    1. If Future Senkou Span A is greater than Future Senkou Span B, then Future Senkou Span A must be pointing down.
  5. Price, Tenkan-Sen, Kijun-Sen, and Chikou Span should not be in the Cloud. If they are, it should be a thick Cloud.
  6. Price not far from the Tenkan-Sen or Kijun-Sen
  7. Optional: Future Cloud is not thick.
K-Cross Strategy Bearish Entry


Sources: Péloille Karen. (2017). Trading with Ichimoku: a practical guide to low-risk Ichimoku strategies. Petersfield, Hampshire: Harriman House Ltd.

Patel, M. (2010). Trading with Ichimoku clouds: the essential guide to Ichimoku Kinko Hyo technical analysis. Hoboken, NJ: John Wiley & Sons.

Linton, D. (2010). Cloud charts: trading success with the Ichimoku Technique. London: Updata.

Elliot, N. (2012). Ichimoku charts: an introduction to Ichimoku Kinko Clouds. Petersfield, Hampshire: Harriman House Ltd.

Categories
Forex Market Analysis

WTI Crude Oil Completes 38.2% Retracement – What’s Next?

The WTI Crude oil prices dropped As the Energy Information Administration, EIA reported that the U.S. oil inventories increased unexpectedly last week.

The EIA said oil stockpiles rose by 7.9 million barrels, compared with expectations from analysts for an increase of about 1.5 million barrels.

From now, we expect many negative factors to increase. The risk we feel, especially with the recent crude oil inventories builds and reduction in demand anticipates, could be the bearish trend in the prices in the energy markets.

WTI crude oil prices got some support during the starting of this week due to expectations that China and the United States were close in the signing of the trade deal.

As per the recent updates, the report came that the signing of the deal may not be signed during this month and will likely happen later this month. By the way, it all depends on the discussion between the Sino-US.

Daily Support and Resistance

S3 53.37
S2 55.09
S1 55.75
Pivot Point 56.8
R1 57.46
R2 58.52
R3 60.23

Technically, the WTI crude oil has completed a 38.2% Fibonacci retracement on the 4-hour chart. Closing of Doji candles above this level is suggesting bullish bias among traders. Most importantly, crude oil has recently closed a bullish engulfing pattern, which may drive sharp buying in the black crack.

On the upper side, crude oil may face resistance at 57.50, along with support at 56.20. I will be looking to trade a choppy session today until this range breakout.

All the best!

Categories
Forex Price-Action Strategies

A Breakout and the Confirmation

Support and Resistance, also known as Supply and Demand, have long been used in the financial markets. The most characteristic feature of support/resistance is a level of support becomes resistance, and a level of resistance becomes support. The price after making a breakout comes back to the level and makes a move towards the established trend. The price does not always confirm all the breakout levels, though. Traders do not know which broken level is going to produce a trading signal. In reality, they do not even have to know or guess. They have to make decisions according to the price movement or Price Action. Let us have a demonstration of this.

The price is up trending. Traders shall look for long opportunities. To be honest, the last candle on the chart is a buy signal. It was a week ending candle, which must have held the buyers back. Let us wait for a while to get more clues.

The last candle came out as a bearish engulfing candle. Such price action usually makes a pair choppy. The buyers may want to wait for an upside breakout to go long. However, a bearish engulfing candle may not let that happen.

A strong bullish candle closes within the resistance. It seems that the chart may produce a Double Top. Thus, the bear may come and dominate. Let us draw the Neck Line and resistance of the Double Top.

The equation is very simple here. A breakout at the neckline attracts the sellers, which is more likely. On the other hand, an upside breakout attracts buyers. Let us find out which way the price heads to.

The price makes a breakout at the Neckline. However, it does not consolidate around the Neckline after the breakout. Unfortunately, the sellers do not get an opportunity to go short here. It often happens with the traders. Traders’ life is never easy!

Here is a question. Do you see anything interesting? Has the price made another breakout?

It has made a breakout at the red-marked level. It goes back to the level to confirm the breakout, as well. Moreover, it has produced a bearish engulfing candle with a long upper shadow. Things look good for the sellers. A breakout at the lowest low would be the signal to go short.

Here comes the breakout. A bearish Marubozu candle breached the lowest low. The sellers may want to trigger a short entry right after the last candle closes. Let us find out how far down it goes before producing any bullish reversal candle.

Here comes the breakout. A bearish Marubozu candle breached the lowest low. The sellers may want to trigger a short entry right after the last candle closes. Let us find out how far down it goes before producing any bullish reversal candle.

The price heads toward the downside with good bearish momentum. It produces a Doji Candle. It may be time to come out with a profit.

The Bottom Line

The price does not confirm all the breakouts. That does not mean we should start pulling our hair. Concentrate hard and calculate well. The next opportunity is just around the corner.

Categories
Forex Market Analysis

Daily November 07– Major Trade Setups – Brace for BOE Rate Decision! 

On Thursday, the dollar’s determined and blending strength will last well into next year, and even if an incomplete U.S.-China trade agreement is signed, it will at most hit the currency by 1-2% in the instant aftermath. 

Today, the focus of traders stays on the series of services PMI figures from the Eurozone. 

Economic Events to Watch Today

Let’s took at these fundamentals.


EUR/USD – Daily Analysis

The EUR/USD currency pair flashing red and dropped for 3-consecutive days, this bearish trend considered as the biggest losing streak since early September. As of writing, the EUR/USD currency pair closed at 0.10% bearish during the Wednesday, as well as the pair was dropped by 0.33% and 0.48% during the Monday and Tuesday. The 3-day declining streak is the highest early September. 

At the time of writing, the EUR/USD currency pair is currently trading at 1.1059, showing a 0.06% decline on the day. On the technical side, the technical outlook found on the bearish track with Wednesday close below 1.1073, which confirmed a double top bearish breakdown on the daily chart.

The possibility of Industrial production missing forecasts is high. That would support the bearish technical trend, probably increase the losses in the EUR. It should be noted that the upbeat expectation will likely a good sign of EUR currency. However, the strong close above 1.1073 is much needed to cancel the bearish trend.

Daily Support and Resistance

S3 1.1018

S2 1.1047

S1 1.1056

Pivot Point 1.1075

R1 1.1084

R2 1.1103

R3 1.1131

EUR/USD– Trading Tips

The EUR/USD is trading with a bearish bias since it violated the bullish trendline support around 1.1125 area. On the 4 hour timeframe, the pair has formed strong bearish channels, which are signaling chances of further selling in the market. 

At the moment, the EUR/USD is focusing on a crucial trading level of 1.1060 level, which is likely to determine the further direction of the pair. Below this level, the EUR/USD may gain support at 1.1040 and 1.1010 level today. 


GBP/USD– Daily Analysis

The GBP/USD pair hit the bearish track and hit the weekly low as the cautious sentiment of the GBP traders due to Super Thursday. As of writing, the GBP/USD currency pair currently trading at 1.2837, as well as the greenback is increasing across the board and uncertainty regarding the trade deal between Sino-US also leaving an impact on the EUR/USD currency pair.

At the Sino-US trade front, the condition surrounding the round-1 trade deal between the United States and China seems doubtful recently. Although, thee U.S. Dollar supported from the move as new thinkings of the Federal Reserves pause in the rate cut cycle.

On the other hand, the investors will strictly be observed to the speech of UK Chancellor Sajid Javid and second-tier data from the U.S., coupled with comments by the President and CEO of the Federal Reserve Bank of Dallas Robert Kaplan which is scheduled to deliver later. 

Today, the whole focus stays on the Bank of England monetary policy report, where the BOE is widely supposed to keep the interest rate on the clutch at 0.75% today.  

Daily Support and Resistance

S3 1.2758

S2 1.2812

S1 1.2832

Pivot Point 1.2865

R1 1.2886

R2 1.2918

R3 1.2971

GBP/USD– Trading Tips

The GBP/USD hasn’t improved enough as it extends to trade sideways ahead of the Bank of England policy decision. The MACD and RSI have crossed below 0 and 50, respectively, suggesting the chances of a bearish trend in the GBP/USD. But the thing is, investors are staying out of the market ahead of BOE rate. On the downside, the GBP/USD may see next support around 1.2786, and the violation of this level can extend sell-off until 1.2690. 


USD/JPY – Daily Analysis

The USD/JPY currency pair are representing losses by 24-pips and currently trading at 108.74. As of writing, the USD/JPY currency pair is on the bearish attitude due to the moderate declines in the U.S. index futures. Notably, the futures on the S&P 500 and Nasdaq are reporting 0.12% and 0.17% losses; respectively, the uncertainty increased again between the United States and China trade deal.

While the United States ten-year treasury yields stop previous drops around 1.815% whereas the NIKKEI opens a tad lower after weak signals.

Whereas, the pairs traders cautious after the Tankan number & trade news. Tankan manufacturing poll, which tracks the steps of Bank of Japan’s (BOJ) essential Tankan quarterly survey, recently fell to the lowest since March 2013 during October.

At the Sino-US trade front, the condition surrounding the round-1 trade deal between the United States and China seems doubtful recently.

Looking ahead, the traders will keep their focus on the United States, and China round-1 phase, and Brexit details for getting fresh hints and clues as well as the trader will carefully observe the 2nd-tier data on the economic calendar. The greenback hit a bullish trend in the wake of the ISM beat. 

Daily Support and Resistance

S3 108.34

S2 108.66

S1 108.82

Pivot Point 108.98

R1 109.14

R2 109.3

R3 109.62

USD/JPY – Trading Tips

On the technical side, the USD/JPY currency pair had shown the wrong direction to the buyers of the market during the last 48 hours as you know the pair dropped in 48 hours against the buyer’s expectations. The pair closed above the 200-day M.A. on Tuesday to fall back below the long-term M.A. in the overnight trade. Consider staying bullish above 

108.700 today.

All the best!

Categories
Forex Market Analysis

Gold Heading North for Bullish Retracement – Who’s Up for Buying Trade?

On Wednesday, the yellow metal gold trades bullish, recovering some losses following an almost 2% drop in the previous session. The demand for safe-haven gold seems to pick up again as the bullish rally in stock market delayed, and the result of U.S.-China trade discussions seemed doubtful once more.

Gold prices soared 0.1% to $1,485.07 per ounce, and bullish bias seems pretty solid today. Considering the U.S. -China trade war, the market is still experiencing uncertainty, and we still don’t comprehend if there is a deal yet. 

Besides, the global stock markets are trading neutral following a three-day bullish trend as traders extended to see incoming economic figures and awaited new improvements from U.S.-China trade discussions. Consequently, we may see investors taking their funds out from the stock markets and putting it in the safe-haven assets such as gold. 


Gold – XAU/USD – Daily Technical Levels

Support Resistance 

1472.82 1501.14

1461.98 1518.62

1433.66 1546.93

Pivot Point 1490.3

Technically, the precious metal gold has formed a Doji /test bar on the 4-hour timeframe, which is suggesting chances of a bullish reversal in gold. The MACD and RSI have started to come out of the oversold zone, and now it’s suggesting chances of a bullish reversal in the market. Continuation of a bullish trend may extend further buy until 1,492 today. Consider taking buying positions above 1,482 and selling positions below 1,492 level. All the best! 

Categories
Forex Basics

Do not be Biased with Your Anticipation

Financial markets keep going up and down. Traders make money out of those moves. To take an entry, a trader is to do a lot of calculations, such as detecting a trend, waiting for the price to go to the right zone, market psychology, and signal candle, etc.

In trading, we often find ourselves in a situation in which we were waiting for a long entry from a support zone, all of a sudden the price makes a breakout at the support and heads towards the South instead. We feel deprived. However, this should not be like this. In trading, we are to get ready to sell and to buy since the market can go anywhere. We are to stick with the rules to take an entry.

Let us demonstrate an example.

The price heads towards the North with good buying pressure. It seems that the price finds its resistance as well. The buyers are to wait for a bullish reversal candle and a breakout at the resistance to go long again on the pair.

The price keeps being bearish. It seems that the price is going to have a long correction instead of consolidation. The price is at a flipped support. This is where a battle is going to take place between the bull and the bear. Traders are to wait for a downside breakout to sell the pair. On the other hand, a bullish reversal candle is going to attract them to keep an eye for an upside breakout and buy the pair.

The bull wins here. An engulfing bullish candle right at the flipped support means traders shall wait for an upside breakout to buy the pair. The momentum looks good. If the breakout takes place within the next candle, it will be an excellent buy signal. If it takes two candles to make the breakout, that will be a good buy signal as well. Let us proceed to find out what happens next.

The bull has lost the momentum. Traders are to wait for an upside breakout to go long. A good-looking bullish engulfing candle at the support area shall attract the buyers on the minor time frames to push the price towards the upside. That would eventually help the price make an upside breakout on this chart. Let us wait and find what happens next.

What do you see here? A bearish engulfing candle is right at the resistance level. This is a Double Top resistance level as well. If you have been waiting to go long, please change your mind. Get ready to look for short opportunities. This is how the market changes its complexion. You know what you have to do to deal with it. Yes, you must not be biased with your anticipation/calculation — Trade what you see, not what you think.


Categories
Ichimoku

Ichimoku Kinko Hyo – Introduction and History

Ichimoku Kinko Hyo


Ichimoku is not an indicator (many platforms incorrectly label it an indicator) – it is a trading system. Ichimoku Kinko Hyo is, in my opinion, the most effective trading system to use with Japanese Candlesticks.

The reasons for this require a deep dive into the fundamentals behind the differences of Japanese VS Western analysis – but that is for another article. The Ichimoku system – and it is a system, not an indicator – is perhaps the most complimentary system that you could ever use with Japanese candlesticks. The reasons for this are rooted in history.


History of Japan: Edo, Meiji, and Candlesticks

One of the most important and famous economists in history, Milton Freidman, often used a specific point in Japan’s history to show how powerful free markets are. This period was known as the Meiji Restoration. If you are unaware of this period of history, you should do a little reading. It’s an astounding story. The period we are most interested in is the period after the end of the Tokugawa Shogunate (Edo Period) and the beginning of the Meiji Period.

It’s important to understand that before the Restoration, Japan was militantly xenophobic. For over a quarter of millennia, no foreigners were allowed in Japan, and no Japanese were allowed to leave. This policy ended almost literally overnight when the Emperor opened the doors of Japan to foreign capital, industry, and ideas. In just a couple of decades, the Japanese went from mostly medieval technology to fast-forwarding their technology ahead almost 350 years. I mean, think about it. In 80 years, the people went from medieval plowshares to aircraft carriers. It’s truly fascinating. But the major transition wasn’t just the technological leap; it was the capital and market-based leap as well.

Believe it or not, Japan created the first futures exchange. The Dojima Rice Exchange was created in 1697 by samurai. Samurai were not just masterful warriors, but they had various duties throughout their existence – one of which was collecting taxes. Rice was the de facto currency in Japan for centuries – it’s how people paid taxes. Rice coupons were issued and used as the first futures contracts.

Fast forward to the end part of the Edo period; we have the first instance of what we now know as Japanese Candlesticks coming to use. Munehisa Homma (nicknamed Sakata) is credited with creating Japanese Candlesticks. It is important to note that Japanese Candlesticks (the mid-1700s) were used well before the invention of American Bar Charts (1880s). More on the history of Japanese Candlesticks and Mr. Homma’s invention will be discussed in another article.


Ichimoku Kinko Hyo History

The man who created Ichimoku is Goichi Hosada. David Linton’s book, Cloud Charts – Trading Success with the Ichimoku Technique and Nicole Elliot’s book, Ichimoku Charts – An Introduction to Ichimoku Kinko Clouds provide an excellent history of both Japanese candlesticks and Goichi Hosada’s time spent creating Ichimoku. Both of those books should be on your shelves!

The translation for Ichimoku Kinko Hyo is this: At a glance (Ichimoku), Balance (Kinko), and Bar Chart (Hyo). The most important word here, Kinko, for balance. Experienced traders in Japanese theory and pedagogy will know that one of the most important characteristics in Japanese technical analysis is the focus of balance and equilibrium. This trait is constant in the Ichimoku system. The focus of equilibrium and balance is constant in various Japanese chart forms as well (Heiken-Ashi and Renko). The concept of balance will make more sense when you learn the Ichimoku system in the next article.


Sources: Péloille Karen. (2017). Trading with Ichimoku: a practical guide to low-risk Ichimoku strategies. Petersfield, Hampshire: Harriman House Ltd.

Patel, M. (2010). Trading with Ichimoku clouds: the essential guide to Ichimoku Kinko Hyo technical analysis. Hoboken, NJ: John Wiley & Sons.

Linton, D. (2010). Cloud charts: trading success with the Ichimoku technique. London: Updata.

Elliot, N. (2012). Ichimoku charts: an introduction to Ichimoku Kinko Clouds. Petersfield, Hampshire: Harriman House Ltd.

Categories
Crypto Market Analysis

Daily Crypto Review, Nov 6 – Senator Romney and the FBI view Crypto as National Security Threat

The cryptocurrency market had another green day. Major cryptocurrencies’ volume is on the decrease, and yet the price rose two days in a row. Almost every cryptocurrency in the top100 is currently in the green, the exceptions mostly being stablecoins. Bitcoin went up 1.78%, and it is now trading at $9,385. Ethereum gained 4.98%, while XRP gained 1.35%.

Out of the top100 cryptocurrencies by market cap, the biggest gainer is Dragon Coins, with 24.53% daily gain followed by Lambda’s 21.71% and Algorand’s 19.42% gain. The biggest loser of the day was Chiliz, which lost 17.59% of its value.

Bitcoin’s dominance went slightly down when compared to the previous day as some cryptocurrencies outperformed its daily gain. Its dominance now sits at 66.82%, which represents a decrease of 0.3% when compared to yesterday’s value.

Cryptocurrencies ended up being in the green in the past 24 hours, which resulted in a small increase in market capitalization of the whole asset class. It now has a market capitalization of $253.78 billion, which represents an almost $3.09 billion increase when compared to the previous day.

What happened in the past 24 hours

The United States Republican Senator Mitt Romney is considering impeaching cryptocurrency from the US as, in his opinion, the threat to national security is rising. The FBI also agreed with that by saying that cryptocurrencies are a “significant problem that will get bigger and bigger”. All this happened during a hearing in the United States Senate Committee On Homeland Security And Governmental Affairs.

_______________________________________________________________________

Technical analysis

_______________________________________________________________________

Bitcoin

Bitcoin’s has broken its triangle pattern that it was forming on a daily time-frame and its standing above it with conviction. While the price seems to be performing movements contained in a range, the current candle is looking promising. Bitcoin is now trading at $9,385, which is close to $100 more than it was trading at 24 hours ago.


Bitcoin’s volume is approximately on the same level as it was yesterday. As there were no new moves to the upside or downside, the key levels stay the same.

Key levels to the upside                   Key levels to the downside

1: $9,580                                          1: $8,820

2: $9,740                                          2: $8,640


Ethereum

Ethereum’s bulls and bears were fighting for its place above or below the $185 line yesterday. The bulls won, and the price went above the line, but that was not the end of the move. Etherum is now trying to tackle another resistance, which is sitting at $193.5. Ethereum is now trying to break the resistance and its trading right at this price level. The price broke resistance once but was quickly driven down by the strong selling pressure.


Key levels to the upside                   Key levels to the downside

1: $193.5                                          1: $178.6

2: $198                                             2: $167.8

3: $163.5


Ripple

XRP has not changed much in terms of price or overall position in the market. It has been stagnant in the past couple of days in terms of breaking any supports or resistances. However, its price did move slightly up in the past 24 hours. The price is still going up and down, performing price moves in the range of $0.286-$0.306. XRP’s price is currently $0.303.


XRP’s RSI is approaching overbought on the 4-hour time frame, which may indicate that bears will be kicking in soon. The key levels are remaining the same as the price did not move past any support or resistance levels.

Key levels to the upside                   Key levels to the downside

1: $0.31                                            1: $0.285

2: $0.325                                          2: $0.266 (major support)

3: $0.333                                          3: $0.245

Categories
Forex Market Analysis

Daily FX Brief, November 06– Major Trade Setups – European Data In Focus! 

On Wednesday, the U.S. dollar index is mostly unchanged, trading at 97.936 in early Asian trade, following a surge of 0.37% the previous day. The headlines came that the United States and China are still on the doubtfull track and so far from reaching even a phase one deal, whereas increasing uncertainty in the trade is China’s intact support for Hong Kong’s hard stand against protestors.

Today, the focus of traders stays on the series of services PMI figures from the Eurozone. 

Economic Events to Watch Today

Let’s took at these fundamentals.


EUR/USD – Daily Analysis

The EUR/USD currency pair found on the bearish track for the last two days. As of writing, the currency pair is currently trading at 1.1073; the neckline supports double top pattern on the daily chart.

The German data is scheduled to release at 06:00 GMT and expected to show factory orders, a vital impulse for Europe’s largest economy, which dropped for the 3rd consecutive month during September.

Moreover, IHS Markit’s Purchasing Managers’ Index (PMI) for Germany dropped to 41.7 during September to register the weakest figures since 2009 and 8-straight monthly drop in output. The PMI was at 43.5 in August. A number below 50 indicates contraction.

As we all well aware, the EUR/USD currency pair is already trading on the slippery ground and having charted a bearish trend over the last two days. Therefore, the unexpected weaker factory orders data could allow a possible break below 1.1073.

On the positive note, the EUR currency will likely take buying if the critical data will release better than expected. However, the technical outlook would become bullish above 1.1180.

Daily Support and Resistance

S3 1.0939

S2 1.1016

S1 1.1045

Pivot Point 1.1093

R1 1.1122

R2 1.1169

R3 1.1246

EUR/USD– Trading Tips

The direct currency pair EUR/USD exhibited a dramatic selling from 1.1120 to 1.1065 area. Today this level is likely to extend support to the EUR/USD pair. New candles are Doji, which are followed by a strong bearish candle. This suggests that sellers are exhausted, and we may see buying behavior in the market. Consider taking buying positions above 1.1065 today.  


GBP/USD– Daily Analysis

The GBP/USD currency pair hit the bearish track despite increasing hopes for the Tory leader to win the snap election. Notably, probably the reason behind the bearish trend of cable pair is uncertainty surrounding the United States, and China trade deal keeps the U.S. Dollar strength intact. As of writing, the GBP/USD currency pair currently trading at 1.2880 on the day.

The headlines came that the United States and China are still on the doubtfull track and so far from reaching even a phase one deal, whereas increasing uncertainty in the trade is China’s intact support for Hong Kong’s hard stand against protestors.

As of data, the preliminary figures of the United States Nonfarm Productivity and Unit Labour Coast for the 3rd quarter will be under the focus after the JOLTS Job Openings Challenged the U.S. employment optimism on Tuesday.

Daily Support and Resistance

S3 1.277

S2 1.2828

S1 1.2856

Pivot Point 1.2887

R1 1.2915

R2 1.2946

R3 1.3004

GBP/USD– Trading Tips

The GBP/USD hasn’t changed much so far as it continues to trade bullish due to the weaker U.S. dollar. The Cable has outraged the previous resistance level of 1.2930. Now the pair is likely to face fresh resistance around 1.3050 area. Consider staying bullish above 1.2941 today.  


USD/JPY – Daily Analysis

The USD/JPY Currency Pair currently trading at 109.04; the pairs hit the low of 109.00 despite the weak macro data. During the Tokyo session, the USD/JPY currency pair was trading near the 109.13 even after the BOJ minutes keeping easy money policy on the cards.

The final Jibun Bank Japan Services Purchasing Managers’ Index (PMI) is seen at 49.7 in October from 52.8 in September on a seasonally-adjusted basis. The below-50 figures are the first since September 2016.

Despite the weak data approved by the Bank of Japan easing policy, the pair found at 109.20 and has slipped back to near 109.00, mainly due to the drop in the S&P 500 futures. As of writing, the index futures are representing the 0.15% decline.

Moreover, the USD/JPY currency pair may continue taking hints from the movement in the equities and Treasury yields. As of now, the ten-year yield is trading at 1.84%, representing two-basis-points declines from the session high of 1.86%.

Looking forward, traders will keep their eyes on Japan’s Jibun Bank Services Purchasing Managers Index (PMI) data for October. In contrast, few other Federal Reserve policymakers will carefully observe for additional direction during the latter part of the day. Market estimates suggest a soft PMI figure of 50.3 against 52.8 prior.

Daily Support and Resistance

S3 108.05

S2 108.55

S1 108.85

Pivot Point 109.05

R1 109.35

R2 109.55

R3 110.05

USD/JPY – Trading Tips

The USD/JPY traded bullish, placing a high around 109.200 level. As per the recent technical analysis of the pair, the USD/JPY is facing resistance around 109.20. Below this level, we can expect a continuation of the selling trend until 108.900 and 108.650.

Besides, the MACD and Stochastics are holding in the overbought range, suggesting chances of a bearish trend in the USD/JPY. Consider taking sell positions below 109 today as the immediate target stays at 108.650. 

All the best!