What is liquidity?
When a trader starts his trading journey, one of the things he finds most attractive is the amount of liquidity offered by the forex market. The latest
What is liquidity?
When a trader starts his trading journey, one of the things he finds most attractive is the amount of liquidity offered by the forex market. The latest
What is liquidity?
When a trader starts his trading journey, one of the things he finds most attractive is the amount of liquidity offered by the forex market. The latest figures suggest that the daily trading volume of forex is close to $5.1 trillion.
Liquidity is the ability to trade a currency pair on demand. In simple terms, it is the measure of how easily a currency can be exchanged. When you are trading major currency pairs, you have an exceedingly high amount of liquidity. This liquidity is provided by financial institutions, big businesses, and retail traders as well. However, not all the currency pairs are liquid; liquidity depends on whether a currency pair is major, minor, or exotic. Major pairs typically have high liquidity compared to the other currency pairs. In the next section, we will look at some of the money management principles in trading with respect to liquidity.
Liquidity and Risk
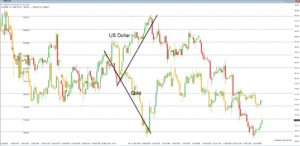
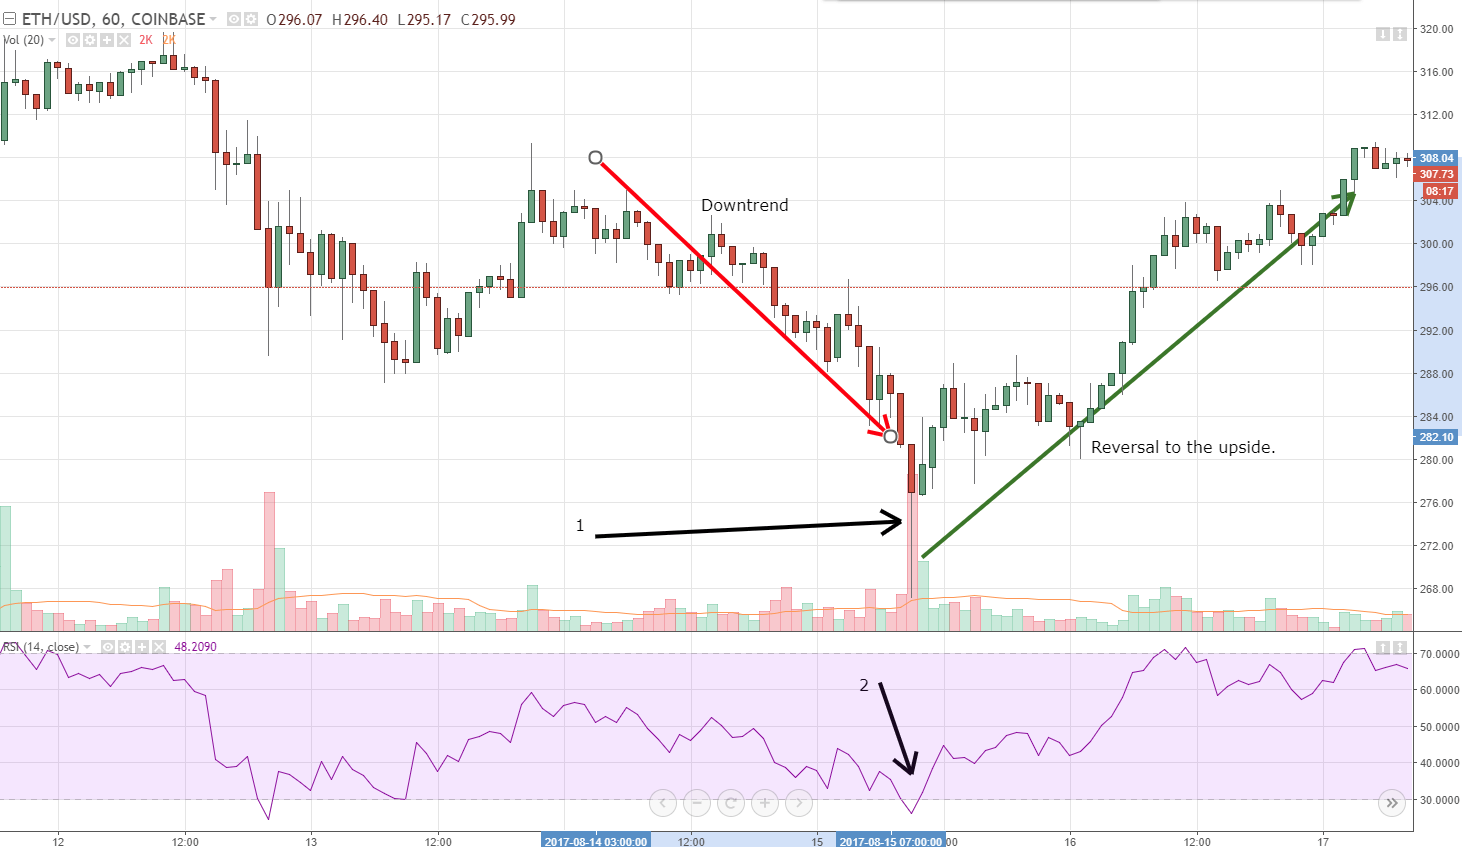
A market with low liquidity has chaotic moves and gaps because of the absence of buyers and sellers at any given point of time. These gaps occur when news announcements are made over the weekend or if an event happens at the same time. The chart below depicts such a gap after a news release.
According to money management principles, when you know that there will be a change in liquidity levels between Friday to Monday, it is not advised to carry huge positions on Friday. The risk drastically increases, if the price opens above your stop loss on Monday, it will become a market order, and this loss will be much higher than the predefined loss (determined using stop-loss). A conservative trader especially should not take any positions during times of news releases.
Retail forex traders need to manage liquidity risk by lowering their leverage and putting stop losses based on higher time frames. In this way, you would be safe from any kind of gaps that happen at the beginning of the week.
Volatility
Volatility refers to the currency fluctuations in the global exchange market. Price movements can vary from hour to hour, minute to minute, and second to second, depending on many factors. A lot of forex traders enjoy volatility, but it comes with a risk. Therefore it is important to manage volatility and do plenty of research before placing a trade.
Eliminating the risk of volatility
In order to make the most out of volatility, follow the below-mentioned techniques:
Volatility strategies
Money management, in relation to volatility, essentially suggests traders invest in strategies that can perform in different market conditions. Some of the strategies that can be used to turn the volatility in your favor include widening your targets, placing tight stop-losses, and analyzing the higher timeframes.
Stay diversified
Don’t rely too much on any asset class or forex pair. If one investment performs poorly, other investments may perform better over that same period and thereby reducing your overall losses. This happens due to the difference in volatility across various asset classes. A balanced portfolio protects from losses and provides a high return on investment.
Money management should always be a top priority for every trader, as these principles guide us while taking trading decisions. A lot more concepts related to money management will be discussed in the upcoming articles.
The Relative Strength Index (RSI) indicator was developed in 1978 by J. Welles Wilder. the RSI is a Momentum indicator that measures the change of the price movement. In this
The Relative Strength Index (RSI) indicator was developed in 1978 by J. Welles Wilder. the RSI is a Momentum indicator that measures the change of the price movement. In this
The Relative Strength Index (RSI) indicator was developed in 1978 by J. Welles Wilder. the RSI is a Momentum indicator that measures the change of the price movement. In this educational article, we will review how to apply the RSI with the Elliott Wave Analysis.
The basics
Possibly, the RSI indicator is the most widespread indicator from professionals to retail traders. The RSI is an oscillator that moves in a range between 0 to 100. Alexander Elder describes it as a “leading or coincident indicator – never laggard.”
Some applications of RSI are tops and bottoms identification, divergences, failure swings, support and resistance, and chart formations.
In the Elliott wave theory, the RSI application can to aid in the wave identification process. In particular, the identification of divergences is the most used application in the wave analysis.
J. W. Wilder describes the divergence between the price action and RSI path as a “powerful indication that the market could reverse soon.
A divergence takes place when the price is still increasing, while the RSI began decreasing (bearish divergence). Or when the price falls, and the RSI climbs (bullish divergence.) In the wave analysis terms, divergences appear between the end of waves three and five. Let’s see a couple of examples.
RSI and the Elliott Wave Principle
Johnson & Johnson (NYSE:JNJ), on its weekly chart, illustrates the RSI and the Awesome Oscillator. Both indicators show the divergence created between the end of waves three and five.
On the JNJ chart, we also can observe the RSI levels when price action runs in a wave three. When this occurs, the RSI tends to move between the levels 70 and 80.
In a bull market scenario, usually, the price action tends to find support near to level 40. When the price moves in a bear market, the ascending correction tends to find resistance near to level 60. This concept, with the swings identification, can support the wave analysis.
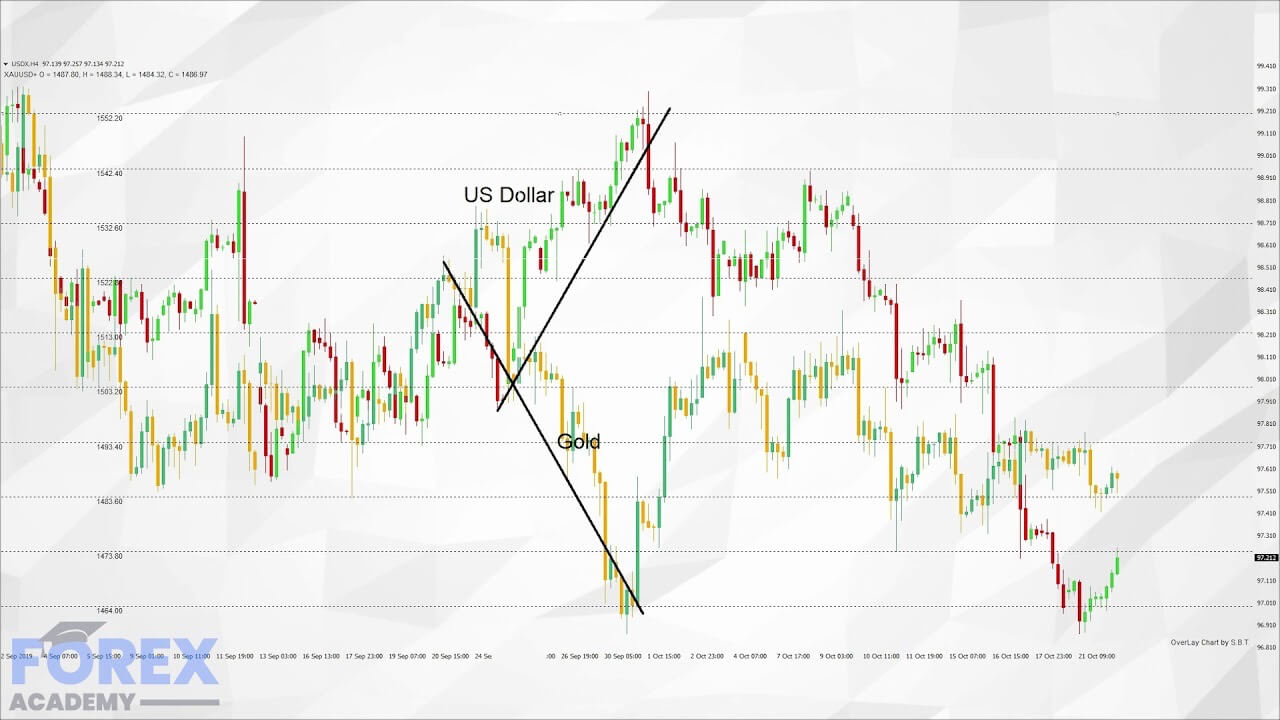
The following chart corresponds to the Dollar Index (DXY) in its 8-hour timeframe. From the figure, we observe the bullish sequence developed in five internal legs, in which we observe that each leg has three waves.
As a conclusion from the study using the RSI indicator and wave analysis, the price action unveils an ending diagonal pattern. The Elliott wave structure shows us that the Greenback should see new lower lows.
Candlestick formations – The display of price information
There are many different ways that a trader can have access to the price of an asset.
[embed]https://youtu.be/pCh8iSCS8kk[/embed]
Candlestick formations – The display of price information
There are many different ways that a trader can have access to the price of an asset.
Candlestick formations – The display of price information
There are many different ways that a trader can have access to the price of an asset. In the Forex market, the most common ways that traders monitor the movements of exchange rates are by using line graphs, bar charts, Renko charts, tick or ticker tape charts. And one of the most popular ways of deciphering price movements is the Japanese candlestick.
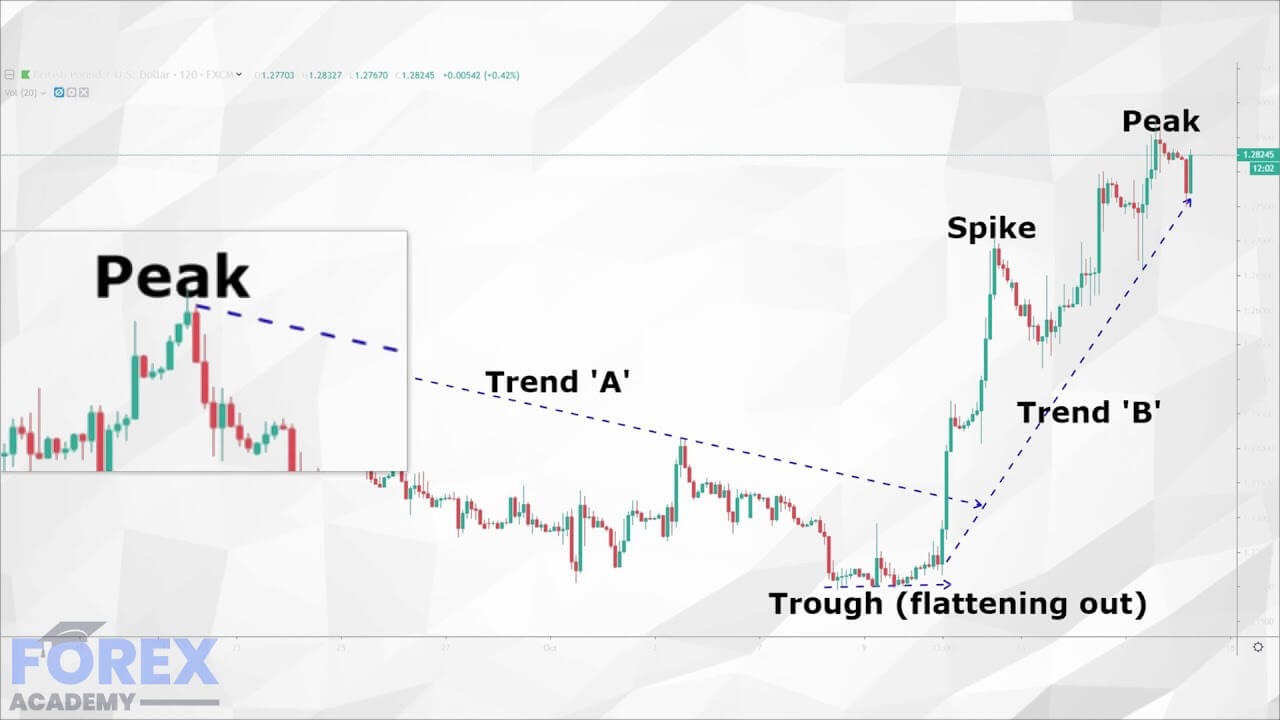
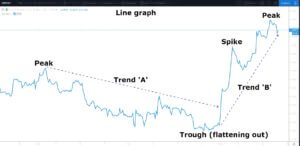
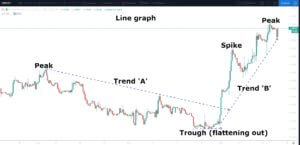
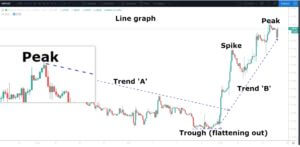
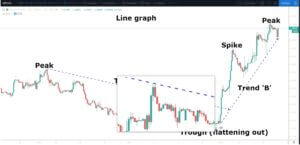
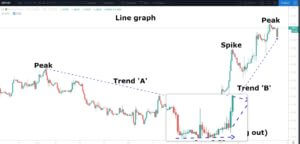
Let’s look at some examples of exchange rate price action via three commonly used technical analysis tools.
Example ‘A’ is a basic line graph of the daily time frame of the GBPUSD pair, as denoted in the top left-hand corner of our chart. Time frames are shown here too. At the bottom of the chart along a horizontal axis, we can see time and the date, and the exchange rate of this pair is shown in the vertical axis on the right-hand side of the chart.
The line graph converts the price action of a currency pair onto a continuous line on a chart. As you would expect, the line goes up and down and sideways. However, just by looking at the line graph alone, it would appear to be almost impossible to try and ascertain future movements by this tool.
Example ‘B’ is the same daily time frame of the GBPUSD pair, but this time we are looking at a bar chart. Each bar opens at the beginning of the given timeframe, and in this case, opens and closes every 24 hours. Each bar consists of three lines: A vertical line to the left of the horizontal line, which denotes the opening of the bar; the vertical line which tells the trader the up-and-down movement of price action during this time frame; and another horizontal line to the right of the vertical which tells the trader where price action finished.
Let’s now turn our attention to example ‘C’: The Japanese candlestick. Each candlestick opens and closes along a vertical line. Again, this is the daily time frame of the GBPUSD pair. The candlestick offers a much greater visual representation of the exchange rate and therefore presents many opportunities to a trader with regard to potential future trends. The Japanese candlestick is the most widely used technical tool used by traders across the globe.
Japanese candlesticks were invented in the early 15th century by the Japanese government of the time. They were used to record price movements on Japan’s rice exchange. At this time, rice was not only the primary dietary staple, but it was also a unit of exchange.
Example ‘D’ is a typical candlestick shape that traders see regularly on their charts. We have marked the points where the candlestick opened and closed. If the candlestick closes above the exchange rate at the point of which it opened, it is considered to be a bullish candlestick. If it closes below the exchange rate at the point of opening, it is considered to be bearish. Candlesticks can also open and close at the same exchange rate.
However, in this example of a bullish candlestick, we can see a wick at the top of the candlestick and also one at the bottom. Therefore, a trader can determine that after opening, price action initially falls before reversing and rising to the top of the time frame, before falling again back to the close. In this case, we have two wicks, one at the top and one at the bottom. A trader can tell the total exchange rate covered by the candlestick by measuring between the low and the high points and also see pullbacks and reversals. The same principle applies to a bearish candlestick where price action is measured over the whole length of the candlestick, but where traders easily identify the opening and closing of price action for each time frame.
Each candlestick will have a different sized body and wicks dependent on the amount of volume going through at any given time. The basic principle is that the longer the body and the shorter the wicks, the stronger the volume. Traders are able to read the many different types of candlesticks, which are all given names, in order to depict the strength of a trend and volume in the market at any given time, and these will help them to predict trend formations, reversals, and consolidation of the exchange rate of any particular pair.
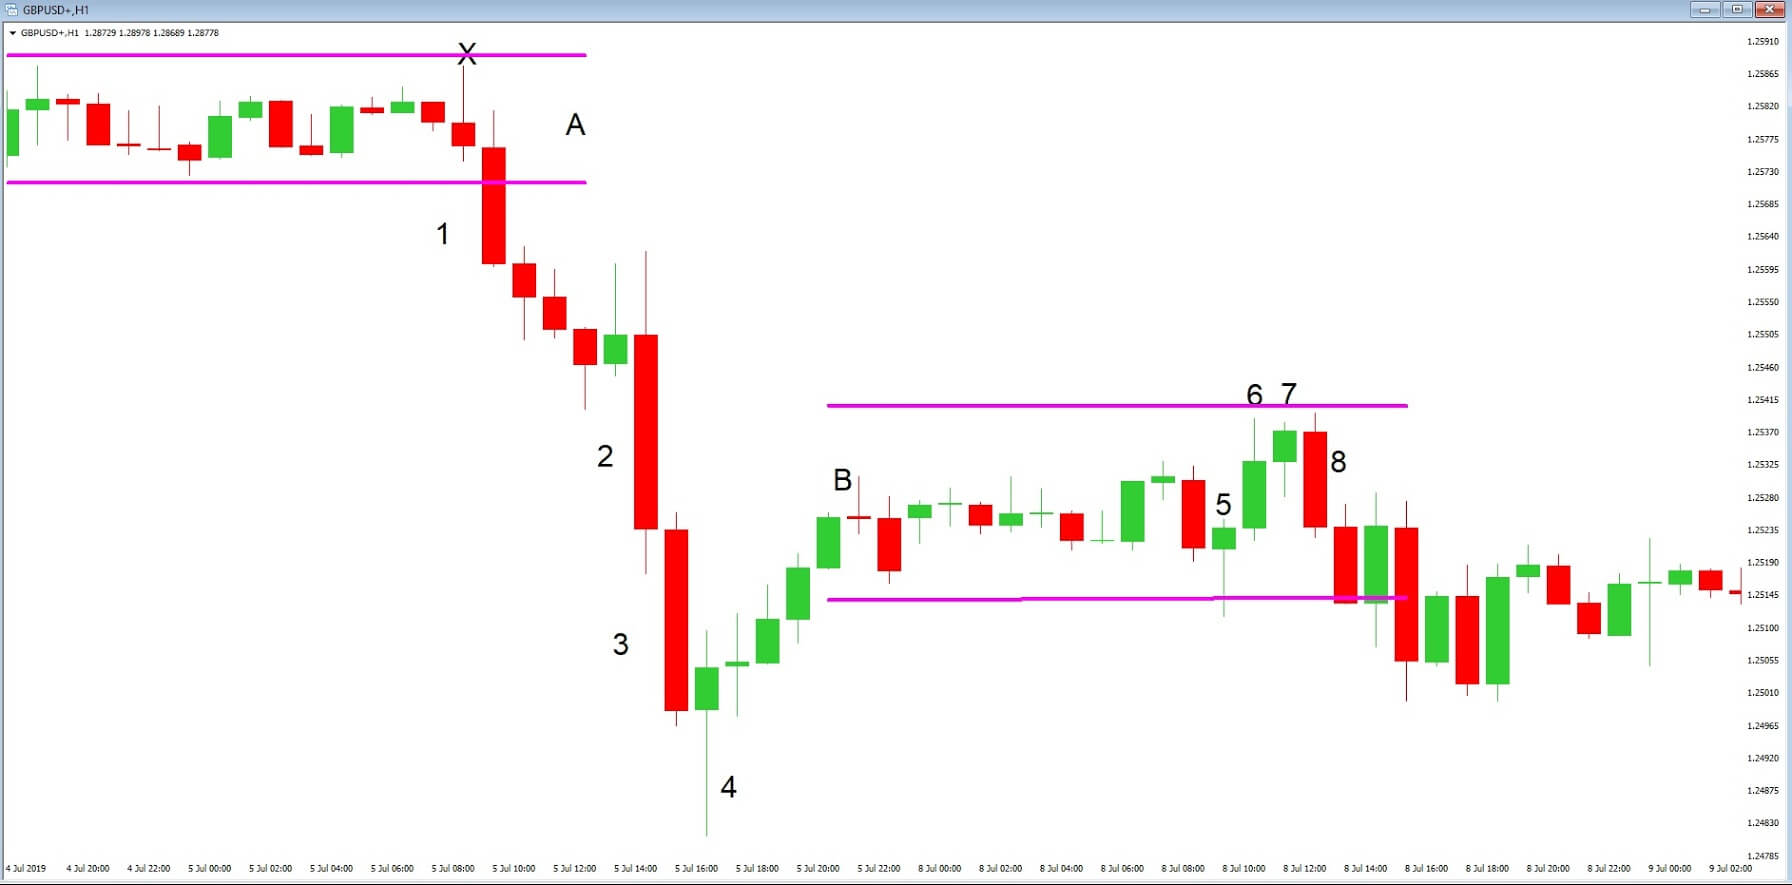
Diagram ‘E’ provides us with a snap-shot of a 1-hour chart of the GBPUSD pair, where candlesticks are used to show price action. In section ‘A’ of the diagram, we can see that the price action is fairly flat and trading in a sideways motion. However, candlestick number 1 pushes below the trend line and forms the basis of a downward move. The candlestick is also bigger than those preceding it, and the wick at the bottom is small, denoting strong volume to the downside.
After a period of uncertainty, price action becomes stronger to the downside, as denoted by the large candlesticks numbered 2 and 3. Price action continues the downward trend, however buyers push up price action at number 4, which is called a reversal hammer, and where indeed price action reverses to section ‘B.’ We now have a series of smaller candlesticks which denotes a thinning in volume, and where we can see some candlesticks open and close at the same exchange rate, telling traders that neither the buyers or sellers are in control at this particular moment in time.
Candlestick number 5 tries to push the trend to the downside, but reverses and forms a reversal hammer shape, and where we subsequently see price action move to the upside as per candlestick number 6 and 7. But we then see a trend reversal in candlestick number 8, which becomes an engulfing candlestick because it is larger than both 6 and 7. The strength of this candlestick denotes a potential increase in price action to the downside by taking out the previous two candlesticks, and we see further movement to the downside before price rises again. Incidentally, we have another price reversal hammer in section A where we have placed an X.
Here at Forex.Academy, we strongly recommend that you learn as many candlestick formations as possible because they are very commonly used within the trading community, and therefore this will give you an edge in your trading.
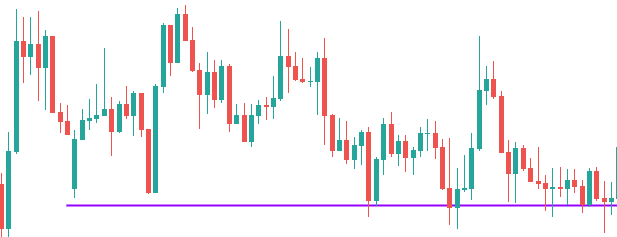
Most traders use a horizontal line on their trading chart to mark support/resistance levels. Support and Resistance lines are the most basic trading tools, which traders use to make a
Most traders use a horizontal line on their trading chart to mark support/resistance levels. Support and Resistance lines are the most basic trading tools, which traders use to make a
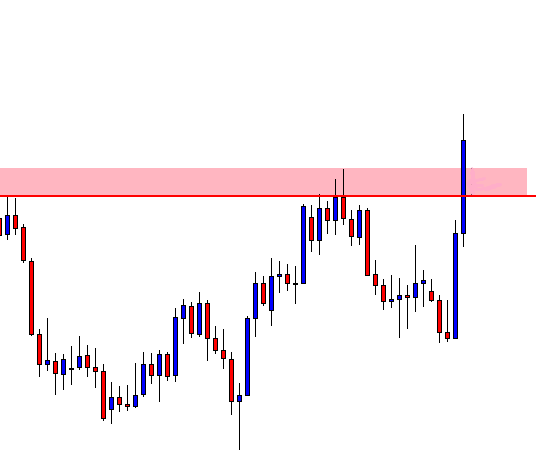
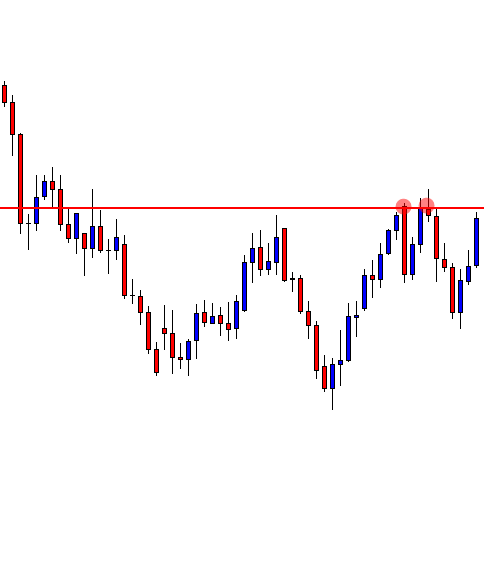
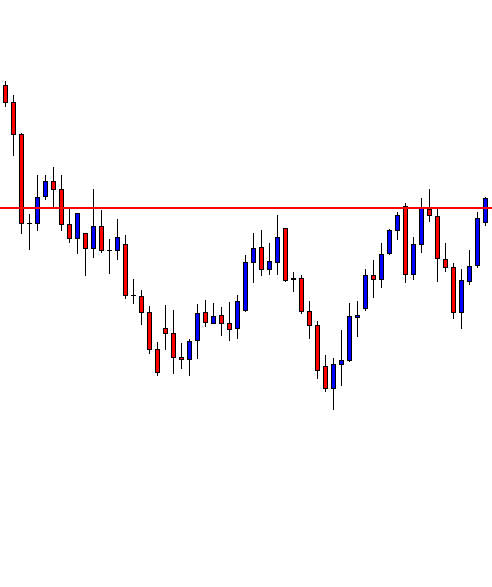
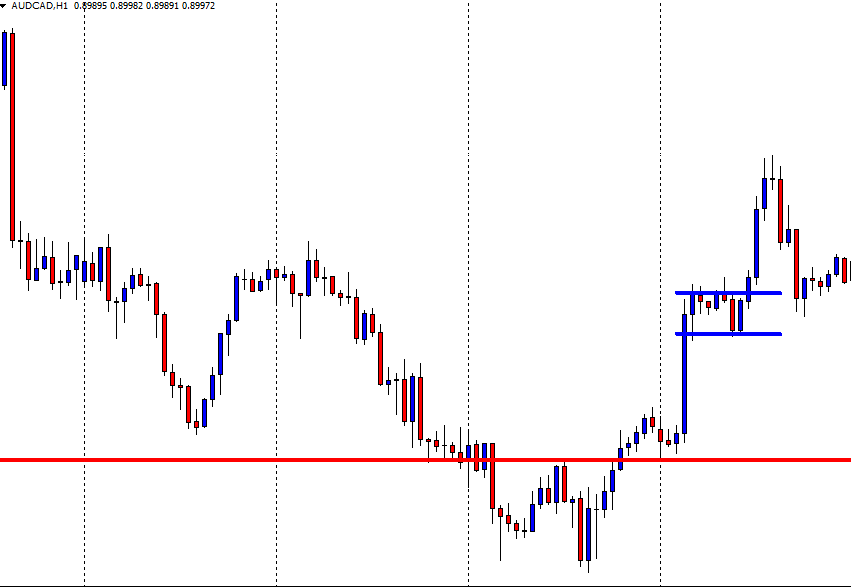
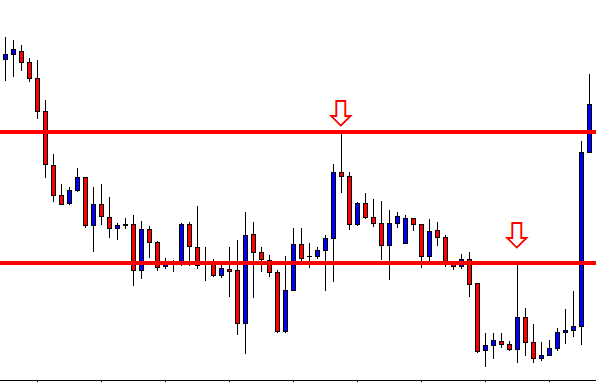
Most traders use a horizontal line on their trading chart to mark support/resistance levels. Support and Resistance lines are the most basic trading tools, which traders use to make a trading decision. However, traders often find that the price does not react right at the drawn level. It is because of candles’ wicks and candles’ bodies. We may see that sometimes the price reacts at the level where the candles’ bodies are, and sometimes the price reacts where the wicks are. Thus, it is a good practice that we mark the support/resistance zone instead of marking the level only.
Let us demonstrate an example of that.
The price is being bullish after producing a Pin Bar. We know that a bullish Pin Bar has a long lower shadow. This means it reacts from a zone not only from a particular horizontal line.
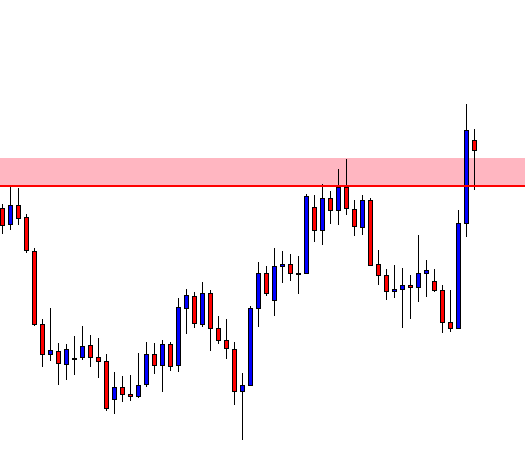
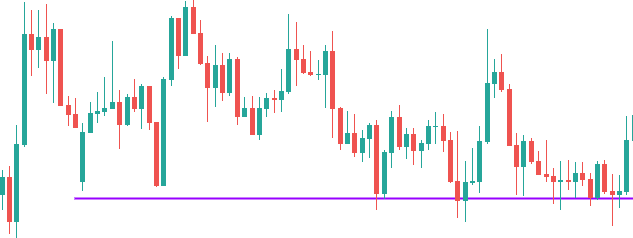
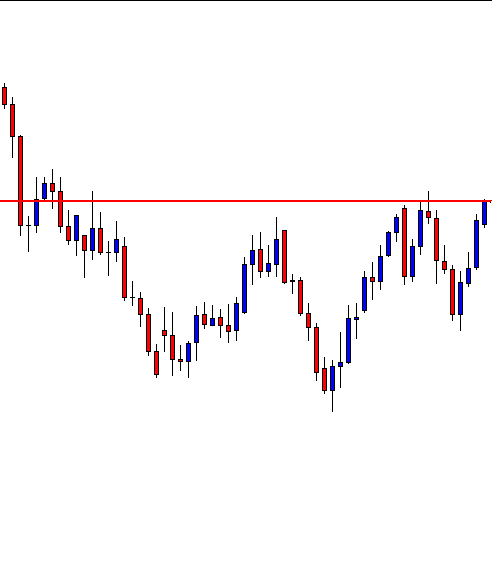
The price is on the correction. Look at those Spinning Tops with long upper and lower wicks. Do you notice that one of the flipped support holds the bodies of the candles? However, those shadows often play an essential role, especially when the price is to confirm a breakout. We will reveal that soon.
The flipped support does not hold the price at last. The price comes towards the South further to find its support. The last bullish candle suggests it finds one strong support for sure. Do you notice that this is where the price has bounced earlier and produced spikes?
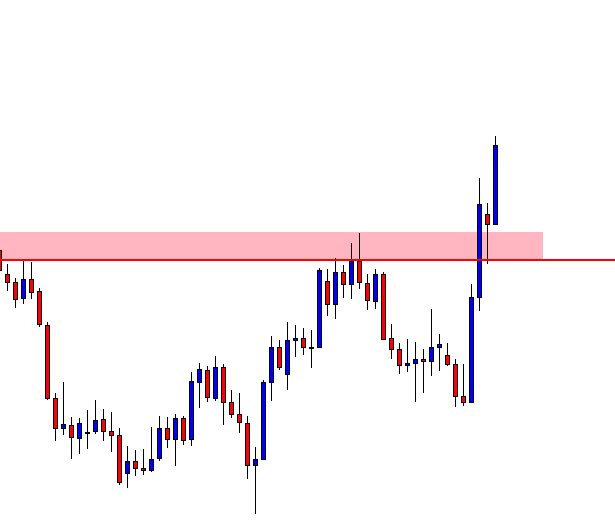
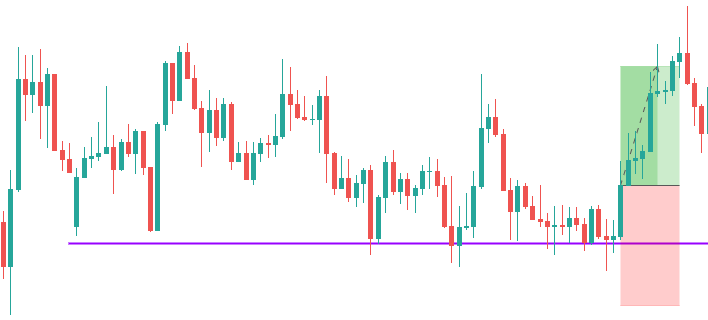
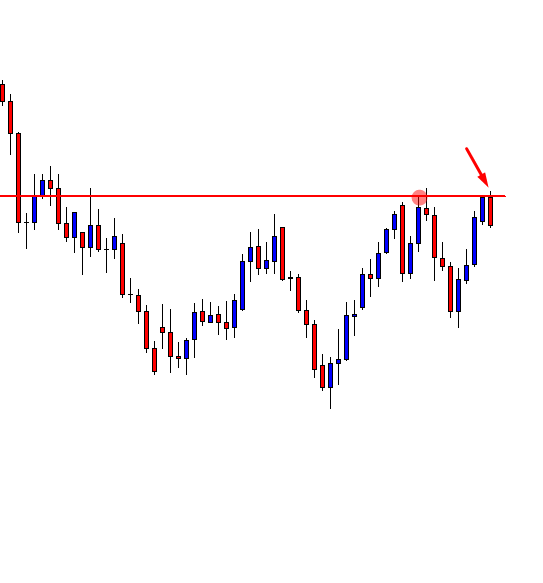
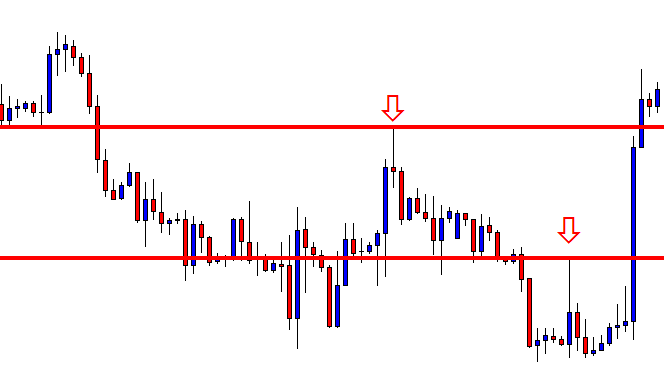
This time we have marked out the resistance zone. A bullish candle breaches the zone. The buyers need to wait for consolidation. The question is which level to hold the price as the level of support. Is it the level where the wicks are or where the bodies close or both?
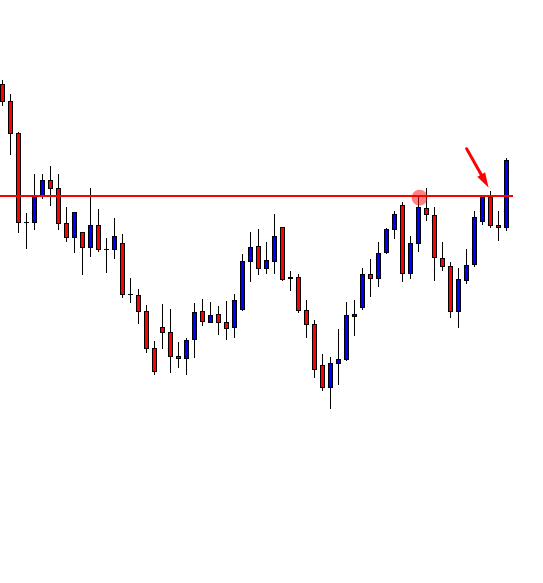
Both levels hold the price as support. On this chart, the level, which is drawn on the wicks, holds the price as the support. On its smaller time frames, the level that is drawn on candles’ bodies holds the price as support. If we draw just one level here, we may get confused. Thus, we must mark out the support/resistance zone. Since the buyers are waiting for a bullish reversal candle to go long, it may be produced where the price is now. The price may as well come down at the lower level of the support zone and create a buy signal. Both are valid signals. Let us find out where the signal is produced.
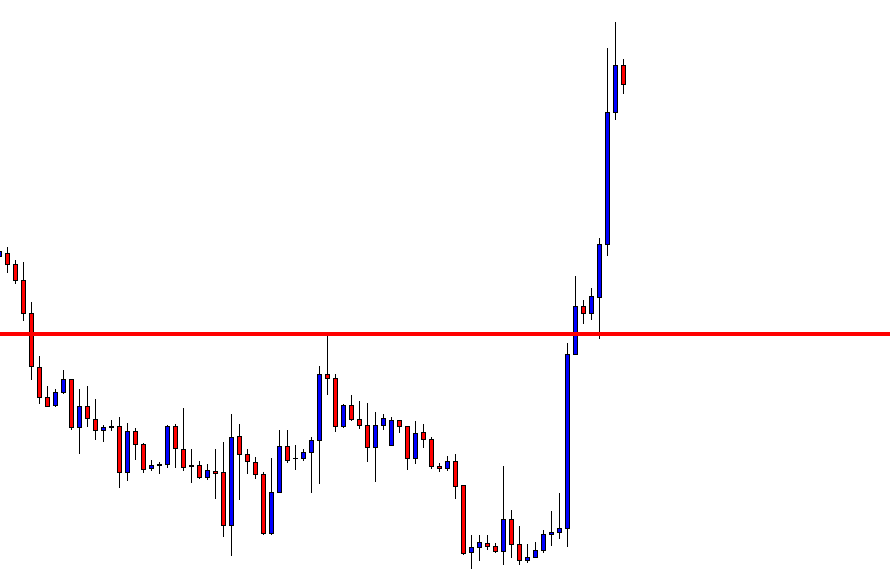
The buyers may want to trigger a long entry right after the last candle closes. Assume only the red line was drawn here. Some buyers would have been confused that the signal did not come from the right level. Thus, drawing the support/resistance zone comes out handy for the traders. Support/Resistance zone helps traders take a better trading decision.
During the Asian session, the economic event well-occupied as it included October Service sector PMI figures coming out from China and Retail Sales Monitor figures from the United Kingdom.
On
During the Asian session, the economic event well-occupied as it included October Service sector PMI figures coming out from China and Retail Sales Monitor figures from the United Kingdom.
On
During the Asian session, the economic event well-occupied as it included October Service sector PMI figures coming out from China and Retail Sales Monitor figures from the United Kingdom.
On the flip side, the Reserve Bank of Australia also released its November interest rate verdict and rate statement. The RBA decided to keep the policy unchanged today.
On the geopolitical uncertainty aspect, chatter on trade contributed backing for riskier investments in the first section of the day. The focus today stays on the series of economic events from the U.S. and New Zealand.
The GBP/USD currency pair still flashing red for the 3rd consecutive day and dropped to 1.2880 on the day. Apart from trade positive headlines, recent uncertainty is taking place, surrounding the United Kingdom Prime Minister Boris Johnson’s victory in the snap election, which is scheduled to happen in December.
Besides that, not only the trade-positive comments from the United States and Chinese officials but the United States administration plan to remove some tariff on Chinese goods looks to support the existing risk-on sentiment. Everything boosts the chances of an incomplete trade deal between the United States and China.
A Labour-party member as the speaker of House of Commons and questions on the Prime Ministers’ performance in the report of Russia interference in British politics looks to hint additional difficulty for the United Kingdom citizen.
However, the British traders will keep their eyes on October month figures of services Purchasing Managers Index from the United Kingdom, ISM Non-Manufacturing PMI, second-tier jobs data, and trade balance will enhance the economic calendar of United States.
Daily Support and Resistance
S3 1.2769
S2 1.2835
S1 1.2858
Pivot Point 1.29
R1 1.2924
R2 1.2965
R3 1.303
GBP/USD– Trading Tips
The GBP/USD hasn’t changed much so far as it continues to trade bullish due to the weaker U.S. dollar. The Cable has outraged the previous resistance level of 1.2930. Now the pair is likely to face fresh resistance around 1.3050 area. Consider staying bullish above 1.2941 today.
USD/JPY – Daily Analysis
The USD/JPY currency pair flashing green and representing 0.17% gains on the day mainly due to positive news came regarding trade. Notably, the pair is currently hit the session highs above 108.77. Whereas the recovery in the pair came from Friday’s lows of 107.89 is bright.
Japanese traders enjoy the heightening chances of the Successful trade deal between the United States and China after a holiday. As of writing, the USD/JPY currency pair takes buying to 108.75.
Besides, it’s not only the trade war-related positive comments from the United States and Chinese officials, but the United States administration plan to remove some tariff on Chinese goods looks to support the existing risk-on sentiment.
As a result, the United States’ ten-year Treasury yields continue the previous run-up to 1.8%, whereas Japan’s NIKKEI climbed 1.5% high at the start of Tuesday trading.
There is another reason behind the pair’s bullish trend, and that’s the support of greenback from the market. It came after the Fridays more than expected Nonfarm Payrolls that ward off Mondays’ adverse Factory Orders. Moreover, the U.S. dollar strong buying could be the new comments from the San Francisco Feds Mary C Daly, who declined the scope of the recession.
Daily Support and Resistance
S3 107.62
S2 108.05
S1 108.33
Pivot Point 108.49
R1 108.76
R2 108.92
R3 109.35
USD/JPY – Trading Tips
The USD/JPY continues to trade bearish with the selling bias due to weakness in the U.S. dollar. The USD/JPY pair broke the bullish channel, which was holding the USD/JPY at 108.800 zones.
Three Black Crows candlestick patterns are suggesting chances of additional selling in the USD/JPY until 107.450 today. On the upper side, resistance is likely to stay at 108.350. Consider taking bearish trades under 108.350 today.
EUR/USD – Daily Analysis
The EUR/USD currency pair found on the bearish outside day candlestick pattern even after the positive news came regarding the United States and China trade progress and seen the risk-on sentiment in the financial markets.
As of writing, the EUR/USD currency pair dropped from 1.1175 to 1.1125 during the Monday and consolidating between the highs and lows. Notably, the bearish outside day candlestick pattern is broadly considered as a sign of a coming bearish reversal.
If the EUR/USD currency pair closes below the level of 1.1125 in today’s trading hour so then the trend reversal would be confirmed. By the way, the currency pair is currently trading at 1.1124, having hit the low of 1.1113 a few minutes ago.
The German economy badly damaged mainly due to the United States and China trade war, sending the Eurozone’s manufacturing powerhouse on the edge of the slowdown. So, the heightened chances of the United States and China makes a trade deal are supportive headlines for Eurozpn and Germany.
The market bought greenback during the Monday and will likely continue to buy more today, possibly due to the decrease of trade tensions that provides the Federal Reserve more opportunity to pause the rate cut series.
Daily Support and Resistance
S3 1.1033
S2 1.1087
S1 1.1105
Pivot Point 1.114
R1 1.1158
R2 1.1194
R3 1.1247
EUR/USD– Trading Tips
The EUR/USD has struck below the double top resistance point of 1.1175 and has lately closed series of neutral candles, which are suggesting chances of a bearish bias until the 1.1175 level gets violated. The pair still stays in the buying zone as the MACD, and RSI value is holding above 0 and 50, respectively. Consider staying bullish above 1.1153 to 1.1180 and 1.1220 today.
What is Range trading?
It is said that the market only trends for 30% of the time. So it becomes necessary to have a range trading strategy to take advantage
What is Range trading?
It is said that the market only trends for 30% of the time. So it becomes necessary to have a range trading strategy to take advantage
What is Range trading?
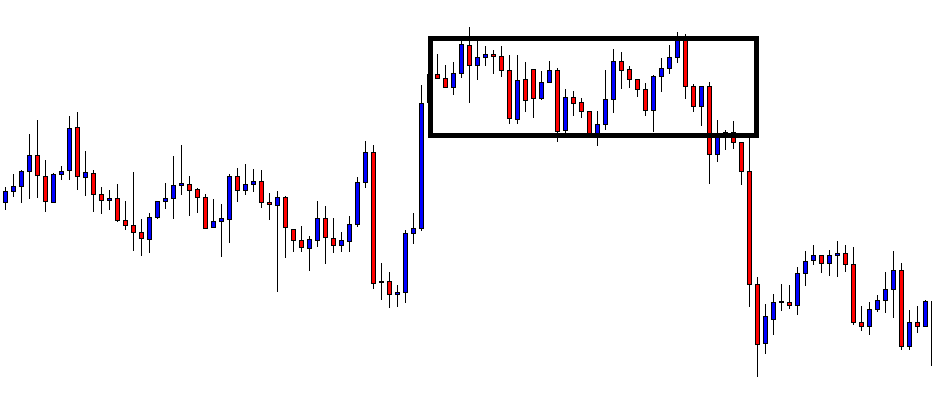
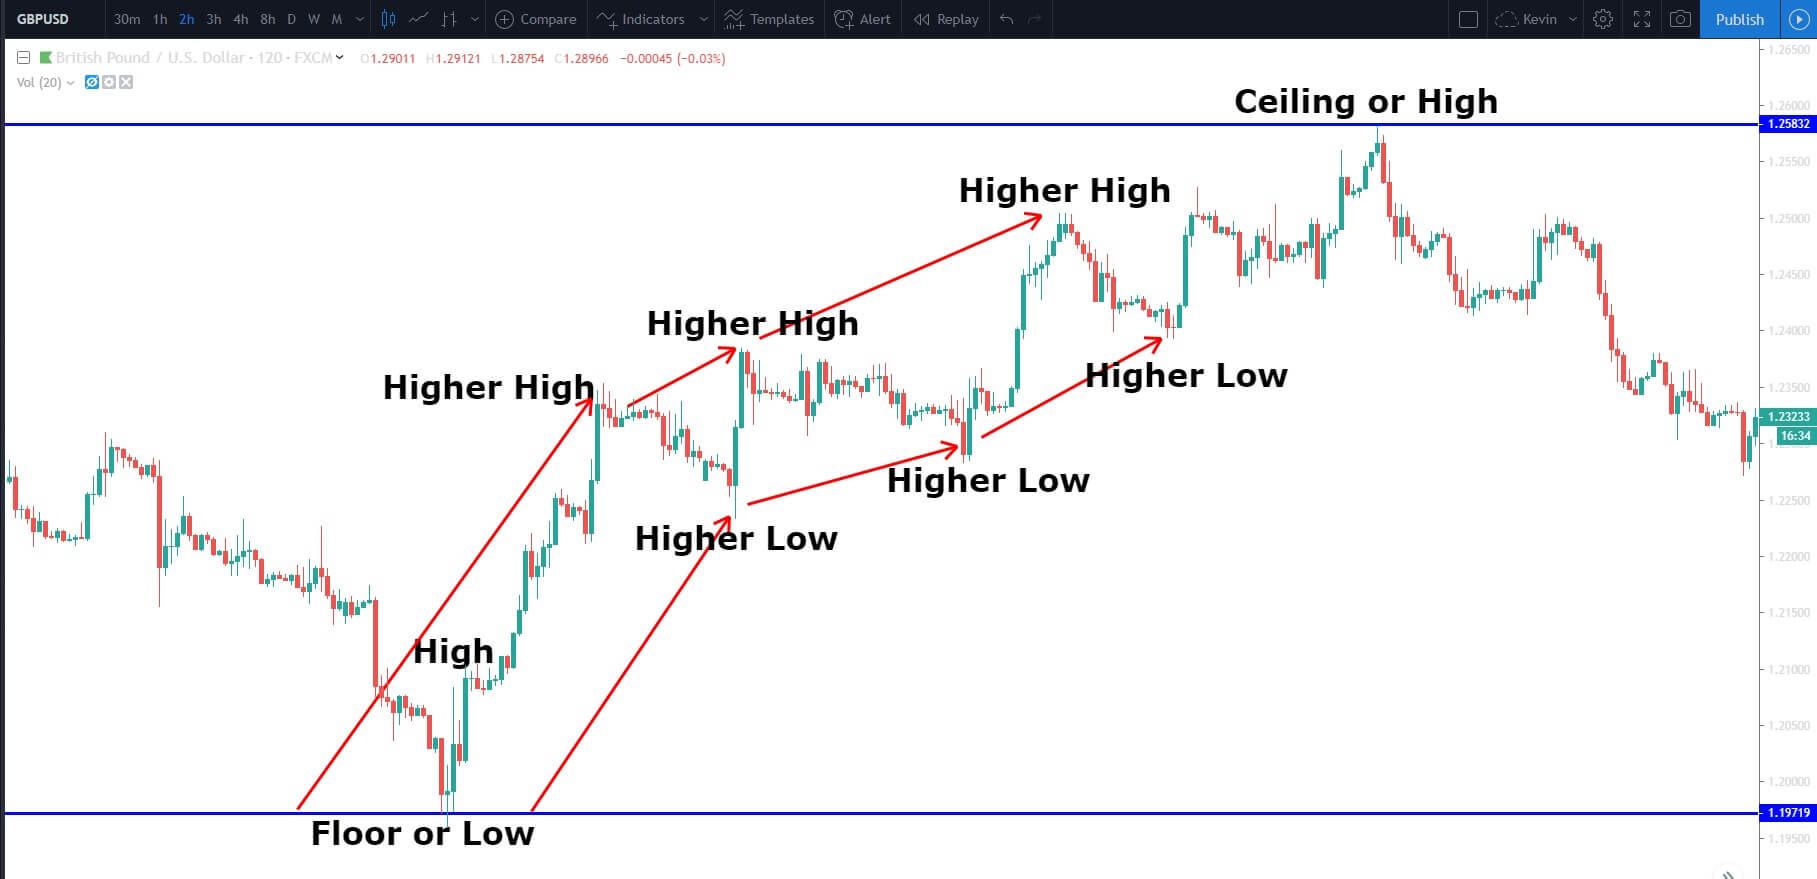
It is said that the market only trends for 30% of the time. So it becomes necessary to have a range trading strategy to take advantage of the other 70% of the time. Range trading is not difficult, but it requires discipline and determination to make most out of it. When a market is trending, it forms a pattern of higher highs and higher lows, in case of an uptrend. The move, in this case, is really strong and is known as an impulsive move. The other type of movement is known as the corrective move, which comes in the form of a pullback. Impulsive moves are stronger than corrective moves.
When the market is making any such moves, it finds itself stuck between a high or low and continues to oscillate between these two points. It means buyers and sellers are equally strong, and this creates a very choppy environment.
Traders now trade these extremes and continue to trade until price breaks out on either of the sides. These two points act as potential support and resistance points, used by traders to place their orders.
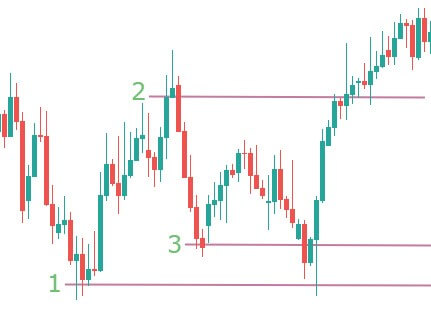
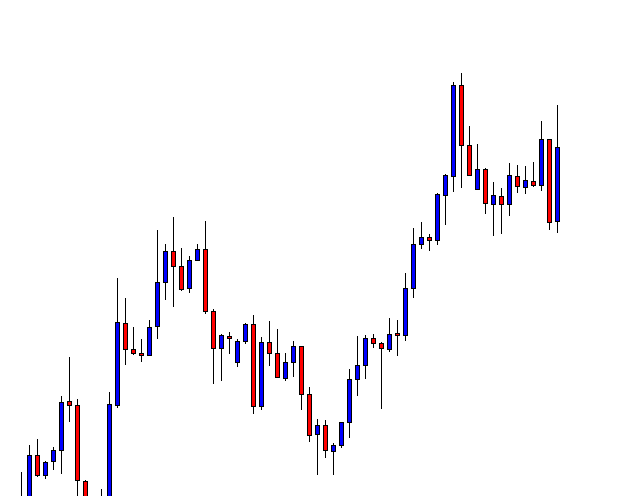
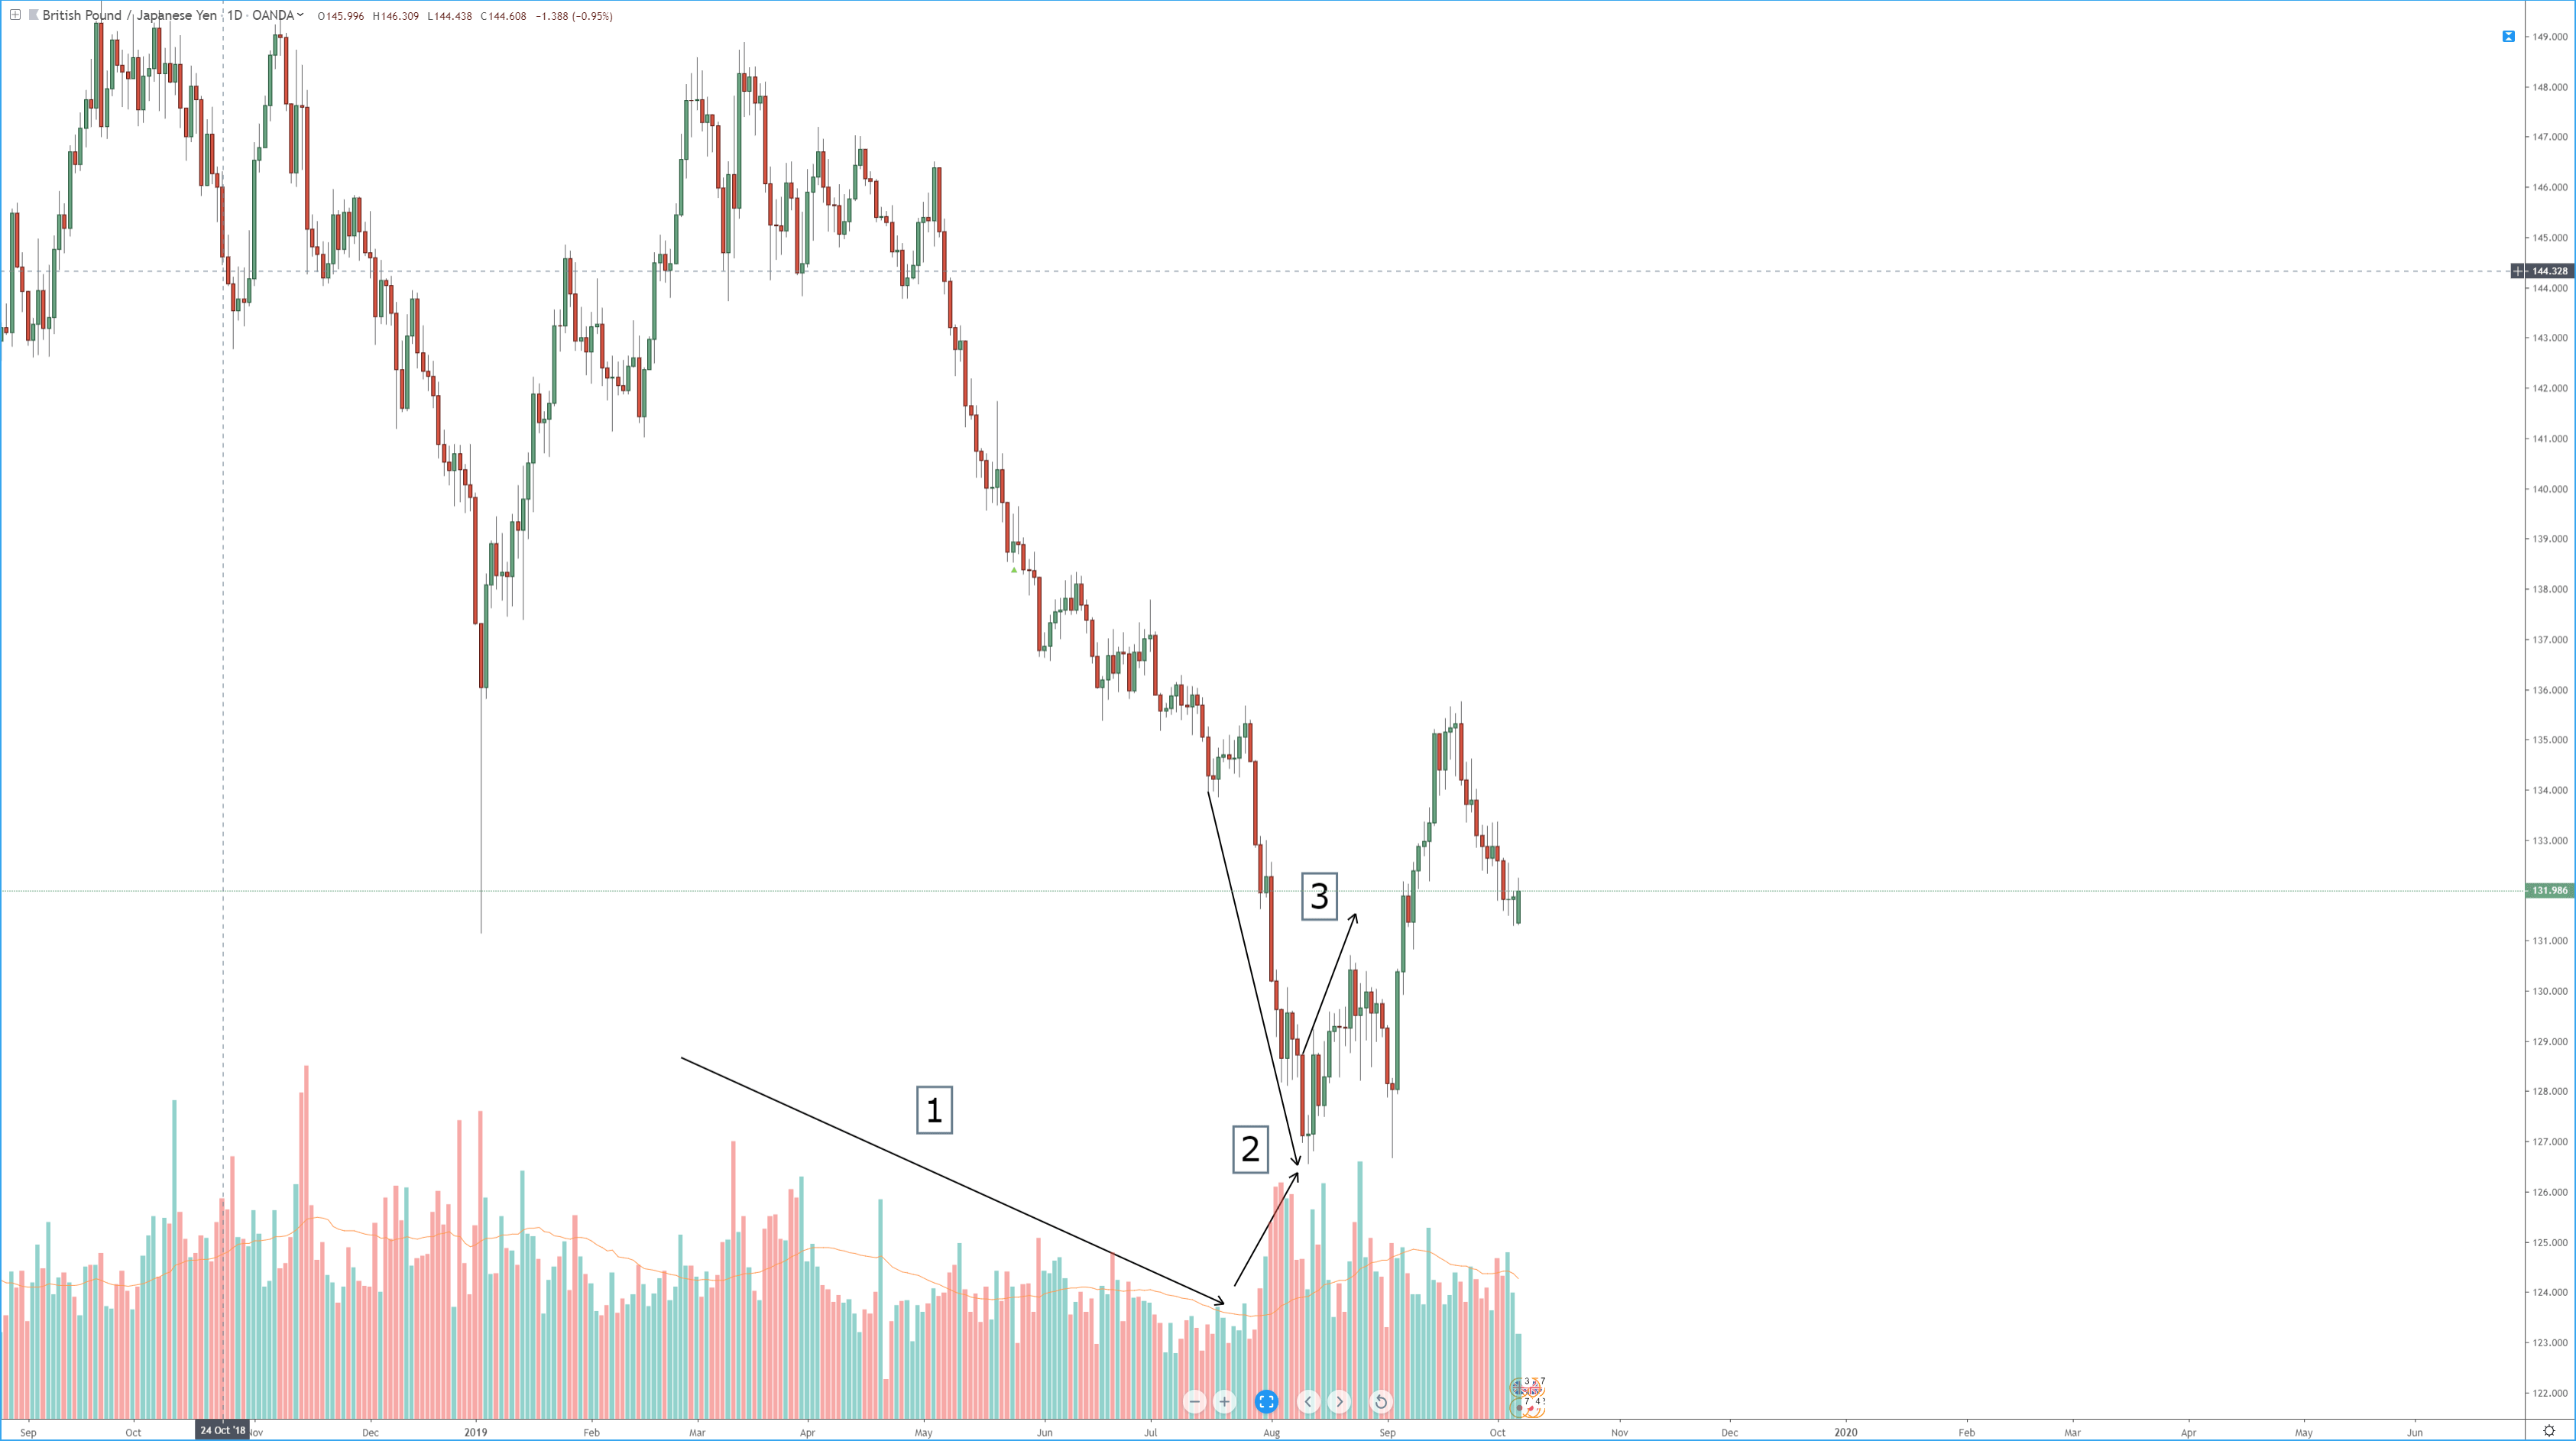
In the above chart, we have drawn a few lines from where the market bounced off. The price action in those areas creates many trading opportunities. The instrument in the chart first trends down and then puts up a low (marked by line 1). Initially, you might think it as a downtrend and expect the pattern of lower lows and lower highs to continue.
Then you see the market rally to line 2, from where the market falls back to line 3 but does not fall till line 1. This highlights the fact that the market is no more trending. The market instead could be stuck in a range between line 1 and line 2. These are not ‘defined’ prices. Always consider them as zones with a margin of error both outside and inside the range. A trader will look to position himself/herself at these zones of support and resistance that forms the range.
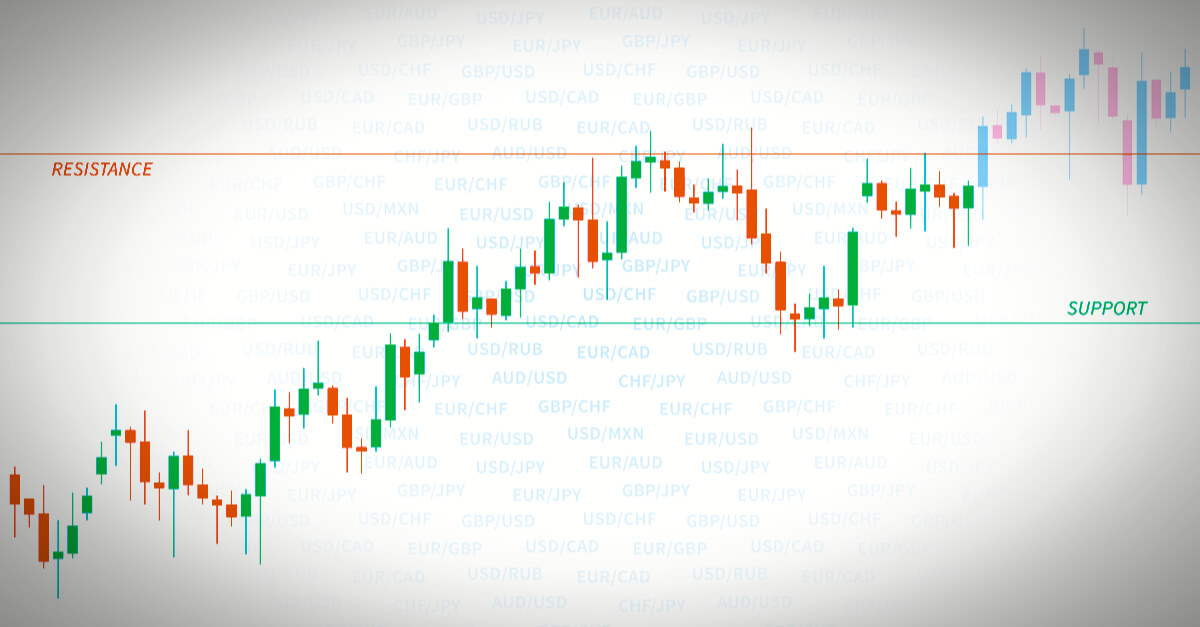
Why support and resistance?
The price that is stuck between these two extremes has a lot of significance. This is because, at this point, the price can either Stop, Reverse, or Breakout. When you have the right knowledge, it will stop you from simply pushing the buttons and will make you trade with a defined strategy.
Range = Consolidation
A range is nothing but a price consolidation of the overall trend move. It could either end the current trend or cause a reversal. The different price behavior pattern in the range creates many trading opportunities, which can be traded by all types of traders, depending on their risk appetite. Now let’s discuss some important trading strategies using support and resistance of ranges.
Strategy Using Technical Indicators
Using technical indicators to trade can aid your trading strategy. Especially while trading ranges, many indicators can be a part of your trading plan. Here, we have used the Stochastic Indicator as a tool to trade the ranges.
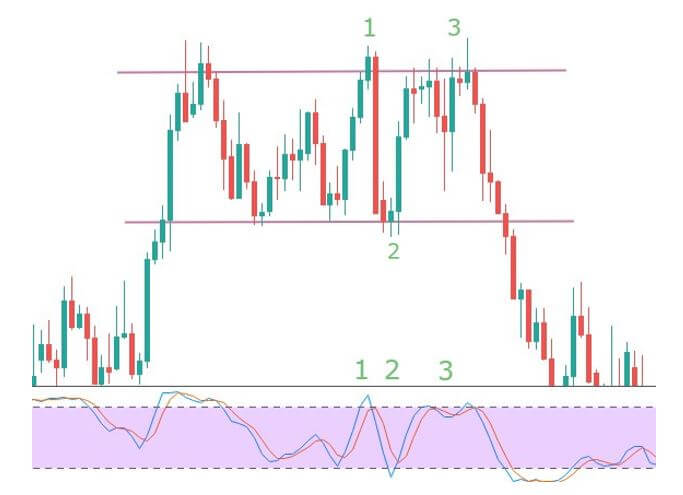
In the above image, the two lines represent the support and resistance of the range formed. When the price reaches the resistance at point 1, the Stochastic enters the overbought area, and the slowdown in momentum is the confirmation signal for a sell. The resistance pushes the price back to support (point 2), but this time the momentum is very strong, hence no entry. The stochastic also does not enter the oversold area clearly. Next time the price goes to resistance with greater momentum, and the Stochastic too does not give an entry signal as it is not in the overbought area. This means one shouldn’t be going short at this point.
Overall, there is only one risk-free trade available in the above chart, and that is at point 1 (short).
Strategy Recap
Firstly, we should be able to see the price at one of the extremes. When that happens, the indicator should show either be at overbought or oversold conditions. The momentum of the price should be an important factor that determines our entry. If we see reversal patterns, this could be the best entry with a good risk to reward ratio. Do not forget to place protective stops much below or above the support and resistance levels, respectively. This will always protect your trades from a false breakout.
When not to buy at support and sell at resistance in ranges
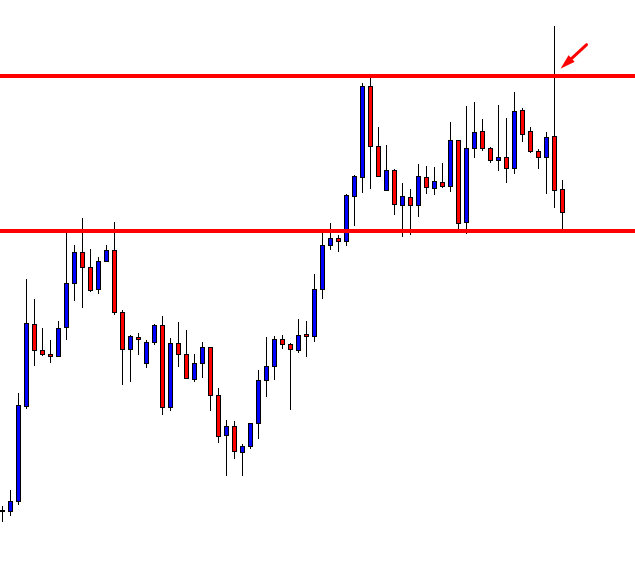
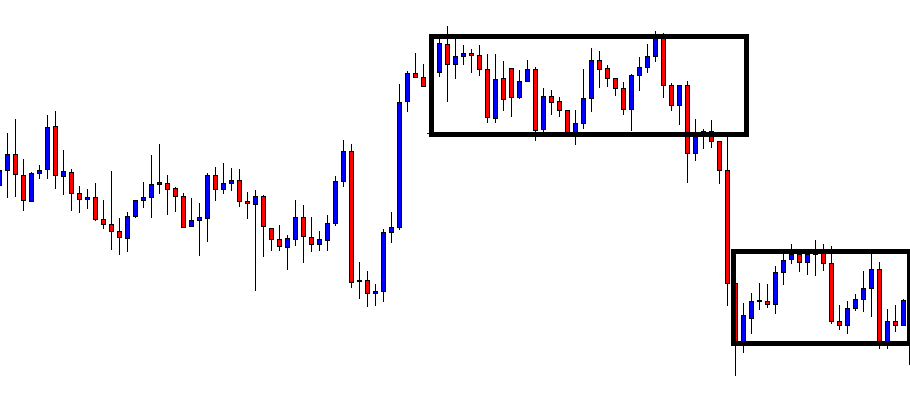
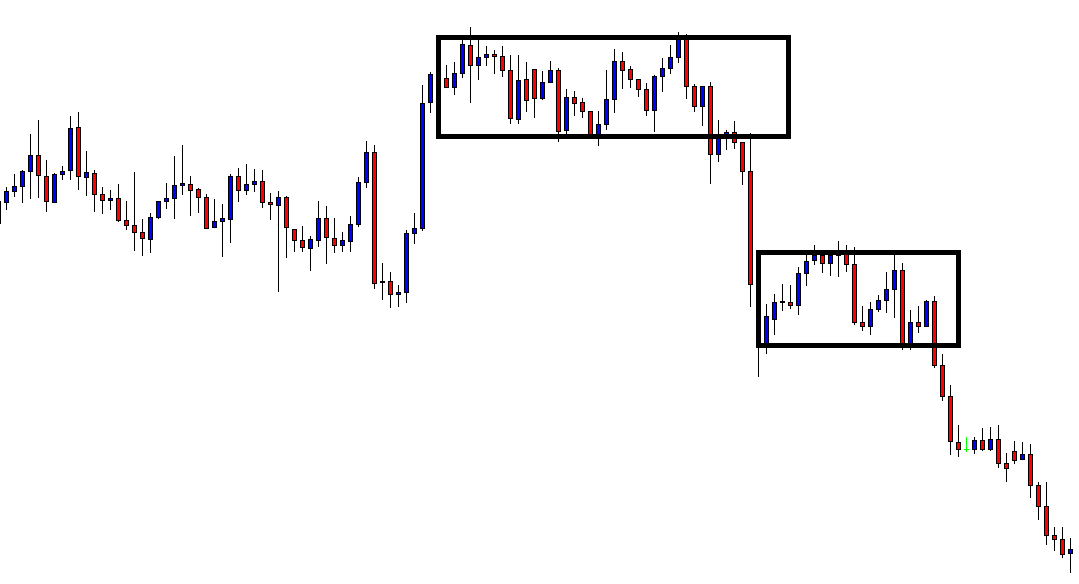
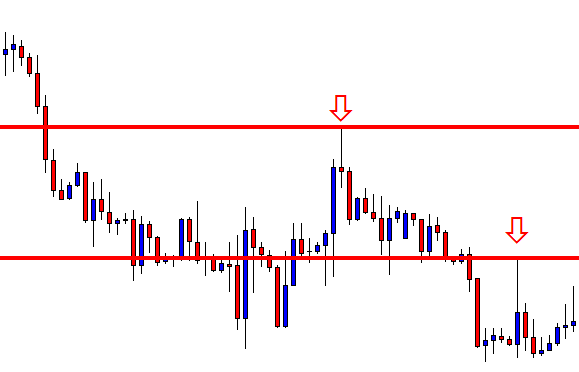
You must have probably heard traders saying that more time a level is tested, the stronger it becomes. This is not true in the case of our range break-out strategy. You need to start paying attention to the price patterns at these ends. If the price has made multiple touches, it could be getting ready for a breakout in the direction of the higher time frame.
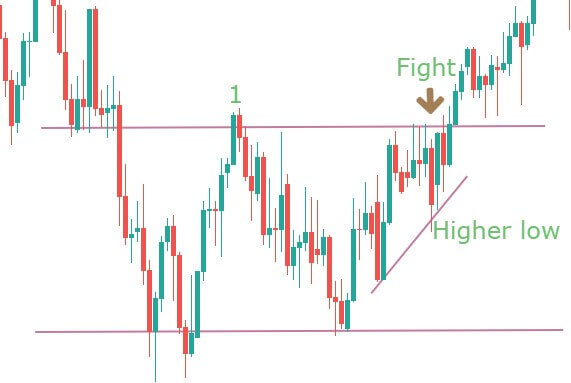
The above chart is an example of such a scenario. It shows a range, and at point 1, you can see the strength in the candle as price pushes towards the resistance area. The next push makes the price to consolidate at the extreme. It appears to be a battle between the bulls and bears. It is also making higher lows as a part of the uptrend. Hence a breakout after this point is not surprising.
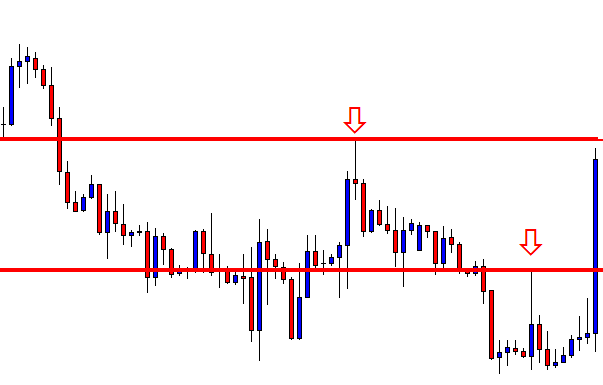
You don’t want to see the higher lows at the resistance extreme and lower highs at the support extreme.
The resistance could still work, and a reversal could happen, but this type of price action does not give much confidence for shorts. Only aggressive traders may find some entry in that consolidation, for a potential long. They can put a protective stop below the higher low that was formed before the accumulation.
We hope you find this strategy informative. Let us know if you have any questions in the comments below. Cheers!
We know using multiple time frames is an essential aspect of trading. Traders use the bigger time frame to find out the trend, breakout, vital support/resistance levels, and relatively smaller
We know using multiple time frames is an essential aspect of trading. Traders use the bigger time frame to find out the trend, breakout, vital support/resistance levels, and relatively smaller
We know using multiple time frames is an essential aspect of trading. Traders use the bigger time frame to find out the trend, breakout, vital support/resistance levels, and relatively smaller time frames to trigger an entry. In this lesson, we are going to learn how the trigger chart can be used as the analyzing chart to find out more entries.
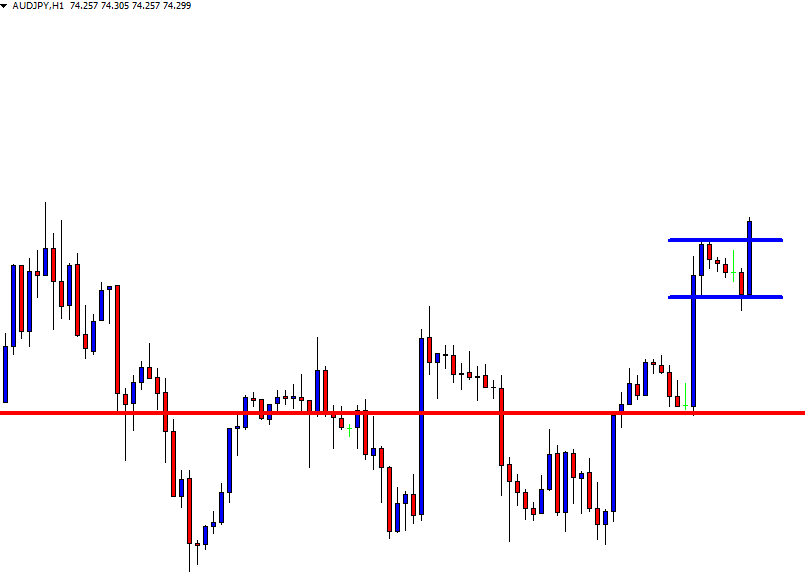
This is a Daily chart, which is being used as the trigger chart. The weekly chart is used as the analyzing chart. It is a combination of Weekly-Daily. The price heads towards the North. Traders are to wait for the price to produce a bullish reversal candle.
A Spinning Top daily candle at a flipped support, the buyers have a lot to be optimistic here. One of the daily candles is to breach the daily resistance to go long on the pair. Let us draw the support and resistance on the chart to get a clearer picture.
This is how the chart looks like with support and resistance levels. If one of the daily candles breaches the resistance with good buying momentum, the daily traders are to trigger a long entry.
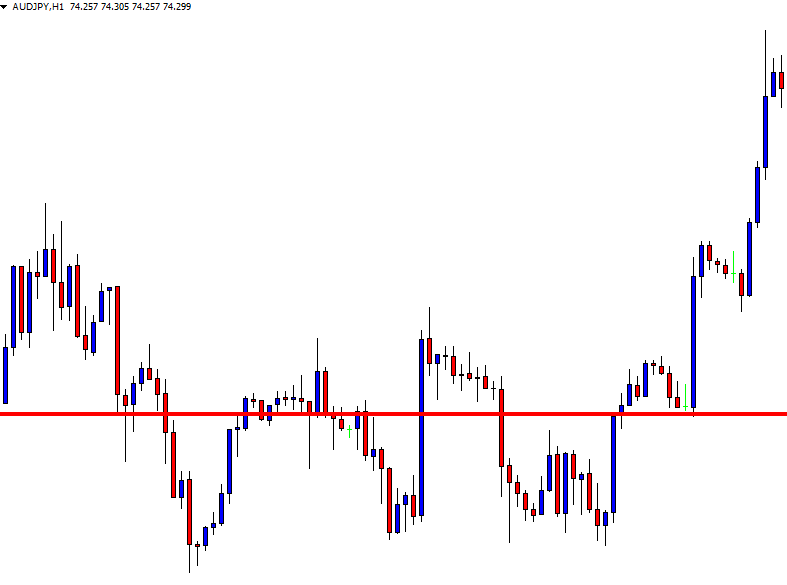
The next daily candle breaches the resistance. The buyer may take a long entry right after the breakout candle closes. An entry on the daily chart means that the trader shall leave the trade/chart for three to four trading days by setting Stop Loss and Take Profit.
However, if a trader uses the same daily chart as the trend-detecting chart and flips over to the H4 chart to find another entry, it surely would be more rewarding.
Let us flip over to the H4 chart.
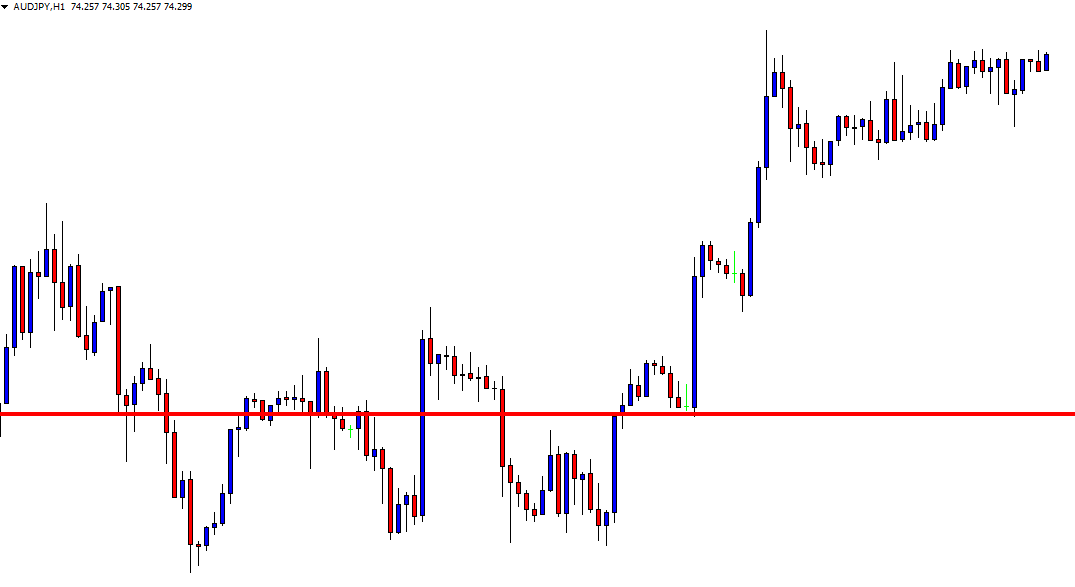
Previously, the daily chart shows an upside breakout. Thus, the trend is bullish. The H4 chart shows that the price starts having consolidation. If the breakout level holds the H4 candles and makes an upside breakout, the H4 buyers are going to go long on the pair as well.
This is the H4 chart with the support and resistance of consolidation. The buyers must wait for an upside H4 breakout to go long on the pair. Let us proceed to the next chart.
Here it comes. An H4 bullish engulfing candle breaches the resistance. The H4 traders may want to trigger a long entry right after the candle closes.
The H4 chart shows the price may have consolidation again. The H4 buyers may want to cash in their profit. However, the entry, which is taken on the daily chart, traders are still to hold their positions until they get a bearish daily reversal candle.
At the end of the day, price action trading works very similarly on the Weekly, Daily, H4, and H1 chart. Today’s examples show that a Weekly-Daily combination offers an entry. After the daily breakout, the Daily-H4 combination offers an entry, as well. With a lot of practice, dedication, and hard work, a trader can trade both of them. This will surely beget more profit.
The Dollar Index slipped 0.2% on the day to 97.12 on Friday, down for a fifth straight session. The euro edged up 0.1% to $1.1167 while the British pound was
The Dollar Index slipped 0.2% on the day to 97.12 on Friday, down for a fifth straight session. The euro edged up 0.1% to $1.1167 while the British pound was
The Dollar Index slipped 0.2% on the day to 97.12 on Friday, down for a fifth straight session. The euro edged up 0.1% to $1.1167 while the British pound was little changed at $1.2935. The Markit U.K. Manufacturing PMI bounced to 49.6 in October (48.2 expected) from 48.3 in September.
USD/JPY rebounded 0.2% from a three-week low to 108.19. USD/CAD fell 0.2% to 1.3136. The Markit Canada Manufacturing PMI climbed to 51.2 in October from 51.0 in September.
Economic Events to Watch Today
Let’s took at these fundamentals.
GBP/USD– Daily Analysis
The GBP/USD currency pair flashing green and found on the recovery track mainly due to increasing optimism regarding the post-December election. As of writing, the cable pair currently trading at 1.2940.
At the time of writing, the GBP/USD pair was traded at 1.2937, up 0.03%, because traders await new ECB head Christine Lagarde’s first official speech, which is scheduled to happen later in the day.
Be it YouGov, Ipsos or Deltapoll suggest a clear lead of the Boris Johnson over the main opposition Labour Party regarding the general election on December 12. However, the United Kingdom Prime Minster Boris Johnson still looks doubtful due to Times mentions that the PM Boris Johnson will remove all fear regarding the no-Brexit deal from the Conservative party manifesto.
Moreover, the announcement came from the U.S. Commerce Secretary Wilbur Ross during the Sunday that the licenses for the American firm to perform business with the blacklisted Chinese Huawei companies will be given very soon. Apart from this, he said that the United States and China already very delayed with phase one of the trade deal, so the agreement will likely be signed very soon.
As we know, there was a little movement in the risk-on market, possibly due to President Donald Trump did not attend the Association of Southeast Asian Nations (ASEAN) summit in Thailand.
Moreover, the market sentiment has been unstable since the start due to the lack of primary data, and the event and Japan market closed as well.
Looking forward, all investors will keep their eyes on the trade and Brexit headlines whereas also keeping the focus on Markit Construction Purchasing Managers Index from the United Kingdom and the United States Facote Orders for September.
Market consensus supports an upbeat print of 44.00 against 43.3 from the British PMI, whereas also expecting the U.S. statistics to decrease further to -0.3% from -0.1% previous.
Daily Support and Resistance
S3 1.2855
S2 1.2901
S1 1.292
Pivot Point 1.2946
R1 1.2966
R2 1.2992
R3 1.3037
GBP/USD– Trading Tips
The GBP/USD hasn’t changed much so far as it continues to trade bullish due to the weaker U.S. dollar. The Cable has outraged the previous resistance level of 1.2930. Now the pair is likely to face fresh resistance around 1.3050 area. Consider staying bullish above 1.2941 today.
USD/JPY – Daily Analysis
The USD/JPY currency pair consolidates in the narrow range near the 108.22, and the pair failed to reach on the bullish track of 100-day EMA as the global risk headlines were entirely in the market for the weekend.
However, the USD/JPY currency pair recently got support from the United States, and China trades positive news because the United States President Donald Trump recently hinted that the round-one of a trade deal would be signed in this month near the U.S.
Moreover, the announcement came from the U.S. Commerce Secretary Wilbur Ross during the Sunday that the licenses for the American firm to perform business with the blacklisted Chinese Huawei companies will be given very soon. Apart from this, he said that the United States and China already very delayed with phase one of the trade deal, so the agreement will likely be signed very soon.
While the United States’ ten-year treasury yield recently declined to multi-weeks lows mainly due to the United States Federal Reserve Bank, Indonesia and Central Bank of Brazil recently announced the 3rd consecutive rate cut in their benchmark rates.
Such as the markets of japan close today due to culture holiday so that investors will keep their focus on the risk catalysts like the United States and China trade-headlines and political plays regarding the Brexit for fresh impulse.
Notably, the risk tone in the market could keep recent recovery mainly due to the positive sentiment regarding trade deal between the United States and China and also due to receding political uncertainty regarding Brexit. However, any negative activity or headlines could be taken very seriously regarding the market’s uncertainty.
Daily Support and Resistance
S3 107.33
S2 107.74
S1 107.96
Pivot Point 108.14
R1 108.37
R2 108.55
R3 108.96
USD/JPY – Trading Tips
The USD/JPY continues to trade bearish with the selling bias due to weakness in the U.S. dollar. The USD/JPY pair broke the bullish channel, which was holding the USD/JPY at 108.800 zones.
Three Black Crows candlestick patterns are suggesting chances of additional selling in the USD/JPY until 107.450 today. On the upper side, resistance is likely to stay at 108.350. Consider taking bearish trades under 108.350 today.
EUR/USD – Daily Analysis
The EUR/USD currency pair flashing green and presently trading at 1.1170, in the wake of the United States and China trade patch-up certainty. Moreover, the EUR/USD pair could take more buying trends, mainly due to confidence surrounding the United States and China.
Whereas, the Shared currency hit the low of 1.1128 during the United States trading session on Friday due to U.S. Nonfarm Payrolls beats forecasted numbers. No Doubt, the decline was short-lived, and the EUR/USD currency pair closed on the bullish track near 1.1165.
So, the EUR/USD currency pair least resistance level is on the bullish range. Whereas, the pair’s bullish sentiment could be increased due to the United States and China trade optimism and the resulting risk-on in the equities.
An announcement came from the U.S. Commerce Secretary Wilbur Ross during the Sunday that the licenses for the American firm to perform business with the blacklisted Chinese Huawei companies will be given very soon. Apart from this, he said that the United States and China already very delayed with phase one of the trade deal, so the agreement will likely be signed very soon.
It should be noted that the Eurozone’s manufacturing powerhouse has got a big hit in the wake of the Sino-US trade war. Therefore, trade certainty between the United States and China could support the German economy and the EUR currency.
As of data, the final Manfutring PMI figures are scheduled to release across the EurozoneEurozone. Moreover, the Eurozone’s Sentix Investor Confidence for November is expected to release at 09:30 GMT, may leave any impact on the currency pair. Across the pond, the ISM-NY Business Conditions Index (Oct) and Factory Orders (Sep) data are scheduled for release.
Daily Support and Resistance
S3 1.1067
S2 1.1111
S1 1.1138
Pivot Point 1.1155
R1 1.1182
R2 1.1199
R3 1.1243
EUR/USD– Trading Tips
The EUR/USD has struck below the double top resistance point of 1.1175 and has lately closed series of neutral candles, which are suggesting chances of a bearish bias until the 1.1175 level gets violated. The pair still stays in the buying zone as the MACD, and RSI value is holding above 0 and 50, respectively. Consider staying bullish above 1.1153 to 1.1180 and 1.1220 today.
Introduction
Japan’s capital Tokyo, is the most majorly traded market in the Asian continent. That is, in Asia, the highest volume comes from the Tokyo market. In fact, it is
Introduction
Japan’s capital Tokyo, is the most majorly traded market in the Asian continent. That is, in Asia, the highest volume comes from the Tokyo market. In fact, it is
Introduction
Japan’s capital Tokyo, is the most majorly traded market in the Asian continent. That is, in Asia, the highest volume comes from the Tokyo market. In fact, it is considered the financial capital of Asia. Moreover, it is the third-largest trading center in the world.
The Tokyo session, also referred to as the Asia session, opens at 8:00 PM EST and is traded until 5:00 AM EST. In terms of Japan’s local time, the trading happens between 9:00 AM to 6:00 PM. As ‘Yen’ is the currency of Japan, 16.50% of all the Yen transactions take place during this time. And as far as all currency transactions are concerned, the value lies at 21%.
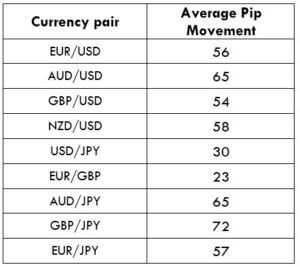
The one that matters the most during any session is the pip movement in different pairs. Below is a table which represents the average pip movement for some of the major currency pair.
Now, the average of the above currency pairs turns out to be around 53 pips. This number is less when compared to the New York session and the London session.
Some facts about trading the Tokyo session
During this session, the market is seen to fade away its momentum. That is, the market is seen to be quite flat. In technical terms, the market usually goes through a consolidation state. This session might not be the ideal session for the ones looking for large pip movement. However, this session can be great for scalpers.
Tokyo market typically is known to correct the overbuying and selling in the New York session. The market makes drastic moves during the NY session and comes to slows down its pace during the Tokyo session. Therefore, the liquidity during this session is quite feeble.
It is not just the central banks and hedge funds that move the market. Since Japan is the largest exporter in the world, a large number of transactions come from the exporters as well.
Also, the Bank of Japan is an active participant in the forex market during the Tokyo session. This is because it intervenes the curb appreciation in the Yen regularly.
Which currency pairs should you focus on?
The market conditions and situations tend to change from time to time, so it becomes uncertain to predict the exact movement of pairs. However, if we were to consider the average rates, we can keep an eye on the news from countries like Australia, New Zealand, China, and Japan. The news from these countries comes during the Tokyo session or just before its open. And the news usually pumps up the volatility and liquidity of the market. Hence, one can have a focus on AUD, NZD, and JPY pairs.
When the Tokyo session comes to an end, the London markets open, which causes overlap between the two sessions. So, to be part of the significant movements, keep an eye on GBP, EUR, and CHF along with AUD, NZD, JPY, and USD.
This is a brief review of the Tokyo session. We shall discuss the other sessions as well in the upcoming lessons. Take the below quiz to know if you have learned the concepts right.
Price action traders consider the breakout as one of the most important factors. It is, once it is confirmed. However, momentum, overall psychology are essential aspects of breakout that less
Price action traders consider the breakout as one of the most important factors. It is, once it is confirmed. However, momentum, overall psychology are essential aspects of breakout that less
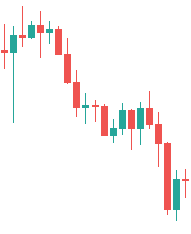
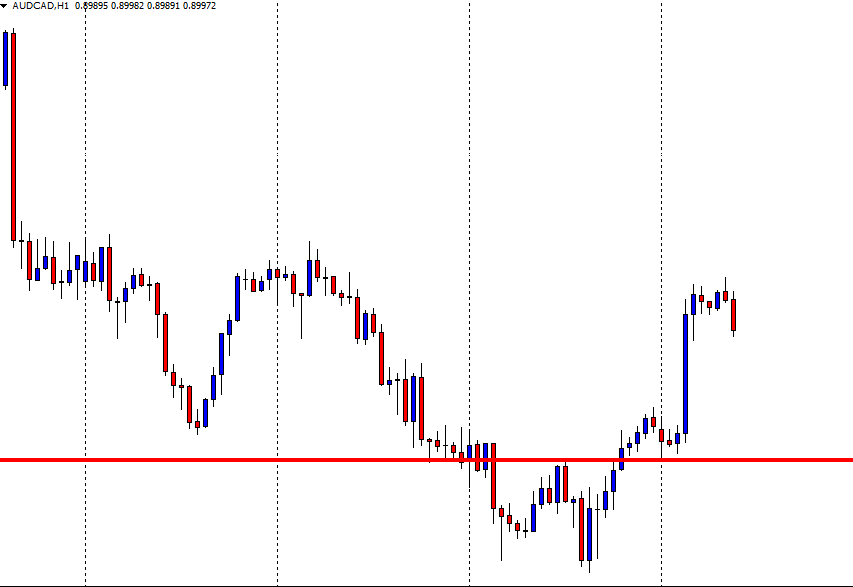
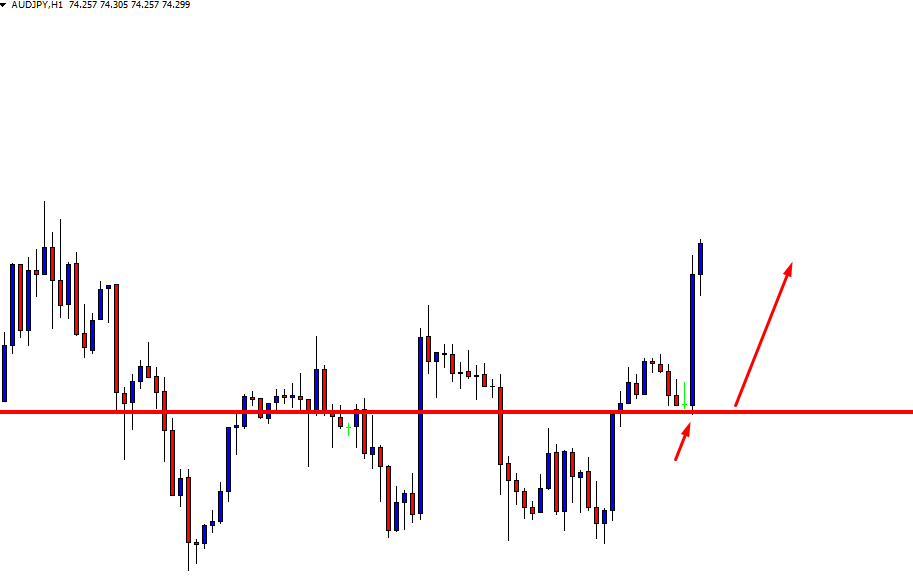
Price action traders consider the breakout as one of the most important factors. It is, once it is confirmed. However, momentum, overall psychology are essential aspects of breakout that less experienced traders often misapprehend. In this lesson, we are going to demonstrate an example of a breakout with less momentum. Let us get started.
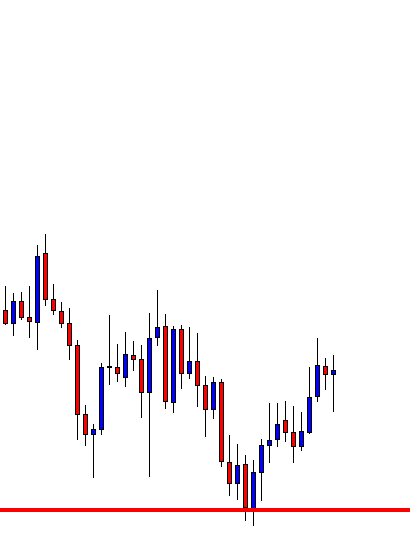
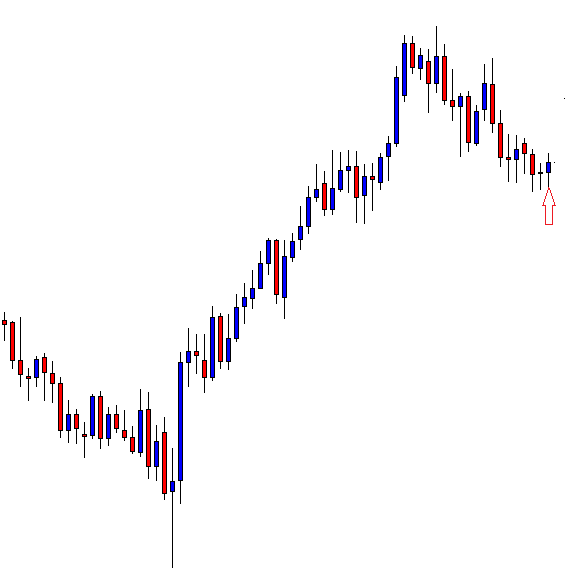
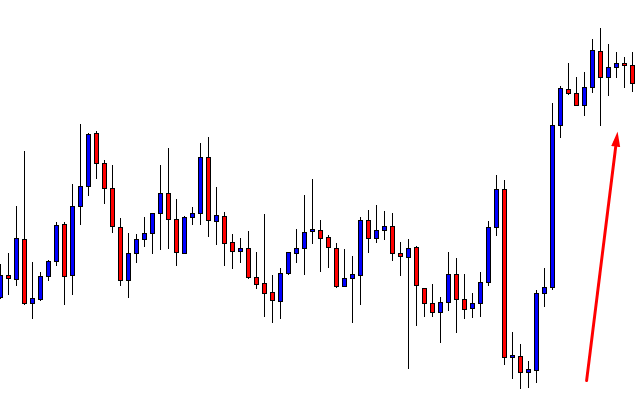
The chart shows that the price is up trending with good buying pressure. The price makes a breakout at the last swing. This is an ideal chart for the buyers to look for buying opportunities. They are to buy the pair on the pullback. Let us proceed to the next scene.
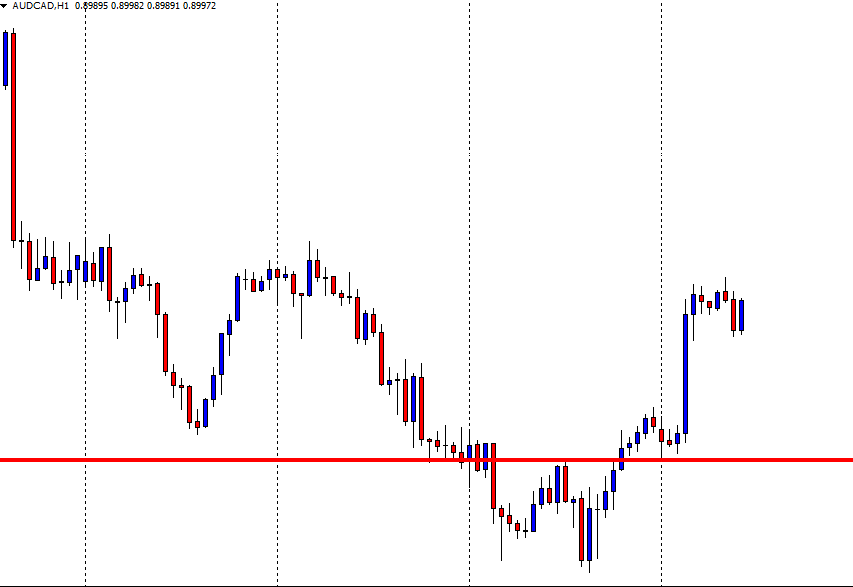
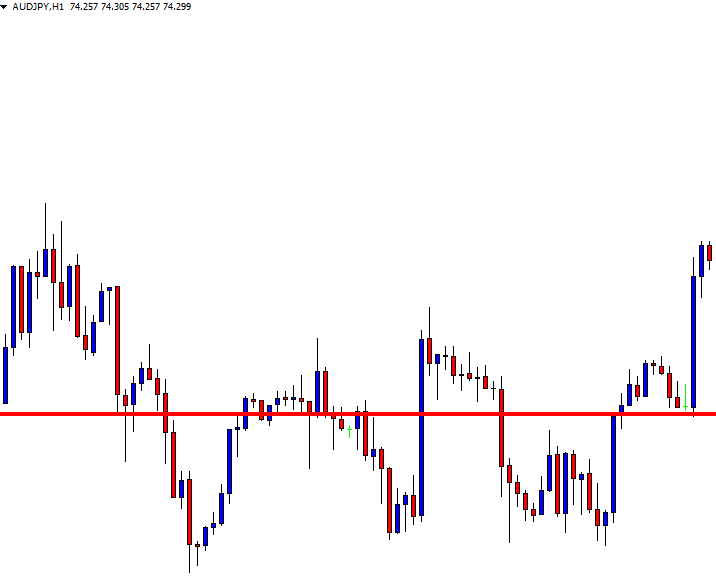
The price starts having a correction and comes back up to the breakout level (the last swing high). It produces an engulfing candle, which is a strong sign that it may keep going towards the upside, makes a breakout, and offers a long entry.
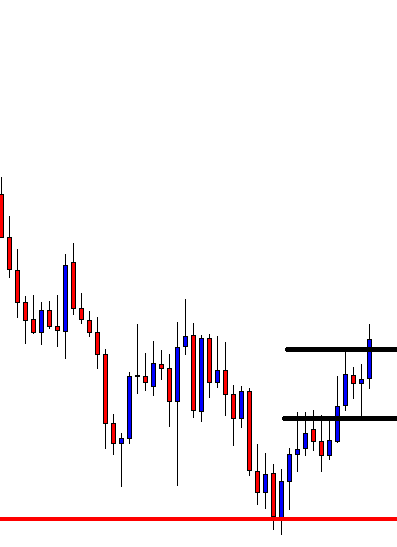
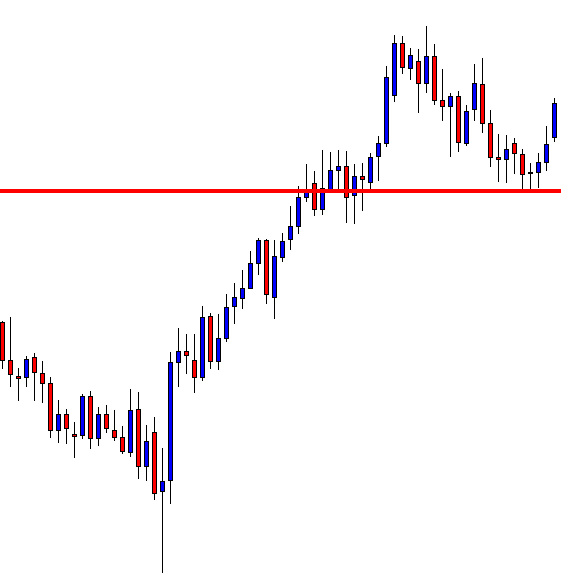
The price does not find a strong buying momentum. It goes towards the upside and comes back again to the support. It seems the buyers may have to wait longer than they thought.
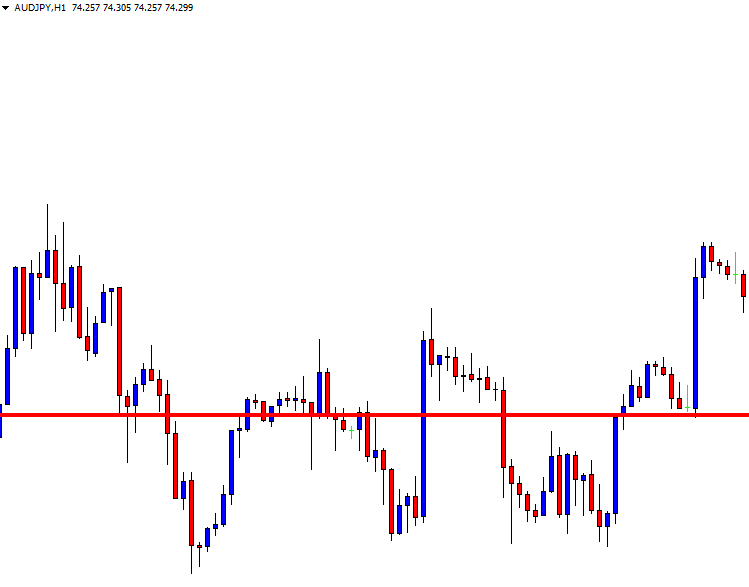
Things look a bit different now. Rather than making an upside breakout, it has a strong rejection at the resistance. The support is being tested again.
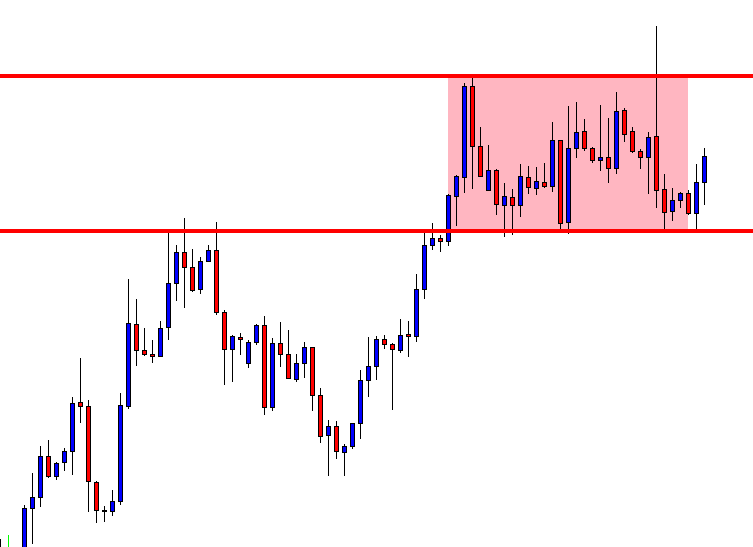
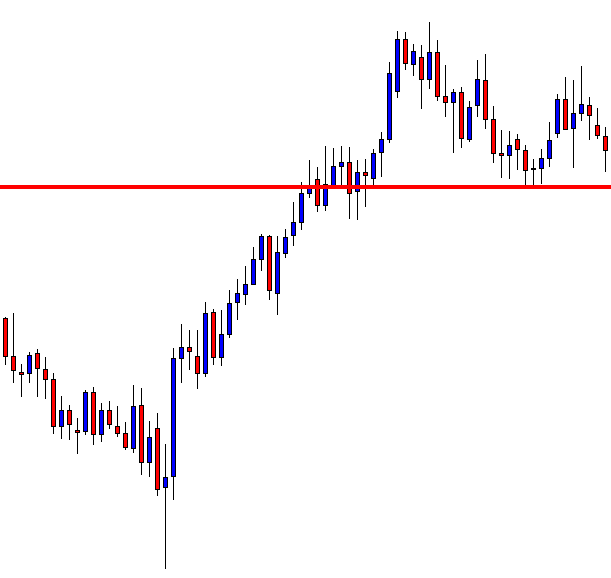
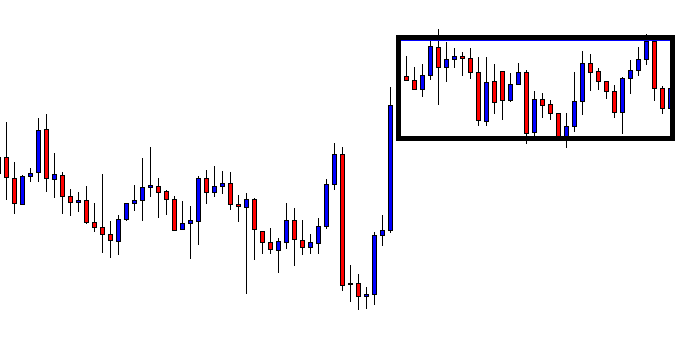
No downside breakout, but the support holds the price. The price gets caught within two horizontal levels. To be precise, the price gets caught within a rectangle. Ideally, both the sellers and the buyers love to keep this chart in their watch list; get a breakout at either side to take an entry.
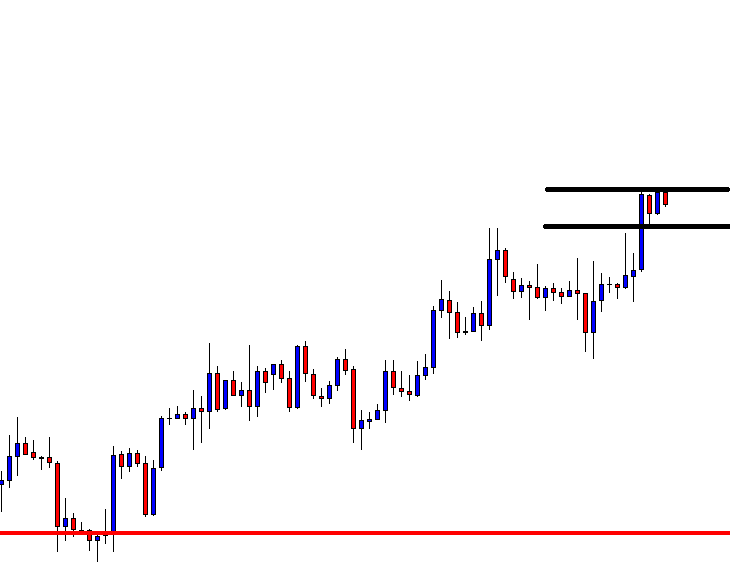
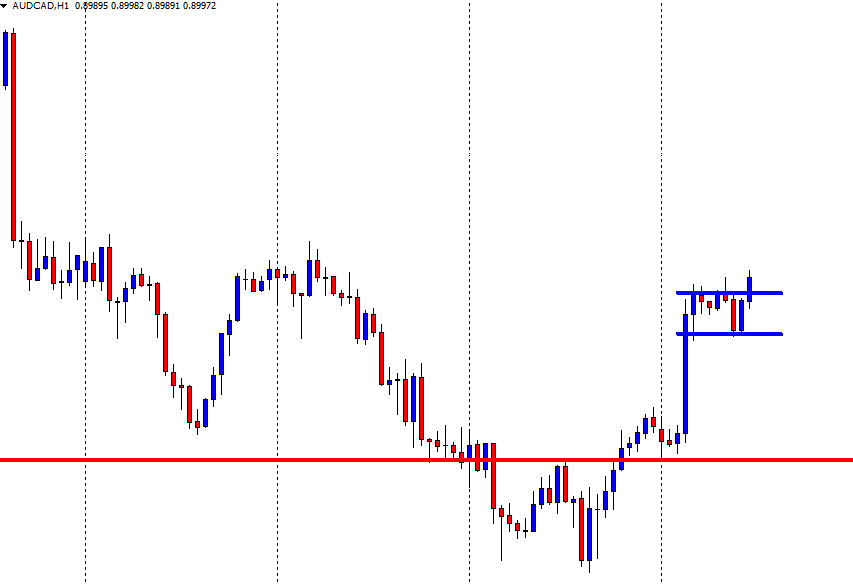
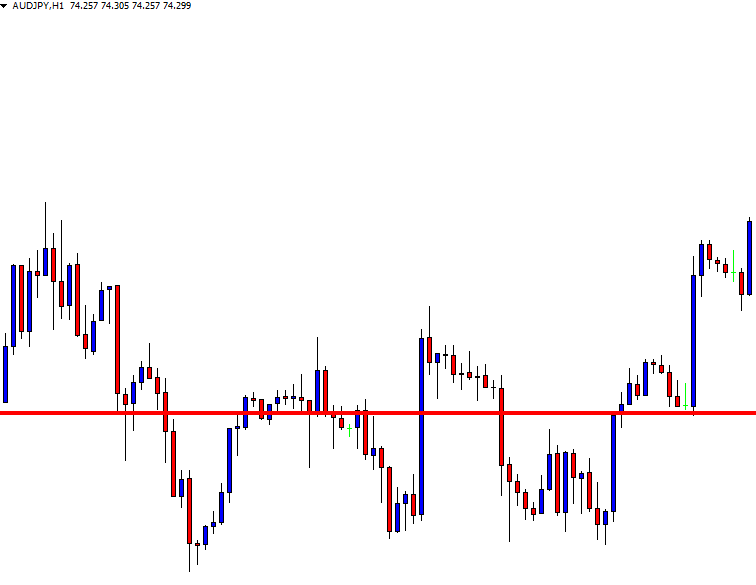
Two consecutive bullish candles right at the support suggest that the buyers have the upper hand. The buying momentum looks good here. If it continues going towards the upside and makes a breakout, the buyers may dominate here. Let us see what happens next.
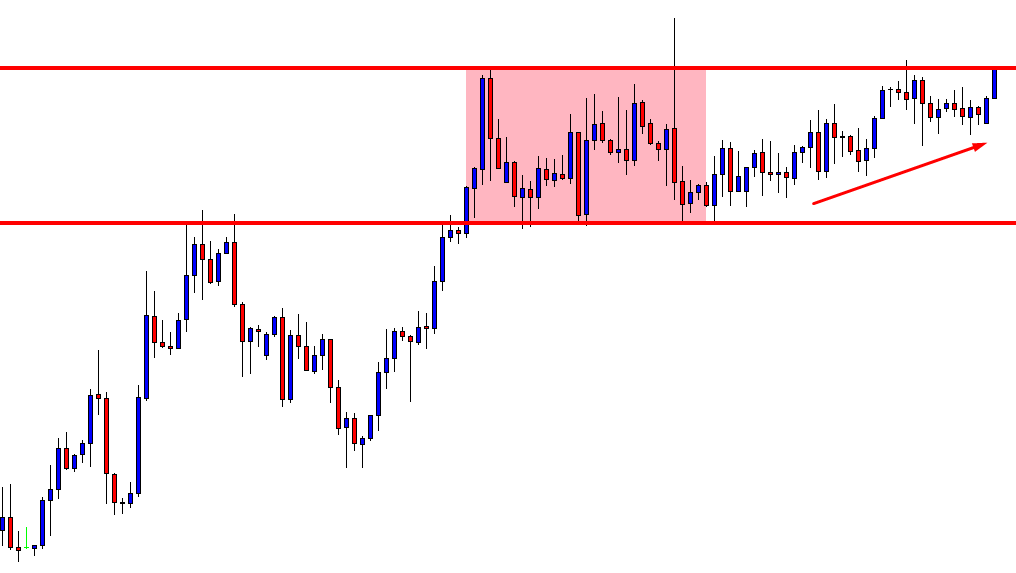
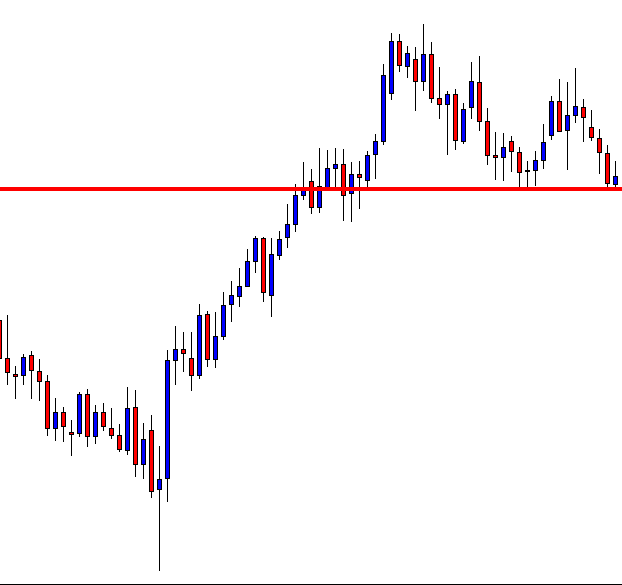
Oh no, the price heads towards the North with less buying pressure. The bullish move has much less speed than the last bearish move. This sort of price action usually makes the price have another bearish move and head towards the support. Let us find out what happens next.
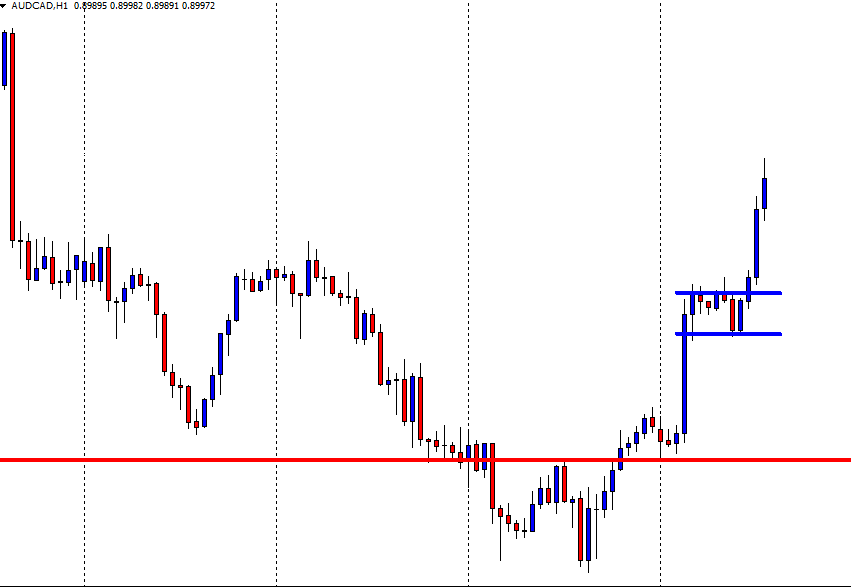
An upside breakout this is! After the breakout, if the price consolidates and makes another bullish move from the breakout level, it would be a buying market again. However, the question is whether it makes the buyers interested in buying or not.
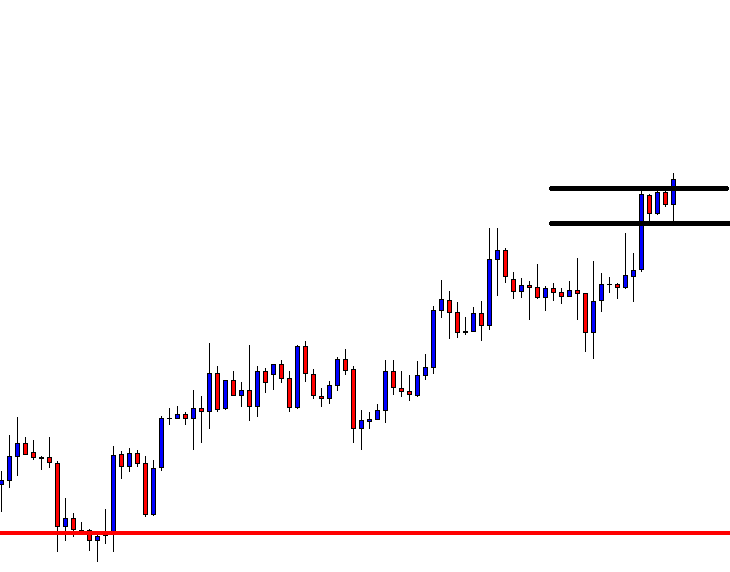
The last bullish wave does not have the drive.
The resistance level is strong
Let us find out what happens next.
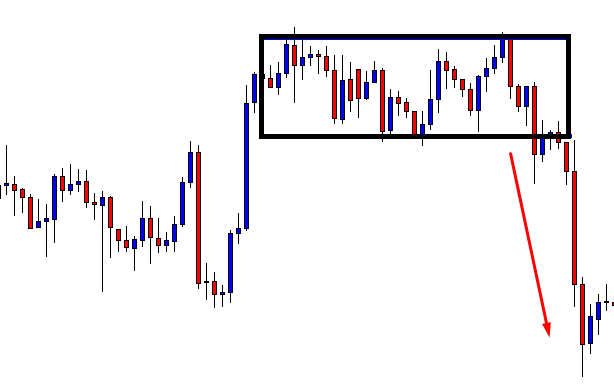
It does not produce a bullish reversal after the breakout. Instead, it comes back in. The breakout is not valid anymore. What may have been a strong buying market has become a choppy market again.
The Bottom Line
The breakout may have offered us entry if it produces a bullish reversal candle at the breakout level. That does not happen. We cannot precisely tell why that happens here. However, the less momentum to begin the potential trend is one of the reasons among many. It represents that psychologically, the buyers are not confident about the breakout and continuation, which makes that a nullified breakout in the end.
The U.S. dollar weakened further Thursday, amid uncertainties over a long-term U.S.-China trade deal and impeachment inquiry into President Trump. The ICE Dollar Index slid 0.2% on the day to
The U.S. dollar weakened further Thursday, amid uncertainties over a long-term U.S.-China trade deal and impeachment inquiry into President Trump. The ICE Dollar Index slid 0.2% on the day to
The U.S. dollar weakened further Thursday, amid uncertainties over a long-term U.S.-China trade deal and impeachment inquiry into President Trump. The ICE Dollar Index slid 0.2% on the day to 97.30, posting a four-day decline.
The euro edged up 0.1% to $1.1157. Official data showed that the eurozone third-quarter GDP grew 1.1% on the year, and CPI rose 0.7% on year in October, both were in-line with estimates.
The British pound advanced 0.3% to $1.2938. Later today, the Markit U.K. Manufacturing PMI for October will be released (48.2 expected).
Economic Events to Watch Today
Let’s took at these fundamentals.
GBP/USD– Daily Analysis
The GBP/USD currency pair flashing green and consolidates near the recent gains to 1.2930 by the press time. Notably, the GBP/USD currency pair currently awaits the early-month data from the United States and the United Kingdom to extend the recent bullish moves beyond 8th-day tops.
As we all well aware that these days confirmed to be most damaging for the U.S. Dollar against the bucket of currencies, therefore the traders of U.S. Dollar await for fresh clues.
The main reasons behind the greenback weakness are a rate cut, which is delivered by the Federal Reserve for the 3rd time back to back during this year, and apart from this, the rising uncertainty between the United States and China trade matter and china joined mixed data from the United States.
At the GBP front, the British got support from the increasing possibilities of the United Kingdoms present Prime Minster Boris Johnson to continue to his post after the snap elections during the December. Also, there were strong expectations regarding the pair’s bullish trend as the United Kingdom Prime MInster Boris Johson has strong relations with the United States and can be trusted for good trade relations in the future.
At the data front, all eyes will be on October month Market Manufacturing Purchasing Manager Index (PMI) from the U.K. and employment stats, ISM Manufacturing PM. We look for the manufacturing PMI to increase from 48.3 to 48.9 during October, supported by inventory building ahead of the (at the time of the survey) Brexit deadline of October 31.
Regarding the U.S. Nonfarm Payrolls (NFP), “U.S. Oct non-farm payrolls are anticipated to increase by 85,000 with the General Motors strike and decrease in census workers both a drag on headline employment increases. The jobless rate is seen to edge back up to 3.6% from a 50 year low 3.5%, and average hourly earnings growth is anticipated to stabilize at 3.0%yr after Sep’s sudden fall to 2.9%yr from 3.2%yr during August.
Daily Support and Resistance
S3 1.2821
S2 1.2881
S1 1.2906
Pivot Point 1.2941
R1 1.2966
R2 1.3001
R3 1.3062
GBP/USD– Trading Tips
The GBP/USD hasn’t changed much so far as it continues to trade bullish due to the weaker U.S. dollar. The Cable has outraged the previous resistance level of 1.2930. Now the pair is likely to face fresh resistance around 1.3050 area. Consider staying bullish above 1.2941 today.
USD/JPY – Daily Analysis
The USD/JPY currency pair flashing red and dropped from the high of 108.90 and just below the 200-day Moving Average, mainly due to report regarding trader war. Thus, investors were cautious and uncomfortable in the wake of news in which China said that we still open to continue trade talks after the first phase.
Notably, the benchmarks on Wall Street were stepped back from its highs due to the report that stated that Chinese legislators are spreading uncertainties regarding the matter of making a comprehensive long-term trade deal with the United States, even as both sides are close to reached on the trade deal.
Overall, the United States’ two-year treasury yields subsequently dropped from 1.62% to 1.52%, whereas the ten-year yield fell from 1.78% to 1.68%. After yesterday’s Federal Reserve interest rate cut and statement, markets were pricing in a Federal Reserve rate of 1.50% at the December conference and a terminal rate of 1.15% against 1.63% currently.
Daily Support and Resistance
S3 106.63
S2 107.43
S1 107.73
Pivot Point 108.23
R1 108.52
R2 109.02
R3 109.82
USD/JPY – Trading Tips
The USD/JPY continues to trade bearish with the selling bias due to weakness in the U.S. dollar. The USD/JPY pair broke the bullish channel, which was holding the USD/JPY at 108.800 zones.
Three Black Crows candlestick patterns are suggesting chances of additional selling in the USD/JPY until 107.450 today. On the upper side, resistance is likely to stay at 108.350. Consider taking bearish trades under 108.350 today.
EUR/USD – Daily Analysis
EUR/USD pair overall sentiment is bullish. But as for now, the EUR/USD currency pair consolidates in the narrow range near the 1.1170 after the post-EMU data releases in the Euroland.
As of writing, the EUR/USD currency pair bullish trend is still strong and well sound, mainly after the advanced inflation figures in the Euroland. Also, headline consumer prices are anticipated to increase at an annualized 0.7% from 0.8% while Core prices are also rose somewhat to 1.1% from 1.0.
Moreover, the flash GDP numbers observe the economy in the bloc expanding 1.1% every year from 1.2% during the July and September month
Whereas, the consecutive weakness in the U.S. dollar still support the EUR/USD currency pair while resumed trade concerns raised recently due to the Chinese officials remain doubtful on the long term trade deal with the United States.
On the technical side, the EUR/USD currency pair is rose by 0.19% at 1.1171 and faced the high resistance barrier at 1.1179 (monthly high Oct.21) seconded by 1.1186 (61.8% Fibo of the 2017-2018 rally) and finally 1.1197 (200-day SMA). At the bearish front, the breakdown of 1.1072 (low Oct.25) would target 1.1042 (55-day SMA) en route to 1.0925 (low Sep.3).
Such as, the EUR currency has succeeded in recovering the bullish monthly range, mainly due to the continued selling pressure in the Greenback.
On the other hand, the chances that the German economy may move into recession in Q3 remains an obvious risk for the outlook and is expected to send EUR currency down for the short and medium-term range.
Daily Support and Resistance
S3 1.1064
S2 1.1109
S1 1.113
Pivot Point 1.1153
R1 1.1175
R2 1.1197
R3 1.1242
EUR/USD– Trading Tips
The EUR/USD has struck below the double top resistance point of 1.1175 and has lately closed series of neutral candles, which are suggesting chances of a bearish bias until the 1.1175 level gets violated. The pair still stays in the buying zone as the MACD, and RSI value is holding above 0 and 50, respectively. Consider staying bullish above 1.1153 to 1.1180 and 1.1220 today.
Indicators are a useful tool that can aid in supporting the analysis process. In this educational article, we will review the Awesome Oscillator and how it can help us in
Indicators are a useful tool that can aid in supporting the analysis process. In this educational article, we will review the Awesome Oscillator and how it can help us in
Indicators are a useful tool that can aid in supporting the analysis process. In this educational article, we will review the Awesome Oscillator and how it can help us in an Elliott Wave study.
The basics
The Awesome Oscillator (AO) is also known as the Elliott Wave oscillator, was developed by Bill Williams. The AO measures the immediate momentum of the five previous periods, compared with the momentum of the last 34 periods.
The calculation is based on the simple moving average of the midpoint (HL / 2) of 34 periods minus the simple moving average of the midpoint of 5 periods.
Elliott Wave and the Awesome Oscillator
The following chart corresponds to the Johnson and Johnson (NYSE:JNJ) weekly chart. The bullish motive wave started with the August 2015 low at $128.51 per share. From this low, JNJ began to a bullish sequence, which drove it to reach the $148.32 level.
From the AO oscillator, we can recognize the following elements of the price action:
Trend bias: If the trend is bullish, the AO will be positive. If it is bearish, the oscillator will move on the negative side. For our example, the market direction of the range of time studied corresponds to a bullish trend.
Wave three: We can identify wave three with the most prominent distance of the AO. From the JNJ example, we distinguish a wave (3) of Intermediate degree labeled in black. At this point, the stock reached $125.90 per share. After this peak, JNJ started a corrective sequence, and the oscillator began to decrease, even moved in the negative side.
Wave five: In the same way as the third wave, we can recognize the fifth wave watching the AO because momentum follows the dominant trend. However, in this segment, the oscillator shows a divergence between the peaks of waves three and five. In our example, JNJ ended the wave (5) on the half of January 2018 at $148.32 per share. We can observe the bearish divergence between the price and the oscillator.
Corrective waves: We can use the AO to identify corrective waves watching how it decreases against the prevailing trend. From the JNJ chart, the oscillator turns negative when the price develops a retracement.
In summary, the Awesome Oscillator can be a useful tool to complement the EW analysis, especially in wave identification. A divergence involves the exhaustion of the movement, but the price is not compelled to reverse the trend.
Price action traders combine multiple time frames to trade. In most cases, they use a time frame to determine the trend and use the next one to trigger an entry.
Price action traders combine multiple time frames to trade. In most cases, they use a time frame to determine the trend and use the next one to trigger an entry.
Price action traders combine multiple time frames to trade. In most cases, they use a time frame to determine the trend and use the next one to trigger an entry. The most important factor in using multiple time frames is the combination. Usually, the combinations are Daily Chart with H4 Chart, H4 Chart with H1 Chart, H1 Chart with 15M Chart, and 15M Chart with 5M Chart. In today’s lesson, we are going to demonstrate an example of the combination of Daily and H4 Chart produces an entry.
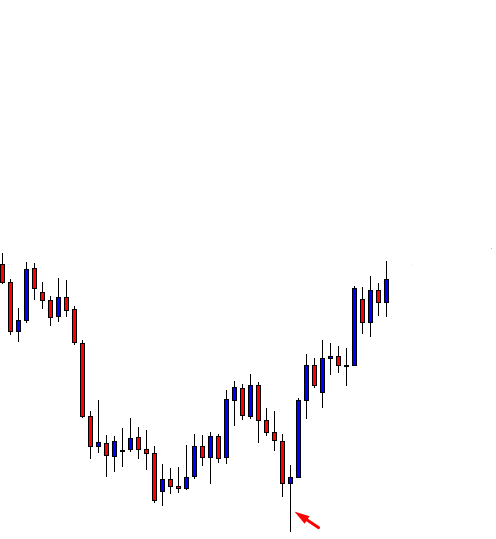
This is a daily chart. In an uptrend, the price had a pullback. It produces a Doji candle followed by an engulfing candle (arrowed). The buyers may want to draw a support level here. Please note, it is not a Morning Star.
It is neither a Moring Star nor a Double Bottom. The price heads towards the North with good buying momentum. Many of us may think we miss an opportunity. The pair may have offered entries on minor time frames, but the daily chart does not provide anything yet.
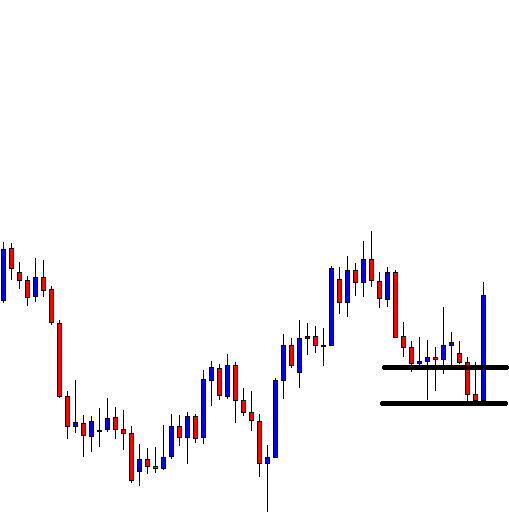
Here we are. The price heads towards the support again. As far as the Daily chart is concerned, the price had a bounce at the level earlier. Thus, if the level produces a daily bullish reversal candle, the buyers are going to get themselves busy to look for long opportunities. Let us proceed to find out what happens next.
The last bearish candle closes within the marked level. This is a sign that the price may obey the support. However, we never know unless it produces a bullish daily reversal candle.
Here we are. The level produces an Inside Bar. It is not a robust bullish reversal candle. Nevertheless, it is a reversal candle. Do you know what the price action traders do next? They flip over to the H4 chart. Have a look at the H4 chart.
Since we are analyzing the daily chart, the trigger chart shall be the H4 chart. The H4 chart shows that the price is on consolidation. The buyers need to wait for bullish momentum.
The chart produces an H4 bullish reversal candle, although the resistance is still intact. Thus, the buyers need a breakout at that level. They must wait for it.
Here it comes. A Marubozu bullish candle breaches the resistance. The buyers may trigger a long entry right after the candle closes. Let us proceed to find out what the price does next.
As expected, the price heads toward the North with good buying momentum. There is enough space for the price to travel. It may go further North as well. Anyway, let us concentrate on what we have learned from these examples.
Using multiple time frames is one of the key components of price action trading.
The right combination of multiple time frames is essential.
We are going to learn more about using multiple time frames in our forthcoming lessons. Stay tuned.
Buying & Selling The Forex Market – The Path To Financial Freedom
There is an old adage in the financial markets: buy at the bottom and sell at the
Buying & Selling The Forex Market – The Path To Financial Freedom
There is an old adage in the financial markets: buy at the bottom and sell at the
Buying & Selling The Forex Market – The Path To Financial Freedom
There is an old adage in the financial markets: buy at the bottom and sell at the top.
This might be better applied to the second-hand car or housing markets than the financial markets. In truth, it is meaningless in the Forex market, but it has strong connotations.
Within the Forex market, a currency pair, in theory, has no top and no bottom! Rather one currency can be valued against another currency as having an intrinsic value that fluctuates either below, above, or at parity with the counter currency within the pair being traded.
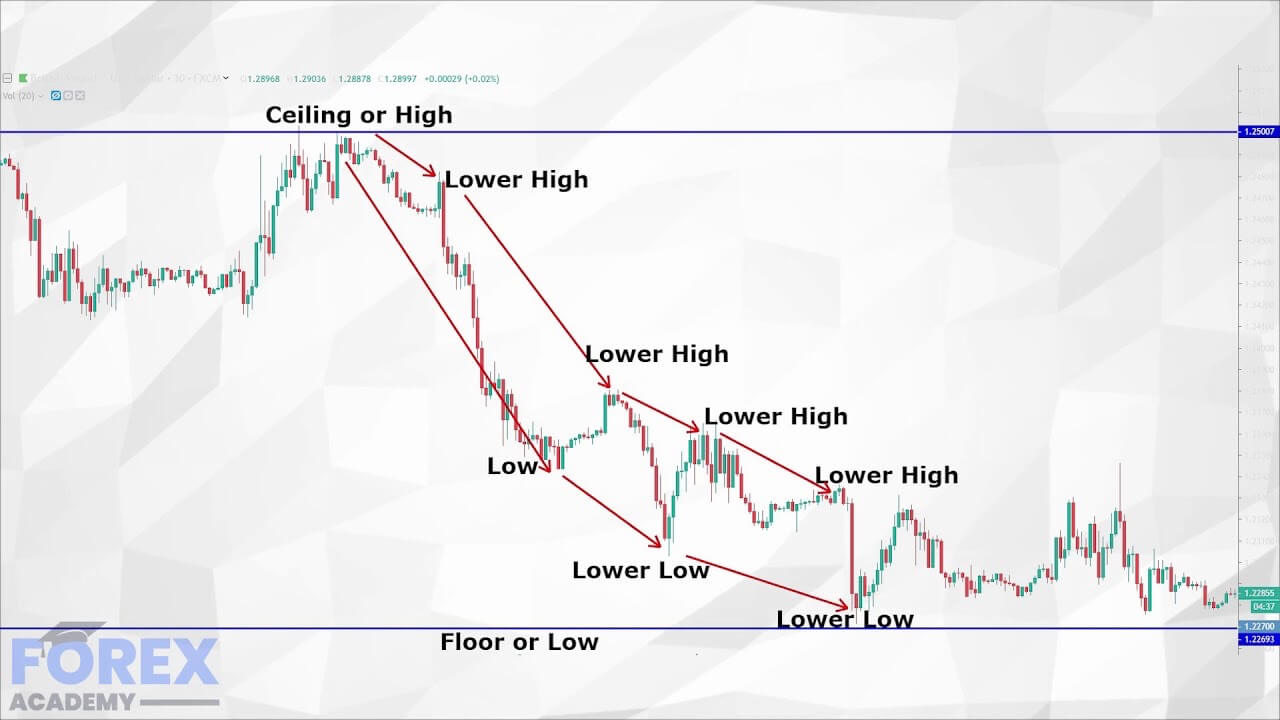
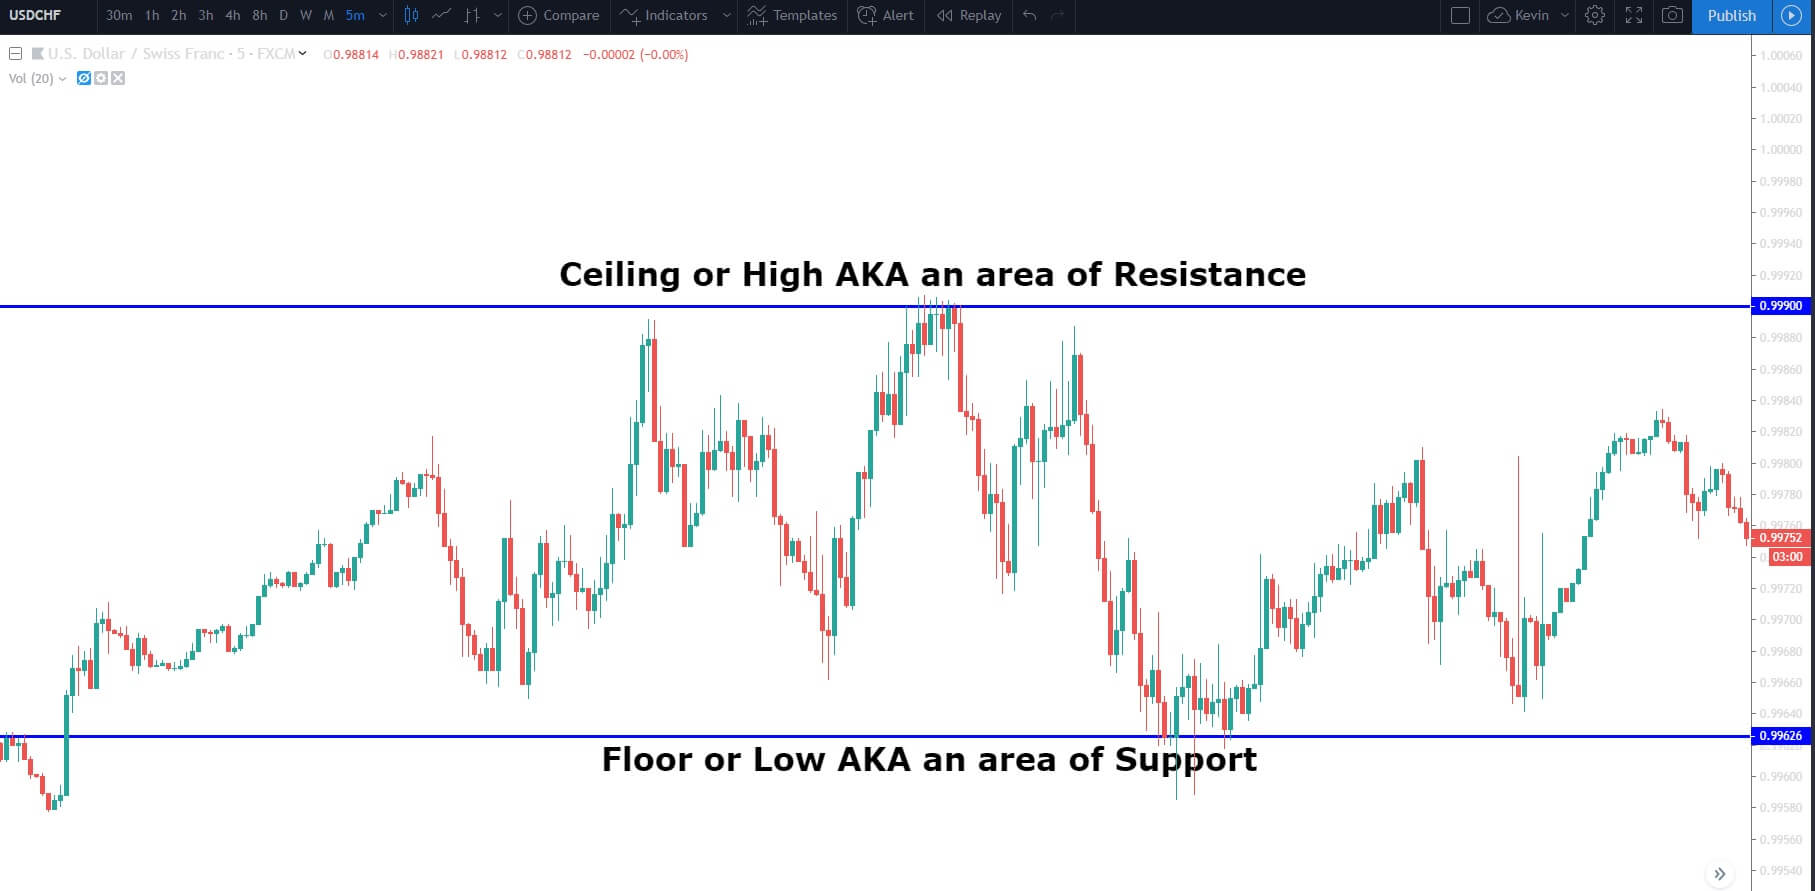
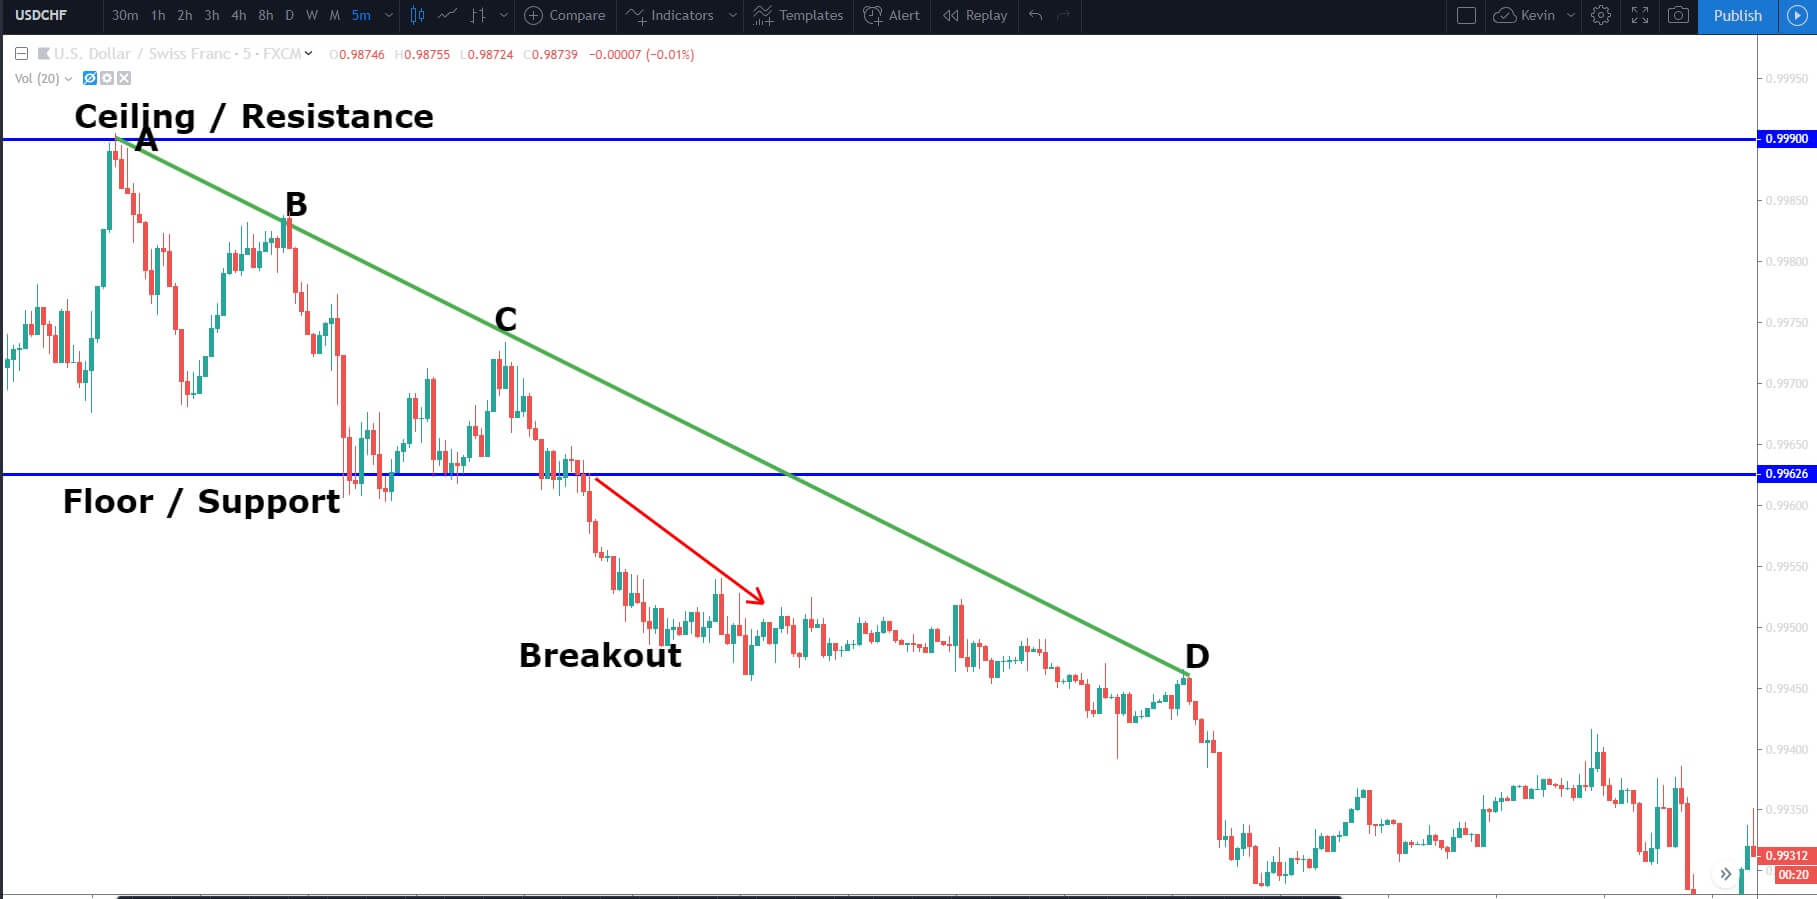
Therefore within the Forex market, we have a multitude of various levels that can be broken down into floors and ceilings, which are also known as areas of support and resistance. And so as traders, we look to buy and sell currency pairs from areas of support up to areas of resistance, or to sell them from areas of resistance to areas of support. We then look for continuations or signs that we should exit our trades.
The absolute best way to ascertain where these areas of floors and ceilings are is by way of technical analysis. Traders then use trend lines and other technical tools on their charts in order to highlight where the price action of a pair will bottom or top out and reverse. Of course, traders would love to execute a trade and have it roll on in their favor for a couple of hundred pips every trade. In reality, it hardly ever happens like this. Even the most reliable technical analysis, set-ups will not work 100-percent of the time. What really matters most is that a trader’s methodology or style means that they consistently win more trades than they lose and that each winning trade is greater than each losing trade. And therefore, traders must incorporate tight stop losses while utilizing their tried and tested trading criteria.
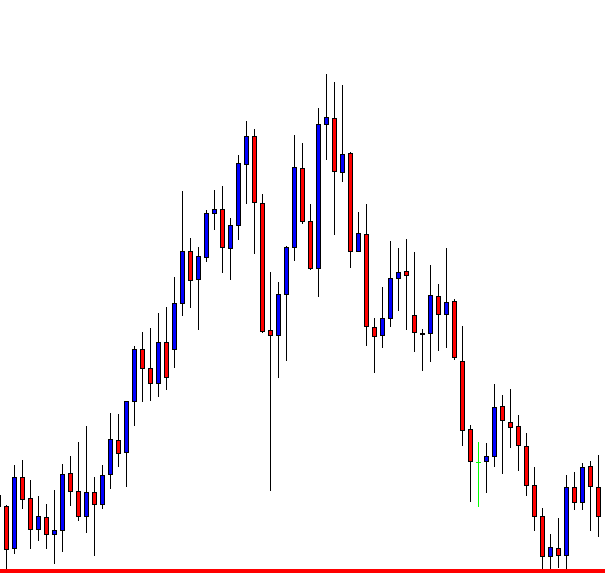
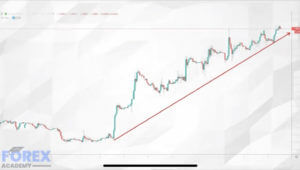
Now let’s break down a buy trade to its bare bones. But before we do so, let’s just go back to our adage for one moment: buy at the top and sell at the bottom. As traders in the Forex market, we have to establish where the multitude of tops and bottoms are in order to give us an advantage in our trading. When you break trading down into its base elements, traders simply like to push an asset as far as it will go. In other words, in Forex, they buy a currency pair until it runs out of steam and stalls at a ceiling, and then after a period of consolidation, they will either continue buying it, or they will reverse the process and start selling it far as they can.
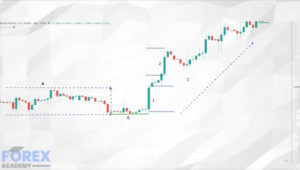
Example A
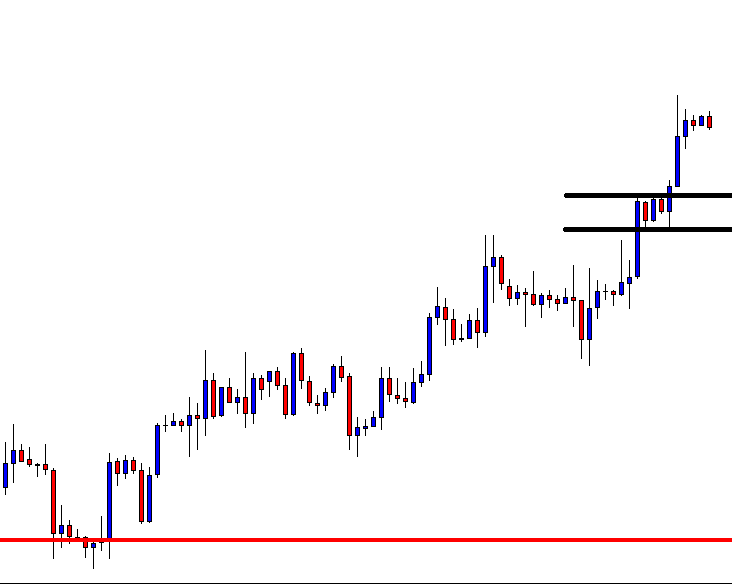
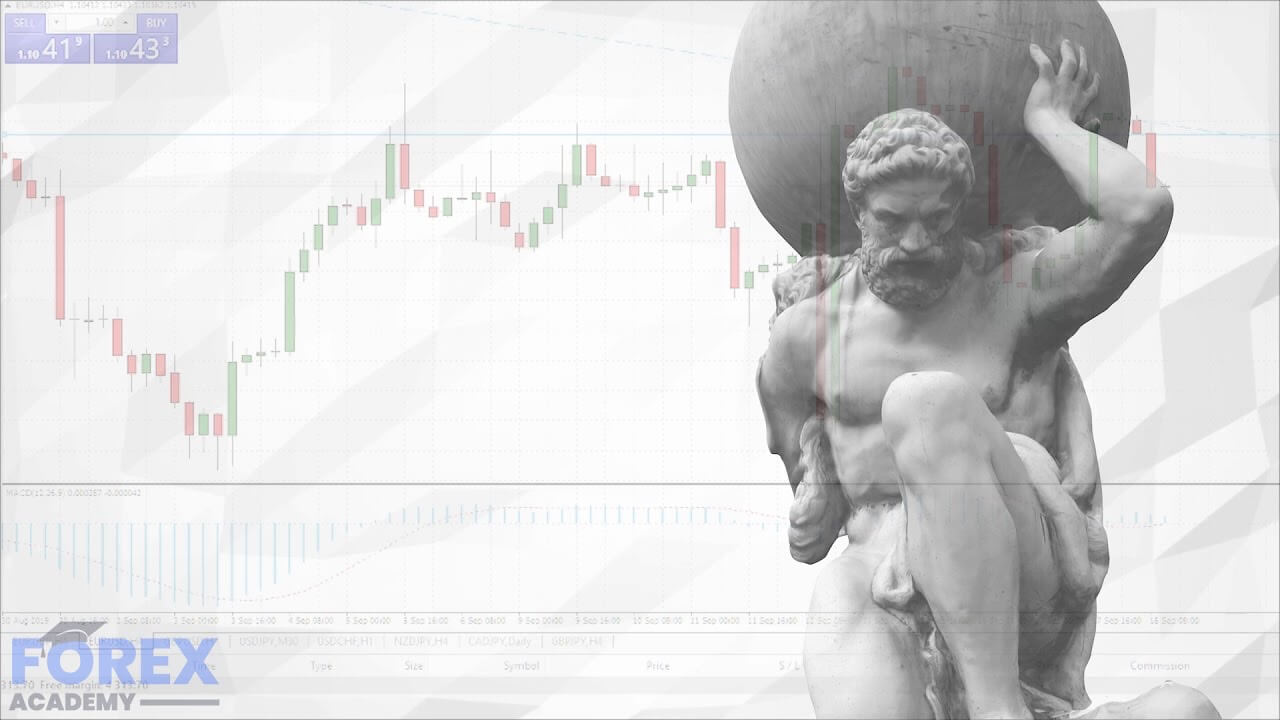
Let’s turn our attention to example ‘A.’ This is a 4-hour chart of the EURUSD pair. Always read a chart from left to right because it tells a story. Here we can see that price action was unable to go rise above the ceiling or resistance level at position 1. Traders then pushed the pair down by selling it to the area of support at position 2. Price action then goes up to the previous ceiling, and this time punches through at position 3. Price action moves a little bit higher before falling back at position 4 and where our previous ceiling has now become an area of support. Traders now start buying the pair all the way up to another area of resistance labeled 5. When they could not push it any higher price action moves down to the previous area of support at position 6 and this time punches through. We then find a continuation trend to the downside.
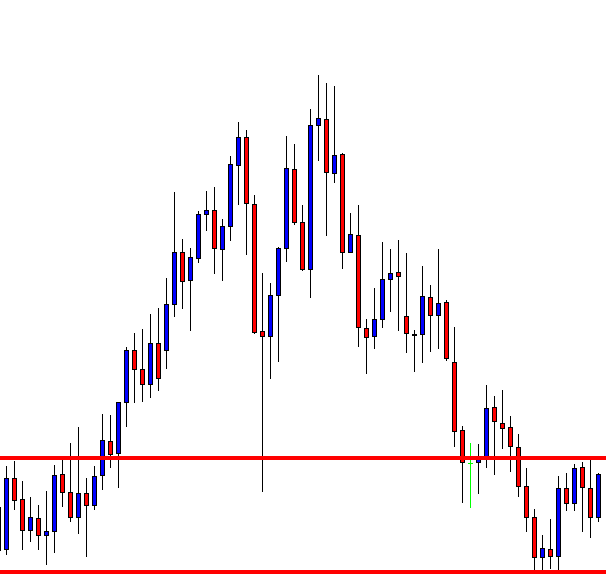
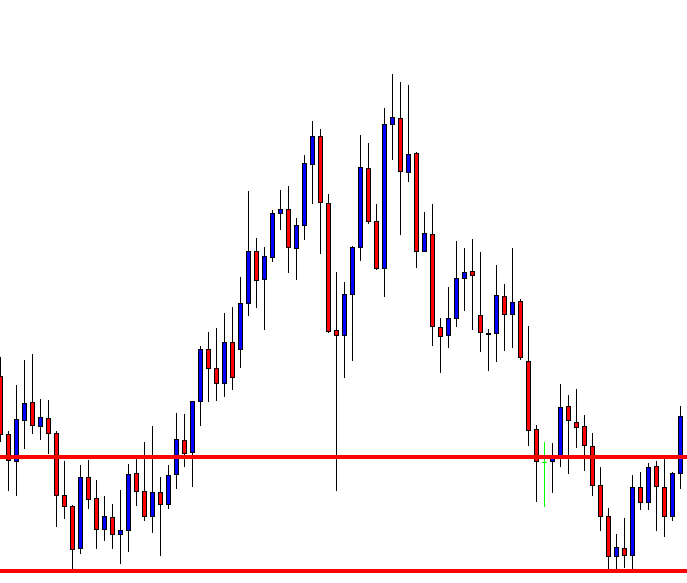
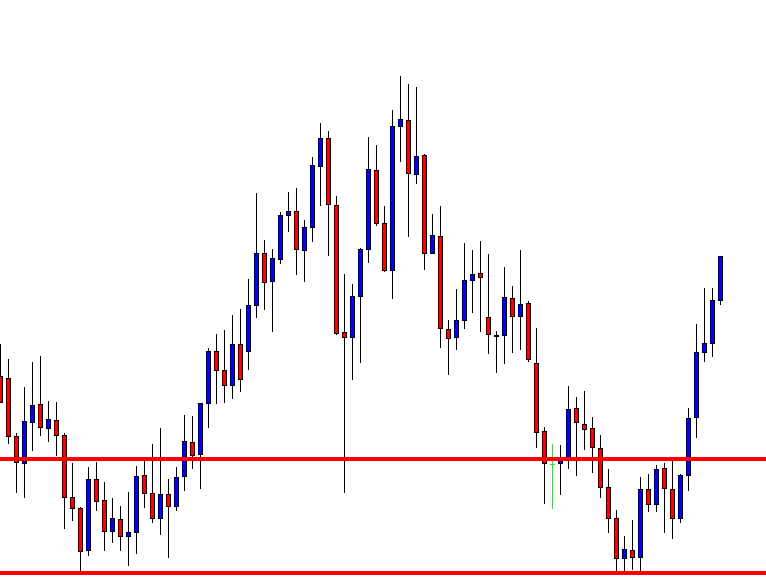
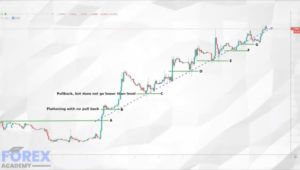
Example B
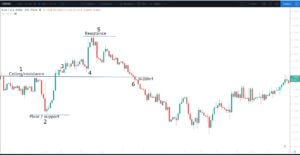
Let’s take a look at the example ‘B,’ which is the same as our previous chart of the EURUSD pair, but where we have Incorporated some potential buy and sell levels. Again, using our levels of support and resistance, we are looking for opportunities when the market pulls away from these levels. At position ‘A,’ we find that the market is moving below the area of resistance, which presents a selling opportunity and where a stop loss marked ‘X’ is placed just a few pips above the resistance line.
When price stalls to the downside, we are presented with a buying opportunity at position ‘B,’ and where our stop loss should be placed a few pips underneath the lowest candlestick at the support area.
At position ‘C’ price action fails back to the support area, we get a second buy opportunity as marked by the arrow and where traders would typically place a stop loss just under the previous resistance level and which has now become a support level. Now it could be that traders are still long having bought the pair at position ‘B.’ But later in the chart, when buyers lose momentum we see price action fall below the support line we have a sell opportunity at position ‘D’ and where our stop loss should be placed a few pips above this level of resistance.
So when it comes to buying and selling a currency pair, we look for defined areas of support and resistance and, more importantly, areas where traders push through these levels, which is typically when we might see a continuation in price action in either direction.
The U.S. dollar softened Wednesday, as the Fed expectedly lowered interest rates. The ICE Dollar Index was down 0.2% on the day to 97.45. The euro rose 0.4% to $1.1152.
The U.S. dollar softened Wednesday, as the Fed expectedly lowered interest rates. The ICE Dollar Index was down 0.2% on the day to 97.45. The euro rose 0.4% to $1.1152.
The U.S. dollar softened Wednesday, as the Fed expectedly lowered interest rates. The ICE Dollar Index was down 0.2% on the day to 97.45. The euro rose 0.4% to $1.1152. Official data showed that French GDP grew 1.3% on year in the third quarter (as expected and +1.4% in the second quarter). Later today, the eurozone third-quarter GDP will be reported (+1.1% on-year expected).
Economic Events to Watch Today
Let’s took at these fundamentals.
GBP/USD– Daily Analysis
The GBP/USD currency pair flashing green and trading near the 1.2930 due to decreeing the uncertainty surrounding the British politics and Federal Reserve rate cut.
One of the main reasons behind the GBP/USD pair revery is Europen Unions 3-month Brexit extension, as well as increasing chances of the December snap election and public support to the United Kingdom Prime Minister Boris Johson looks to support the cable pair recently.
At the trade front, the uncertainty surrounding the United States and China trade deal, in the wake of no fixed meeting place, joins the U.S. Secretary of State Mike Pompeo’s said that China’s ruling Communist Party (CCP) took benefits from the U.S. goodwill. All traders look to ignore the recent support from the United States side to China.
Whereas, the Chinas Commerce Ministry shares more direction regarding trade discussion, which will happen through the telephone call between the official, and made sure that no change will be coming in the plan for talks.
It should be noted that the risk sentiment has been slow, and also the U.S. ten-year Treasury yields fell to 1.80%, whereas Asian stocks supported by the Feral Reserve rate cut.
Looking forward, the markets will ready for Friday’s employment headlines data from the United States, as well as all focus will keep on trade and Brexit headlines and 2nd-tier statistics on the economic calendar.
Daily Support and Resistance
S3 1.2758
S2 1.2822
S1 1.2862
Pivot Point 1.2885
R1 1.2926
R2 1.2949
R3 1.3013
GBP/USD– Trading Tips
The GBP/USD is trading bullish in the wake of a weaker dollar. The pair faced triple bottom support at 1.2780 level, which triggered a bullish trend in the GBP/USD. On the upperside, the Cable may hit the first target at 1.2960, and the bullish breakout of this level can drive more buying until 1.3000 today.
USD/JPY – Daily Analysis
The USD/JPY currency pair found on the multi-day low nearby 108.65 despite the Bank of Japan announces that no monetary policy change. The Bank of Japan faced the broad expectations of the market, whereas the holding short-term interest rate target at -0.10% with a 10-year Japanese Government Bond (JGB) yield target around zero. However, the Japanese central bank gave more transparency in its fresh direction through the 3rd-quarter Outlook Report.
As a result, the greenback and Treasury yields surged but then turned back during the Powell press conference. The United States’ two-year Treasury yields surged six-basis points to 1.67% before sliding back to 1.60%, -4 basis points for the day. Finally, the USD/JPY currency pair rose to 109.29 – as being a 3-month bullish before going back to 108.85, unchanged on the day.
At the data front, the United States Q3 GDP slipped from 2.0% to 1.9% annualized but was above expectations of 1.6%, supported by a stronger consumer. In y/y terms Q3 19 against Q3 18, growth slipped to 2.0% from 2.3%. Personal consumption increased by 2.9%, crossed the estimate of 2.6%, with particularly strong personal durable goods purchases of 5.4%. Core PCE inflation rose to a 2.2% pace from 1.9%, as expected. The ADP private payrolls survey rose 125k in Oct (vs. est. 110k), but the previous reading was revised down from 135k to 93k.
On the other hand, the risk market has been slow overnight due to the uncertainty surrounding the United States and China trade deal. In the wake of no fixed meeting place, joins the U.S. Secretary of State Mike Pompeo’s said that China’s ruling Communist Party (CCP) took benefits from the U.S. goodwill. All traders look to ignore the recent support from the United States side to China. Traders want to decrease the uncertainty regarding Brexit.
Looking forward, the markets will ready for Friday’s employment headlines data from the United States, as well as all focus will keep on the Nonfarm Payrolls, while trade and Brexit headlines and 2nd-tier statistics on the economic calendar will continue under the trader’s eyes.
Daily Support and Resistance
S3 107.82
S2 108.39
S1 108.63
Pivot Point 108.96
R1 109.19
R2 109.53
R3 110.09
USD/JPY – Trading Tips
The USD/JPY is trading sharply bearish amid weakness in the U.S. dollar over interest rate cut decision. The USD/JPY pair violated the bullish channel, which was supporting the USD/JPY at 108.800 area.
Bearish engulfing candles are still suggesting chances of further selling in the USD/JPY until 108.450 today. On the upper side, resistance is likely to stay at 108.750. Consider taking selling trades below 108.750 today.
EUR/USD – Daily Analysis
The EUR/USD Currency Pair hit the bullish track and surged sharply from the 20-day Moving Average at 1.1075, increasing more than 50-basis-points. The pair crossed the level 1.1130 and found on the six-day high at 1.1149. So, the EUR/USD currency pair currently stands on the bullish tone, mainly after the FOCM meeting.
After the Federal Open Market Committee meeting, the U.S. Dollar surged across the boards, sending the EUR/USD currency pair toward the 1.1070and 1.1080 range. As expected, the central bank rate cut the key interest rate but signaled a pause ahead.
During Powell’s speech, the U.S. Dollar lost the strength and then rose sharply, mainly due to when Chairman mentioned there would not be a rate hike until there is a significant move up in inflation. Whereas, Chairman’s comment pushed higher the equity princes in Wall Street and sent the greenback to fresh lows across the board.
As of now, the EUR/USD Currency Pair remains to increase into 4th-day during the Thursday, in the wake of Greenback weakness, mainly due to the latest United States Federal Reserve rate cut continues to keep the bearish sentiment around the U.S. dollar and Treasury yields.
As we all well aware that the Federal Reserve delivered a rate cut by the 25-basis-points during the last trading hours; however, they indicated a pause in the future easing. Moreover, the traders continue to worry because of the impact of the rate cut on the economy and about Uncetanitny between the United States and China trade progress.
Daily Support and Resistance
S3 1.0981
S2 1.1055
S1 1.1104
Pivot Point 1.1129
R1 1.1178
R2 1.1203
R3 1.1277
EUR/USD– Trading Tips
The EUR/USD has reached under the double top resistance level of 1.1175 and has recently closed the Doji candle, which is suggesting chances of a bearish bias in the pair. The pair is oversold as the MACD, and RSI value stays in the bullish zone. Consider staying bearish below 1.1175 to target 1.1120 today.
The USD/CAD closed at 1.30856 after placing a high of 1.31003 and a low of 1.31420. The overall movement of the pair remained Bullish that day. Central Bank of Canada
The USD/CAD closed at 1.30856 after placing a high of 1.31003 and a low of 1.31420. The overall movement of the pair remained Bullish that day. Central Bank of Canada
The USD/CAD closed at 1.30856 after placing a high of 1.31003 and a low of 1.31420. The overall movement of the pair remained Bullish that day. Central Bank of Canada and Federal Reserve of United States both will hold their Policy Meeting on Wednesday. Ahead policy meeting, both currencies remained under pressure on Tuesday.
Loonie remained under pressure because of falling Crude Oil prices on Tuesday and supported the USD/CAD upward trend. The traders took repositioning ahead policy meetings to gain profit on Wednesday.
The BOC has not cut its rates since 2015, and there are no chances for further rate cuts this month.
However, the Federal Reserve is anticipated to cut its rates by 25 basis points in the meeting of October. But the chances for the third rate cut by fed are also decreased due to the raised optimism of the US-China trade deal & Brexit Extension.
Although there are no chances of rate cuts from Bank of Canada in October, the December cut is not out of the board. Some analysts suggest that the labor markets are stronger, inflation is on target, and the rates are already lower than US rates, but some factors indicate the need for December cut, and they can’t be ruled out.
Despite the weak Consumer Confidence form United States, the pair continued to move in an upward direction. USD/CAD rose sharply on Tuesday and crossed 1.31 level, but it dropped after reaching that point.
USD/CAD – Daily Technical Levels
Support Resistance
0.6846 0.6875
0.683 0.6888
0.68 0.6918
Pivot Point 0.6859
The USD/CAD is staying steady below 1.3100 level, and closing below this level is suggesting strong chances of a bearish trend. Closing above this level can trigger buying until 1.3120 today.
All the best!
https://youtu.be/YVwz52RR7UE
Using Volume As A Form Of Technical Support – Forex Tips & tricks
One of the problems for retail Forex traders is that there is no tool currently
https://youtu.be/YVwz52RR7UE
Using Volume As A Form Of Technical Support – Forex Tips & tricks
One of the problems for retail Forex traders is that there is no tool currently
Using Volume As A Form Of Technical Support – Forex Tips & tricks
One of the problems for retail Forex traders is that there is no tool currently available that tells them how much volume – in terms of currency amount – floating around in the market at any given time. The Forex market is not like the stock market, where we can see amounts of stocks and shares being bought and sold. Although some brokers will tell you what percentage of the traders are either long or short on a currency pair, it doesn’t give you the whole of market volume. And because there are so many market makers and so many brokers out there, it is impossible to determine the amount of volume – in terms of currency – in the market at any given time.
Therefore traders have to use their technical analysis to establish when volume is high and low in the market. One of the best ways to establish volume is to look at the size of Japanese candlesticks. For example, the longer the candlestick – and especially those which have very short wicks at either end – usually means a large volume of currencies are being simultaneously bought and sold, pertaining to the particular pair a trader is focused on.
Logically, the times when traders are more likely to see large volumes going through in a pair is likely to be around the times of economic data releases, in particular, those relating to GDP, interest rate decisions, employment, imports and exports, and manufacturing.
We might expect to see smaller candlesticks and, therefore, smaller amounts of volume in a pair in areas of price congestion, price consolidation, and also quiet times in the market, such as time zone overspills.
Let’s look at the example ‘A’
This is a 4-hour chart of the GBPUSD pair, also known as Cable. We have split the price action in this period into three sections marked, ‘A,’ ‘B’ and ‘C.’ In area ‘A,’ price action has gravitated to the bottom, which is a key level of support at the 1.22 exchange rate. This is technically a period of consolidation and sideways trading because no trend has been allowed to develop to the upside or downside. Let’s now turn our attention to the area ‘B,’ where the candlesticks are very small and where price action is merely fluctuating around the 1.22 to level. The candlesticks are very small, and this can only mean one thing: that volume is thin in this area. Now let’s take a look at area ‘C.’ We have marked the first candlestick as number 1 and where price action has accelerated away from the 1.22 level to just above the 1.24 level; again, this is a key level. We also note that there are small wicks at either end of the candlestick. This candlestick has also taken out or engulfed the preceding candlesticks in areas A and B. This is a strong move to the upside, and was a lot of volume has gone through during this 4 hour our time frame. Candlestick number 2 is also a large candlestick, although it does have a small wick at the top denoting a decrease in volume towards the end of that period. The strong push higher with candlestick 1 and 2 confirms large volume, which kicked off what turned out to be the beginning of a trend higher in this pair.
Traders need to be mindful of potential areas of support and resistance while factoring in economic data releases, which could subsequently reverse or cause a continuation of a trend in price action.
Useful tools to be able to gauge support and resistance during technical analysis are; Fibonacci retracement, stochastic overbought and oversold, and being mindful of possible Elliott waves forming.
One key area to focus on in order to fully understand volume in the markets is an understanding of the psyche of institutional traders.
Let’s imagine that an institutional trader comes to his or her desk at 7 AM in the morning, bright and breezy, and looking for the earliest opportunity to make money for their investment firm.
Now, this guy or girl may be on a salary of over €/£/$100.000, for example, and also gets a big fat annual bonus cheque. This puts them lots of pressure to make money.
Therefore at the beginning of each session, whether it be the USA, Asia, Europe, or the United Kingdom sessions, you will find that volatility usually picks then. Therefore Forex Traders, we need to be mindful that volatility equals volume, and the greater the volume, the greater the risk of larger swings in price action.
Introduction
Forex is the most liquid and volatile market in the world. The average pip movement in the major currency pairs is around 100 pips. However, as a retail trader
Introduction
Forex is the most liquid and volatile market in the world. The average pip movement in the major currency pairs is around 100 pips. However, as a retail trader
Introduction
Forex is the most liquid and volatile market in the world. The average pip movement in the major currency pairs is around 100 pips. However, as a retail trader, it is not impractical to grab 100 pips every single day. Though there are some strategies out there, it is very challenging to make 100 pips per day every day. But, there is 20 pips strategy, 30 pips strategy as well as 50 pips strategy, which is much reliable than the 100 pips strategy. So, in this lesson, we shall be discussing the 20 pips strategy.
The 20 Pips Strategy
The strategy is very simple and straightforward. According to this strategy, when the price breaks above a range in a logical area, you must go long, and when it breaks below a range in a logical area, you must go short. So, this strategy is basically a breakout strategy. However, it’s not as straightforward as it sounds. There are some criteria one must consider before trading this strategy.
❁ Considerations
✓ Currency Pair
You can trade this strategy on any currency pair. However, it is recommended to focus mainly on major and minor currency pairs.
✓ Session
Though the market is open 24 hours, it does not mean you can apply this strategy any time during the day. To keep it safe, it is advised to trade only during the times when there is high liquidity. That is, the London – New York overlap would be the best time to apply this strategy. Else, the London session or the New York session will work perfectly fine as well. And it is great if you do not trade it during the Asian session, as markets don’t usually break out during this period.
✓ Timeframe
Timeframe plays an important role when it comes to trading a strategy of this type. To make 20 pips a day, it is ideal to stay between the 1hour timeframe and the 15-minute timeframe.
✓ Indicators
This strategy does not require any technical indicators.
❁ How to trade the 20 pips strategy
Below is a step by step process to trade this strategy.
Open the candlestick chart of any currency pair, preferably, a major or minor currency pair.
Firstly, go to the 1-hour timeframe in the chart and see if the market is in a logical area to buy or sell (Ex: Support and resistance).
If yes, then wait for the price to break above or below the consolidation area.
Check the strength of the breakout on the lower timeframe (15 minutes). Based on the strength, prepare to hit the buy or sell.
❁ Trading the 20 pips strategy on the live charts
• Buy example
Below is the chart of AUDUSD on the 1-hour timeframe. We can see that the market has been bouncing off from the purple line. So, this becomes a logical area to buy. At present, the market is holding at the purple support line. And it was in a tiny range for like ten candles. Now, to apply the strategy, we need the market to break above this range.
In the below image, we can see that the market breaks above the range with a big green candle. But, before hitting the buy, we must switch to the lower timeframe and see if the momentum of the candle that broke the range was strong or not.
In the below 15 min chart, we can clearly see that the broke above the range in just two green candles. This is an indication that the buyers have come up strong. Hence, now we can prepare to go long.
Coming to the take profit and stop loss, the take profit would, of course, be 20 pips, and the stop loss can be kept a few pips below the support area. Alternatively, you can even go for a 1:1 RR by keeping a stop loss of pips.
• Sell example
Note that this strategy can be applied when the market is in a trending state as well. Below is the chart of EUR/USD on the 1-hour timeframe, and we can see that the market is in a downtrend. The market keeps making lower lows and lower highs. At present, it can be seen that the market is pulling back, and a green candle has appeared. Now, all we need is the price to break below the pullback to give us a heads up that the downtrend is still active.
In the below chart, we can see that, in the very next candle, the market broke below the pullback area. Hence, we can prepare to go short after getting confirmation of the strength from the lower timeframe.
In the below 15-minute timeframe chart, we can see that the momentum of the candle was sufficiently robust during the breakout. Hence, we can consider shorting in now.
As far as the take profit and stop loss are concerned, it remains the same as the previous example. That is, 20 pips take profit with 20 pips stop loss.
Bottom line
A great feature to consider about this strategy is that it can be used in any state of the market. However, all the criteria mentioned above must be met for the strategy to work. If you’re a beginner in trading, then this could be an ideal strategy to get started with. And if you have experience in trading, you can try enhancing the strategy by applying some indicators and patterns.
Note that this strategy, just like other strategies, does not provide 100% accuracy. There are times when this strategy fails, as well. Hence, it is recommended to use this strategy in conjunction with other strategies to have a better winning probability. Happy Trading!
The price after making a strong bullish or bearish move, it makes correction/ consolidation. The price consolidates within two horizontal lines. In the financial market, this is called Rectangle. In
The price after making a strong bullish or bearish move, it makes correction/ consolidation. The price consolidates within two horizontal lines. In the financial market, this is called Rectangle. In
The price after making a strong bullish or bearish move, it makes correction/ consolidation. The price consolidates within two horizontal lines. In the financial market, this is called Rectangle. In today’s lesson, we are going to demonstrate some examples of the bullish and bearish rectangle.
Let us start with a bullish rectangle.
The price heads towards the upside with good bullish momentum. At the top, the price seems to start having consolidation. A buyer may want to keep an eye for an upside breakout to go long from here. However, the price continues to consolidate.
The price consolidates within two horizontal lines. We can draw a rectangle here since the price produces the rectangle after a bullish move, so it is called ‘Bullish Rectangle.’ Traders are to wait for a breakout to take an entry. A downside breakout offers a short entry, and an upside breakout offers a long entry. Let us find out which way the next breakout takes place and the price heads to.
The price makes a downside breakout and heads towards the South. At rectangle breakout, the price usually travels at least the same distance of the consolidation length. It seems the price travels 1.5X distance of the consolidation length here. Let us concentrate on the next chart below.
The price consolidates getting trapped within horizontal support and resistance. Do you find anything interesting here? Yes, we find another rectangle. This time it is a bearish rectangle. Let us draw those two lines here.
Again, traders must wait for a breakout to find out its next direction. The price has several bounces and rejections within those two horizontal lines. It is a bearish rectangle, but we know a breakout can take place either way. There is no point in guessing. Let us wait and find out.
The price makes a downside breakout and heads toward the South with good enough selling momentum.
We have demonstrated two examples here. The first one is a bullish rectangle where the price makes a downside breakout. The second one is a bearish rectangle, on which the price makes a downside breakout as well. Breakout direction does not depend on the bullish or bearish rectangle. Trader’s job is to wait for the breakout and breakout confirmation. Entry is to be taken only when the breakout is confirmed. We can spot rectangles almost in all the time frames. However, it is often seen on the H1, H4, and Daily charts. Have some practice on the demo account or do some backtesting to get well acquainted with the pattern to make green pips.
The U.S. Dollar Index kept trading within a tight range on Tuesday, closing down 0.1% to 97.69, as investors await the Fed’s interest rates decision.
The euro gained 0.1% to
The U.S. Dollar Index kept trading within a tight range on Tuesday, closing down 0.1% to 97.69, as investors await the Fed’s interest rates decision.
The euro gained 0.1% to
The U.S. Dollar Index kept trading within a tight range on Tuesday, closing down 0.1% to 97.69, as investors await the Fed’s interest rates decision.
The euro gained 0.1% to $1.1112, while the British pound was flat at $1.2866. The U.K. Parliament finally supported Prime Minister Boris Johnson’s plan for an early election, which would be held on December 12.
USD/JPY fell 0.1% to 108.88.
Meanwhile, USD/CAD advanced 0.3% to 1.3092 amid weakness in oil prices. On the other hand, the Bank of Canada is expected to keep its benchmark rate at 1.75% unchanged later today.
Economic Events to Watch Today
Let’s took at these fundamentals.
GBP/USD– Daily Analysis
The GBP/USD currency pair consolidates in the narrow range near the 1.2865 despite the United Kingdom parliament approving the extension for the December snap elections. As of writing, the GBP/USD currency pair s currently trading at 1.2863 and has spent a large part of the last 12 hours chipping away at the resistance of the bull flag on the 4-hour chart.
As we all well aware that the market is cautious not only because of key events but the shortage of fresh hints, so in the consequences, the GBP/USD pair is stuck in the tight range during the Asian trading hours.
During the Tuesday, the United Kingdom parliament approved the law for the first December snap eclection since 1932. The bill will likely become law on the weekend.
On the other hand, the breakout could remain difficult or fail mainly if the Federal Reserve delivers the rate cut by the 25 basis-points and give a hint to pause rate cut series, pushing the U.S. Treasury yields and the greenback higher across the board. It should also b noted that the market has already priced in the 25-basis-points easing.
Apart from the Federal Reserve decision, the GBP/USD currency pair could take hints from the U.S. Q3 preliminary GDP and the monthly ADP jobs data.
On the technical side, while 1.3000 and the fresh high near 1.3015 could keep the pair’s near-term upside limited, a bearish break of 1.2800 could take rest on the 21-day Exponential Moving Average (EMA) level of 1.2715 ahead of revisiting September high surrounding 1.2580.
Daily Support and Resistance
S3 1.2661
S2 1.276
S1 1.2813
Pivot Point 1.2859
R1 1.2911
R2 1.2958
R3 1.3056
GBP/USD– Trading Tips
The GBP/USD is still trading the same range, mostly trading bullish above 1.2830 range. On Wednesday, the GBP/USD proceeds to trade bullish above 1.2830 major trading levels.
On the 4-hour chart, the pair has formed Doji patterns, which is weighing on the bullish trend, but the MACD and RSI are proposing bullish preference. Consider taking buying positions over 1.2859 and bearish under the same level ahead of FOMC and Fed rate decision.
USD/JPY – Daily Analysis
The USD/JPY closed at 108.974 after placing a high of 109.037 and a low of 108.657. The overall movement for the pair remained Bullish that day. At 4:50 GMT, the Services Producer Price Index (SPPI) from the Bank of Japan was released and remained the same for the year at 0.5%.
At 17:30 GMT, the International Goods Trade Balance of the United States for September came in as -70.4B against the expectations of -73.5B and supported the U.S. Dollar on Monday. The negative Prelim Wholesale Inventories from the United States for September also supported the U.S. Dollar. It showed a decline to -0.3% from the previous month’s 0.2%.
The robust macroeconomic data from the U.S. at the starting day of the week gave strength to the U.S. Dollar and increased the prices of USD/JPY in Financial Markets.
On Monday, USD/JPY was rallied to 109 after the Positive comments from Trump about the US-China trade deal and increased U.S. Yields. Trump told the reporters on Monday that he was expecting to sign a significant portion of the Phase-one deal ahead of schedule. Although he did not mention the time for signing the part of the deal, the hint of pre-schedule deal signing itself created a big fluctuation in the market.
The overall optimistic mentality from China & U.S. gave hopes to a possible end of the prevailing Trade-war between them. U.S. & China were expected to sign the phase-one deal at the upcoming APEC Summit in Chile, but Trump announced that a portion of that deal would be signed before the Summit.
This state of affairs raised the appetite for riskier assets in the market, and USD/JPY gained traction in this regard and created a Bullish trend for itself after moving in a consolidated range for almost 2-3 previous days. The incoming positive trade headlines increased the U.S. Yields and hence created more demand for USD/JPY.
Daily Support and Resistance
S3 108.13
S2 108.52
S1 108.75
Pivot Point 108.9
R1 109.13
R2 109.28
R3 109.66
USD/JPY – Trading Tips
The USD/JPY surged to test the resistance area of 109.030, but the bullish momentum wasn’t strong enough to retain a bullish trend for a more extended period. The USD/JPY has dropped below the 109.036 area to retest the bullish trendline support at 108.800. Above this, we can expect USD/JPY to continue trading bullish today.
So let’s keep an eye on 108.800 today to stay bullish above and bearish below the same level to capture quick 30 pips. The USD/JPY may gain support around 108.550 today.
EUR/USD – Daily Analysis
The EUR/USD currency pair consolidates in the narrow range near the 1.1109. The pair were fell from the recent highs near the 1.1180 during the previous session; probably, the pair will hit the high level again if the German inflation crosses the forecast figures, and the Federal Reserve delivers a dovish rate cut at the coming meeting.
On the technical side, the currency pair had created a bullish hammer candlestick during yesterday, making a strong follow-through to Mondays bullish inside day candlestick.
The consecutive bullish candles indicate the recovery from 1.1180 has likely ended up creating a bullish higher low near 1.1073.
Whereas, the preliminary German consumer price index for October is still unchanged at 0% and fell moderately to 1.1% from 1.2% in annualized terms.
The EUR/USD currency pair will likely get hints from the German job data, which is scheduled to release at 08:55 GMT. On the other hand, the preliminary U.S. Q3 GDP and the monthly ADP employment figures could leave a slight impact on the EUR pairs before the Federal Reserve rate decision.
The Federal Reserve is expected to deliver the 3rd rate cut by the 25 basis-points during 2019 on Wednesday and gives the hint of pause easing further. Moreover, the hawkish rate cut could be capping the upside in EUR/USD currency pair.
According to the forecast, the market has already priced in the rate cut. So, the EUR/USD currency pair could increase mainly if the Federal Reserve keeps the doors open for delivering another rate cut before the year’s end.
Daily Support and Resistance
S3 1.1011
S2 1.1056
S1 1.1084
Pivot Point 1.1101
R1 1.1129
R2 1.1147
R3 1.1192
EUR/USD– Trading Tips
The EUR/USD jumped off the support point of 1.1065 yesterday. A bullish trendline extended the support level, which is still keeping the EUR/USD upbeat. The pair rose to the retest 1.1100 area. Today, consider staying bullish above 1.1101 until the FOMC and Fed rate decision comes out.
The cryptocurrency market had a slow day price-wise. Most prices stayed on the same levels even though the volumes, as well as RSI values, fell. The past 24 hours were
The cryptocurrency market had a slow day price-wise. Most prices stayed on the same levels even though the volumes, as well as RSI values, fell. The past 24 hours were
The cryptocurrency market had a slow day price-wise. Most prices stayed on the same levels even though the volumes, as well as RSI values, fell. The past 24 hours were uneventful as far as price is concerned as most cryptocurrencies are either in the slight green or slight red. Bitcoin went down 1.72%, and it is now trading at $9,238. Ethereum gained 0.44%, while XRP gained 1.07%.
Bitcoin’s dominance increased over the weekend even as cryptocurrencies rose in price. However, it is on the downturn in the past 48 hours. Its dominance now sits at 67.3%, which represents a 0.4% decrease when compared to its dominance value 24 hours ago.
Cryptocurrencies ended up being divided between being in the green or red in the past 24 hours. The industry’s market capitalization fell slightly when compared to yesterday’s value. It now has a market capitalization of $248.6 billion, which represents a $2.3 billion decrease when compared to the previous day.
What happened in the past 24 hours
There was no major news in the cryptocurrency industry in the past 24 hours that could shake the prices up or down. The volumes, as well as RSI values, are descending. These are just indicators of a healthy consolidation.
The UK lenient approach to crypto regulation might change by Jan 10, 2020. This may be done with the implementation of the “Fifth Money Laundering Directive.” Eric Benz, CEO of Changelly, said that the UK’s regulatory framework is just trying to keep up with the cryptocurrency market, which is growing. He said:
“I do think regulation is a good thing but only if done in a way, which suits this new market. Applying traditional archaic regulation to crypto simply will not work as it’s been designed in its nature to avoid regulation. There has to be a much better understanding of the market and technology on behalf of Governments not just in the U.K. but globally.”
Chinese cryptocurrency mining company Canaan Creative filed for an IPO on Oct 28. Canaan intends to be the first publicly-traded crypto-mining company. Canaan Creative filed for an IPO with the U.S. Securities and Exchange Commission to raise $400 million by selling its shares on the Nasdaq under the ticker CAN.
There were no significant changes in Bitcoin’s price in the past 24 hours. Ever since Oct 26, which is right after Bitcoin surged up to $10,430, the price was steady and in the consolidation state. Its price is currently hovering around the $9,220 mark, which is a bit lower than the $9,450 that it was trading at yesterday.
Bitcoin’s RSI levels are now falling under the RSI overbought territory and entering the regular trading territory. This indicates that the pressure that the buyers had is slowly dying out. On top of that, its volume is descending slowly. However, it is still above the levels it was at before the big spike.
Ethereum
Ethereum is doing pretty much the same thing Bitcoin does. After the big price surge, a consolidation needed to happen to make this move healthy. Ethereum is now hovering between its immediate support and resistance levels of $$185 and $193.5. Ethereum has attempted to break this range both to the upside and the downside in the past 24 hours but failed both times. It is currently trading at $186.7, which is almost exactly the price it was trading at 24 hours ago.
Ethereum’s RSI is falling below the overbought territory, and it is now valued at 53. Ethereum’s volume stopped dropping as it returned to the state it was in before the price spike.
XRP
XRP is, as stated in yesterday’s article, performing its consolidation a bit differently from Bitcoin and Ethereum. It is not trading in a specific range, but following its ascending trend line. Even though the volume seems to stay at the same levels, XRP is finding the strength to move upwards and follow the ever-rising resistance line. Just following this line indicates major strength to the upside. However, the trend of price hovering just below the line will have to stop soon as the aforementioned line is too steep.
XRP’s RSI is dropping from the overbought levels into regular trading levels. It’s currently sitting at the value of 53.
Gold prices were closed at $1492.540 after placing a high of $1508.2 and a low of $1489.96. The overall trend for Gold remained Bearish at the starting day of the
Gold prices were closed at $1492.540 after placing a high of $1508.2 and a low of $1489.96. The overall trend for Gold remained Bearish at the starting day of the
Gold prices were closed at $1492.540 after placing a high of $1508.2 and a low of $1489.96. The overall trend for Gold remained Bearish at the starting day of the week.
At 17:30 GMT, the International Goods Trade Balance of the United States for September came in as -70.4B against the expectations of -73.5B and supported the US Dollar on Monday. The negative Prelim Wholesale Inventories from the United States for September also helped the US Dollar. It showed a decline to -0.3% from the previous month’s 0.2%.
The robust macroeconomic data from the US at the starting day of the week gave strength to the US Dollar and weighed on Yellow Metal prices in Financial Markets.
The drop in Gold Prices was boosted on Monday after the positive comments from US President, Donald Trump on Trade Deal talks between US & China. Trump told the reporters on Monday that he was expecting to sign a significant portion of the Phase-one deal ahead of schedule. Although he did not mention the time for signing the part of the agreement, the hint of pre-schedule deal signing itself created a large fluctuation in the market.
XAU/USD – Daily Technical Levels
Support Resistance
1,485.65 1,503.9
1,478.72 1,515.22
1,460.47 1,533.47
Pivot Point 1,496.97
Gold has recently violated the bullish trendline, which was extending Gold an excellent support around 1490. Below this, the market is likely to stay bearish below 1490. On the lower side, the additional support stays at 1,481 today. Whereas, the resistance remains at 1,495.
https://youtu.be/MctYxXifbes
Correlated Market’s – Understanding Which Pairs Affect Each Other
When we talk about correlation in the financial markets, we are looking for assets across all the financial classes
https://youtu.be/MctYxXifbes
Correlated Market’s – Understanding Which Pairs Affect Each Other
When we talk about correlation in the financial markets, we are looking for assets across all the financial classes
Correlated Market’s – Understanding Which Pairs Affect Each Other
When we talk about correlation in the financial markets, we are looking for assets across all the financial classes, such as stocks, Forex, bonds futures, commodities precious metals and oil, etc., which trade positively or negatively against each other, either for brief or sustained periods. And so in Forex trading, we seek other currency pairs or other assets from these classes to assist us in our trading decision making, especially when we know that we can rely on correlation due to historical reliance.
As an example, in the stock market, we often find that if a major bank announcers a large loss due to underperformance you might find that there is a knock-on effect in the banking sector, causing bank stocks to fall due to the fact that the market perceives a correlated risk in this sector. This was particularly true in the 2008 market crash. Stock market traders might consider trying to counter this by buying stocks in utilities companies and firms that manufacture consumer staples, which are usually seen as more safe haven stock. In this example, traders look for positive correlation by buying utilities and consumer staples producers, and negative correlation in selling banking stocks in order to balance their portfolios.
There are many ways to measure correlation, and the larger the financial institution, the more complex measurements are used to define values in correlation, such as; Correlation Brownian motions, The Binomial correlation coefficient, Copula correlations, and others.
The basic measurement is called a Correlation Coefficient and is calculated within a range between -1 and +1. A perfect positive correlation has a correlation coefficient of +1, where currency pairs will move in the same direction 100% of the time. A perfect negative correlation is measured at -1 and means that the two currency pairs will move in the opposite direction 100% of the time. And if the correlation is 0, the two currency pairs are said to have no correlation and will act independently of each other.
We often find positive correlation within the precious metals sector, where silver will move either up or down in line with gold. An example of a negative correlation would be between gold and the US dollar. If we think about this logically, gold is valued in US dollars, and therefore for if the price of gold is rising, it stands to reason that the value of the dollar must be falling in value. Therefore some Traders will buy gold when the value of the dollar is falling and vice versa. See example ‘A.’
When looking for correlation on equities we find a positive correlation between the Dow Jones, the NASDAQ 100 and the S&P 500, and this is because these indices are priced in dollars and when the US economy is strong we would expect that these three indices are correlated positively to the upside, and vice versa when their economy is weak. Also, if the US has a strong economy and, therefore, we experience positive correlation between the indices, then we might expect this positive correlation to spill over into global equities. Again the opposite would
apply in a US downturn.
Another area we would expect to see positive correlation would be the bond market and especially when it comes to US and German 10 year treasury bonds, which typically move in sync with each other. Another positive correlation is seen in the oil markets where US, Canadian, and European oil stocks are heavily correlated, being supply-driven, and where the price is affected by the global economy outlook.
Great, so we know that correlation exists in the market and that traders use correlation to adjust their portfolios, but how can it help us in the retail Forex market? First and foremost, the fact that we know it exists already helps us because now we can use it as a tool or leading indicator in order to support our trading view of a particular currency, for example, USDCAD. This pair is heavily influenced by the fluctuations in the oil market. We can see this in action, in the example, ‘B.’
Here we have overlaid the USDCAD pair with US oil on a daily chart. The magenta trend line helps to define areas where USDCAD and especially when the price of oil is moving higher from the 10th to the 12th of June 2019, and the opposite is true between the 18th September to the 4th October 2019.
This is because a major contributor of the Canadian economy GDP is their production and subsequent sale of oil into the global oil market. Therefore when we find the price of oil tumbling, we might see the value of the Canadian dollar to fall in relation to the US dollar due to a negative correlation.
Also during the last few days, we have seen a rapid appreciation of the British pound to US dollar and whereby this rally was followed by the Euro against the US dollar which acted as positive correlation between the two pairs, and which largely came about because of positive sentiments regarding the eurozone and United Kingdom withdrawal agreement. See example ‘C.’
Where we see negative around the beginning of August 2019 and positive correlation during mid-October 2019. Correlation can be seen in the most unexpected places, such as, for example, ‘D,’ between the CHFJPY and EURUSD pairs, so it’s worth looking out for examples by studying your charts regularly.
The thing to bear in mind when it comes to correlation in the financial markets is that the markets have an ebb and flow to them, and things are constantly changing, and therefore correlation between assets should be seen as a fair-weather friend who comes and goes when they feel like it.
Harmonic Pattern Example: Bearish 5-0 Harmonic Pattern
The 5-0 Harmonic Pattern
Like the Shark Pattern, the 5-0 pattern is a relatively new pattern discovered by the great Scott Carney. Carney
Harmonic Pattern Example: Bearish 5-0 Harmonic Pattern
The 5-0 Harmonic Pattern
Like the Shark Pattern, the 5-0 pattern is a relatively new pattern discovered by the great Scott Carney. Carney
Like the Shark Pattern, the 5-0 pattern is a relatively new pattern discovered by the great Scott Carney. Carney revealed this pattern in his second book in his harmonic series, Harmonic Trading: Volume Two.
The 5-0 pattern is easily one of the wonkiest looking patterns. Depending on where you are at with your knowledge of harmonic patterns, the 5-0 will look foreign. And this is primarily because the 5-0 Pattern starts a 0. If you are used to seeing XABCD, then 0XABCD will undoubtedly look odd.
5-0 Elements
The pattern begins (begins with 0) at the beginning of an extended price move (direct quote from Carney’s work).
After 0 has been established, an impulse reversal at X, A, and B must possess a 113 – 161.8% extension.
The projection off of AB has a 161.8% extension requirement to C. C can move beyond the 161.8% extension but not beyond 224%.
D is the 50% retracement of BC and is equal to AB (a Reciprocal AB=CD Pattern).
The reciprocal AB=CD is required.
One of the best ways to interpret this pattern is to view it from an exasperated trader’s point of view. If we take the Bullish 5-0 Pattern as an example, then we can see why. The AB leg ends with B below X, creating a lower low. We then get an extended move in time where the BC leg is the most prolonged move with C ending above A. The movement from B to C may take on the appearance of a bear flag or bearish pennant. C to D shows intense shorting pressure and a belief among bears that new lows are going to be found. Instead, we get to D – the 50% retracement of BC. Instead of new lower lows, we get a confirmation swing creating a higher low. That move will more than likely generate a brand new trend reversal or significant corrective move.
Sources: Carney, S. M. (2010). Harmonic trading. Upper Saddle River, NJ: Financial Times/Prentice Hall. Gilmore, B. T. (2000). Geometry of markets. Greenville, SC: Traders Press. Pesavento, L., & Jouflas, L. (2008). Trade what you see: how to profit from pattern recognition. Hoboken: Wiley.
Harmonic Pattern Example: Bearish Deep Crab
The Deep Crab Pattern
The Deep Crab is a variant of the regular Crab pattern. It is still a 5-point extension, and it still
Harmonic Pattern Example: Bearish Deep Crab
The Deep Crab Pattern
The Deep Crab is a variant of the regular Crab pattern. It is still a 5-point extension, and it still
Harmonic Pattern Example: Bearish Deep Crab
The Deep Crab Pattern
The Deep Crab is a variant of the regular Crab pattern. It is still a 5-point extension, and it still has the endpoint (D) at the 161.8% extension of XA, but the AB=CD importance is a little different.
The most distinguishing component of this pattern is the importance of the specific 88.6% retracement point of B. Along with the Crab Pattern, the Deep Crab Pattern presents an especially extended and long move towards D.
Carney stressed that the Crab and Deep Crab represent significant overbought and oversold conditions, and reaction after completion is often sharp and quick. It is the opinion of many traders and analysts that the Crab Pattern and Deep Crab represent some of the fastest and profitable patterns out of all harmonic patterns.
Deep Crab differences from the Crab
BC leg projection is not as extreme as the Crab.
B must be at least an 88.6% retracement. Common to move more than 88.6% retracement level not above/below X (not above X in a Bearish Deep Crab and not below X in a Bullish Deep Crab).
AB=CD pattern variations are more important in the Deep Crab Pattern.
The BC leg is a minimum of 224% but can extend to 361.8%.
Sources: Carney, S. M. (2010). Harmonic trading. Upper Saddle River, NJ: Financial Times/Prentice Hall. Gilmore, B. T. (2000). Geometry of markets. Greenville, SC: Traders Press. Pesavento, L., & Jouflas, L. (2008). Trade what you see: how to profit from pattern recognition. Hoboken: Wiley.
Harmonic Pattern Example: Bearish Shark
The Shark Pattern
The Shark Pattern is the newest harmonic pattern from Carney’s work (2016). He revealed this pattern in his third book in
Harmonic Pattern Example: Bearish Shark
The Shark Pattern
The Shark Pattern is the newest harmonic pattern from Carney’s work (2016). He revealed this pattern in his third book in
Harmonic Pattern Example: Bearish Shark
The Shark Pattern
The Shark Pattern is the newest harmonic pattern from Carney’s work (2016). He revealed this pattern in his third book in his Harmonic Trading series, Harmonic Trading: Volume Three.
To gain a further understanding of the terminology used in this article, I would strongly encourage everyone to pick up all three of Carney’s books.
The Shark Pattern shares some of the more peculiar conditions that exist on some of the most extreme patterns. For example, both the 5-0 and the Shark Pattern are not typical M-shaped or W-shaped patterns. The Shark Pattern shows up before the 5-0 Pattern. It also shares a specific and precise Fibonacci level that the Deep Crab shares: The 88.6% retracement.
One behavior that might sound abnormal to all other harmonic patterns is that the reaction to the completion of this pattern is very short-lived. I think this is one of the most potent harmonic setups in Carney’s entire work because I am an intraday trader, and this pattern is very much for active traders.
Shark Pattern Elements
AB extension of 0X must be at least 113% but not exceed 161.8%.
BC extends beyond 0 by 113% of X0.
BC extension of AX must be at least 161.8% but not exceed 224%.
Because the Shark precedes the 5-0 Pattern, the profit target should be limited to the critical 5-0 Fibonacci level of 50%.
Sources: Carney, S. M. (2010). Harmonic trading. Upper Saddle River, NJ: Financial Times/Prentice Hall. Gilmore, B. T. (2000). Geometry of markets. Greenville, SC: Traders Press. Pesavento, L., & Jouflas, L. (2008). Trade what you see: how to profit from pattern recognition. Hoboken: Wiley.
Double Top/Double Bottom is one of the most robust patterns that price action traders wait to take entries. When the price is rejected twice at a resistance level, it forms
Double Top/Double Bottom is one of the most robust patterns that price action traders wait to take entries. When the price is rejected twice at a resistance level, it forms
Double Top/Double Bottom is one of the most robust patterns that price action traders wait to take entries. When the price is rejected twice at a resistance level, it forms a Double Top. As far as the candlestick pattern is concerned, an engulfing candle is the most reliable reversal candle that traders usually love to take an entry from a value area.
A combination of Double Top and a bearish engulfing candle attracts sellers to go short. Since it is an outstanding price action combination, it does not usually go wrong. However, in today’s lesson, we are going to demonstrate that even a great flourishing price action combination can go wrong, as well.
The price consolidates at the marked resistance and heads towards the downside. It then goes back towards the resistance. The sellers are to get ready to get a bearish reversal candle. The red-marked level is the resistance level, where we don’t consider the upper shadows. Since the price has several rejections at the marked level, and it is a valuable area for the sellers, the price most probably may respect the area and produce the bearish reversal candle.
The price does not respect the red-marked level, but it does not make an upside breakout either. Instead, it closes within the upper shadows. Traders are to adjust here. Let us see how it looks now.
The level where the last candle closes has some significance. One of the bullish candles closes within the marked level. This level may work as a resistance level and ends up producing a bearish reversal candle.
Here it comes. The Double Top’s resistance level produces a bearish engulfing candle. We have found the resistance level at last. So all the equations to go short from here seem to match as far as price action trading is concerned.
The price produces a Double Top.
The price produces a bearish engulfing candle right at the resistance of the Double Top.
The swing low is far enough, which offers good Risk-Reward as well. All seems to be okay to trigger a short entry.
After triggering the entry, the next candle comes out as a bearish Doji candle. Things still look good. The sellers are going to grab some green pips!
No! The next candle comes out as a bullish Marubozu candle, which breaches the resistance of the Double Top. It wipes off the Sellers Stop Loss. The buyers may take control once the breakout is confirmed.
The Lesson
It does not matter how good a trade setup looks: it may fail. Thus, there is no reason to be too optimistic about any entry. We must calculate our Risk-Reward and have immaculate risk management with every single entry that we take in the market.
The risk sentiment remains on today amid faded safe-haven appeal over-optimism from the U.S. China trade deal. Regarding Brexit, Prime Minister Boris Johnson would still need support from the Liberal
The risk sentiment remains on today amid faded safe-haven appeal over-optimism from the U.S. China trade deal. Regarding Brexit, Prime Minister Boris Johnson would still need support from the Liberal
The risk sentiment remains on today amid faded safe-haven appeal over-optimism from the U.S. China trade deal. Regarding Brexit, Prime Minister Boris Johnson would still need support from the Liberal Democrats and the Scottish National Party.
Notably, the 2-parties shown willingness to support a coming election if the Prime Minter Boris Johnson satisfies three conditions, no-deal Brexit is ruled out, no attempt to pass the PM’s Brexit deal before the election, and the election date is stipulated.
At the Fed front, the Federal Reserve is expected to deliver the rate cut by the 25-basis-points. As we are all well aware that this rate cut is counted as a 3rd-consecutive rate cut since July, markets are expecting the rate cut by 21-basis-points at the upcoming meeting on October 30 and the terminal velocity of 1.27% against the 1.88% currently.
The FOMC is expected to communicate patience in deciding future policy movements after the next week’s rate cut as they estimate the impact of the cuts which are delivered already.
Today in the early Asian session, the GBP/USD currency pair found on the bullish track according to the technical indicators. However, the strong bullish trend could remain difficult if the United Kingdom parliament again rejects Prime Minster Boris Jonhson December election proposal.
On the technical side, the 50-day Moving Average has ticked above the 100-day Moving Average, confirming a bullish cross for the first time after February.
The crossover shows a sequence of the recent rally from lows near 1.22, and so does the buyer’s flag marked on the 4-hour chart. As we are well aware that the Europan Union gave a Brexit extension of 3-months and the United Kingdom parliament has rejected Boris Johnson’s offer of snap elections.
The report came from an unknown source that Prime Minister Boris Johnson will request for another vote during the December election Tuesday, there are many possibilities of success as compared to the past way because thereby they just need a simple majority to succeed.
Looking ahead, Prime Minister Boris johnson would still need support from the Liberal Democrats and the Scottish National Party. Notably, the two parties shown willingness to support a coming election if the Prime Minter Boris Johnson satisfies three conditions: no-deal Brexit is ruled out, there are no attempts to pass the PM’s Brexit deal before the election, and the election date is stipulated.
On the other hand, the United Kingdom housing prices, Consumer Credit, Money Supply, and Mortgage Approvals are scheduled to release during the European trading hours. Across the pond, the eyes will be on the U.S. Consumer Confidence data and Pending Home Sales.
The GBP may challenge recent highs above 1.30, as hinted by technical studies if the Europan Parliament allows an early election. Notably, If the vote fails, then GBP could drop below support at 1.2788.
Daily Support and Resistance
S3 1.2727
S2 1.2789
S1 1.2826
Pivot Point 1.2851
R1 1.2888
R2 1.2914
R3 1.2976
GBP/USD– Trading Tips
The GBP/USD pair is trading at 1.2855 area, after gaining support at 1.2830. On Tuesday, the cable continues to trade choppy from 1.2950 – 1.2785. On the 4-hour chart, the bearish engulfing pattern is anticipated to hold the GBP/USD prices towards 1.2785 area today.
The technical indicators such as the MACD and RSI are proposing neutral bias for the GBP/USD. Consider staying bullish above 1.2785 and bearish blow the same area to capture 30 pips on either side.
USD/JPY – Daily Analysis
The USD/JPY currency pair consolidates in the narrow range of 108.70 and 108.75, which is the strongest part of overnight trade until New York traders stepped in. This initiated a squeeze to as high as 109.04 3-months high, mainly due to the rise in the U.S. Treasury yields and certainty surrounding the United States and China trade relations.
The USD/JPY currency pair is currently trading at 108.98, flashing green on the day, having examined the 200-day M.A. line of 108.05 in the early Asian trading hours.
President Donald Trump has fueled the market expectations by announcing that the United States is ahead of schedule to sign the first round of the United States and China trade deal ahead of when Xi and Trump are ready to meet in Chile next month. Moreover, the Chinese official said that most main parts of the deal basically completed already.
At the data front, the United States’ two-year Treasury yields rose from 1.63% to 1.67% – a one-month high, before steadying at 1.64%. The 10-year yield rose from 1.80% to 1.85%. United States benchmarks were also supported by the risk-on sentiment, with a fresh all-time closing high for the S&P 500, weighing on the Yen.
The U.S. Federal Reserve is expected to deliver the rate cut by the 25-basis-points, as we all well aware that this rate cut is counted as a 3rd-consecutive rate cut since July while markets are expecting the rate cut by 21-basis-points at the upcoming meeting on October 30 and the terminal velocity of 1.27% against the 1.88% currently.
The FOMC is expected to communicate patience in deciding future policy movements after the next week’s rate cut as they estimate the impact of the cuts which are delivered already.
Daily Support and Resistance
S3 108.13
S2 108.52
S1 108.75
Pivot Point 108.9
R1 109.13
R2 109.28
R3 109.66
USD/JPY – Trading Tips
The USD/JPY currency pair has already violated the sideways trading range to hit our suggested target of 108.950 area. For now, the 108.800 level is likely to extend solid support to the USD/JPY currency pair.
With the bullish breakout of the 108.800 level, the USD/JPY is expected to trade until 109.355 while the MACD and RSI are also supporting the bullish bias in the USD/JPY currency pair today.
EUR/USD – Daily Analysis
During the Asian session, the EUR/USD currency pair consolidates in the narrow range around 1.100. However, during the Monday trading session, the couple was found on the bullish track and created a bullish inside day candlestick pattern, but the bullish moves could be capped due to hawkish expectation regarding the Federal Reserve rate cut and increase in the U.S. Treasury yields.
The EUR/USD currency pair closed at 0.19% up yesterday. Moreover, the bullish and bearish levels fell in Fridays trading range. As we know, the shared currency created a bullish inside day candle, which was showing by the chart.
The candlestick pattern arrangement is biased bullish. Although, the bullish trend in the pair could be reduced or continue to difficult because the Federal Reserve is expected to deliver the rate cut by the 25-basis-points during the Wednesday and lessen the need for an additional rate cut.
Therefore, heading toward the Federal Reserve rate cut decision, the United States Treasury yields could increase, keeping the greenback better buying. Notably, the ten-year yield has already increased by 14-basis-points, since the last 3-days
As of writing, the Treasury yield is found at 1.85%, and the EUR/USD currency pair is trading mostly flat on the day near 1.11.
On the other hand, the EUR currency may take hints from the German Bundesbank President Weidmann’s speech, which is scheduled to deliver at 09:50 GMT and the U.S. housing data and consumer confidence number expected to release at 14:00 GMT.
Daily Support and Resistance
S3 1.1045
S2 1.107
S1 1.1085
Pivot Point 1.1096
R1 1.1111
R2 1.1121
R3 1.1147
EUR/USD– Trading Tips
As discussed before, the EUR/USD is trading below 1.1100 support becomes resistance area. Overall, the trend in the EUR/USD remains bearish below 1.1100, as we can also notice the leading indicators such as MACD and RSI.
On the lower side, the EUR/USD may find support at 1.1065, and the violation of this level could extend sell-off until the 1.1020 area. On the upperside, the resistance prevails at 1.1115. A bullish breakout of 1.1115 can lead to 1.1160. Let’s for selling trades below 1.1110 today.
https://youtu.be/urtMhx5oBls
Assessing Directional Bias – Predicting Long Term Trends
Directional bias and personal bias, i.e., the feeling that the markets will either go up or down, should not be
https://youtu.be/urtMhx5oBls
Assessing Directional Bias – Predicting Long Term Trends
Directional bias and personal bias, i.e., the feeling that the markets will either go up or down, should not be
Assessing Directional Bias – Predicting Long Term Trends
Directional bias and personal bias, i.e., the feeling that the markets will either go up or down, should not be confused because they are two entirely different factors relating to trading.
When it comes to personal bias, a lot of traders are right, but not necessarily at the right time! In fact, one of the safest bets in trading is that traders who hang on to trades that are going against them, because they have a biased opinion of the market, are the types of traders who regularly lose money. Therefore, the longer you hang on to a losing trade because of your biased opinion about the market, the more likely you are negatively affect your win to loss ratio.
There is an old saying in the market is; buy the rumor and sell the fact! And rumors abound in the markets. In fact, more so now than ever before, and especially with the advent of Twitter and the myriad of news release platforms. Indeed, it will probably have been from one of these that you formed your biased opinion in the first place.
Another problem with personal bias, and especially when it comes to retail traders, is that at what level do you define the value in a given exchange rate? A level that might seem correct to you might not be the same level as a large hedge fund, or institution, or, more importantly, a sovereign wealth fund or government!
When it comes to directional bias, traders want to see that their technical tools are working hand in hand with fundamental analysis and sentiment. After all, when we are all singing from the same hymn sheet, so to speak, this is when primary trends tend to develop.
So, if you do have a personal bias towards the market direction, the best time to run with that (to open Spot trades) is when you have the technicals, fundamentals, and sentiment backing you up. In other words, wait for the market to come to you and don’t go chasing it!
Let’s take a look at example A. This is the British pound against the US dollar, also known as Cable. The best way to read a chart is from left to right because it tells a story. In this particular chart of the 1-hour time frame, we can see that price action levelled off at the 1.22 exchange rate. Prior to this, directional bias was to the downside for this pair. This was due to the fact that Britain is getting closer to the 31st of October deadline, where it could possibly leave the European Union without a withdrawal agreement in place, thus crashing out, which would have been detrimental for the British economy. But at the point on the chart where the upward arrow has commenced, the European Union agreed to reopen the Withdrawal Agreement negotiations and thereby potentially opening the door to a managed divorce between the UK and the eurozone. Market sentiment changed at this point. Fundamental analysis also changed at this point because when the United Kingdom voted in the 2016 referendum to leave the European Market, the danger was that we would leave without a deal, and this caused the depreciation of the pound. However, with a mutually beneficial Withdrawal Agreement in place and backed by a strong economy, the pound was heavily perceived by the markets to be undervalued and, therefore, ready for a bull run.
The subsequent strong push higher in Cable to the 1.24 level and the lack of a pullback from that exchange rate meant that technical traders could see that everything was in position for a continuation in directional bias to the upside. And so from the 1.22 level, it was a case of when to get in and buy into the potential bull run during pullbacks and corrections.
Let’s go back to our chart and take a look at example ‘B,’ where we have added a blue trendline and some areas of support and resistance. The first thing to point out is that a previously a ceiling, just below trendline ‘A’ has been breached to the upside. Price action continues to just above trendline ‘B,’ where we see a slight pullback and then a flattening of price action. Level ‘B’ then becomes a level of support. This came about shortly after an announcement by the European Union to reopen the UK Brexit Withdrawal Agreement and enter into fresh negotiations. Price action continues to surge before pulling back to the area of support marked ‘C.’ Price continues to move up to various points or resistance before pulling back to areas of support found at ‘D,’ ‘E,’ ‘F’ and ‘G,’ thus providing traders with a strong directional bias the upside. Each level of support is defined by the blue trendline, which is drawn at the base of the pullbacks and where this trendline acts as a simple moving average.
Here at Forex.Academy, we strongly recommend you incorporate your own trading style and methodology with technical and fundamental analysis and market sentiment and let the trend be your friend.
On Friday, the WTI crude oil prices continue to hold bullish bias maintaining substantial weekly gains as support from a surprise draws in U.S. inventories and possible action from OPEC
On Friday, the WTI crude oil prices continue to hold bullish bias maintaining substantial weekly gains as support from a surprise draws in U.S. inventories and possible action from OPEC
On Friday, the WTI crude oil prices continue to hold bullish bias maintaining substantial weekly gains as support from a surprise draws in U.S. inventories and possible action from OPEC and its allies to increase production cuts burdened broader economic interests.
The strong buying in crude oil was mostly underpinned by the surprise plunge in U.S. stockpile data. The U.S. crude oil inventories fell by about 10 million barrels during the previous week.
Whereas, the officials at the Organization of the Petroleum Exporting Countries (OPEC) remarked to extended supply cut is an option to balance the softer demand outlook in 2020, hence extending another reliable support to the WTI crude oil prices.
Technically, the WTI has violated an asymmetric triangle pattern, which keeps the crude oil prices on hold between 54.75 to 53.50. The violation of this range has pushed crude oil higher towards 56.50 area.
WTI Crude Oil – Daily Technical Levels
Support Resistance
55.5 56.59
54.91 57.1
53.82 58.19
Pivot Point 56.01
At the moment, crude oil is facing stiff resistance at 56.50 area. However, the WTI is looking to complete bearish retracement on the 240 mins chart. Crude oil has already completed 23.6% Fibonacci retracement at 55.85 area, and below this, further sell-off is expected until 55.50.
Despite the bearish correction, I would suggest looking for a bullish trades above 55.30 level today. All the best!
The U.S. Dollar Index gained 0.2% on the day to 97.68 on Thursday amid mixed U.S. economic data. The euro slid 0.3% to $1.1104. The European Central Bank held its
The U.S. Dollar Index gained 0.2% on the day to 97.68 on Thursday amid mixed U.S. economic data. The euro slid 0.3% to $1.1104. The European Central Bank held its
The U.S. Dollar Index gained 0.2% on the day to 97.68 on Thursday amid mixed U.S. economic data. The euro slid 0.3% to $1.1104. The European Central Bank held its benchmark rates unchanged as expected. ECB President Mario Draghi said risks to the outlook are “on the downside” compared with “tilted to the downside” previously.
On the other hand, the Markit eurozone manufacturing purchasing managers’ index was flat on the month at 45.7 in October (46.0 expected) while the Services PMI rose to 51.8 (51.9 expected) from 51.6.
The pound dropped 0.6% to $1.2838. U.K. Prime Minister Boris Johnson said he would call for an early general election for December 12. Meanwhile, the European Union is expected to decide the length of Brexit delay later today.
Economic Events to Watch Today
Let’s took at these fundamentals.
GBP/USD– Daily Analysis
The GBP/USD currency pair consolidating in the narrow range below the 200-hour Moving Average at 0.2852, due to the uncertainty intensified regarding the Brexit deal and the United Kingdom eclection. Notably, the pair may remain under pressure mainly due to increased risk.
British Prime Minister Boris Johnson admitted for the first time that he would not fulfill his (do or die) promise to get a departure between the U.K. and E.U. before October 31 and asked for a fresh election on December 12 to break Britain’s Brexit obstacle.
Although the opposition has rejected the election offer and LAbour leader Jermy Corbyn said that he would wait to observe what will the European Union decides regarding the Brexit delay before deciding that how to put the vote on Monday.
Moreover, the European Union is thinking of granting a 3-months delay. However, the decision may not come on Friday. The Brexit is moving in the uncertainty track, and Prime Minister Boris Johnson looks stuck in the middle. Therefore, traders are cautious about buying GBP.
On the technical side, the Technical charts are also indicating a move lower. It should be noted that Thursday’s bearish candlestick has opened the opportunities for a broader reversal, perhaps to the 200-day average at 1.2710.
Daily Support and Resistance
S3 1.2539
S2 1.2701
S1 1.2774
Pivot Point 1.2862
R1 1.2936
R2 1.3024
R3 1.3186
GBP/USD– Trading Tips
After violating the bullish channel, the GBP/USD pair is trading bearish at 1.2835 area. Overall, the Cable is maintaining a sideways range of 1.2950 – 1.2785. The bearish engulfing candle on the 4-hour timeframe is likely to lead the GBP/USD prices towards 1.2785 area today.
The MACD and RSI indicators are holding in the selling zone, supporting the bearish trend in the GBP/USD. Consider staying bearish below 1.2845 today.
XAU/USD – Daily Analysis
The safe-haven prices rose somewhat due to traders are awaited the next weeks, the United States Federal Reserve policy conference.
The U.S. Federal Reserve’s policymakers will attend next week. Its Oct. 29-30 policy settlement is required to yield in a 3rd-straight quarter-point rate cut.
President Trump tweeted that, “The Federal Reserve is negligent in its duties if it doesn’t deliver the rate cut and even, ideally, stimulate.
Gold prices remain supported in the wake of Japan’s manufacturing activity, which declined at the fastest rate in 3-years. Meanwhile, The U.S. PMI opposed expectations for a drop and rose marginally, but with limited impact on the prices of the safe-haven gold.
Daily Support and Resistance
S3 1466.32
S2 1482.53
S1 1493.22
Pivot Point 1498.74
R1 1509.43
R2 1514.95
R3 1531.16
XAU/USD – Trading Tips
Gold’s bullish trend continues to dominate the market. Closing of 4-hour candles above 1,495 and 1,503 area is indicating chances of further buying in the gold. The precious metal has formed three white soldiers pattern, which typically drives the bullish trend in the market.
On the upper side, the next resistance is likely to be 1,511. Therefore, we should look for buying positions above 1,500 area to target 1508 today.
USD/JPY – Daily Analysis
The USD/JPY currency pair is sidelined below the 200-day moving average and consolidating in the narrow range of 108.50 and 108.7 overnight, even after the United Sateta data a geopolitical uncertainty.
As of writing, the USD/JPY currency pair is currently trading at 108.60, having ranged between the level of 108.56and 108.64.
At the Hong Kong front, the condition is dull in Asia right now, but the markets keep their eyes on how the Chinese can react to comments regarding the Honk Kong and China, where he criticized the Chinese over security and human rights.
At the U.S. data front, the United States September Durable Goods Orders were depressed, and the volatile headline dropped -1.1%m/m against an estimate of -0.7%m/m. Though, September New Home Sales found on the positive side, with an increase of 701,000 against 702,000, against the previous revised to 706k from 713k, though average annual prices continued to ease. Markit PMIs also held steady in October, whereby Manufacturing PMI rose to 51.5 and bat the estimates of 50.9 and prior 51.1. Services came in line with expectations with an increase in the composite level to 51.2 from 51.0.
Moreover, the United States’ two-year Treasury yields waited in normal ranges between 1.55% and 1.58%, and the ten-year return moved between 1.74% and 1.77%. Markets are expecting 22-basis points of a rate cut at the October 30 meeting and a terminal rate of 1.21% against 1.88% currently. President Trump tweeted that, “The Federal Reserve is negligent in its duties if it doesn’t deliver the rate cut and even, ideally, stimulate.
At the Brexit front, the British Prime Minister Boris Johnson admitted for the first time that he would not fulfill his (do or die) promise to get departure between the U.K. and E.U. before October 31, and asked for fresh elections on December 12 to break Britain’s Brexit obstacle.
While the European Union was expected to give its answer to the United Kingdom governments request for a delay of European Union membership beyond October. However, due to the conflict between the United Kingdom parliament members, the European Union will decide to prefer to get some transparency first because it is continuously creating uncertainty in U.K. politics and Brexit.
Daily Support and Resistance
S3 108.11
S2 108.37
S1 108.5
Pivot Point 108.63
R1 108.76
R2 108.88
R3 109.14
USD/JPY – Trading Tips
On Friday, the safe have currency pair USD/JPY is facing support at 108.280. This level has become a triple bottom level and pushed the USD/JPY higher for the third time. At the moment, the USD/JPY trend is mixed as it holds right below an immediate resistance level of 108.650. Violation of this level can extend buying until the next resistance level of 108.900.
Today, let’s keep an eye on 108.650 to stay bearish or bullish above this level to capture quick trade in the USD/JPY.
https://youtu.be/eLaFiGWCs3U
Assessing Market Conditions
No matter which markets you trade, but in particular the Forex market, trading conditions change constantly depending on a number of factors, including the time
https://youtu.be/eLaFiGWCs3U
Assessing Market Conditions
No matter which markets you trade, but in particular the Forex market, trading conditions change constantly depending on a number of factors, including the time
Assessing Market Conditions
No matter which markets you trade, but in particular the Forex market, trading conditions change constantly depending on a number of factors, including the time of day the time, the time of the month, and even on an hour by hour basis. This is dependant on both fundamental, technical, and conditions based on sentiment.
Example: on an hour by hour basis because the Forex market has peak trading ours during the European, London and US session – where most volume is going through the market – daily; due to fundamental news release and a change in market sentiment, monthly, because hedge funds typically like to rebalance their portfolios at this time and also on a quarterly basis.
When these factors are taken into consideration, they transfer onto a trading chart as range-bound, which are also known as consolidating markets; breakouts, where markets begin trading outside of a consolidation zone, and we’re these breakouts typically turn into trends. All of these conditions present trading opportunities.
Example ‘A’ is a diagram of a range-bound market, with support and resistance (highs and lows). These areas are also sometimes called; floors and ceilings and where price action will typically move up and down within these ranges. Sometimes traders refer to this as sideways trading.
Example ‘B’ shows a breakout of a previously ranging market, and where a floor or ceiling has been breached and where price action advances outside of the range. We have added a trend line A, B, C. D, where price action to the upside has begun to fade, and wher moves have been limited to this new are of resistance. Incidentally, the line continues to be a support move for the breakout at area D, which again proves to be a barrier for the bulls!
Example ‘C’ shows a trending market. In this type of market, traders look for repeated signs, such as in a bull market (ascending) market and where each high is higher than the previous high, and where each low point (pullback/retracement) is higher than the previous low. The correct terminology is: higher highs and higher lows.
Example ‘D’ in a bear trend (descending) market, the reverse applies, and now traders look for lower highs and lower lows.
So, we know what we are looking for: range-bound, breakouts, and trends, in which case, when is the best time to be looking to trade them?
Let’s consider that you live in the United Kingdom and you want to trade the pound against the US dollar, AKA Cable, trading this pair at 11 PM (Sun-Fri) would not be a particularly good idea, because the European, London, and US markets will be closed at this hour, and the Asian region traders will be coming to market. This could mean that Asian traders have a different view than the other regions, regarding the value of the pound against the US dollar, or and which could be the start of a trend reversal. This could go against technical analysis as inherited
from the aforementioned markets.
Another reason could be that typically Asian markets at this time might be more focused on their own domestic currencies, such as the Yen, Australian and New Zealand dollar, for example. This would, therefore, have the effect of potentially leaving cable with little volume and, therefore, flat. Therefore, for the best time to trade the Cable would be during the European session, including London.
Another thing to be mindful of is the immediate, or near-term financial, economic calendar, especially when it comes to interest rate decisions, gross domestic product GDP releases, and on a more topical note event surrounding Brexit.
However, because currencies are traded in pairs, it is also highly advisable to observe the financial calendar releases for the counter currency, in this case, the US dollar.
We would also recommend caution when trading any of the major currency pairs when an unrelated pair is about to have an economic-related news release as this could impact the counter currency, and which may have a knock-on effect and impact on your trade.
Her is an example: let’s say that you are buying Cable, and the European Union announces an unexpected ten basis point interest rate reduction. This could cause the value of the Euro to fall and cause the US dollar to rise sharply. Thus potentially resulting in a knock-on, or adverse effect on your trade, where you need a weaker dollar and stronger pound.
Please also note that range-bound markets, breakouts, and trends will have a completely different complexion depending on the time frame that a trader chooses to trade with. For example, a 1-minute time frame, which is typically used by scalpers, or intraday traders, tends to be more frantic than a 1-hour time frame, and will also typically offer less movement in terms of pips. Hedge funds, institutions, and governments tend to hold longer views and therefore use longer time frames such as daily, weekly, and monthly set-ups.
Price action traders’ main job is to watch the price action and find out the message out of it. The message comes from candles, various charts, momentum, as well as
Price action traders’ main job is to watch the price action and find out the message out of it. The message comes from candles, various charts, momentum, as well as
Price action traders’ main job is to watch the price action and find out the message out of it. The message comes from candles, various charts, momentum, as well as the attributes of breakouts. In this lesson, we are going to demonstrate an example of a breakout, which occurs with more than one candle. Let us find out whether a breakout with multiple candles gives us any message or not.
The price finds its support at the marked level and heads towards the North with good buying pressure. Price action traders start eyeing on the pair to go long on the pair. The first thing they would want is consolidation. Let us proceed to the next chart.
It seems that the price may have started having a pullback. The price is to come about 38% of the trend’s length to attract the buyers to watch for an upside breakout. Let us see what happens next.
The last candle seems to have covered a good distance. The buyers are going to be keen to get a bullish reversal candle on the chart now. If a reversal candle makes a breakout itself, it attracts traders more. Eventually, it pushes the price towards the trend’s direction at a good pace. Let us find out what happens here.
Here it comes. The bullish reversal candle is here. It is a ‘Track Rail,’ which is the second strongest reversal candle after the Engulfing candle. Traders are to wait for an important event. You know what that is, right?
‘The Breakout’!
The breakout occurs here by a Marubozu candle. Price action trader shall trigger a long entry right after the candle closes. Before triggering the entry, a trader must know where to set his Stop Loss and Take Profit. Stop Loss level is obvious here, which is below the support of the consolidation zone. Where the Take Profit level is to be set? Ideally, a 1:1 risk-reward ratio is the first target in any entry. However, there seems to be enough space for the price to travel. We may go for 1:2 risk-reward here. Does a trader go for a 1:3 risk-reward ratio or even more here? We get the answer later. Meanwhile, let us continue watching the drama.
The plan seems to be working amazingly well. The price heads towards the North with good buying momentum. 1:1 risk and reward ratio is easily achieved within the next candle. 1:2 risk-reward is achieved as well. Some may start splitting the hair for not setting the target with a 1:3 risk-reward ratio. Let us proceed.
The price has produced an Evening Star. This surely is not a good sign for the buyers. Those who set their Take Profit with a 1:3 risk-reward ratio must be in a pensive mood.
The price does not hit the Stop Loss, but there is no profit left for the buyers that are holding the positions. Targeting a 1:3 risk-reward ratio does not bring more pips. It rather makes them lose some pips that they could have earned.
Price Action breakout attributes suggest that if a breakout occurs with multiple candles, the trend often loses its impetus early. Thus, it is best to target 1:1 (in most cases), 1:2 (if there is enough space) risk-reward ratio when a breakout occurs by more than one candle.
The European Central bank rate decision is scheduled to release at 11:45 GMT, and Mario Draghi will conduct the press conference at 12:30 GMT. Apart from this, the
The European Central bank rate decision is scheduled to release at 11:45 GMT, and Mario Draghi will conduct the press conference at 12:30 GMT. Apart from this, the
The European Central bank rate decision is scheduled to release at 11:45 GMT, and Mario Draghi will conduct the press conference at 12:30 GMT. Apart from this, the EUR/USD currency pair may get any fresh hints from the United States Durable Goods order, which is scheduled to release at 12:30 GMT and the German preliminary Manufacturing PMIs and Eurozone due in the European trading hours.
Economic Events to Watch Today
Let’s took at these fundamentals.
GBP/USD– Daily Analysis
The GBP/USD currency pair consolidating in the narrow range near the 1.29 and could continue to trading in the tight range due to the Brexit Uncertainty.
As the Prime Minister Boris Johson failed to convince parliament to approve the Brexit deal as a law, therefore Prime Minister Boris Johnson is now on the waiting mood that the Europan Union to decide whether to agree to his 3-months delay request.
Moreover, PM Boris Johnson Spokesman has stated that the election will be compulsory if the European Union approved a request for a 3-month delay.
However, there are very fewer chances that the European Union will decide before Friday. So, traders will be cautious until any fresh news does not come.
The GBP/USD currency pair may beat the recent highs around the 1.30 in the American trading hours if the United States Goods order data release below expects figures, by the way, the data is scheduled to release at 12:30 GMT, rising the dovish Federal Reserve expectations.
It should also be remarked that the United States Central Bank is expected to deliver a rate cut by the 25-basis-points at its coming meeting.
Daily Support and Resistance
S3 1.2733
S2 1.2813
S1 1.2864
Pivot Point 1.2894
R1 1.2945
R2 1.2974
R3 1.3054
GBP/USD– Trading Tips
The GBP/USD has broken the bullish channel, which was carrying the pair near 1.2945. The formation fo a bearish engulfing candle is suggesting chances of a bearish reversal in the GBP/USD pair.
On the lower side, the Sterling may find support at 1.2785 level, which also marks a double bottom on the 4-hour chart. Besides, the resistance stays at 1.2945 level. Consider staying bearish below 1.2920 today.
EUR/USD – Daily Analysis
During the early Asian session, the EUR/USD currency pair trying to cross the 100-hour Moving Average level at 1.1140, mainly due to the European Central Bank (ECB) rate decision, which will be the last decision by the Mario Draghi as president.
The central bank rate cut by ten-basis points to -0.5% during September and announced a new step of the asset purchase program.
Europan Central Bank hasn’t many reasons to change its position at today’s meeting because the recent macro data report has been positive. Moreover, the European Central Bank members were divided due to the need to reviving bond purchases.
However, the bearish trend seems limited because the September month stimulus has been priced in. Besides this, it appears that markets are more interested in knowing hints by the incoming President Christine Lagarde in 2019 and 2020.
The European Central bank rate decision is scheduled to release at 11:45 GMT, and Draghi will hold the press conference at 12:30 GMT. Apart from this, the EUR/USD currency pair may get any fresh hints from the United States Durable Goods order, which is scheduled to release at 12:30 GMT and the German preliminary Manufacturing PMIs and Eurozone due in the European trading hours.
An unexpectedly weaker US data will support the dovish Federal Reserve expectations, and probably this greenback will drop across the board. Notably, the markets remain expecting the Federal Reserve will deliver the rate cut by the 25-basis-points on October 30.
Daily Support and Resistance
S3 1.1058
S2 1.1092
S1 1.1112
Pivot Point 1.1126
R1 1.1147
R2 1.1161
R3 1.1195
EUR/USD – Trading Tips
The EUR/USD consolidates between 1.1116 and 1.1157 after placing a high around 1.1160 at the start of the week. For now, the EUR/USD is likely to continue consolidating in the narrow range of 1.1110 – 1.1150, at least ahead of the ECB rate decision.
The EUR/USD is bearing double bottom support at 1.1110 regions, and over this, we can anticipate a bullish trend in the EUR/USD until 1.1150 and 1.1180. On the flip side, selling can be expected beneath 1.1110 till the 1.1065 area.
USD/JPY – Daily Analysis
The USD/JPY currency pair flashing red and declines to 108.60, due to downbeat Brexit news increased the risk-on sentiment. The USD/JPY currency pair recently got support from the upbeat headlines regarding the United States and China trade agreement and Brexit, not to ignore the greenback weakness due to soft data. Although the increases could not long term due to the current threats from the United Kingdom. As of consequence, the recovery in the United States ten-year US treasury yields could not take much longer, whereas Wall street also ended with minor increases.
Brexit headlines and SIno-US trade headline keeps the markets cautious, as fears of hard Brexit and a potential trade deal between the United States and China.
Europan Central Bank hasn’t many reasons to change its position at today’s meeting because the recent macro data report has been positive. Moreover, today’s last meeting of President Draghi’s should be directed on the Governing Council’s views on the economic and geopolitical outlook, especially should talk about Germany’s slowdown as well as on the loud criticism by some Europan Central Bank member of restarting asset purchases.
The ECB’s policy meeting will be under the eyes overnight, but the market doesn’t anticipate much action after last month’s rate cut package.
On the other hand, the US Durable Orders, Purchasing Managers Index, and New Home Sales will also keep under focus.
Daily Support and Resistance
S3 107.69
S2 108.12
S1 108.39
Pivot Point 108.55
R1 108.81
R2 108.97
R3 109.4
USD/JPY – Trading Tips
The USD/JPY gained support above 108.280, the triple bottom level, which triggered a bullish reversal in the USD/JPY. At the moment, the bullish trend seems pretty strong, but the USD/JPY may find an immediate resistance at 108.900 area first.
The MACD and Stochastics have diverted their direction to the bullish side, signaling chances of further buying in the pair. Today, the violation fo 108.270 can help us capture a quick sell position until 107.950. Whereas, buying can be seen until 108.900 level.
Price action is a discipline of identifying price action trends (up and down movement) reversals, support, and resistance via technical analysis on a trading chart during a
Mastering Price Action
Price action is a discipline of identifying price action trends (up and down movement) reversals, support, and resistance via technical analysis on a trading chart during a
Mastering Price Action
Price action is a discipline of identifying price action trends (up and down movement) reversals, support, and resistance via technical analysis on a trading chart during a specified period of time. Price action analysis is used in conjunction with global news events and economic data releases, which act together in order to influence exchange rates.
Most technical traders profit by devising a strategy which actually combines both price action, fundamental analysis, and their overall understanding of technical analysis. All these factors work hand-in-hand with each other.
Different tools can be applied to a chart to make trends in price action more obvious for traders. And where technical analysis formations and chart patterns are derived solely from price action.
Example ‘A’
Example ‘A’ is a 2-hour line graph of the British pound against the American dollar, also known as Cable. Let’s disregard the comments on the graph and simply focus on the actual line graph itself, which denotes the up and down movements – or price action – of the exchange rate of this currency pair. If we only used this line graph to trade this particular pair, we would find it extremely difficult to know when to open a trade in any particular direction. It simply looks chaotic and random!
However, looking a little more closely we can see a peak on the left hand side of the chart which occurs at the 1.2567 exchange rate level, before price action descends to the 1.22 level, which is a key level, and where we might expect to find some potential support, (a floor in this example) and where indeed the price flattens out here and which marks the end of trend ‘A’.
Price then moves higher throughout trend B and where we see a couple of spikes, some pullbacks, and then a continuation to the peak of 1.2850; another key level (in this case, a potential ceiling).
Example B
In example B, we have changed the line graph to Japanese candlesticks, a style of technical analysis which is more widely used in the trading community and which is much easier to read in terms of potential fading of price action and therefore possible opportunities to enter the market more easily.
Here we can see for example that our initial peak on the left-hand side of the screen showed a high, as denoted by the green (bullish) candlesticks, which was replaced by a red (bearish) candlestick – which was larger than the preceding two candlesticks – and was a warning to traders of a potential pullback, or a reversal of price action.
Indeed price begins to fall before almost returning to trendline ‘A’ and then continues the momentum to the downside. Eventually, the price action returns to our trend line before continuing the move lower by way of a series of falls and pullbacks and where trendline ‘A’ has become a simple moving average.
After the price action flattens out at the 1.22 level, we are able to identify a move higher and where the larger candlesticks (a sign of a strong trend) move above the trend line or simple moving average, and this starts a price action reversal. When price crosses the extended trend line ‘A,’ this becomes a signal of a new trend, and indeed trendline ‘B’ becomes a simple moving average to the peak of 1.2850.
Example C
Now let’s look at candlesticks a little more closely. In example ‘C’ we have magnified a section of price action in order that we can analyze the candlesticks in more detail. Note that price action, as denoted by the green candlesticks, is in an upward trend. The last green candlestick in this sequence is called an upside-down hammer. This has a smaller ‘wick’ at the bottom, a small ‘body,’ and then a longer wick at the top: Hence the term upside down hammer. At its height, the price has moved to the highest point and then pulled back before the next candlestick opens. The subsequent candlestick is a descending candlestick with a long body, and one small wick at the top, and where the candlestick is longer than the preceding two bull candlesticks. This type of Candlestick is an engulfing candlestick (it engulfs the previous ones), and often sets the precedent for any subsequent move; in this case lower.
Example D
In example ‘D’ we can see that the bulls have been in control of the price action and moved the exchange rate up to trendline ‘A.’ However the subsequence candlestick is a bearish candlestick, which engulfs the body of the previous candlestick, and where price action begins to trend lower. In the middle of the sequence, we see another hammer shape candlestick, but this time it has a longer wick at the bottom, and traders have taken advantage of this and move the price higher. Many of the candlesticks in the remainder of this sequence are very small, and this usually denotes that there is a lack of volume at the present moment in time.
Example E
Now we turn our attention to example ‘E,’ where we have magnified the price action around the key 1.22 area. Many of the candlesticks we see have small bodies, and where some of the candlesticks have small wicks; these types of candlesticks are called ‘spinning tops’ and usually denote a lack of direction and a lack of volume in the market. Towards the end of this sequence, we can see that the last two bullish green candlesticks open above the preceding ones, and both of these have long bodies with small wicks, which ingulf the previous candlesticks from the beginning of the move in this highlighted sequence. They form our new bullish move, which we have called trend ‘B.’
Therefore, the candlesticks become a much better tool to read price action. Suddenly the chaos and randomness ebb away! Remember, the larger the candlestick, the stronger the trend. Candlesticks are the best available tool for mastering price action. They are a leading indicator, and when combined with other technical analysis tools will help you get an edge in your trading! We will identify more Japanese candlesticks later in our course.
The safe-haven metal prices fond on the bullish track due to fresh Brexit headlines. Prime Minister Boris Johnsons Brexit bill gained the parliamentary support, but the government timeline of just
The safe-haven metal prices fond on the bullish track due to fresh Brexit headlines. Prime Minister Boris Johnsons Brexit bill gained the parliamentary support, but the government timeline of just
The safe-haven metal prices fond on the bullish track due to fresh Brexit headlines. Prime Minister Boris Johnsons Brexit bill gained the parliamentary support, but the government timeline of just three-days discussion on the bill was rejected.
The Chances of Britain departing the European Union before the deadline date of 31 October has dropped sharply, mainly due to parliamentary failure.
On the other hand, the headline came from the Prime Minster Boris Johnson office said that if the European Union agree to a delay until January, then the only way to shift from Britain’s Brexit crisis is a new election.
At the US-China trade front, Chinse Vice Foreign Minister Le Yucheng said during this week that the China and United States reached on some developments in trade talks, as well as he said that as long as both nations respected between ourselves, all problems can resolve.
Trouble in Hong Kong also gained some attention, after the financial Times reported overnight that China is considering replacing Hong Kong’s chief executive, Carrie Lam, by March.
Daily Support and Resistance
S3 1474.16
S2 1480.41
S1 1484.27
Pivot Point 1486.66
R1 1490.52
R2 1492.91
R3 1499.16
Consider trading bearish below 1,497 area with a stop loss above the 1,500 level. Conversely, selling trades can be taken below 1,496 to target 1,486. All the best!
Breakout is one of the most important factors in trading. Attributes of a breakout give clues with what traders can manage their opened position to make more profit. Price action
Breakout is one of the most important factors in trading. Attributes of a breakout give clues with what traders can manage their opened position to make more profit. Price action
Breakout is one of the most important factors in trading. Attributes of a breakout give clues with what traders can manage their opened position to make more profit. Price action traders, in particular, love to compute the attributes of a breakout to determine their take profit level.
In this section, we are going to demonstrate an example of a single candle breakout and its impact afterwards. Have a look at the chart below.
The price finds support at the red market level and heads towards the North. The price action suggests that the buyers are going to control the pair. A downward correction/consolidation followed by a bullish reversal candle at a value zone is what they need to wait for. Let us find out what happens next.
The price seems to have started having a pullback. The first corrective candle comes out as an Inside Bar, which is a good sign for the buyers. The buyers wait for the price to come back at a level of support with a reasonable distance from the resistance. Let us see how far it comes up to.
The price has crossed a good distance from resistance. The buyers are to wait for a bullish reversal candle. Ideally, a bullish engulfing candle is the first choice for the buyers. Other candles such as Inside bar, Spinning Top do the job as well, but an engulfing candle’s signal attracts more traders, and it brings more liquidity. Let us see what happens next.
Price action traders dream of such a reversal candle. This is not only a bullish engulfing candle but also an engulfing candle, which breaches the highest high of the last wave. Let us draw the consolidation zone on the chart.
The reversal candle makes the breakout with good momentum. A trader shall trigger a buy entry shall right after the candle closes. When a reversal candle itself makes a breakout, it makes the fore coming move go towards the trend’s direction with good momentum. Look at the chart below.
Look at the pace of the bullish move after the breakout. Here is another very important factor that traders must remember. A single candle breakout usually offers a 1:2 risk-reward ratio. This means traders shall add some extra pips with their profit target when they get such price action. The drama remains. Have a look at the chart below.
The price makes a correction and seems to have found support again. It suggests that the buyers are still in control. Smart buyers take their Partial profit and let the rest of the trade run to earn more pips.
As mentioned, breakout attributes give clues about the trend’s strength. Eventually, this helps traders manage their trade nicely and make more money out of trading.
Intermarket Analysis studies the correlation or relationship between different markets or assets. In this educational article, we will review how to apply the correlation analysis within the Elliott Wave Principle.
Intermarket Analysis studies the correlation or relationship between different markets or assets. In this educational article, we will review how to apply the correlation analysis within the Elliott Wave Principle.
Intermarket Analysis studies the correlation or relationship between different markets or assets. In this educational article, we will review how to apply the correlation analysis within the Elliott Wave Principle.
The basics
In financial markets, we use the correlation to measure the relationship between two or more assets. These assets can be from the same or different markets.
For example, we can analyze the relationship between a commodity and a currency pair. In the first figure, we observe the relationship between Crude Oil (NYMEX:CL) and the FX pair US Dollar – Canadian Dollar (USDCAD).
From the figure, we observe that Crude Oil holds an inverse relationship with USDCAD. It means that, if CL soars, the USDCAD should decrease, and vice-versa. This type of correlation is known as negative or inverse correlation.
In the contrarian case, when an asset moves in the same direction that the second one is known as positive or direct correlation.
The second key concept in the Intermarket analysis is convergence and divergence. In the same way that we use and identify divergences, or deviations, on technical indicators, we use it with correlations. Divergences allow us to foresee the exhaustion of a sequence.
From the figure one, we identified the divergence with the red arrow. In the example, we observe at the end of a wave, when Crude Oil soars, the Loonie decreases. In general, we find divergences when the fifth wave is in progress.
Putting all together
The next chart corresponds to the NASDAQ Biotechnology ETF (IBB) and the stock price chart of MERCK & Co. (MRK), in the weekly timeframe and log scale.
In this case, both assets belong to the same sector. Thus, we expect a positive correlation with each other. From the chart, we observe that IBB and MRK started a rally in the third quarter of 2009.
MRK looks like it’s near to end the bull trend; however, IBB unveils an incomplete bullish five-waves sequence.
Finally, please, note how the divergence appears at the end of the third wave on IBB, while MRK started the wave four.
On Wednesday, the dollar rose versus its peer currencies as a risk spread ahead of the British parliament’s vote on the Withdrawal Agreement Bill, which will reflect light on when
On Wednesday, the dollar rose versus its peer currencies as a risk spread ahead of the British parliament’s vote on the Withdrawal Agreement Bill, which will reflect light on when
On Wednesday, the dollar rose versus its peer currencies as a risk spread ahead of the British parliament’s vote on the Withdrawal Agreement Bill, which will reflect light on when and how Britain will exit the Eurozone.
The British Pound currency was found on the selling track, although Prime Minister Boris Johnsons Brexit bill gained the parliamentary support, the government timeline of just three-days discussion on the bill was rejected.
The European Union Consumer Confidence is scheduled to release at 14:00 GMT. Hence, the European Central Bank, Andrea Enria, is expected to deliver the speech at an event in Madrid at 08:45GMT.
Economic Events to Watch Today
Let’s took at these fundamentals.
GBP/USD– Daily Analysis
The GBP/USD currency pair came under pressure, and the pair is currently trading below the 1.2850. As well as, the pair failed to hit the critical support range on Tuesday, mainly due to Brexit uncertainty and delay. The 50-hour and 100-hour Moving Averages are found at 1.2940 and 1.2905, respectively.
The British Pound currency was found on the selling track, although Prime Minister Boris Johnsons Brexit bill gained the parliamentary support, the government timeline of just three-days discussion on the bill was rejected.
The chances of Britain departing the European Union before the deadline date of October 31 has dropped sharply, mainly due to parliamentary failure.
On the other hand, the headline came from the Prime Minster Boris Johnson office said that if the European Union agree to a delay until January, then the only way to shift from Britain’s Brexit crisis is a new election.
Forecast view, the ongoing uncertainty regarding Brexit could continue to push the GBP lower. Moreover, the pair is trading well below the 100-hour Moving Average for the 1st time since October 11.
It should be noted that the greenback may gain some haven buying due to the risk-off sentiment in the equity markets and trade uncertainty.
Daily Support and Resistance
S3 1.264
S2 1.278
S1 1.2839
Pivot Point 1.292
R1 1.2979
R2 1.306
R3 1.32
GBP/USD– Trading Tips
The GBP/USD has violated the bullish channel, which was supporting the pair around 1.2945. The formation fo a bearish engulfing candle is suggesting chances of a bearish reversal in the GBP/USD pair.
On the lower side, the Sterling may find support at 1.2785 level, which also marks a double bottom on the 4-hour chart. Besides, the resistance stays at 1.2945 level. Consider staying bearish below 1.2920 today.
EUR/USD – Daily Analysis
During the early Asian session, the EUR/USD currency pair hit the bearish track, having gained acceptance below the 100-day M.A. yesterday. The EUR currency came under selling pressure, mainly due to the decline in the GBP currency as the Brexit obstacle.
If talking about the past movement of EUR, Brexit certainty has sent the shared currency above the 100-day Moving Average on October 18.
On the technical side, the EUR/USD currency pair found on the inverted hammer on Monday and ended well below the inverted hammers low of 1.1139 on Tuesday.
So, the EUR currency could drop further, notably if the German ten-year bond yields extend Tuesdays 4-basis-points decline to -0.38%.
Moreover, the greenback may gain some haven buying, adding to the bearish pressures near the EUR/USD currency due to the risk-off sentiment in the equity markets.
On the other hand, the European Union Consumer Confidence is scheduled to release at 14:00 GMT. Hence, the European Central Bank, Andrea Enria, is expected to deliver the speech at an event in Madrid at 08:45GMT.
Daily Support and Resistance
S3 1.1056
S2 1.1096
S1 1.1113
Pivot Point 1.1135
R1 1.1153
R2 1.1175
R3 1.1214
EUR/USD – Trading Tips
The EUR/USD currency was trading 1.1116 and 1.1157 yesterday, hit the lowest range. As for today, the EUR will likely to continue consolidating in the narrow range of 1.1110 – 1.1150.
The EUR/USD is also facing double bottom support at 1.1110 area, and above this, we can expect to buy a trend in the EUR/USD until 1.1150 and 1.1180. On the other hand, selling can be expected below 1.1110 until the 1.1065 area.
USD/JPY – Daily Analysis
The USD/JPY currency pair is flashing red and representing 0.16% declines on the day. As of writing, the USD/JPY currency pair currently trading at 108.30, as the time of writing, the pair traveled from a high range of 108.51 to a low range of 108.25.
The USD/JPY currency pair may end with a much higher daily loss, as the four-hour chart is showing a head-and-shoulders breakdown.
Such as Prime Minister Boris Johnsons Brexit bill gained the parliamentary support, but the government timeline of just three-days discussion on the bill was rejected.
Notably, Prime Minister Boris Johnson made a plan to meet with European Union leaders once again to discuss the timeline, and the chances of an early election are increasingly, but Brexit delayed beyond the elections.
At the data front, the Oct Richmond Fed manufacturing survey rose firmly to +8 (est. -7, prior -9). Increases were comprehensive, with noted raises in employment and new orders with expectations edging higher in addition to stronger current conditions. United Step Sep existing home sales slid -2.2%m/m (est. -0.7%m/m). However, at 5.38mn (est. 5.45mn), the annualized level continues close to post record highs, and NAR’s chief economist continues to cite a shortage of stock and supply.
The United States’ two-year Treasury yields were moving between 1.59% and 1.63, whereas the ten-year yield traveled between 1.76% and 1.80%. Markets are expecting 22-basis points of a rate cut at the October 30 meeting and a terminal rate of 1.24% against % currently.
Daily Support and Resistance
S3 108.09
S2 108.31
S1 108.41
Pivot Point 108.53
R1 108.63
R2 108.75
R3 108.97
USD/JPY – Trading Tips
Recalling our previous update, the USD/JPY was trading in the bullish channel, which was extending support at 108.350. This bullish channel is now violated. As anticipated, the violation of 108.350 is extending bearish rally until the 108 level.
The MACD and Stochastics are consistently pointing into the selling zone, signaling odds of a bearish bias.
The USD/JPY may attain a critical resistance at 108.57, along with support at 108.300. Today, the violation fo 108.270 can help us capture a quick sell position until 107.950.
On Monday, the safe-haven metal prices rose but remain below the level of $1500 as the United States and China completed one round of trade meetings, and the United States
On Monday, the safe-haven metal prices rose but remain below the level of $1500 as the United States and China completed one round of trade meetings, and the United States
On Monday, the safe-haven metal prices rose but remain below the level of $1500 as the United States and China completed one round of trade meetings, and the United States planned to delay tariff on Chinese goods this week. Gold contract slipped 0.2% to trade at $1,491.35.
The U.S. President Donald Trump sketched the first round of a deal to settle the protracted Sino-U.S. trade war and halted a vulnerable tariff hike, the most significant step by the two nations in 15 months.
In return for the U.S. decision to delay tariff, China agreed to buy $40 billion and $50 billion in U.S. agricultural goods. More steps will be reached in the second phase, the president said.
The safe-haven metal prices swiftly dropped after the report came that the investors adopted the risky assets and dropped the safe-havens.
Technically, the Fibonacci retracement levels are playing a significant role. As you can see on the 2-hour chart above, the XAU/USD is trading right below the 38.2% retracement. This level used to work as resistance last week, but now, the same level is working as a resistance.
The closing of a 2-hour candle below 1,496 is suggesting bearish bias among traders. On the lower side, gold may find support at 1,486 and 1,480 level today.
Daily Support and Resistance
S3 1430.45
S2 1459.63
S1 1474.37
Pivot Point 1488.82
R1 1503.56
R2 1518
R3 1547.19
Consider staying bearish below 1,494 areas to target 1,487 and 1,482 today. On the flip side, buying can be seen in over 1,496 areas.
In today’s lesson, we are going to demonstrate an example of how the price heads towards the direction of the trend upon a breakout. We know that it is not
In today’s lesson, we are going to demonstrate an example of how the price heads towards the direction of the trend upon a breakout. We know that it is not
In today’s lesson, we are going to demonstrate an example of how the price heads towards the direction of the trend upon a breakout. We know that it is not only the breakout that traders shall be looking at. There are other factors, such as consolidation or correction, breakout confirmation, and the signal candle. Let us have a look at what the price does before offering us an entry.
The price heads towards the North and has a rejection. Look at the candle at the top (arrowed candle). This is where the price has its first rejection and lands at the support zone. The price has another rejection at the level below (arrowed candle). However, it continues the consolidation. As a trader, you have to wait for a price to make a move either to make a breakout at the support of the consolidation or the resistance level. Let’s see what happens next.
Oh! Upside breakout! This is how a breakout candle should look like. It closes just below the second resistance. The first resistance is now a support. The price is to make a pullback to confirm the breakout. Let us see what happens next.
It rather continues its bullish journey and makes a breakout at the second level of resistance as well. Guess what shall we do here? Shall we wait for the price to come back to the first breakout level or the second breakout level? Have a look at the chart below.
The breakout level seems to be held and produces a bullish candle already. Shall we consider taking an entry here? The answer is no. The price does not come up to the breakout level. Let us see what happens next.
Look at the last candle. A bullish engulfing candle closes above the last highest high and confirms the breakout level by having a bounce on it. This is the signal candle price-action traders crave for. A buy entry may be triggered right after the candle closes by setting Stop Loss below the candle’s lowest low. In this case, the candle’s lowest low and breakout level are the same. If the signal candle had a bigger lower shadow below the breakout level, the Stop Loss should have been set below the candle’s lowest low.
About setting Take Profit level, there are several ways to determine it. To be very safe, you may have 1:1 risk and reward. This means the number of pips that we have set as our Stop Loss from the entry point; we shall set our Take Profit at a distance with the same amount of pips.
The price travels almost twice the distance than we have anticipated. Never regret, but keep studying to learn how to maximize your risk and reward ratio. We will write some articles on this. Stay tuned.
On Wednesday, the precious metal gold prices trade sideways in a narrow trading range of 1,512 – 1500 in the wake of mixed economic events. Moreover, the uncertainties encompassing
On Wednesday, the precious metal gold prices trade sideways in a narrow trading range of 1,512 – 1500 in the wake of mixed economic events. Moreover, the uncertainties encompassing
On Wednesday, the precious metal gold prices trade sideways in a narrow trading range of 1,512 – 1500 in the wake of mixed economic events. Moreover, the uncertainties encompassing the United States and China trade war and dark Brexit headlines depressed investors’ sentiment. The gold futures for December delivery gained 0.5% to $1,511.83 at the start of the European session.
A report came from South China that China stepped back from the high-level trade talks between the United States and China. The report said the Chinese delegation might enter in Washington a day earlier than scheduled.
China also gave warning that they would hit back after the United States blacklisted a list of Chinese tech companies in the wake of China treatment with Muslim minorities, which ultimately threats increased incoming talks between the United States and China.
On the Brexit front, German Chancellor Angela Merkel told Boris Johnson, U.K.’s Prime Minister, that Northern Ireland has to continue being part of the customs union in any deal, which Johnson said has paved the way for a no-deal Brexit.
Gold – Technical Outlook
Technically, the XAU/USD has formed an ascending triangle pattern, which is keeping gold steady below 1,512 resistance level. The ascending triangle pattern is extending support at 1,500 level.
Typically, these ascending triangle patterns break out on the upper side and may extend bullish rally up to 1,534 in a medium run.
Daily Support and Resistance
S3 1459.04
S2 1480.2
S1 1492.88
Pivot Point 1501.36
R1 1514.04
R2 1522.52
R3 1543.68
Consider taking a buying position on the bullish breakout of 1,513 to target 1,525 and 1,530.
Today in the early European session, the safe-haven metal prices slipped due to less expectation of the rate cut by the Federal Reserve. Earlier today, the U.S. Gold was
Today in the early European session, the safe-haven metal prices slipped due to less expectation of the rate cut by the Federal Reserve. Earlier today, the U.S. Gold was
Today in the early European session, the safe-haven metal prices slipped due to less expectation of the rate cut by the Federal Reserve. Earlier today, the U.S. Gold was down by 0.6% at $1,495.85 as Fed Rate Monitor Tool showed a high chance for a quarter-point rate cut when the Federal Reserve meets Oct. 28-29 at 69.5 percent, versus 72.7 percent on Monday and 78 percent on Friday. The lowered chances of easing by the Federal Reserve continued to hurt gold in post-settlement trade, sending it under the critical $1500 level.
As of writing this, the precious metal gold prices are surging in the wake of boosted safe-haven appeal amid the uncertainty. China-U.S. trade talks are expected to affect gold’s movement late this week when high-level negotiations between the two sides resume this Thursday.
Trade discussions are expected to manage the gold prices movement during this week when both high-level officials will do talks between the two sides’ resumes on Thursday.
At the Hong Kong front, the government of Hong Kong invoked a colonial-era emergency law to stop protesters wearing face masks. Due to this decision, further made the worst environment, which damage China’s banking facilities and retail outlets in the entire city.
Gold – Technical Analysis
On the technical front, gold has for Doji pattern at 1,497 area, which has to extend support to gold since the morning while the RSI and MACD are shifting in the buy zone.
Daily Support and Resistance
S3 1456.57
S2 1476.39
S1 1484.55
Pivot Point 1496.21
R1 1504.37
R2 1516.03
R3 1535.85
Three bullish candles on the 4-hour chart are signaling chances of a further bullish trend. Today, gold may find an immediate resistance level at 1,513 and support at 1,487 level. Consider staying bearish below the triple top level of 1,513 zones.
Volume
Historically, and this is especially true in traditional equity markets, volume is often the most important indicator out there. Some people argue that volume is not overly reliable in
Volume
Historically, and this is especially true in traditional equity markets, volume is often the most important indicator out there. Some people argue that volume is not overly reliable in
Volume
Historically, and this is especially true in traditional equity markets, volume is often the most important indicator out there. Some people argue that volume is not overly reliable in forex markets. There is a significant debate on whether volume should be considered as important in forex markets as it is in equity markets due to the drastic differences in the amount of volume from one broker to another. Others believe that it is already (we can see volume from many of the exchanges). For the stock market and futures and almost any traded instrument, volume tells you what people are doing. And what they are not doing.
Volume helps you spot reversals and can tell you if the reversal candlestick is a ‘true’ candlestick. For example, in the image below, the hammer candlestick forms at or near the end of a downtrend. However, this candlestick (and those before it) should have increased and above-average volume. A hammer candlestick on high volume in a downtrend can be a great signal when you accompany it with another indicator, like the RSI.
Look at number one. The arrow is pointing to a very large hammer candlestick; the volume column is massive and definitely above the average volume (orange line average volume). If we look at the RSI, it is oversold. Those can be great conditions for going long!
Candlestick Principles with Volume
Volume is an extremely important component of any candlestick. A candlestick tells us what happened to move price in that period, but volume tells us how hard people fought for that movement and how much conviction was in that move. Here are some principles about candlesticks to keep in mind.
The length of any wick, either the top or the bottom, is ALWAYS the first point of focus because it instantly reveals strength, weakness, indecision, and (more importantly) market sentiment.
If no wick, then that signals strong market sentiment in the direction of the closing price.
A narrow-body indicates weak sentiment. A wide-body represents strong sentiment.
A candle of the same type will have a completely different meaning depending on where it appears in a price trend.
Volume often validates price – Any candlestick that closes at or near an important high or low should be watched very closely for how much volume was involved.
High volume near highs and lows
Volume can give a clear, early warning that a current trend (long term or short term) may be coming to an end. If you observe price moving lower, but volume starts to increase and become greater than a 20 to 30-period average, then you may be looking at the bottom of a move. In other words, the market may reverse and become bullish. Observe the chart below:
Price is declining as the price is dropping. That is a clear sign that no one is interested in buying or supporting higher prices.
As prices have continued to make new lows, notice how the volume begins to spike higher – well above the most recent candlesticks volume.
This increase in volume indicates more participation and is generally a combination of new entrants going long (buying), and those current traders who are short, have to cover and convert to long. That volume becomes a powerful variable that reverses the price action.
Key Points
Look to see if the current chart is showing new and important highs or lows.
If new highs or lows are present, observe the volume indicator. If it is rising, then that can mean the current price action may reverse.
The safe-haven metal gold prices consolidate in the narrow range of $1,508.60 and $1,497 at the start of this week. The lack of volatility in the market was
The safe-haven metal gold prices consolidate in the narrow range of $1,508.60 and $1,497 at the start of this week. The lack of volatility in the market was
The safe-haven metal gold prices consolidate in the narrow range of $1,508.60 and $1,497 at the start of this week. The lack of volatility in the market was mostly due to the national holidays in China.
However, the precious metal gold prices slipped later during the European session as the dollar rallied after a report stated China was unwilling to consent to a broad trade deal with Washington. The bullion traded in a tight range as investors adopted a wait-and-see strategy before U.S.-China discussions this week.
As we know, it was all about the United States employment data, which is disappointing, and jobless rate prints a low of 3.5% during September, from 3.7% in August. The United States and Chinese trades are ready to start again this week. However, the Sentiment regarding trade war negotiations is not right.
Looking ahead into the fundamentals, some other key events are under the spotlight, including Federal Reserve chairman Powell’s speech, the FOMC minutes, and the United States Consumer Prices Index.
On the technical side, the gold prices started a day with a Doji candlestick on the charts and having the prices ending above the $1500 psychological level again.
The technical side of the market seems pretty clear as investor’s are consistently testing 1,497 support area. The violation of this level could extend the bearish trend until 1,492 and 1,487.
At the same level, we got the 50 periods EMA, which is also extending support at 1,497 zones.
The leading indicator, such as MACD and RSI, are holding staying in the neutral zone, suggesting indecision among traders today.
Daily Support and Resistance
S3 1465.24
S2 1485.38
S1 1495.05
Pivot Point 1505.52
R1 1515.19
R2 1525.66
R3 1545.8
I would rather stay out of the market until we have clear direction about the market and clear path means either the bearish breakout of 1,497 or bullish candles closing above the same level.
Hello, and welcome to this latest edition of our course on demand which has been brought to you by Forex dot Academy. So, in
[embed]https://youtu.be/CRmp_Ntl9hg[/embed]
Hello, and welcome to this latest edition of our course on demand which has been brought to you by Forex dot Academy. So, in
Hello, and welcome to this latest edition of our course on demand which has been brought to you by Forex dot Academy. So, in this course, we will be discussing mastering price action trading. So, just before we get in, and explain what’s involved, please do take a quick moment to read through our disclaimer, and the information is there currently up on the screen. Do feel free to pause this recording, if you need additional time okay.
So, let’s start with a webinar outline, and we look at the principles behind price action we’ll have a look at, what you would need to consider. If you look to master these principles of price action, we look at the importance, and the role that Japanese candlesticks will actually play in that decision-making process we look at their price action patterns which are then created we’ll have a look at the role of technical analysis, and we’ll finish with just an approach in which you can look to master price action trading strategy itself okay. So, let’s start with price action principles. So, price action training is – a discipline of basing all of your trading related decision-making processes on historical price movements that are displayed on a particular price chart. So, price charts reflect the beliefs, and actions of all participants trading the markets during a specified period of time, and it’s these beliefs that are portrayed on a market price chart in the form of price action. So, whilst economic data, and of course other global news events are absolutely the catalysts for price movements in a market technical training assumes that we don’t need to analyze them in order to trade the market successfully. Now, the reason for this is a very simple one all economic data, and world news that causes price movements within a market can ultimately be reflected solely in the price action or the price on a particular market price chart. So, if we talk about the value of the US dollar or the gold market or the oil market for example then all of that information is taken into account, and that price will either move higher it’ll move lower or it will continue to stay roughly at the same level, and it’s this information that those that trade price action can use in a very useful manner it’s also important to take on board that due to the fact of recent technological advancements, and the development of Japanese candlestick charting you know a lot of that has been responsible for the popularity of price action trading today. So, it does allow traders to recognize when certain structures occur in the market, and it also gives them the information to understand, what they mean in terms of price change, and how likely price is to move in any particular direction which does to the upside to the downside or potentially continue to move sideways some, what you’ll often find is many good trading opportunities occur even when price action traders realize that price structures break down, and reject areas of interest, and we call these types of scenarios structural failures. So, when even when you see structural failures, and price does not behave, and act like you anticipate it to do it still presents some fantastic opportunities for those that trade price action. So, in order to master price action training traders must gain experience in seeing price action set up on numerous occasions. So, you can build up the confidence to trade these setups, and navigate through the financial markets. So, a good analogy to use when we talk about price action is to think of trading price action like reading a book.
So, the entire book, of course, tells us a story just like the market does on a daily basis. So, what you’ll find is overall themes develop with many into thing plots, and subplots throughout, and it’s the same for the financial market. So, so then when you go down into a bit more detail think of each individual page as perhaps resenting a trading day which can then be subdivided in the paragraphs are little subplots, and these can be seen as effectively different candlesticks or price patterns which could effectively be the words on the particular page, and all of this is really useful information. Now, the market will trade each, and every day just like reading a long story and. So, as the theme or the story begins to develop in a book. So, does the theme or price section in a market. So, it’s quite a useful analogy just to do just to explain that it is like reading a story when you’re looking at a price chart it gives you some very valuable information and, if you can read that price chart, it can give you some a significant edge when trading okay. So, just looking at the foundation of price action it’s important to note that, if we look along the x-axis, what you’ll see when you look at a price chart is the timeframe of the chart that you’re looking at, and along the y-axis you’ll experience the price and, what you’ll experience over this timeframe is how price moves during this particular period, and what’s important to note from just looking at the price section that we’re seeing on on-screen currently is that this market moves from bottom left okay does move sideways a little bit for a period of time but then starts to push higher, and it’s currently trading top right. So, in general, overall, this market is moving to the upside, and it just happens to be a eurodollar daily candlestick chart. So, we’re constantly experiencing a battleground, and a battleground is just it’s where buyers and sellers come to do battle buyers are looking to push prices higher, and of course, sellers are looking to push prices lower whoever wins out will see a chart move in that general direction. So, we can experience a consolidated market for a period of time followed by a little bit of bullish price action, and you could argue as well a little bit more consolidation which is often, what you get after some you know a big bit of price action pushing prices higher okay. So, that’s just touching upon the concept and the idea behind the battleground, and it’s important to note that all price action trading decisions are made here on this chart or on a chart should I say. So, deciding when to buy or sell is made purely on, what is happening to price of price action.
So, we can glean some very useful information from what we’re currently seeing that can give us an edge when we look to navigate these markets okay. So, moving on to mastering price action, there’s a number of things we need to understand, and the first one is to understand the principles behind Japanese candlesticks. We then need to recognise price patterns which is a collection of candlesticks, and technical structures which exist in the markets, and price moves from those structures but can also break down those structures as well. So, that’s important to acknowledge to master price action you need to develop a price action methodology, and that’s just a way in which you can look to enter and exit these markets, and of course you need to be in the market long enough to be able to gain the confidence necessary which will allow you to also eliminate hesitation because, hesitation can prevent you from actually getting into those trades, and try to gain that all-important experience by learning from each technical setup, and acknowledging how priced behaves in those situations on a number of occasions, and that that’s, what will give you the to be able to master price action okay. So, focusing upon Japanese candlesticks in more detail, to begin with, in order for price action traders to consistently profitable profit from trading they must find a way to effectively assess how prices are trading in the markets. Now, observing Japanese candlesticks is the best way to do this. So, these candlesticks describe the interaction between buyers and sellers, and they tell us who has more control over price directions. So, if we talk about that battleground are the buyers in control of that market are the sellers and, if you understand that, and Japanese can help us with that Japanese candlesticks can help us with that then you will give yourself a really good basis in which to navigate these markets, and also the sizes shape of each candlestick provides us with unique information such as the trading range of the market within each particular time period whatever that may be, and how much pressure there was on either pushing prices hot to the upside or like I said to the downside. So, this is, what this is how Japanese candlesticks and our understanding of these candlestick patterns can really assist us when we trade, and to just give you a good example of this, you know why are they are so important in deciding price direction, because, when you can blend them with easy to identify levels of support resistance, and you see price action interacting, and behaving with these markets and, if you can see these three candlesticks are very bearish, ie pushing prices to the downside but, what you can clearly see is price then have become supported at this particular level because it’s understood by the market as a level of support.
So, what you see is a little bit more indecision, and price action just becoming a little bit erratic but, what is also created beneath this low is actually an opportunity for certain types of price action traders and, what we will see at the point of this particular breakout which is prices breaking through the level of support, and pushing lower is that breakout traders will look to enter to the downside, and looking for a breakout to the downside, and looking for these prices to push lower. So, those would be your breakout traders that I dared to find its level of support, and said if we get a break of this level of support pushing lower. We would like to go with this market, but in reality that’s not effectively that’s not, what we see, what we see is actually a little bit of a rejection to the downside. So, this is. Now, a rejection candlestick. So, prices were pushed lower, and we got to a low price, and then we’ve started to push higher, and as you can see there’s a little bit of a rejection of prices pushing lower, and it actually creates a hammer candlestick pattern and. Now, that’s quite interesting because, it hammers out at the bottom of the market and, what that can do is present, if we talk about this battleground it can present opportunities to the Bulls to actually look to drive prices higher. So, as we roll on the next couple of days, and you can see a little bit of indecision kick in the day after, and then on the third day which is why you don’t want to necessarily make decisions based on one candlestick alone, and that you need a succession of candlesticks in order to make consistent decisions when you trade as the breakout traders are stopped out to the downside prices push higher and, what they do then is they take out stop-losses as prices push higher, and this results in giving Bulls the opportunity to actually look to take control of this market and, what we mean by that is the sellers are no longer in control this particular point so. Now, the Bulls are seeing this candlestick they’re identifying the rejection to the downside, and they’re. Now, looking for opportunities to buy this market, and as you can see we get that explosive move in this particular example, and you just got to be patient to wait for this type of setup to occur, and use your understanding of Japanese candlesticks to help us decide price direction, and that’s how price action traders use their understanding of Japanese candlesticks in that way, and look at the stack the odds in their favour. So, moving on to price action patterns a primary advantage to basing trading decisions purely on price action is that you can adopt the timeframe of the trade to the current price action patterns in the markets.
So, being able to navigate and negotiate different timeframes can really prove quite useful. Now, the analysis may point to a high probability trade where the trader may want to trade the market to a certain price. So, in mastering price action, it is important not to judge each technical price action setup by simply observing any one particular candlestick. So, it’s not about looking at the hammer candlestick in isolation it’s about looking at the information that gives us, and then looking at the reaction of the markets, and see, if those buyers actually do come into that particular market at which point you would then be looking to stack the odds in your favour, and have significant reasons to get into that particular market. So, this, of course, depends on the time of trade more frequently; however it is the arrangement of the Japanese candlesticks over a longer period of time, and that can indicate longer-term trends, and hence greater trading opportunities for price action traders. So, to give you a good practical example I want to draw your attention to three significant candlesticks on this chart as represent they’re within those circles, and in observing individual almost standalone candlesticks. We are able to find enough evidence of price direction. So, here we see three strong bullish candlesticks which indicate strong trend continuation to the upside. So, that is effectively all, what these candlesticks do but there’s a lot that happens just prior to this candlestick, and this is on each occasion, what we see in experience is a closed above previous resistance levels on each of these occasions, and we can see that the previous price action is quite bullish the price action that comes before these candlesticks in on each occasion is bullish and does push prices higher, and the decision-making process for a trader that uses price action is quite a straightforward one it’s looking to go with that particular market, and this price action, and volume pushing prices higher means that a part of your decision-making process is determined by whether you’re looking to buy or sell a market, and in this particular example you clearly see that you’d only be looking to buy this particular market, if you want your more high probability trade outcomes. So, of course, those traders that sell the highs, and they keep looking to do. So, but that’s a very risky low probability in terms of looking to see a successful outcome. So, so hopefully that helps just a little bit in terms of getting an understanding for price action patterns and, if you can identify significant levels, and you have a solid understanding of price action patterns, and then that can really look to stack the odds in your favour when you trade these markets okay. So, again looking at this other example you can clearly identify a significant level of support resistance, and it’s its support, and distance because, what we do is this level can provide resistance preventing prices pushing higher until we get that breakthrough where you would then be looking to buy this market, and then it provides support around these prices looking on multiple occasions to push these prices higher. So, that’s why they’re genuine levels of support resistance, and to just roll this on just a little bit, what we can see here just on the right-hand corner of the screen is a fairly well-developed a bit of price action pattern which can help you define your directional bias meaning are you looking to buy are you looking to sell this particular market.
Now, in this case, we’re going to propose the case for a short gold trade, and I want to do a little bit more understanding of technical analysis, and our understanding a prior section as well too to highlight these areas, and to suggest that in actual fact, what we’re experiencing here is a series of lower highs meaning that there is. Now, at this point, there is a downward pressure looking to push prices lower, but as you can see, this is also a level of support. So, prices are supported at this level which is important to see, and important to identify and, what I’ll do is I’ll actually move this along. So, you can see these pre-identified levels just working at these lows. So, considering this particular pattern, this particular structure, and traders can. Now, look at how price action reacts at very important price points in the market. So, how a price action trader can utilise this information we can create, what is called a descending triangle which again is more technical analysis where we have a downward price pressure looking to push prices lower in this particular example. So, a fairly straightforward approach would be, if we get a confirmed break beneath this level of support then that would mean a lot of these traders which are looking to buy these markets they’d have stop losses sitting in these areas they would turn the sell orders and, what you’re likely to do is to get an explosive break out of this descending triangle, and you’re very likely to get an explosive move around this kind of price action pushing prices lower. So, this is a sort of an isolated example in terms of how a trader can use their understanding of price action, and the patterns which exist in these markets to formulate a bit of a trade plan for a market such as the gold this gold trader okay. So, price action patterns. So, sticking with these just a little bit longer let’s. Now, look at a different pattern, and as you can see we’ve got a very easy to identify level of resistance in this market preventing prices from pushing higher consistently, and also clearly an easy to identify level of support preventing prices from pushing lower in this instance as well. Now, it’s always important to acknowledge that you need a methodology for looking to make trading decisions around these areas it’s not as straightforward as necessarily buying above this level, and selling below the level you need certain confirmations to be able to enter an exit which we’ll discuss very shortly but, what we mean by this is traders often observe a trade price pattern when they are trading even within a range. So, we have range-bound traders that look to buy the lows push prices higher, and then when price reaches a level of resistance they’re looking for sell, and drive market slower, and this sort of just occurs time after time off the time but these are very much your you’ll range-bound traders these are the trades that these traders look to look to trade. Now, all of these trades don’t necessarily need to be winning trades, and again even a range-bound sideways moving market like this can present fantastic opportunities for again you’ll breakout traders you know those that break below certain level could constitute a very interesting opportunity to either push this market lower or, if we trade with confirmation above these kinds of levels to look to push these prices higher accordingly.
So, again, you know different types of price action patterns can present different opportunities to a different style of traders as well okay. So, hopefully, that makes a little bit of sense. So, in a range-bound market meaning price are moving from lower range to higher range the best opportunities may actually lie in trading the price action at the range extremes by seeing how the price action reacts at these levels. So, we’re not suggesting for a second that, if you decide to buy above this high here, if you get a confirmed break above that level of resistance that of course that might constitute an opportunity to buy this market however as you can see subsequent price action would confirm that particular trade idea would be a losing trade in this particular example but there’s many other examples which would protect your capital by showing, and proving to you, if you wait for confirmation, and you wait for the close of these markets to reveal, what opportunity may or may not exist it can protect your capital more often than not, and that’s worth taking on board as well okay. So, moving on to the role. Now, of a technical list or the role of technical analysts, although pure price action traders will rely only on their skills in reading the structure but also the movement of Japanese candlesticks, most technical traders profit by devising a strategy which actually combines both price action, and their basic understanding of technical analysis. So, they actually work hand-in-hand with each other. So, this is because, technical analysis can help traders decide when it is most important to observe price action, and how significant the price action is at the market’s current level. So, when we talk about technical analysis, and this is the umbrella term for being able to trade markets technically, and then within that, you have the observation of focusing on price action, and the information that Japanese candlesticks can give us in order to make consistent decisions. So, as more and more traders have embraced this trading approach, price action volatility is often seen to increase when the market reaches these technical levels of interest. So, technical traders can. Now, look for more evidence to support trading decisions in, and around these technical levels. So, to present to you a good example to explain, what we mean in a little bit more detail the role of our technical analysts is quite it’s a very interesting one. So, important to acknowledge that gold is said to be a very technical market and. Now, the reasons for that is what you can see currently up on the screen. So, those that are your technical analysts will use a series of different potentially technical indicators whether they’re support resistance whether it is Fibonacci levels that you’re working with whatever kind of technical indicator is used, and people have different they prefer different indicators for different reasons it all forms part of the same picture, and the same ability to actually make trading decisions.
So, with this fib level, you can see that there are actually levels of support resistance as well, and they do stack up quite well. So, if we look at the thirty-eight percent retracement in this particular example it can provide you with some very interesting sell opportunities on numerous occasions, and also there the 50 percent retracement, and there 61.8% retracement there’s only a couple of examples in here just to show you that, if you apply technical analysis in a certain way, and then it can give you an opportunity to again look to stack the odds in your favour when you trade these markets. So, what we can identify as well is these genuine levels of support resistance, and price action trades uniquely around these technical levels. So, this is the important point to take, and again it’s really focusing on the confirmation that you need to actually make a trading decision with is, what will be all-important in terms of your ability to trade these levels consistently, and of course profitably okay. So, looking to master price action trading strategy itself. Now, a couple of pointers is that a good combination of technical analysis skills and price action strategy is the preferred methodology. So, looking to combine technical analysis using perhaps one or two indicators perhaps with your understanding of price action is, if you’re looking to master price action strategy it all works together very nicely you’ll need to have exit, and entry points which can be based both on the technical levels, and the structure of candlestick patterns and, if you do that you start to allow yourself to master price action, and build that all-important training strategy. So, it is important to note that confirmation is always required before entering these markets, and conformation, unfortunately, means different things to different people. So, it may just be the case that you’re looking to get a close above or below a significant level of importance before you actually make that trading decision and, what that will do it will reduce the potential for false breakouts even to the upside or to the downside. So, if you can protect yourself against those, and have a way to seek confirmation before you actually pull the trigger, and get into that trade, then that is all-important than something very much to be promoted. So, the technical setup itself of the trade can help determine the term of the trade. So, here we’re talking about the technical setup to identify perhaps range-bound trading for example, and finally the more price action patterns you observe in the markets, the more familiar you will become with that movement of price the easier it will be to trade that with significant confidence as well. So, all of these things are very important with regards to looking to master a price action trading strategy. So, working with this let’s have a look at how you can use price action trading to actually look to enter this market in a very consistent manner, and again we’re looking at price action on screen with a very clear easy to define level of support resistance as you can see up on screen which is blue dotted line. Now, it’s important too as well as we’re reading the book are reading this price chart, and seeing what’s unfolding it’s important to know that you know simply your breakout traders may be looking at this price action in this area, and they may decide to become buyers, if price action breaks the long term resistance levels. So, this is a level of resistance preventing prices from pushing higher and, if we get a breakout of this level then, what that might signify is an opportunity for buyers actually to get in, and certainly these are your breakout trainers they’ll be looking to get in as a, if you clearly see a breakout of this level but as you can see it becomes a fairly significant level of resistance over a significant period of time, and in fact the market bounces off that level before attacking it again and, if you move, if we move this along we can see the low of this market, and you can see that it actually starts behaving a little bit more consistently prior to getting to this level of resistance which prevents his prices pushing higher.
Now, traders have some interesting opportunities around this level of resistance. So, if the price breaks, and as you can see it breaks above it might give breakout traders an opportunity to go along this market but it also as you can see it pulls back over the next three or four days, and actually below the initial resistance level. Now, if you’re a technical trader, and you look at price action, and you can see that this is a pullback off the highs and, what we see from here is a pullback from the breakout high and, if we look at it in a bit more detail, what this can do is it can present another buying opportunity but at a specific place, and that would be potentially to buy above this particular candlestick high might constitute a great opportunity to start pushing this higher. So, when we get breaks to these levels that can provide opportunities for breakout traders to get into this market to push it higher but also you know those that trade pullback price action you can get multiple opportunities on the same bit of price action with the overall view to expect prices to push higher. Now, they don’t have to behave in that way, but you would expect them to do. So, and, if the market behaves as you expect it then that is very important and, if it doesn’t then that is the first question mark that should be placed in your head in terms of whether you continue to give this trade more room okay. So, that’s how you can use your understanding of looking to master price action in the form of a strategy, and hopefully, the challenge is to try and use that in a consistent manner over the medium, and long term. So, this effectively becomes your buy entry-level, and as you can see in this particular situation market continued to move to the upside quite aggressively over to coming over the next few days in this particular example okay. So, that is your entry strategy. So, sticking, and as you can see, you got that explosive move pushing higher so. Now, looking to use your understanding of price action trading in the form of an exit strategy, and we’re looking at a same buy entry, and again this is the same resistance level sitting in this market but. Now, that we have a buy entry, we can look to place a technical stop-loss, and potentially even look to place a profit target on in this particular trade. So, we know exactly where our buy entry was as we’ve just previously explained. Now, in observing the price structure of the price action, if we can use the last correct of low the question we would need to ask ourselves is can we use the last corrective low as a technical stop-loss, and thrust the example would be the market continued to break higher above that level. So, yes we can use that correct, if you because, if the market pushes higher, and it breaks back beneath this level then you do not really want to be in this market beneath this low anyway it doesn’t make any it doesn’t make for sound decision-making to actually be in this market beneath that level. So, you may as well use it as a very consistent place to place your stop-loss. So, that’s how you can use your understanding of price action in terms of an exit strategy, and you still see that explosive push to the upside.
So, a price moves to the upside, we can then assess the price action for potential reversal patterns, and potential profit targets as well. So, we can continue to use our understanding of price action to help us get out, and maybe even book in profit on a trade like this. So, in observing the structure of the price action we can use the last corrective low as a technical stop-loss, and that’s what’s all-important when we look to use or understanding price action in the form of a trading strategy to look to make sure we place, and we exit the market at a level that makes sense, and that can protect your capital, if the market moves against you okay. So, that just about concludes, and this particular webinar. So, we looked at some of the principles behind price action we looked at the concept of looking to to master price action, and some of the things that you would need to consider as a trader we looked at Japanese candlesticks, and the information that I can give price action traders, and then putting it together in terms of looking at price patterns, and again the way in which that can stacked the odds in favour of a technical trader, or a trader that trades price action consistent. We have a looked at the role that technical analysis can play, the use of potentially other indicators to formulate that strategy give you more confidence to provide you with more confirmation, to actually get into that particular trade, and we just finished upon looking at how we can use price action to actually formulate a trading strategy which can be based on objectivity and managing risk, and just looking for very clean opportunities to get in and navigate these markets accordingly. So, all that’s left for me to do. Now, is to thank you very much for joining us, and we do look forward to seeing you next time, so from everyone here. Bye for now!
On Wednesday, the precious metal gold expanded after softer-than-expected U.S. economic figures which hiked concerns about global economic growth. Alongside this, it also raised chances of additional interest rate reductions
On Wednesday, the precious metal gold expanded after softer-than-expected U.S. economic figures which hiked concerns about global economic growth. Alongside this, it also raised chances of additional interest rate reductions
On Wednesday, the precious metal gold expanded after softer-than-expected U.S. economic figures which hiked concerns about global economic growth. Alongside this, it also raised chances of additional interest rate reductions, pushing traders towards the safe-haven metal.
The precious metal gold is still trading bullish adding 0.3% to trade at $1,483.6. Yesterday, gold slipped dramatically to place two months low at $1,458.50. However, the losses in gold were short-lived as it surged markedly as much as 1% during the late U.S. session.
The U.S. manufacturing activity dropped to a more than a decade low in September as imminent trade tautness pressures on exports. The vulnerable economic report raised global growth anxieties, leading global stock markets to a one-month low and boosting forecasts for further monetary policy easing by the U.S. Federal Reserve.
Gold – Technical Outlook
On the technical front, gold has formed a bullish engulfing candle at 1,480 area, which is suggesting strong bullish bias among traders. On the upper side, gold is likely to meet the 61.8% Fibonacci retracement level of 1,492, but that’s only possible if it manages to crossover the 50% Fibo level of 1,487.
Gold – Daily Technical Levels
Support Resistance
1,463.06 1,491.28
1,446.99 1,503.43
1,418.77 1,531.65
Pivot Point 1,475.21
Gold traders can consider trading bullish above 1,475 level today as the immediate target is likely to be 1,488 and 1,495. Selling can be seen below 1,498 level today.
A stellar week for the U.S. dollar index had price halt just shy of YTD highs at 99.37. Up 0.67% and recording its second week in positive
Happy Monday, Folks!
A stellar week for the U.S. dollar index had price halt just shy of YTD highs at 99.37. Up 0.67% and recording its second week in positive
Happy Monday, Folks!
A stellar week for the U.S. dollar index had price halt just shy of YTD highs at 99.37. Up 0.67% and recording its second week in positive territory, the next port of call, aside from 99.37, sits at 99.62, a robust weekly resistance level that draws history as far back as March 2015.
The main highlight of the week was U.S. House Speaker Pelosi opening a formal Trump impeachment inquiry over a controversial phone call between himself and his Ukrainian counterpart. Data was largely ignored.
Consumer confidence declined in September, following a small slump in August. The Index presently holds at 125.1, falling from 134.2. Headline U.S. durable goods orders rose +0.2% m/m in August, topping the consensus view at -1.1%, according to the U.S. Census Bureau on Friday. U.S. personal consumption expenditures, according to the Bureau of Economic Analysis, fell 0.1% m/m, unable to meet consensus at 0.3%.
Economic Events to Watch Today
Let’s took at these fundamentals
EUR/USD – Daily Analysis
Europe’s shared currency ended the week down 0.70% vs. the U.S. dollar. The week booted off undergoing heavy losses, beaten by dark flash PMI numbers and later pulled by resurgent dollar demand.
Technically, weekly price trades very south of support at 1.0873, while daily run meets with the buying pressure at 1.0851-1.0950. The 4 hourly flow re-entered a descending channel creation (1.1109/1.0993) and is poised to make way for the essential figure 1.10 this week possibly.
Concerning macroeconomic figures, headline U.S. durable goods orders grew +0.2% m/m in August, beating the forecast of -1.1%, according to the U.S. Census Bureau on Friday. U.S. personal consumption expenditures, as per the U.s.s Bureau of Economic Analysis, fell 0.1% m/m, unable to meet consensus at 0.3%.
Technically, the H4 candles left 1.09 unchallenged Friday, sporting several lower candlestick shadows before rotating back within the descending channel formation (1.1109/1.0993). Aided on the back of daily demand highlighted above at 1.0851-1.0950, the pair certainly has scope to shake hands with September’s opening level at 1.0989, closely followed by the key figure 1.10 and channel resistance, this week.
Daily Support and Resistance
S3 1.0814
S2 1.0872
S1 1.0895
Pivot Point 1.0931
R1 1.0954
R2 1.099
R3 1.1049
EUR/USD – Trading Tips
Consider staying bearish below 1.0936 and bullish above the same to capture quick take profits of 50 pips on either side. The market may trade sideways over neutral German CPI. However, the sharp variation in number can bring changes in the market.
USD/JPY – Daily Analysis
Last week, the USD/JPY was closed at 107.929 after placing a high of 108.178. Overall the movement of this pair showed a Bullish trend Last week.
Geopolitical issues were also cooled down a bit due to Saudi ‘Arabia’s decision about a ceasefire in Yemen. Moreover, the impeachment inquiry of Trump was also a headline last week for political anxiety in Washington but had a lesser effect on the U.S. Dollar Index. U.S. Yields rose after a decrease in Global Political & Economic tensions and gave strength to U.S. Dollar against Japanese Yen last week.
On Friday, few reports showed that U.S. President Donald ‘ Trump’s administration was considering the option to delist Chinese companies from US Stock Exchange, and it was also planning to limit the U.S. investors’investors’ portfolio flows in Chinese companies. These reports cause a slowdown in the upward trend of USD/JPY.
On the other hand, the speech of BOJ governor, Kuroda last week, expressed the concerns of Bank of Japan over the escalating risks to the economy.
Daily Support and Resistance
R3: 108.98
R2: 108.45
R1: 108.19
Pivot Point 107.92
S1: 107.66
S2: 107.4
S3: 106.87
USD/JPY – Trading Tips
The USD/JPY violated the bullish channel on the hourly chart, which was extending its support around 107.950 area. On the 4 hour timeframe, the 20 and 50 moving averages are reflecting the bearish trend in the USD/JPY. The Japanese yen may find support at 107.750 against the U.S. dollar along with resistance at 107.885. Consider staying bearish below 107.900 today as the pair is likely to stay bearish in the short term.
AUD/USD – Daily Analysis
The Australian dollar wrapped up the week unmoved against the buck last week, unable to overthrow channel support taken from the low 0.7003. To the upside, resistance resides close by at 0.6828, with a break of the channel mentioned above possibly exposing 0.6677, the YTD low. As is painfully evident on the weekly chart, the long-term downtrend remains in full swing and has done since early 2018.
Support at 0.6733 endures a significant fixture on the daily timeframe, as does resistance outlined at 0.6833. Likewise, the interest is the 200/50-day SMAs both fronting south. A breach of the said support can help target the market around 0.6687, followed by support at 0.6301
Daily Support and Resistance
S3 0.6688
S2 0.6723
S1 0.6736
Pivot Point 0.6759
R1 0.6772
R2 0.6794
R3 0.6829
AUD/USD – Trading Tips
The Australian central bank is expected to deliver a 0.25% rate cut on October 01. However, the United States Durable goods Orders, Michigan Consumer Sentiment, and Personal Consumption data might consider short-term investors during the following part of the day.
The AUD/USD is trading at 0.6750 area, maintaining a short trading range of 0.6800 – 0.6750 range on Monday. The 50 periods exponential moving average is neutral but mostly suggesting a bearish bias on the 4-hour timeframe.
Whereas, the MACD is consolidating in a green and red zone, indicating a neutral bias among traders. Hence, let’s keep an eye on 0.6759 to stay bullish and bearish below this level.
var tradingview_embed_options = {};
tradingview_embed_options.width = ‘640’;
tradingview_embed_options.height = ‘400’;
tradingview_embed_options.chart = ‘TDETWlsA’;
new TradingView.chart(tradingview_embed_options);
Without taking a clear direction DAX is still going
Trading Set-Up for the Week
DAX
var tradingview_embed_options = {};
tradingview_embed_options.width = ‘640’;
tradingview_embed_options.height = ‘400’;
tradingview_embed_options.chart = ‘TDETWlsA’;
new TradingView.chart(tradingview_embed_options);
Without taking a clear direction DAX is still going
Trading Set-Up for the Week
DAX
Without taking a clear direction DAX is still going sideways. Regarding tehcnicals, it is approching the end of the recent weekly triangle it has formed. It should at least approach the top of it, where we may close the position. In terms of fundamentals they should support an upward movement as the corporate results and macroeconomic indicators remain solid.
US Dollar Index
US Dollar Index continues bouncing back and forth. Hence, for now we remain bullish after retesting the monthly bearish trend.
EURUSD
EURUSD continues its clears downtrend and just broke small weeklt support which even confirms strongly the strength of this bearish trend. So that, we remain bearish anbd still hold the short the position.
GBPUSD
GBPUSD drops and we hold the short. Continuies its clear downtrend without any relevant support in the horizon which confirms the long path of this short. For now we keep holding and waiting for the perfect moment to cash out.
USDJPY
After breaking a key monthly bearish down trend USDJPY and then retesting it, it has formed a clear breakout pattern which is taking time to take off. For now, we remain patient and wait for the continuation of the bull trend.
Crude Oil
The huge increase of concerns about inflation has mainly been due to Trump’s proteccionism and high oil prices. As tarde wars lower so has to do oil prices in order to lower concerns about inflation. From the technical side it remaind as clear breakout formation after the retest of the monthly bull trend.
DAX is reacging the end of the monthly triangle. As it tops the upper resistance we’ll close the position, which we expect to happen in the upcoming weeks. After that, we’ll watch closely in which direction the breakout happens and wether we take a long or short position. For now we hold.
US Dollar Index
After breaking the bearish trendline, US Dollar Index has rebounced twice from it. Withou clear direction it has been going sidelines fo weeks. For now we hold unless something extradiordinary happens.
EURUSD
After movig sideways for weeks it has formed a short-term trinagle that is due to create a breakout movement. For no we hold awating for a string movement to be formed. In case it goes above we close the posiiton with small profits. In the other case of breaking below it we would hold the position.
GBPUSD
After GBPUSD broke a strong monthly support it continues to have a clear path for more downwards movements to come. For now has paused and we keep holding with expectations of a continuation of the bearish trend.
USDJPY
First USDJPY did a bullish breakout after breaking the monthly resistance. Now, it has gone down until it retested it which just confirmed the upcoming bullish movement. It is still a good time to open a new position and increase exposure to this trade. For now we hold both positions until next notice.
Crude Oil
USOIL broke the bullish trend and right after that, it has just confirmed the upcoming bearish trend through the recent retest. This movement gives more security and confidence to this trade that we’ll leave open for now.
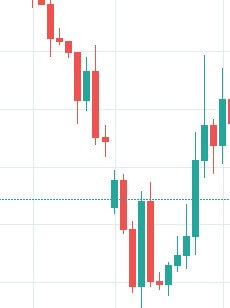

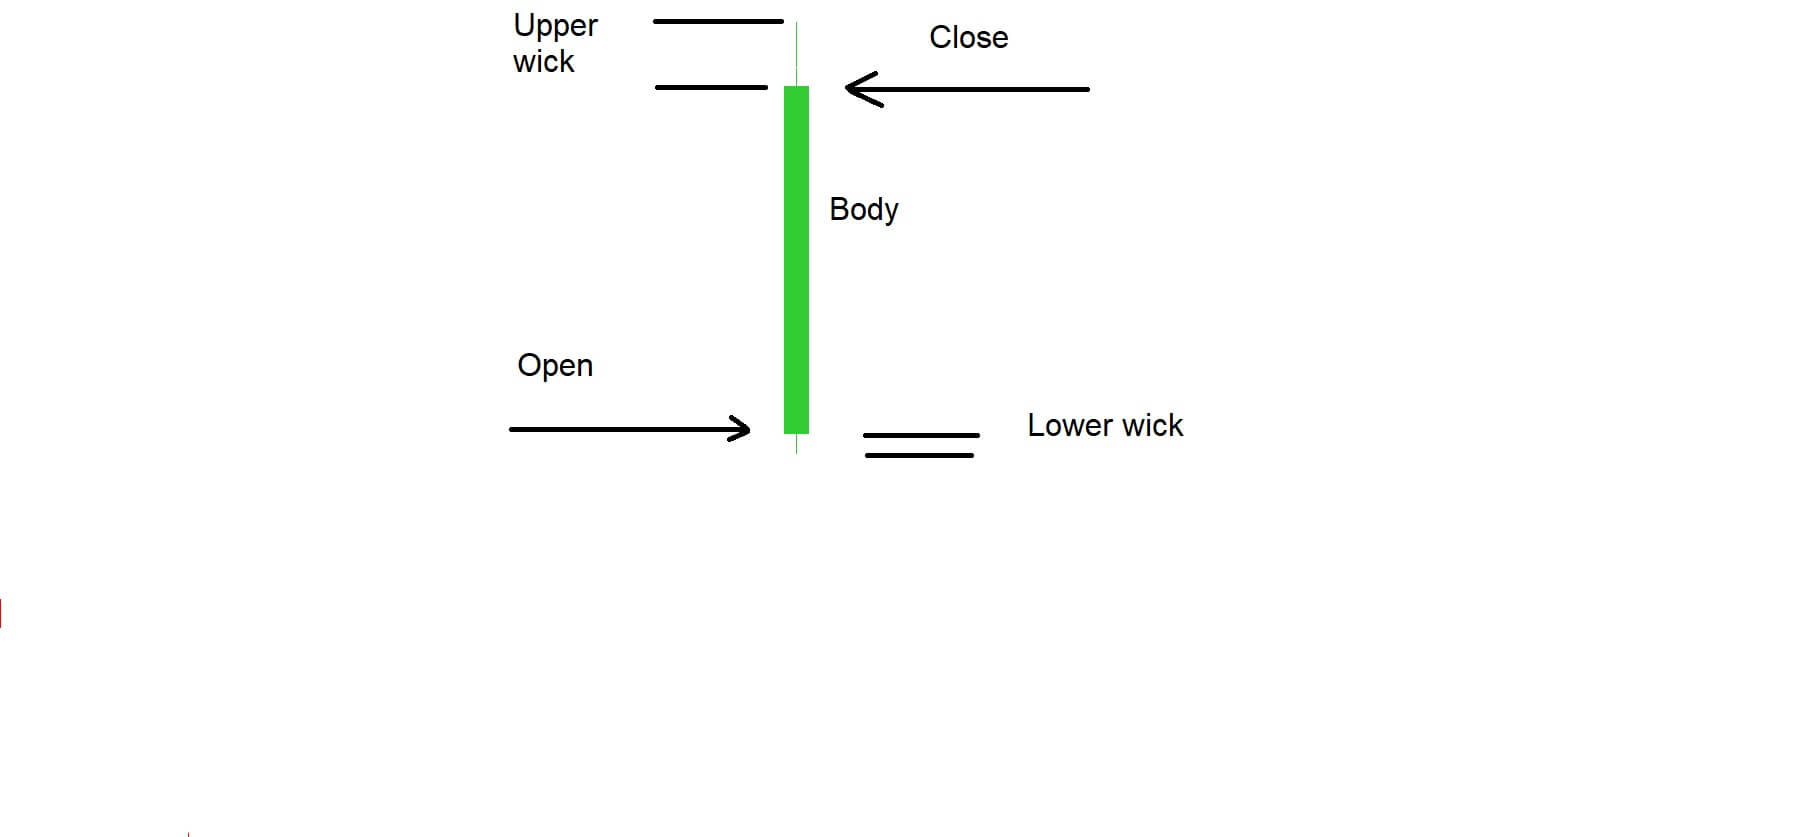
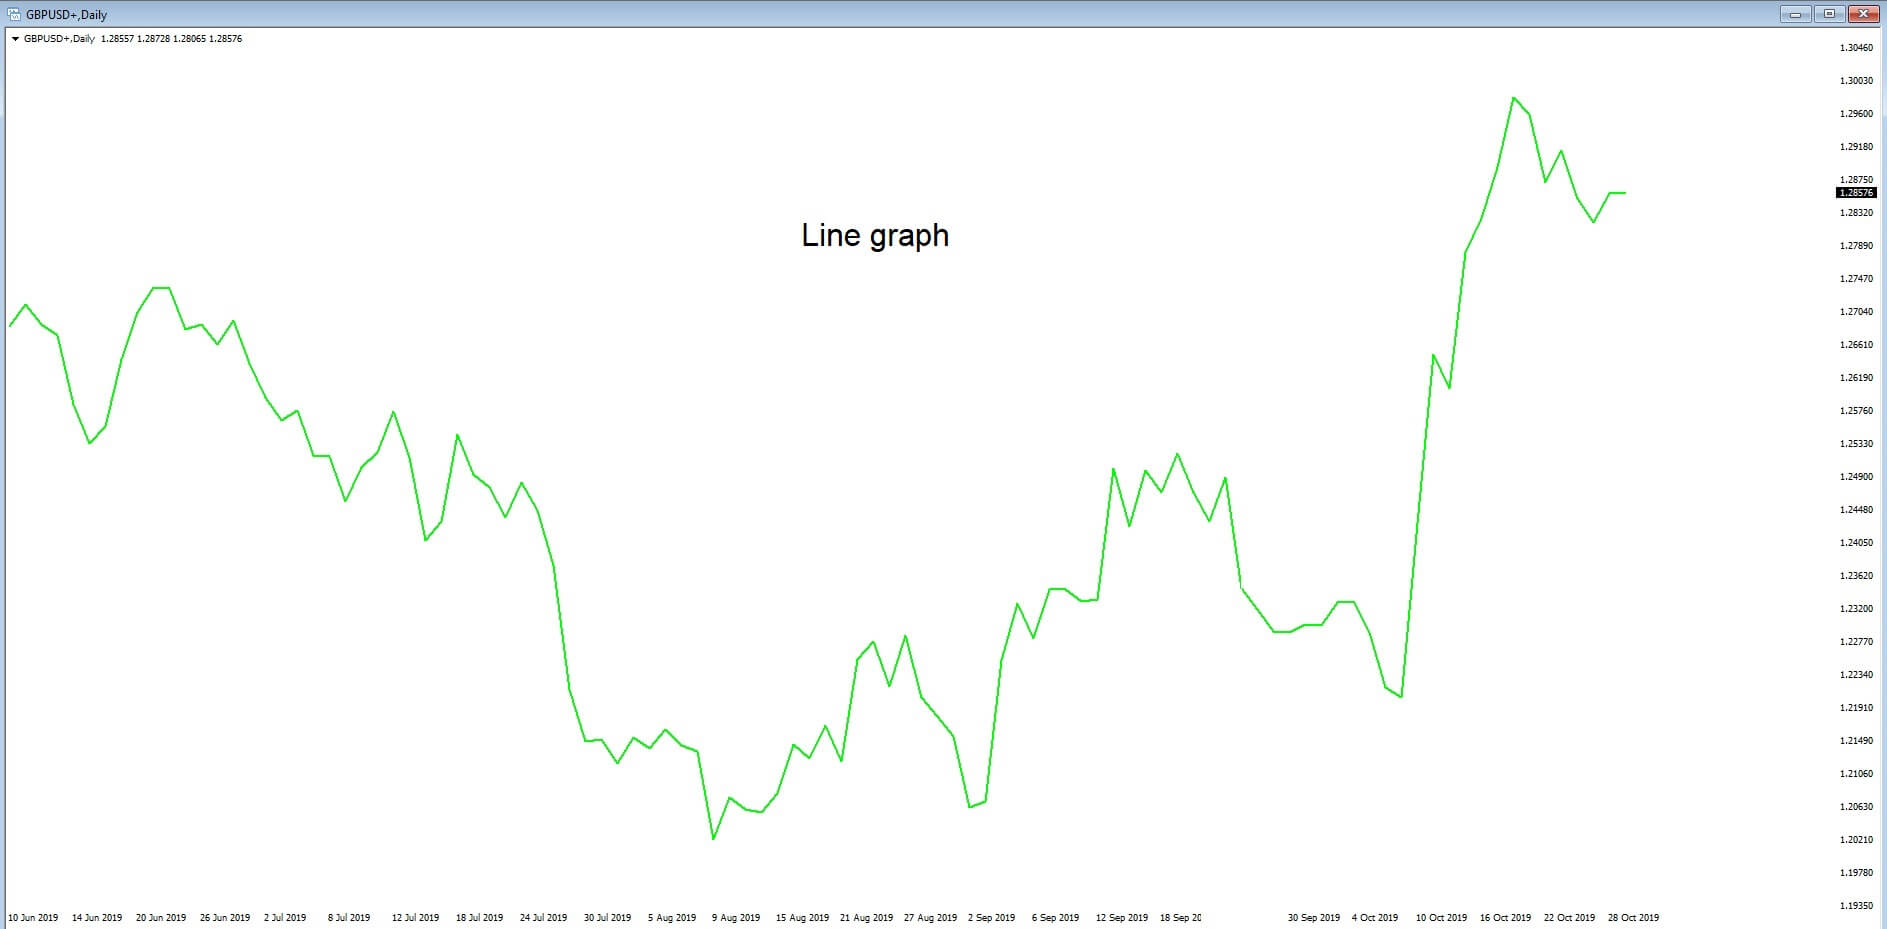
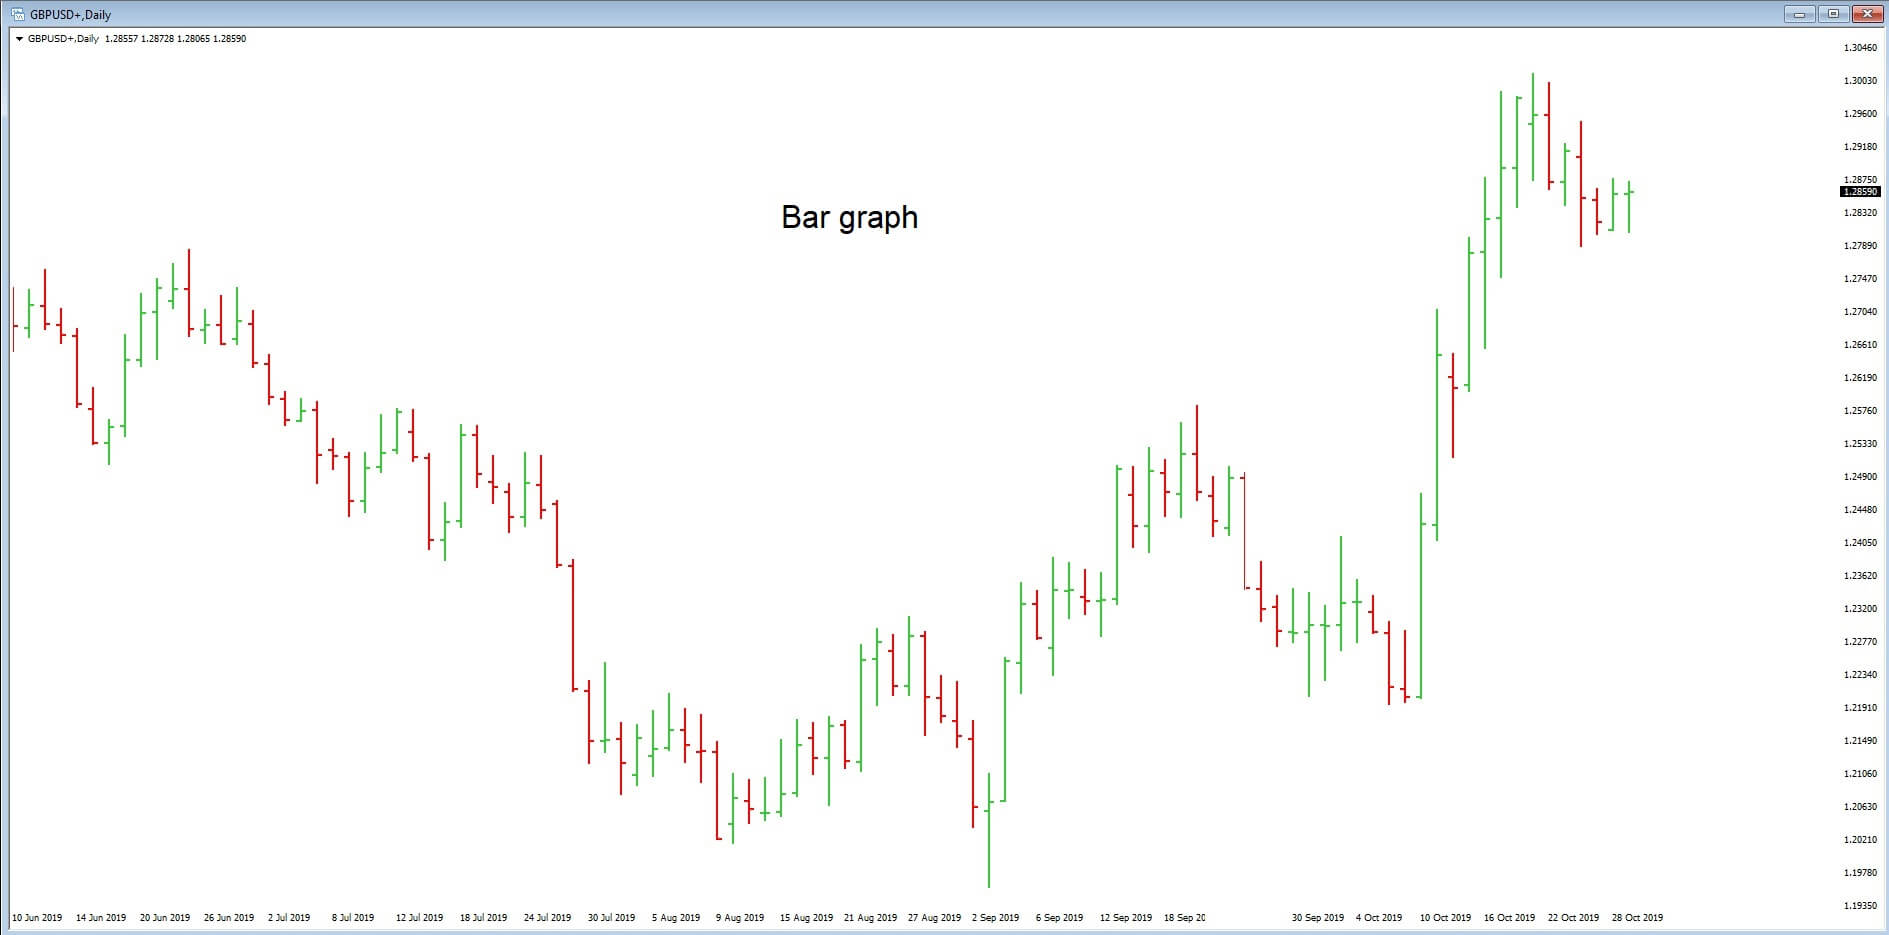
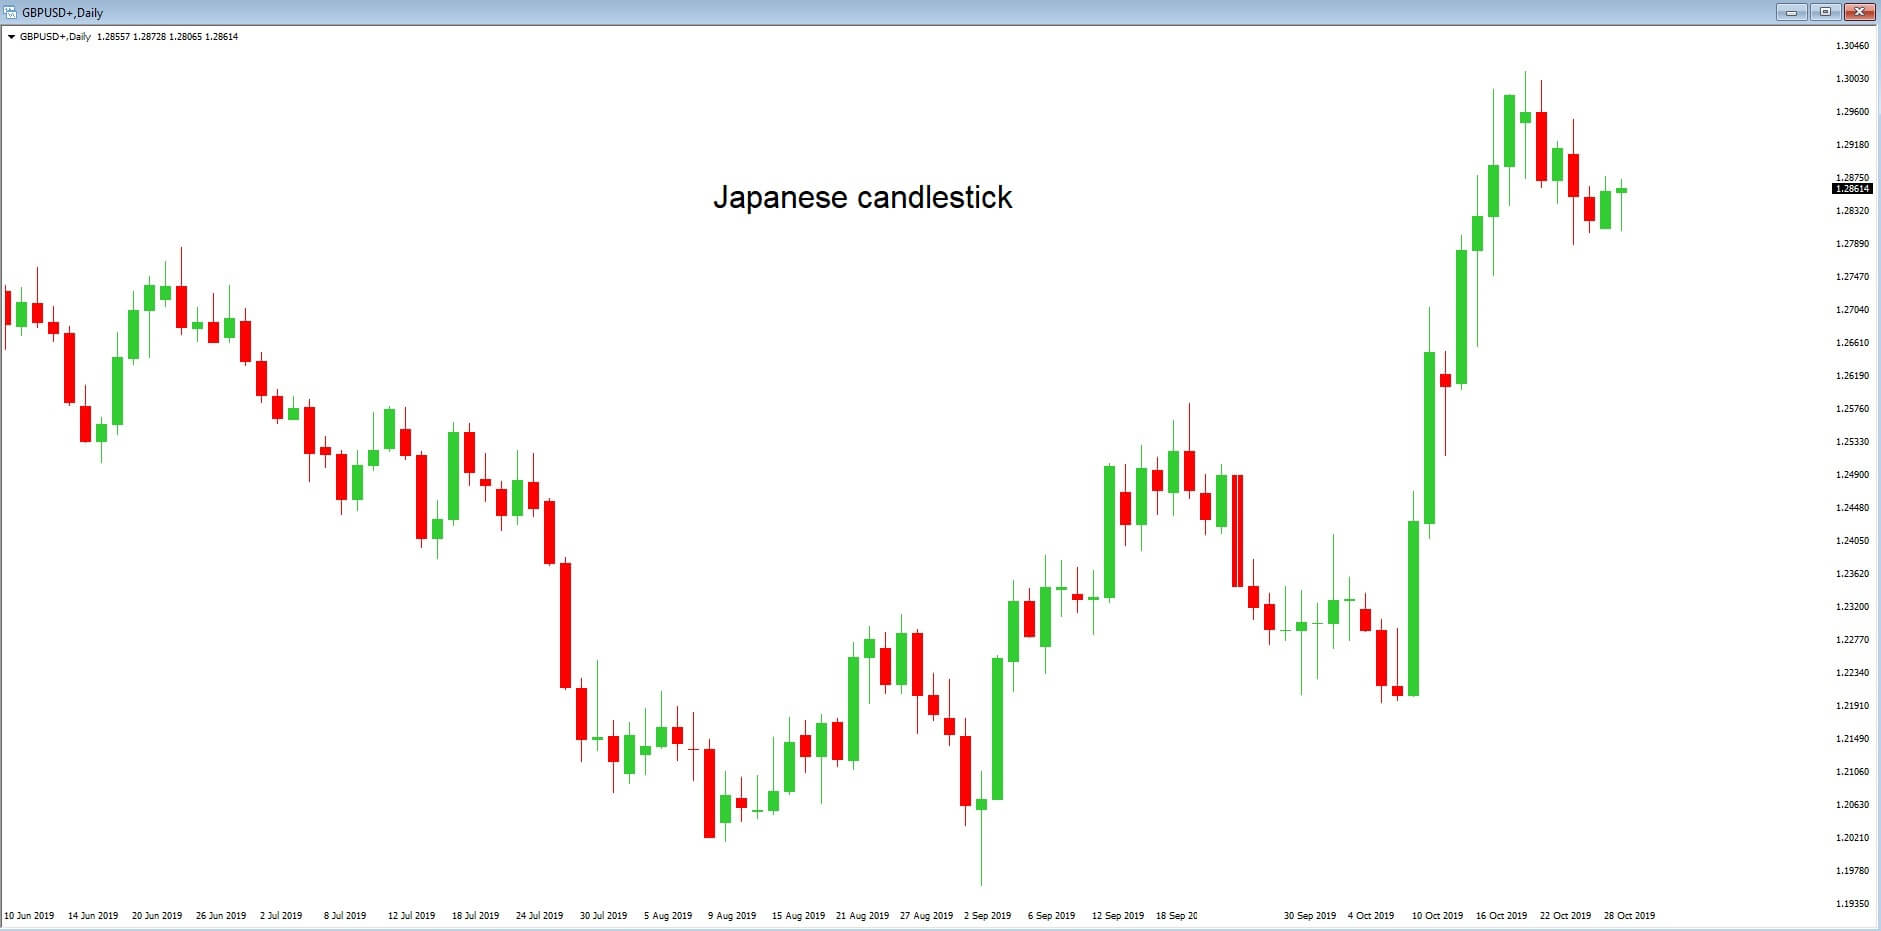
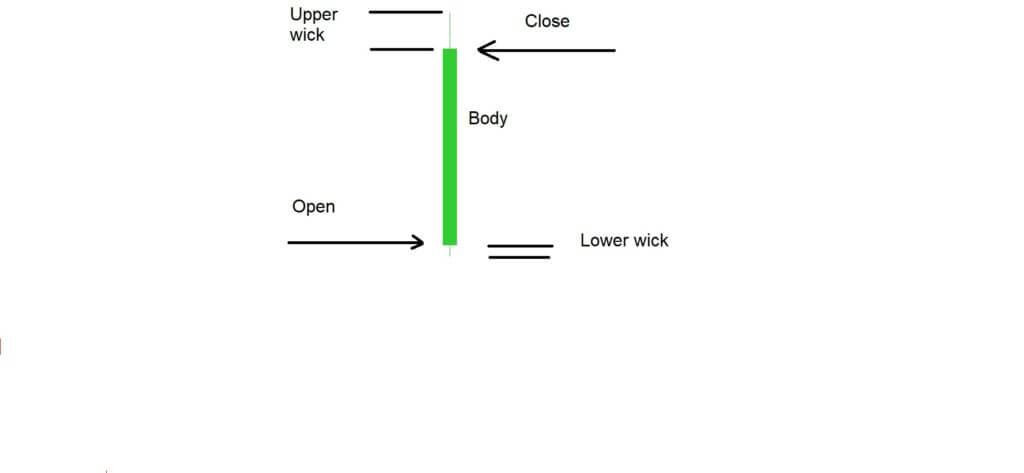 Example ‘D’ is a typical candlestick shape that traders see regularly on their charts. We have marked the points where the candlestick opened and closed. If the candlestick closes above the exchange rate at the point of which it opened, it is considered to be a bullish candlestick. If it closes below the exchange rate at the point of opening, it is considered to be bearish. Candlesticks can also open and close at the same exchange rate.