Price Cycle – Market structure
In this section, we will be looking at technical market structures. Professional traders are continually looking out for technical market structures that occur when a currency pair has achieved a swing high – or structural high – followed by a swing low – or structural low – and vice versa. Traders gain great inside in the relationship between these highs and lows.
These swing highs and swing lows can be found on any time frame, including the 1 minute, the 5-minute, 15-minute, 1-hour, even the 1-month time frame. And herein lies one of the most problematic aspects of trading the forex market: because a swing high might occur on one timeframe, while actually forming the basis of a swing low on a different time frame!
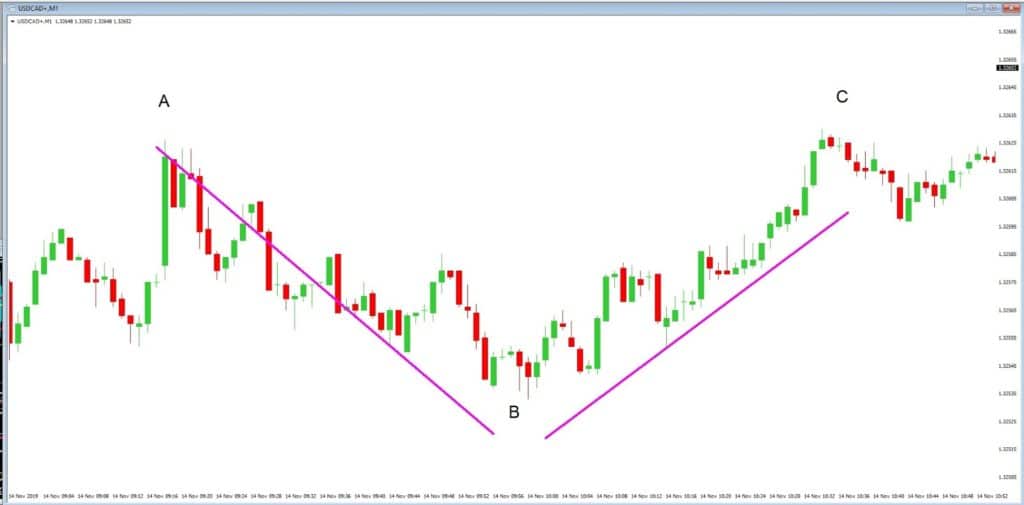
Example A

Let’s take a look at example ‘A’, which is a 1-minute chart of the USDCAD pair, and where we can see price action, as denoted by our Japanese candlesticks, has formed a swing high at position ‘A’, followed by a swing low at position ‘B’, and then a swing high to position ‘C’. In total, this A, B, C, swing high, to swing low price and swing high price action move presented traders with an overall 20 pip trading opportunity. This is not an unsubstantial amount of pips!
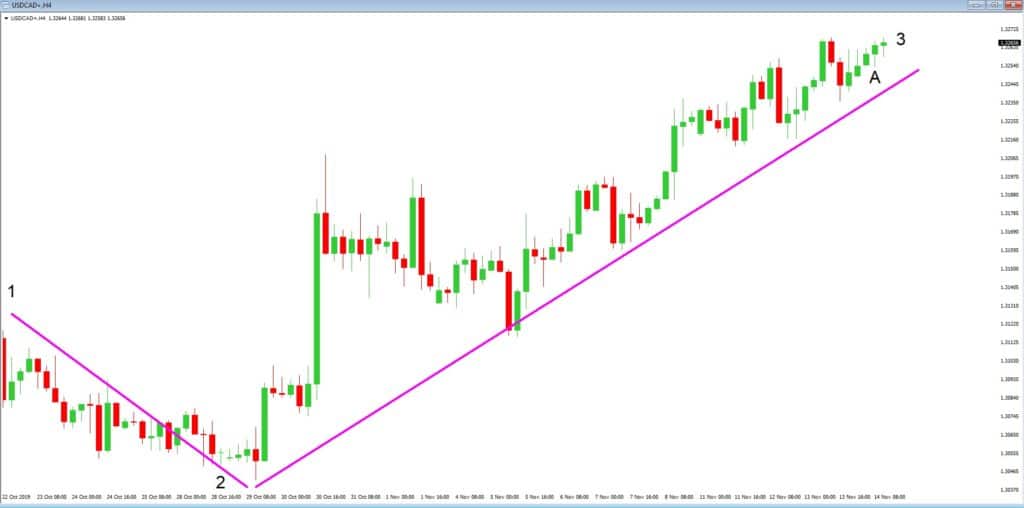
Example B

Now let’s look at the example ‘B’; this is a 4-hour chart of the same USDCAD pair. In this example, we have used position ‘1’ to show a previous structural, or swing high, followed by position 2, which is a structural or swing low and then followed by a structural , or swing high, to position 3. This overall move presented traders with a 300 pip price action swing. A huge swing, and an extremely profitable one, if you got it right!. However, sat all on its own, in the top right-hand corner of the chart, as they noted by position ‘A,’ is the exact same position of our swing high, swing low, swing high on our 1-minute chart.
All of the timeframes present trading opportunities when it comes to identifying structural highs and structural lows. However, it is advised that traders are mindful as to what is going on in various other time frames on any given currency pair! But one thing is for sure, and self-evident from the two examples, that the larger the timeframe is, the more important significant the market structure becomes.
Technical traders will keenly observe price action at structural highs and structural lows, because they present trading opportunities, such as pullbacks and reversals, continuations in price action, or price consolidation and subsequent breakouts. They can use a number of tools, such as Fibonacci retracements, moving averages, stochastic oscillators, and Moving Average Convergence and Divergence or MACD, however, the best tool is price action itself, and the most common method to determine price action is via the use of Japanese candlesticks.
Traders don’t need to load their chats up with lots of technical indicators, because more often than not, all the information is already on the charts, and we can use a few lines that we draw onto the charts ourselves in order to show us where the structural highs and lows are.
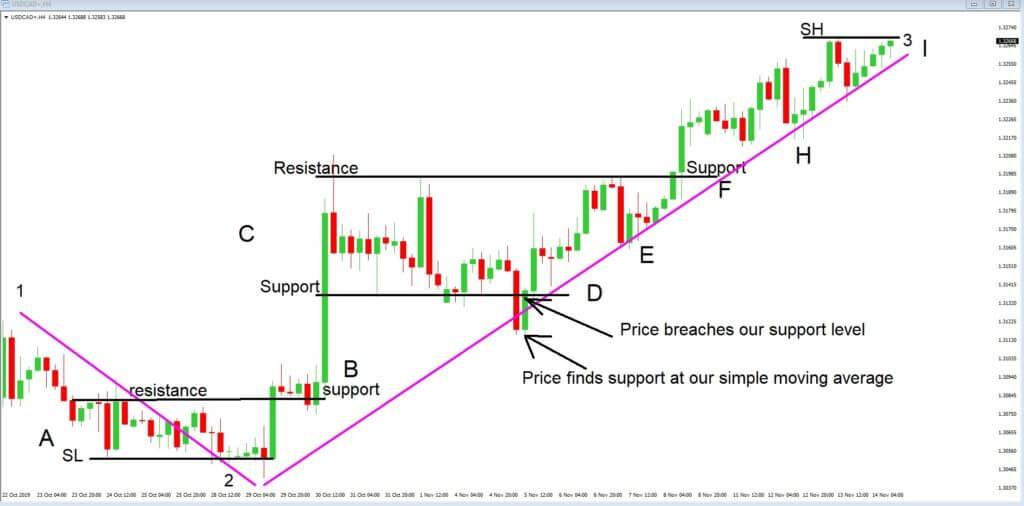
Example C

So let’s look at example C, where we have added a few lines to the same 4-hour chart of the USDCAD pair. First of all, at position ‘A’ on the bottom left of the screen, we can see a structural low, or SH, where price action has failed to go any lower. Price action enters a consolidation, or sideways pattern, between this low, and the area of resistance just above it.
Price, as it will always do, eventually brakes out of this range at position ‘B,’ where we find that our previous area of resistance has become an area of support. The major structural low has failed, and price action moves to the upside as denoted by the very large bullish candlestick, which tells traders that a large amount of liquidity or volume has entered this pair and moved it up to position ‘C.’ Again we see some consolidation of price action, but where are an initial pullback below the support level at position ‘D’ is curtailed when price action bounces off our ascending magenta simple moving average, and where we can see price action hugging this line all the way up to position ‘I.’ Because position ‘I’ is the highest point in this range it is considered to be a structural high or SL on our chart.. Traders will now be looking to establish if price action moves underneath the simple moving average, or if it will continue above the structural high. And if this becomes a support level, buyers may take advantage of an upward trend continuation.
Here at Forex.Academy, we emphasize to new traders, to be patient, understand their technical analysis, and that an awful lot of information is already on the chart. It does not need to be overloaded with too many technical analysis tools. And that to be a successful
trader, one needs to be patient. What is more, that a multi time-frame approach should be observed to help maximize win to loss ratios.


