
Mastering Price Action
Price action is the fluctuation in currency exchange rates, which are constantly moving up or down, relative to the exchange rate, and where these movements form trends, which are typically called ‘bullish,’ where price action moves in an upwards direction, or bearish when price action moves in a downward direction.
However, currency exchange rates do not move in a straight continuous line. Therefore, Traders use technical analysis tools in order to decipher the direction of price action on their charts.
By carefully selecting technical analysis tools Traders are able to drill down further into the fluctuations of exchange rates and where it becomes much easier to identify when a particular price action move is about to stall and reverse direction.
Example A
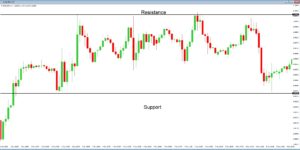
Let’s look at the example ‘A.’ This is a 1-hour chart of the EURUSD pair. Always read your charts from left to right, because they tell a story of where price action has been, and where it is likely to go in the future. In the chart, we are using Japanese candlesticks, and where are the green candlesticks denote bullish price action, and where red candlesticks show a bearish price action.
Example B
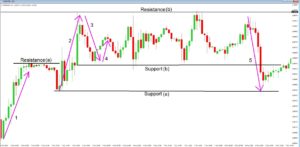
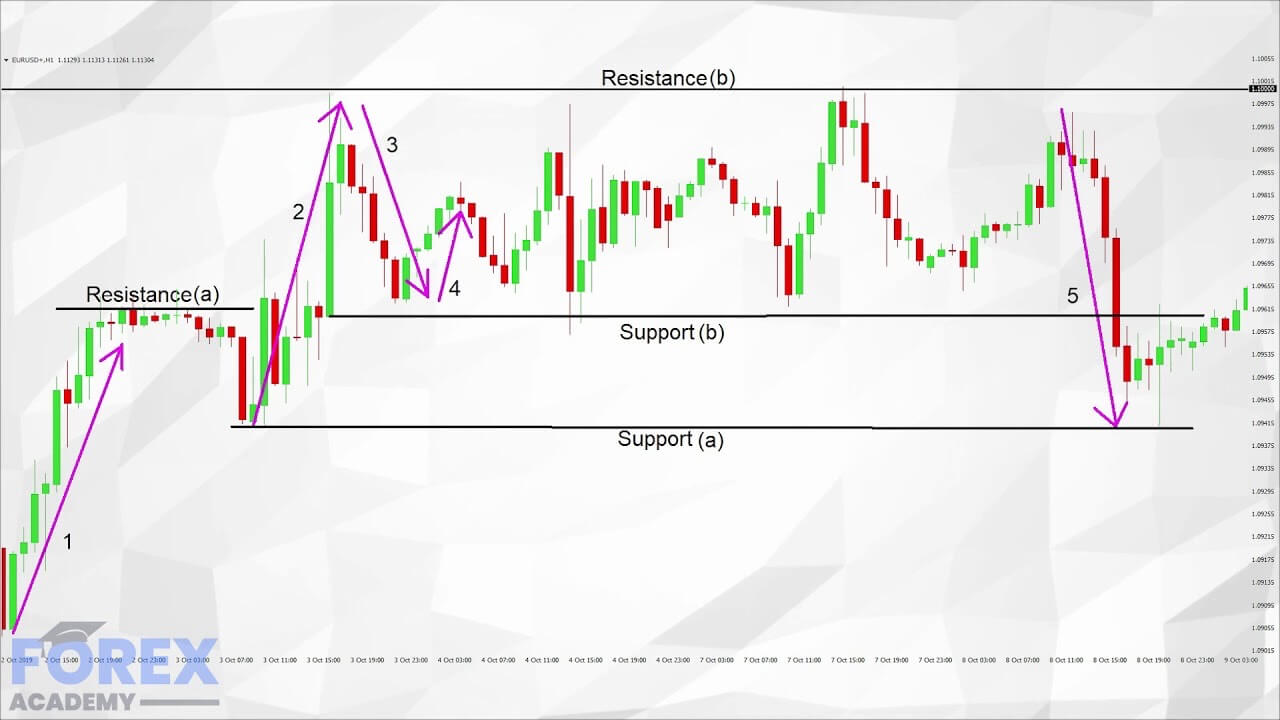
Now let’s look at the example ‘B,’ which is the same 1-hour chart of the EURUSD pair. And like other professional technical analysis traders, we have added a few lines which highlight some interesting areas on the chart, and which would have led to several trading opportunities.
First of all, we note a strong bullish move at position 1, where we see predominantly bullish candlesticks. However, this price action trend to the upside fades, and where we have drawn in a ceiling, or level of resistance marked ‘A.’ The bulls have essentially thrown in the towel. Some traders would be taking a profit at this stage, and price action begins to fall lower. This is a period of consolidation. But it is not long until the bulls regain control again, and an overall trend forms to the upside, as per the arrow at position 2, until price reaches our resistance line marked ‘B.’ Importantly, this line is the 1.10 exchange rate, a key level.
Incidentally, note that our resistance A-line causes some confusion for traders until price action reaches the key 1.10 exchange rate. While some see the resistance continuing to hold, it eventually becomes the beginning of support line ‘B.’
The overall move from the beginning of position 1 to the top of position 2, which is our key 1.10 exchange rate, is around 100 pips, a fairly substantial move. Again, bull traders will be looking to cash in and take a profit at this level while assuming that there will be limit orders in place here to go short at this level and therefore drive the price action lower. And that is exactly what happens as per arrow number 3, where sellers take a hold, and price action moves lower to our secondary support level marked support ‘B.’
Price action then begins to fluctuate between our support level B, and our resistance level ‘B.’ During this phase, technical Traders will be wondering if price action can breach the key
resistance level at 1:10, and where that might become an area of support at which point bulls would be expected to come in and drive the market to the next level of resistance.
After three consecutive attempts to breach the key 1.10 resistance level, bull traders at position 5 fail to reach the 1.10 level and they begin to fear that price will again be rejected at the 110 level, and price action pulls back to support level B, which is then breached, until price action finally finds support at level ‘A’.
During the time frame of this chart, from the 2nd to the 9th of October, 2019, we are presented with clear buying and selling opportunities with the EURUSD pair, simply by the use of Japanese candlesticks and a few trend lines that we have added to our chart to identify support and resistance levels. We can see sideways price action where traders are uncertain if there will be a complete reversal in the upward trend, and there are clear lines of interest, such as the 1.10 exchange rate.
And so, support lines become lines of resistance, and these fluctuate throughout the day depending on the level of liquidity and also market sentiment and other factors based on fundamentals of the relevant currencies within the pair.
Simply by understanding that these lines exist and where traders are driving the market too, and fears of where reversals lurk will give you a better understanding of mastering price action.