The Two Clouds Discovery
In Manesh Patel’s book, Trading with Ichimoku Cloud – The Essential Guide to Ichimoku Kinko Hyo Technical Analysis, he made a fantastic discovery. When I first read his work, I almost missed it. Whether he knows it or not, Mr. Patel made a discovery and an observation that his peers have not written about in their work. I call this the ‘Two Clouds Discovery.’ It’s one of those moments where you know you’ve probably been aware of this phenomena, but no one put words to it. It’s one of those things where you go, ‘huh, why didn’t I think of that?’ or ‘I can’t believe no one else noticed this.’
Two Clouds
The Two Clouds discovery puts a label on the component we already know: the Kumo (Cloud). The names we are giving to these two components are the Current Cloud and the Future Cloud. The Current Cloud is where price action is currently trading. The Future Cloud is the further point of Senkou Span A and Senkou Span B – so Future Senkou Span A and Future Senkou Span B. It’s important to think of it this way:
The Current Cloud is the average of the Tenkan-Sen and Kijun-Sen from 26 periods ago.
The Future Cloud is the current average of the Tenkan-Sen and Kijun-Sen.
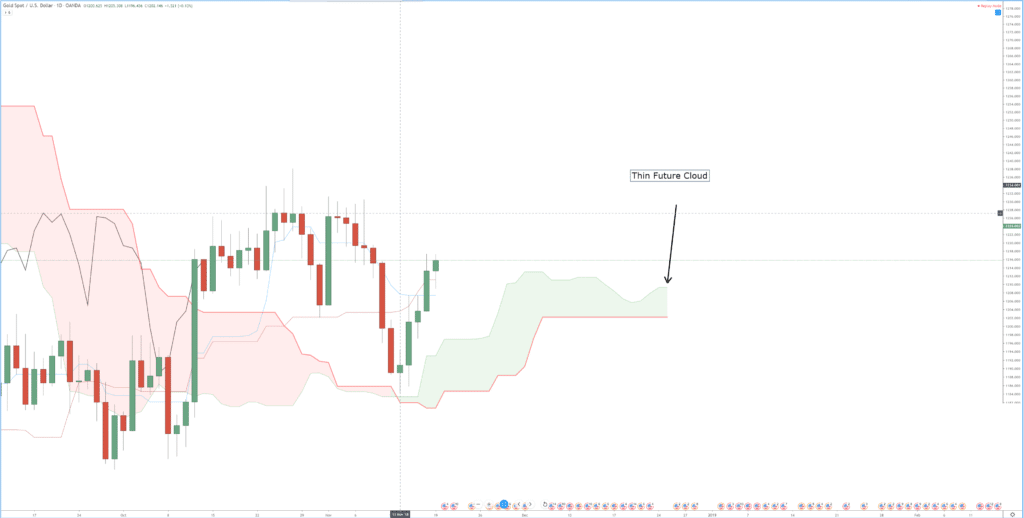
And here is the main point and of the Two Clouds Discovery: When a significant trend change occurs, the Future Cloud is thin with both the current Senkou Span and Senkou Span B pointing in the direction of the Future Cloud.
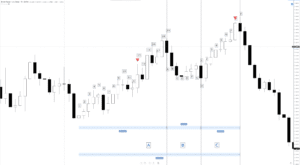
The image below is Gold’s daily chart. Using the market replay feature in TradingView, I have used November 20th, 2018, as the starting point for this article. It’s important to remember what we are looking for: Current Senkou Span A and Current Senkou Span B pointing in the direction of Future Senkou Span B and Future Senkou Span A.
First, we look to see if the Future Cloud is thin. The thickness or thinness of the Cloud is going to be very subjective, but I believe most people can determine whether something is thick or thin based on the instrument they trade and the timeframe they are trading in. For Gold, this is a thin cloud.
Next, we want to see if the Current Senkou Span A and Current Senkou Span B are pointing in the direction of the Future Cloud – they are.
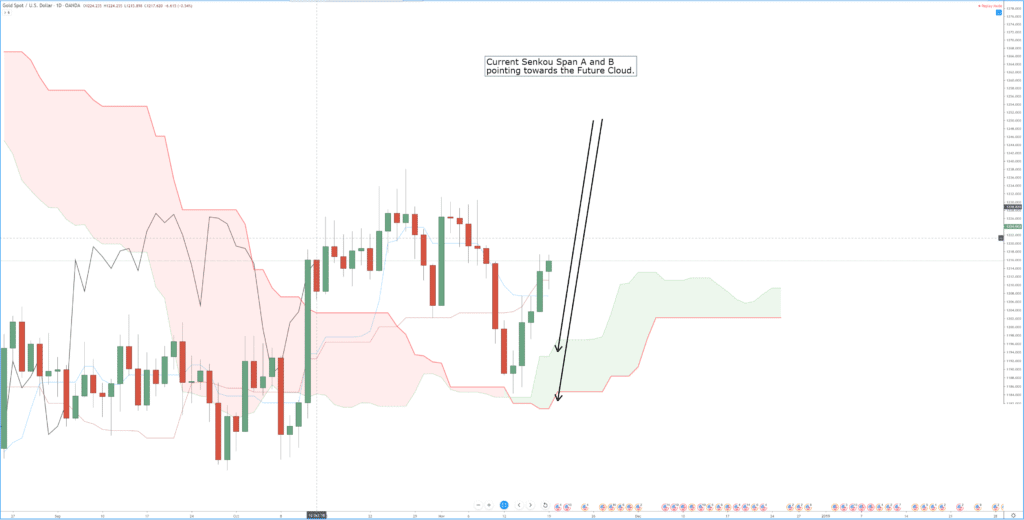
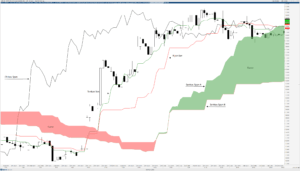
Now, let’s see what happens when we populate the screen with the price action that occurred after November 20th, 2018. What we should see if a significant trend change is occurring when both the Current Senkou Span A and Current Senkou Span B are pointing in the direction of a thin Future Cloud.
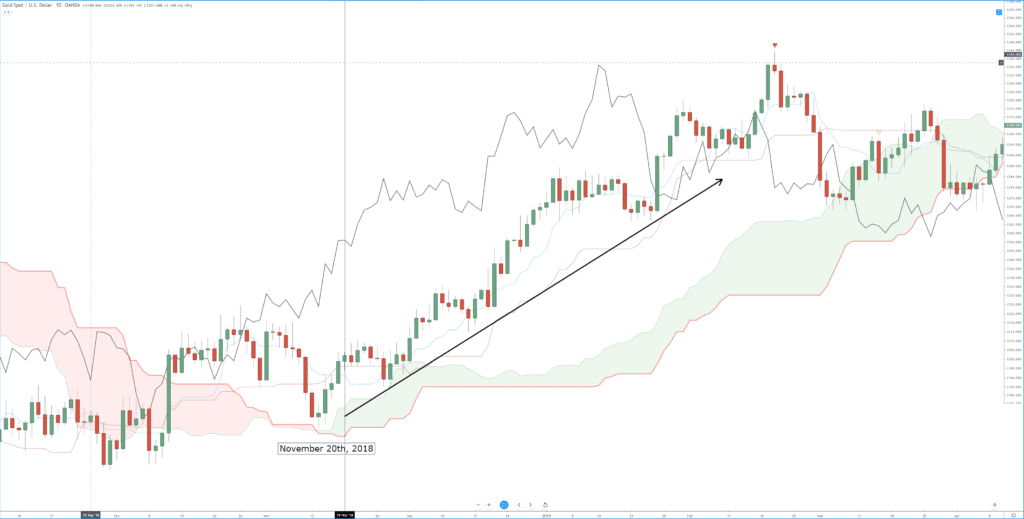
Go through any Daily or Weekly chart and find a thin Cloud and then utilize the market replay – odds are you will see what I have discovered: a high positive expectancy rate of markets trending strongly when price is trading near where the current Senkou Span A and current Senkou Span B are pointing towards the direction of a thin Future Cloud.
Sources: Péloille, Karen. (2017). Trading with Ichimoku: a practical guide to low-risk Ichimoku strategies. Petersfield, Hampshire: Harriman House Ltd.
Patel, M. (2010). Trading with Ichimoku clouds: the essential guide to Ichimoku Kinko Hyo technical analysis. Hoboken, NJ: John Wiley & Sons.
Linton, D. (2010). Cloud charts: trading success with the Ichimoku Technique. London: Updata.
Elliot, N. (2012). Ichimoku charts: an introduction to Ichimoku Kinko Clouds. Petersfield, Hampshire: Harriman House Ltd.