Robert Kiyosaki is an American entrepreneur, investor, writer, speaker, and motivational speaker of Japanese descent. He is the founder, CEO, and majority shareholder of Cashflow Technologies, a corporation that holds the licenses for the “Padre Rico Padre Pobre” brand, his best-known work.
Kiyosaki has provided us with excellent readings, those capable of inspiring and transforming the lives of anyone. If anything stands out Robert Kiyosaki, it is his vocation to teach, his vocation to serve others. This vocation has led him to write a book where his purpose is to teach what is the vision that children should have about the financial culture. A culture that, unfortunately, is neither taught nor encouraged in the classroom. We will focus on providing phrases that I think can be tremendously revealing when it comes to the concept that modern society has about financial education.
What follows are forty of Kiyosaki’s most notable phrases.
“Teaching about money is not given in schools. The school focuses on professional and curricular skills, but not on financial skills.”
“Making money work for you is a permanent topic of study. Most people attend college for four years and their education ends.”
“You have to learn to master money, not to be afraid of it. And they don’t teach that to kids, and if you don’t learn it, you can become a slave to money.”
“The main cause of poverty and financial hardship is fear and ignorance, not the economy or government of the rich.”
“For most people school is the end and not the beginning.”
“To spend your life in fear, without exploring your dreams, is cruel. Working hard to make money and thinking that money will allow you to buy things that will make you happy is also cruel.”
“A job is the solution for the short term but it will be a long-term problem.”
“We focus on the word education and not on financial education.”
“In accounting what matters is not the numbers but what the numbers tell you. It’s like words. The important thing is not the words, but the story that the words tell you.”
“An asset is something you put in my pocket. A passive is something you take out of my pocket. If you want to be rich, just spend your life building assets.”
“What is needed in education is not how to make money, but how to spend it; that is, what to do after earning it. That’s called financial fitness.”
“Making more money rarely solves a person’s money problems. Intelligence solves them. If you find out you’re in the hole… stop digging.”
“An intelligent person hires people who are smarter than her.”
“You need to learn how to make your efforts benefit you and your family directly.”
“The rich acquire assets. The poor have only expenses.”
“Financial problems are often the direct result of people working their whole lives for another investor. Most people will have nothing when their working lives are over.”
“Our current education system focuses on preparing young people today for good jobs, rather than developing their financial skills. Their lives will revolve around their salaries.”
“What often happens with school is that you will often become what you study. (…) The mistake in becoming what one studies is that many people forget to take care of their own business. They spend their lives running someone else’s business and making that person rich.”
“Start by running your own business. Keep your job, but start acquiring real assets, not liabilities or personal effects that have no real value once you are home.”
“The first lesson to make money work for me instead of me working for money is actually about power. If you work to make money, you give power to your employer. If your money works for you, you retain and control power.”
“Most people only contemplate for their lives to work hard, borrow and save.”
“Poor people, and in general the middle-class work only for money, the rich make money.”
“Saving money every month is a solid idea. It’s an option: the option most people follow. The problem is this: it blinds people to what is really happening.”
“My child is doing well in school and is getting a good education. It may be good, but will it be adequate?”
“Financial intelligence consists of four main skills:
- Financial education. The ability to read numbers
- Investment strategies. The science of money creates money.
- The market. Supply and demand.
- The law. Know accounting rules and regulations.”
“Real opportunities aren’t usually seen with your eyes, they are seen with the mind.”
“Unfortunately, people are not rich because they are terrified of losing. People who avoid failure also avoid success.”
“Work to learn, not to earn money.”
“There is an old cliché in English that states that the word JOB is the acronym for Just over broke.”
“Since the school considers financial intelligence to be a form of intelligence, most workers live according to their means. They work and pay their bills.”
“I now know people who are often too busy to take care of their wealth. And there are people who are too busy to take care of their health. The cause is the same. They’re busy and they’re busy as a way to avoid something they don’t want to face. No one’s told them. Deep down, they know.”
“The problem I detect today is that there are millions of people who feel guilty about their ambition.”
“The message repeated to us again and again is: Let us work hard, let us earn money, let us spend it; when we run out, we can always borrow. Unfortunately, 90 percent of the Western world adheres to this dogma simply because it is easier to find a job and work to earn money.”
“All of us have a choice. I simply chose to be rich and make that choice every day.”
“Invest first in education. Actually, the only real asset you have is your mind.”
“Most people simply buy investments instead of first investing in learning about investments.”
“The poor have bad habits. A very common bad habit is innocently known as «resorting to savings». The rich know that savings are only to create money, not to pay bills.”
“We go to school to learn a profession in order to work for money, when it’s about making money work for you.”
“You were all given two gifts: your mind and your time. It is up to you to do as you please with both.”
“There are five main reasons why people with financial literacy cannot develop their asset column:
- Fear
- Cynicism
- Laziness
- Bad habits
- Arrogance”
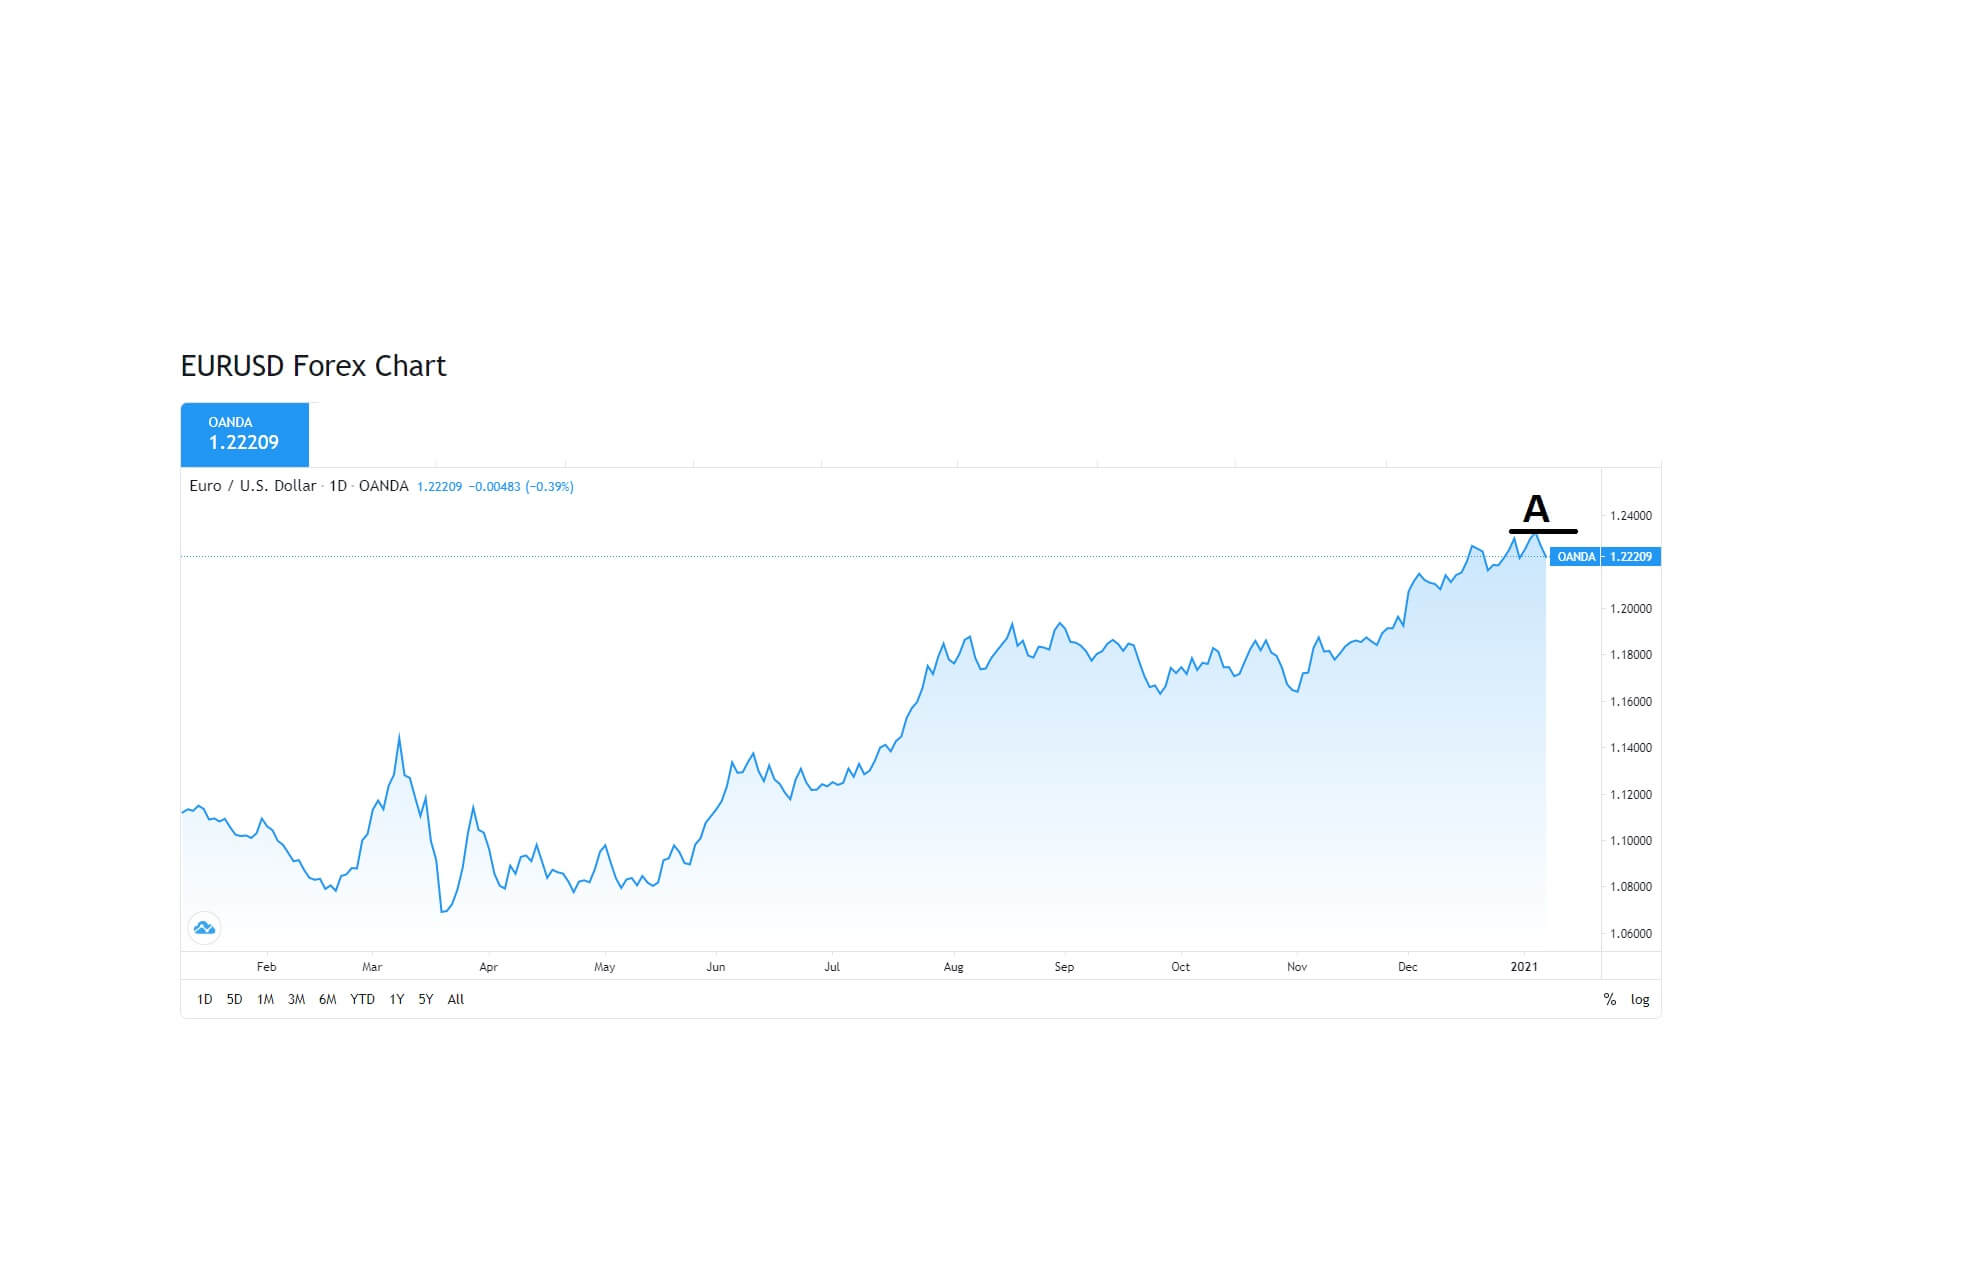
The relationship between Robert Kiyosaki and Forex has always been close and has left us with a lot of lessons, but only that, good lessons and ways forward to achieve success as investors. Robert Kiyosaki has never encouraged trade of any kind but has confined himself to analyzing and trying to educate through his books and lectures to have a winning mentality, and that we can eliminate all our fears so that we have the best habits for our investments.
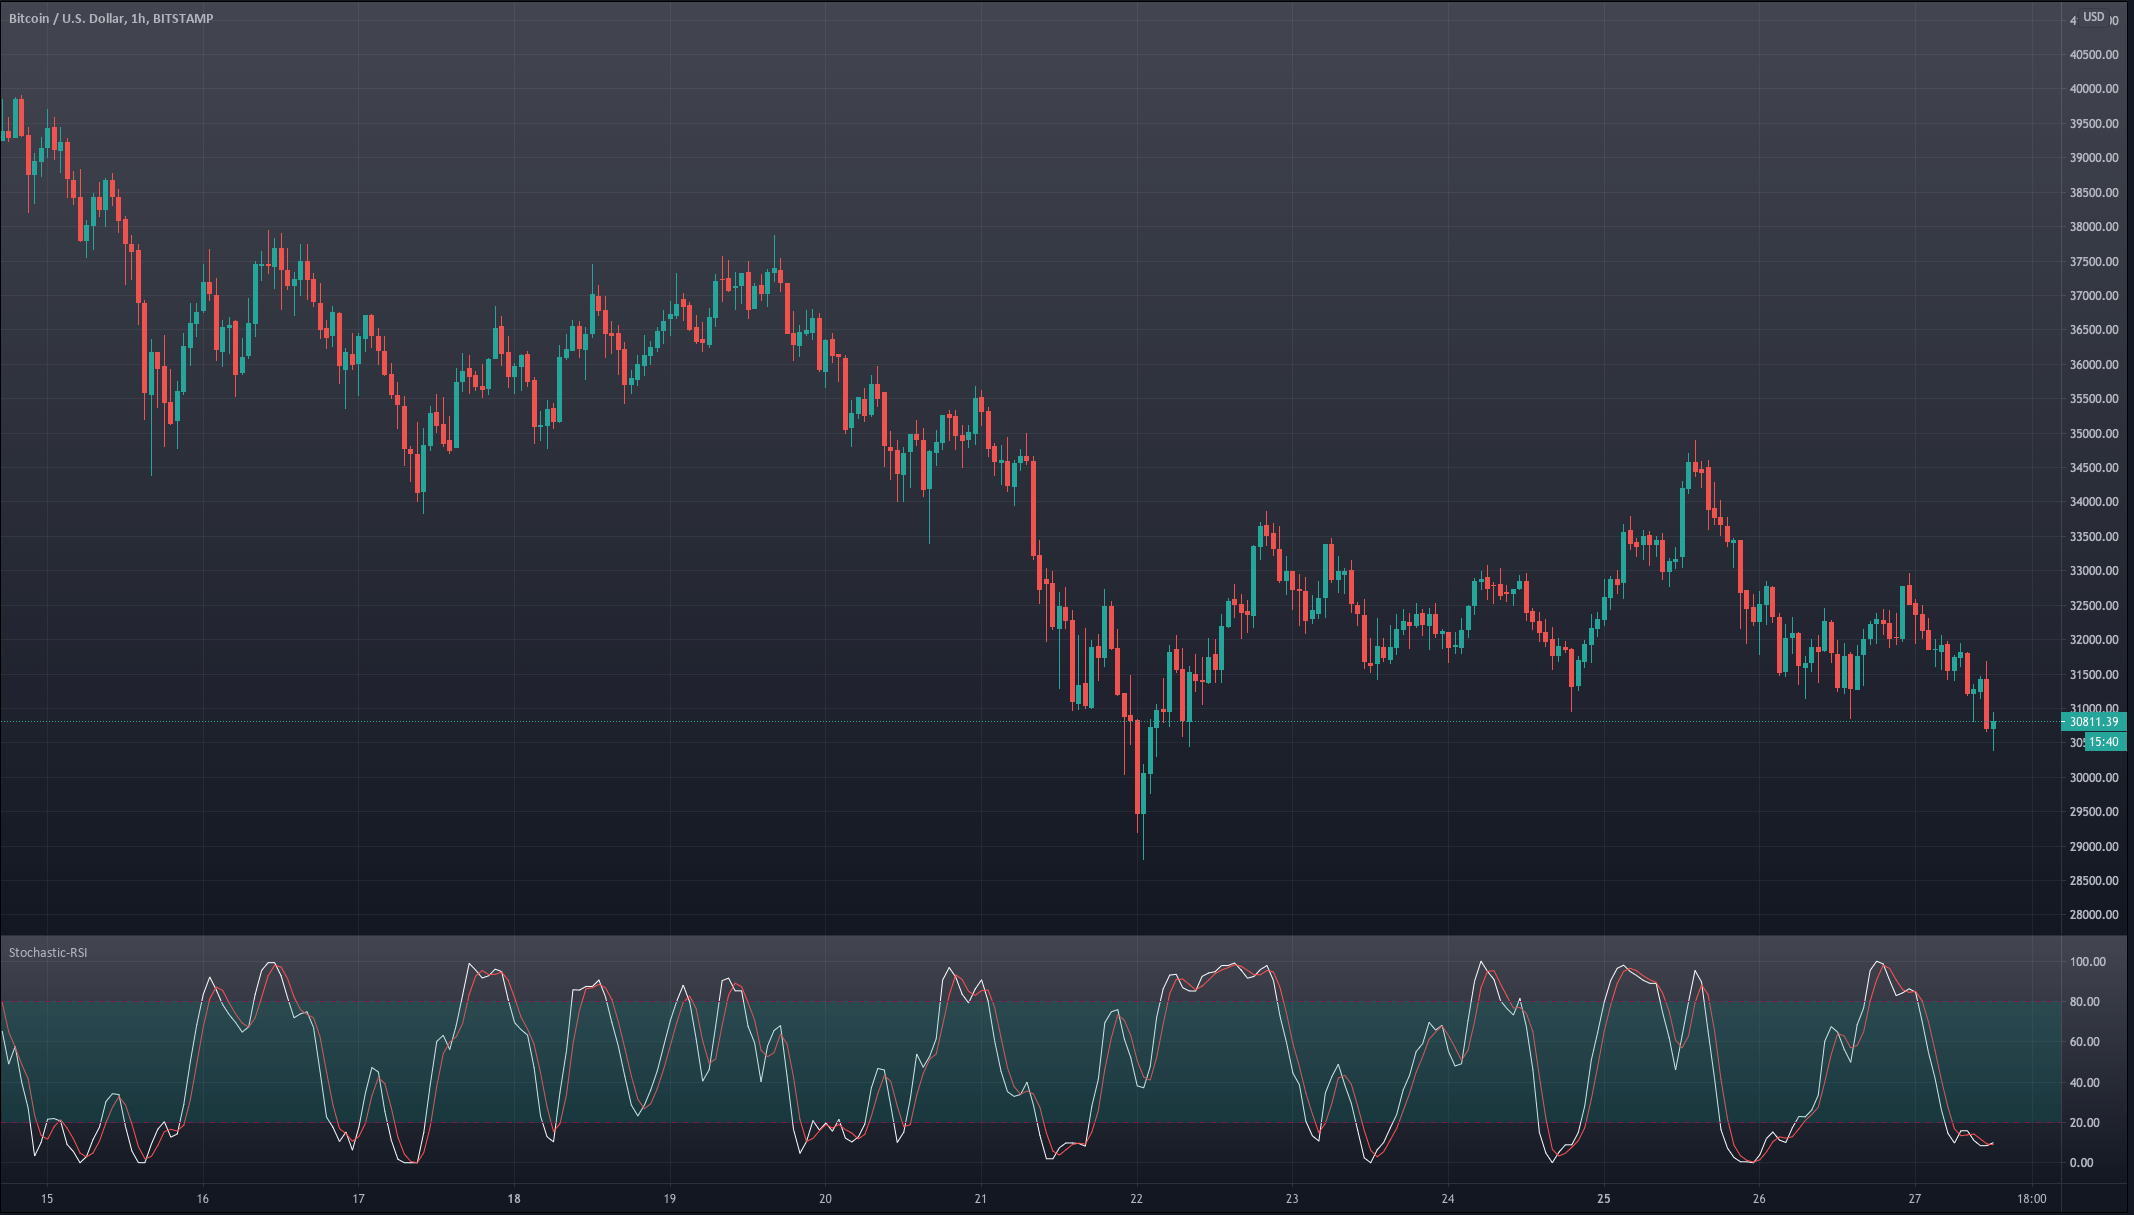
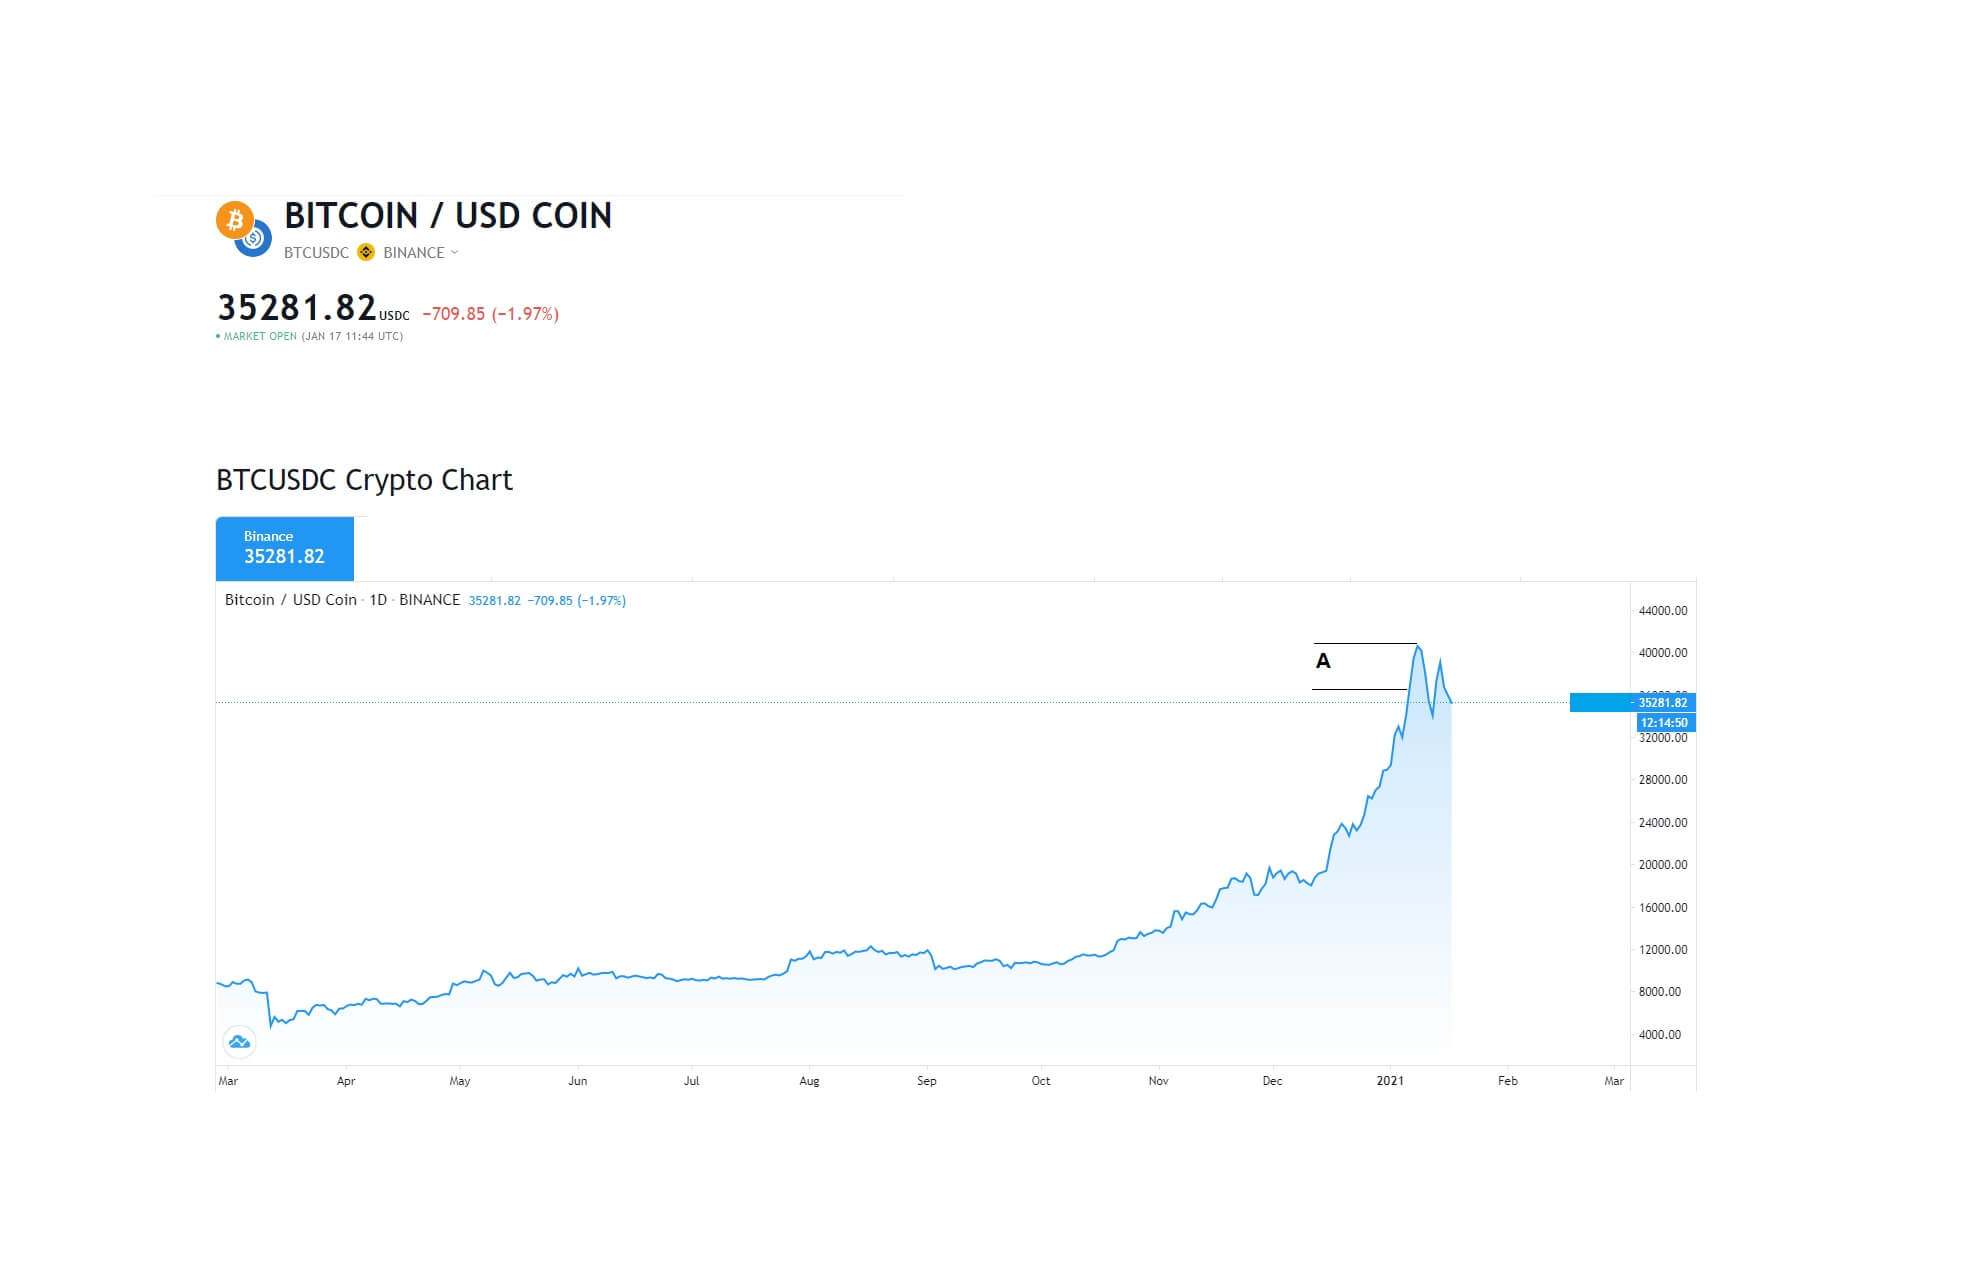
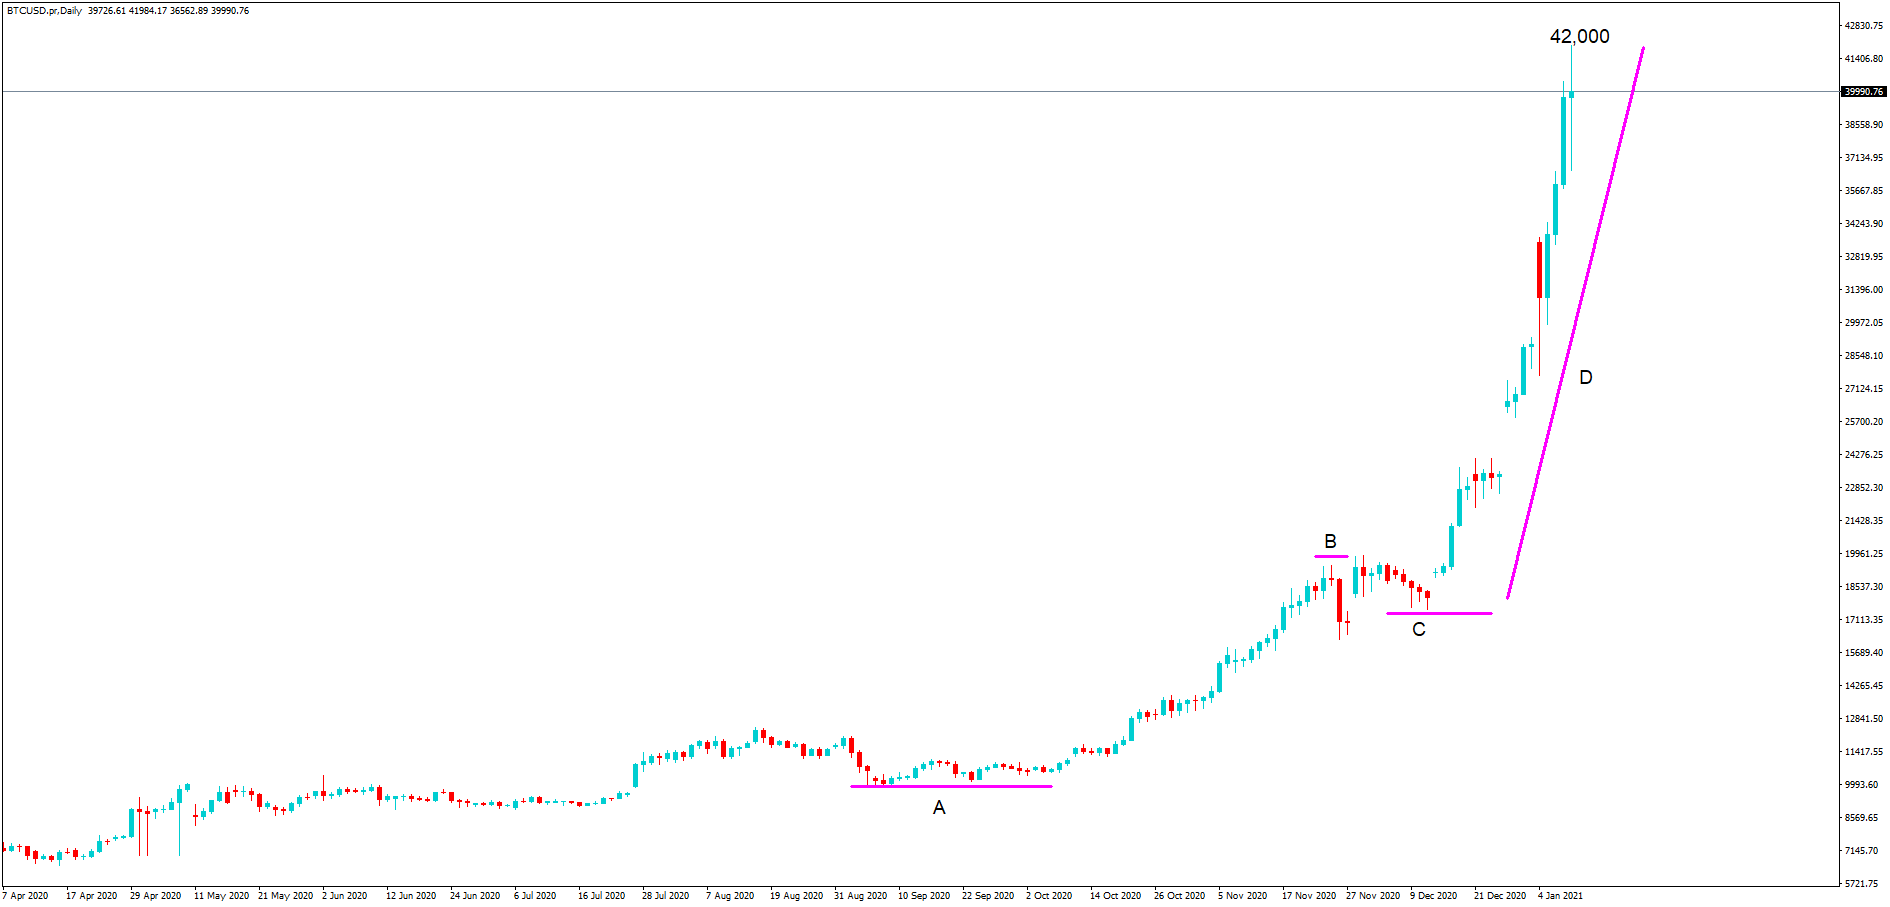
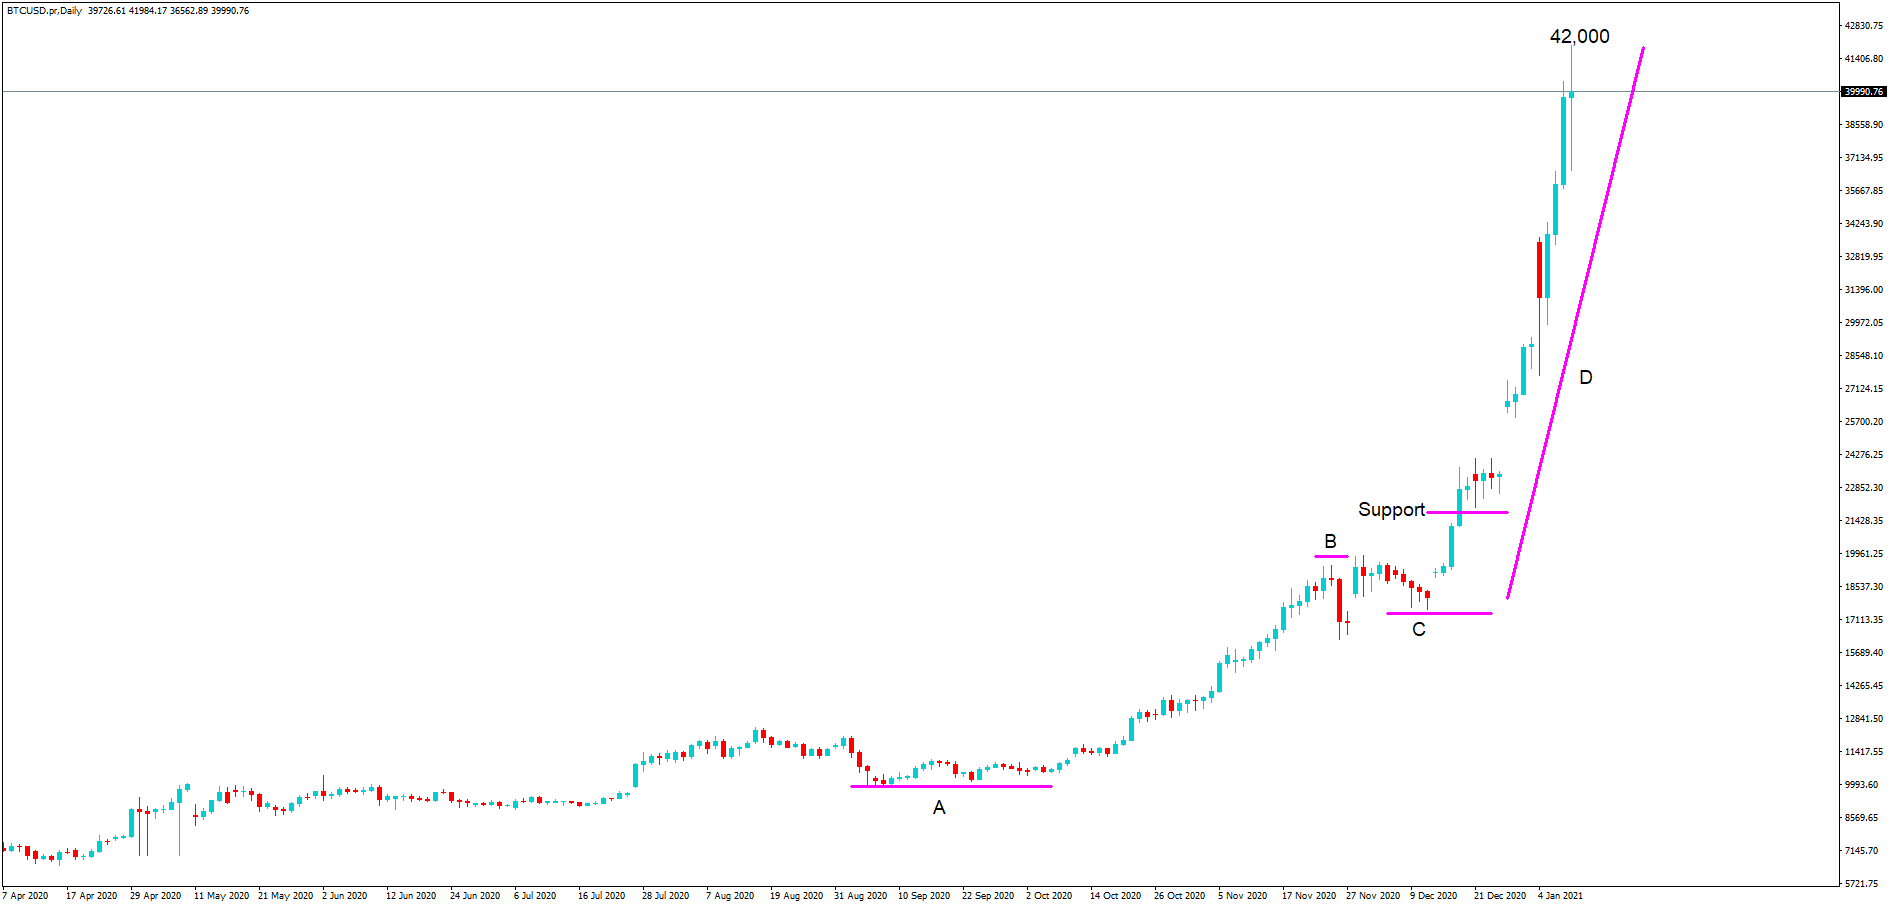
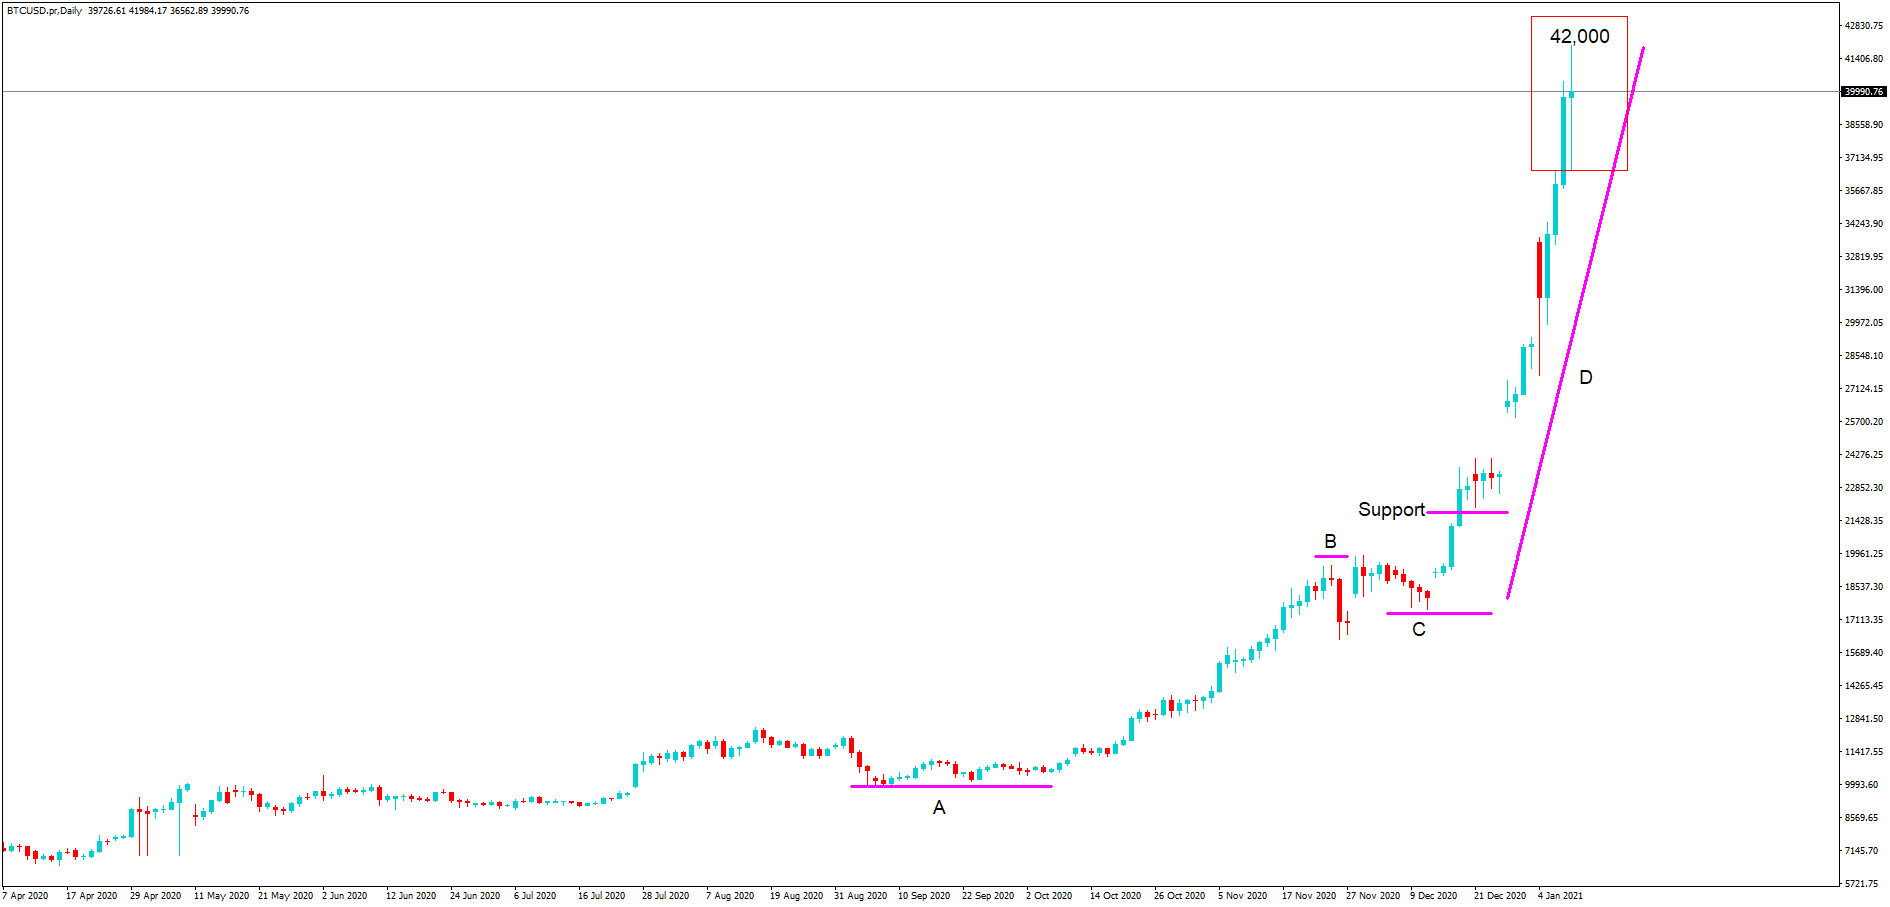
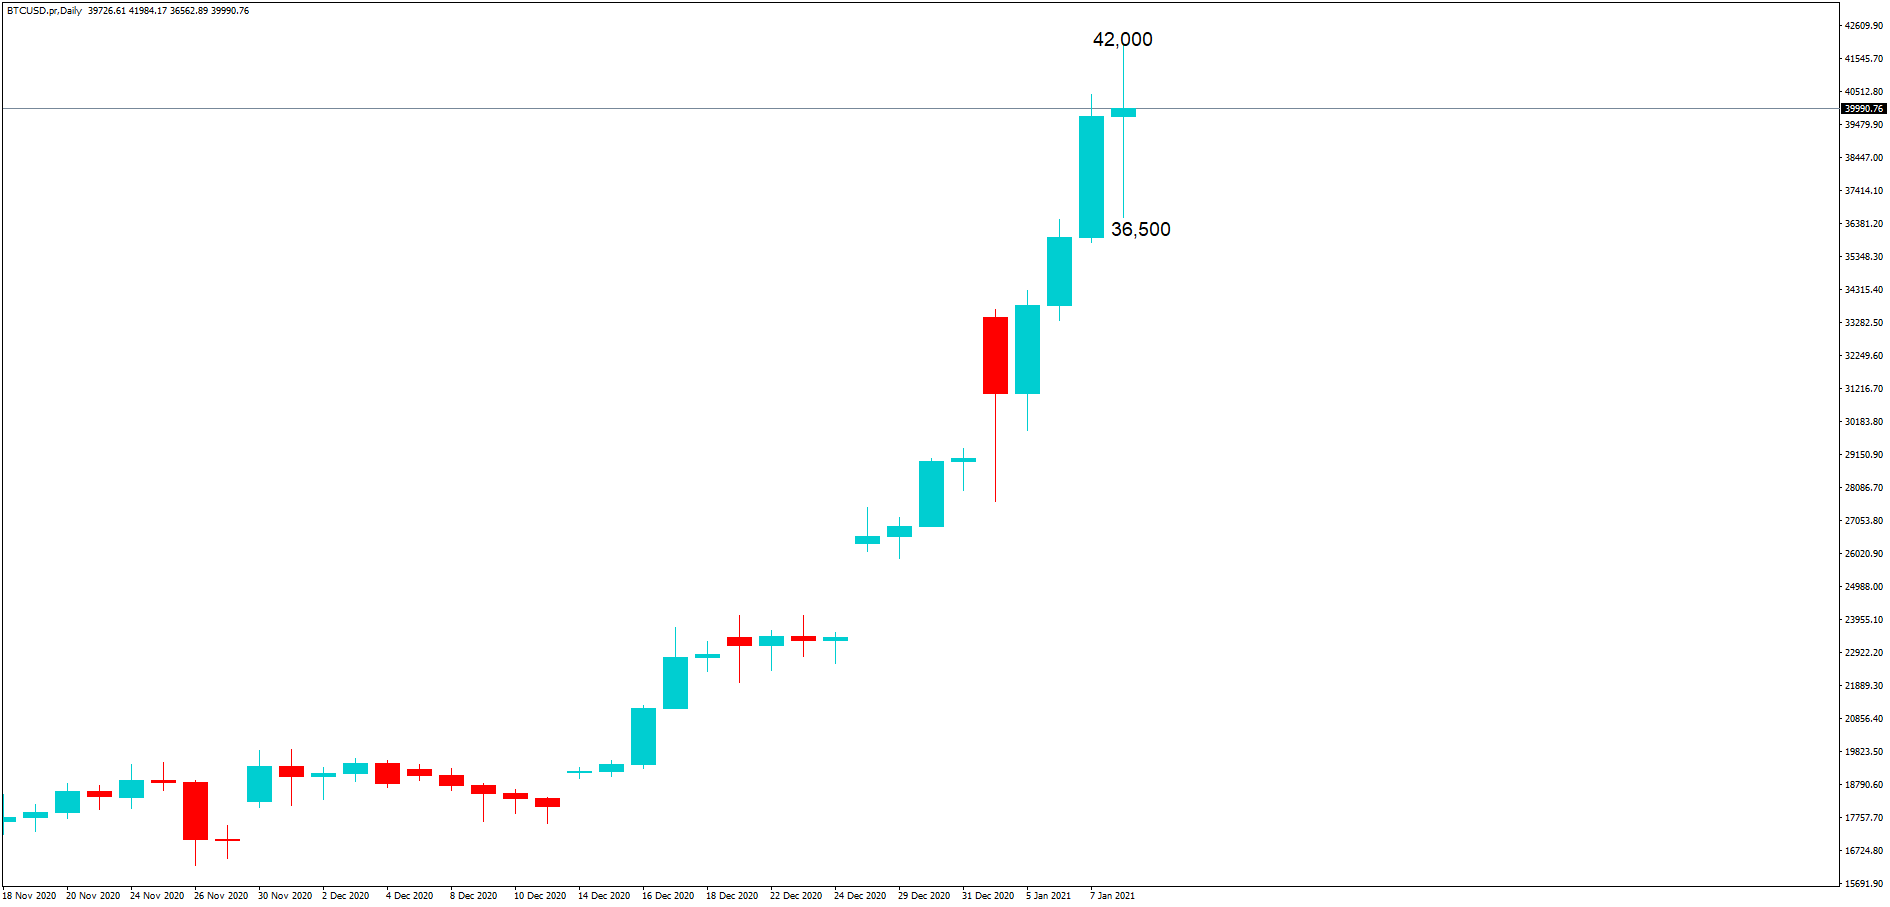
As a curiosity…, one of Robert Kiyosaki’s latest statements predicts that Bitcoin will be worth $75,000 in 3 years. This means the price of Bitcoin will increase by almost 100% a year over the next three years. Will it come true?


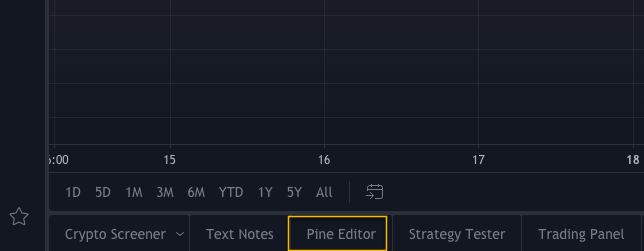
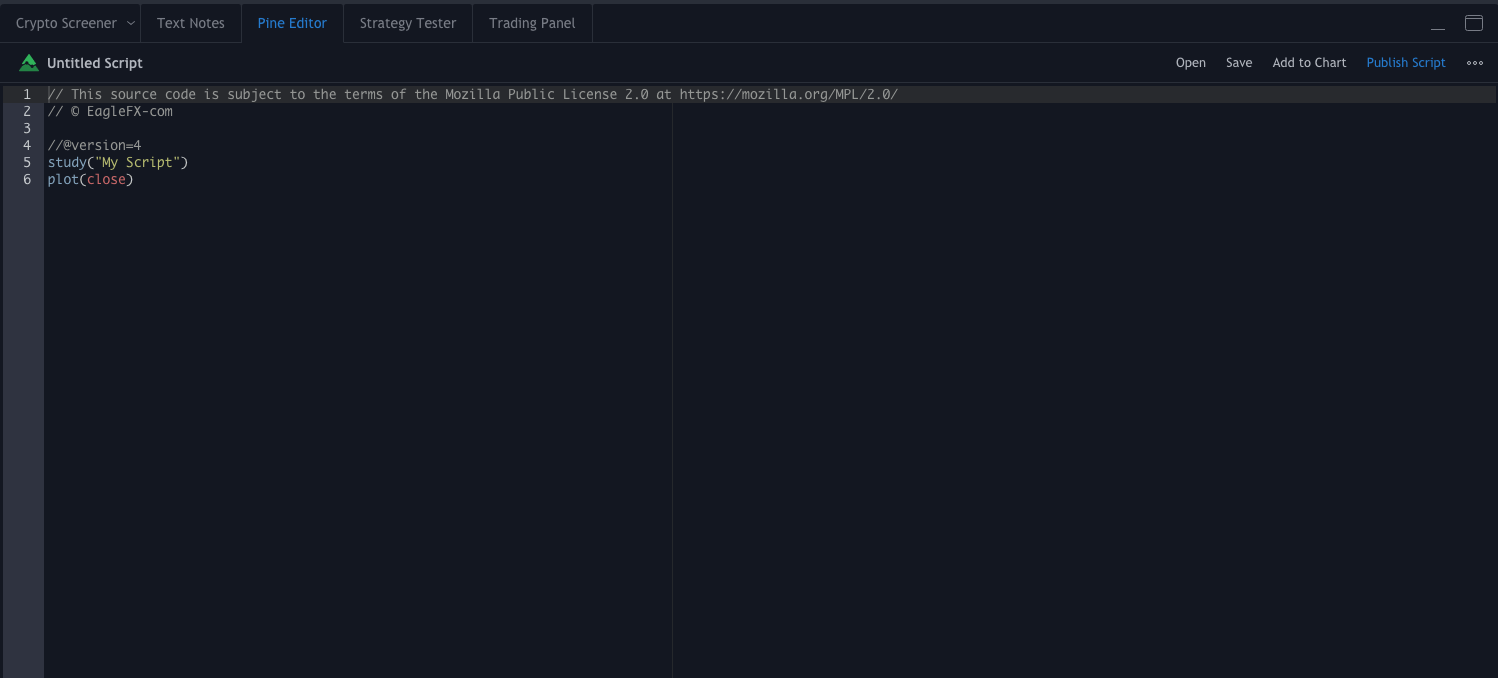
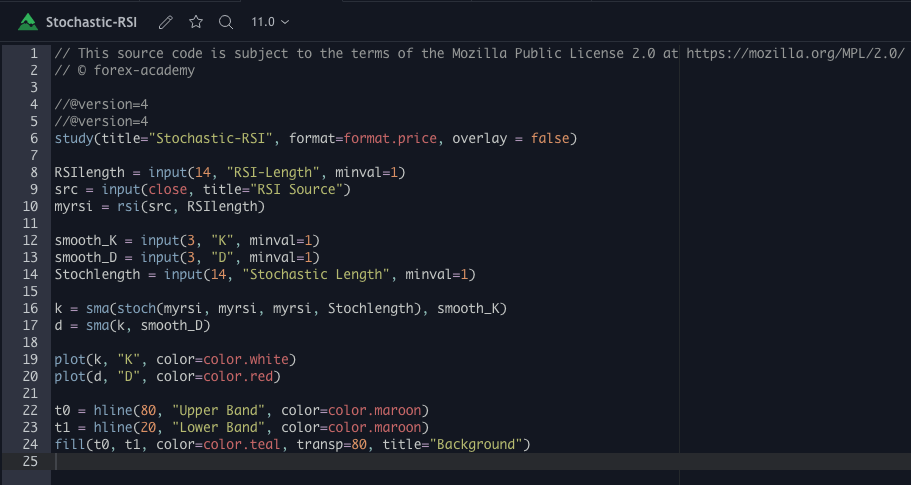
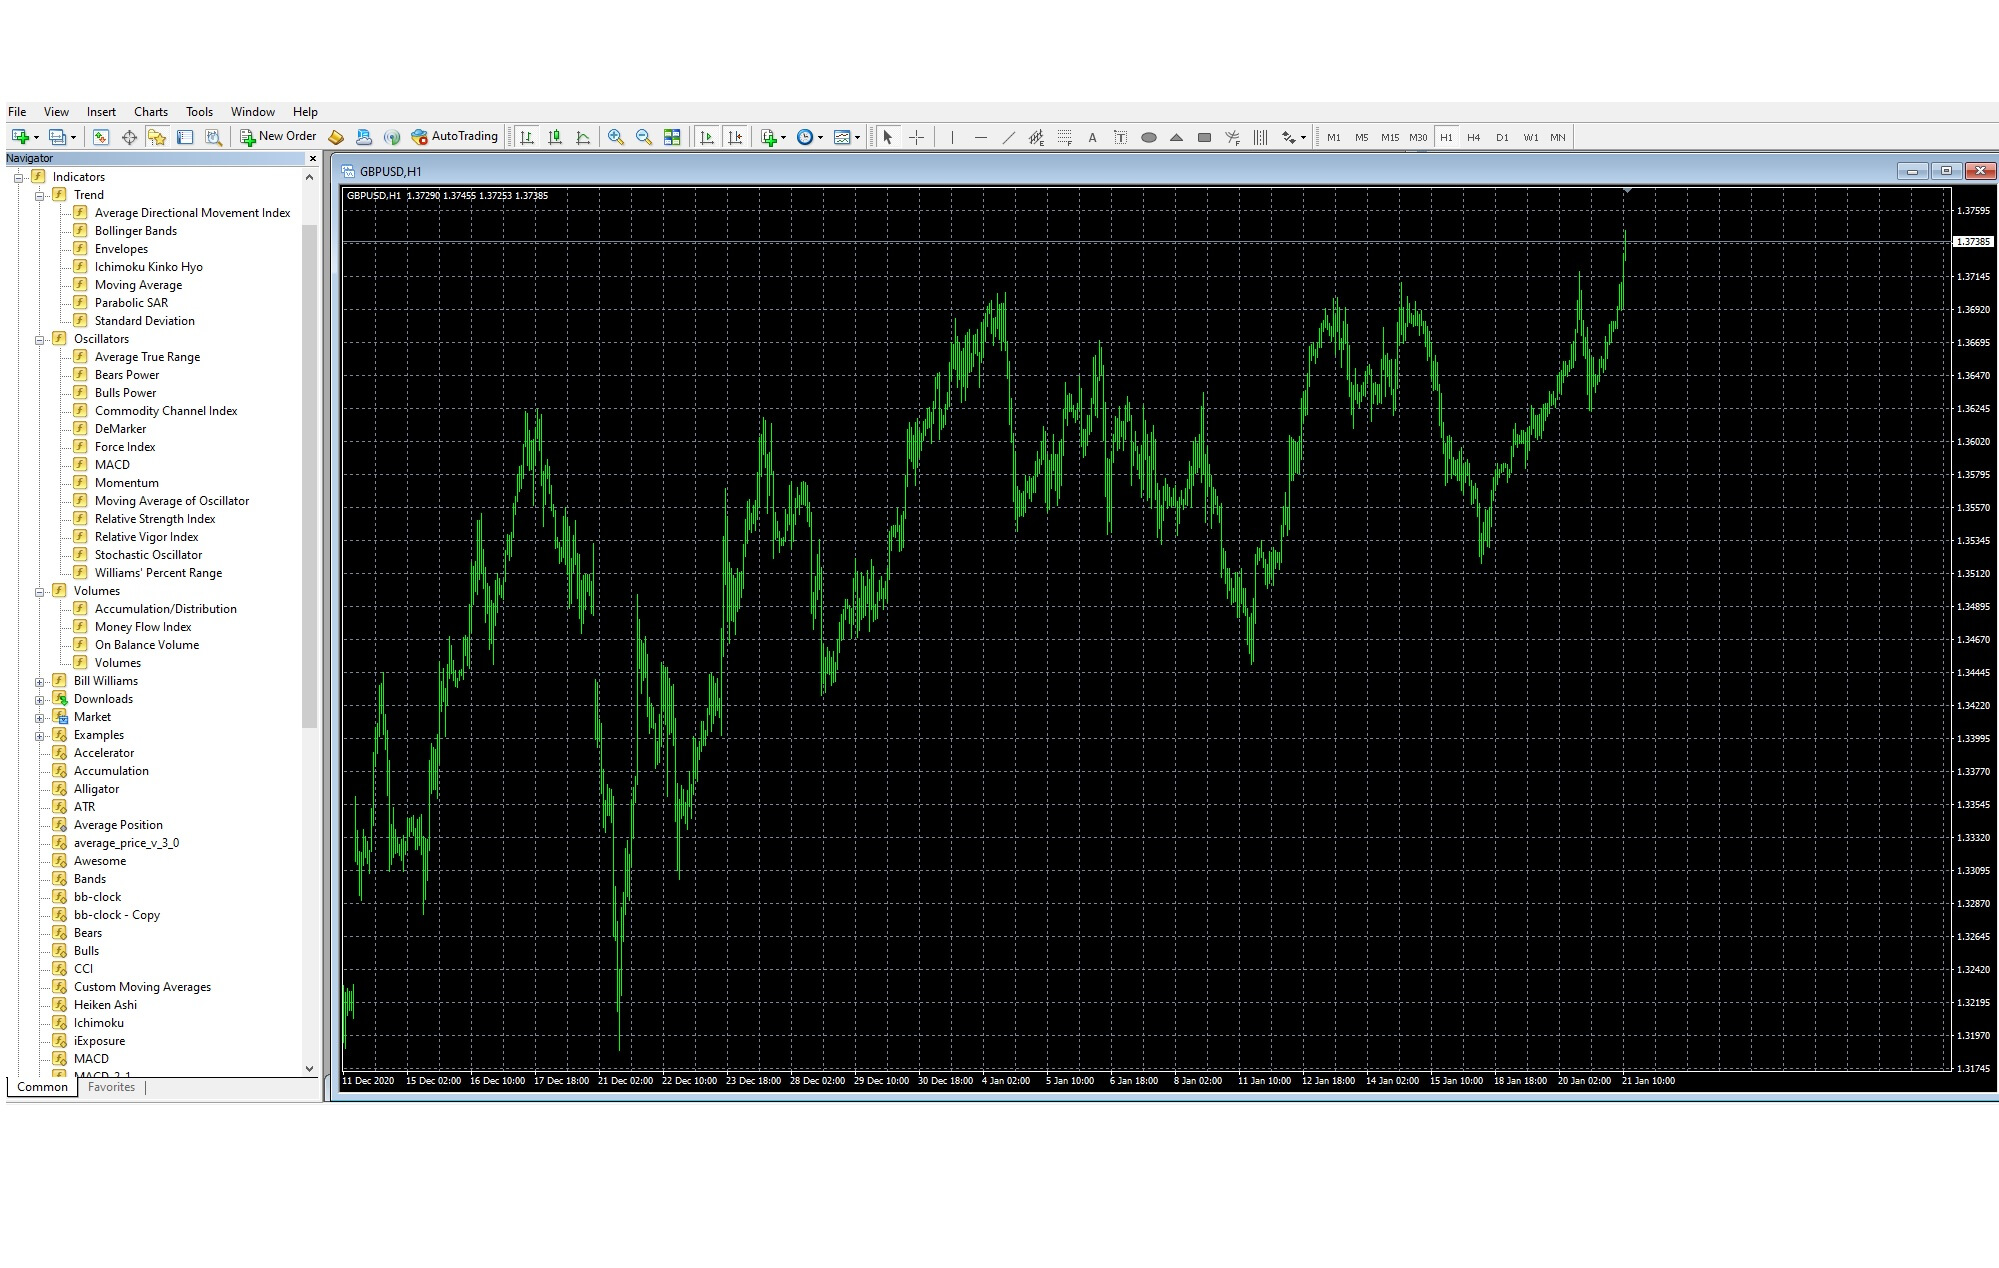
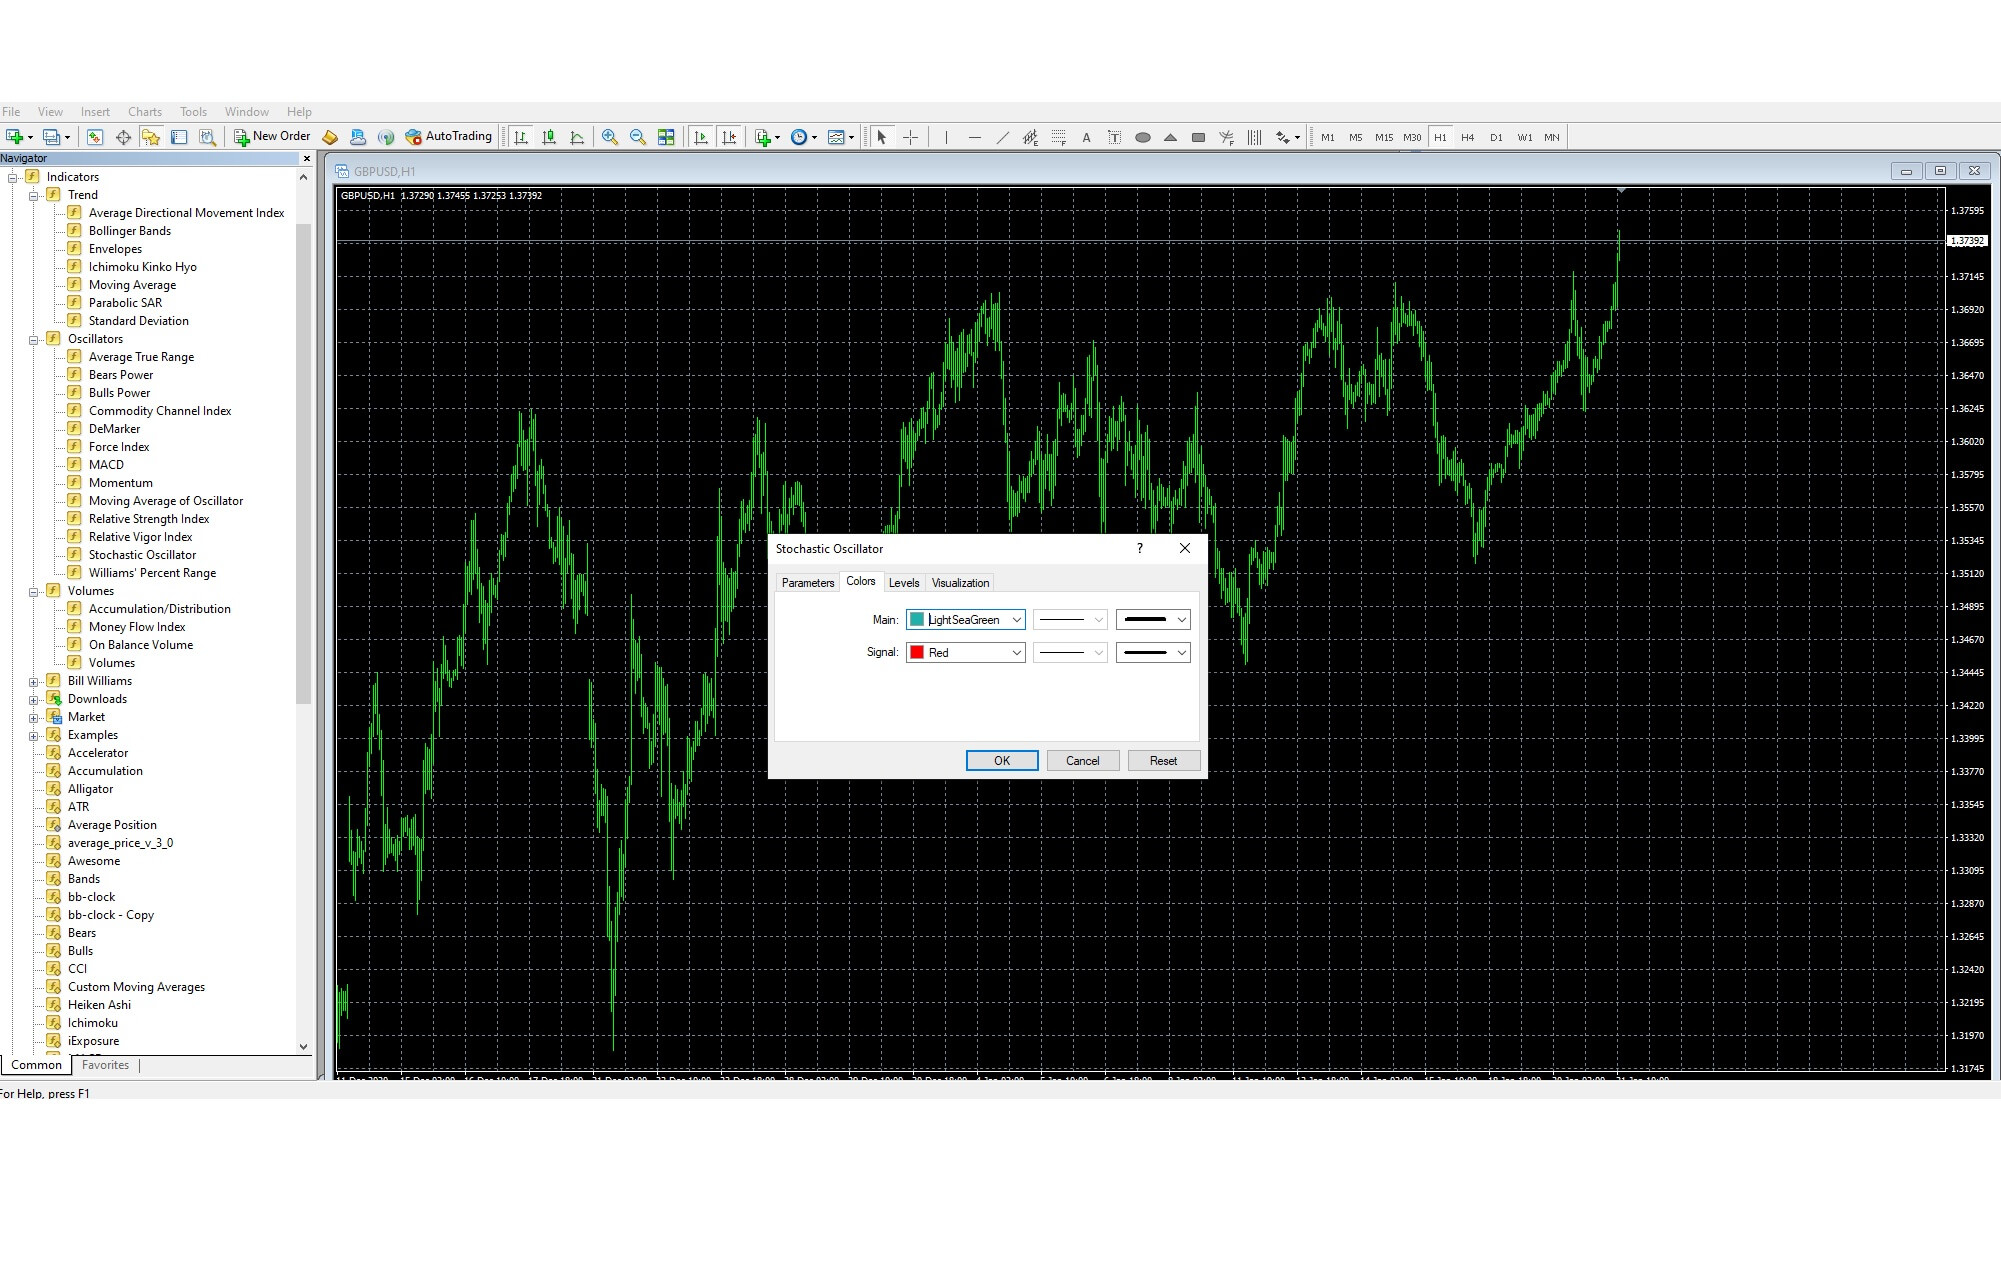
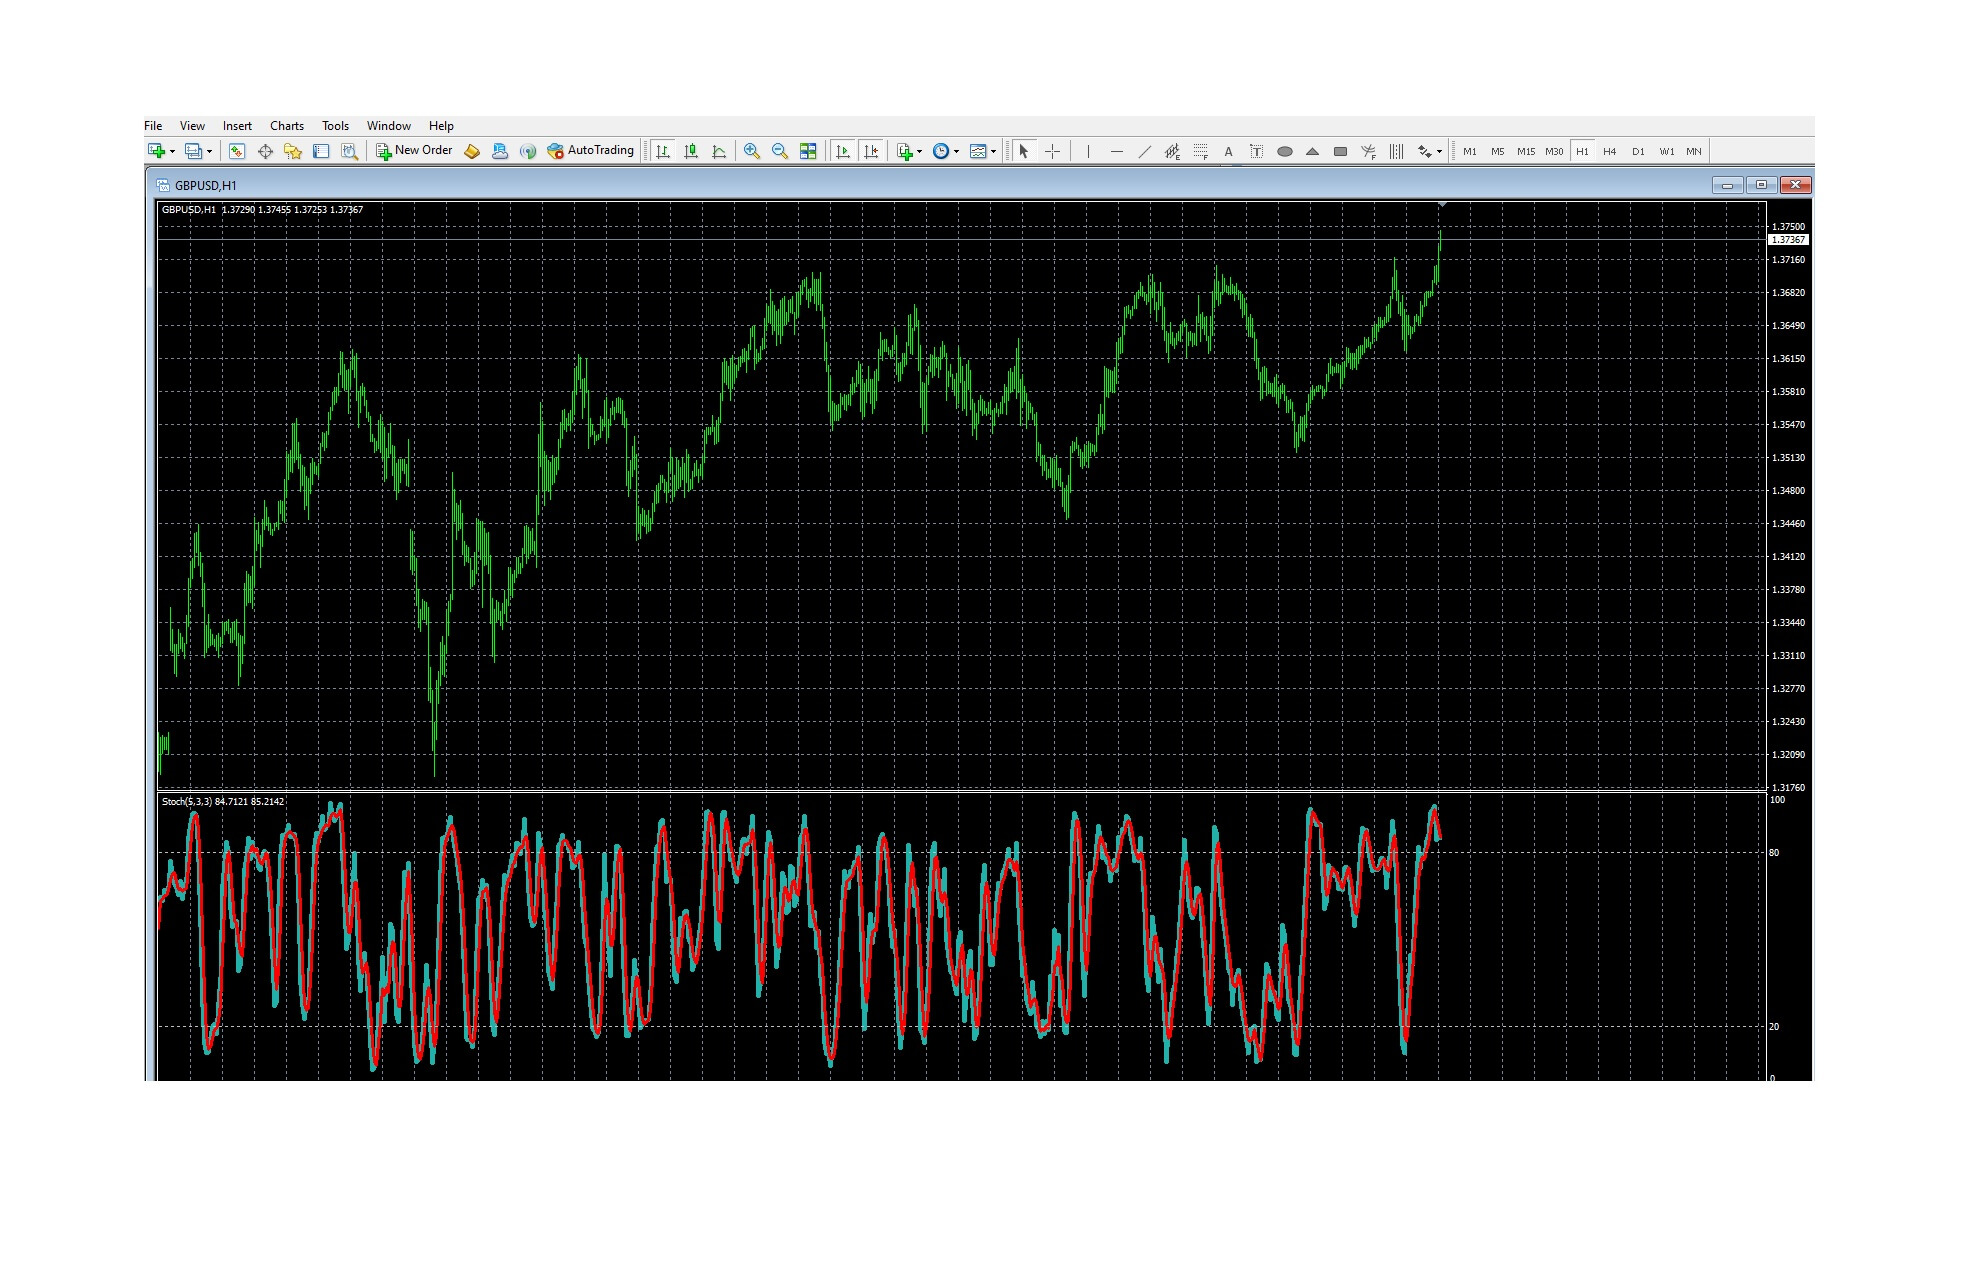
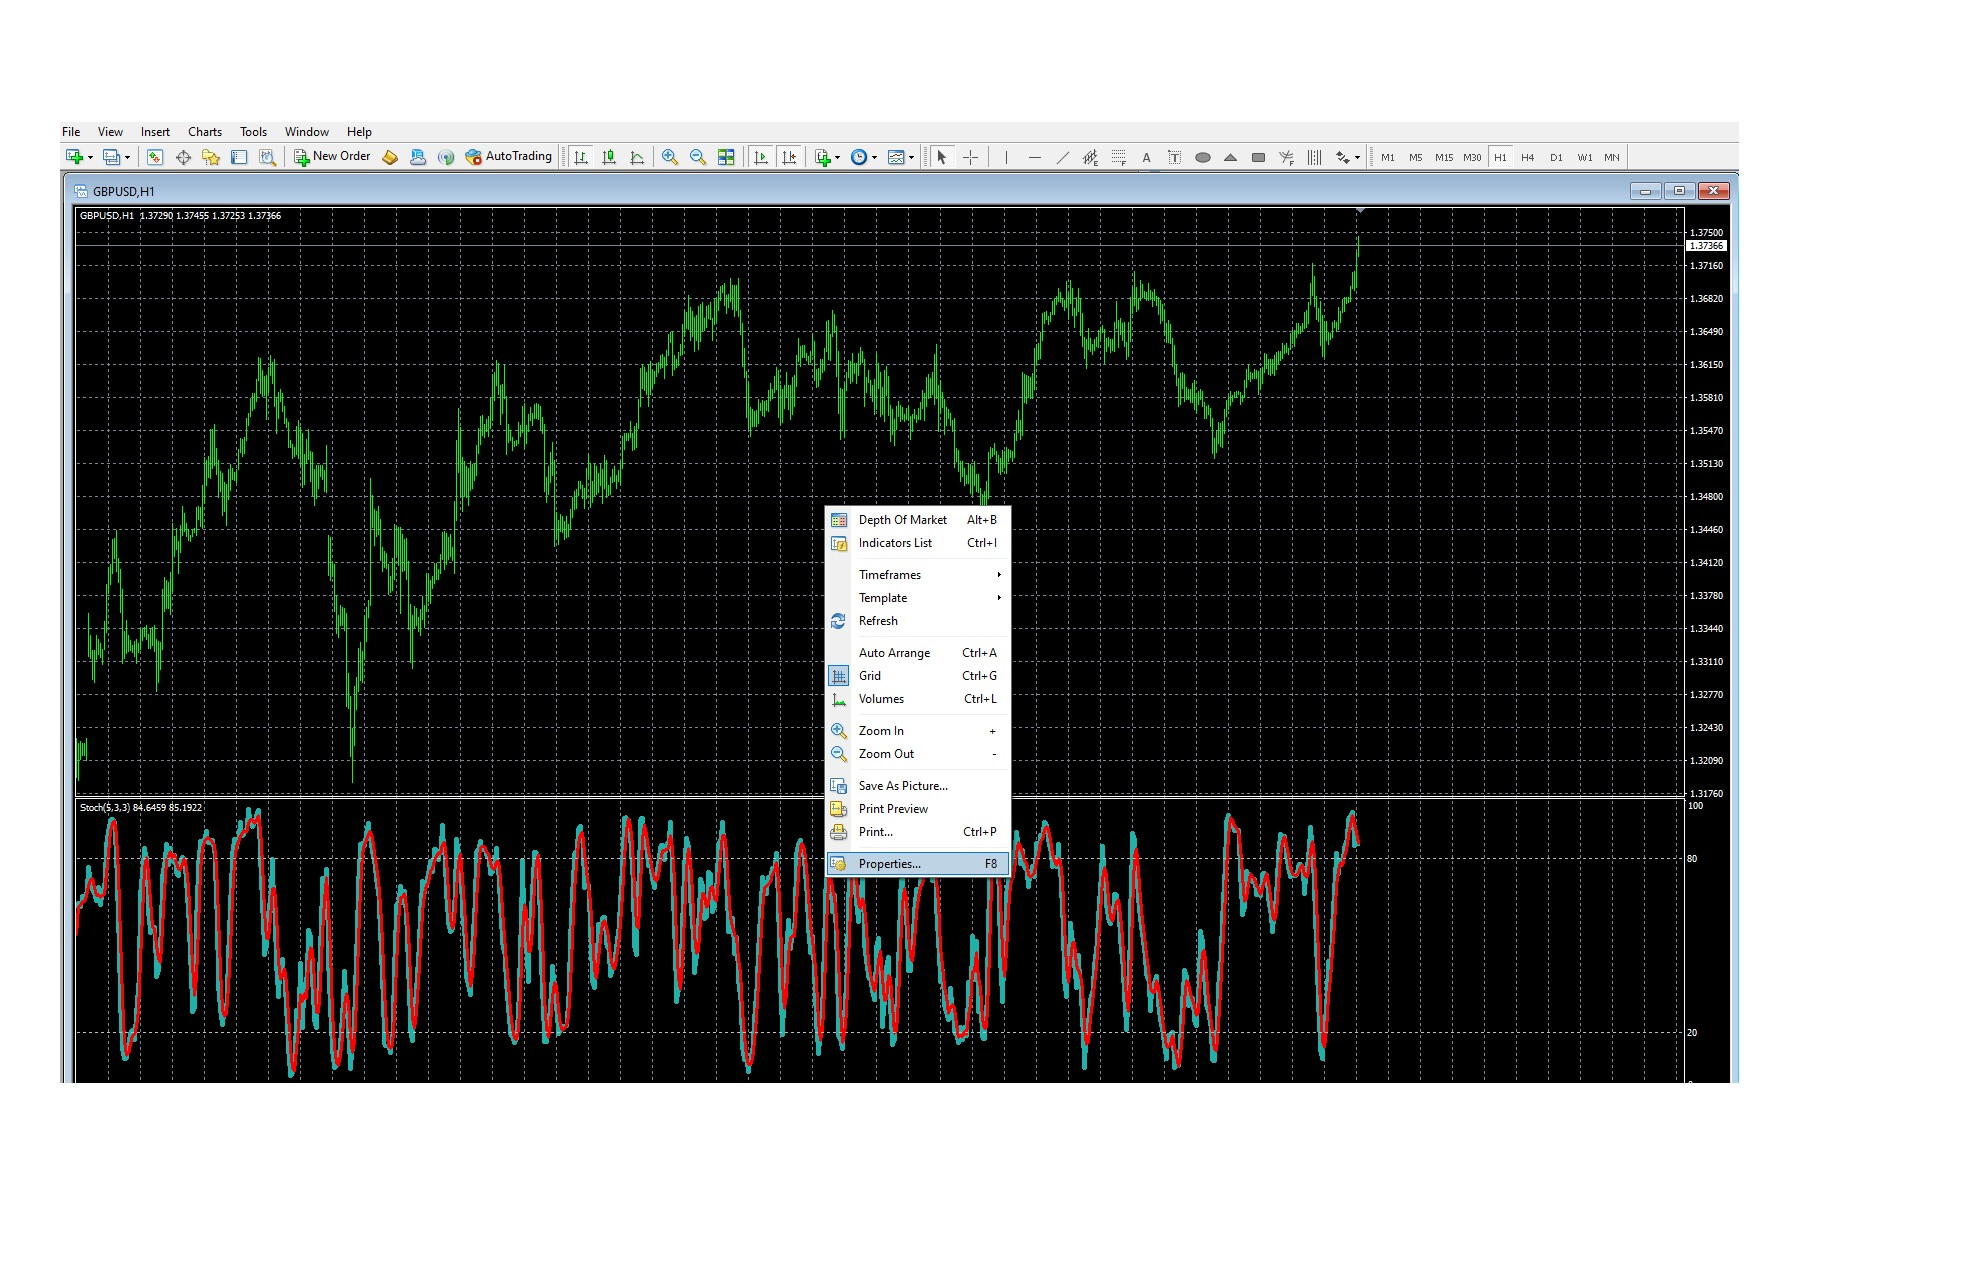
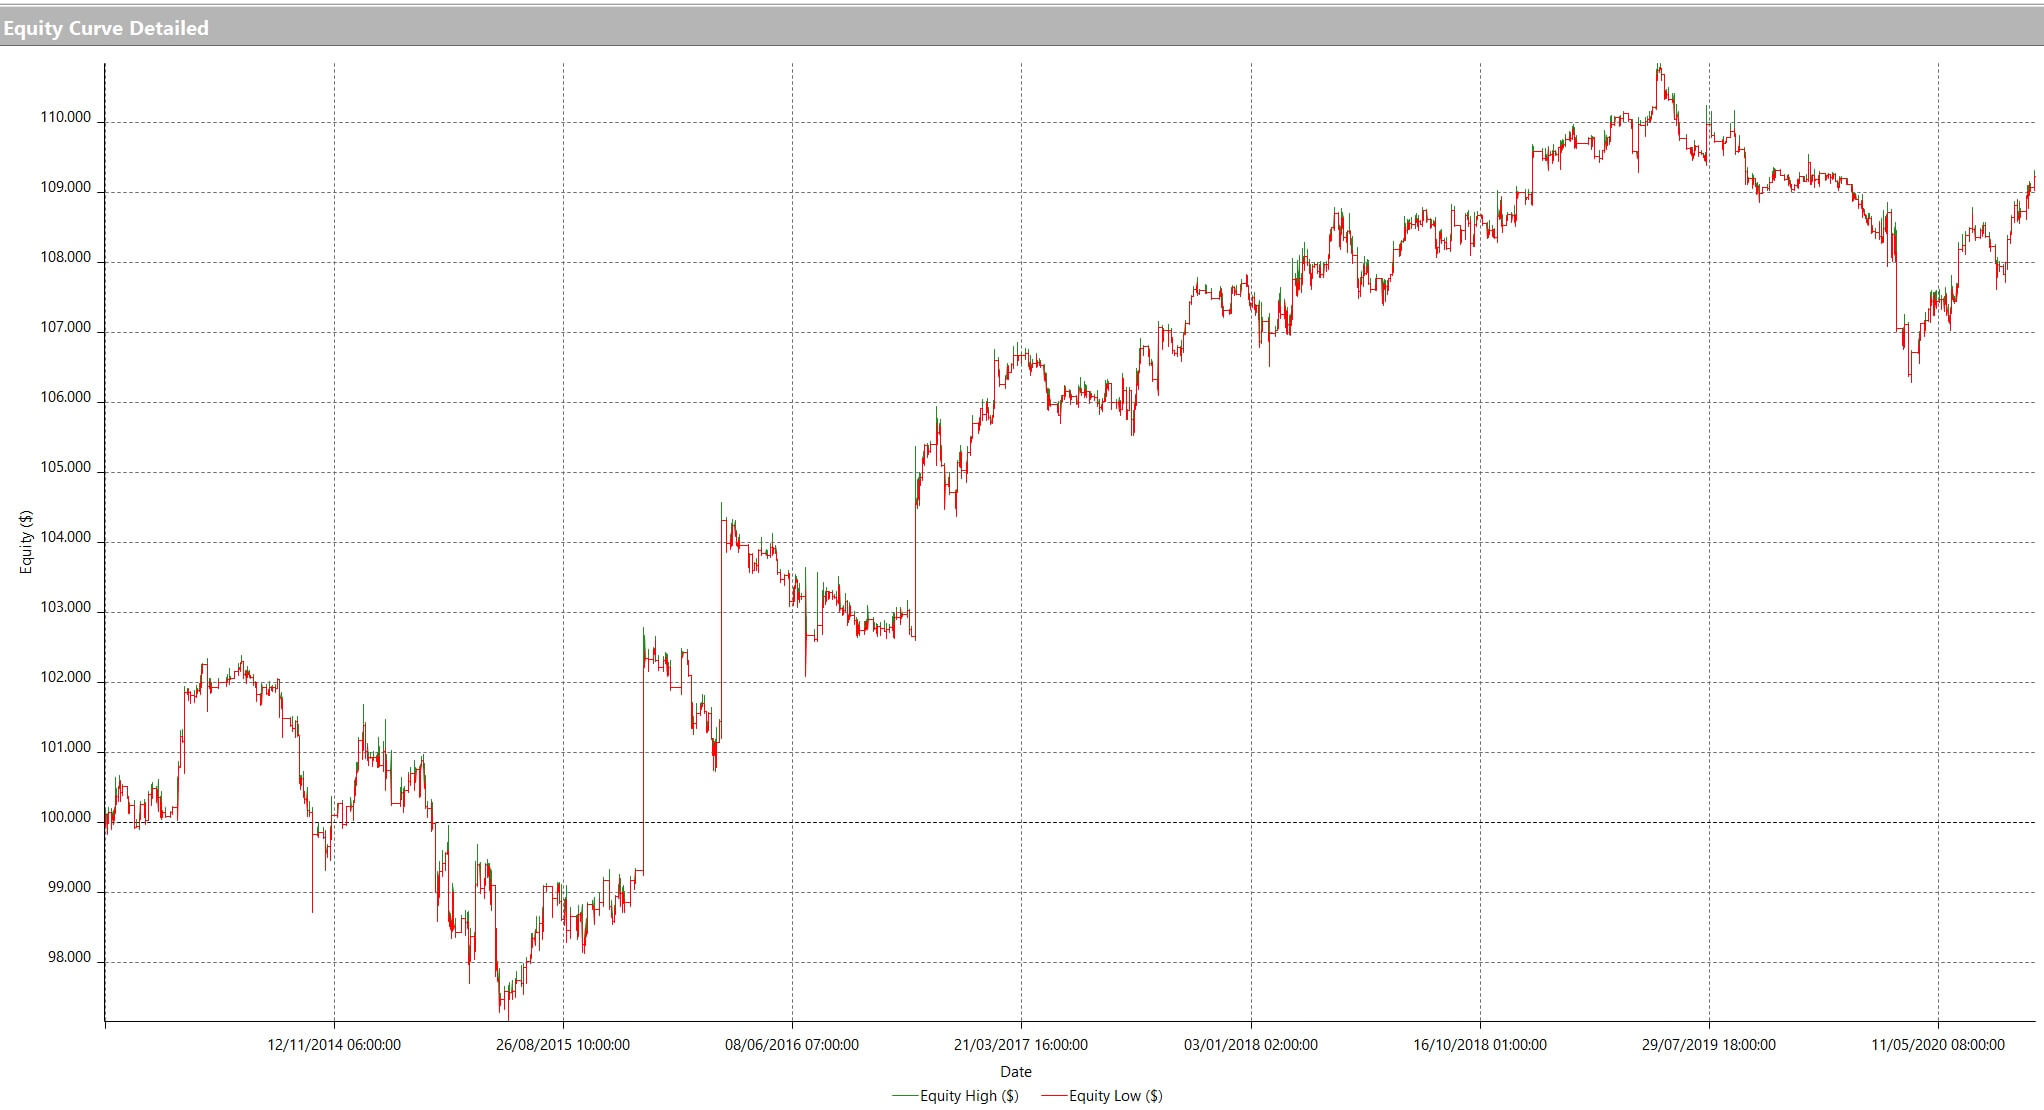
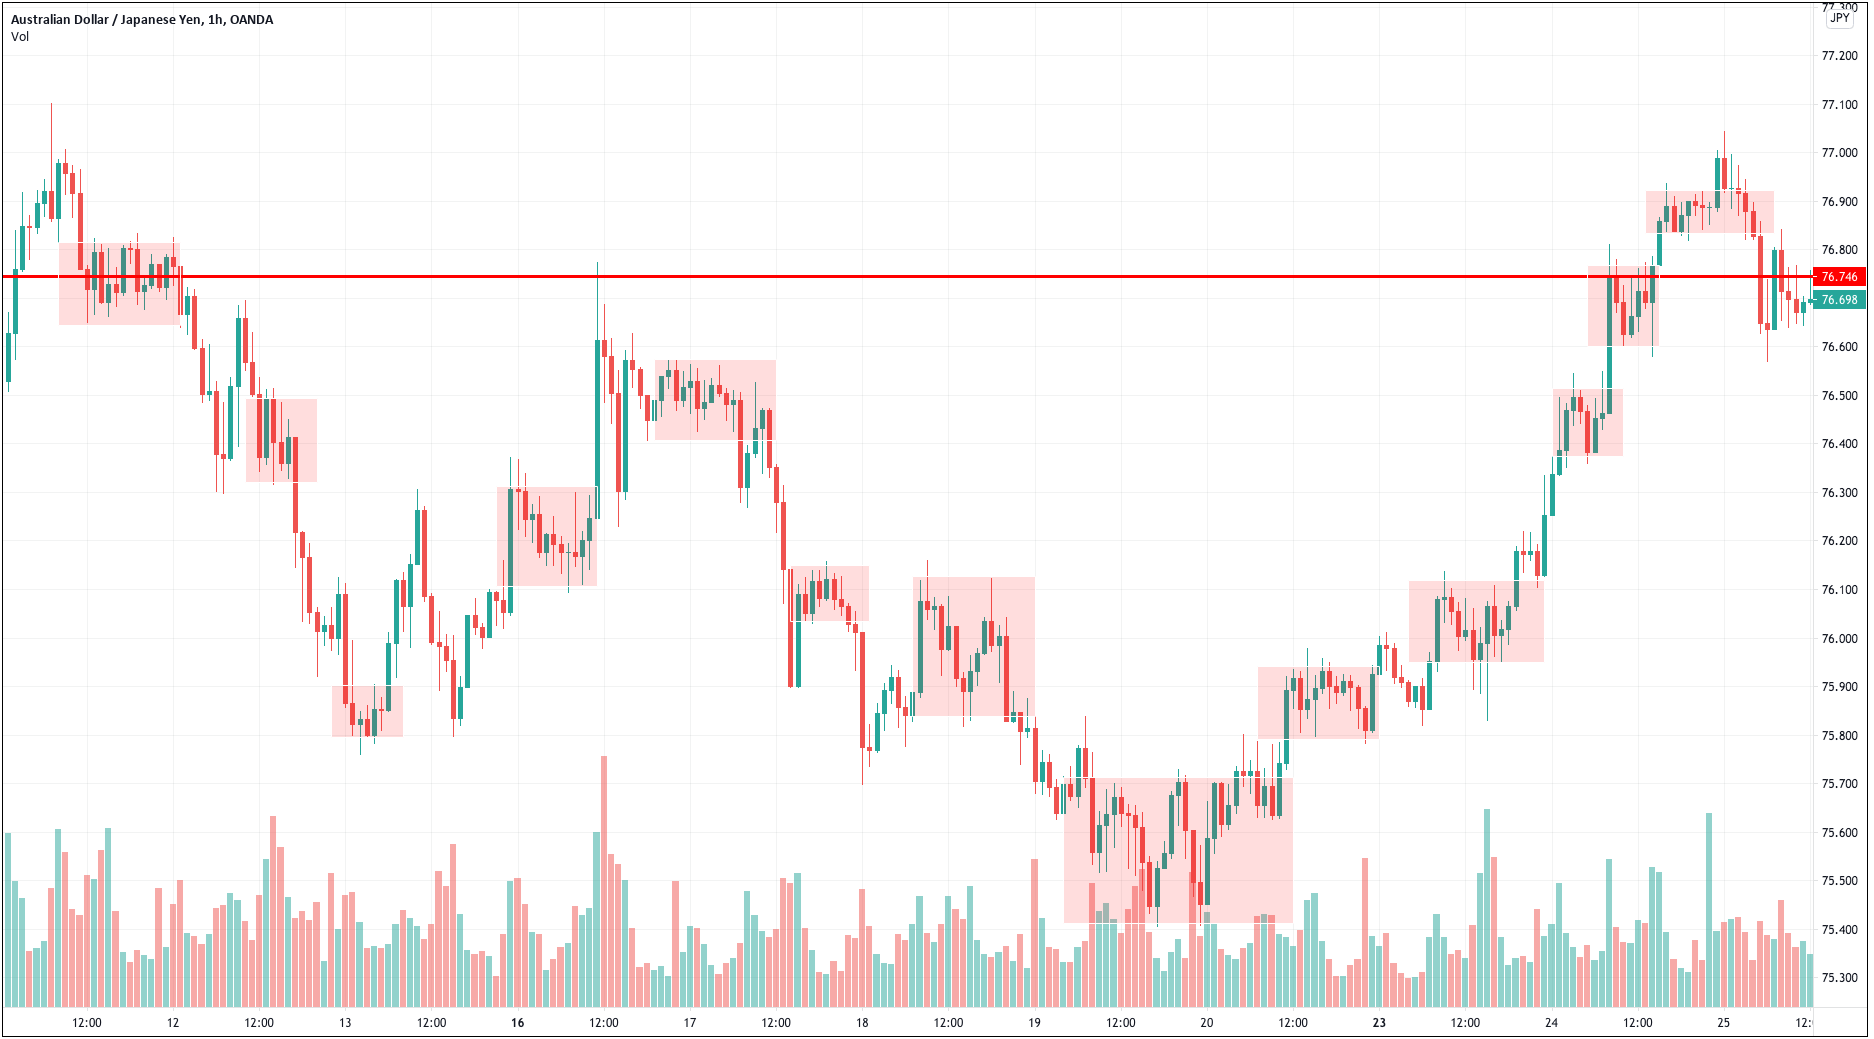
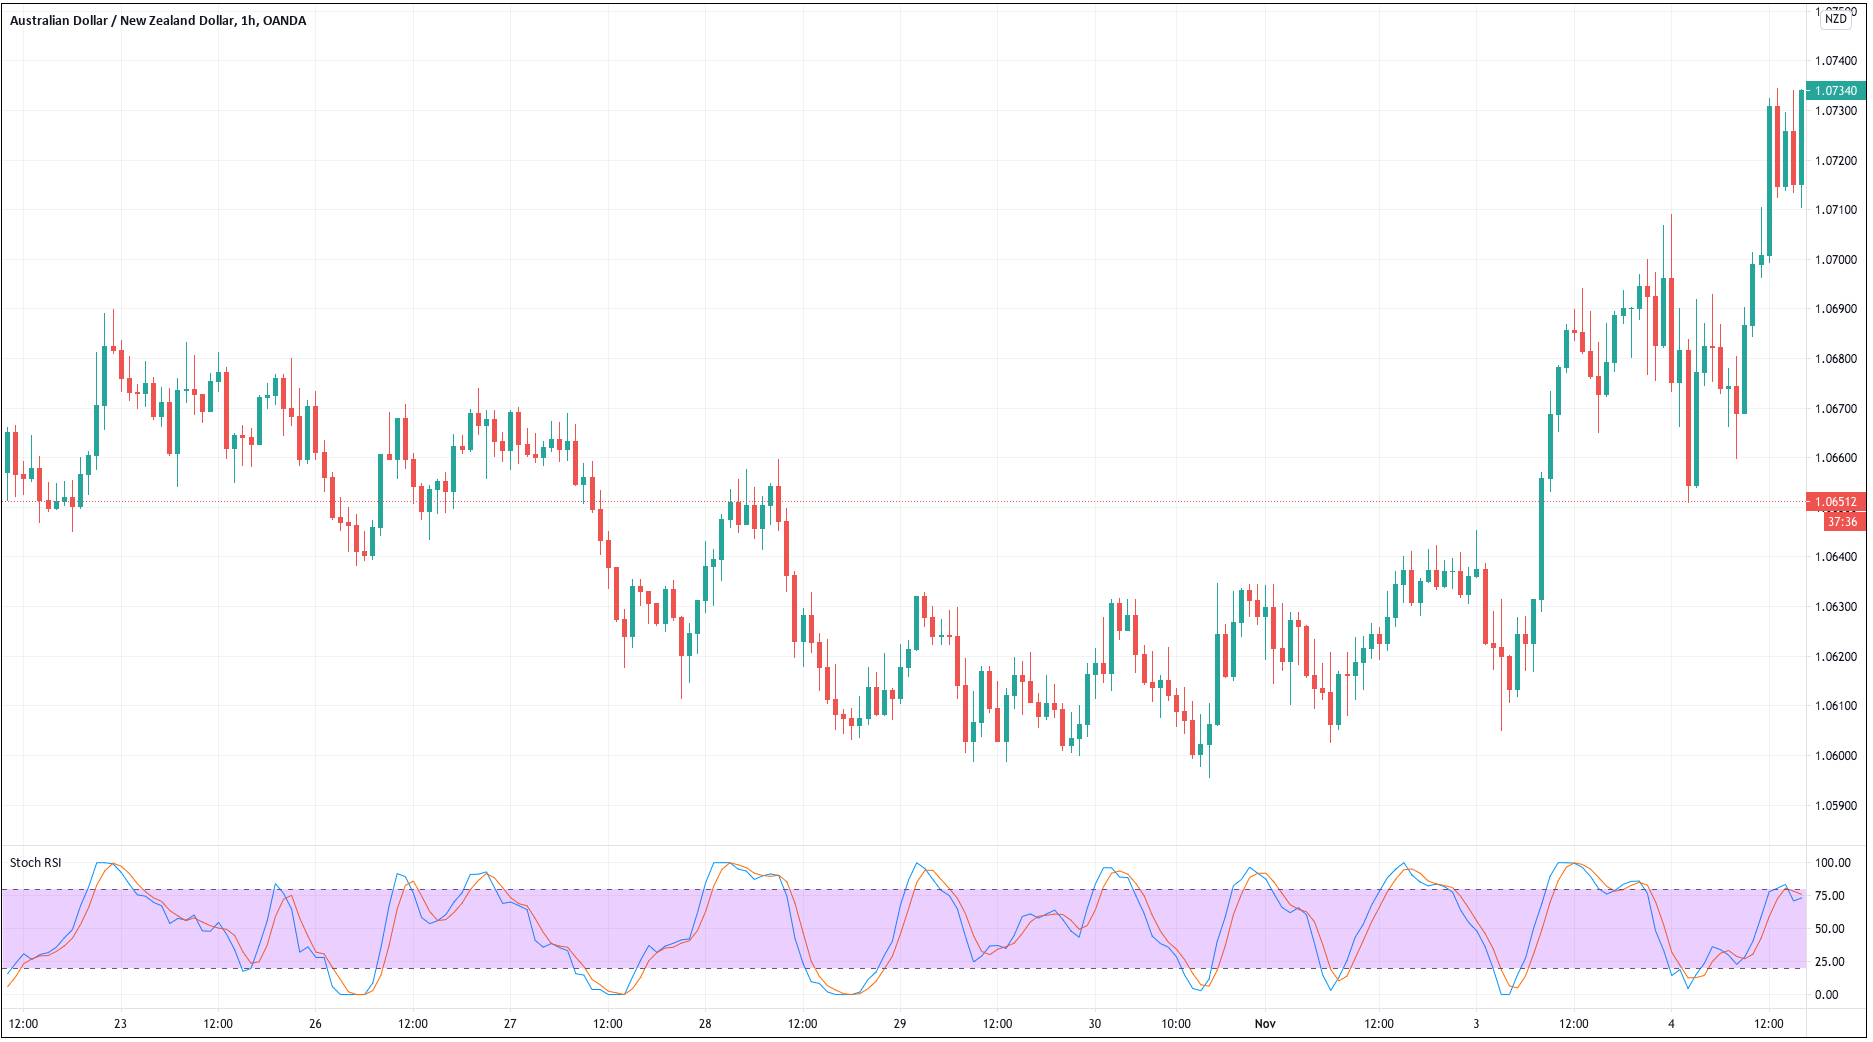
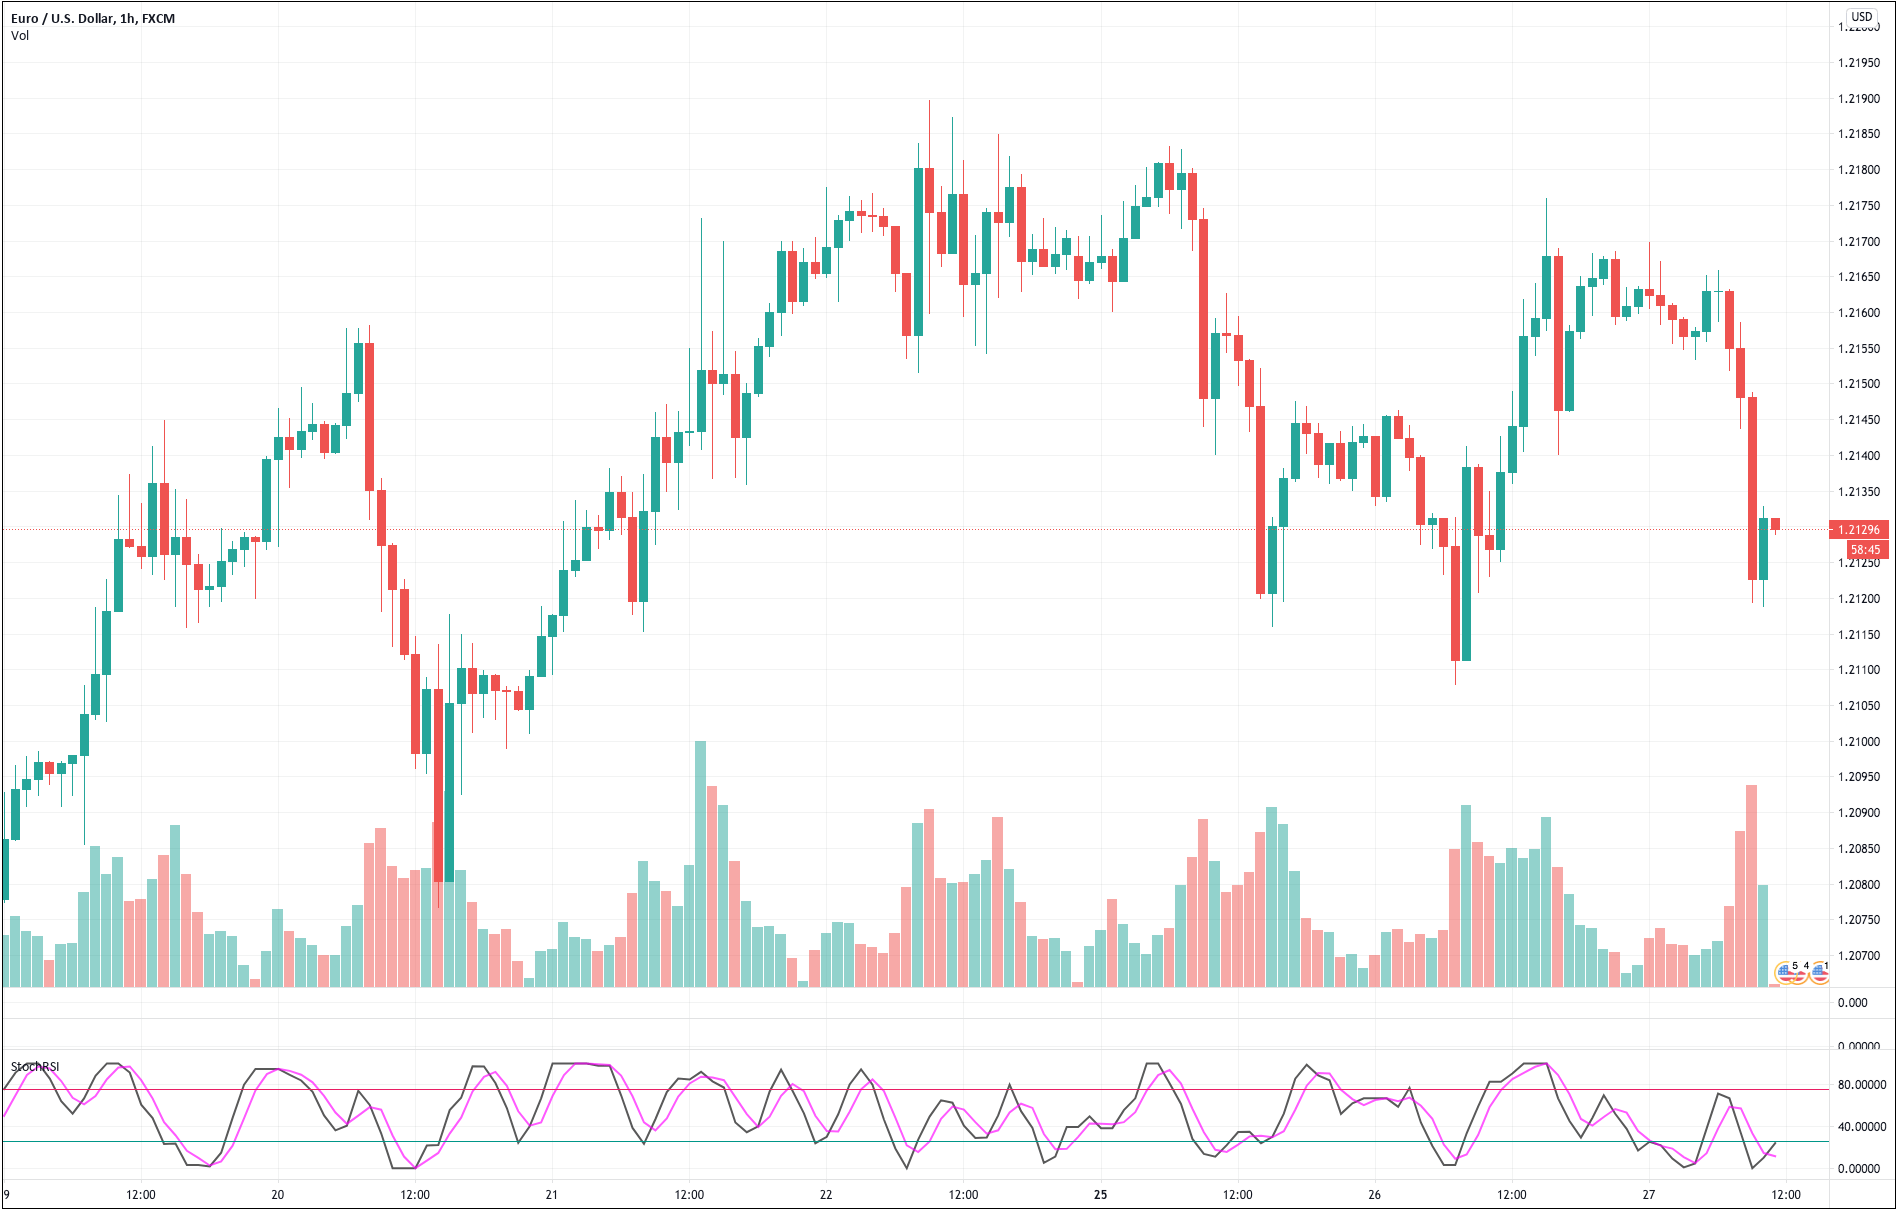 For our example, we will use a simple yet quite exciting indicator called Stochastic RSI, which applies the Stochastic study to the RSI values. This operation smoothes the RSI, and it reveals much better the turning points on mean-reverting markets, such as in Forex. Let’s see how it behaves as a naked strategy.
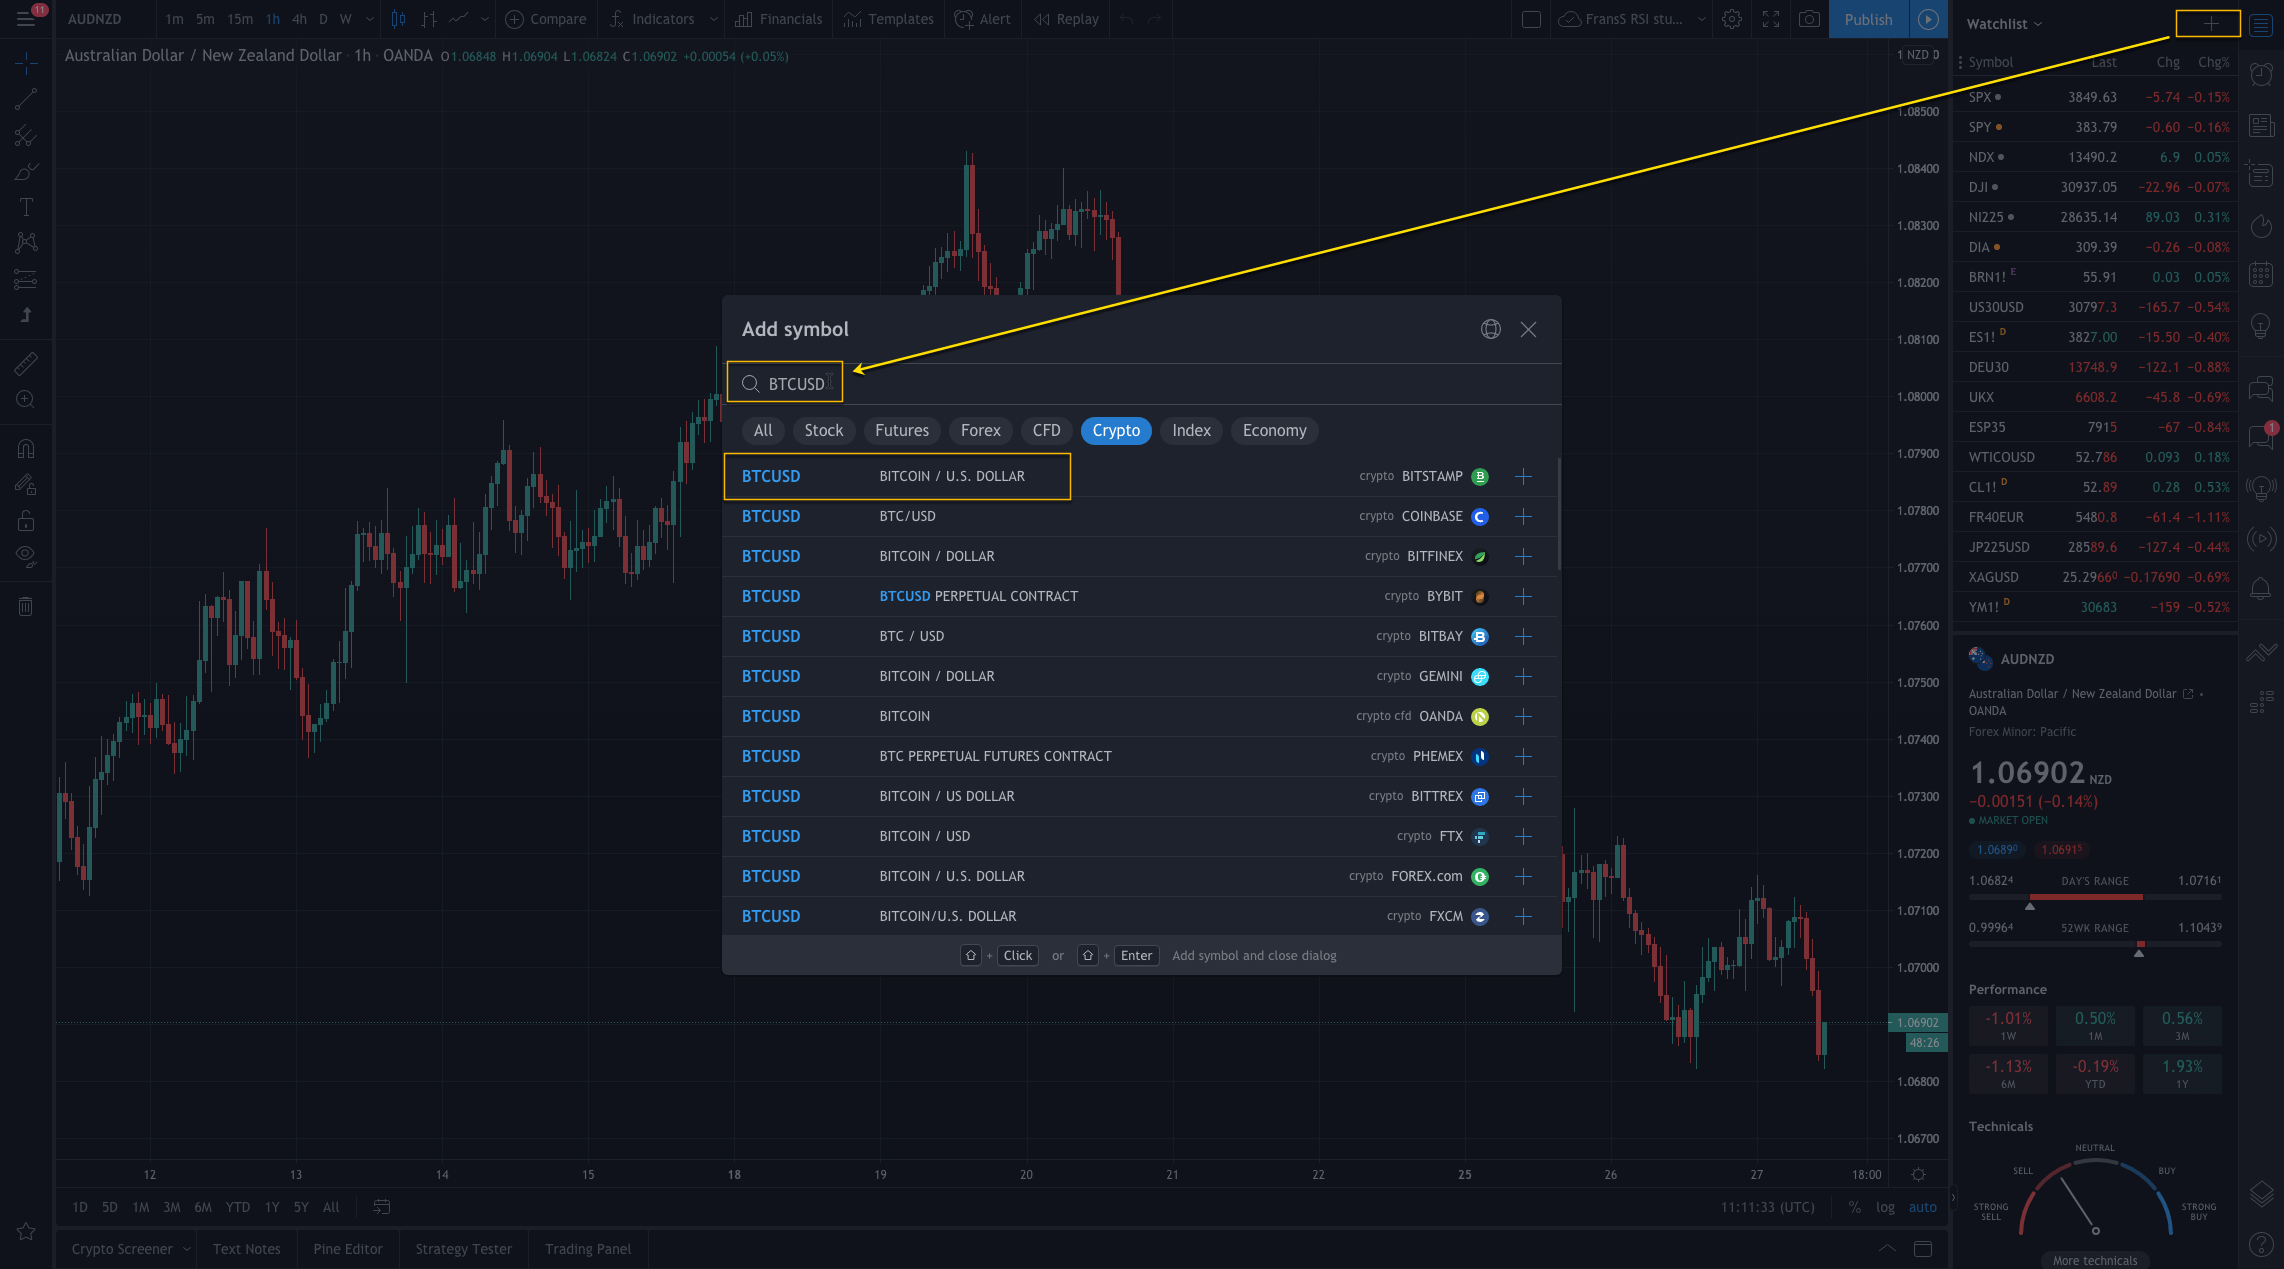
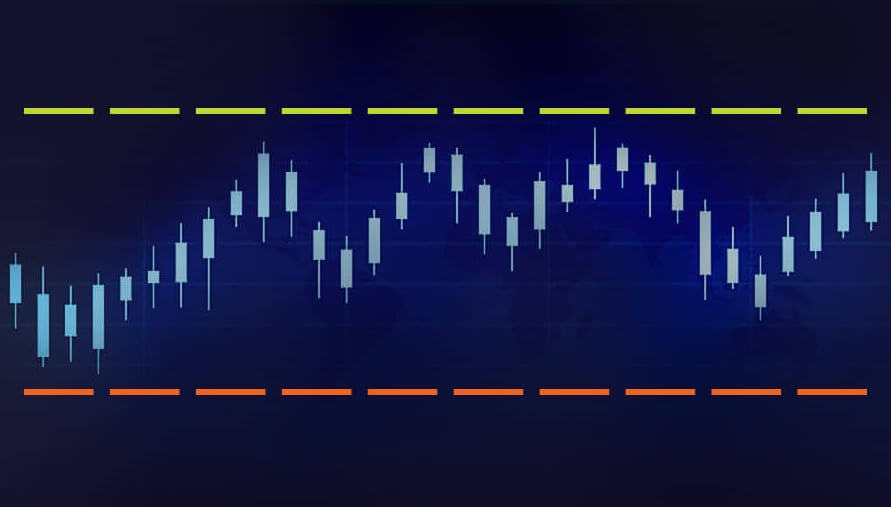
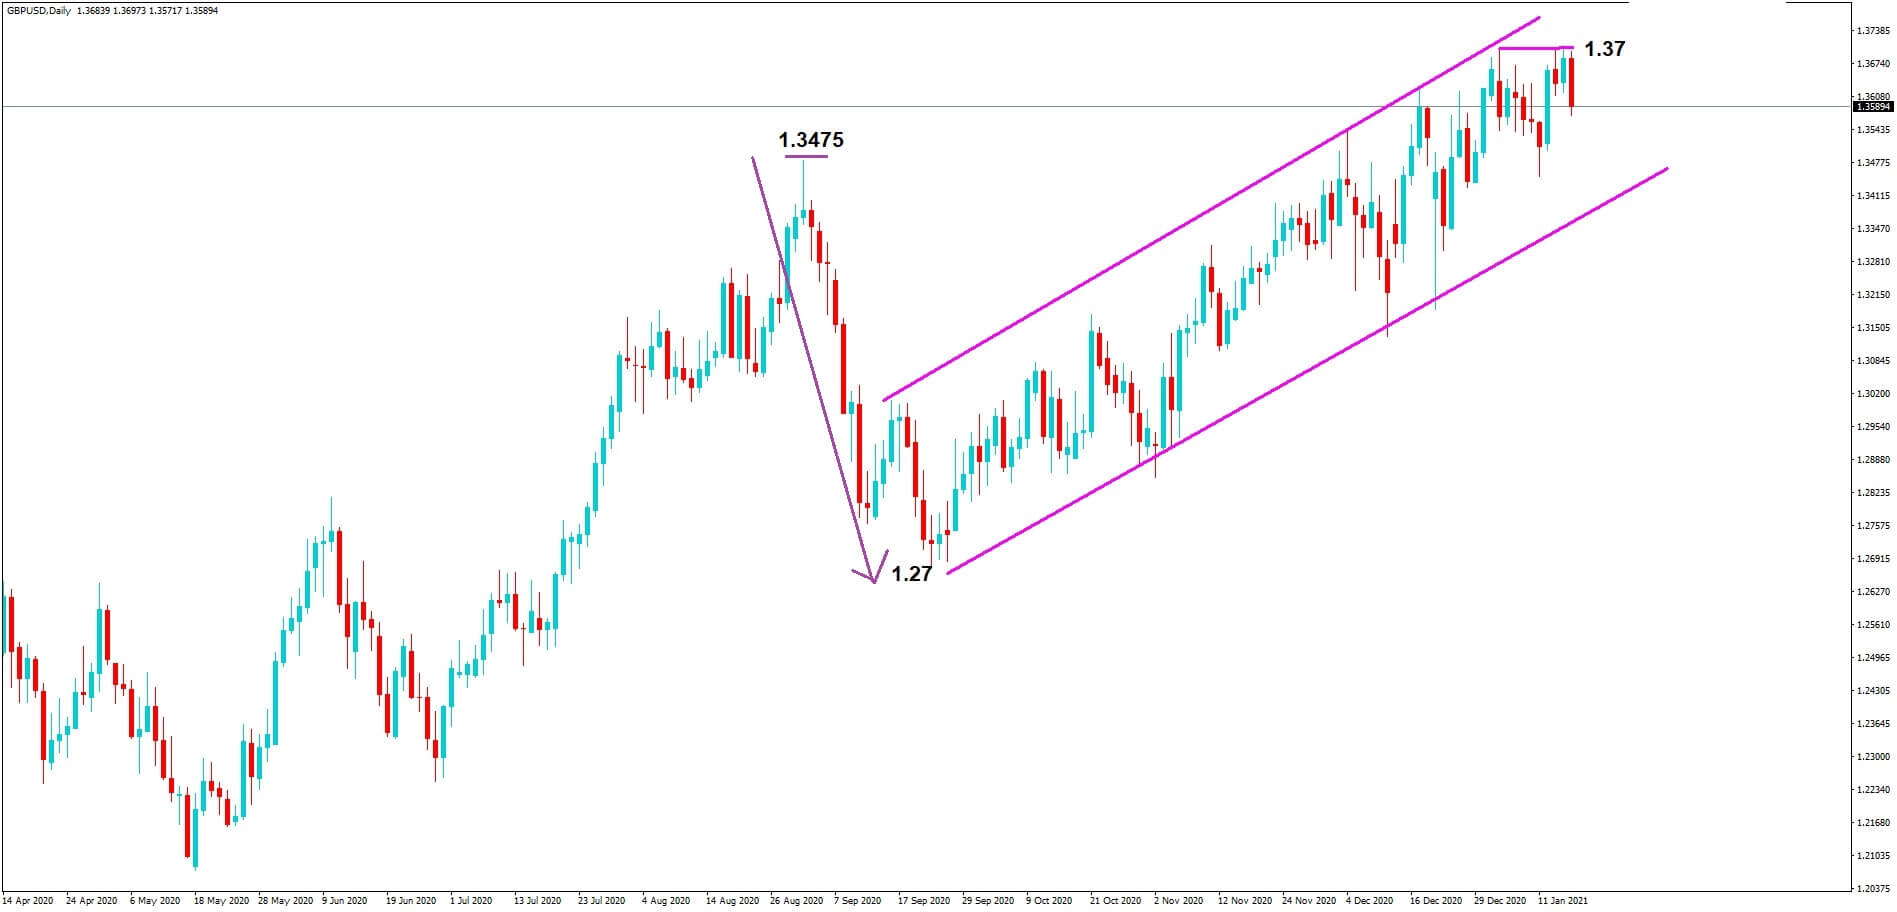
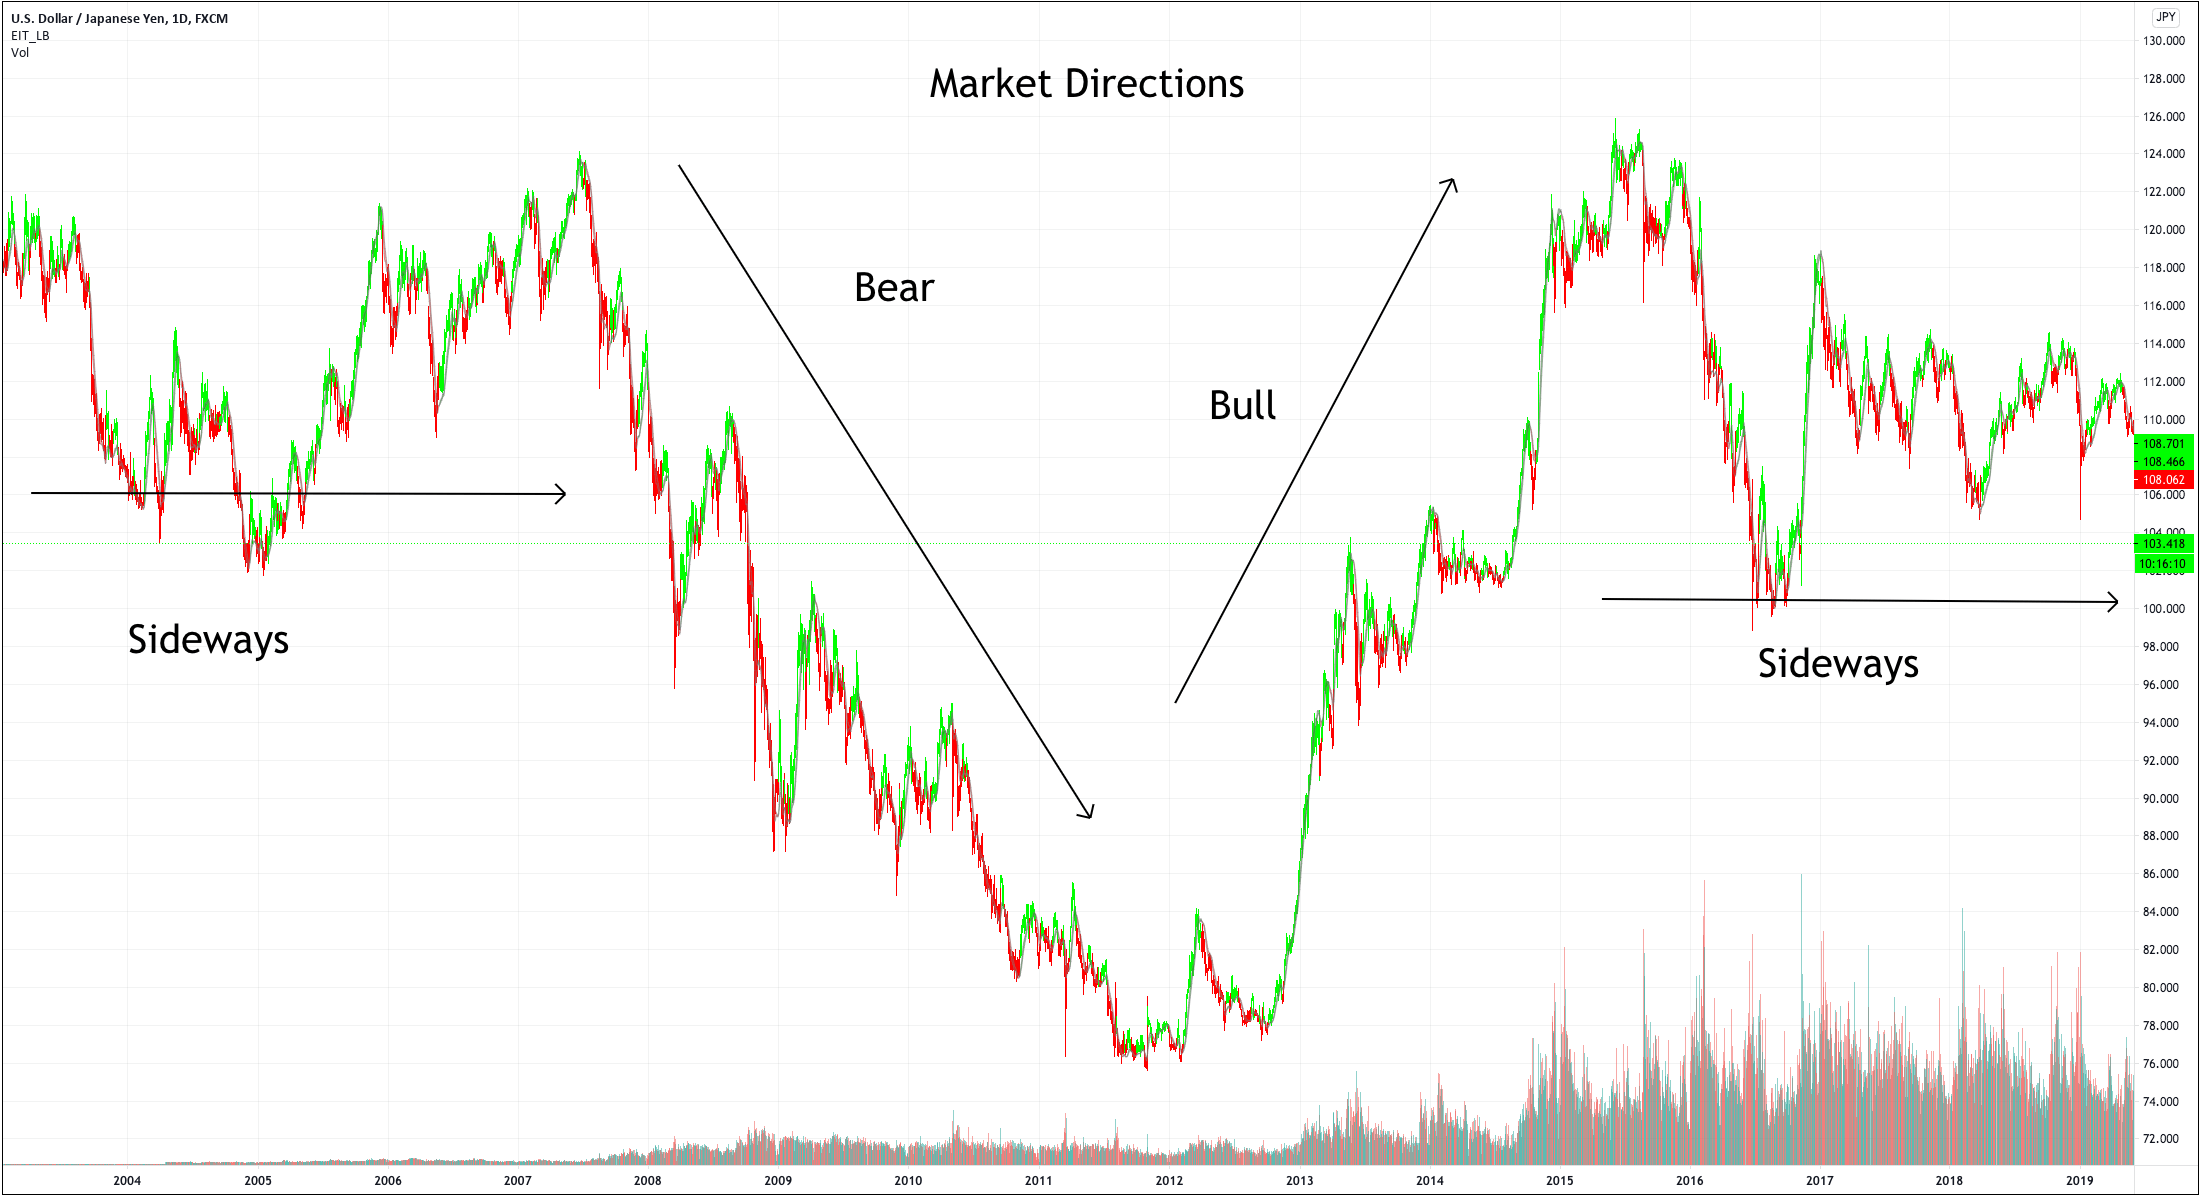
 From time to time, we will not be able to see any definitive upward or downward movement and the prices may not get to make your take profit targets, making traders insecure about the overall market direction.
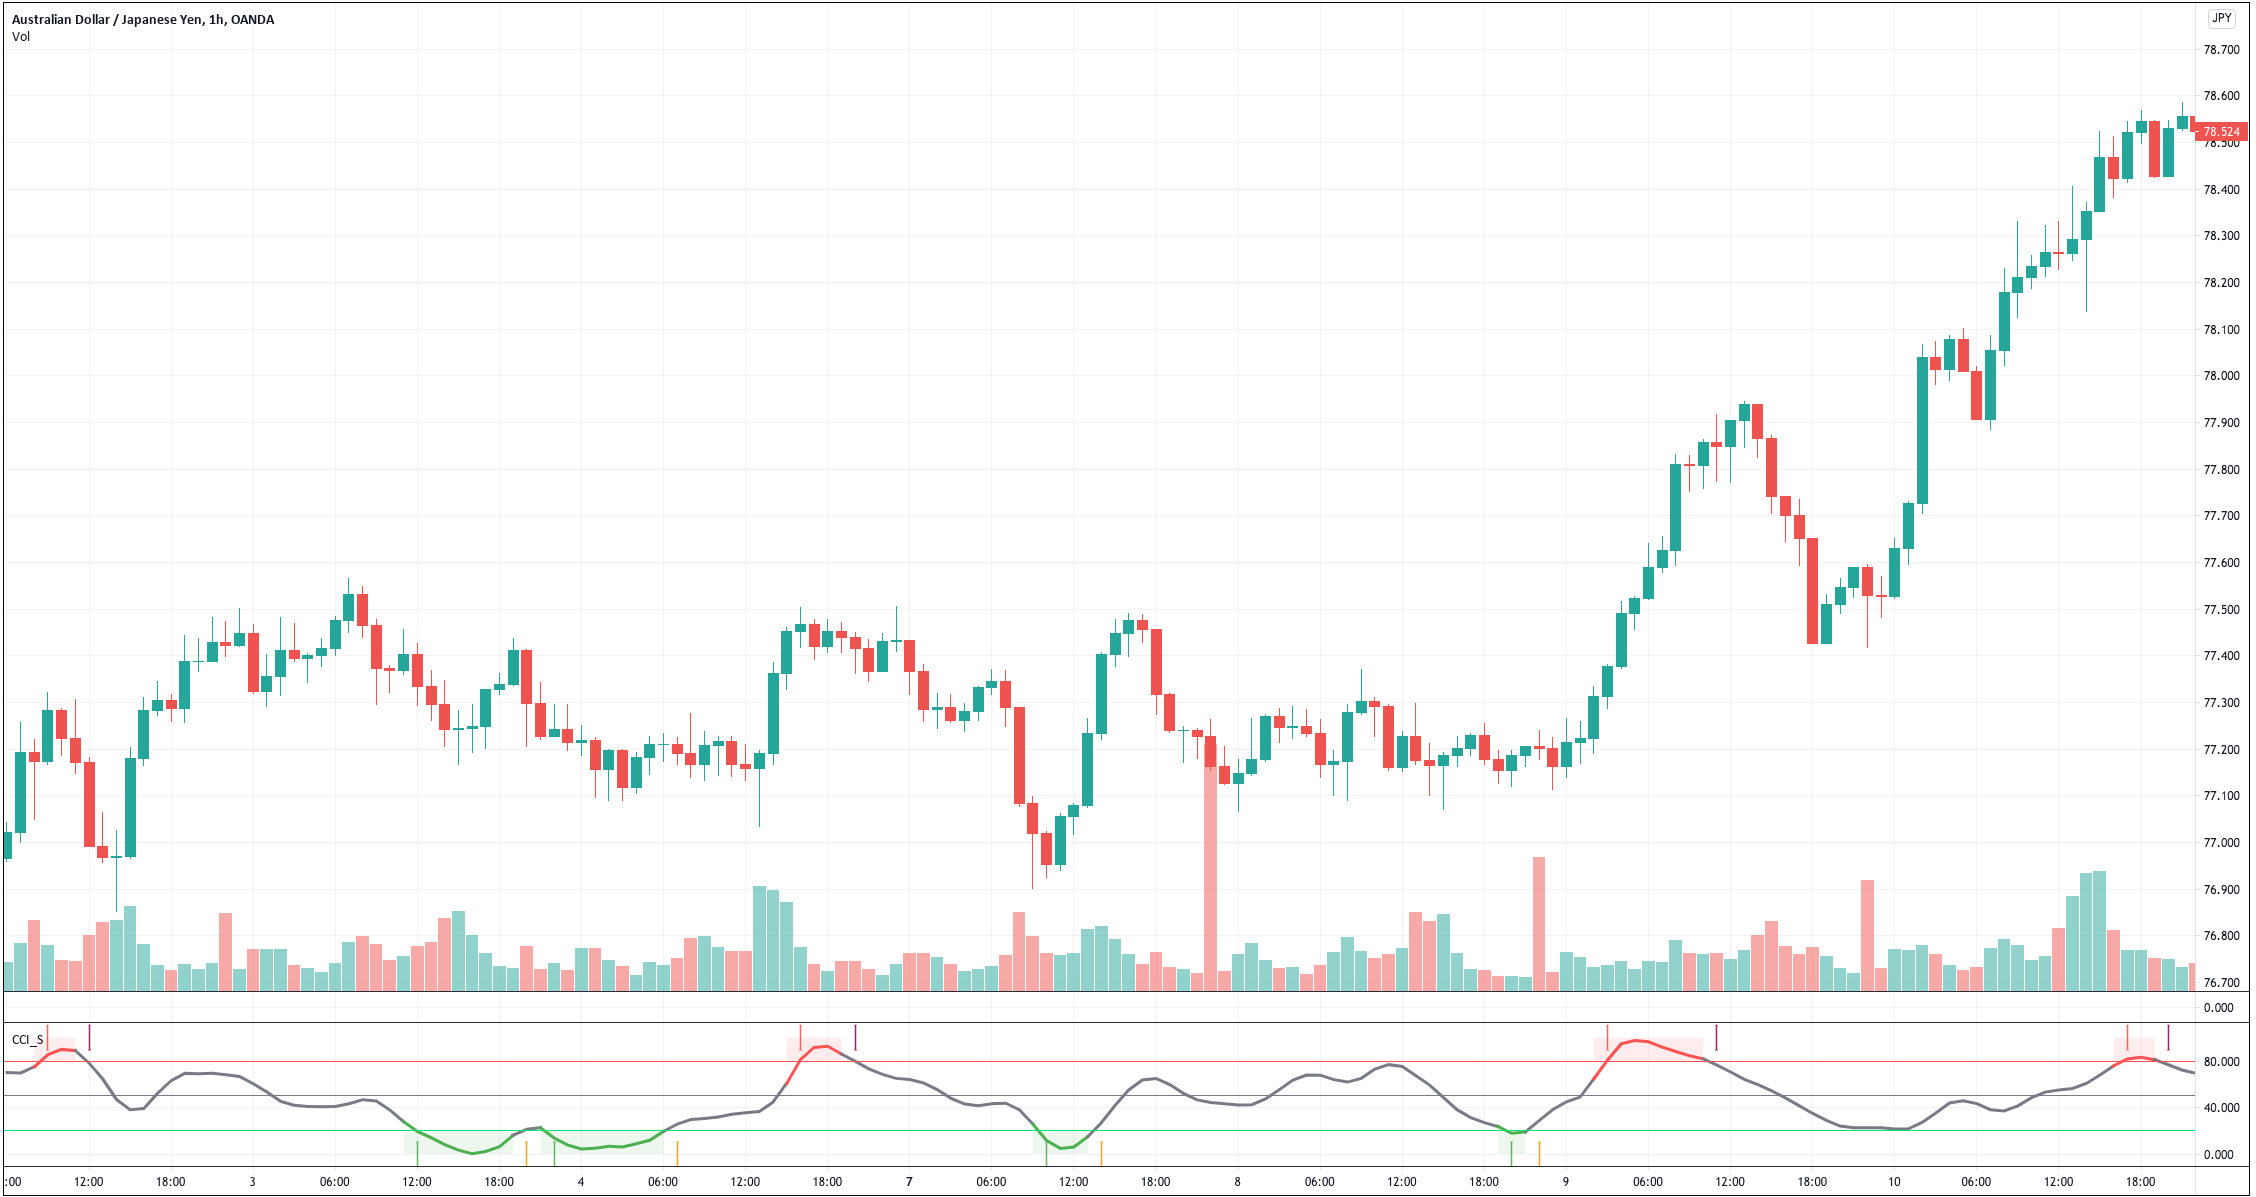
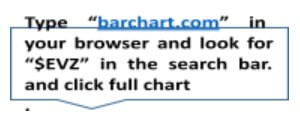 Even though we can determine market volume with the help of ATR, ADX, and Bollinger Bands, among other tools, the $EVZ volatility index has proved to be extremely useful and easy to use. When you open the full chart, you will be able to see a number under the heading “Euro FX VIX.”
  There are a few ways to deal with unfavorable markets.
  Still, low volume/volatility is a normal part of market oscillations, as these constantly fluctuate. Even if you are getting a lot of losing trades, do not get discouraged. Your time will come.
 You should not trade at this time because the price direction guesswork is extremely hard to get right and you can easily lose a lot of money. If you aren’t getting any signals, there is no reason for you to push it. Just stay put.
 We cannot scale out when the market is unresponsive. Therefore, we should in such cases take the entire trade-off at the first
  We usually cannot have a standard 2% risk on trades encumbered by sideways market movement. Reduce your risk to 1%, for example, if you see that the $EVZ index is reaching incredible lows, like in 2019.
  If you are not prepared mentally or emotionally, your account will suffer no matter the conditions. If you start panicking the first moment you spot any sideways market movement, the likelihood of you making a good decision will start to decrease exponentially.
 Looking for an ideal trading scenario to start trading is as futile as is failing to recognize the potential of dead markets. When we are faced with the saturation of sideways market movements, we should perceive the market as our fertile land. It is those moments that give us perfect room for improving our systems. Reflect on your past trades and decisions, and see what you can do better. Focus your attention on your trading and test, test, test. If you find a strategy that is working well in these conditions, this is your plan B, switch to it.
 Unfavorable market conditions affect us all. Do not think that experts are making a ton of money under any circumstances. You may have even had plans to leave your current job and turn to trading only, but now is not the time. Make no rash decisions, keep all of your sources of income active, and just wait for everything to go back to normal. Even when it does, you may still need a few months or years for everything to work out as you planned.
 Well, no matter how well-developed your system is, most volume indicators cannot record the first big move as quickly as it occurs. So, now that you know that it isn’t your fault, do not give in to any doubts or regrets and just move on.


 Many traders are passionate about beating the competition when, in fact, their greatest opponent is their own lack of knowledge or understanding. In the forex market, we can say that everyone is fighting their own battle, so we cannot really discuss competition as we can do in the world of sports. Fighting against the big banks in the literal sense has been proven to be in vain, but understanding how to rise above their radar and focus of attention is most likely to bring you to where you want to go.


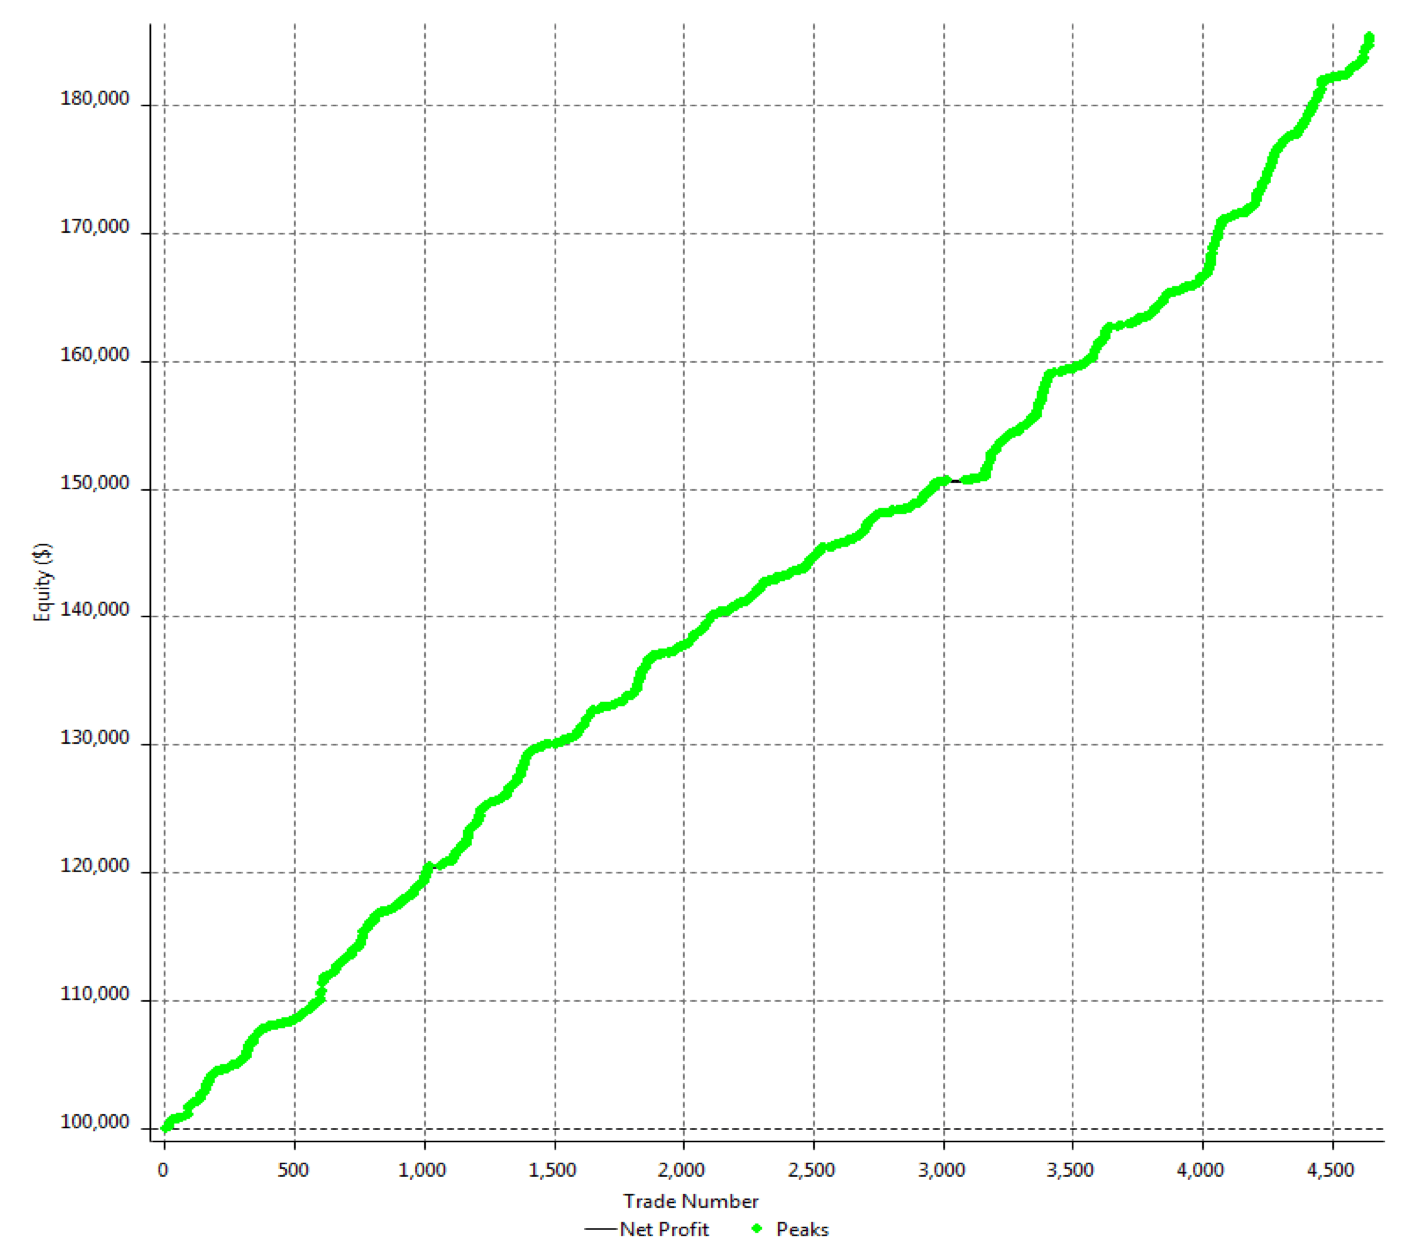

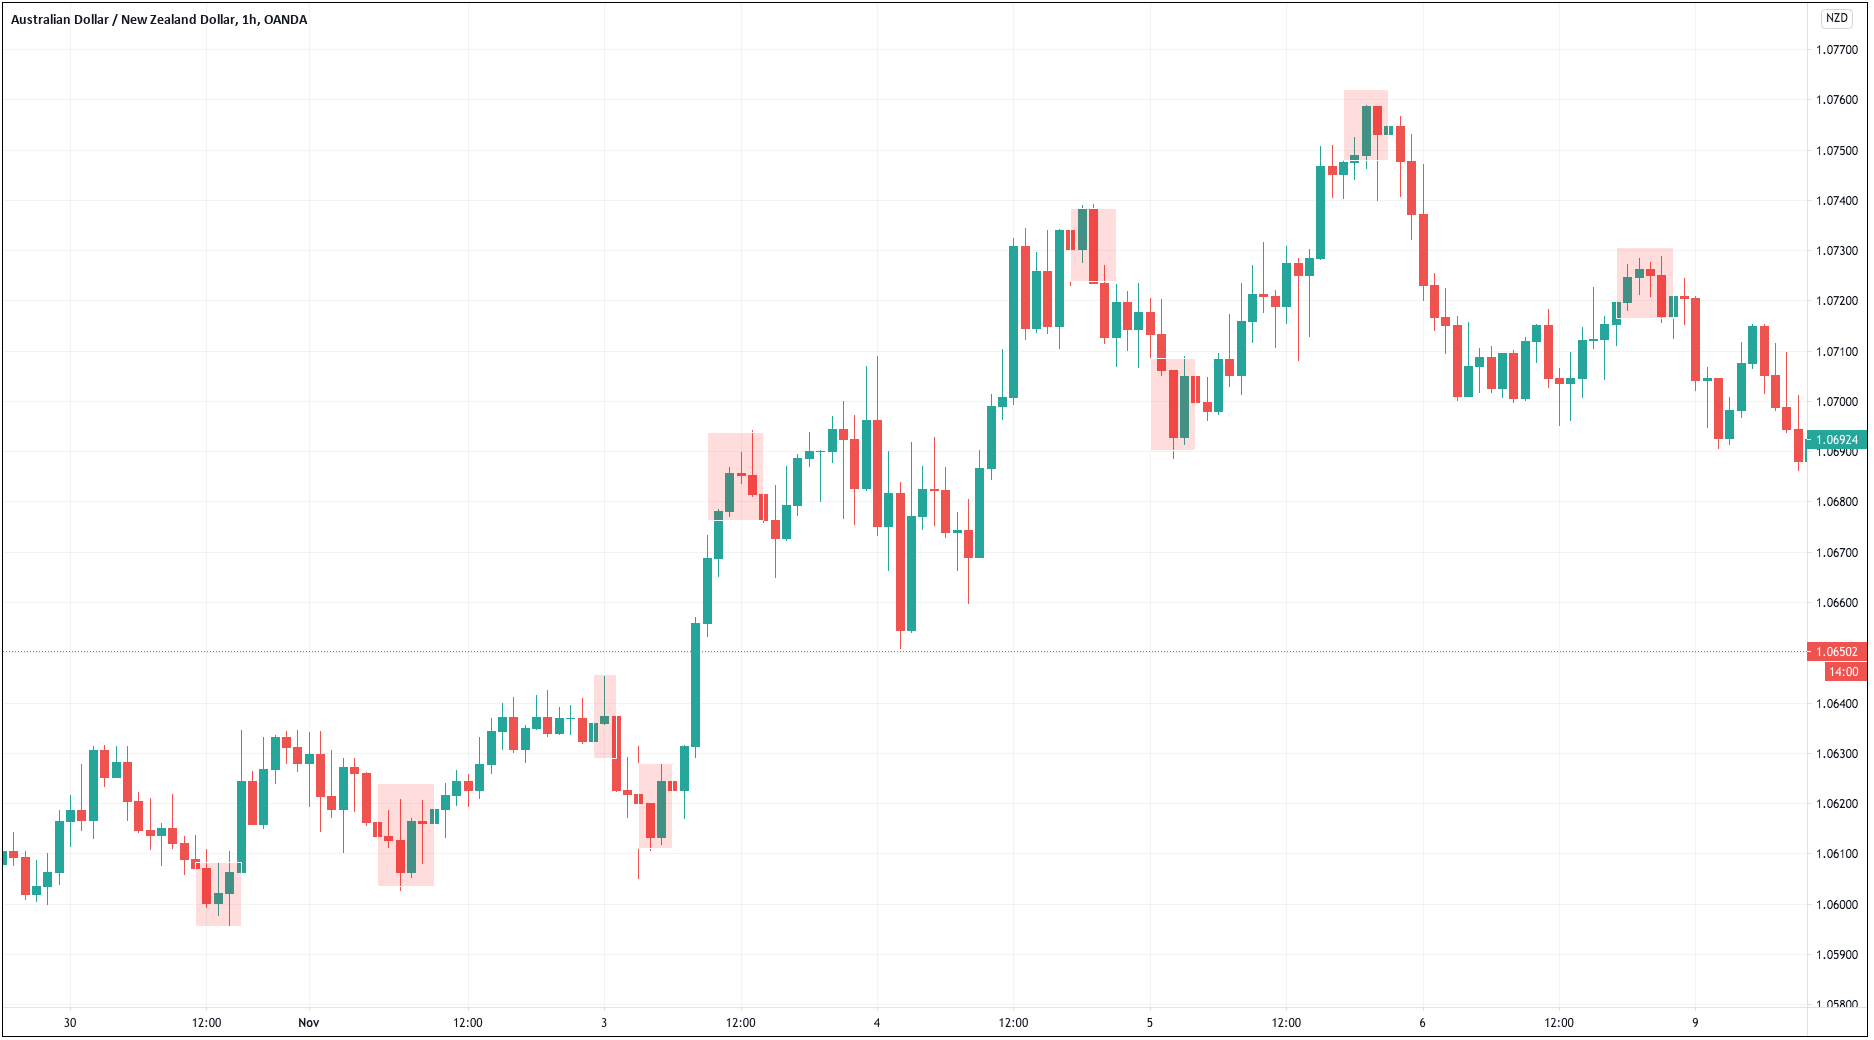
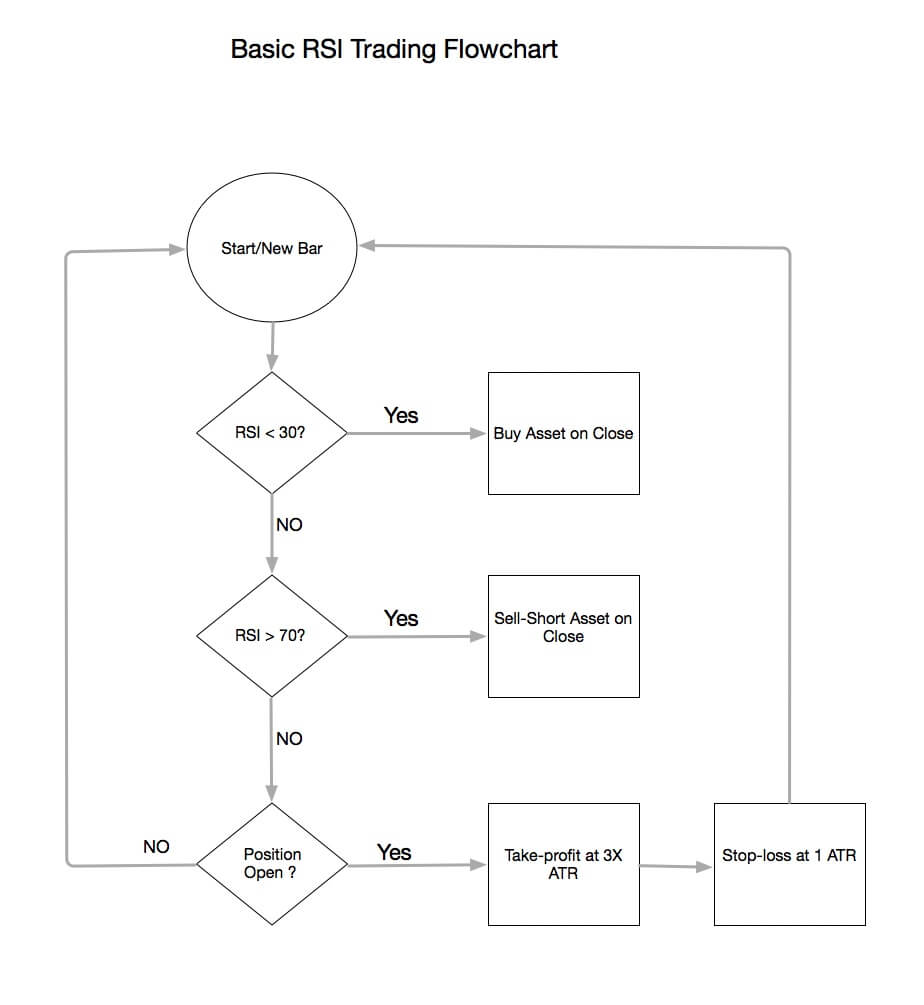
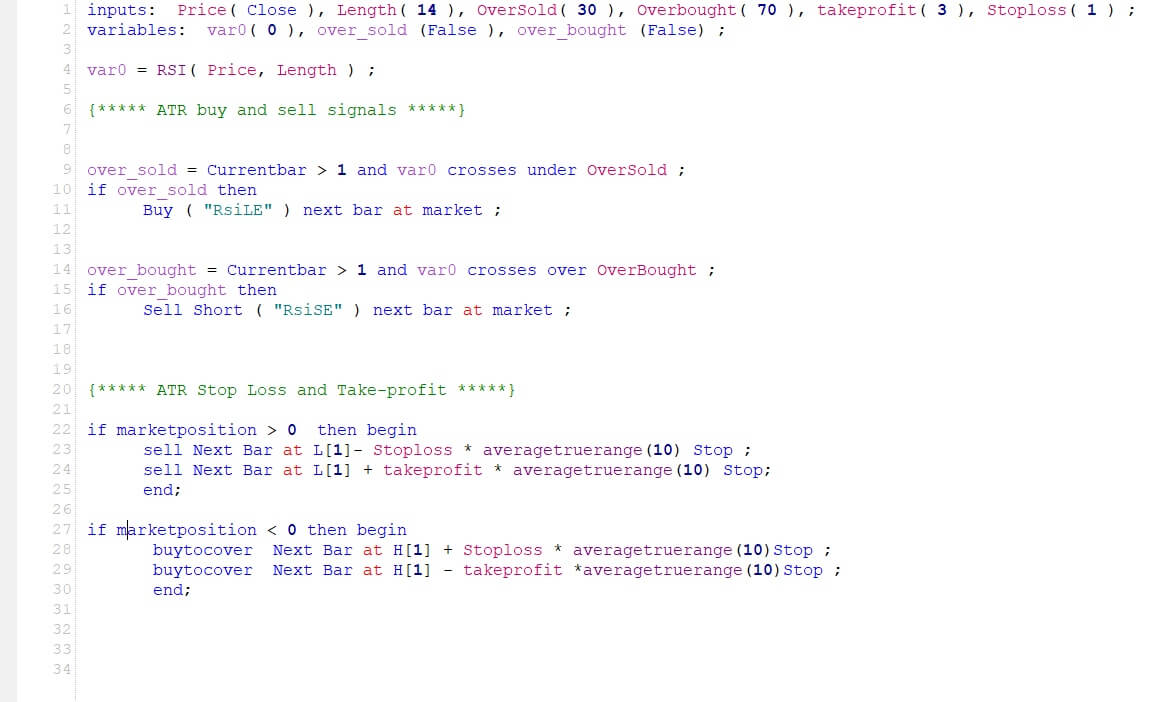
 The first step to see if the idea has merit is to test it in a historical sample under the market conditions it was supposed to operate. Of course, a trading idea is almost always referring to a market entry, as the concept is supposed to time the market. This entry is usually combined with a stop-loss and a
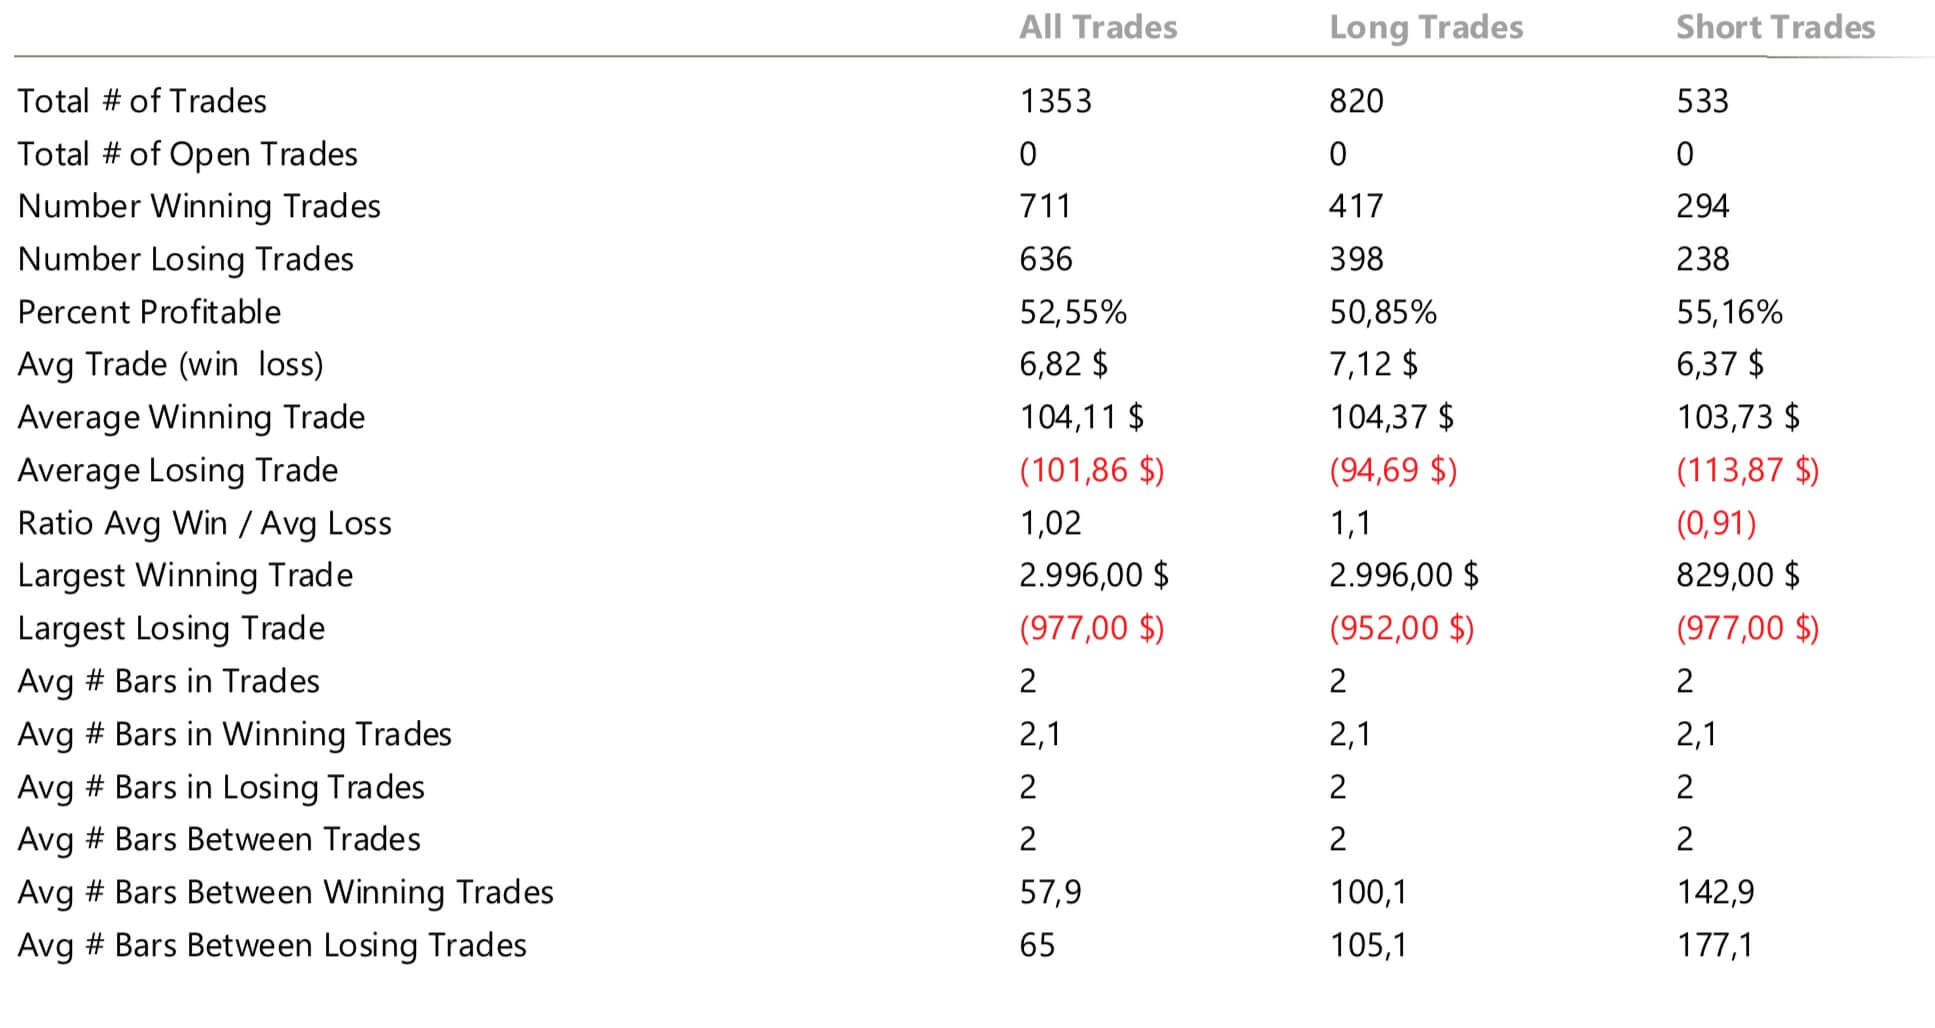
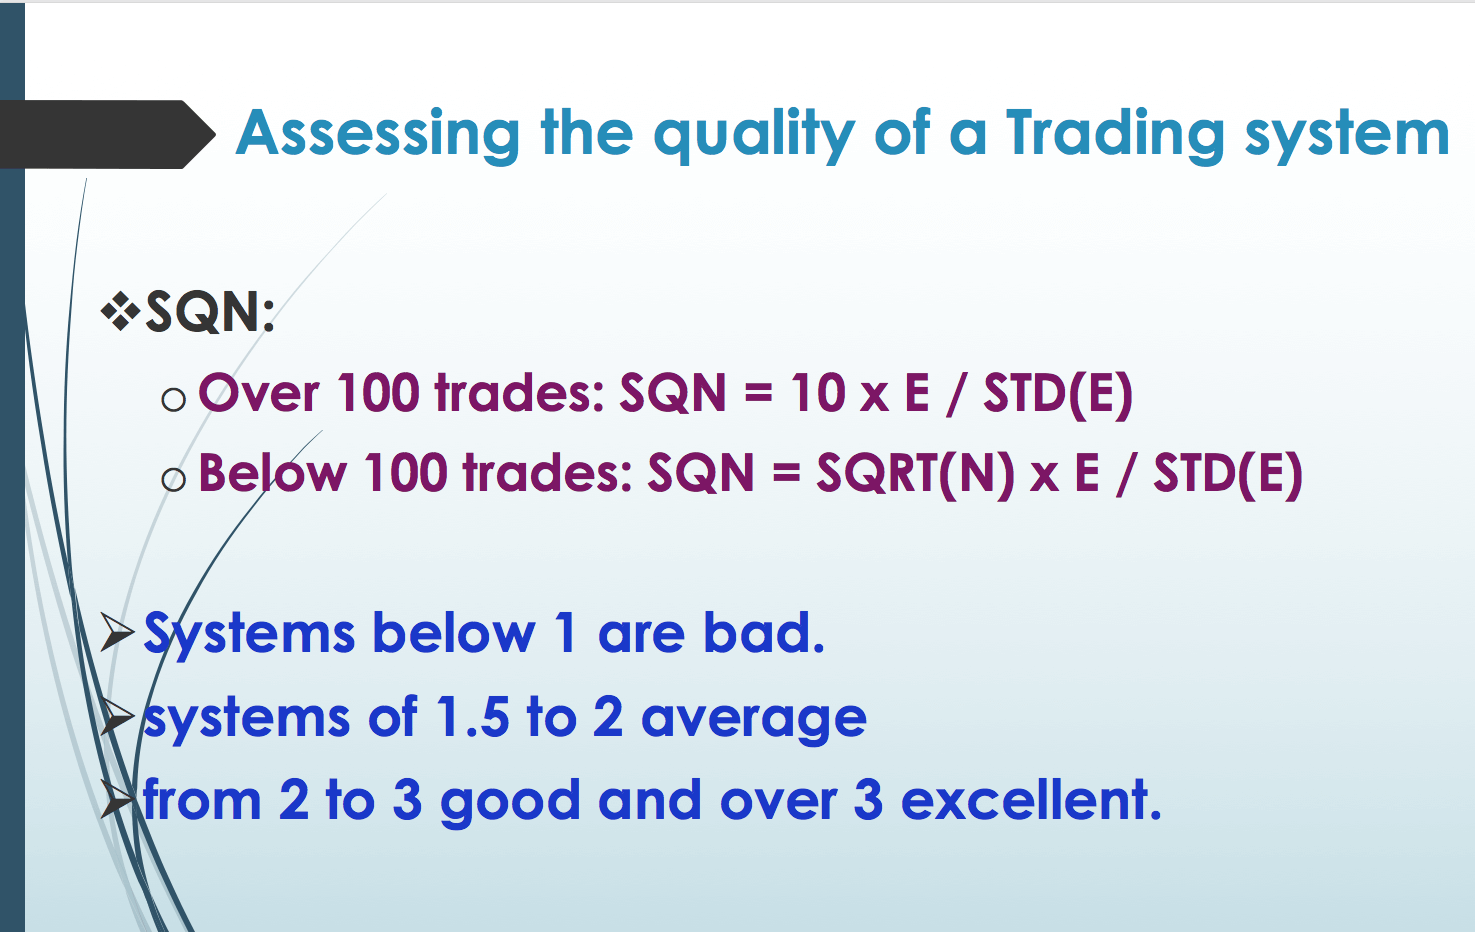
 After 100 backtested trades, the developer has enough information to detect the basic mistakes of the strategy. Maybe the entry has a large lag that hurts profits, or, worse, it is too early, thus triggering the stop-loss too often.


 Traders, especially novice traders, get emotional and lose money because their emotions interfere and stop making rational decisions in the battle’s heat. Thus, the first thing to avoid is
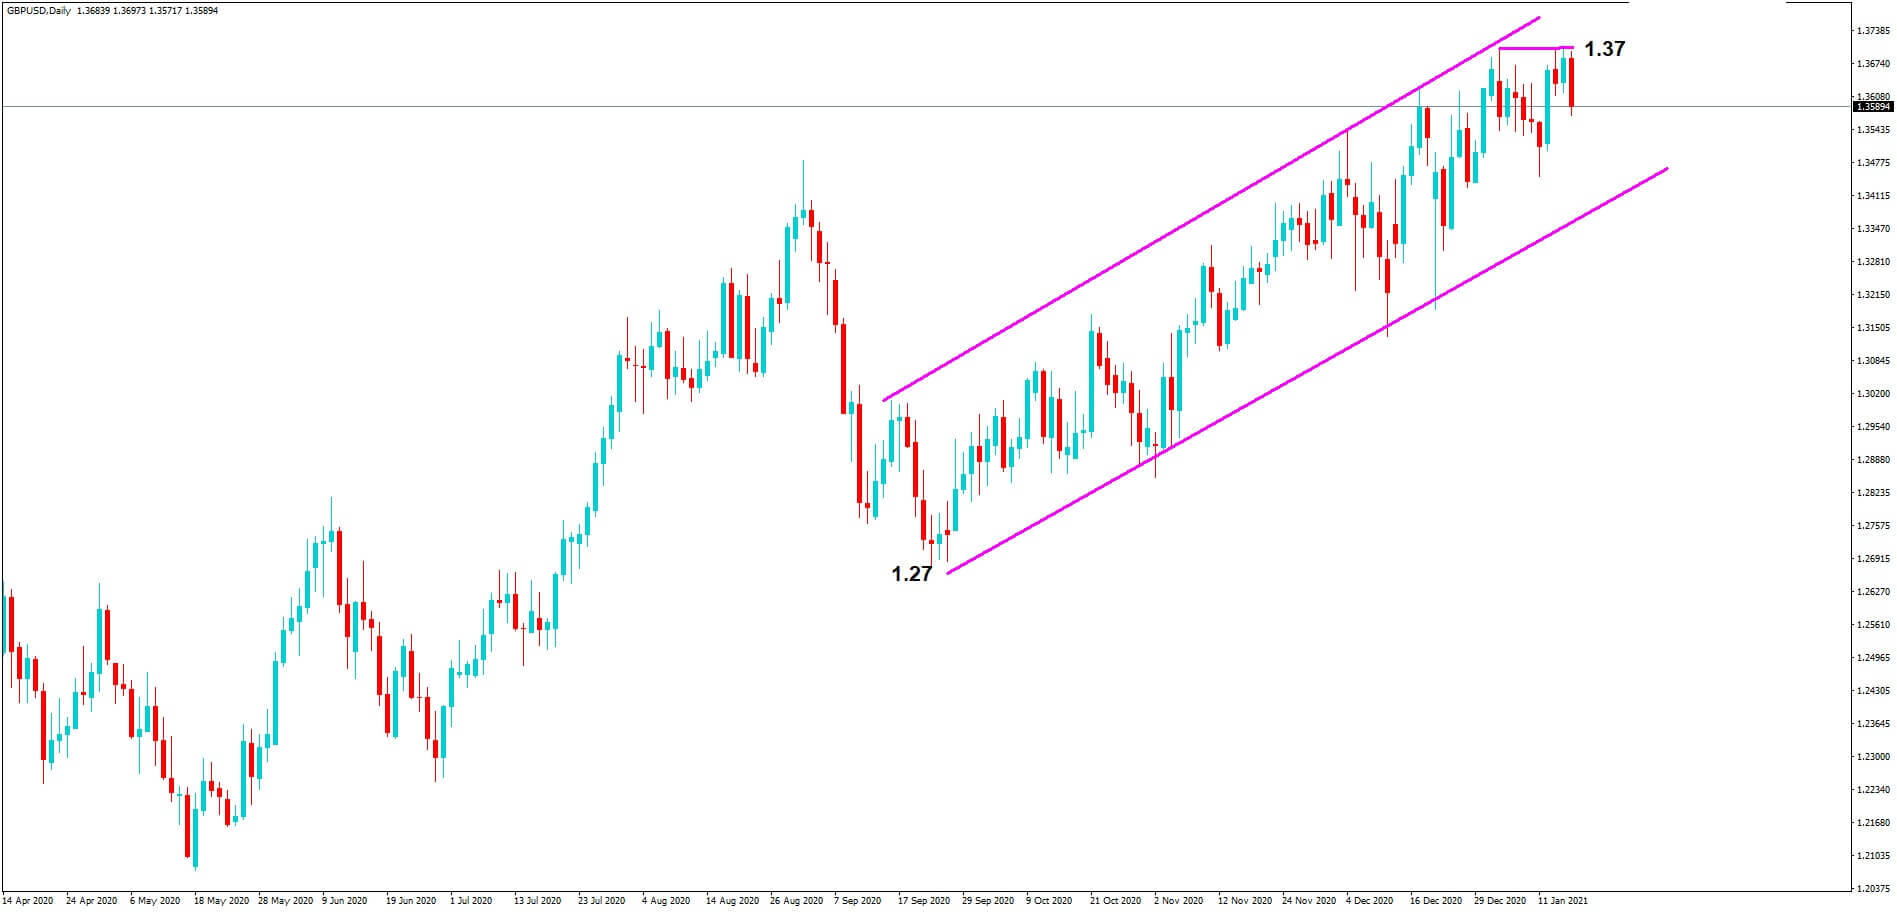
  The rubber band idea describes the price as if it was a rubber band or spring. When it moves far away from equilibrium, we expect the force to pull it to its center to increase and eventually drive it back to equilibrium.
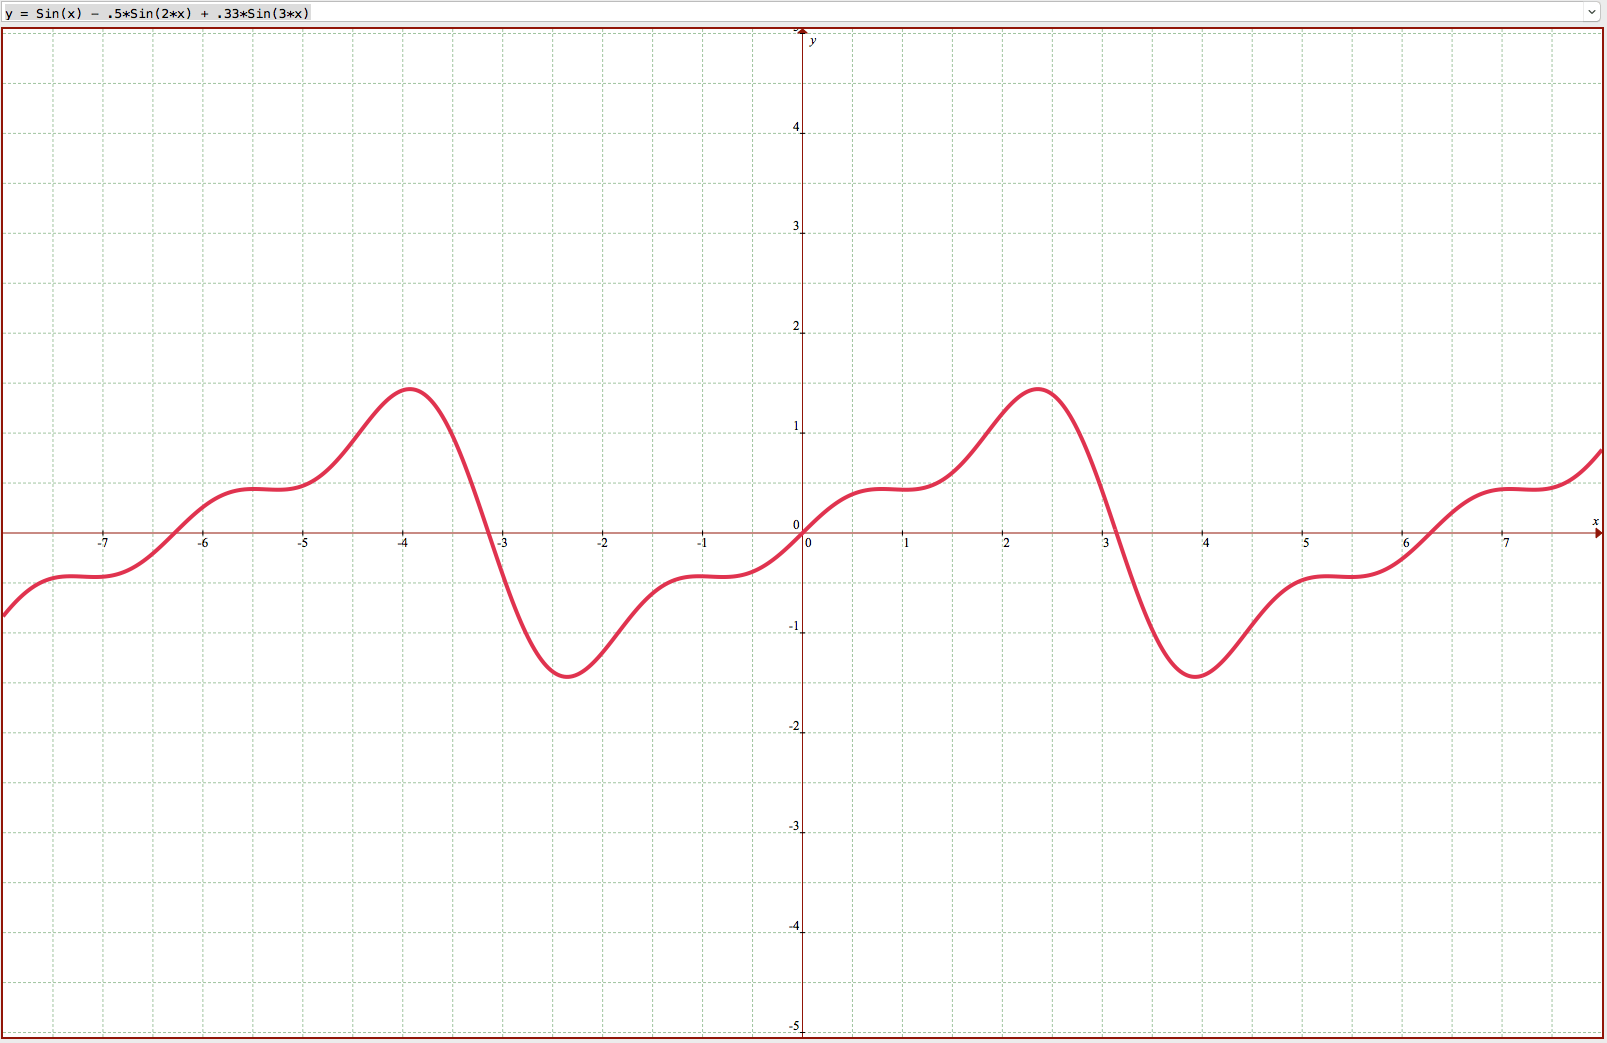 fferent waves are in sync, and chaotic moves occur when waves desync.


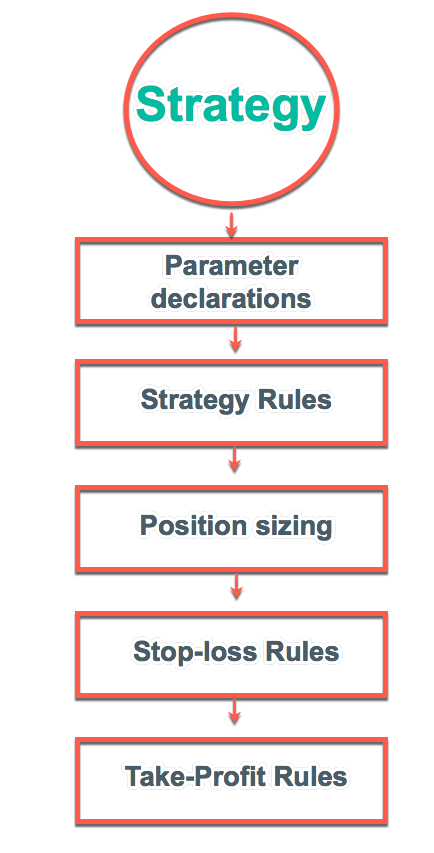
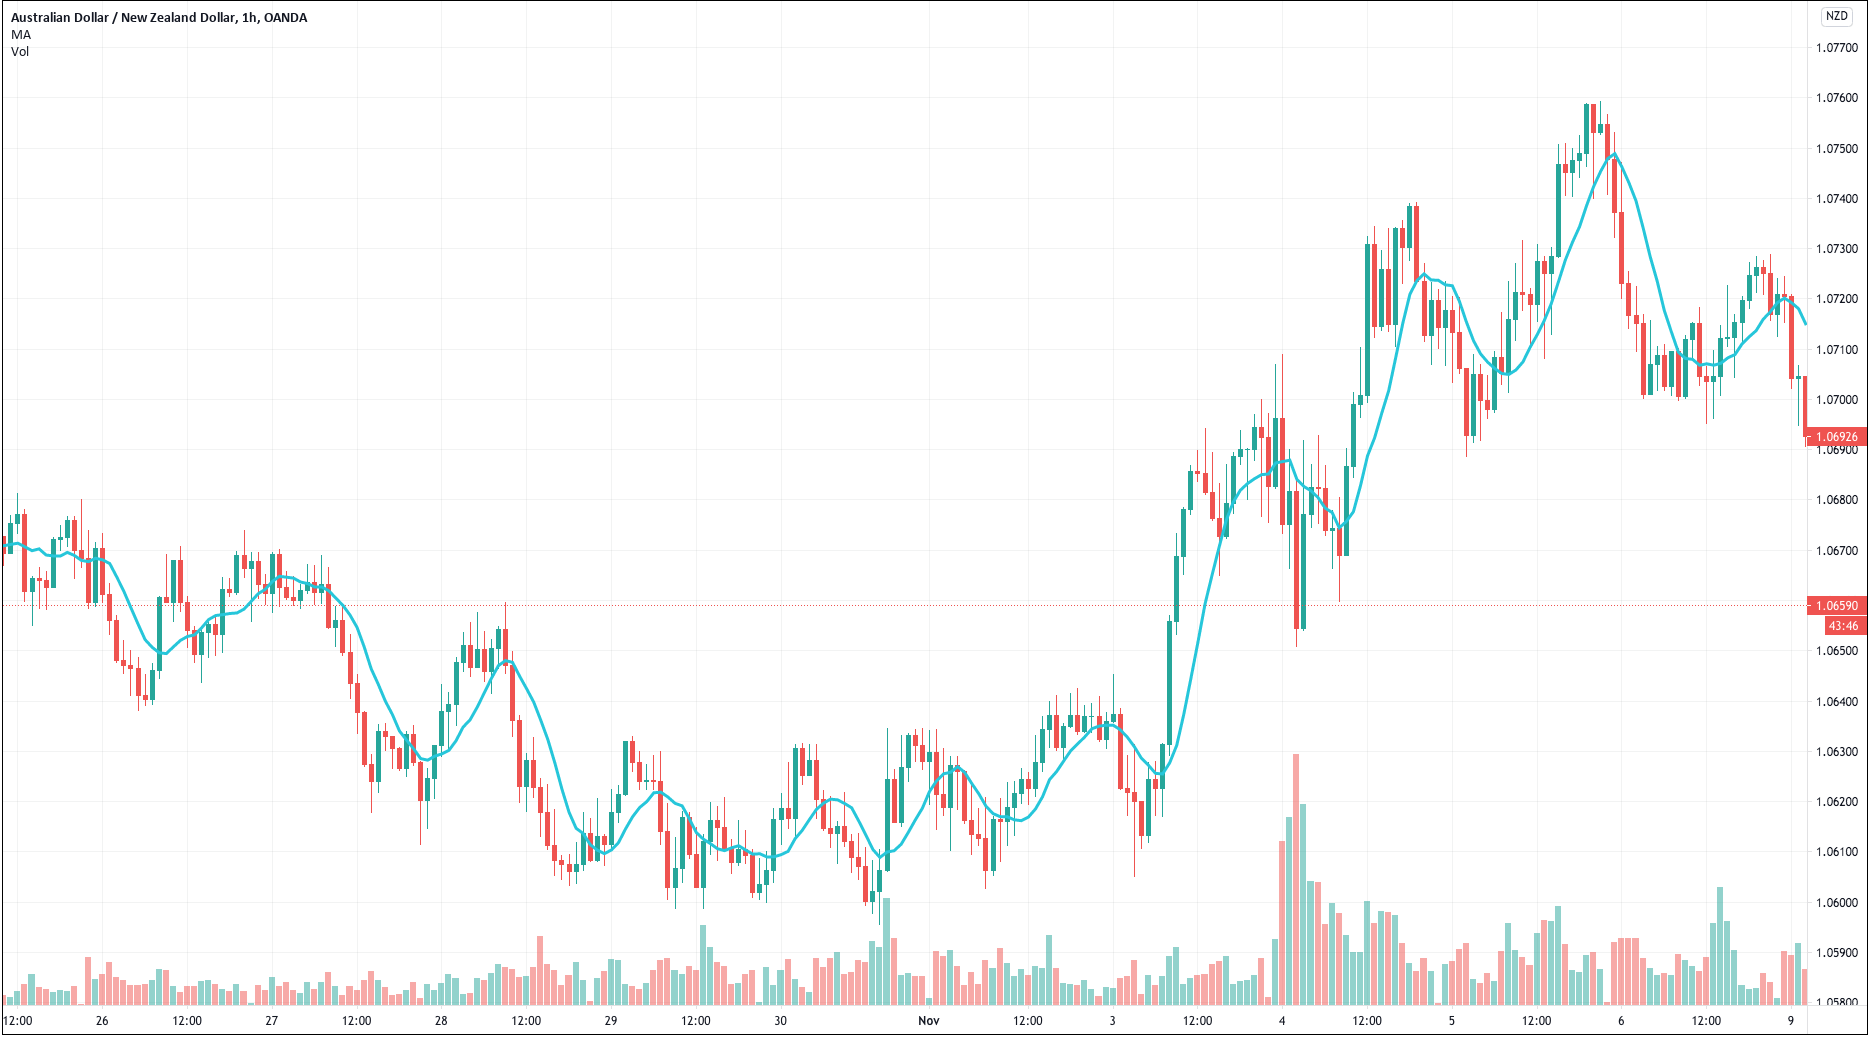
 As said in our previous video, financial markets are unbounded territories where each trader needs to set his own rules; otherwise, they will be influenced by his emotions and fail. A trading system is their set of rules that enable them a long-term success.
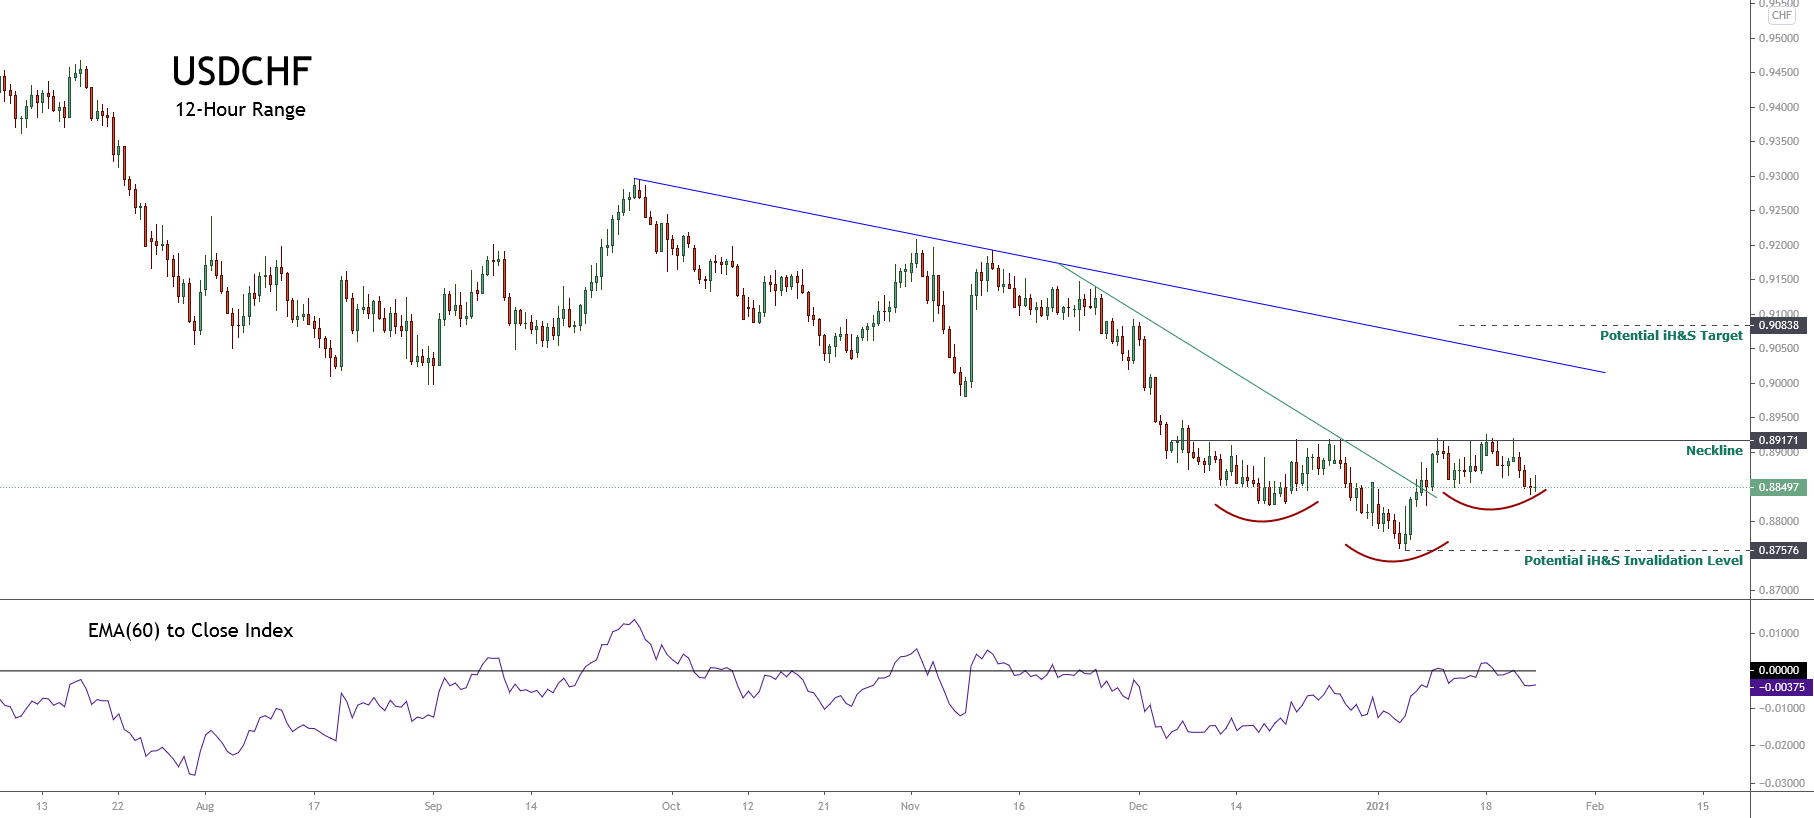
 The chosen timeframe should match the availability to trade. A trader with a day job would need to select a daily or a 12-hour timeframe, whereas a full-time trader could use shorter frames, such as 15-min, one, two, or four-hour timeframes.
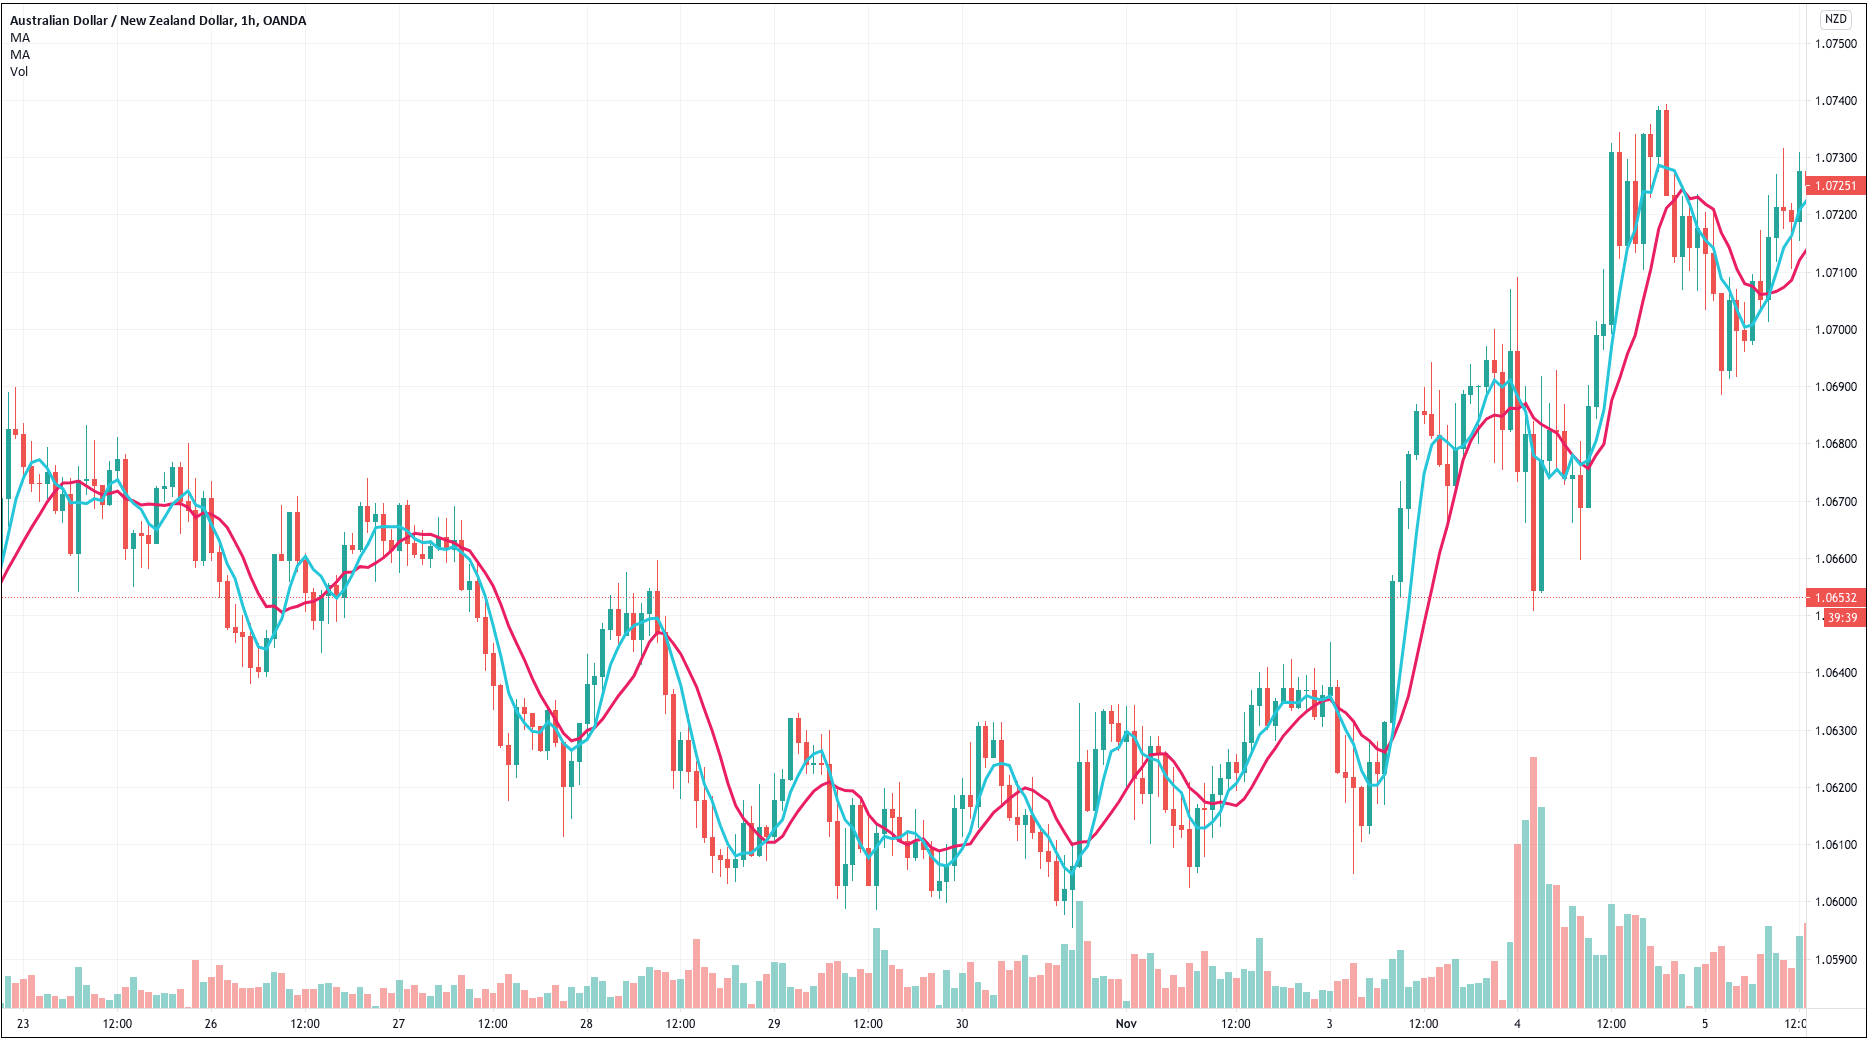
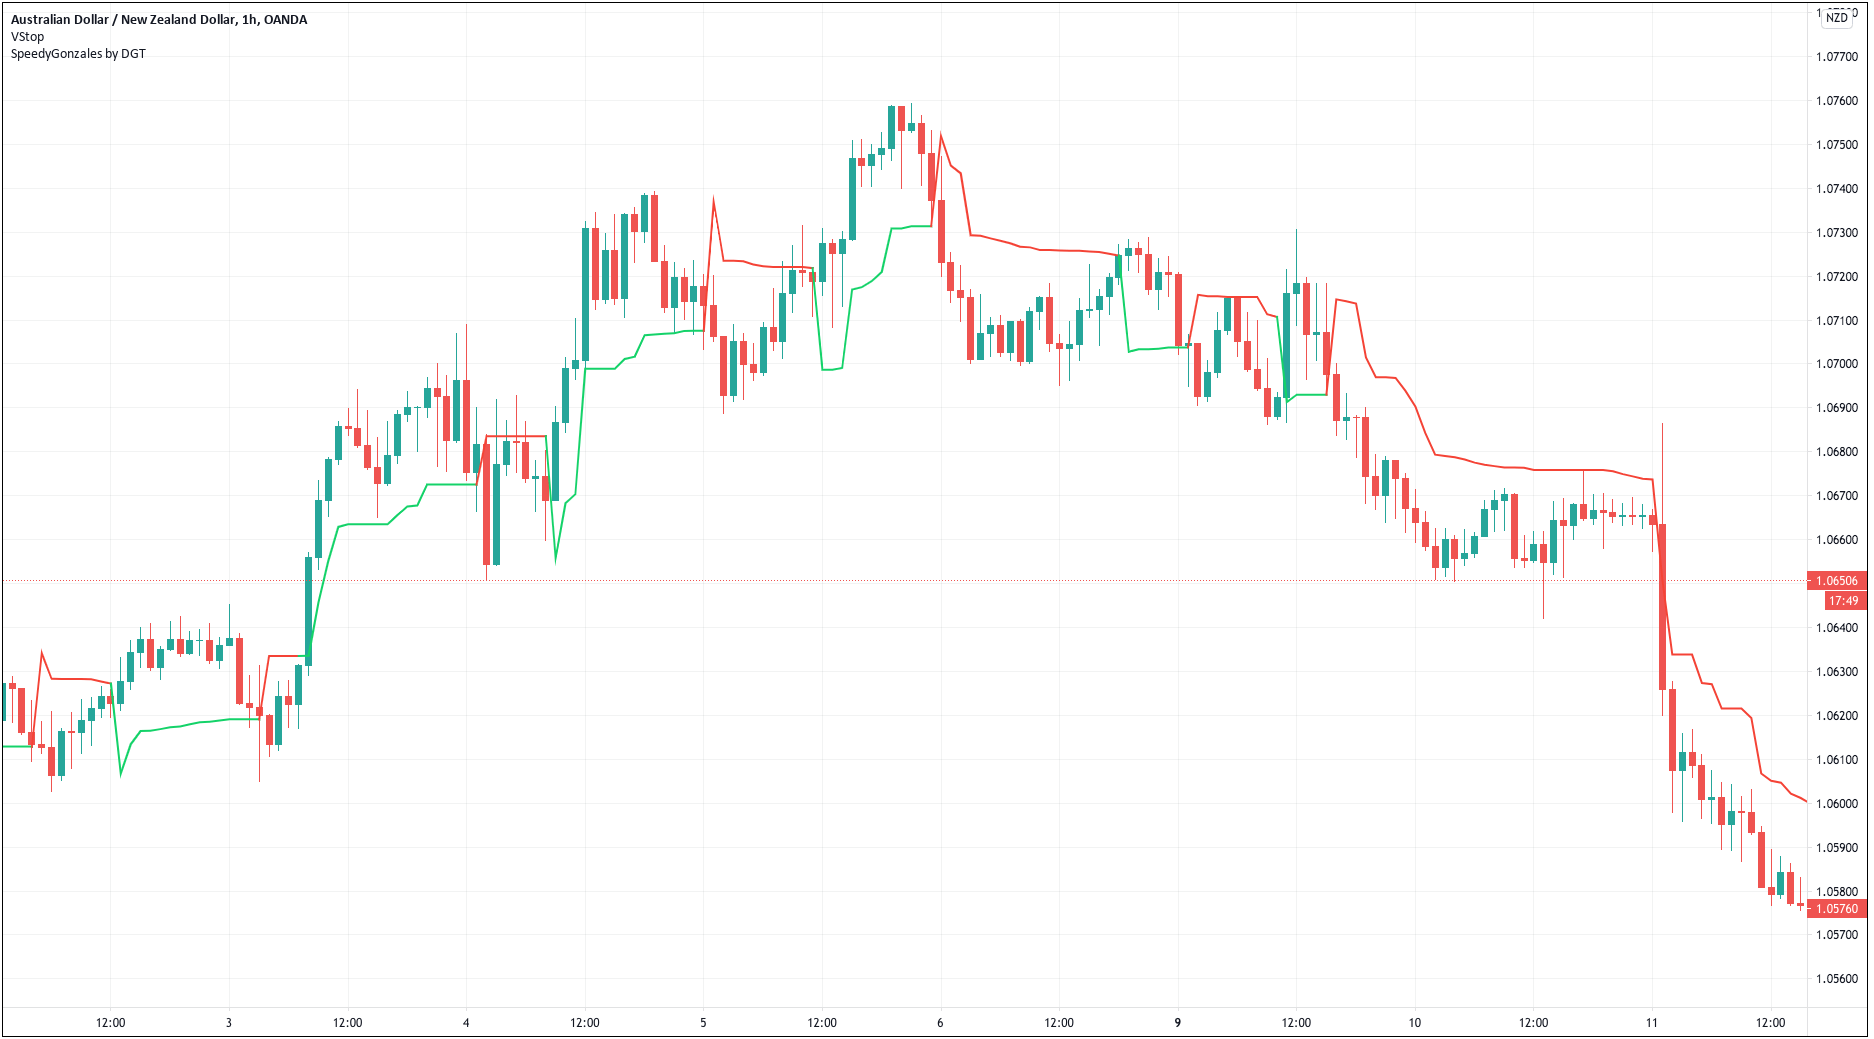
 A permisioning filter is a way to avoid trading under determined circumstances. It can be a filter that allows only trading in the direction of the primary trend or an overbought/oversold sign that should be on for a determined candlestick or pattern formation to be valid.

 Position sizing is the part of your plan that tells you how much risk you should take on a trade. We have had a