Categories
Forex Fundamental Analysis

GBP/JPY Global Macro Analysis – Part 2

JPY Endogenous Analysis

Summary

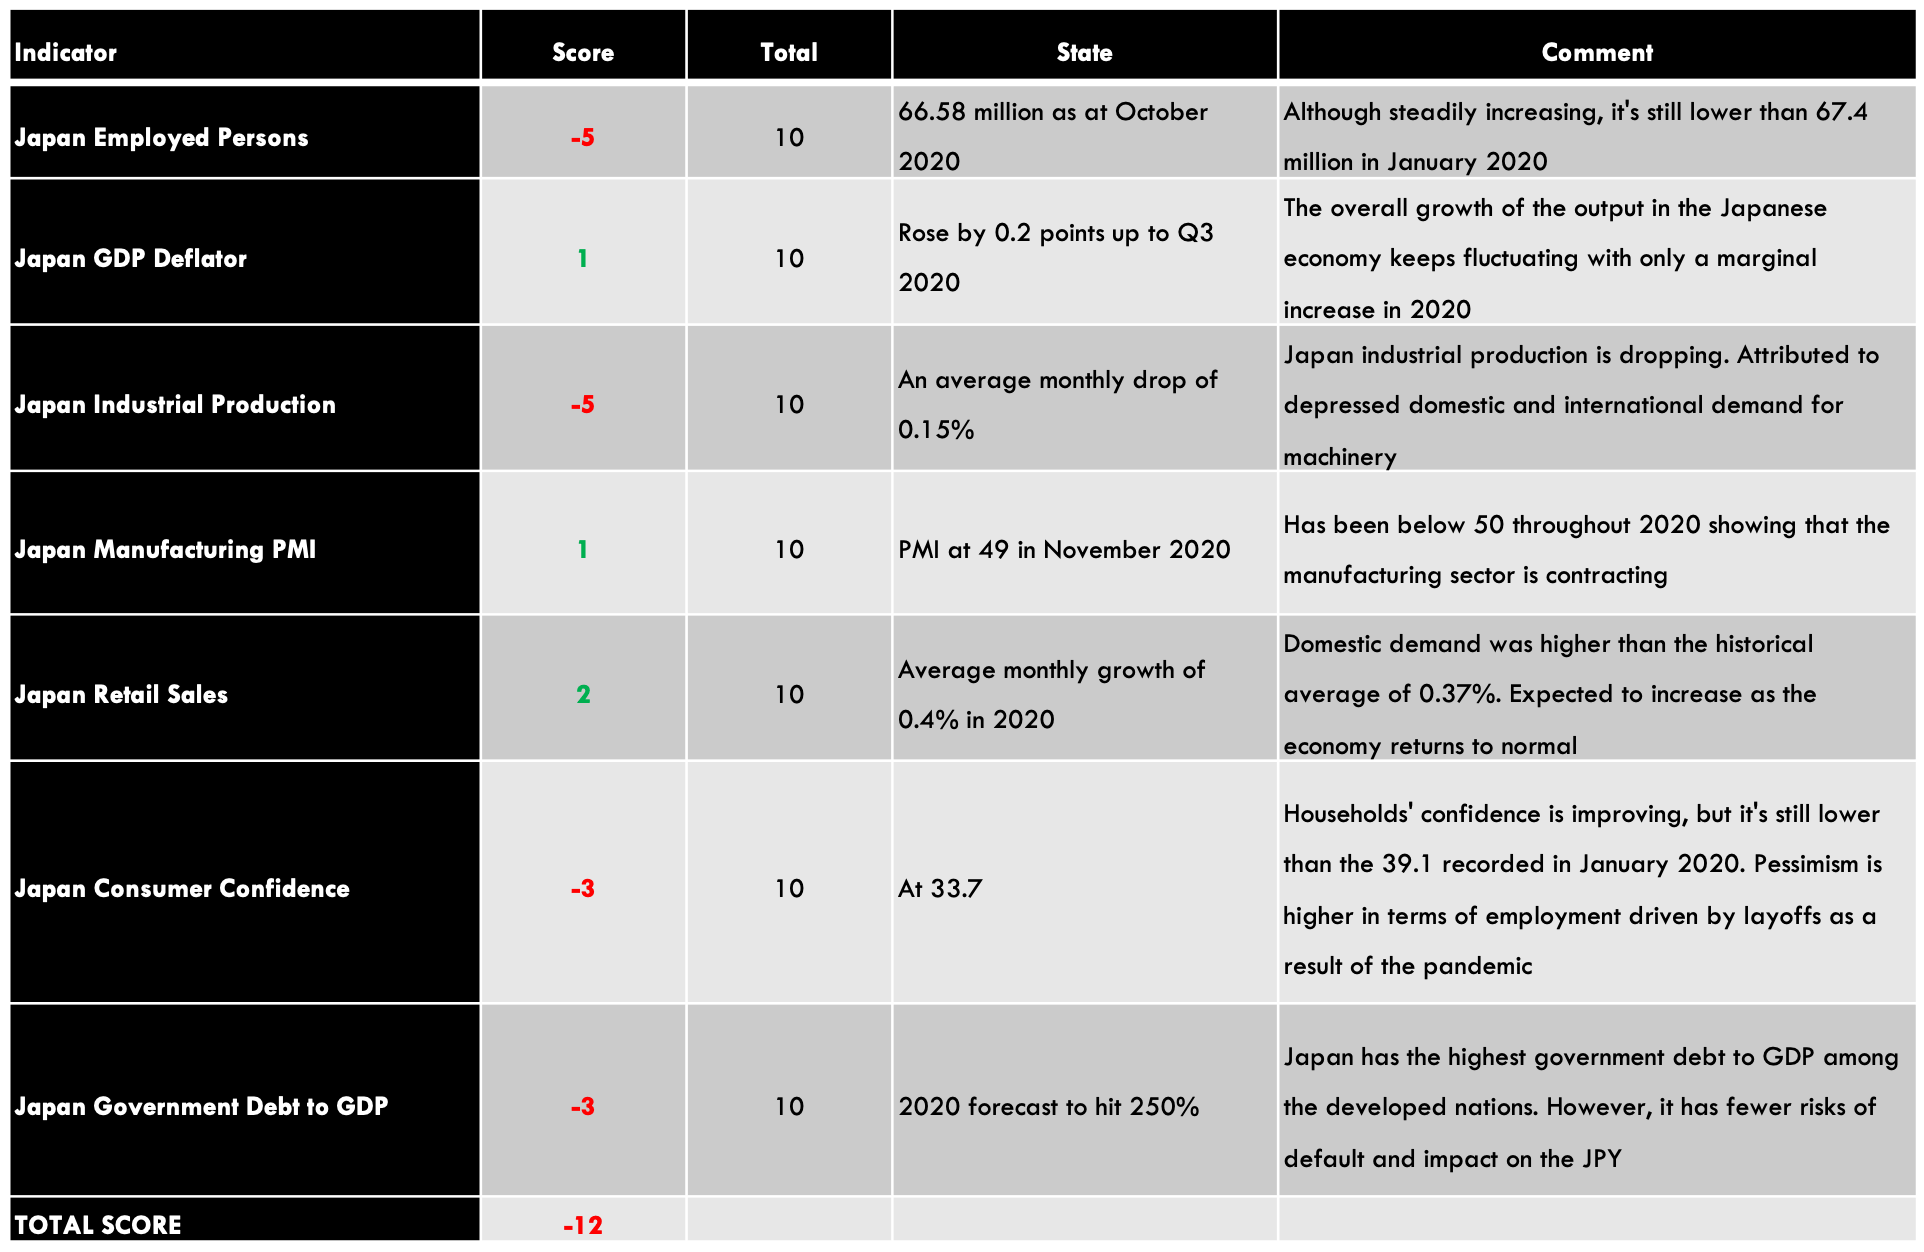
An overall score of -13 implies that this currency (JPY) has depreciated since the beginning of this year.

Indicator Score Total State Comment
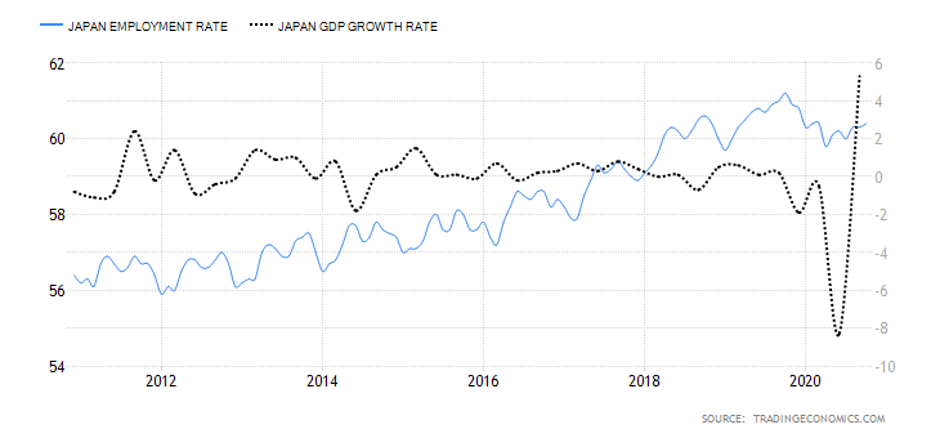
Japan Employment Rate -4 10 60.4% in October 2020 The Japanese labor market has shed about 820,000 jobs between January and October 2020
Japan Core Consumer Prices -1 10 101.2 points in November 2020 The index has dropped marginally by 0.8 points in the first 11 months
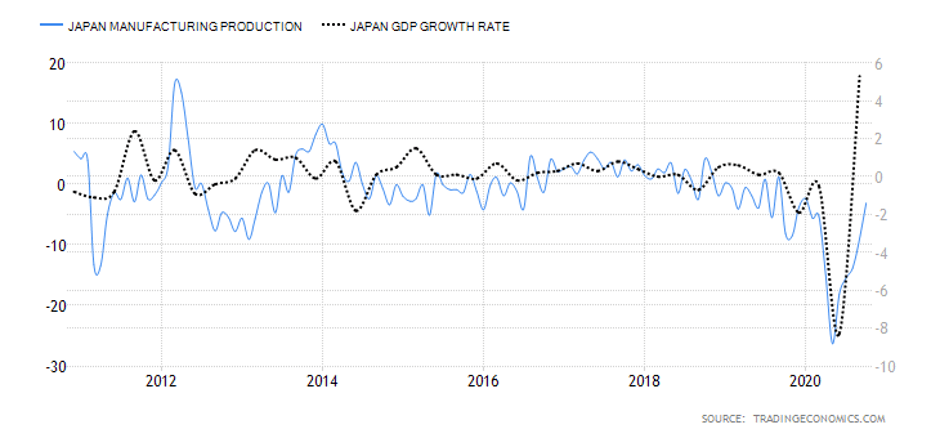
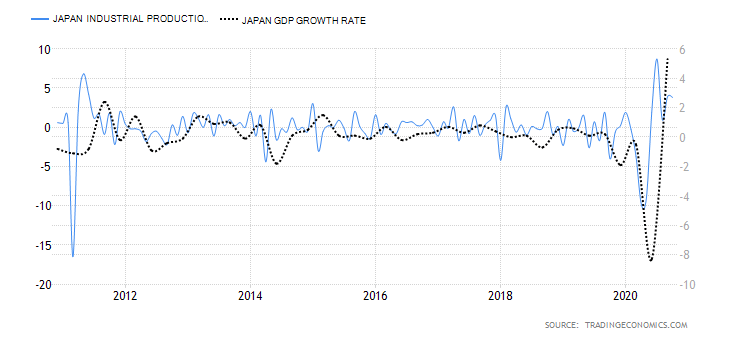
Japan Manufacturing Production 2 10 3.1% drop in October The decrease in YoY manufacturing production is slowing down
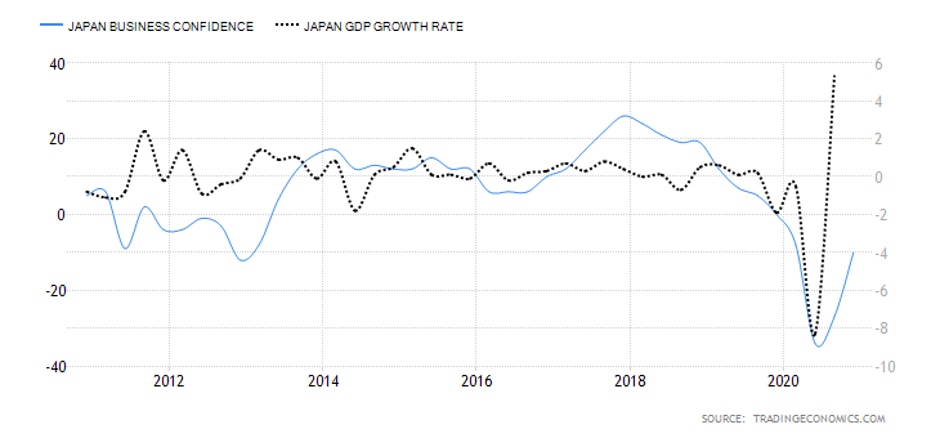
Japan  Business Confidence -2 10 Q4 reading was -10 Businesses are growing increasingly optimistic
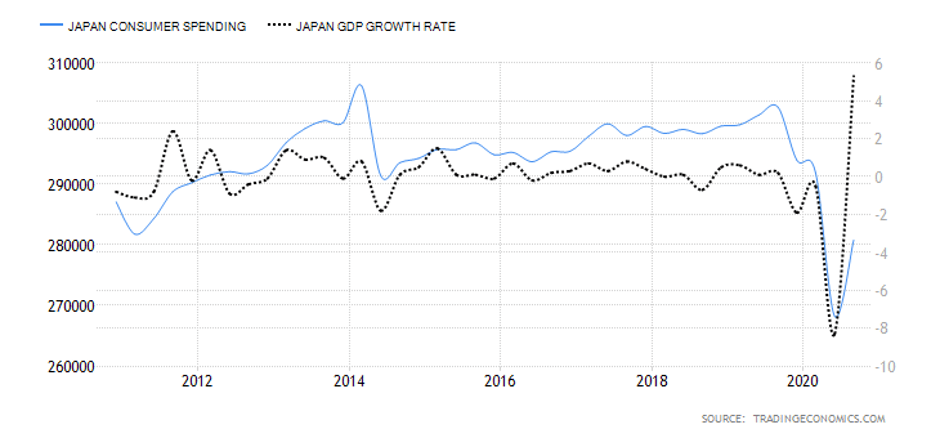
Japan Consumer Spending -2 10 Was ¥280.8 trillion in Q3 2020 The increase in Q3 expenditure by households shows that the economy is steadily recovering
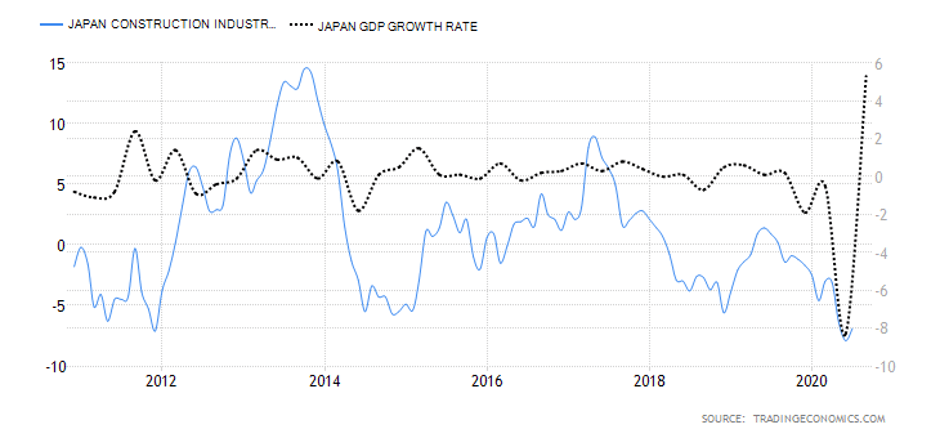
Japan Construction Industry Activity -2 10 YoY drop of 6.9% in July 2020 The July drop was the second-worst recorded in over ten years
Japan Government Budget Value -4 10 the budget deficit of ¥308414 in Q2 2020 This is the worst deficit in 20 years. It’s expected to improve as the economy goes back to normal
TOTAL SCORE -13
  • Japan Employment Rate

This indicator shows the number of Japanese nationals employed as a percentage of the entire Japanese working-age population. With this indicator, we can track the Japanese economy’s performance since employment corresponds to the expansion and contraction of the economy.

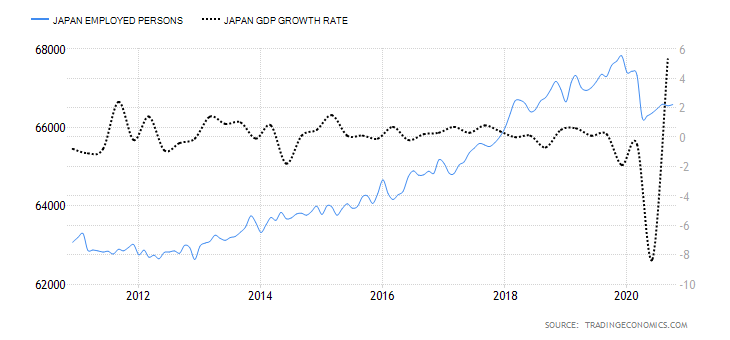
In October 2020, the Japan employment rate rose to 60.4% from 60.3% in September. Although Japan’s employment rate is higher than in January, the labor market has lost about 820,000 jobs since January. We assign a score of -4.

  • Japan Core Consumer Prices

Core consumer prices measure the inflation rate in Japan based on a select basket of goods. The core consumer prices do not include goods and services with volatile prices. Typically, when inflation rises, it implies that the economy is expanding and the labor market is growing. Conversely, when the index drops, it means that the labor market is shrinking.

In November 2020, Japan Core Consumer Prices dropped to 101.2 points from 101.3 in October. Since January, the index has shed 0.8 points. Thus, it scores a -1.

  • Japan Manufacturing Production

This indicator measures the percentage change in the value of the output in the manufacturing sector. Since the Japanese economy is highly reliant on the manufacturing sector, changes in this indicator can be considered a leading indicator of economic growth.

In October 2020, the YoY manufacturing production in Japan decreased by 3.1% compared to the 9% decrease recorded in September. The October decrease is the slowest since February.  We assign a score of 2.

  • Japan Business Confidence

In Japan, the business confidence index results from a survey of about 1100 large manufacturers with a capital of at least ¥1 billion. The survey evaluates the current industry trends, business conditions within the company and the industry, and expectations for the next quarter and year. The sentiment in Japanese businesses is ranked with an index of a scale from -100 to +100. The negative index shows pessimism, while a positive index shows optimism.

In Q4 of 2020, the Bank of Japan’s Tankan business sentiment index increased to -10 from -27 in Q3. This improvement shows that the economy is potentially recovering from the impact of the COVID-19 pandemic. However, it is still lower than the -8 registered in Q1. Thus, we assign a score of -2.

  • Japan Consumer Spending

It tracks the quarterly value of expenditure by households. In Japan, the consumption expenditure accounts for both the supply-side and demand-side. The supply-side from the survey of family income, while the demand-side is from the expenditure survey. The weighted average of both these estimates represents the final consumption expenditure.

In Q3 2020, the consumer spending in Japan rose to ¥280.8 trillion from ¥268.2 trillion in Q2. However, it is still lower than the consumer spending recorded in Q1. Japan consumer spending scores -4.

  • Japan Construction Industry Activity

This index tracks the YoY changes in the construction industry in Japan. It shows the changes in companies’ monetary value of construction work and billed to the clients. Note that in Japan, the construction industry accounts for about 6% of the total industrial activity. Thus, the construction output index can be a leading indicator of the entire industrial activity. More so, since it is a tertiary industry, it can signal longer-term changes in the GDP.

In July 2020, Japan’s YoY construction output dropped by 6.9%. This drop is the second-worst in over ten years. The worst was recorded in June at -7.9%. The Japan construction industry activity scores -2.

  • Japan Government Budget Value

In Japan, the government budget value evaluates the difference between government revenues and expenditure. This is meant to determine whether there is a government budget surplus or deficit. A budget surplus arises when revenues exceed the expenditure, while a deficit occurs when government expenditure is more than revenues.

In Q2 of 2020, Japan has a government budget deficit of ¥308414. This is the worst deficit recorded in over two decades. Thus, the Japan Government Budget Value has a score of -4.

In the upcoming article, you can find the Exogenous analysis of the GBP/JPY currency pair where we have forecasted its price movements. All the best.

Categories
Forex Fundamental Analysis

GBP/JPY Global Macro Analysis – Part 1

Introduction

The GBP/JPY pair’s global macro analysis interrogates the endogenous factors that drive the GDP growth in the UK and Japan. The analysis will also cover exogenous factors that affect the exchange rate between the GBP and the JPY.

Ranking Scale

The analysis will use a sliding scale from -10 to +10 to rank the endogenous and exogenous factors’ impact. Endogenous factors impact the value of the domestic currency. Thus, when it is negative, it means that the domestic currency has depreciated. When positive, it means that the domestic currency has increased in value during the period under review. The ranking of the endogenous factors is based on correlation analysis with the domestic GDP.

On the other hand, a positive ranking for the exogenous factors means that the GBP/JPY pair’s price will increase. Conversely, when negative, it means that the price of the pair will drop. This ranking is derived from correlation analysis between the exogenous factors and the GBP/JPY exchange rate fluctuation.

GBP Endogenous Analysis – Summary

A score of -15 implies that GBP has depreciated since the beginning of this year.

Indicator Score Total State Comment
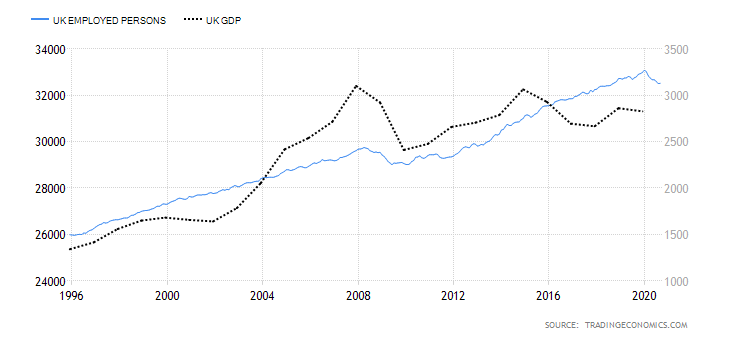
UK Employment Rate -5 10 75.2% in September 2020 Dropped by 1.4% from January to September. The labor market has shed around 551,000 jobs
UK Core Consumer Prices 2 10 109.82 points in November 2020 The UK core consumer prices have increased by 1.82 points since January. Shows that the demand in the domestic economy has not been depressed
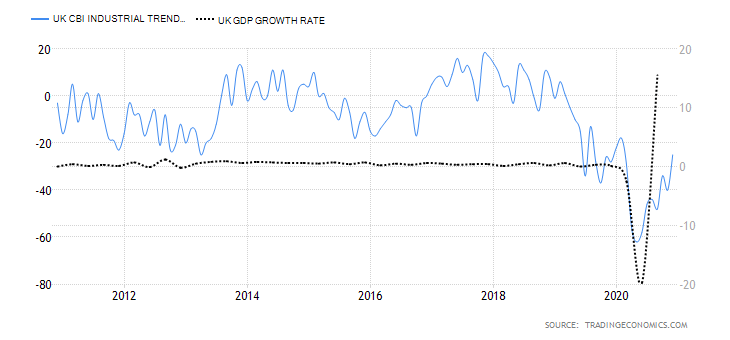
UK Factory Orders 3 10 Was -25 in November The CBI trends orders are improving. The -25 recorded in November was the highest since February
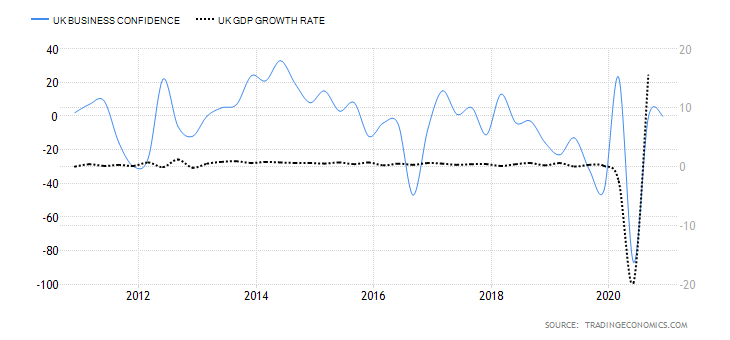
UK Business Confidence -2 10 Neutral in Q4 of 2020 UK businesses are still pessimistic about the future operating environment.
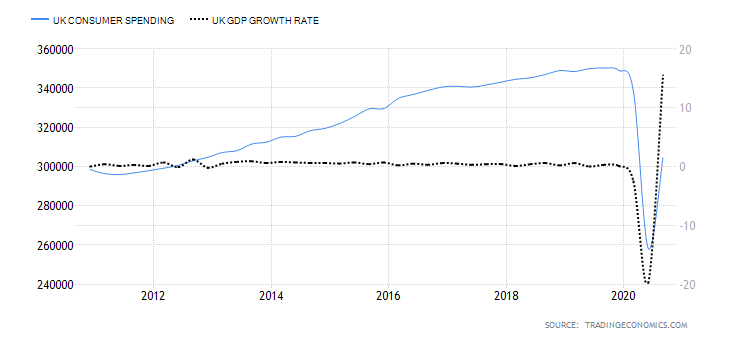
UK Consumer Spending -5 10 Was £304.5 billion in Q3 2020 Q3 household expenditure shows domestic demand is recovering from the lows of Q2. Consumer spending is still below the pre-pandemic Q1 levels
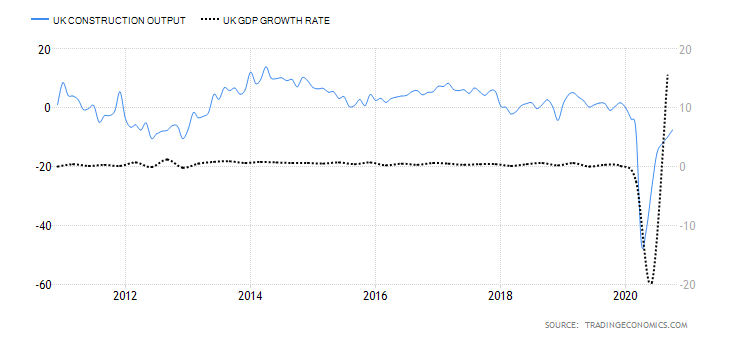
UK Construction Output -2 10 YoY drop of 7.5% in October 2020 The construction output is improving, which implies that the UK economy is steadily recovering from the economic disruptions of the pandemic
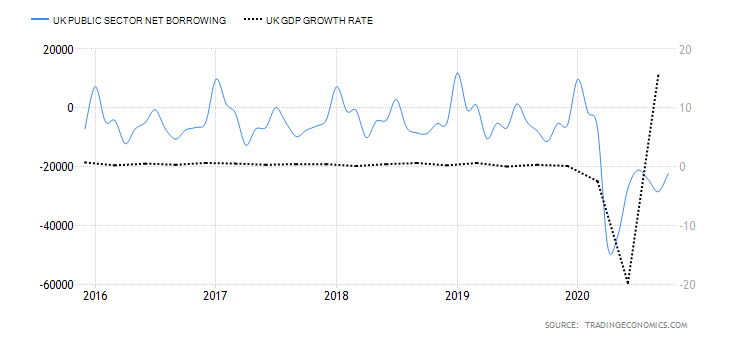
UK Government Budget Value -6 10 UK public sector net borrowing deficit was £22.3 billion The growing budget deficit is a result of increased government expenditure in the wake of COVID-19 pandemic. Also worsened by reduced revenues due to business disruption
TOTAL SCORE -15
  • United Kingdom Employment Rate

The employment rate shows the percentage of the UK labor market that is actively and gainfully employed. It is a comprehensive representation of the growth in the labor market. Note that the changes in the employment rate measure the changes in the economic activities of a country.

In September 2020, the UK employment rate dropped to 75.2% from 75.3% in August. From January to September 2020, the employment rate has dropped by 1.4%, equivalent to about 551,000 job loss. The UK employment rate scores -5.

  • United Kingdom Core Consumer Prices

This index measures the change in the rate of inflation in the UK by tracking price changes of specific consumer products. The index calculation excludes items whose prices tend to be highly volatile, such as fuel and energy.

In November 2020, the core consumer prices in the UK dropped to 109.82 from 109.9 in October. The index has increased by 1.82 points since January. The UK core consumer prices score 2.

  • United Kingdom Factory Orders

In the UK, the CBI Industrial Trends Orders tracks orders from about 500 companies in 38 sectors of the manufacturing industry. The survey’s components include domestic goods orders, exports, inventory, output prices, and expectations of future investments and output levels. The surveyed manufacturers respond whether the current conditions are normal, above, or below normal. This is used as a leading indicator of industrial production.

In December 2020, the UK CBI trends orders were -25, 15 points up from -40 in November. This is the highest level since February 2020 but still lower than -18 in January. We assign a score of 3.

  • United Kingdom Business Confidence

This index gauges the optimism of businesses operating in the UK. A survey is conducted on 400 small, medium, and large companies to determine their optimism. The survey covers exports, output levels and prices, capacity, order books, inventory, competitiveness in the domestic market,  innovation, and training. The business sentiment is then ranked from -100 to +100, with 0 showing neutrality.

In the fourth quarter of 2020, the UK business confidence was neutral at 0, a slight change from -1 in Q3. It is, however, still below the 23 recorded in Q1. We assign a score of -2.

  • United Kingdom Consumer Spending

Expenditure by households contributes to a significant proportion of the domestic GDP. In the UK, this index tracks quarterly changes in the amount of money spent by households and Non-profit institutions serving households (NPISH). Note that when the economy is performing well, consumer spending is high. Conversely, a poorly performing economy corresponds to low consumer spending.

In Q3 2020, consumer spending in the UK rose to £304.5 billion from £258.3 billion in Q2. However, the Q3 expenditure is still lower than Q1. The UK consumer spending scores -5.

  • United Kingdom Construction Output

This economic indicator tracks the yearly change in the value of work done in the construction sector. The amount of money charged by construction companies in the UK is based on a sample of 8000 companies that employ over 100 employees. Note that in the UK, the construction sector contributes about 6.4% of the GDP.

In October 2020, the UK’s YoY construction output dropped by 7.5%, up for the 10% drop recorded in September. This marks the smallest decrease in the UK’s construction output since the pre-pandemic period. We assign a score of -2.

  • United Kingdom Government Budget Value

This indicator tracks the changes between the government’s revenues and expenditure. When the revenue exceeds the expenditure, it is a surplus and indicates that the economy is expanding. When the deficit is increasing, it means that the government is spending much more than it receives. This poses a threat of overburdening the economy with future debt repayment obligations.

In October 2020, the UK public sector net borrowing deficit was £22.3 billion. This is an improvement from the deficit of £28.6 billion in September. In January 2020, the UK had a surplus of £9.6 billion. Thus, we assign a score of -6.

In the next article, we have discussed the endogenous analysis of JPY currency to see how it has performed in the year’s due course. Make sure to check that out. Cheers.

Categories
Forex Market Analysis

Daily F.X. Analysis, January 13 – Top Trade Setups In Forex – U.S. Inflation Report in Focus! 

On the news front, eyes will remain on the ECB President Lagarde Speaks as she may discuss the upcoming monetary policy event; however, the major focus will remain on the U.S. Inflation rates, which may help determine the further direction of the U.S. dollar.

Economic Events to Watch Today  


EUR/USD – Daily Analysis

The EUR/USD closed at 1.22077 after placing a high of 1.22095 and a low of 1.21369. After falling for three consecutive sessions, the EUR/USD pair rose on Tuesday as the U.S. dollar eased and U.S. Treasury declined. The U.S. Dollar had hit a more than two and half year lowest level in January after sliding for months as the U.S. Federal Reserve cut its interest rates and speculation of heavy rounds of fiscal stimulus under President-elect Joe Biden’s tenure. However, after Democrats won the Georgia runoff elections, the hopes for massive stimulus packages increased, and the U.S. Treasury yields started to rise that ultimately lifted the U.S. dollar.

This rise in the U.S. dollar weighed heavily on EUR/USD pair during last week; however, the recent rally in U.S. Treasury yields ran out of the stream, and the dollar came back to its previous levels. The U.S. Treasury yield on a 10-year note reached a 10-month high on Tuesday but ultimately had a reverse effect and weighed on the U.S. dollar. This slide-in U.S. dollar added gains in EUR/USD pair on Tuesday as the investors started taking profits. Meanwhile, on Tuesday, the Turkish President Recep Tayyip Erdogan said that country was ready to settle its frayed relationship with the European Union back on track and called on the 27 nation bloc to display the same determination. 

These new lockdown measures across Europe to fight the second wave of coronavirus raised the fears of a double-dip recession in the Eurozone that added weight on the single currency Euro and capped further upside in the EUR/USD pair on Tuesday.

On the data front, there was no macroeconomic data to be released from Europe while from the U.S., at 16:00 GMT, the NFIB Small Business Index for December dropped to 95.9 against the expected 100.1 and weighed on the U.S. dollar that ultimately added in the gains of EUR/USD pair. At 20:00 GMT, the JOLTS Job Openings for November rose to 6.53M against the expected 6.42M and supported the U.S. dollar that capped further gains in EUR/USD pair. At 20:02 GMT, the IBD/TIPP Economic Optimism came in line with the forecasts of 50.1.

Daily Technical Levels

Support   Resistance

1.2159     1.2234

1.2111     1.2259

1.2085     1.2308

Pivot point: 1.2185

EUR/USD– Trading Tip

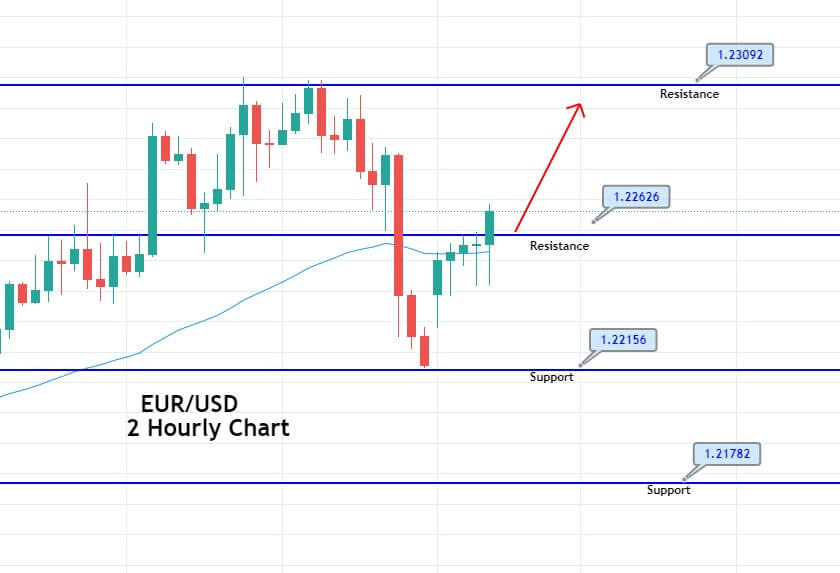
The EUR/USD is gaining support at the 1.2200 level, and below this, it can dip further until the 1.2189 level. On the higher side, the pair may face resistance at the 1.2226 level, and a bullish breakout of this level can extend the buying trend until 1.2260. The RSI and MACD support a bullish trend, but there’s a chance of bearish correction upon the violation of 1.2190. On the 4 hour timeframe, the EUR/USD pair may face resistance at the 1.2220 level, which is extended by a downward trendline.


GBP/USD – Daily Analysis

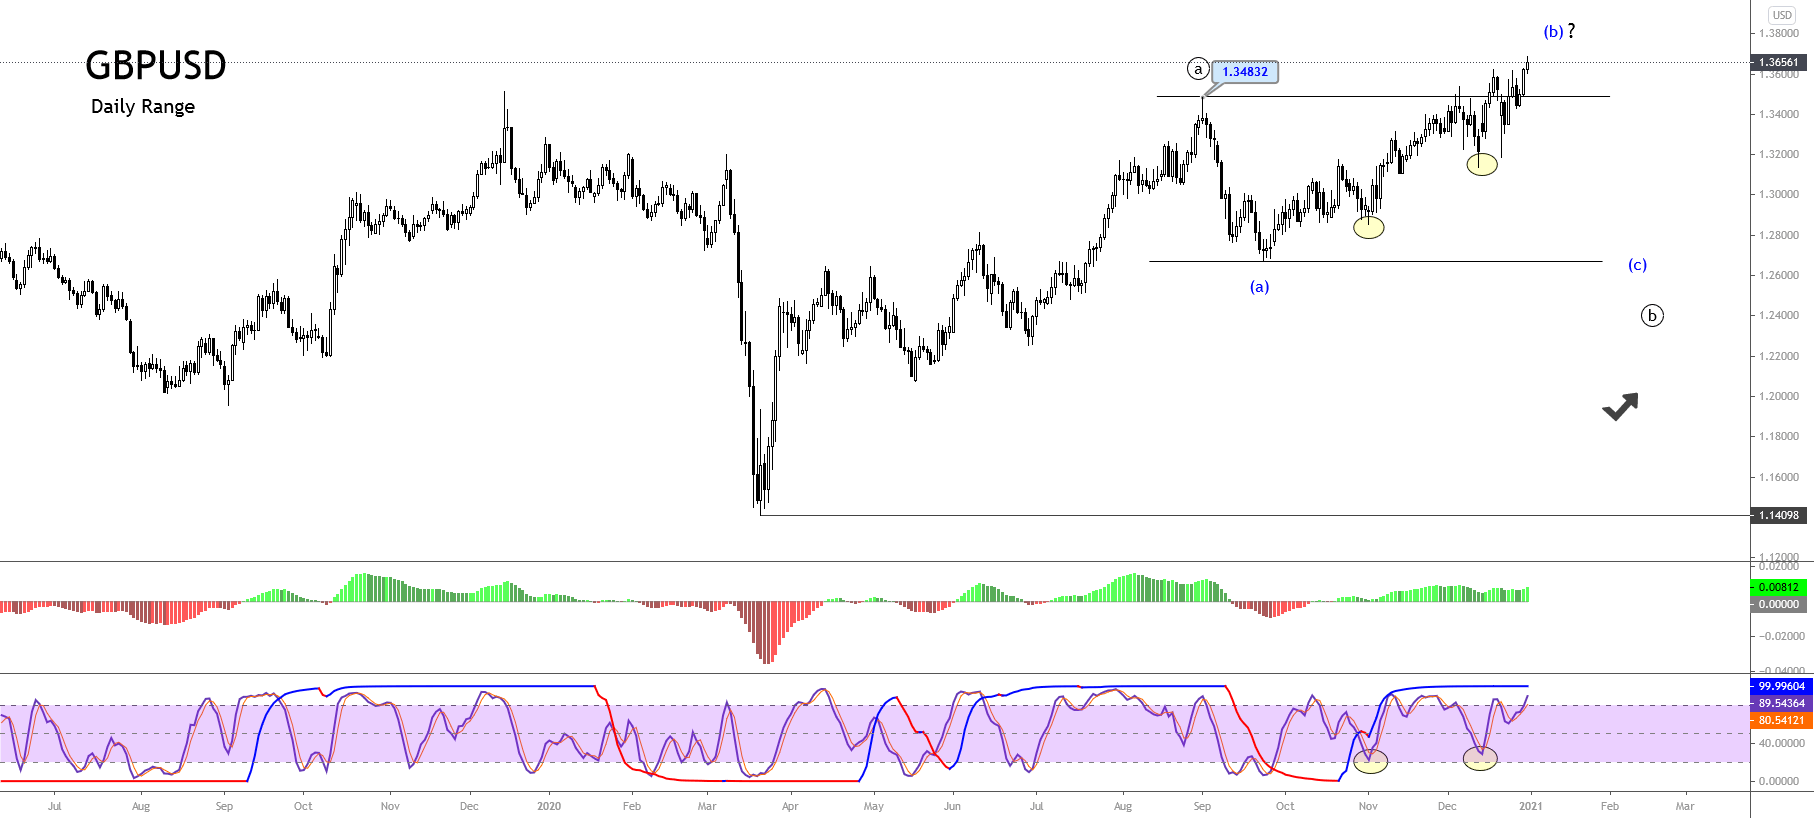
The GBP/USD closed at 1.36645 after placing a high of 1.36702 and a low of 1.34932. After falling for four consecutive sessions, the GBP/USD pair raised on Tuesday after Sterling strengthened amid the Bank of England’s positive comments. The Pound Sterling jumped against the U.S. dollar and the Euro on Tuesday as comments from the Bank of England’s governor Andrew Bailey on the viability of negative interest rates dampened some sub-zero rates’ expectations in the U.K. 

Bailey said that there were many issues with cutting interest rates below zero, and such a move could hurt banks. After these comments from Bailey, the British Pound gained traction and raised that ultimately pushed the GBP/USD pair higher on Tuesday.

Meanwhile, The Deputy Governor of Bank of England, Ben Broadbent, said on Tuesday that Britain’s coronavirus pandemic was likely to have a limited long-run impact on inflation and has led to less short-term downward pressure on prices than might have been expected from the slump in headline economic output. Broadbent said that a smaller slowdown in inflation reflected shifts in consumer demand during the pandemic that had led to temporary capacity constraints in businesses, as well as support to household incomes from government furlough schemes.

On the data front, at 05:01 GMT, the BRC Retail Sales Monitor for the year for December dropped to 4.8% against the expected 5.9% and weighed on British Pound and capped further upside in GBP/USD pair. From the U.S. side, at 16:00 GMT, the NFIB Small Business Index for December declined to 95.9 against the projected 100.1 and weighed on the U.S. dollar that ultimately added the gains of the GBP/USD pair. At 20:00 GMT, the JOLTS Job Openings for November surged to 6.53M against the projected 6.42M and supported the U.S. dollar that capped further GBP/USD pair gains. At 20:02 GMT, the IBD/TIPP Economic Optimism came in line with the projections of 50.1.

On the other hand, the U.S. dollar was also weak on Tuesday as the U.S. Dollar Index dropped as investors kept an eye on U.S. politics while pressure continued to grow to impeach President Donald Trump. Furthermore, the U.S. dollar was also weak as the prospects of massive stimulus packages from Joe Biden’s government raised as he has shown a willingness to add trillions in new relief bills that ultimately supported the upward momentum of the GBP/USD pair.

Daily Technical Levels

Support   Resistance

1.3555     1.3722

1.3445     1.3781

1.3387     1.3890

Pivot point: 1.3613

GBP/USD– Trading Tip

The GBP/USD is trading at 1.3692, and it has closed a doji candle on the four hourly timeframes, and it may extend a bearish correction in the GBP/USD pair. On the lower side, the support stays at 1.3636 and resistance at 1.3692 and 1.3720 today. The GBP/USD pair’s 10 & 20 periods EMA is supporting bullish bias in the Sterling. The MACD and RSI thesupport bullish bias; therefore, bullish bias dominates over the 1.3646 level today.


USD/JPY – Daily Analysis

The USD/JPY pair closed at 103.749 after placing a high of 104.333 and a low of 103.718. After rising for four consecutive days, the USD/JPY pair dropped on Tuesday amid the slide in the U.S. dollar. The U.S. dollar index dropped to fresh weekly lows in the 90.20 level as hopes for additional fiscal stimulus raised and provided support to high yielding equities. The House of Representatives introduced an impeachment article against U.S. President Donald Trump that weighed on the U.S. dollar and dragged the pair USD/JPY on the downside.

The U.S. Dollar Index (DXY) fell almost 0.3% on Tuesday against its rivals, while the 10-year U.S. Treasury yields dropped to a session’s low of 1.146%. The U.S. stocks opened higher on Tuesday and recovered from the previous session’s losses, with investors looking for additional fiscal stimulus amid continued political turmoil. The Dow Jones Industrial Average was down by 0.3%, and the S&P 500 was down by 0.6% lower while NASDAQ was low by 1.2%.

On the data front, at 04:50 GMT, the Bank Lending for the year from Japan dropped to 6.2% against the forecasted 6.5% and weighed on the Japanese Yen that capped further losses in the USD/JPY pair. The Current Account Balance from Japan for November raised to 2.34T against the forecasted 2.00T and supported the Japanese Yen that ultimately added the USD/JPY pair’s losses. At 10:00 GMT, the Economic Watchers Sentiment dropped to 35.5 against the expected 36.9 and weighed on the Japanese Yen, which capped further losses in the USD/JPY pair.

From the U.S. side, at 16:00 GMT, the NFIB Small Business Index for December decreased to 95.9 against the anticipated 100.1 and weighed on the U.S. dollar that ultimately added further losses in the USD/JPY pair. At 20:00 GMT, the JOLTS Job Openings for November increased to 6.53M against the anticipated 6.42M and supported the U.S. dollar that capped further losses in the USD/JPY pair. At 20:02 GMT, the IBD/TIPP Economic Optimism came in line with the anticipations of 50.1.

Meanwhile, the safe-haven appeal rose on Tuesday after fears rose that there could be further disruptions in the days leading up to Biden’s inauguration on January 20. FBI has said that it has received information specifying that armed protests were being planned at all 50 state capitols and Washington. The FBI’s comments raised the safe-haven appeal and supported the safe-haven Japanese Yen that ultimately added the USD/JPY pair’s losses on Tuesday.

On Tuesday, Federal Reserve Governor Lael Brainard said that the federal banking agencies were in the process of enlisting requests for information on the risk management of artificial intelligence applications in financial services. Whereas, the Boston Federal Reserve Bank President Eric Rosengren said that the U.S. economy could see a strong rebound in the second half of this year as vaccinations became widely available and that monetary policy will remain accommodative. However, the virus was still driving the economy. The losses in USD/JPY pair were also capped on Tuesday after the Donald Trump administration said that it was releasing millions of coronavirus vaccine doses and urged states to offer them to all Americans over age 65 or with chronic health conditions.

Daily Technical Levels

Support   Resistance

103.53     104.16

103.31     104.56

102.91     104.78

Pivot point: 103.94

USD/JPY – Trading Tips

The safe-haven currency pair USD/JPY slipped to trade at 103.623 level amid increased demand for safe-haven assets. On the lower side, the USD/JPY pair has completed 38.2% Fibonacci retracement at 103.611 level, and on the further lower side, the USD/JPY pair may find support at 50% Fibonacci level of 103.400 level. The MACD and RSI support selling bias; therefore, we may find support at the 103.283 level. Let’s consider taking the buying trade over the 103.283 level and selling below the same. Good luck! 

Categories
Forex Psychology

The Fundamentals of Mental Accounting in Forex Trading

The vast majority of agents involved in the financial markets know the term accounting. We also know the different categories within the generic concept: financial accounting, corporate accounting, analytical, management, banking, etc. However, what do we know about Mental Accounting? Have you ever wondered about the internal processes that our minds follow when we open or close a position? Why isn’t it easy for us to close a loss-making operation? Why do we rush to sell the winning trades, even knowing that they can have a favorable path to our position?

In the same way that a company has to identify, evaluate, and record the relevant accounting facts, individuals face the same problem. When an institution provides a service or sells a product it has to record this fact, when we in the market open a position, we open a mental account that will move with the fluctuations of the market even if we do it unconsciously.

Mental accounting seeks answers to questions such as those I have just asked and the purpose of this article is to show that mental accounting influences decision-making whose final outcome is uncertain, that is, the decision under uncertainty, and that its study and knowledge can provide us with greater mental stability to face activities such as investment or trading. Mental accounting is the set of cognitive operations developed by individuals to organize, evaluate, and track financial activities.

Fundamentals of Mental Accounting

Financial accounting is composed of a set of rules that have been codified over the years, can be found in quite a number of textbooks and unfortunately, there is no equivalent of these rules in mental accounting, We can learn them by observing human behavior from which we can infer rules of conduct. In this article we will try to see three components of mental accounting:

– The first refers to how we perceive actual events and how we make decisions based on those events. In the diagram below, the individual or trader is linked to the actual events.

– The second component is the allocation of each activity in your specific mental account. Financial accounting teaches us that there is a classification of expenses and revenues that are within a budget.

– The third component tells us about the frequency with which we evaluate accounts, we can audit our financial accounts annually, monthly, or daily if we consider it, what happens with our mental records? , Do we have enough willpower not to count the money we are earning or losing while we are positioned in the market? In the diagram below would be the return flow of each account to the trader.

A more detailed study of our mental structure shows that it is not advisable to count money in situations that require decision-making under an atmosphere of uncertainty such as poker, black-jack, or trading so that the audit of our accounts should be done with enough time to not affect our decision making, this time-space will be different for each trader, who through a process of trial and error must find its optimal review frequency.

The Profit and Loss Environment

To get us into the decision-making process of each individual, we must infer a utility function that offers us an output value for each of the decisions and thus be able to decide between our range of possibilities in matters such as, When to buy? At what price to buy? How much to buy? For this we will use the function of Kahneman and Tversky which has three essential elements:

– Transactions processed by mental accounting are mainly evaluated one at a time and not in relation to other transactions.

– Both the loss function and the profit function show a decreasing sensitivity, and this implies that the difference between 20 and 30 euros may seem larger than the difference between €1,000 and €1,010.

– Risk aversion. The loss of 100€ causes us more pain than the satisfaction that provides a profit of 100€. The influence that risk aversion has on our minds is considerable, as we shall see later.

Below we will review with some examples the characteristics of the function exposed. Suppose we want to buy a tie and a suit for €10 and €120 respectively, and when we arrive at the store the seller informs us that in the store located 20 kilometers from the store where we are, they have lowered the prices of both products by €5, leaving them at €5 and €115 respectively. Given this circumstance, most people will prefer to travel the distance to benefit from the reduction of the tie but will not do the same for the suit, although the reduction in both cases is the same. In this case, our mental accounting is based on relative rather than absolute perceptions.

The example of the tie and the suit shows us that we are willing to travel a distance to save money on the lowest priced product and not for the same savings on the most expensive product so we infer that the utility that provides the savings is associated with the differences in value and not in the value of the difference. This helps us to model how the individual processes event combinations to maximize their usefulness. We need to know if for two events, X and Y, their joint utility function F(X+Y) is greater than the sum of the individual functions F(X) + F(Y), and the utility function we mentioned earlier would have the following features:

– Separation of earnings.

– Grouping of losses.

– Grouping small losses with larger profits (to overcome risk aversion).

– Separate small gains from larger losses (the profit of a small gain exceeds the profit of reducing a large loss by a small amount).

An example of the first rule is the possibility of winning a pool with a prize of 75,000 euros, against winning two pools of 50,000 and 25,000 euros respectively. According to the work done by Richard H. Thaler, 64% of the surveyed population prefer the second option. The examples for the other rules are as intuitive as the one mentioned. Regarding the second section, we prefer to pay a purchase of 50 € with a credit card in which we will group all the purchases of the month and will be included within the total invoice of supposing 790 € to pay the 50 € in cash at the time of the purchase.

Opening and Closing of Accounts

One of the most useful components for mental accounting trading is the decision when to leave an account open and when to close it. Consider the purchase of 1,000 shares of telephone to 10€, the initial investment is 10,000€ but the value of the same will fluctuate with the movements of the market, producing gains or losses in paper until we sell the securities. The mental accounting of these losses and gains is misleading and depends on the time variable, one of the basic intuitions is that an effective loss produces more pain than a loss on paper and because closing an account with losses produces pain, Mental accounting induces us to delay the decision to close losing trades and to advance the decision to close winning trades to feed our ego.

Decision-Making: Grouping and Past Events

When we think of decision-making processes as a set of events that we can group together or dissociate, we must consider the importance of parenthesis localization in grouping together these events, because the pain produced by a loss is less if we can combine this loss with a higher gain, thus blurring its total effect.

Just as important are past events for decision making, if we are operating in the market and we are going to open a position, the results of past decisions will always affect the mental process of the new position. I would like to focus on the importance of real money, it is not the same to do this test sitting in the living room while we have coffee, that operating in the market while we gamble our savings.

The first question in the survey gives us the vision of how a gain can stimulate us to look for more risk in the same account, a este fenómeno se le denomina ‘house money effect’ o ‘efecto del dinero de la casa’ o ‘efecto del dinero arrebatado al mercado’ y debe su nombre a los jugadores de casino que llaman ‘la casa’ al casino y por consiguiente, The money from the house would be the one they’ve previously taken from the casino. This mental account of our money and that of the casino or financial market is reset to zero every day if we dedicate ourselves to an intraday operation. In this case, we have a clear example of how mental accounting is a problem for our operation since we should treat in the same way the money with which we start the operation of the money taken from the market, that should be treated as our money and not put you at greater risk.

The second conclusion of the study is provided by the second and third questions, past losses do not stimulate the search for risk, unless the new move offers us the possibility of compensating for the previous loss (break-even point), any trader, whether professional or amateur, can corroborate this conclusion through their personal experience.

Conclusion

During the presentation of the examples and works carried out in the field of mental accounting, it has been tried to demonstrate the importance that the processes of mental calculation have in our real operation, starting from the great ignorance that exists on this matter. The more knowledge we have of these processes, the greater our capacity to fight against the market and its greatest enemy, which is within each of us.

The trading industry knows that the mental structure of future traders is right for them to lose money, the difference in lost money between novice traders will be defined by how long it takes the trader to realize that the enemy is at home and that he has to try to change his beliefs, the next thing is to have a good system, a stable rules of money management and above all, being well-capitalized, a lot of discipline and a high dose of patience.

From now on, when you open a position, think about what has been developed in the article and try to decipher the mental registers that are being created while we are in the market and adopt the following rules:

– Avoid counting the money until you have closed the position.

– Treat in the same way the money taken from the money market with which it began to operate (house money effect).

– Never forget the influence that the previous operations have in the decision-making process of the present operations.

– Risk aversion leads us to make the suffering caused by a loss greater than the satisfaction caused by a gain of an amount equivalent to that of the loss.

– Do not be carried away by the illusion of measuring money in relative terms.

– Do not let your ego win the game by delaying the closing of the losing trades and accelerating the winning trades.

Categories
Forex Daily Topic Forex System Design

Building a Trading System: Why do you need a trading plan?

The necessity of a trading system has been discussed many times. Still,  new traders don’t consider it important when, in fact, it is a crucial element.  Could you conceive building a bridge without a project, playing tennis, or chess, with no strategy?


The trading profession is alike. If you take this business seriously, you’ll need to have a plan. Else, you’ll be in the loser team, in which are 90 percent of traders.

Reasons for a trading plan

1.- The financial markets are not deterministic

A market is a strange place where you cannot predict an outcome. An engineer can design a bridge, knowing that he can predict the bridge’s strength and behavior under heavy loads with proper calculations.  In the financial markets, you don’t have the benefit of an analytical formula to success. All you can expect is a small edge. Not following your plan is comparable to random trading; thus, losing the edge.

2.- Not following a plan weakens you psychologically

When you buy a lottery ticket or play roulette, you’re entering a bounded game. You know the cost of your ticket, the reward associated with a successful bet, and you don’t need to make any other decision. All parameters of the play, including the exit time, are fixed.

The financial markets are different. Everything there is unrestricted. The trader decides when, how much, exit time, stops, and target levels.  With so many parameters, a trader needs to define his rules and stick to them. Otherwise, he will be shattered by his emotions and lose money.

3.- The need to measure

Traders need to record and analyze their trades for many reasons.  The first is the need to analyze their performance and see if it has improved or not. Also, if the system performs as expected or lags its past performance. The most important reason is that traders need to know the strategy’s main parameters: percentage of winners, reward/risk ratio, the average profit and its standard deviation.

A trading plan that fits you

New traders don’t know much about statistics, and trading is about odds and their properties. One of them is streaks. There are winning streaks and losing streaks. The point is, streaks are mathematically linked to the ods of the system.

Let’s think of a system as a loaded coin, in which the odds of a winner can be different from 50 percent. Let’s say the odds of a system is 60 percent instead.  That means there is a 60 percent chance the next trade is a winner, and, consequently, a 40 percent chance it is a loser.

But what are the odds of a loser after a previous losing trade (a two-losing streak)? For the second trade to be a loser, the first one should also be a loser.  So the odds of two consecutive losing trades in a row is 0.4 x 0.4 = 16%. The odds of three successive losers would be 0.4×0.4×0.4 =6.4%, and so on.

The general formula for the probability of a losing streak is

n-losing-Streak = prob_lossn

which is the probability of one loss to the power of n, the size of the losing streak.

What we have shown here is that streaks are inherent to trading. In fact, inherent to any event with uncertainty. Golf pros, football players, and spot teams are subject to streaks, which are entirely expected. Trading systems are no different.

So, what’s the problem?

There are a variety of trading systems. Some, such as the well-established Turtles Trading System, which is trend-following, have less than 38 percent winners, although with average reward/risk ratios over 5. Other systems show over 70 percent success but reward/risk ratios of less than 1.

The odds of a 10-losing streak on the Turtles system, assuming 38% winners or 62% losers, is about 0.84%. That means we can expect ten losers in a row every 120 trades.

On a 70% winner system, the odds for ten losers in a row are one every 200 thousand trades.

The rationale behind the turtle is to lose small and profit big. When a Turtle trader sees they are right, they add to their position, and on and on, following the trend.

People who use the later system are scalpers that jump for the small profit and get our fast before the movement fades.

Nobody is wrong. They trade what best fits their psychology. You need to know your limits, as well. Many wannabe traders move from system to system after only a five-losing streak, discarding a sound strategy when its first perfectly normal streak occurs. Also, most traders use sizes inconsistent with the expected streaks and lose their entire account.

By now, you should have learned the importance of having a plan that fits your psychology and trading tastes.

In the coming article, we will discuss the components of a trading strategy or system. Stay tuned!

Categories
Forex Course

206. The Correlation Between The Stock and Forex Markets

Introduction

The stock market encompasses individual stocks that create an index or a sector. An active under trader must define an approach to the equity as it differs depending on what she or he trades. When purchasing individual shares of an enterprise, some factors such as voting rights, dividend date, earnings per share, earnings releases, etc., play an important role.

The Relationship Between Forex and Stocks

The primary principles theory behind this is when there is an increase in the equity market rise. The demand for that particular currency also rises, resulting in more fund inflow from international investors. Additionally, it generates higher demand for the specific currency, leading it to rally instead of other foreign currencies.

On the other hand, when a local stock market does not perform well, this confidence lowers, resulting in investors to take their funds and put them somewhere safer and more lucrative.

Currency Correlation

Correlation is referred to as the measurement of the degree to which prices of two things have moved in a similar direction at the same time. For instance, if A and B prices always move up and down in sync, they have a correlation coefficient of 1, which implies an ideal positive correlation.

Contrarily if the value of these things moves simultaneously in the opposite direction, then their correlation coefficient is -1, which signifies a negative correlation.

Example – Correlation between Stock & Forex Markets

If the USA stock market performs well, international investors will sell their local currency to purchase USD-denominated stocks. When the demand for the dollar rises, it experiences an increase in value. In the Foreign exchange market, USD pairs will move in favor of the dollar ( i.e., The EURUSD falling, the USDCAD rising); hence a strong US stock market will favor the value of the US Dollar.

On the other hand, if the USA’s stock market is not performing well, investors will sell their USD-denominated shares and buy stocks or ETFs in places where they can generate more yield. This shows that the economy in the USA is performing badly. Since the demand for the dollar is less, it adversely affects the value of the US dollar.

Possibility Of Negative Correlation

There is also a possibility that the currency market will rise in answer to a volatile stock market. This may happen due to tons of other factors that contribute to currency performance. We will discuss more related to this topic in the upcoming course lessons.

Don’t forget to take the quiz below before you go. Cheers.

[wp_quiz id=”100352″]
Categories
Forex Elliott Wave Forex Market Analysis

Is US Dollar Index Ready for a Rally?

The US Dollar Index reveals exhaustion signals of its bearish trend. A trend that remains in progress since the currency basket topped at 102.992 pm mid-March 2020. Follow with us what signs show the Greenback to expect a rally during the first quarter of the year.

Technical Overview

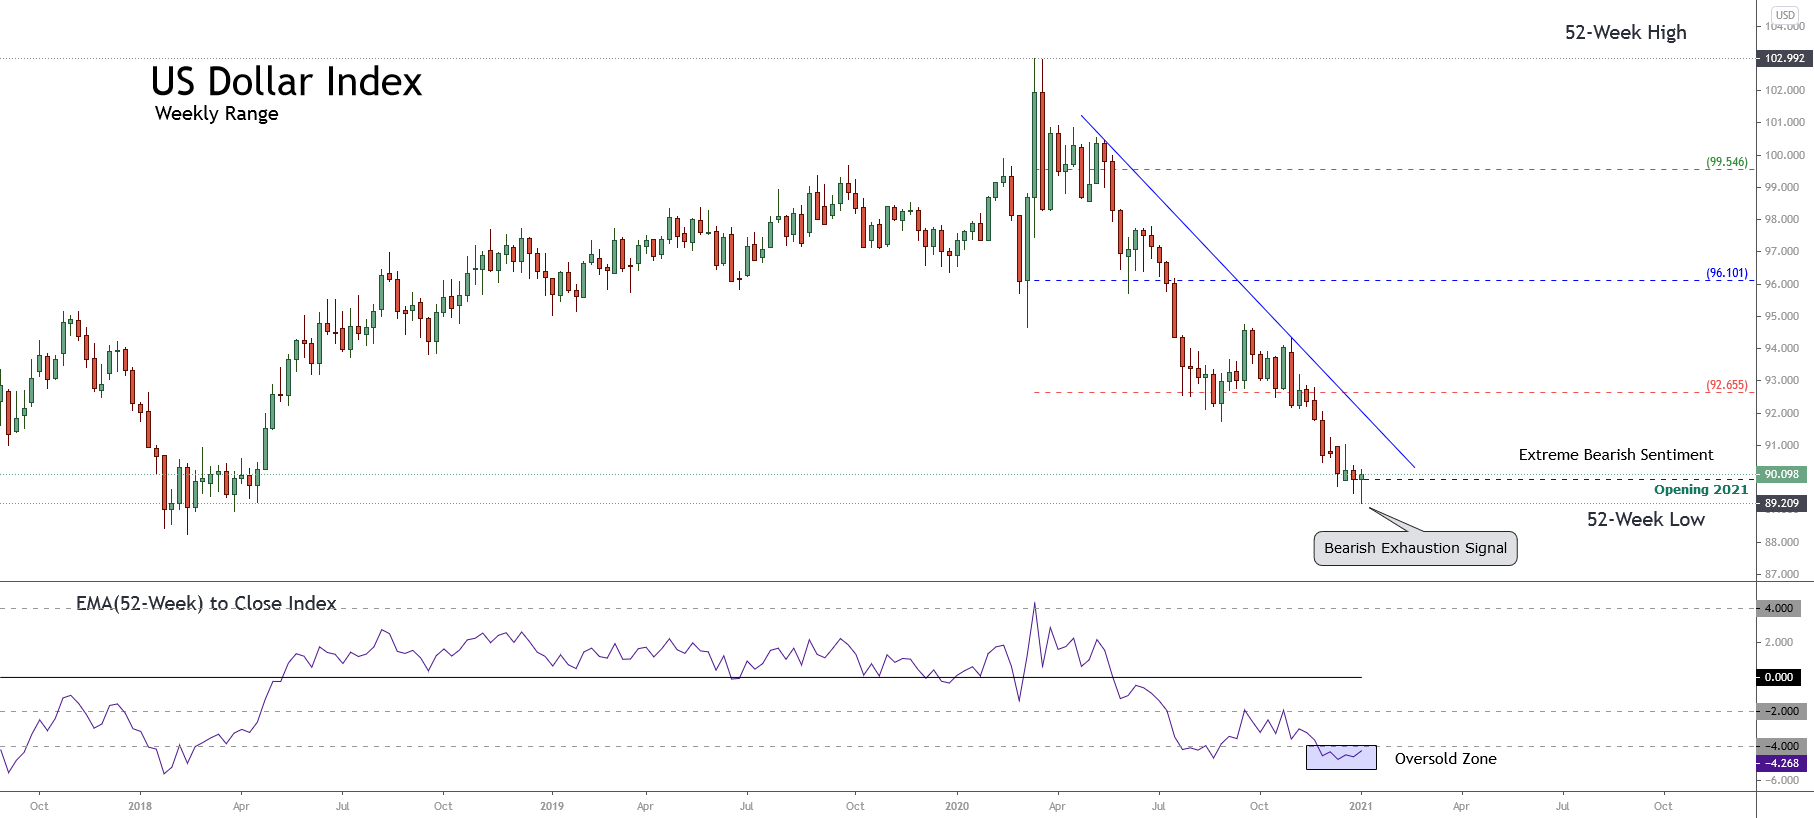
The big picture of the US Dollar Index (DXY) illustrated in the next weekly chart reveals the downtrend that remains active since the price found fresh sellers at 102.992 in mid-March 2020. The following figure also exposes the market participants’ sentiment represented by the 52-week high and low range.

The previous figure shows the extreme bearish sentiment dominating the big participants’ bias since mid-March 2020. Nevertheless, the long-tailed candlestick corresponding to the last trading week that was closed above the yearly opening, suggests the bearish trend’s exhaustion in progress.

On the other hand, the reading -4.26 observed in the EMA(52) to Close Index suggests the currency basket is oversold; thus, a potential corrective rally could occur in the coming weeks.

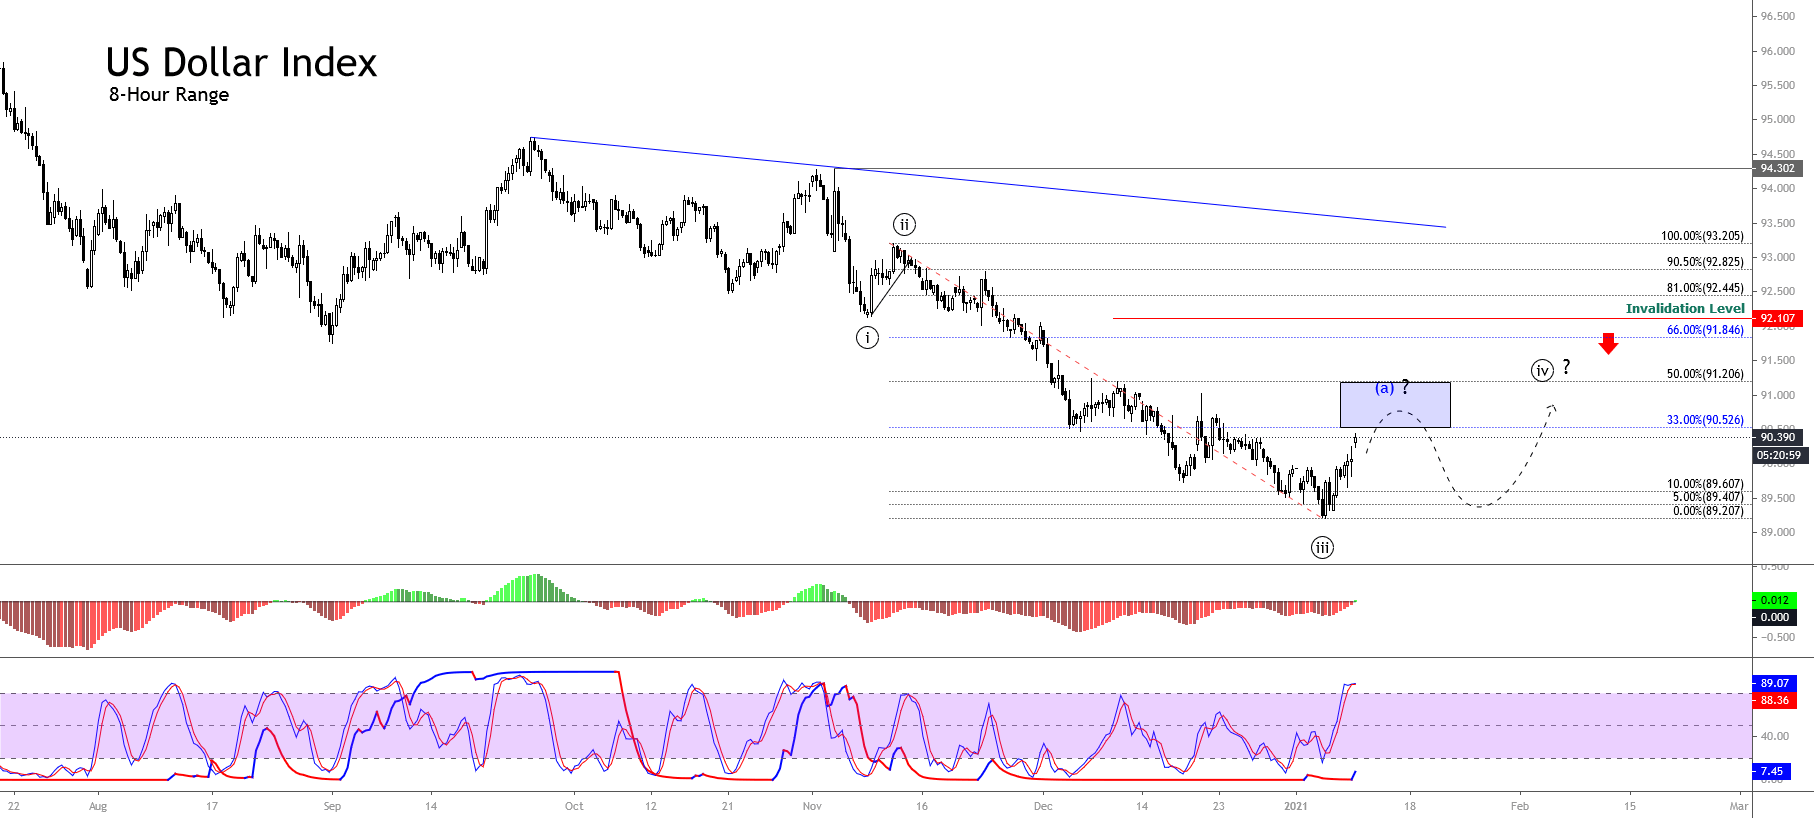
The mid-term Elliott wave view of the US Dollar Index exposed in the next 8-hour chart suggests completing an extended third wave of Minute degree labeled in black, when the price found support at 89.209 on January 06th.

Once the price found support, the price started to bounce, developing an incomplete wave (a) of Minuette degree identified in blue, which belongs to wave ((iv)) in black. Finally, the momentum and timing oscillator suggests that the bearish pressure persists, and the current upward movement could correspond to a corrective rally.

Technical Outlook

The mid-term outlook for the US Dollar Index unfolded in the next 8-hour chart shows the incomplete wave ((iv)) in black, which advances in wave (a) identified in blue. In this context, the current climb experienced by the Greenback could be a corrective rally.

According to Elliott Wave theory, the fourth wave in progress could retrace to 50% of wave ((iii)),  and reach 91.205. Likewise, considering that the second wave was a simple correction in terms of price and time, the current fourth wave should be complex in terms of price, time, or both. 

On the other hand, if the price extends beyond 50%, this could indicate weakness in the bearish pressure. If the price action advances above 92.107, the bearish scenario will be invalidated leading us to expect more upward movement.

In summary

The US Dollar Index completed a bearish third wave of Minute degree at 89.209 on January 06th, when it began to bounce, starting an upward corrective rally that remains in progress. The current intraday movement could reach 91.206 where the price could complete its wave (a) of Minuette degree labeled in blue. On the other hand, considering the alternation principle, the current corrective formation, the structure should be complex in terms of price, time, or both. Finally, the bearish scenario’s invalidation level locates at 92.107, corresponding to the end of wave ((i)) in black.

Categories
Beginners Forex Education Forex Basics

These Small Changes Will Make a Huge Difference in Your Profits

It’s no secret that every single forex trader wants to make as much money as possible, otherwise, what’s the point? Even if you’re already bringing in consistent profits, you might be surprised to learn that there are some very simple changes you can make to put more money in your pocket. If you’re a beginner, this could even be the difference between having a positive or negative profit ratio. Would you put in the effort to make the difference? 

Change #1: Use a Simple Trading System

It might seem like more complicated trading plans bring in more money. After all, these plans seemingly account for more factors and are more technical, so it’s easy to think that they’re better. In reality, simplicity is key to making consistent profits and avoiding all that unnecessary confusion. If you know what you’re doing, you’ll be less stressed and you won’t have to spend as much time in front of your computer screen, so this is definitely a win-win for everyone. If you’re currently using an overcomplicated plan, do yourself a favor and switch to a simpler version.

Change #2: Trade During the Best Times

Did you know that there are certain times when it’s better to trade? The best trading times occur whenever sessions overlap and things tend to heat up towards the middle of the week. Mondays and Friday evenings are slow, and nobody wants to trade on the weekends, so you should give yourself the much needed time off when there aren’t good trading opportunities. Other times to avoid trading? Major holidays and whenever big news is expected to be released. If you trade during the best times and avoid the worst ones, you’ll be able to profit more efficiently without making the mistake of trading in more volatile market environments. 

Change #3: Check Your Broker’s Costs

Whether you recently signed up with a broker or you’ve been using the same one for years, it’s a good idea to go back and check out their rates, then compare them with a few other options. You might find that switching to a new broker will save you a ton of money, plus, several new companies have probably opened up since you opened that old trading account. Say your broker charges a 5% withdrawal fee for withdrawing via card but you’re able to switch to a broker with no withdrawal fees. Or perhaps you could save 0.5% or more on the spread or commission charges. At the end of the day, these small changes will really add up and leave you with more of your money. Another added bonus is that your new broker may offer some extra perks like a deposit bonus that will add to your money when you switch over. 

Change #4: Limit the Pairs you Trade With

Some traders like to trade a variety of assets, which can be profitable, but it might be more helpful to stick with around three pairs so that you don’t have to keep up with as many factors affecting prices across different markets. If you’re able to focus more clearly on what you’re trading, your profits are bound to increase as you’ll avoid missing out on important news or becoming overwhelmed. 

Change #5: Make Smarter Leverage Choices

The more leverage you use, the more money you might make…or lose. If you’re looking to increase your profits, now is a good time to consider the leverage you’ve been using and to think about your profits. If you’ve been losing money, you might want to lower the leverage you’re using, as this will lower the amount of losses you take from losing trades. On the other hand, those that are making consistent profits might want to increase their leverage slightly, as these traders are more likely to benefit from doing so. Every now and then, you can increase your leverage in increments as long as your profits stay consistent. 

Change #6: Be Patient

Some traders have a difficult time sitting around without entering trades, especially after some time has passed. However, you shouldn’t trade for the sake of doing so. If the market isn’t throwing out any good opportunities, simply don’t trade. Otherwise, you run the risk of losing money on a trade when you could have opted not to trade at all. In times like these, remember to stick to your trading plan and know that the market will give you more opportunities later on. 

Change #7: Never Stop Learning

It’s easy to start thinking you know everything you need to once you’ve been trading for a while with consistent profits; however, you should never stop seeking out more trading knowledge. Learning about trading psychology and reading about different or new kinds of strategies are a couple of examples of topics you can look up, but you shouldn’t stop there. The more you know, the more chance you’ll have to increase your profits, and you might even find a better trading system along the way.

Categories
Forex Fundamental Analysis

EUR/CHF Global Macro Analysis – Part 3

EUR/CHF Exogenous Analysis

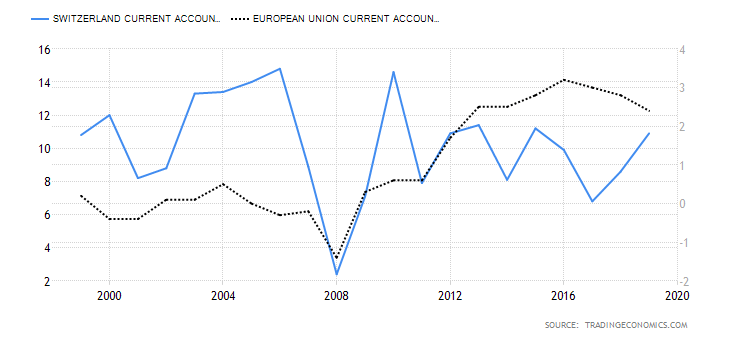
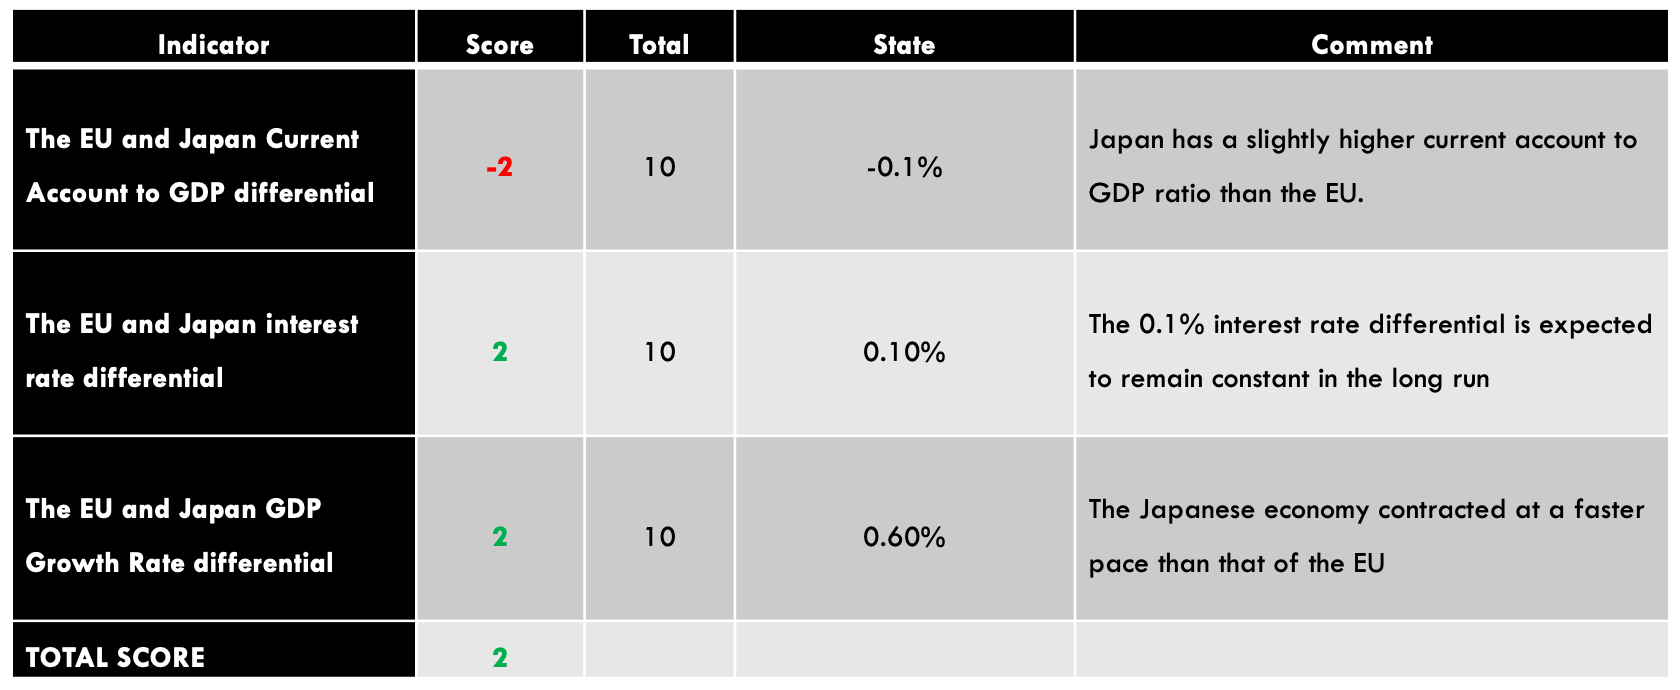
  • The EU and Switzerland Current Account to GDP differential

The ratio of the current account to GDP helps us determine the level of a country’s participation in the international market. When a country has net exports, it means that it will have a current account surplus; and, the larger the surplus, the higher the current account to GDP ratio. Conversely, a country with higher imports than exports; it means it has a current account deficit, and its current account to GDP ratio will be lower.

The domestic currency will be in higher demand in the forex market when a country is a net exporter.

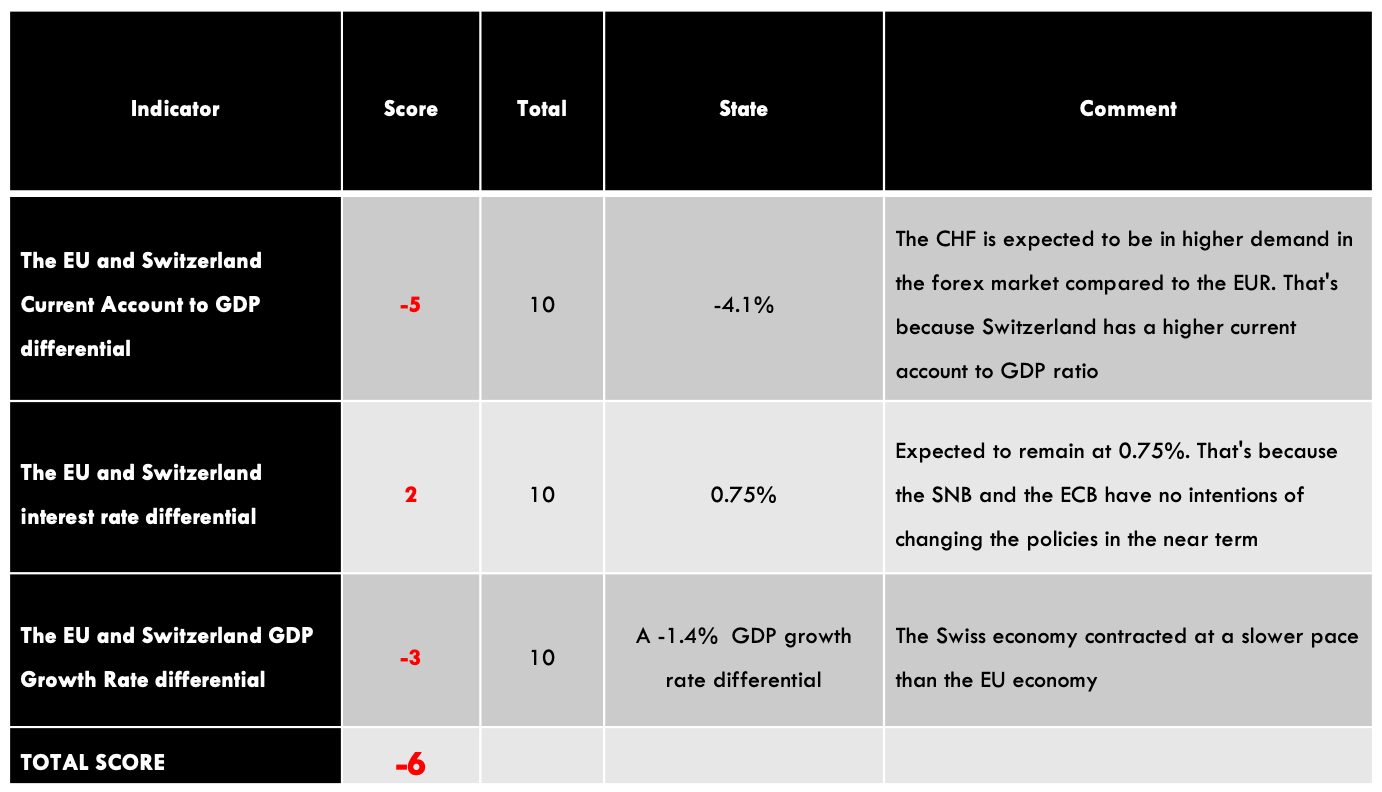
In 2020, the Swiss Current Account to GDP is projected to reach 7.5% and that of the EU 3.4%. Thus, the current account to GDP differential between the EU and Switzerland is -4.1%. That means we should expect that the CHF will be in higher demand than the EUR. Thus, we assign a score of -5.

The interest rate differential for the EUR/CHF pair determines which of these currencies is preferable to investors and carry traders in the forex market. When the interest rate differential is positive, it means that investors will earn more by buying the EUR. Similarly, carry traders will be bullish on the EUR/CHF pair, thus driving the exchange rate higher. A negative interest rate differential implies that the Swiss Franc will be preferable to investors, while carry traders will be bearish on the pair.

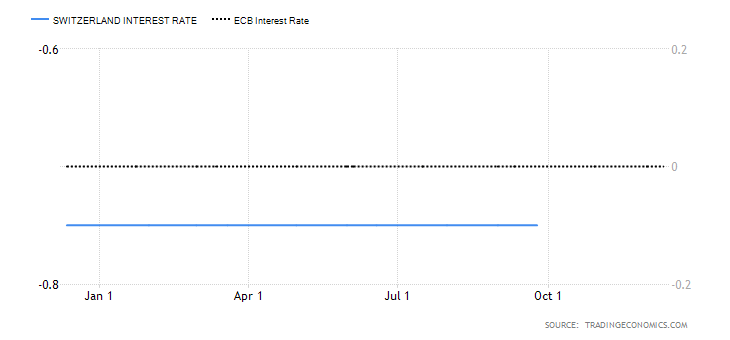
The Swiss National Bank has maintained the interest rate at -0.75% throughout 2020, and the ECB interest rate has been at 0%. The interest rate differential for the EUR/CHF pair is 0.75%. We assign a score of 2.

  • The EU and Switzerland GDP Growth Rate differential

The GDP growth differential is the difference between the rate at which the EU and the Swiss economy are growing. This will help us identify which economy is growing faster. A positive GDP growth differential between the EU and Switzerland will result in a higher exchange rate for the EUR/CHF pair. A negative one will lead to a drop in the exchange rate for the pair.

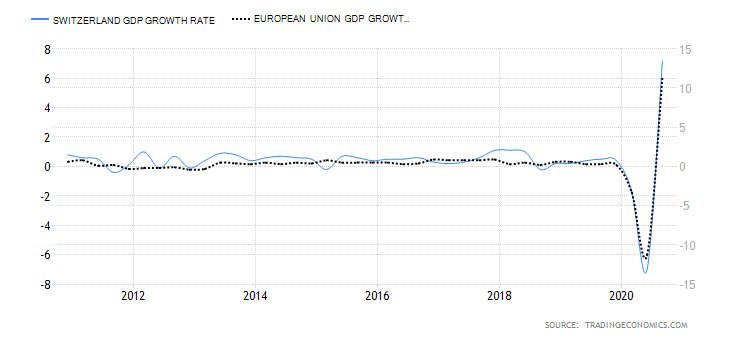
In the first three quarters of 2020, the EU economy has contracted by 2.9% while the Swiss economy contracted by 1.5%. The GDP growth rate differential is -1.4%. We assign a score of -3.

Conclusion

The exogenous factors between the EUR/CHF pair have a score of -6; which implies that the pair can be expected to be on a downtrend in the short term.

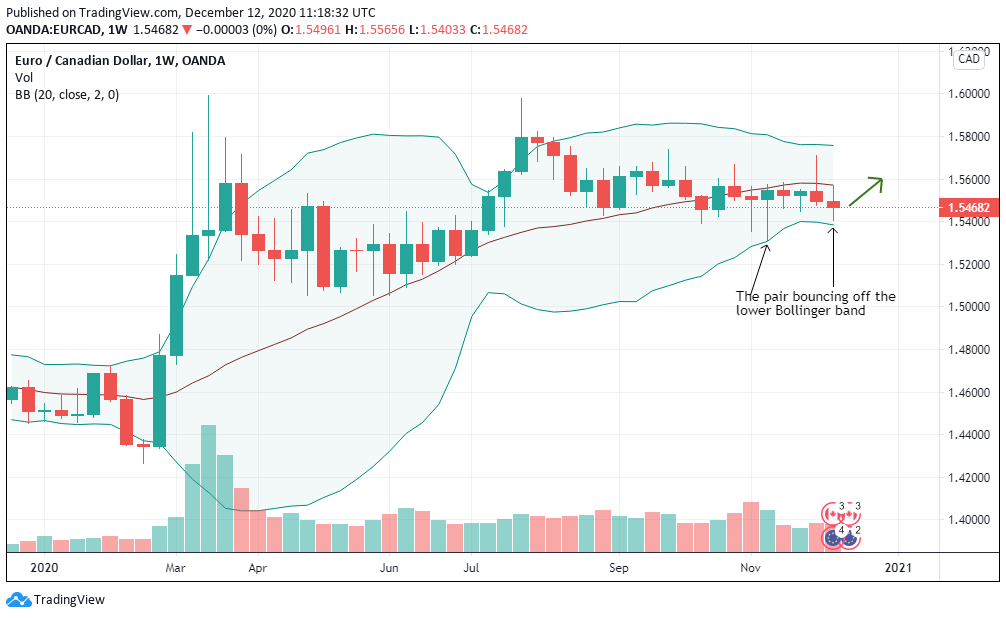
As you can see above, the Technical analysis shows that the weekly chart for the EUR/CHF pair has failed to breach the upper Bollinger band successfully and has bounced off of it supporting our fundamental analysis. All the best.

Categories
Beginners Forex Education Forex Basics

Tips for Avoiding Forex Burnout

Has forex trading left you feeling tired, frustrated, and just plain burnt out lately? Some might be under the impression that trading is an easy job. After all, you just sit in front of your computer, make a few trades, and sit back while the money comes in, right? True forex traders know that this is far from the truth. The reality is that trading can actually become quite stressful once the constant risk, undesirable market conditions, overtrading, pressures to succeed, and failing to meet your own expectations all set in. Add a string of losses to the mixture and you’ll find yourself with one stressed out trader. 

Experiencing mental burnout is something that nobody wants to deal with, but it can be especially harmful when it happens to forex traders. This is because we need to be awake and alert so that we can make the smartest financial decisions. Once we become tired and frustrated, our cloudy head might lead us to overlook things, enter trades we shouldn’t or leave trades open too long, overtrade, practice revenge trading when we’re losing – you get the picture. Think about the things you were told when it was time to take a test in grammar school. You were advised to get plenty of rest, eat a big breakfast, and show up feeling energized to get the best results. Are you treating yourself the same way as a forex trader

Step 1: Recognizing Burnout

Mental burnout is not something that will hit you right off the bat once you start trading. In fact, you might be able to go a long time without experiencing it. This is because it is something that sets in over time once a variety of stressful factors start to pile up on you. Did you know that some of the signs that you’re burnt out can even be physical, rather than only mental? If you want to avoid becoming a total trading zombie, you can start by recognizing the signs and symptoms of mental burnout:

  • You’ve started to deviate from your trading plan and no longer care about your trading rules.
  • You’re experiencing headaches or other physical symptoms like muscle aches or generally just feeling sick with no real explanation.
  • You’re falling into a depression that leaves you tired and unmotivated.
  • You become frustrated at everyone and everything for no real reason, both in everyday life and while trading.
  • You begin to doubt your abilities as a forex trader, even though you’ve been successful before.
  • You just don’t care much about trading anymore and you consider giving up despite past success.

If this sounds familiar, you are probably already dealing with mental burnout as a forex trader. Fortunately, there are some things you can do to get your head back in the game and to overcome those debilitating symptoms.

Step 2:  Take Yourself Back to the Beginning

Do you remember how you felt when you opened your very first trading account? Were you an eager, starry-eyed beginner that had big plans and dreams? Try to take yourself back to those feelings. Think of the way you felt the first time you entered a trade, made money, and when you made your first withdrawal. Over time, trading probably became a habit and you no longer felt the excitement from those little things, but this doesn’t mean that you can’t renew your happiness with trading. Every dollar made is worth celebrating, so give yourself some credit for coming so far and try to soak in the small victories. 

Step 3: Find Other Traders to Confide In

If you’re dealing with trading burnout alone, it only makes it that much more overwhelming. Having other traders to talk to who can say they’ve also been there and give you advice about how they overcame it is a great way to remind yourself that you aren’t the only trader that has experienced this. It can also be reassuring to talk with someone else that has experienced physical symptoms from the stress because you may feel more validated. If you confirm that this is happening to others and they’ve overcome it, then you may feel more confident that you can pull yourself out of the slump too.

If you personally know someone that trades, you should ask them if they’d like to get together and become trading buddies. Don’t worry if you don’t know anyone in person because there are online forums and communities designed just for this purpose. You shouldn’t have an issue finding one (or more) traders that relate to the way your feeling and your trading style. You can probably even find a more experienced trader that will also give you great advice that goes above and beyond dealing with trading burnout. 

Step 4: Relax and Refresh

Whenever you’re dealing with stress from forex trading or anything else going on in your life, the best thing to do is take some time for yourself to unwind. Of course, this looks different for everyone. Some of us would prefer to sleep in or take a nap, relax on the couch, and maybe watch a movie. Others might be more into exercising or partaking in yoga or meditational activities. Sometimes, a night out can really do the trick, so consider treating yourself to a nice dinner, heading to the movies, or doing anything else you find fun. The key is to find something that you really enjoy doing and to do it often enough to keep yourself calm. If you start to feel stressed, simply take a break from trading, unwind, and come back with a clear head and zero frustration. It might seem unproductive to stop trading, but you will find that you get better results because you won’t be making trading decisions out of sheer frustration. 

Categories
Forex Fundamental Analysis

EUR/CHF Global Macro Analysis – Part 1 & 2

Introduction

In conducting the global macro analysis of the EUR/CHF pair, we’ll focus on endogenous economic factors that contribute to the growth of GDP in the EU and Switzerland. Exogenous factors that influence the exchange rate of the EUR/CHF in the forex market will also be analysed.

Ranking Scale

A sliding scale of -10 to +10 will be used to rank the impact of endogenous and exogenous factors.

The ranking of the endogenous factors will be based on their correlation analysis with the GDP growth rate. A negative score implies that they resulted in the contraction of the economy hence depreciating the domestic currency. A positive score implies that they led in economic expansion hence appreciation of the domestic currency.

The exogenous factors are ranked based on their correlation with the EUR/CHF exchange rate. A positive score means that the pair lead to an increase in the exchange rate, while a negative ranking means that the exchange rate has decreased.

EUR Endogenous Analysis – Summary

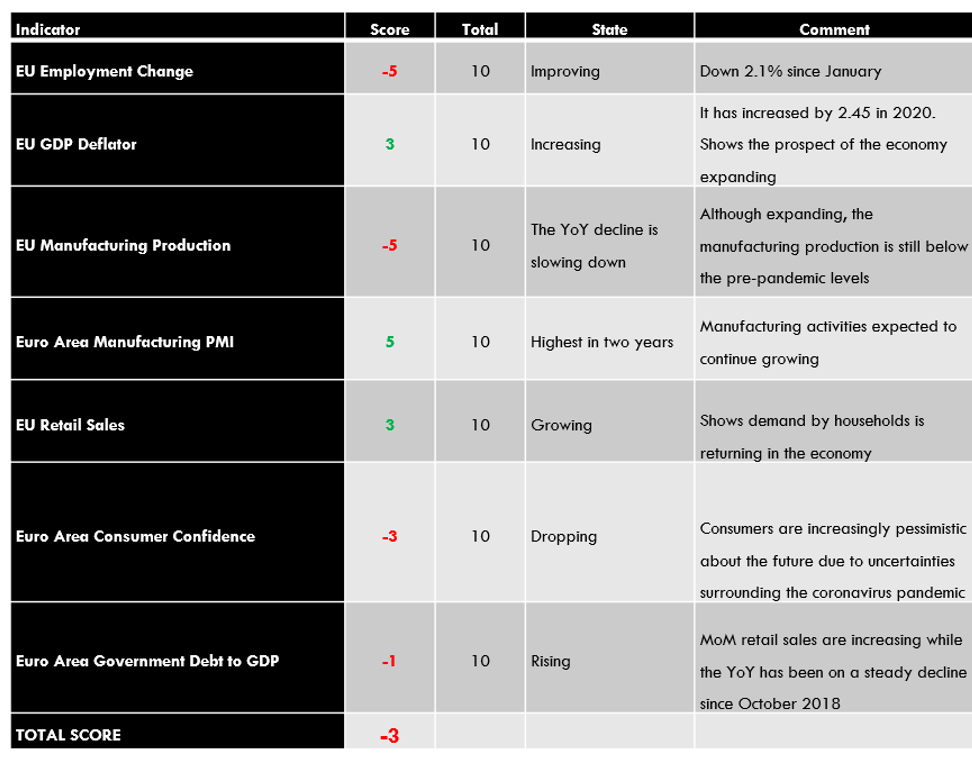
The EUR’s endogenous analysis has a score of -3. This implies that the Euro had marginally depreciated in 2020.

CHF Endogenous Analysis – Summary

The change in the level of employment covers the quarterly developments in the labour market in Switzerland. The statistic includes the changes in both fulltime and parttime employment. Typically, changes in employment is a result of changes in business activities.

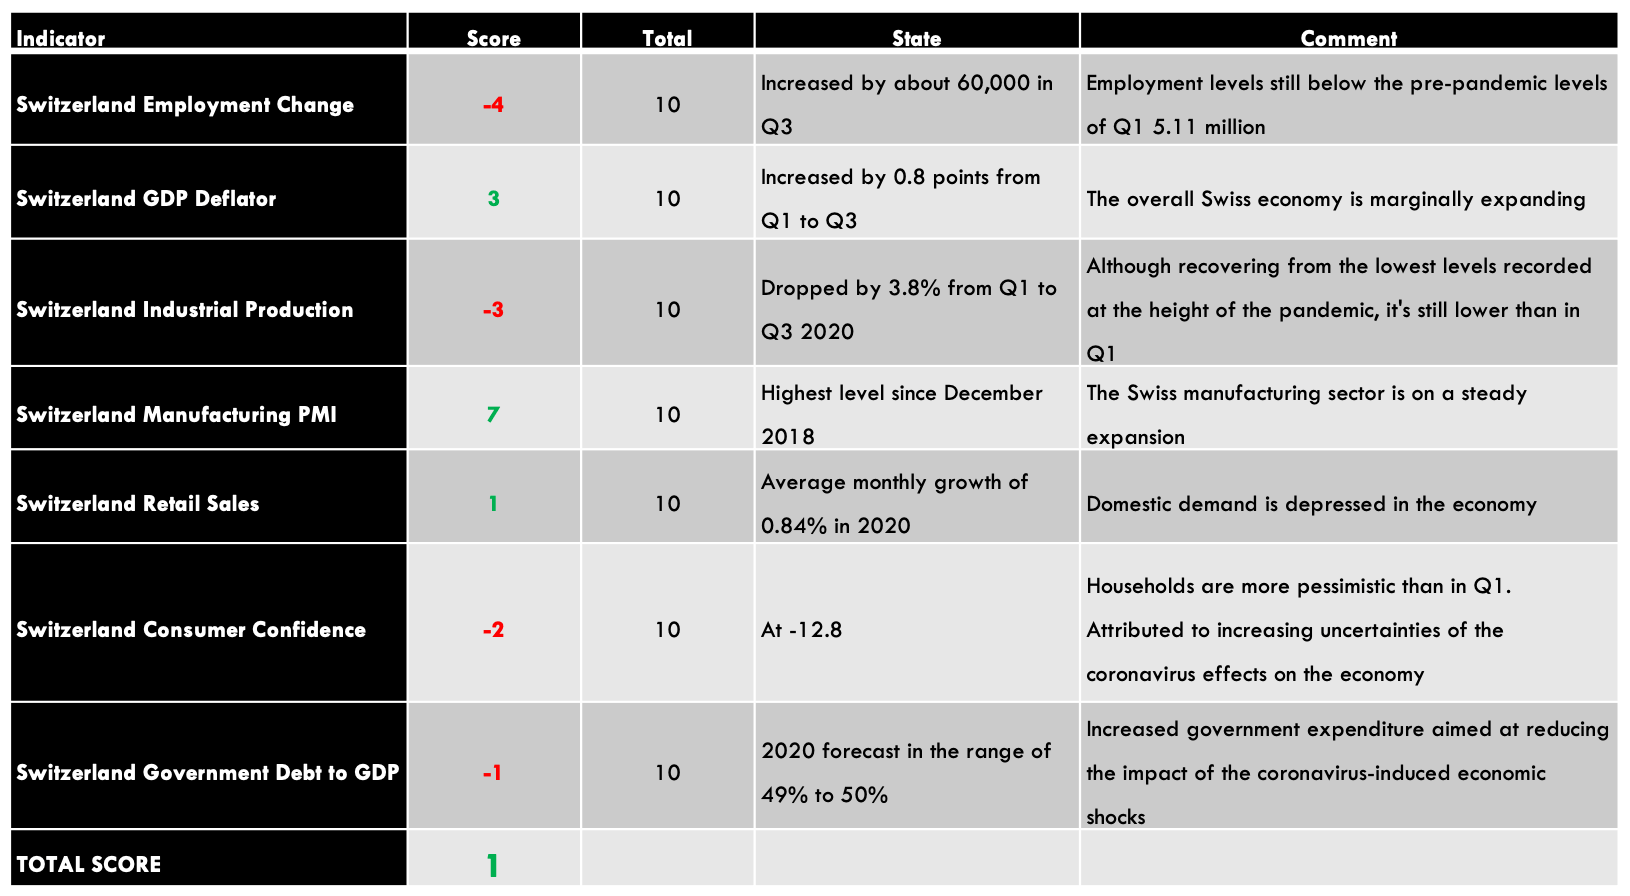
In Q3 of 2020, 5.08 million people were employed in Switzerland compared to 5.02 million in Q2. The employment level is still below the 5.11 million registered in Q1. We assign a score of -4.

  • Switzerland GDP Deflator

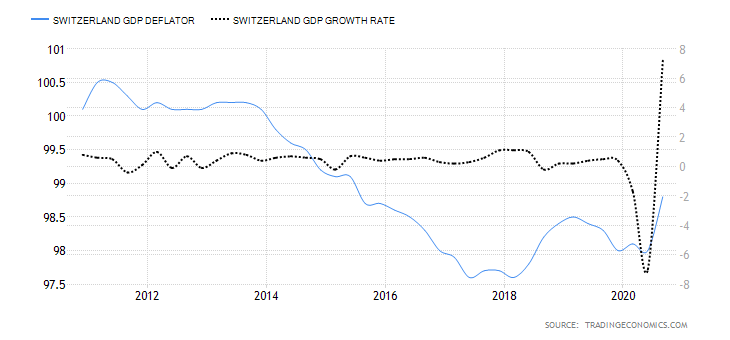
Switzerland GDP deflator is used to calculate the change in real GDP in terms of prices of all goods and services produced within the country. This is a comprehensive measure of inflation compared to measures like CPI and PPI, which only focus on a small portion of the economy.

In Q3 2020, Switzerland GDP deflator rose to 98.8 from 98 in Q2.  Up to Q3, the GDP deflator has increased by 0.8 points. The increase in inflation can be taken as an indicator that the economy is bouncing back from the economic shocks of the coronavirus pandemic. We assign a score of 3.

  • Switzerland Industrial Production

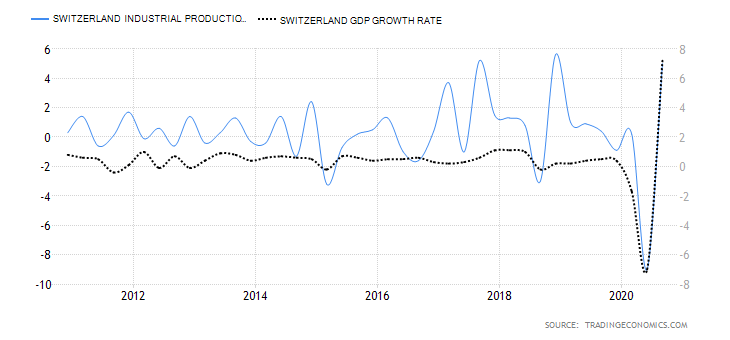
This indicator shows the changes in output for firms operating in the manufacturing, mining, quarrying, and electricity production. Although Switzerland is not heavily dependent on industrial production, it is still an integral part of the economy.

In Q3 2020, the industrial production in Switzerland increased by 5% from a drop of 9% in Q2. The YoY industrial production for Q3 was down 5.1%. For the first three quarters of 2020, the industrial production is down 3.8%. We assign a score of -3.

  • Switzerland Manufacturing PMI

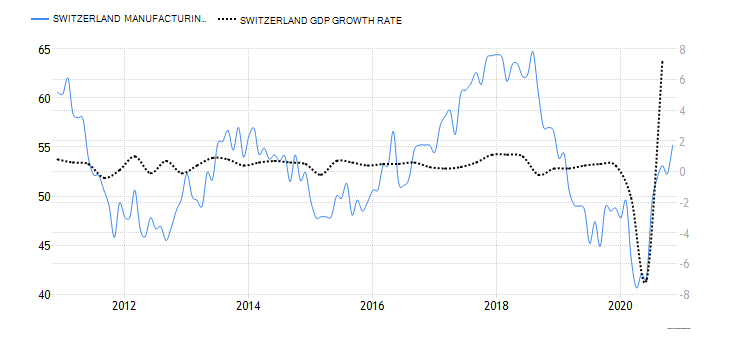
This is an indicator of the economic health of the Swiss manufacturing sector. The purchasing managers are surveyed based in a questionnaire which covers the output in the sector, suppliers’ deliveries, inventories, new orders, prices, and employment. A PMI of above 50 shows that the Swiss manufacturing sector is expanding, while below 50 shows that the sector is contracting.

In November 2020, Switzerland manufacturing PMI rose to 55.2 from 52.3 in October. This is the highest reading since December 2018 and the fourth consecutive month of expansion since July. We assign a score of 7.

  • Switzerland Retail Sales

The retail sales measure the consumption of final goods and services by households in Switzerland. The expenditure by households drives the aggregate demand in the economy, which results in the changes in GDP.

In October 2020, Switzerland retail sales increased by 3.2% from a drop of 3.2% in September. YoY retail sales increased by 3.1% in October from 0.4% in September. Up to October 2020, the average retail sales has increased by 0.84%. We assign a score of 1.

  • Switzerland Consumer Confidence

About 1000 Swiss households are surveyed in January, April, July and October. They are evaluated based on their opinions about the economy, job security, financial status, inflation, and purchases. Consumer confidence tends to be higher when the economy is expanding and low during recessions.

In Q4 2020, the Swiss consumer confidence dropped to -12.8 from 12 in Q3. Although it is higher than it was in Q2 at the height of the pandemic, it is still lower than in Q1. The expectations on households’ financial situation also dropped to -6.6 from -4.2 in Q2. Households were increasingly pessimistic about the labour market and their job security. this can be attributed to the uncertainties that surround the ongoing coronavirus pandemic. We assign a score of -2.

  • Switzerland Government Gross Debt to GDP

This is the total amount that the Swiss government owes to both domestic and international lenders is expressed as a percentage of the GDP. It helps us to understand and evaluate the size of the debt relative to the size of the economy. At below 60%, the government is seen as being able to service its debt obligations and have room to acquire more debt without straining the economy.

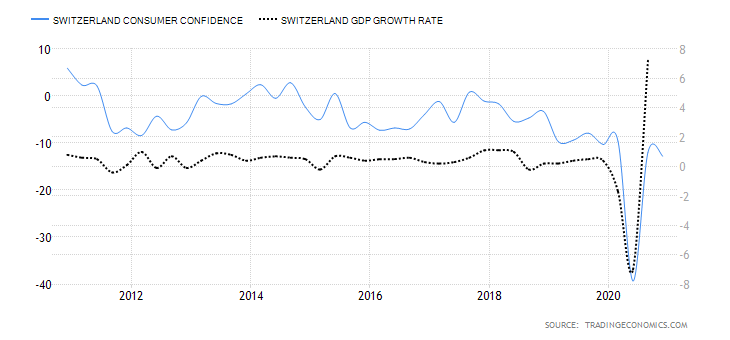
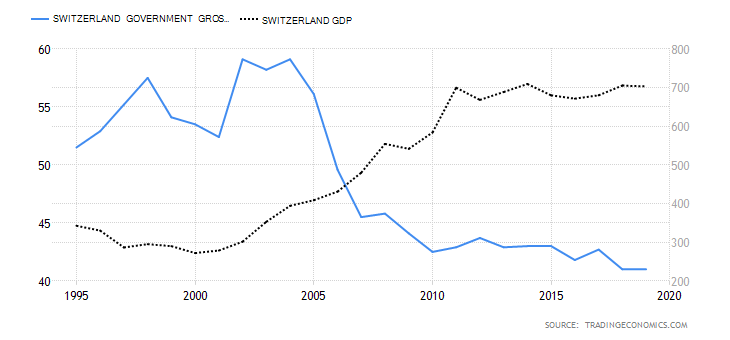
In 2019, the Switzerland government gross debt to GDP was 41% same as in 2018. In 2020, it is expected to range between 49% and 51% due to aggressive expenditure to alleviate the shocks of coronavirus pandemic. We assign a score of -1.

In the very next article, you can find the exogenous analysis of the EUR/CHF Forex pair. Please check that and let us know if you have any questions below. Cheers.

Categories
Forex Basics Forex Daily Topic

The Trading Log: Key Component for a Pro Trader

At forex.academy, we understand that a trading record is a decisive component to be successful in Forex. That’s why we took the time to create a free trading log on an Excel Spreadsheet. It was designed to present all the needed information at a glance. Here we present its guide.

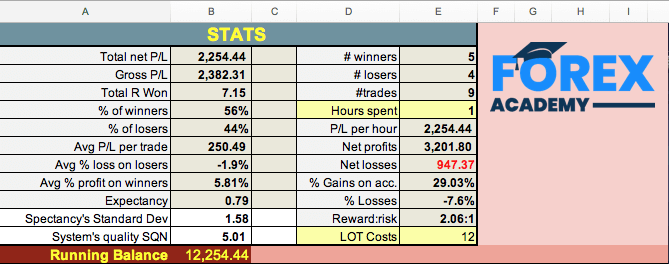
The Stats Section

The top of the spreadsheet shows the Main statistics of your trading record. 

Total net P/L: The net profits after the trading costs. You can set an average cost in the bottom right cell named “LOT Costs”. If you enter the lot cost, the sheet will compute every trade cost by multiplying it by the actual lots of the trade. Of course, you can set it manually on every trade with the exact costs your broker charged.

Gross P/L: The total profit without costs.

Total R won. R is the measure of your risk. The “R multiple” column converts the net profit into a ratio Net Profit/$Risk. R is a measure of the profit/loss for every dollar risked.  This helps you plan your objectives and calculate the risk needed to achieve them. For example, if you find that you are making 20R per month and plan to earn 3000$ monthly, you will need to risk $3000/20 = $150 on every trade.

% Winners: The winner percent figure.

% Losers: The percent of losers

AVG P/L per Trade: The average dollar won/lost. It is the Total net won/lost divided by the number of trades.

Avg % loss on losers: The average percent capital lost on losing trades.

Avg % profit on winners: The average percent capital won on winning trades.

Expectancy: A measure of what you can expect to gain in the next trade for every dollar risked. The example shown is 0.79, which means you can expect to earn $79 every time you trade if your risk is $100.

Expectancy’s Standard Dev: A statistical measure of the variability of the expectancy figure. You can expect that 95% of  Expectancy’s values are plus and minus two stdev from 0.79.

#winners: The number of winners.

#losers: the number of losers.

Hours Spent: this is a manual input of your time spent in trading.

P/L per hour: It will compute your profit per hour spent in trading.

Net Profits: These are the net profits on winning trades.

Net Losses: The losses on losing trades.

% Gains on account: The total sum of the percent gained on winning trades.

% Losses: The sum of the percent lost on losing trades.

Reward:risk: The average reward/risk of your trades.

LOT Costs: This is a manual entry for the average costs per lot your broker charges you.

Running Balance: The initial capital ( Cell B17) plus the total net P/L amount (on closed trades).  Please note that this balance does not take into account open trades.

Total costs: The sum of the cost of spreads and commissions of your trades. This parameter will help you understand how much of your money goes to your broker. It could be handy if you want to negotiate rebates or shift your business to another cheaper broker.

The trades

The cells in columns with a yellow heading are for you to enter manually. The rest were filled with the needed formulas to get the stats figures, so there is no need to touch them when trading.

The exception is The Trade Cost column. This column is also filled with the formula to approximate your costs if you supply the average cost per lot in the B12 cell. But you can also manually enter your true cost.

Entering a Trade

We have designed the sheet so that you have total control over your risk on every trade. Therefore, we should begin to enter the desired percent risk for the coming trade. Let’s say 1%.  With this figure, the sheet computes the dollar-risk based on your current account balance.

After entering the entry price and stop-loss level, it will also compute the recommended trade size in lots. You should then input the real lot number in the following column, “Real lots.” It was designed that way because we must take into account several open trades at the same time.

How the sheet computes the risk of the next trade?

When allowing several simultaneous trades, the model chosen to compute risk is to subtract the risk of the previous open trades to the available capital. That way, you risk a percent of the money not currently at risk.  But when you close a trade and record it, the sheet recalculates all cells. Thus, the sheet needs the “Real Lots” column, so the record does not get modified every time an open trade is closed.

After the trader decides the percent of his account to risk on a trade, the real lot size, and the entry and stop-loss point are set, the sheet also shows the leverage of that trade. That way, all the risk information is displayed. Please, beware that a risk of 3 percent corresponds with a leverage of 10, and that leverages over 10:1 should be avoided, especially when several trades are open on major currency pairs.

JPY pairs

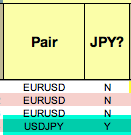
The column JPY? was added for the right calculation of JPY pairs’ values, as these pairs’ pip value is in the second decimal place instead of in the fourth decimal. You should input Y on these pairs to get the right trade size, profit, and leverage. Please, note that pip values on non-USD quote currencies are approximate.

Entry and exit date and time

These are optional entries, but it is advisable to register these values to get observations about the average time on a trade and the average time for a trade to hit stop-loss and take-profit levels.

Trading results

Once the Exit price has been entered, the sheet displays the profit/loss (P/L), Net P/L, %P/L and R multiple of the trade. This will help assess essential parameters, such as the average Trade profit, the usual percent obtained, and the real reward/risk values (R), which is also the profit on a one-dollar risk.

Trade quality

Alexander Elder recommends traders value the quality of the trade based on one objective parameter: The percentage of the available profit you could obtain from the trade.

One possible scale is 0: less than 10%, 1: from 10 to 25%, 2: from 25, to 50%, 3: from 50 to 75% 4: from 75 to 90%  5: over 90%. This will help you see if, over time, you’re improving, maintain, or decrease the quality of your trades. It will reveal the best times of the session to trade.

MAE/MFE

These are to annotate the Maximum adverse excursion and Maximum Favorable excursion. These two parameters are important clues to improve stop-loss and take-profit levels. It will help you also analyze if your entries are too early or too late and take measures to correct them. For more on this subject, please read an MAE/MFE explanation here.

Summarizing

We hope this spreadsheet will help you be a better trader. Please modify and complete it at will for your purposes.  This trading log is not perfect, but it is a starting point.

Categories
Forex Signals

AUD/USD Violates Ascending Triangle – Double Bottom Support! 

The AUD/USD closed at 0.77665 after placing a high of 0.77984 and a low of 0.77280. The currency pair AUD/USD remained flat throughout the day on Friday and closed its day at the same level it began its day with as the risk rally pushed the pair higher and the US dollar strength dragged the pair AUD/USD lower at the same time. 

The risk-sensitive Aussie just went with the flow and boosted by rallying equities and persistent hopes that the economic chaos triggered by the coronavirus pandemic was on its final stage. The risk sentiment in the market was also supported by the latest announcement from the UK on Friday. The UK announced that it’s medical regulatory has approved a third vaccine for coronavirus made by Moderna for emergency use authorization. 

The rising risk sentiment was also supported by the decreasing political risk in Washington related to power transition. The US President Donald Trump has agreed to a transition of power, and this has raised the risk sentiment in the market and supported the upward momentum in AUD/USD pair in the early trading session. However, the AUD/USD pair’s gains were lost in the late trading hours on Friday after the US Dollar became strong across the board. The greenback was high on Friday, with the US Dollar Index above the 90.00 level for the first time this week. The US treasury yields on the 10-year note were also high on Friday, with 3% up for the day and 21% up for the week. All these factors added to the US dollar demand that ultimately weighed on AUD/USD pair and forced the pair to lose its early daily gains.

On the data front, from the US side, at 18:30 GMT, the Average Hourly Earnings for December raised to 0.8% against the predicted 0.2% and supported the US dollar that added further weight to AUD/USD pair. In December, the Non-Farm Employment Change plunged to -140K against the predicted 60K and weighed on the US dollar. During December, the Unemployment Rate plunged to 6.7% against the predicted 6.8% and supported the US dollar that added further AUD/USD pair losses. At 20:00 GMT, the Final Wholesales Inventories for November came in as 0.0% against the predicted -0.1% and weighed on the US dollar.

The AUD/USD pair remained flat throughout Friday amid the mixed market sentiment and left the investors to await the publication of the final reading of November Retail Sales from Australia while China will provide an update on inflation that will also remain under close observation by AUD/USD investors. 

On Thursday, China will release its December Trade Balance that may also impact AUD/USD pair. The US’s CPI data on Wednesday and Retail Sales on Thursday will also affect the AUD/USD pair’s momentum in upcoming days.


Daily Technical Levels

Support Resistance

0.7700 0.7755

0.7679 0.7789

0.7645 0.7811

Pivot point: 0.7734

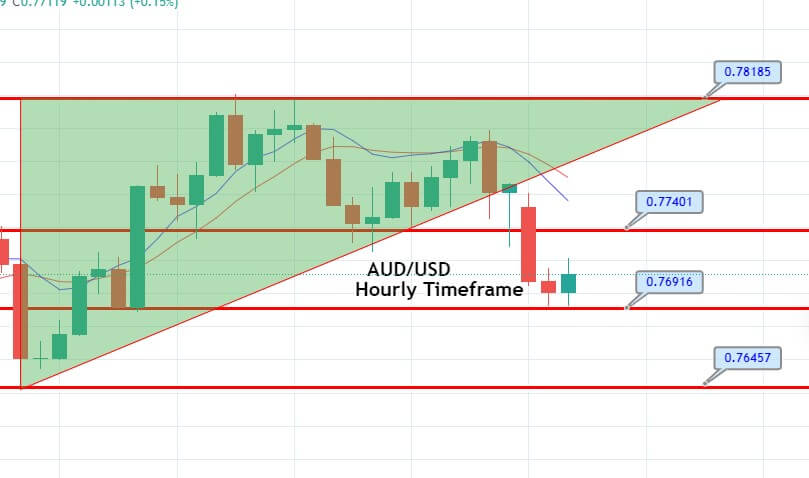
The AUD/USD pair has bounced off over the 0.7690 level, forming a bullish engulfing candle on the 2-hour timeframe. It may bounce off to trade until the 0.7740 level, where 10 & 20 periods EMA are likely to extend resistance at 0.7740. On the lower side, the AUD/USD may find support at the 0.7690 level. A bearish breakout of 0.7690 level can extend the selling trend until the next support area of 0.765 level today. Good luck! 

Categories
Forex Course

205. How Global Equity Markets Affect The Forex Market?

Introduction

The equity market is also referred to as the stock or share markets. This is an extensive marketplace where traders and investors purchase and sell shares of the publicly listed organizations. The company’s share, stock, or equity is an important financial instrument that denotes the company’s ownership. Contrary to the market, when you buy a share in the stock market, you own a percentage of the company’s overall shares.

Global equity markets have a direct impact on the Forex market. A stable equity market reflects a good currency. Generally, when the country’s equity market is performing well, it attracts higher foreign investors. Therefore, it increases the demand for the local currency, resulting in a boost in a positive trade balance as well as currency appreciation.

Contrarily, when the equity market is not performing well, the investors begin to pull out their money and invest in safer securities. This results in a decrease in the demand for a particular currency.

Impact Of Global Equity Markets On The Forex Market

Forex and equity markets trades center on the currency exchanges of various countries. In case there is a rise in the equity market, more international investors will want to put their money in that particular stock.

However, to do the same, they need to transfer their local currency to the currency of a particular country. This increases the currency demand for the nation. So when there is a huge demand for the currency, its value naturally increases in the market.

Example Of How The Equity Markets Impact Forex Market

If you are looking to invest in the UK’s stock market and your local currency is US dollars. So you need first to change the USD to GBP. This way, you are selling the US dollar while purchasing the GBP.

When more people sell the USD to buy GBP, it increases the demand for pounds, thereby boosting the value of the GBP. Additionally, it also contributes to a positive trade balance. On the other hand, since more US dollars are being sold, it increases the supply of USD, which results in a fall in the value of the dollar.

So when the demand for the currency rises, its value appreciates. This makes the forex market more bullish. Similarly, if the currency demand falls, its value will also fall. It will make the forex market more bearish.

We hope you got the gist of what we are talking about. In the upcoming course lessons, we will be learning more about various equity markets and how their movement can be used to predict the Forex price charts. Cheers.

[wp_quiz id=”101514″]
Categories
Forex Market Analysis

Daily F.X. Analysis, January 11 – Top Trade Setups In Forex – Stronger Dollar In Play! 

On the news side, the European Sentix Investor Confidence will be in focus, along with speeches from UK MPC Member Tenreyro, and the U.S. FOMC Member Bostic will remain in highlights. The U.S. dollar was also strong on the board, mainly because of the rising U.S. treasury yields that rose more than 3% on the day. The unemployment rate and average hourly earnings data from the U.S. support the greenback. 

Economic Events to Watch Today  


EUR/USD – Daily Analysis

The EUR/USD pair was closed at 1.22122 after placing a high of 1.22844 and a low of 1.21928. The EUR/USD pair dropped on Friday and extended its losses amid the broad-based strength of the U.S. dollar on the day amid the rising U.S. Treasury yields.

The U.S. dollar was also strong on the board, mainly because of the rising U.S. treasury yields that rose more than 3% on the day. The unemployment rate and Average Hourly earnings data from the U.S. also supported the greenback that ultimately added further losses in the currency pair EUR/USD. From the U.S. side, at 18:30 GMT, the Average Hourly Earnings for December rose to 0.8% against the forecasted 0.2% and supported the U.S. dollar and weighed on EUR/USD prices. In December, the Non-Farm Employment Change fell to -140K against the forecasted 60K and weighed on the U.S. dollar and capped further losses in EUR/USD pair. 

During December, the Unemployment Rate fell to 6.7% against the forecasted 6.8% and supported the U.S. dollar that added further EUR/USD pair losses. At 20:00 GMT, the Final Wholesales Inventories for November came in as 0.0% against the forecasted -0.1% and weighed on the U.S. dollar that limited the losses in EUR/USD pair on Friday.

Meanwhile, the fact that Democratic leader and incoming President Joe Biden will have complete control over all three legislative houses included the White House, the House of Representatives, and the Senate, also supported the U.S. dollar as it suggested a stable government ahead. The U.S. President Donald Trump also agreed to an orderly transition of power that also lifted the lingering political risk from the local currency and gave further strength to the U.S. dollar that ultimately added further pressure on the EUR/USD pair on Friday.

Daily Technical Levels

Support   Resistance

1.2228     1.2330

1.2186     1.2388

1.2127     1.2431

Pivot Point: 1.2287

EUR/USD– Trading Tip

The strength in the U.S. dollar also dragged the EUR/USD pair lower to the 1.2175 level. For the moment, the EUR/USD is gaining support at the 1.2175 level, and below this, it can dip further until the 1.2130 level. On the higher side, the pair may face resistance at the 1.2216 level. The RSI and MACD support bullish correction, and these may cause a bounce off in the EUR/USD pair until the 1.2216 level. Below 1.2216, we can again see a dip in EUR/USD.


GBP/USD – Daily Analysis

The GBP/USD pair was closed at 1.35606 after placing a high of 1.36356 and a low of 1.35382. The currency pair GBP/USD remained flat throughout Friday as it showed no movement and closed the day at the same level it started its day with. The pair GBP/USD raised during the early trading session on the day but faced some heavy pressure during the second half of the day and closed the trading week at the same level it started its day on Friday. The rise in the early trading session was caused after the U.K. announced the approval to use its third coronavirus vaccine. However, the downward pressure on the currency pair was caused by the relative strength of the U.S. dollar amid the rising U.S. Treasury yields on the day.

After the coronavirus press conference of the British Prime Minister Boris Johnson on Friday, the PM announced that the army would be brought in to help aid the vaccination rollout. On Friday, Britain’s medical regulatory approved Moderna’s coronavirus vaccine for emergency use. The U.K. also agreed to purchase an additional 10 million doses; however, the Moderna vaccine will not play a part in the first stage of Britain’s vaccine rollout.

The Health Minister of Britain, Matt Hancock, said that about 1.5 million people have already been vaccinated across the U.K. and Moderna’ ‘s vaccine will allow them to accelerate their vaccination program even further once doses become available in spring. These comments from the U.K. added optimism and supported the GBP/USD pair to rise in the early trading session on Friday.

However, the gains in GBP/USD currency pair could not live for long as the pair faced heavy pressure from the U.S. dollar’s strength and the rising number of coronavirus cases and deaths across the U.K. despite vaccine rollout. The U.S. Dollar was strong across the board after the U.S. Treasury yields rose on Friday to more than 3% amid the full sweep victory of Democrats over the Senate. The incoming President Joe Biden is expected to have full control over the White House, Senate, and House of Representatives added in the local currency as the incoming government will have more stability in rules.

In the capital, London’s mayor declared a major incident on Friday and issued a warning that hospitals in the city were close to being overrun. London’s situation was critical with the spread of the virus out of control as the city was declared to be at a crisis point. These developments in the U.K. also added pressure on British Pound and dragged the pair lower on Friday.

Daily Technical Levels

Support   Resistance

1.3496     1.3553

1.3475     1.3589

1.3439     1.3611

Pivot Point: 1.3532

GBP/USD– Trading Tip

The GBP/USD has violated the sideways trading range of 1.3625 – 1.3530 level, and closing of candles below this area can trigger selling until the next support level of 1.3452 level. On the higher side, the resistance continues to stay at the 1.3530 mark. On the hourly timeframe, the GBP/USD pair has violated the descending triangle pattern at the 1.3547 level, and now this level is likely to provide selling in the pair. Violation of the triangle pattern can extend selling bias today.


USD/JPY – Daily Analysis

The USD/JPY pair was closed at 103.951 after placing a high of 104.090 and a low of 103.602. The USD/JPY pair raised on Friday and extended its gains as the U.S. dollar was strong across the board amid the rising U.S. Treasury bond yields. The USD/JPY pair staged an impressive rebound and rose more than 150 pips in two days as the 10-year U.S. Treasury bond yield placed almost 13% gains in these two days. Over the week, the 10-year note U.S. Treasury yield has risen by about 21% and has supported the greenback since then. 

The U.S. dollar’s strength added further gains in the USD/PY pair and extended its upward momentum on Friday to its highest since December 15. The U.S. Dollar Index was also high beyond the 90.00 level for the first time in the week and supported the USD/JPY pair’s rise. Meanwhile, another factor involved in the rising demand for the U.S. dollar was Donald Trump’s comments, who agreed on a smooth transition of power. The political risk related to transition power that rose after Thursday’s attack was lifted and supported the local currency on Friday that eventually helped the USD/JPY pair to rise further n board. It means that the incoming President Joe Biden will have control over all three legislative bodies, the White House, the House of Representatives, and the U.S. Senate, to give his Democratic Party stability in rules. 

Despite all these positive sentiments, the incoming president promised to deliver two massive stimulus packages in 2021, and his first order is expected to increase the direct payment checks to $2000 kept the local currency USD under pressure and capped further upside in the USD/JPY pair. 

On the data front, at 04:30 GMT, the Household Spending from Japan in November raised to 1.1% against the expected -1.0% and supported the Japanese Yen that capped further upside in the USD/JPY pair. At 10:00 GMT, the Leading Indicators from Japan remained flat at 96.6%. 

From the U.S. side, at 18:30 GMT, the Average Hourly Earnings for December advanced to 0.8% against the projected 0.2% and supported the U.S. dollar that pushed the USD/JPY pair higher. In December, the Non-Farm Employment Change decreased to -140K against the projected 60K and weighed on the U.S. dollar. During December, the Unemployment Rate decreased to 6.7% against the projected 6.8% and supported the U.S. dollar that added further gains in the USD/JPY pair. At 20:00 GMT, the Final Wholesales Inventories for November came in as 0.0% against the projected -0.1% and weighed on the U.S. dollar that capped further upside in the USD/JPY pair on Friday. Furthermore, the USD/JPY pair’s upward momentum was also supported by the rising risk sentiment in the market. The risk flows were encouraged after the U.K. approved another vaccine from Moderna on Friday. U.K. became the first country to approve a third coronavirus vaccine for emergency use authorization that lifted the market’s risk sentiment that ultimately added weight on the safe-haven Japanese Yen and pushed the USD/JPY pair even higher on board.

Daily Technical Levels

Support   Resistance

103.18     104.19

102.56     104.58

102.16     105.21

Pivot Point: 103.57

USD/JPY – Trading Tips

The USD/JPY is trading at 104.123 level, facing immediate resistance at 104.223. On the 4 hour timeframe, the USD/JPY pair suggests bullish bias, and as the 10 and 20 periods, EMA is in support of buying trend while the MACD holds above 0, supporting bullish bias in the USD/JPY pair. A bullish breakout of the 104.223 level can extend the buying trend until the 104.610 level today. Let’s consider taking the buying trade over the 104.223 level and selling below the same. Good luck! 

Categories
Crypto Daily Topic Forex Daily Topic Forex Videos

Forex Trading Algorithms Part 7 Elements Of Computer Languages For EA Design!


Trading Algorithms VII – Liberal sequences and exact sequences

Translating ideas into a trading algorithm is not always easy. When examining a particular trade idea, we could find two cases: 

  • the signal can be described precisely in a consecutive sequence of trading facts, or 
  • Several conditions with variable steps among each condition need to be spotted.

The first class is easier to program. To this class belong any kind of crossovers: 

  • price to MA: 

  • MA to MA :

Similar conditions can be created with indicator crossovers and level breakouts.


Trading Signals Using Pivots

But what if the idea is more complex?. Let’s consider we want to catch pivot points in the direction of the trend. Let’s say we want to open a buy trade in the second pivot reversal. Let’s follow Pruitt’s example:

Buy on the second pivot pullback if

1.- The second pivot high is higher than the first pivot

2.- The pullback is larger than 2%

3.- The sequence takes less than 30 bars


The Flag Model

Since these conditions happen with variable price-action sequences programming, this kind of entry is much more difficult if we employ just If-then-else statements. The employment of flags to signal that a specific condition was met helps in the logic but is not the best solution.


As we see, the flag model is awkward and not too flexible. Also, this method is prone to errors.


The Finite State Machine

The second method to this kind of problem is the Finite State Machine (FSM). Basically, we want to detect certain states following others, defining a state when the needed condition is met. An FSM is a machine with finite states. The machine moves from state zero or START through several states until a final one, which defines the ACCEPT state. 

We can imagine a state machine as a combination lock. We need to supply the lock with a combination of numbers until its final digit, which triggers its opening.

The first step is to create the states needed. Next, we create the conditions for the change from one state to other states. Once satisfied with the diagram, we can easily write the pseudo-code, or, even, the actual code directly.

As we can see here, the code is precisely subdivided into states, each state with the precise instructions to move to the next state or back to the start state. We can see also that this algorithm is executed from top to bottom on each new bar. We hope that this example will help you better understand how an entry algorithm can be created.

Stay tuned for more interesting videos on trading algos!

Categories
Forex Videos

Forex Trading Algorithms Part 6 Elements Of Computer Languages For EA Design!


Trading Algorithms VI –  The Stages of a trading algorithm

In this video, we will discover the different parts needed for a complete trading system. 

One of the most common systems involves the crossover of two moving averages, a short- and a long-term SMA. Let’s do a system based on this idea.

Creating a trading algorithm involves at least two stages: the entry logic and the trade management logic, and the position sizing logic. 

The Entry Logic

The entry logic sets the rules for entries. The logic can be subdivided into two sections: the entry signal and the Filter or Trade setup

The entry signal  

An entry signal is a moment in time when something happens in the asset. Entries can be MA crossovers, level breakouts, bullish or bearish candlestick formations, and so forth.

The Filter

A filter is a condition imposed for the entry signal to be valid. For instance, you can allow a MA crossover to the long side only if the main trend is up. Then, you can programmatically define the primary trend, and this is the filter. For instance, we could describe an upward direction when the price is higher than the +1 SD line of a Bollinger Band ( in which we set the bands to 1 SD instead of the standard 2SD). We could also say that the upward trend is the price above its 200-period MA, or when there are higher highs and higher lows. A down-trend can be defined using the opposite logic.

On mean-reverting assets, an interesting filter might be overbought/oversold indicators such as RSI, Percent R, or Stochastics curving against the current move, allowing then use of candlestick reversal signals.

We can also add a filter that excludes trades whose projected reward/risk ratio is below one.

As a caveat, the higher the number of conditions, the higher the probability of over-optimizing it. The best designs are those with a few parameters. Also, the higher the number of filters, the less the system will trade. Thus, not always a filter improves a raw signal.

When building your trading system, a sound methodology starts with raw entry signals and a time stop at a determined number of bars. If the entry has an edge, it will be proved by higher than 50% profitable signals after 5-10 bars.

The trade management Logic

Trade management logic takes care of open trades. It is constituted of at least a stop-loss logic and a take-profit logic.  It may include other decision steps, such as break-even logic and trail stops.

The Stop-loss 

We have already published several articles on stop-losses. There are several ways to set a stop-loss level. We can do it using a multiple of the Average True Range of the asset, using the last swing low (or high in the case of a short-trade), or by statistically optimizing the distance using John Sweeney’s Maximum Adverse Excursion (MAE) concept.

Trail stops are also a recurrent idea in trading, although the developer should test them and assess if they really improve the results.  The same is valid for the break-even logic. Both concepts seem logical and mind relieving, but I have yet to find their utility to improve a trading system.

In some trading systems, a time stop can be handy. A time stop closes if the trade is not profitable after a certain period or a specific number of bars.

The Take-profit.

Take profit logic can also be varied, from dollar-based stops to stops based on key levels, supports, and resistances or pivots. A take-profit condition may be set, too, when a signal opposite to the current trade happens, such as an MA crossover against the trade, the price below the -1SD Bollinger line on longs or over +1SD line on short positions.

Take profit code can be added for scaling out the trade, letting a percent of the original position open to ride the wave and improve profits when your trade is right.

Position Sizing logic

The position size logic is a final step that involves setting up the right trade size for the trader’s objectives. This step should be used only in real-time trading, not during the definition, optimization, and evaluation of a new trading system.

During the definition step, a trading system must be used with one trade unit, and its results normalized to its risk, so instead of dollar profits, it should produce a stream of multiples of R, a standard one-dollar risk.

Position sizing logic is key to maximizing the returns of a system and limiting the max drawdown to the levels desired by the trader.

We will further develop these concepts in the coming videos, with specific algorithms demonstrating how to create them properly.

Categories
Forex Basic Strategies Forex Indicators Forex Service Review Forex Services Reviews-2

Market Profile Singles Indicator Review

Today we will examine the Market Profile Singles Indicator (we could also call it a single print indicator or gap indicator), which is available on the mql5.com market in metatrader4 and metatrader5 versions.

The developer of this indicator is Tomas Papp, who is located in Slovakia, and currently has 7 products available on the MQL5 market.

It is fair to point out that four of his products are completely FREE and are in a full-working version. These are: Close partially, Close partially MT5, Display Spread meter, Display Spread meter MT5. So it’s definitely worth a try.

Overview of the Market Profile Singles 

This indicator is based on market profile theory. It was designed to show “singles areas.” But, what exactly is a singles area?

Theory of the Market Profile Singles

Singles, or single prints, or gaps of the profile are placed inside a profile structure, not at the upper or lower edge. They are represented with single TPOs printed on the Market profile. Singles draw our attention to places where the price moved very fast (impulse movements). They leave low-volume nodes with liquidity gaps and, therefore, the market imbalance. Thus, Singles show us an area of imbalance. Singles are usually created when the market reacts to unexpected news. These reports can generate extreme imbalances and prepare the spawn for the extreme emotional reactions of buyers and sellers.

The market will usually revisit this area to examine as these price levels are attractive for forex traders, as support or resistance zones. Why should these traders be there? Because the market literally flew through the area, and only a small number of traders got a chance to trade there. For this reason, these areas are likely to be filled in the future.

The author also adds: “These inefficient moves tend to get filled, and we can seek trading opportunities once they get filled, or we can also enter before they get filled and use these single prints as targets.”

The author points out: Used as support/resistance zones, but be careful not always. Usually, it works very well on trendy days. See market profile days: trend day (Strategy 1 – BUY – third picture) and trend day with double distribution (Strategy 1 – SELL- third picture).

Practical use of the Market Profile Singles Indicator

So let’s imagine the strategies that the author himself recommends. Of course, it’s up to you whether you use these strategies or whether you trade other strategies for the singles area. Here we will review the following ones:

  • Strategy 1: The trend is your friend
  • Strategy 2: Test the nearest level
  • Strategy3: Close singles and continuing the trend

The author comments that these three strategies are common and repeated in the market, so it is profitable to trade them all.

The recommended time frame is M30, especially when using Strategy 2.

It is good to start the trend day and increase the profit, but be aware that trendy days happen only 15 – 20% of the time. Therefore, the author recommends mainly strategy 2, which is precise 75-80% of the time.


Strategy 1 – BUY :

  1. A bullish trend has begun.
  2. The singles area has been created.
  3. The prize moves sideways and stays above the singles area.
  4. We buy above the singles area and place the stop loss under the singles area.
  5. We place the profit target either according to the nearest market profile POC or resistance or under the nearest singles area. We try to keep this trade as long as possible because there is a high probability that the trend will continue for more days.

Strategy 1 – SELL :

  1. The bear trend has begun.
  2. The singles area has been created.
  3. The prize goes to the side and stays under the singles area.
  4. We sell below the singles area and place the stop loss above the singles area.
  5. We will place the target profit either according to the nearest market profile POC or support or above the nearest singles area. We try to keep this trade as long as possible because there is a high probability that the trend will continue for more days.


Before we start with Strategy 2, let’s explain the Initial Balance(IB) concept. IB is the price range of (usually) of the first two 30-minute bars of the session of the Market Profile. Therefore, Initial Balance may help define the context for the trading day.

The IBH (Initial Balance High) is also seen as an area of resistance, and the IBL (Initial Balance Low) as an area of support until it is broken.

Strategy 2 – one day – BUY:

This strategy will take place on a given day.

  1. There is a singles area near IB. (a singles area was created on a given day)
  2. The price goes sideways or creates a V-shape
  3. We expect to return to the singles area or IB. We buy low and place the stop loss below the daily low (preferably a little lower) and place the target profit below the IBL (preferably a little lower).


Strategy 2 – one day – SELL:

This strategy will take place on a given day.

  1. There is a singles area near IB. (a singles area was created on a given day)
  2. The price goes sideways or creates a reversed font V
  3. We expect to return to the singles area or IB. We sell high and place the stop loss above the daily high (preferably a little higher) and place the target profit above the IBH (preferably a little higher).


Strategy 2- more days- BUY:

This strategy takes more than one day to complete (Singles were created one or more days ago)

  1. After the trend, the price goes sideways and does not create a new low (or only minimal but with big problems)
  2. Nearby is a singles area (Since the price cannot go to one side, there is a high probability that these singles will close).
  3. We buy at a low, placing a stop-loss order a bit lower. We will place the target profile under the singles area.


Strategy 2- more days- SELL:

This strategy takes longer than one day (Singles were created one or more days ago)

  1. After the trend, the price goes to the side and does not create a new high (or only minimal but with big problems)
  2. Nearby is a singles area ( Since the price cannot go to one side, there is a high probability that these singles will close ).
  3. We sell at a high, and we place a stop-loss a bit higher. We will place the target profile above the singles area.

Strategy 3 – BUY:

  1. The current candle closes singles.
  2. Add a pending order above the singles area and place the stop-loss under the singles area or the candle’s low. (whichever is lower)
  3. Another candle must occur above the singles area. (If this does not happen, we will delete the pending order) .
  4. We will place the profit-target either according to the nearest market profile POC or resistance or under the nearest singles area.


Strategy 3 – SELL:

  1. The current candle closes singles.
  2. Add a pending order under the singles area and place the stop-loss above the singles area or candle’s high (whichever is higher).
  3. Another candle must occur under the singles area. (If this does not happen, we will delete the pending order) .
  4. We will place the profit-target either according to the nearest market profile POC or support or above the nearest singles area.

Discussion

These strategies look really interesting.  As the author himself says:

It’s not just a strategy. There is more to it in profitable trading. For me personally, they are most important when trading: Probability of profit, patience, quality signals with a good risk reward ratio (minimum 3: 1) and my head. I think this is the most important.

In this, we must agree with the author.


Service Cost

The current cost of this indicator is $50. You are also able to rent the indicator. For a one-month rental, it is $30 per month. There is also a demo version available it is always worth testing out the demos before purchasing. Though.

After purchasing the indicator, the author sends two more indicators to his customers as a gift: Market Profile Indicator and Support and Resistance Indicator.

Conclusion: There are only 2 reviews for the indicator so far, but they have 5 stars and are very positive.

For us, this indicator is interesting, and it is a big plus that the author shares his strategies. The price is also acceptable since the indicator costs 50 USD = 5 copies (10-USD / 1 piece), and since the author sends another 2 indicators as a gift, this price is really worthwhile.

The author added:

By studying the market profile and monitoring the market, I came up with an indicator and strategies we would like to present to you. Here you can try it for free :


MT4: https://www.mql5.com/en/market/product/52715

MT5: https://www.mql5.com/en/market/product/53385


And here you can watch the video:


Also, a complete description of the strategies and all the pictures can be seen HERE :

Other completely free of charge tools:

https://www.mql5.com/en/users/tomo007/seller#products


Categories
Forex Basic Strategies

Optimization Vs. Over Optimization

Today we discover the dangers of optimization: over-optimization. That’s the secret to making our system robust, consistent, and quite durable over time, or a quick way to lose your capital. It’s a fine line we shouldn’t cross. Let us then see what requirements we must take into account and what precautions we must take during the creation of a system, either automatic or 100% manual. At what point does optimization appear?

When we are creating our trading robot, the first thing we do is determine how it starts making market entries, when it will come out with its corresponding motives (crossover, RSI, MACD, different timeframes, etc). Once this is done, we start with optimization.

Right now we are going to adjust the robot to each market, as it is quite difficult for them to behave in similar ways. Therefore, if hypothetically our robot enters by moving averages when we are optimizing, the program will tell us that moving averages have gone better and which ones have gone worse. It’s just in that instant that we’ll have to be very careful, because it is when the joys of seeing a system that has multiplied our capital by 4 in 6 months come, forgetting the rest of optimizations. Error.

What do we have to look at in optimization?

In the graph of the evolution of our capital. Capital should not have any operation that excelled from the rest notably. Trading is a work of constancy; we must never seek the ball, the trade of your life… if it comes, it will come. Imagine that our profit after a year (500 operations) amounts to 1,800€, but we see that with a trade or two we have made 2,000€. We are in front of a system that will rarely get super trades, but that for the rest of the time, will be a negative or near-zero profit system.

Another point that can help us identify whether or not we are over-optimizing will be to look at the values of nearby means and see what results there are. If the results are very uneven, be careful, it is very possible that we have over-optimized. It may be that the means 10 and 20 go very well and that the means 12 and 25, fail miserably. A good system has to keep these values quite similar, the more subsystems (system configurations), the better the overall result.

It is necessary to be careful that when we decide to optimize a variable, it must be directly related to the market, that is, that it is something measurable, some numerical value.

As an example of this point, we could optimize our trading system by the hour. The market does not know what time it is, nor is it sleepy, the market is there. We must draw a pattern of behavior from indicators, or whatever, that depends directly on the market. Not because it’s 9:00 in the morning the market is going to move or the other way around; not because it’s 10:00 at night, the market is going to be flat. There are trends day and night, although it is true that there are more during the day. If we decide to optimize by eliminating certain hours of the day, the days that for some unknown reason there is no trend, our system, if it is tendential, will probably suffer.

Time for backtesting and subsequent optimization. If our strategy is long-term, we must have at least 200 trades, at least. With less, it is impossible to get reliability from that system. It is estimated that the robot continues to operate for a period of approximately 1/3 to 1/8 of the total simulation. If we do a test of 8 months, at least the system should work from one month to almost 3.

If after optimizing the system does not work, nothing happens. I know, it’s nice to see how your system in the past could have made a killing, but now it’s no good. It was a combination of trades that might happen again, but maybe 20 years from now. Are you going to be losing money for that long?

The last thing, I was looking for images to illustrate the post and I remembered the most over-optimized systems that exist, the trading robots that are sold online. 95% are scams. With phrases like this: “I doubled the capital, in 6 months” and a guy smiling with money, people go crazy. The final part of the advertisement says: “For only 29,95€”… If the programmer had a system that doubled the capital in 6 months, it would be cheaper for him to go and ask for money in the bank or wherever. I put the photo here, so you can see the graphic they show on their websites. Good and functioning robots make money in the long run, but they are not exponential and perfect trend lines, without any failed trade.

Categories
Forex Elliott Wave Forex Market Analysis

USDCAD Bullish Divergence in a Complex Corrective Formation; What’s next?

The big picture of the USDCAD pair shows a bullish divergence suggesting the exhaustion of the current bearish trend that remains active since past March 2020 when the price topped at 1.46674 and began to decline in a complex corrective pattern. Follow with us what’s next for Lonnie.

Technical Overview

The long-term Elliott wave view of the USDCAD pair unfolded in its 2-day chart and log-scale, illustrates a downward movement that began on the second half of March 2020 when the price found fresh sellers at level 1.46674. Once the price topped, the Lonnie started to decline in a complex corrective formation identified as a double-three pattern (3-3-3) of Minor degree labeled in green.

According to the textbook, the double-three pattern characterizes itself by following an internal sequence subdivided into 3-3-3, each “three” a complete corrective formation. In this regard, the previous figure shows the price action moving in the third segment of the double-tree pattern corresponding to its wave Y. Also, the lower degree structural sequence reveals the progress in its wave ((c)) of Minute degree identified in black.

On the other hand, the technical indicators support the bearish bias that dominates the downtrend, persisting since March 2020. Both the trend and the momentum oscillators confirm the downtrend in progress. Nevertheless, the timing oscillator shows a bullish divergence plotted in green. This reading suggests the exhaustion of the bearish trend. In this context, the candlesticks formations observed in the last chart remains weighting declines over rallies.

Technical Outlook

The short-term outlook for USDCAD exposed in the next 8-hour chart reveals the incomplete downward advance corresponding to wave ((c)) of Minute degree identified in black, suggesting a potential new decline.

The figure illustrates the downward channel in play that connects the extremes of waves (i)-(iii) and (ii)-(iv) Minuette degree identified in blue. The Elliott Wave theory suggests that the penetration below the base-line between waves (i) and (iii) could reveal the end of wave (v). In this regard, a potential new decline could strike the area bounded between 1.2585 and 1.2425. Likewise, the gap between momentum and timing oscillators supports the likely additional downward move in the USDCAD pair. 

In summary, the USDCAD advances in a downward complex corrective sequence identified as a double-three pattern of Minor degree, which looks running in its wave Y. Simultaneously, the internal structure reveals the progress in its wave ((c)) of Minute degree, which could see a new drop to the potential target area between 1.2585 and 1.2425. Finally, the bearish scenario will invalidate if the price soars and closes above 1.27980.

Categories
Forex Market Analysis

Daily F.X. Analysis, January 08 – Top Trade Setups In Forex – U.S. NFP Figures Ahead! 

The eyes will remain on the U.S. NFP data on the news side, which is expected to report a slight drop from 638K to 500K during the previous month. Besides, the U.S. Average Hourly Earnings m/m and Unemployment Rate will also remain the main highlight of the day, and these may determine the USD trend for today and next week. Let’s wait for the news.

Economic Events to Watch Today  


EUR/USD – Daily Analysis

The EUR/USD pair was closed at 1.22690 after placing a high of 1.23442 and a low of 1.22449. The EUR/USD pair came under renewed pressure as the U.S. dollar rebounded after an increased 10-year U.S. treasury yield and the depressing economic data from the Eurozone. The U.S. Dollar was strong onboard after falling to the multi-year lowest level this week amid the rising U.S. Treasury yield on a 10-year note that raised by 1% for the first time since March. The rising demand for the greenback ultimately added weight on EUR/USD pair that fell on Thursday.

However, the strong demand for the U.S. dollar is expected not to live for a large time as the Democratic win in the U.S. Senate elections has raised the prospects for a larger stimulus package that will ultimately weigh on the local currency. Meanwhile, the European Central Bank released the regular economic bulletin on Thursday in which it said that the Eurozone economic indicators point to an economic contraction in the final quarter of 2020. 

The ECB said that high-frequency indicators and the latest survey results were consistent with a fall in GDP in the final quarter of 2020. The survey indicators point to a renewed contraction in activity mainly affecting the services sector. The ECB also said that the stat of vaccinations supports expectations for a rapid recovery. Still, it will take time before widespread immunity could be reached and the economy could return to normal. These depressing comments from ECB also added weight on the single currency Euro that added further pressure on EUR/USD pair on Thursday.

On the data front, at 12:00 GMT, the German Factory Orders in November raised to 2.3% against the expectations of -0.6% and supported the single currency Euro that capped further downside in EUR/USD pair. At 15:00 GMT, the CPI Flash Estimate for the year for December declined to -0.3% against the expected -0.2% and weighed on Euro that added losses in EUR/USD pair. The Core CPI Flash Estimate remained flat with expectations of 0.2%. The Italian Prelim CPI also raised to 0.3%against the forecasted 0.2% and supported Euro and capped further downside in EUR/USD pair. The Retail Sales from Eurozone dropped to -6.1% against the forecasted -3.4% and weighed heavily on Euro that added further downside pressure on EUR/USD pair.

The Challenger Job Cuts for the year in December rose to 134.5% compared to November’s 45.4%. At 18:30 GMT, the Unemployment Claims from last week were dropped to 787K against the expected 798K and supported the U.S. dollar that added losses in EUR/USD pair. The Trade Balance from November showed a deficit of -68.1B against the expected -66.7B and weighed on the U.S. dollar that capped further downside in EUR/USD pair. The ISM Services PMI rose in December to 57.2 against the expected 54.5 and supported the U.S. dollar that added further losses in EUR/USD pair on Thursday.

Daily Technical Levels

Support   Resistance

1.2228      1.2330

1.2186      1.2388

1.2127      1.2431

Pivot Point: 1.2287

EUR/USD– Trading Tip

The EUR/USD continues trading with a bullish bias at 1.2367, facing resistance at the 1.2350 level. On the lower side, the support continues to hold around the 1.2278 level. Simultaneously, the bullish breakout of the 1.2350 resistance level can extend buying until the 1.2435 level. The leading indicators such as RSI and MACD support selling, but the EUR/USD 50 periods EMA is likely to support at 1.2289. 


GBP/USD – Daily Analysis

The GBP/USD pair was closed at 1.35641 after placing a high of 1.36330 and a low of 1.35324. The GBP/USD pair extended its losses on Thursday amid the broad-based U.S. dollar recovery amid the rising safe-haven demand and the British Pound’s weakness due to the rising deaths from a new coronavirus variant. Since March, the U.S. Dollar was high on board after the U.S. 10-year Treasury yield rose by more than 1% for the first time. The U.S. Dollar Index that measures the value of the greenback against the basket of six major currencies also recovered from the multi-year lowest level and supported the U.S. dollar that ultimately added weight on the GBP/USD pair on Thursday.

Moreover, the U.S. dollar gains were limited as the pressure of prospects of a larger stimulus package in 2021 from the Democratic government held the local currency down. The Democratic win in the U.S. Senate elections raised the anticipations that President-elect Joe Biden will stand true to His promises for delivering two major stimulus packages in 2021. 

However, the losses in the GBP/USD pair could also be attributed to the rising number of deaths in the U.K. from the new UK coronavirus variant. The U.K. reported a further 1041 fatalities due to coronavirus, which is the highest daily death toll since April. 

On Thursday, about 62,322 new coronavirus cases were recorded, which was also the highest daily rise since mass testing began. The rising spread of coronavirus due to its new variant and the increased number of deaths despite the nationwide lockdown and vaccine rollout raised fears for the newly independent nation Great Britain’s economy that ultimately weighed on the local currency Sterling and dragged the currency pair GBP/USD on the downside.

Furthermore, the World Health Organization (WHO) called on European countries to intensify coronavirus measures as the region deals with the new UK-detected variant. On Thursday, the WHO Europe director Hans Kluge said that further measures were needed to flatten the steep vertical line of rising cases in some countries. Moreover, the French Prime Minister Jean Castex said that France’s border with the U.K. will remain shut and that it was out of the question to lower their guard in weeks to come. These statements also weighed on British Pound and affected the GBP/USD pair’s movement on Thursday.

The Construction PMI for December from Great Britain came in line with the expectations of 54.6. At 14:32 GMT, the Housing Equity Withdrawal for the quarter also remained flat with the expectations of -7.0B. The Challenger Job Cuts for the year in December surged to 134.5% compared to November’s 45.4%. At 18:30 GMT, the Unemployment Claims from last week fell to 787K against the projected 798K and supported the U.S. dollar that added losses in GBP/USD pair. The Trade Balance from November showed a deficit of -68.1B against the projected -66.7B and weighed on the U.S. dollar that capped further downside in GBP/USD pair. The ISM Services PMI surged in December to 57.2 against the projected 54.5 and supported the U.S. dollar that added further GBP/USD pair losses on Thursday.

The GBP/USD pair’s losses were limited as the U.K. government was trying to increase the vaccination supply to control coronavirus spread. The health minister Matt Hancock has said on Thursday that the Britain government was working with both Pfizer and AstraZeneca to increase supplies as the pace of Britain’s rollout of coronavirus vaccines was being limited by the supply of shots. He said that the government must quickly ramp up the rate of vaccinations to meet an ambitious target to protect more than 13 million people who were elderly, vulnerable, or frontline workers by mid-February. 

Daily Technical Levels

Support   Resistance

1.3518      1.3620

1.3474      1.3678

1.3416      1.3722

Pivot Point: 1.3576

GBP/USD– Trading Tip

The GBP/USD pair continues to consolidate in a narrow trading range of 1.3625 – 1.3556. The Sterling may face immediate resistance at the 1.3625 level, and the continuation of an upward trend can lead the Cable towards the 1.3700 resistance level. On the lower side, the breakout of 1.3545 support can extend the selling trend until the 1.3468 level.


USD/JPY – Daily Analysis

The USD/JPY pair was closed at 103.824 after placing a high of 103.955 and a low of 102.948. The USD/JPY pair rose to its highest level since mid-December on Thursday amid the broad-based strength of the U.S. dollar. The USD/JPY pair’s bullish momentum was supported by the stronger U.S. dollar driven by the rising 10-year U.S. Treasury yields. The U.S. 10-year Treasury yields rose to 1.085% on Thursday that was the highest level since March. On Wall Street, the main indexes were also at record highs as Dow Jones gained about 1.7% and NASDAQ gained about 2.25% on Thursday.

The rising risk sentiment because of the rally in the stock market and the U.S. treasury yield, along with the rising crude oil prices, added weight on the safe-haven Japanese Yen that ultimately pushed the currency pair USD/JPY higher onboard to 4 weeks highest level. The U.S. Dollar Index was also up from the multi-year lowest level on Thursday and moved near 89.85 and was up 0.35% for the day. The rising demand for the greenback pushed the currency pair USD/JPY higher on the board.

However, the U.S. dollar demand is expected not to live for a longer period as the Democratic win in U.S. Senate elections has raised the prospects for a larger stimulus package. Joe Biden, who will begin his term from January 20th, has promised to deliver about two large stimulus measures this year, ultimately hurting local currency.

On the data front, at 04:30 GMT, the Average Cash Earnings for the year from Japan dropped to -2.2% against the projection of -0.9% and weighed on the Japanese Yen that ultimately added further gains in the USD/JPY pair. From the U.S. side, at 17:30 GMT, the Challenger Job Cuts for the year in December increased to 134.5% compared to November’s 45.4%. At 18:30 GMT, the Unemployment Claims from last week were decreased to 787K against the anticipated 798K and supported the U.S. dollar that added further gains in the USD/JPY pair. The Trade Balance from November showed a deficit of -68.1B against the anticipated -66.7B and weighed on the U.S. dollar that capped further upside in the USD/JPY pair. At 20:00 GMT, the ISM Services PMI increased in December to 57.2 against the forecasted 54.5 and supported the U.S. dollar that added further gains in the USD/JPY pair.

Meanwhile, on Thursday, the Federal Reserve released its FOMC December meeting minutes that revealed that the Federal Reserve officials consistently backed, holding the pace of asset purchases stable, while some were open to future adjustments if needed. Minutes also revealed that all participants judged that it would be appropriate to continue those purchases at least at the current pace. Nearly all members favored keeping the current arrangement of purchases. The Federal Open Market Committee kept interest rates near zero. It supported its commitment to bond-buying at the meeting after vowing to maintain a $120 billion monthly pace of purchases until there will be considered further progress towards inflation goals and employment. The FOMC meeting minutes also supported the local currency U.S. dollar and added further upside in the USD/JPY pair on Thursday.

Daily Technical Levels

Support   Resistance

103.18     104.19

102.56     104.58

102.16     105.21

Pivot Point: 103.57

USD/JPY – Trading Tips

The USD/JPY consolidates below 103.950 level, after bouncing off above 103.528 support level. A bullish breakout of 103.950 can lead the USD/JPY pair to the 104.322 level. The 50 periods EMA is expected to keep the USD/JPY support at 103.355, which is very far from the current market price; thus, we can also expect some bearish correction. The market may show further movements upon the release of U.S. NFP figures today. Good luck! 

Categories
Forex Market Analysis

Daily FX Analysis, January 07 – Top Trade Setups In Forex – Eyes on Series of US and European Events! 

It’s going to be a busy day from the news front, as the market will be focusing on the German Factory Orders m/m, ECB Economic Bulletin, Retail Sales, and CPI figures from the Eurozone economy that can drive price action in the Euro pairs during the UK session. On the other hand, the dollar’s movement can be influenced by Unemployment Claims and ISM Services PMI scheduled to be released during the US session.

Economic Events to Watch Today  


EUR/USD – Daily Analysis

The EUR/USD pair was closed at 1.23259 after placing a high of 1.23492 and a low of 1.22653. The depressed US dollar after the signs of a Democratic win in the US Senate runoff elections and the rebounded risk-on market sentiment helped EUR/USD pair to post gains on Wednesday.
The markets anticipated a Democratic win in the US Senate election in Georgia that would evacuate the track for a bigger fiscal stimulus package; the greenback came under pressure. Democrats won one US Senate race in Georgia and led in another on Wednesday, moving closer to a sweep in a Deep South state. The result will be announced on late Wednesday, and winning both seats by Democrats will give Congress control to power the President-elect Joe Biden’s policy goals.

Biden has said that he wanted two fiscal stimulus packages in 2021 to support his economy through the pandemic. His first order is expected to increase the stimulus paychecks amount to $2000 rejected by Republicans. These hopes kept the US dollar under pressure and supported the upward momentum in the EUR//USD pair.

On the data front, at 10:00 GMT, the German Prelim CPI for December dropped to 0.5% against the expected 0.6% and weighed on Euro and capped further upside in EUR/USD pair. At 12:45 GMT, the French Prelim CPI for December also dropped to 0.2% against the forecasted 0.4% and weighed on Euro. At 13:15 GMT, the Spanish Services PMI for December raised to 48.0 against the expected 44.5 and supported the single currency Euro and added further EUR/USD pair gains. At 13:45 GMT, the Italian Services PMI for December declined to 39.7 against the estimated 45.0 and weighed on the single currency Euro.

At 13:50 GMT, the French Final Services PMI came in line with the expectations of 49.1. At 13:55 GMT, the German Final Services PMI dropped to 47.0 against the anticipated 47.7 and weighed on Euro and capped further upside in EUR/USD pair. At 14:00 GMT, the Final Services PMI from Europe also fell to 46.4 against the forecasted 47.4 and weighed on Euro. At 15:00 GMT, the PPI for November from the Euro area raised to 0.4% against the expected 0.2% and supported Euro and gave strength to the EUR/USD pair’s rising prices.

From the US side, at 18:15 GMT, the ADP Non-Farm Employment Change for December declined to -123K against the forecasted 60K and weighed on the US dollar that gave further gains to EUR/USD pair. At 19:45 GMT, the Final Services PMI for December also declined to 54.8 against the forecasted 55.2 and weighed on the US dollar and helped EUR/USD to rise further. At 20:00 GMT, the Factory Orders for November rose to 1.0% against the forecasted 0.7%, supported the US dollar, and capped further gains in EUR/USD pair.

Meanwhile, the market’s risk sentiment was improved after the resurgence in global manufacturing as shown in various surveys this week despite the rising coronavirus cases, which also gave strength to the risk perceived EUR/USD pair on Wednesday.


Daily Technical Levels

Support   Resistance

1.2257      1.2318

1.2220      1.2344

1.2195      1.2380

Pivot point: 1.2282

EUR/USD– Trading Tip

The EUR/USD continues trading with a bullish bias at 1.2367, facing resistance at the 1.2350 level. On the lower side, the support continues to hold around the 1.2278 level. Simultaneously, the bullish breakout of the 1.2350 resistance level can extend buying until the 1.2435 level. The leading indicators such as RSI and MACD support selling, but the EUR/USD 50 periods EMA is likely to support at 1.2289. 


GBP/USD – Daily Analysis

The GBP/USD pair was closed at 1.36075 after placing a high of 1.36711 and a low of 1.35380. The currency pair came under pressure on Wednesday amid the rising number of coronavirus cases in the UK, depressing comments from Andrew Bailey, and the poor macroeconomic data from Great Britain.

The UK has more new coronavirus cases per capita than any other major country globally as the number of daily cases topped 60,000 for the first time this week. The latest data suggested that around one in 50 people in the UK currently have the virus. Only the US has a per capita infection rate nearly equivalent to the UK of any country with more than 1 million cases.

Since December 06, the average number of new daily cases has risen from around 15,000 to above 55,000. PM Boris Johnson said on Tuesday that about 1.3 M people have so far received a coronavirus vaccination. The rising number of coronavirus made the UK the worst-hit country in Europe in terms of cumulative cases and weighed on its local currency British Pound, which ultimately added weight to the GBP/USD pair.

Meanwhile, on Wednesday, the Governor of Bank of England Andrew Bailey risked reigniting the politically charged debate over Brexit by predicting that the trade deal struck with the European Union could end up costing the UK economy the equivalent of more than 80 billion pounds.
During his first public comments since Britain completed its withdrawal from the bloc on December 31, Bailey endorsed warnings from the Office for Budget Responsibility, the fiscal watchdog, that gross domestic product will be as much as 4% lower in the long term than it would be had the country remained in the EU.

These comments from the Bank of England governor right after the Brexit completion raised fears and added weight on Sterling that eventually dragged the GBP/USD currency pair on the downside. On the data front, at 14:30 GMT, the Final Services PMI from Great Britain for December dropped to 49.4 against the expected 499 and weighed on British Pound and added more losses on the currency pair GBP/USD.

From the US side, at 18:15 GMT, the ADP Non-Farm Employment Change for December fell to -123K against the anticipated 60K and weighed on the US dollar and capped further losses in GBP/USD pair. At 19:45 GMT, the Final Services PMI for December also fell to 54.8 against the anticipated 55.2 and weighed on the US dollar. At 20:00 GMT, the Factory Orders for November surged to 1.0% against the anticipated 0.7% and supported the US dollar that added further GBP/USD pair losses.

However, the GBP/USD pair’s losses were somewhat recovered in the late trading session over the positive sentiment that was mostly driven by the rising expectation that the Democrats will win both seats in Georgia’s Senate runoff. A clean sweep for the Democrats would hand charge of both houses of Congress to the incoming administration that would pave the way for Joe Biden to push through more stimulus. This left the US dollar under pressure and supported the GBP/USD pair in late trading hours.


Daily Technical Levels

Support   Resistance

1.3572      1.3660

1.3518     1.3696 

1.3483      1.3749

Pivot Point: 1.3607

GBP/USD– Trading Tip

The GBP/USD pair continues to consolidate in a narrow trading range of 1.3625 – 1.3556. The Sterling may face immediate resistance at the 1.3625 level, and the continuation of an upward trend can lead the Cable towards the 1.3700 resistance level. On the lower side, the breakout of 1.3545 support can extend the selling trend until the 1.3468 level.


USD/JPY – Daily Analysis

The USD/JPY pair was closed at 103.049 after placing a high of 103.442 and a low of 102.590. The higher US yields and the market’s risk appetite boosted the USD/JPY prices on Wednesday. Since March, the currency pair bounced from the lowest levels, near 102.50, and peaked at 103.43, a one-week high.

The main driver of the pair USD/JPY remained the US yields followed by the elections to decide the US Senate’s composition. The 10-year yield reached 1.05%, its highest since March, and supported the US dollar that ultimately pushed the USD/JPY pair higher on board. The market sentiment was not affected by the weaker than expected US economic data as the Dow Jones was at record highs, up by 1.55%, and the NASDAQ gained 0.51%.

Markets were pricing the prospects of a Democratic win in the US Senate runoff elections in Georgia. The Democrats already have the House of Representatives, aka lower chamber of Congress, in their control. Winning the Senate elections will also give them control over the upper chamber that means they will have a complete majority in the US legislative assembly and the power to push forward their agenda.

The term of Joe Biden will begin on January 20. He has hinted that he wanted at least two stimulus packages in 2021 to overcome the damage caused and expected to continue from the coronavirus pandemic. Markets were also pricing their bets on the prospects of Biden’s first order that is expected to push out $2000 checks to most Americans that had been strictly opposed by the Republicans.

On the data front, at 10:00 GMT, the Consumer Confidence from Japan for December dropped to 31.8against the anticipated 32.6 and weighed on the Japanese Yen that added more gains in the USD/JPY pair.
From the US side, at 18:15 GMT, the ADP Non-Farm Employment Change for December decreased to -123K against the projected 60K and weighed on the US dollar that capped further gains in the USD/JPY pair. At 19:45 GMT, the Final Services PMI for December also decreased to 54.8 against the projected 55.2 and weighed on the US dollar that limited additional USD/JPY pair gains. At 20:00 GMT, the Factory Orders for November increased to 1.0% against the projected 0.7% and supported the US dollar that added further gains in the USD/JPY pair.

Furthermore, some of the USD/JPY pair’s gains were lost in late trading hours of Wednesday as the rising number of coronavirus cases kept the global economic recovery under pressure and safe-haven demand intact. On Wednesday, Japan’s number of coronavirus cases reached its highest level as the government faced mounting pressure from health experts to impose a strict state of emergency for Tokyo.

In Portugal, about 10,027 new cases on Wednesday were reported, which was the highest since the pandemic started. Ontario reported 3266 new coronavirus cases that brought the total number of coronavirus in the region to 200,626. All these fears kept the safe-haven Japanese yen supportive that ultimately weighed on the USD/JPY pair and lost most of its gains for the day on Wednesday.


Daily Technical Levels

Support   Resistance

102.49      103.08

102.24      103.44

101.89      103.68

Pivot Point: 102.84

USD/JPY – Trading Tips

The USD/JPY bounced off to violate the resistance level of 102.960 level, and now it’s working as a support for the USD/JPY pair. The pair may find resistance at the 103.430 level. Overall, the bullish bias seems strong as the USD/JPY pair has crossed over 50 EMA at the 103.063 level. Taking a look at the 2-hour timeframe, the USD/JPY has closed a bullish engulfing candle over 102.962 level that can drive the further bullish trend in the USD/JPY pair. Let’s consider taking a buy trade over the 102.960 level today. Good luck!

Categories
Forex Market Analysis

GBPJPY Under the Bearish Pressure

The GBPJPY cross continues moving in an incomplete long-term sideways corrective pattern of Intermediate degree that remains active since the price found support at 124.786 in early October 2016. The Elliott wave sequence in progress suggests the possibility of a new decline for the coming trading sessions.

Technical Overview

The following figure illustrates the GBPJPY cross in its 2-day range, developing a sideways formation of Intermediate degree labeled in blue, which could correspond to an incomplete, irregular flat pattern (3-3-5). This Elliott wave formation began in early October 2016 when the price found support at 124.786 and rallied until 156.608 reached in early February 2018 when the price completed its wave (A) identified in blue.

The previous chart exposes the downward advance of wave (B) in blue, which began once the cross topped at 156.608. In this context, wave (B) internal structure seems like a double-three pattern of Minor degree labeled in green, which currently advances in its wave Y.

Likewise, the lower degree sequence shows the progress in its incomplete wave ((c)) of Minute degree identified in black, which began in early September 2020 when the price found fresh sellers at 142.714.

According to the textbook, the wave ((c)) in progress should follow an internal sequence subdivided into five waves. In this context, the lower degree structure of GBPJPY might move in its second wave (ii) of Minuette degree labeled in blue. Thus, completing this corrective rally should give way to a new decline corresponding to wave (iii).

Technical Outlook

The next 12-hour chart shows the GBPJPY advancing in the wave c of Subminuette degree labeled in green inside the corrective rally corresponding to wave (ii) in blue. The completion of this corrective formation could correspond to an incomplete ending diagonal pattern suggesting a new decline.

The new decline’s potential bearish target corresponding to wave (iii) in blue locates in the demand zone between 130.808 and 129.298. On the other hand, the downward scenario’s invalidation finds at the top of the wave (i) at 142.714, corresponding to the last September 01st high.

In summary, the GBPJPY cross advances in an incomplete sideways corrective formation, which its internal structure suggests the progress in a complex double-three pattern. The lower degree structure exposes the advance of wave (ii), which seems incomplete. In this regard, the ascending base-line breakdown should confirm the potential next decline, which has a potential target the demand zone located between 130.808 and 129.298. Finally, the bearish scenario forecasted will be invalid if the price surpasses and closes above 142.714.

Categories
Forex Videos

Brexit Is Done – How To Profit Trading Forex GBPUSD


Brexit done – where now for Cable?

Thank you for joining this forex academy educational video.  in this section, we will be looking at the aftermath of the Brexit future trade deal agreement negotiations, which have finally concluded.  And what this might mean for the GBPUSD pair.

After 4 years of wrangling over a future trading arrangement between the European Union and the United Kingdom, which left EU membership back in June 2016, by way of a national referendum, a free trade deal has been agreed between the UK and EU on Christmas Eve 2020. 

The markets will be grateful for a breather in the now finalised divorce, which has finally been settled after years of; will they, or won’t they get a future treading deal completed in time before the UK was forced to end the transition period on wt20 trading regulations, which was seen as potentially very bad for the British economy.  As many had predicted, the negotiations went down to the wire, and an agreement was set in place with hardly any time to spare.

The referendum, which took place on the 23rd of June 2016, and where the British people voted to leave the EU, caused the pound against the dollar to crash from 1.47 to a low of 1.21 during the following year, as the markets tried to decipher how this may play out for the British economy.

The pear rallied up to 1.42 in April 2018 as hopes were raised of a negotiated trade free trade deal, which was dashed. 

And we had the crash to 1.16 in march 2020 as the pandemic gripped the United Kingdom.

The pair has been rallying up to its current position at 1.36 – at the time of writing – based on the market anticipation that a free trade agreement would be reached.  This extremely bumpy road has been smoothed by the free trade agreement, but what now for the British economy and the pound, as it finally goes its own way as an independent nation?

There is no doubt that the bulls are in control of the pair at the moment, and some institutional traders will be looking for the previous highs, as shown here on the chart of 1.42 and 1.47.

However, things to consider are that the free trade agreement only takes up 20% of the British economy, with the remaining 80% of the gross domestic product being attributed to financial services, which does not form part of the agreement, and which still has to be negotiated between the EU and UK.  It is unlikely that issues in this sector will cause a major upset; however, there is potential for a spanner in the works should the two sides diverge from current alignments in trading standards.

The other critical component, which will affect the pound, is the United States dollar currency index, or DXY, which measures the dollar against the most commonly traded currencies known as the majors and which includes the British pound and Euro.

The dollar index has fallen from a high of 103.00 in march 2020 to its current level at just under 90.00 at the time of writing, as the federal reserve and United States’ government implement stimulus measures by pumping more and more dollars into the system to shore up the failing US economy, which is still in the grips of the pandemic.

While traders wonder if Cable has run out of steam at 1.36, traders will also be wondering if there is further room for a continued slide in the dollar index, perhaps down to 88.00 in the short term, as the market opens to a new year and a first new quarter, with institutions and investors adjusting their portfolios for the new financial year ahead.

On a market sentiment basis, a fundamental basis, and on a technical analysis basis, it would appear that there is scope for a push higher in Cable to reach some of the previous levels mentioned at 1.42 and 1.47, especially while the US dollar index is generally under pressure.


Categories
Forex Market Analysis

Daily F.X. Analysis, January 06 – Top Trade Setups In Forex – ADP Non-Farm Employment Change Ahead! 

On the news front, eyes will remain on the Services PMI figures from the Eurozone, U.K., and the United States. Almost all economic figures are expected to perform better than previous months, perhaps due to a lockdown lift. Price action will depend upon any surprise changes in the PMI figures. Later today, the U.S. ADP figures will also drive some volatility in the market.

Economic Events to Watch Today  


EUR/USD – Daily Analysis

The EUR/USD pair was closed at 1.22984 after placing a high of 1.23055 and a low of 1.22419. The renewed U.S. dollar weakness and the prospects for a Democratic majority in the Senate after the runoff election in Georgia boosted the market sentiment that supported the upward trend in EUR/USD pair on Tuesday.

The U.S. Dollar Index that gauges the greenback’s value against the basket of six major currencies fell by almost 0.38% on Tuesday to an 89.53 level that ultimately added gains in EUR/USD pair. The U.S. Dollar was also under stress on Tuesday amid the US Georgia runoff elections that would decide the future of the U.S. Senate. The outcome will be crucial for incoming president Joe Biden as the Senate majority helps pass the law and confirm the cabinet appointments. The result is expected on Wednesday. It has made investors cautious about placing any strong bids in favor of the U.S. dollar, resulting in the upward momentum of EUR/USD.

On the data front, at 12:00 GMT, the German Retail Sales for November raised to 1.9% against the expected -2.0% and supported the single currency Euro and added further gains in EUR/USD pair. At 13:00 GMT, the Spanish Unemployment Change in December raised to 36.8K against the expected 30.5K and weighed on the single currency Euro that capped further EUR/USD pair gains. At 13:55 GMT, the German Unemployment Change for December declined to-37K against the expected 10K and supported the single currency Euro that added further EUR/USD pair gains. At 14:00 GMT, the M3 Money Supply for the year from Eurozone raised to 11.0% against the forecasted 10.6% and supported the single currency Euro that added additional EUR/USD pair gains. The Private Loans for the year from Eurozone dropped to 3.1% from the expected 3.3% and weighed on Euro that further capped gains in EUR/USD pair.

From the U.S. side, at 20:00 GMT, the ISM Manufacturing PMI from December rose to 60.7 against the estimated 56.6 and supported the U.S. dollar, and capped further gains in EUR/USD pair. The ISM Manufacturing Prices also raised to 77.6 against the anticipated 66.0 and supported the U.S. dollar. The Wards Total Vehicle Sales raised to 16.3M against the estimated 15.8M and supported the U.S. dollar, ultimately limiting further gains in EUR/USD pair.

On Wednesday, the HIS Markit will release the Services PMI data for Germany and the Euro area. From the U.S., the ADP Employment Change will also be featured in the economic docket that will impact EUR/USD prices. Furthermore, the investors will keep a close eye on the Georgia election results.

Daily Technical Levels

Support   Resistance

1.2257      1.2318

1.2220      1.2344

1.2195      1.2380

Pivot point: 1.2282

EUR/USD– Trading Tip

The EUR/USD is trading with a mixed bias at the 1.2272 level, having violated the upward trendline at the 1.2252 level. At the moment, the pair is likely to face resistance at the 1.2307 level along with a support area of 1.2245 and 1.2215. Bullish bias seems dominant today, so a bullish breakout of 1.2307 can extend buying until the next resistance level of 1.2345.


GBP/USD – Daily Analysis

The GBP/USD pair was closed at 1.36278 after a high of 1.36420 and a low of 1.35540. Despite the third nationwide lockdown in the U.K., the GBP/USD pair raised on Tuesday amid the broad-based U.S. dollar weakness. The U.S. Dollar Index that measures the value of the U.S. dollar against the basket of six major currencies fell by 0.38% towards the two years, the lowest level of 89.53, and weighed on the greenback that ultimately supported the gains in GBP/USD pair.

The U.S. dollar was weak across the board despite the safe-haven appeal in the market mainly because of the Georgia runoff elections in the U.S. The runoff will decide the future of the U.S. Senate. It will be essential for Joe Biden, the upcoming Democratic president of the U.S., as it holds major importance in the U.S. Congress being its upper chamber. Senate holding party could easily approve its bills, which is the main attractiveness for getting majority votes in the Georgia runoff elections. Since 2014, the Senate has been controlled by the Republican Party, and if Democrats win on Wednesday, the extra two seats will give them effective control.

On the other hand, the British Pound was under pressure on Tuesday as the number of new daily confirmed cases of coronavirus in the U.K. has topped 60,000 for the first time since the pandemic started.

According to the government figures on Tuesday, the number of people who tested positive was 60,916. It came in as England and Scotland announced new strict lockdowns with people told to stay at home. The country is entering another nationwide lockdown to control coronavirus’s new variant affected the local currency and GBP/USD pair. However, investors did not give much attention to it and continued moving with the weakness of the U.S. dollar that ultimately pushed the GBP/USD pair higher.

There was no macroeconomic data on the data front to be released from the U.K. From the U.S. side, at 20:00 GMT, the ISM Manufacturing PMI from December surged to 60.7 against the anticipated 56.6 and supported the U.S. dollar and capped further gains in GBP/USD pair. The ISM Manufacturing Prices also rose to 77.6 against the projected 66.0 and supported the U.S. dollar. The Wards Total Vehicle Sales surged to 16.3M against the expected 15.8M and supported the U.S. dollar that ultimately limited further GBP/USD pair gains.

Daily Technical Levels

Support   Resistance

1.3572      1.3660

1.3518      1.3696

1.3483      1.3749

Pivot point: 1.3607

GBP/USD– Trading Tip

The Cable’s technical side also remains mostly unchanged as the GBP/USD pair consolidates between 1.3632 – 1.3556 after violating the support level of 1.3609 level. On the higher side, the Sterling may find resistance at 1.3632 and 1.3697 level while support at 1.3550 and 1.3473 level. Choppy trading expected. 


USD/JPY – Daily Analysis

The USD/JPY pair was closed at 102.716 after placing a high of 103.189 and a low of 102.603. On Tuesday, the currency pair USD/JPY came under resumed bearish pressure through the American trading hours and reached its lowest level in nearly ten months at 102.60. The intensified selling pressure surrounding the U.S. dollar in the second half of the day forced the USD/JPY pair on the lower side. The U.S. Dollar Index that measures the value of the greenback against the basket of six major currencies fell to its multi-year lowest level at 89.44 by 0.47% on Tuesday and weighed heavily on the USD/JPY pair.

The U.S. Dollar was also weak across the board ahead of the results of the Georgia runoff elections. The state of Georgia held runoff elections for its two Senate seats. The results will determine who gets to control the U.S. Senate for the next two years and will consequently have a profound impact on the course of U.S. fiscal policy. The U.S. Republican Party has been controlling the U.S. Senate since 2014, and markets are betting that the Republicans will still win at least one of the seats and cement its hold on the upper chamber of the U.S. Congress.

On the data front, at 04:50 GMT, the Monetary Base for the year from Japan raised to 18.3% against the forecasted 18.0% and supported the Japanese Yen that ultimately weighed on the USD/JPY pair. From the U.S. side, at 20:00 GMT, the ISM Manufacturing PMI from December rose to 60.7 against the forecasted 56.6 and supported the U.S. dollar, and capped further losses in the USD/JPY pair. The ISM Manufacturing Prices also raised to 77.6 against the projected 66.0 and supported the U.S. dollar that limited further losses in the USD/JPY pair. The Wards Total Vehicle Sales raised to 16.3M against the estimated 15.8M and supported the U.S. dollar that ultimately limited further losses in the USD/JPY pair.

Meanwhile, the rising demand for safe-haven appeal in the market also supported the safe-haven Japanese Yen that ultimately weighed on the USD/JPY pair. The U.K. entered into a third nationwide lockdown on Monday as the daily count of new coronavirus cases surpassed 60,000 figure for the first time since the pandemic started. The PM Boris Johnson said that it was crucial to control the spread of a new variant of coronavirus that was more contagious.

Meanwhile, Germany also stretched its nationwide lockdown until the end of the month and announced tougher new restrictions to curb rising cases of coronavirus infections. New York on Monday reported its first case of a new variant of the coronavirus that has been reported in more than 30 countries so far. In the past four days, the U.S. has added about 1 million new coronavirus cases that have pushed the total number of cases beyond 21 million. This rising number of cases across the globe added fears for the recovery of the global economy and increased the appeal for safe-haven that ultimately supported the safe-haven Japanese Yen and added weight on the USD/JPY pair on Tuesday.

Daily Technical Levels

Support   Resistance

102.49      103.08

102.24      103.44

101.89      103.68

Pivot point: 102.84

USD/JPY – Trading Tips

The technical side of the USD/JPY also remains mostly unchanged as the USD/JPY is trading sharply bearish at 102.74. On the downside, the USD/JPY pair may find support at the 102.595 level along with resistance at 102.930. The USD/JPY pair has formed a downward channel on the two-hourly timeframes, which is likely to keep the pair bearish. The MACD and 50 EMA is suggesting selling bias in the USD/JPY. Let’s consider taking sell trades below the 102.850 level today. Good luck!

Categories
Forex Basic Strategies

Two Ways To Trade The ‘Descending Top’ Chart Pattern Like A Pro

Introduction

The Descending Top is a technical chart pattern that frequently appears on the Forex price charts. Each peak of the price in this pattern is lower than its previous peak. The descending top chart pattern’s appearance indicates a downtrend in the market, and we must only look for sell trades at that point.

This pattern can be recognized when the first peak is lower than the second peak and the second peak is lower than the third peak. For instance, if the first peak is at 88.00, and the price drops down to 83.00, then the second peak at 85.00, and drop to 80.00, and if the next peak is below 85.00, we can see the descending top pattern forming on the chart, and we should then looks out for selling trade in an underlying asset.

If the next peak is higher than the previous peak, instead of being lower, the pattern gets invalidated, and the market goes up, or it will consolidate. We will often witness the descending top pattern on lower timeframes, and we should not be expecting this pattern to form on the higher timeframes. The reason is that in a higher timeframe, the pullback is very less, and even the trend soon comes to an end.

To identify the pattern, we must spot two tops on the price chart, which are descending, and then we must draw a line to connect these tops.

Descending Tops – Trading Strategies

Now that we know what a descending top pattern is, we will see how to combine it with other technical tools to trade this pattern.

Channel Trading

The first step is to identify the descending top pattern on the price chart. After that, identify the bottom between the two tops and draw a horizontal support line. Then wait for the break below the support line to enter a trade. Place the stop loss below the second top of the pattern and ride the trade. As we know, we cannot stay in a trade forever. We have to close our trade at some point. To close the trade, wait for the price to break the channel.

Example 1

As you can see in the image below, we have identified the descending top pattern in the EUR/USD 5 minute chart.

As you can see, when price action printed the pattern, we started preparing to take sell trades, and when the price broke below the most recent support area, it was a sure sign for us to go short. As we took the sell trade, the price immediately came back to retest the support area. Here, we choose to scale our trade at the support line and go for the brand new lower low.

Initially, our trade goes to a 1.1255 area, and we were looking for more profit in the trade. The trade failed to print the lower low furthermore, and it broke above the channel at around 1.274. Here, we choose to close our trade as that was a sign of the trend getting reversed. The Forex market is all about probabilities. We cannot expect the price to do what we want it to do. Instead, follow the rules of the game. When the market gives less profit, accept it, and don’t try to break the rules.

Descending Top Breakout Trading Strategy

As we know, the descending top is a pattern that gives the selling trades. But in this strategy, we will show you how to use it to take the buy trades. To enter a buying trade, we should wait for the price action to break above the descending top trend line. Your stop-loss order must be placed below the last bottom of the chart. Stay in the trade as long as price action prints the brand new higher high and exit your whole position when the prices break below the upper trend line.

The image below represents the descending top pattern on the price chart, and also it represents our entry, exit, and stop-loss in this pair. As you can see, when the price action prints the descending top pattern, it immediately goes down, and it prints the lower low.

In this one, we were looking for the breakout above the descending top chart pattern, and when the breakout happened, we were all set to take the buy trade. After our buy entry, price action prints a brand new higher high aggressively. When it gave the reversal signal, we choose to close our whole position, and the stops below the entry should be good enough.

Strategy Roundup

The descending top is a chart pattern that gave us potential selling trades. Trading this pattern is quite reliable, and when it gives the trading opportunity, we must trust it and go big. To identify this pattern, we must spot a price top, followed by a lower top. Take an entry below the most recent higher low and go for the brand new lower low and place the stop loss just above the entry. If you desire a safe trade, choose to place the stop loss above the first top.

We hope you find this educational article informative.  Let us know if you have any questions in the comments below. Cheers!

Categories
Forex Course

204. The Impact Of ‘Fixed Income Securities’ On The Forex Price Charts

Introduction

Fixed income securities are investments that offer returns in terms of fixed periodic interest payments and the return of principal at the end of the security period. Contrary to variable income securities, in which the payments vary depending on the underlying measure, the payment obtained in fixed income securities are recognized in advance.

What are the Types of Fixed Income Securities?

Following are the types of fixed income securities:

Bonds: They are among the common forms of fixed income securities issued by organizations to fund the daily operations to make sure smoother and efficient production. Granted that fixed-income bonds act as a liability for the missing company, it must be redeemed as soon as the company makes sufficient revenue.

Debt Mutual Funds: These funds leverage the collected corpus for investments in different variations of fixed income securities like commercial papers, government bonds, corporate bonds, money market instruments, etc. The main benefit of these investments is that you get higher returns in comparison to the convention.

Exchange-Traded Funds: Exchange-traded funds primarily function by investing in different types of debt securities present in the market. This produces regular as well as fixed returns. This way, they offer assured stability as returns are offered periodically at a particular rate of interest. These are popular among risk-averse investors who look for stability over market advantage.

Money Markets Instruments: Certain types of money market instruments like treasury bills, commercial papers, certificates of deposits, etc., are provided as investment opportunities at a fixed interest rate and therefore are categories under the fixed income securities. Moreover, these instruments are provided for a short duration where the maturity period stands less than a year.

The Effect of Fixed Income Securities on the Movement of Currency

Understanding the relationship between fixed-income securities and currency movement is quite straightforward. Economies that provide higher rates of returns on fixed income securities are likely to attract more investments.

This makes the currency more attractive than economies that provide lower returns on the fixed income market. To determine the yields derived by the securities, you can check the official government website of a specific country.

[wp_quiz id=”97508″]
Categories
Forex Market Analysis

GBPUSD Advances in an Irregular Correction. What’s Ahead?

The GBPUSD pair advances in an incomplete Elliott Wave Irregular Flat pattern that began on September 01st when the Pound found resistance at 1.34832. Currently, the price action moves in its wave (b) of Minuette degree identified in blue, suggesting a potential decline in the coming trading sessions.

Technical Overview

The big picture of the GBPUSD illustrated in the following daily chart shows the advance in an incomplete upward corrective sequence of Minute degree labeled in black, which began on last March 20th when the Pound found support and fresh buyers at 1.14098 developing a corrective rally. Once completed the three-wave upward sequence on September 01st at 1.34832, the price completed its wave ((a)) in black and began to advance in a sideways corrective formation corresponding to wave ((b)), which remains in progress.

The previous chart shows the incomplete wave ((b)), which at the same time, rallies in a corrective sequence corresponding to wave (b) of Minuette degree identified in blue. This corrective formation in progress could correspond to an irregular flat pattern (3-3-5).

On the other hand, both the trend and momentum indicator confirms the upward bias of wave (b). The stochastic oscillator that acts as a timing indicator carries to suspect the wave (b) could advance in a complex correction. In this regard, the next 8-hour chart illustrates the internal structure of the wave (b).

The second chart exposes the Pound advancing in a triple-three pattern of Subminuette degree labeled in green. According to the textbook, this complex formation identified as w-x-y-x-z follows an internal structural series subdivided into (3-3-3-3-3). In this context, the complex correction in progress looks advancing in its third segment of wave z, which seems like an ending diagonal pattern.

In consequence, the GBPUSD should end this complex corrective rally in the coming trading sessions giving way to a new decline corresponding to wave (c) of Minuette degree.

Technical Outlook

The short-term structure developed by GBPUSD corresponds to an ending diagonal pattern, which suggests the finalization of the current corrective rally before starting a new decline.

The next chart exposes the Pound in its 8-hour time frame, which could make a new upward move, surpassing the ending diagonal pattern’s upper-line with a potential target in the area between 1.3700 and 1.3800.

Once the ending diagonal pattern finalizes, a breakdown below the Invalidation Level at 1.3439 would confirm the start of wave (c) in blue. According to the Elliott Wave Theory, this bearish leg should follow an internal sequence subdivided into a five-wave sequence.

On the other hand, considering that the upper degree’s current corrective pattern might correspond to an irregular flat, the price might develop two potential scenarios identified as follows.

  • Scenario 1: If wave (c) finds support above the end of wave (a), the Pound could drop to the demand zone between 1.2916 and 1.2853. This scenario suggests the strong long-term bullish pressure and the Elliott Wave formation should correspond to an irregular flat pattern with the failure in wave (c).
  • Scenario 2: If the price drops violating the end of wave (a) at 1.26753, the GBPUSD could decline to the next demand zone between 1.2553 and 1.2506. This scenario suggests the strength of bearish pressure, and the irregular flat pattern is extended in wave (c).

The price advance in a complex correction is identified as a triple-three formation, which seems moving in its last internal segment, which looks like an incomplete ending diagonal pattern. In this context, the breakdown and close below the 1.3439 would confirm the end of wave (b) and the start of wave (c) of Minuette degree identified in blue.

Considering that the upper degree corrective structure could correspond to an irregular flat pattern, wave (c) offers two potential scenarios. The first scenario could see a potential target between 1.2916 and 1.2853. In the second one, the price could decline between 1.2553 and 1.2506.

Categories
Forex Videos

Forex In The New Year: How To Trade The EURUSD!


New year, where next for EURUSD pair?

Thank you for joining this oryx academy educational video.  

In this session, we will be looking at where next for the euro US dollar pair as the new year unfolds.

The pair’s bull run in February and March 2020 lifted it to 1.1400 and was driven by the pandemic beginning to take hold in the United States and weakening the dollar. However, as conditions worsened in Europe, the pair swung back in the other direction, to a low of 1.0700 in the market mayhem and volatility, which ensued as traders tried to decipher which economy was faring better than the other. 

 But as the US dollar index, a weighted indicator of the strength of the dollar against the so-called major currency pairs, including the euro, began to sink……

The Euro, which by volume is the largest traded major currency, moved higher to its current level of 1.22 at the time of writing. 

The reasons are largely twofold; firstly, the European Central Bank took measures to shore up the economies within the eurozone, which were seen to be sensible under the circumstances, and where are the pandemic seemed to be taking a breather in the eurozone area while still growing exponentially within the United States, causing harm to the American economy, and where it was perceived that perhaps the United States government were not being as cautious and sensible as the Europeans with regard to instigating lockdown measures including the wearing of masks and social distancing, and where their policies of stimulus, needed to shore up the US economy against the pandemic caused more dollars to be pumped into the system and thus affecting its value negatively.


Traders will be eyeing the 2018 high at 1.2469, as their next target, with the New year opening and traders looking to adopt longer view trading positions for the first quarter of 2021.

Potential for the continued upside momentum will be buoyed by the fact that the European Union will be rolling out vaccines to the population and where a free trade deal between the EU and UK was agreed on the 24th of December 2020, which will help give a lift to the euro because the worry of a negative economic impact of the UK leaving on WTO trading rules will have now abated.

Traders will also factor in that the relentless slide of the US dollar index below the key 90.00 level could cause further downside potential to 88.00 and even lower, again causing markets to buy Euros against the dollar.


Categories
Forex Psychology

Why Do We Sabotage Ourselves Emotionally in Trading?

We spend our entire childhood and adolescence learning to control and develop appropriate responses to our emotions. We learn from our teachers, from our parents, from society, and from our idols through observation and comparison. Therefore, we might think that most people have some control mechanism when they start trading. However, in practice many of us when we operate find ourselves struggling with our own emotions and losing control. While there are a wide variety of reasons that depend on each trader, these are the most common.

Unresolved Personal Problems

This is one of the main reasons why we always say that trading is a way by which we know ourselves. If there is a past problem that we have not solved or that we are not even aware of because the conditions have not been met for it to emerge, I can guarantee that by operating in the markets that problem will appear. In fact, until you identify him and confront him, the problem will resurface again and again. I’m sure you will. A fairly common situation that indicates the presence of a problem is that of a trader who wins consistently over a period of time and then returns everything to the market in a matter of minutes.

Self Reprobation

Simple but dangerous, self-deprecation puts us into a vicious circle that often begins with the mistake of not preparing properly to operate every day. You don’t prepare, you do something stupid and possibly avoidable, you’re angry at the time of surgery, you get depressed, you lose confidence in your abilities, and you make the mistake of not preparing for the next time. In trading, constant effort and results are everything, not just a single trade or a session. Negative emotions can not only be demoralizing and demoralizing but can also physically and mentally exhaust us.

Immediate Effect

When we are operating and need to perform some kind of action, it is often the strongest emotions that come into action just before executing our entry or exit order. This is perhaps the least easy aspect of overcoming without effective strategies to deal with it. When we suddenly have an emotion of any kind, we are inclined to act on it. The problem is that markets don’t care and, in fact, they move in a way that often aggravates the problem. Emotions distort the reality of what is happening and drive us to act in a way that is often counterproductive.

Based on these reasons we can find in our trade situations like the following (sure to sound to more than one!):

Greed leads us to risk more than we should, leveraging ourselves excessively and ruining the account quickly after a streak of winning operations that has led us to trust too much. It confirms a pattern we have studied but we are afraid to enter the operation and we end up joining the movement too late, buying or selling at the end of the movement.

When a trade goes against us, we decide not to assume the loss and expand or remove the stop loss thinking that the position will return to our favor, thus breaking with our trading plan. The reasons behind all these behaviors are the biases of the mind, some of which we have already seen in other articles on Psychology and Trading. In the case of emotional sabotage, three are the biases that fundamentally affect us:

Bias of Confirmation: This is the tendency to favour, seek, interpret, and recall information that confirms one’s beliefs or hypotheses, giving disproportionately less consideration to possible alternatives. Applied to trading, it would be the tendency to ignore the evidence that our strategies will make us money or the opposite: trust patterns not properly analyzed thinking that we will win when they are actually losers.

Bias of Recent Experience: It is a bias of our mind that comes to keep a sharper and more intense memory of the information we have received more recently, which implies that the context that we apply to our way of thinking at a given moment assumes the sum of memories or previous experiences weighted according to the closeness in time of such experiences or memories. This bias clearly explains why traders rely on excess if they have a winning streak, They hesitate to open a new position if they have had a bad streak or make bad decisions when they are not focused enough and chain several mistakes.

Media Bias: It is the tendency of the media to select the news and information with which it is intended to distort, distort, or lie about a certain fact. Applied to trading, the consequence would be to get carried away by the news published by the media, buying the trendy values, or following the new guru who appeared on television.

How to Overcome Emotional Sabotage?

I’m sure you’re tired of hearing it, but apart from the fact that this is a highly recommended practice to overcome emotional sabotage, it’s absolutely necessary: KEEP A TRADING JOURNAL! In that diary, you will have to tell things as they happened, which requires an important exercise of honesty with ourselves. Don’t blame the market and those who move it. Document what really went wrong and whether we were responsible for it.

The exercise of keeping such a diary honest with ourselves may involve encountering uncomfortable revelations but without a doubt, it is the best (and fastest) way to improve our trading since if we identify and correct the problem we detect (before we merge our account!), this could be a real change in our career as traders.

Additionally, an excellent idea is to create a checklist of our trading plan and make sure you have it in front of you all the time. It’s certainly hard to break the rules if we have them in front of us. By doing this we have another powerful tool to identify the root of the problem that causes emotional sabotage and allows us to correct it in real-time before we go ahead and make more mistakes that ruin our account.

Finally, another important recommendation is to learn to know yourself and how we act as traders. If we tend to make certain mistakes, are prone to be victims of certain biases, are confused by the excess of information, or let fear and greed cloud our judgment, then it will be necessary, to be honest with us and admit how we are, for better or for worse. Surely there will be some traits of our character that we will have to learn to correct if we want to succeed in trading but knowing who we are will allow us to make the most of our capabilities and minimize the impact of our weaknesses, thus minimizing the impact of emotional sabotage on our account.

Conclusion

In trading and in life, many times the key to success is knowing what is not to be done, so if bad habits and mistakes are costing us money, then like many traders you are struggling with emotional sabotage. And as if it were a disease, the sooner we detect emotional sabotage, the sooner it will be treated and we will avoid further damage.

A properly studied and analyzed strategy is our best weapon on the market, so once we have one we must let it work. Use your trading journal to detect emotional sabotage and be honest with yourself. Remember: just because the market does things that defy reason, doesn’t mean we have to do them too!

Categories
Forex Fundamental Analysis

EUR/JPY Global Macro Analysis – Part 3

EUR/JPY Exogenous Analysis

  • The EU and Japan Current Account to GDP differential

The current accounts have three basic components: net exports, the difference in incomes that countries pay each other, and transfer payments that countries make to each other. A country that has a surplus in international trade has a higher current account to GDP ratio. Since its domestic currency is in higher demand, it tends to appreciate. Conversely, a country with current account deficits will need to buy more foreign currencies to finance its imports – which weakens the domestic currency in the forex market.

In 2020, the Japanese currency account to GDP ratio was expected to drop to 3.5% while that of the EU 3.4%. This means that the 2020 current account to GDP differential between the EU and Japan is -0.1%. In this case, we expect a bullish JPY; hence, we assign a score of -2.

The interest rate differential between the EUR/JPY pair is used to determine whether traders are bullish or bearish. If the interest rate differential is positive, it means that traders can receive higher returns by selling the JPY and buying the EUR since the EUR offers higher returns. Thus, they are bullish on the pair. Conversely, if the interest rate differential is negative, it means that traders can receive higher returns by selling the EUR and buying the JPY, which means they will be bearish on the EUR/JPY pair.

In 2020, the Bank of Japan maintained the interest rates at -0.1% while the ECB maintained at 0%. Therefore, the interest rate differential for the EUR/JPY pair is 0.1%. We assign a score of 2.

  • The EU and Japan GDP Growth Rate differential

The rate at which an economy is growing impacts the strength of the domestic currency in the forex market. Since it is impractical to compare countries’ economic performance using absolute GDP numbers, we will use their growth rate. In this case, if the GDP growth rate differential is positive, it means that the EU economy has been growing at a faster pace than that of Japan hence a bullish outlook for the EUR/JPY pair. Conversely, when negative, it implies a bearish outlook for the pair.

The Japanese economy contracted by 3.5% in the first three quarters of 2020, while the EU economy contracted by 2.9. Thus, the GDP growth rate differential is 0.6%. Thus, we assign a score of 2.

Conclusion

The exogenous factors have a cumulative score of 2. That means we can expect a short-lived bullish trend for the EUR/JPY pair. The weekly EUR/JPY chart shows that the pair has crossed the 200-period MA for the first time since August and attempting a breach of the upper Bollinger band.

We hope you find this article informative. In case of any questions, please let us know in the comments below. Cheers.

Categories
Forex Fundamental Analysis

EUR/JPY Global Macro Analysis – Part 1 & 2

Introduction

The global macro analysis of the EUR/JPY forex pair will involve the analysis of endogenous and exogenous economic factors. The endogenous analysis will cover indicators that drive economic growth in the EU and Japan. Exogenous factors will cover the analysis of factors that impact the exchange rate between the Euro and the Japanese Yen.

Ranking Scale

We will use a scale of -10 to +10 to rank the impact of these factors. When the endogenous factors are negative, it implies that they resulted in the depreciation of the local currency. a positive ranking implies that they led to an increase in the value of the domestic currency. The ranking of the endogenous factors is determined by their correlation with the domestic GDP growth.

When the exogenous factors get a negative score, it means they have a bearish impact on the EUR/JPY pair. A positive score implies they’ve had a bullish impact. The ranking of the exogenous factors is determined by their correlation to the exchange rate of the EUR/JPY pair.

EUR Endogenous Analysis – Summary

The endogenous analysis of the EUR has an overall score of -3. Based on the factors we have analyzed, we can expect that the Euro had marginally depreciated in 2020.

JPY Endogenous Analysis – Summary 

A score of -12 implies a strong deflationary effect on the JPY currency pair, and we can conclude that this currency has depreciated this year.

  • Japan Employed Persons

This indicator measures the changes in the number of workers over a particular period. It only tracks the section of the labor force that has attained the minimum working age. Changes in the labor market are seen as leading indicators of economic development.

In October 2020, the number of employed persons in Japan increased to 66.58 million from 66.55 million in September. The number of employed persons in Japan is still lower than the 67.4 million recorded in January. We assign a score of -5.

  • Japan GDP Deflator

The GDP deflator is used to measure the comprehensive changes in the overall inflation of the Japanese economy. Since it measures the price changes of the entire economic output, it is used as a key predictor of future monetary and fiscal policies. An increase in GDP deflator means that the economy is expanding, which may lead to the appreciation of the JPY.

In Q3 of 2020, the Japan GDP deflator dropped to 100.4 from 103.5 in Q2. Up to Q3, the Japan GDP deflator has marginally increased by 0.2 points. We assign a score of 1.

  • Japan Industrial Production

This indicator covers the changes in the output value of mining, manufacturing, and utility sectors. The Japanese economy is highly industrialized. The industrial sector contributes approximately 33% of the GDP. That means the GDP growth rate in Japan is sensitive to the changes in industrial production.

The MoM industrial production in Japan increased by 3.8% in October 2020 while the YoY dropped by 3.2% – the slowest since February 2020. On average, the MoM industrial production in Japan is -0.15%. We assign a score of -5.

  • Japan Manufacturing PMI

About 400 large manufacturers are surveyed monthly by The Jibun Bank. These manufacturers are classified according to the sector of operations, their workforce size, and contribution to GDP. The overall manufacturing PMI is an aggregate of employment, new orders, inventory, output, and suppliers’ deliveries. The Japanese manufacturing sector is seen to be expanding when the PMI is above 50 and contracting when below 50.

In November 2020, the Japan Manufacturing PMI was 49 compared to 48.7 in October. The November reading is almost at par with the January levels. We assign a score of 1.

  • Japan Retail Sales

The retail sales measure the change in the monthly purchase of goods and services by Japanese households. Since it is a leading indicator of consumer demand and expenditure, it is best suited to gauge possible economic contractions and expansions.

In October 2020, Japan retail sales rose by 0.4% from 0.1% recorded in September. YoY retail sales increased by 6.4%, which marks the first month of increase since February 2020. The growth of retail sales is mainly attributed to an increase in motor vehicle sales, machinery and equipment, and medicine & toiletry. On average, the first ten months of 2020 have had a 0.4% increase in MoM retail sales. Thus, we assign a score of 2.

  • Japan Consumer Confidence

This is a monthly survey of about 4700 Japanese households with more than two people. The survey covers the households’ opinion on the overall economic growth, personal income, employment, and purchase of durable goods. An index of above 50 shows that the households are optimistic, while below 50 shows that they are pessimistic.

In November 2020, Japan’s consumer confidence was 33.7 – the highest recorded since March. It is, however, still lower than the pre-pandemic levels of 39.1. We assign a score of -3.

  • Japan General Government Gross Debt to GDP

Prospective domestic and international lenders use the government debt to GDP ratio to determine the ability of an economy to sustain more debt. Among the developed nations, Japan has the highest government debt to GDP ratio. However, it has minimal risk of default since most of the debt is domestic and denominated in Japanese Yen, which poses a low risk of inflating the domestic currency in the international market.

In 2019, the general government gross debt to GDP in Japan was 238%, up from 236.6% in 2018. In 2020, it was projected to hit a maximum of 250%. We assign a score of -3.

In our upcoming article, we have performed an Exogenous analysis of the EUR/JPY Forex pair and gave our optimal forecast. Make sure to check that out. Cheers.

Categories
Forex Course

203. Bond Spreads Between Two Economies and Their Exchange Rate

Introduction

Bond spreads play a vital role in the movement of currencies. The difference between the bond yield of two countries is called interest rate differential. It is more impactful on the currency direction as opposed to the actual bond spreads. The difference between the interest rate between the bond yield of two countries typically moves together with the corresponding currency pair.

Understanding The Impact

The prices of different currencies can influence the monetary policy decision by the central banks across the globe. However, monetary policy decisions, as well as interest rates, can also contribute to the price movement of the currencies. For example, a stronger currency will help control the inflation rate, whereas the weaker currency will contribute to inflation.

Additionally, the central banks harness this relationship as a means to manage the monetary policies in the respective countries. By comprehending as well as assessing these relationships and the patterns, people get a window into the currency market, thereby getting a means to forecast and capitalize on the currency movements.

An Example of This Relationship

In 2000, post the tech bubble burst, traders who were earlier looking for the highest returns shifted their focus on capital preservation. However, the U.S. was provided with below 2% interest rate, a lot of hedge funds, and those who had access to the international market moved abroad looking for higher yields.

Moreover, Australia has similar risk factors as the U.S. extended interest rate of 5%. Consequentially, this attracted a lot of investment money within the country, creating asset domination. This significant difference in interest rate resulted in the growth of the carry trade. In this, the investors bought currency from low yielding countries and invested in high yielding countries, and benefited from the difference in the interest rate.

Bond Spreads and Movement Of Currency

Bong spreads differential typically move together with currency pairs. This notion emerges as the capital flows move towards high yielding currencies. When there is an increase in one currency rate with respect to another currency, the investors move towards the higher-yielding currency.

Furthermore, the cost of acquiring lower-yielding currencies rises as the bond spread differential moves in favor of selling currency.

[wp_quiz id=”97499″]
Categories
Forex Market Analysis

Daily F.X. Analysis, January 04 – Top Trade Setups In Forex – Manufacturing PMI In Focus! 

On the news front, eyes will remain on the Manufacturing PMI and Services PMI figures from the Eurozone, U.K., and the United States. Almost all economic figures are expected to perform better than previous months, perhaps due to a lift of lockdown. Price action will depend upon any surprise changes in the PMI figures.

Economic Events to Watch Today  


EUR/USD – Daily Analysis

The EUR/USD pair was opened at 1.22387, and it has placed a high of 1.22584 and a low of 1.22276 so far. The currency pair is currently moving at 1.25514 and has shown a consolidative move since the start of the day.

The U.S. dollar was weak across the board on Monday and the starting day of the week and pushed the currency pair EUR/USD higher on board. However, the EUR/USD pair’s gains remained consolidative ahead of the release of macroeconomic data from the European side.

At 13:15 GMT, the Spanish Manufacturing PMI for December is forecasted to come in as 52.6 compared to November’s 49.8, which, if met, will be supportive to the single currency Euro and will probably add gains in EUR/USD pair. At 13:45 GMT, the Italian manufacturing PMI for December is also expected to surpass the previous 51.5 and come in as 53.5 and support the single currency Euro to add further gains in EUR/USD pair. At 13:50 GMT, the French Final Manufacturing PMI is projected to remain flat at 51.1 for December. At 13:55 GMT, The German Final Manufacturing PMI for December is also projected to remain the same as November’s 58.6. At 14:00 GMT, the Final manufacturing PMI for December from the whole Eurozone is also expected to remain flat at 55.5.

From the U.S. side, at 19:45 GMT, the Final Manufacturing PMI from the U.S. for December is anticipated to release as 56.3 against the previous 56.5 and weigh on the U.S. dollar be beneficial for EUR/USD pair. At 20:00 GMT, the Construction Spending for November is estimated to decline to 1.1% compared to the previous 1.3%, and if the actual meet the expectations, then EUR/USD will gain more as the U.S. dollar will become weak.

Apart from macroeconomic data, the gains in EUR/USD pair were very limited at the start of the trading session as the rise in coronavirus cases in Europe urged the countries to get ready to extend lockdowns to control the spread of the virus. Not in Europe, but all countries across the world, including UK, Canada, India, the USA, Japan, and Mexico also have seen a rise in the number of infection cases that has prompted the need for safe-haven and resulted in the consolidative movement of EUR/USD pair on Monday.

The risk perceived EUR/USD pair faced pressure while moving upward as the risk sentiment in the market deteriorated after the rising number of coronavirus cases throughout the globe. However, the currency pair EUR/USD remained on the plus side as the European countries have started immunizing people against coronavirus in earnest, but huge discrepancies in vaccination pace exist.

Meanwhile, the U.S. dollar was also weak ahead of Tuesday’s Georgia runoff elections that will decide the control of the U.S. Senate and also the fate of President-elect Joe Biden’s legislative agenda. Whereas, Senate ended the demand for an increase in direct payments from $600 to $2000 by Donald Trump and supported by Democrats as Republicans did not approve it and weighed on the U.S. dollar that ultimately kept the EUR/USD pair higher.

Daily Technical Levels

Support   Resistance

1.2179      1.2279

1.2144      1.2344

1.2078      1.2379

Pivot Point: 1.2244

EUR/USD– Trading Tip

The EUR/USD is trading with a bearish bias today at the 1.2248 level, having violated the upward trendline at the 1.2252 level. Closing of candles below this trendline confirms a breakout, and there’s a strong odd of selling trend’s continuation until 1.2203. The next support may be found around the 1.2175 level below this, along with resistance at 1.2258 and 1.2313. The 50 periods EMA is likely to extend resistance at the 1.2262 level, and supporting selling trend in the EUR/USD today! 


GBP/USD – Daily Analysis

On January 04, the currency pair was opened at 1.36471, and it has placed a high of 1.36982 and a low of 1.36436 so far. The pair is currently moving at 136884 and is rising to place gains for the 4th consecutive session on Monday. The U.K. was enjoying its first trading session as an independent nation on Monday as the transition period for Brexit ended on Thursday when the United Kingdom finally ended its ties with the European Union, almost a year after its formal departure from the 27-nation bloc.

After four and a half years, when the majority in the U.K. voted to leave the European Union, the end of the transition period was a significant moment in the history of the U.K. Great Britain will now forge a separate path after almost five decades as part of the bloc. 

According to PM Boris Johnson, Britain will be an open, generous, outward-looking, internationalist, and free-trading country free to do things differently and, if necessary better than the E.U. On Sunday, the PM Boris Johnson said that he intended to carry on as a prime minister after Brexit.

Although the British Pound will see a selling pressure given the impact of Brexit sooner or later, the investors were favoring the currency in the beginning hours of the trading session ahead of the macroeconomic data or any major news as after a long fight between the E.U. & U.K.; the country has departure from the E.U. with a deal beneficial for both sides successfully.

At 14:30 GMT, the Final Manufacturing PMI for December is expected to remain flat at 57.3. The Mortgage Approvals from Britain in November are expected to decline to 82K from October’s 98K and weigh on British Pound that could drag the pair GBP/USD lower. The Net Lending to Individuals for November is also expected to decline to 3.0B from October’s 3.7B and weigh on British Pound and limit the GBP/USD pair’s upward trend. Furthermore, the pair was also supported in the Asian session due to the weakness of the U.S. dollar on Monday. The U.S. dollar was weak due to the broad market optimism and rallying equities. Some news from the U.S. Congress unveiled that Nancy Pelosi was re-elected as the U.S. House Speaker, which indicated an easy way for further stimulus. 

Meanwhile, Georgia’s electoral runoff will also decide the Senate majority’s fate and will be crucial to watch on Tuesday. All these developments kept the greenback under pressure and supported GBP/USD’s rising prices on Monday during the early session.

Apart from Brexit and U.S. headlines, the currency pair came under pressure as the market’s risk sentiment was affected by the increase in the number of coronavirus cases throughout the globe. 

The rising number of infections from COVID-19 raised fears that countries might extend the restrictions that would have a negative impact on global economic recovery. These fears kept the risk perceived GBP/USD pair under pressure and kept its gains limited during the Asian session on Monday.

Daily Technical Levels

Support   Resistance

1.3623      1.3705

1.3573      1.3737

1.3540      1.3788

Pivot Point: 1.3655

GBP/USD– Trading Tip

The GBP/USD pair has also violated the resistance level of 1.3617 level, and on the higher side, the next target remains at the 1.3698 level. On the lower side, the GBP/USD pair may find support at the 1.3617 level for now. We can expect a continuation of an upward trend in the Sterling today. The 50 periods EMA is supporting bullish bias at the 1.3600 level, and at the same time, the upward channel is also likely to keep Sterling bullish on Monday. Let’s consider taking buying trades over 1.3609 and selling below the 1.3698 level today. 


USD/JPY – Daily Analysis

On January 04, the USD/JPY opened at 103.096, and it has placed a high of 103.314 and a low of 102.932 since then. The pair USD/JPY was currently moving at 103.023 and was placing losses for the day.

In the Asian trading session, the U.S. dollar was down on Monday, with investors continuing to put pressure on the safe-haven assets on the first trading day of 2021. The rising expectations that the U.S. interest rates will remain low and hopes for an eventual global economic recovery from coronavirus will likely continue to slow the dollar down against other major currencies.

The U.S. Dollar Index that measures the value of the U.S. dollar against the basket of six major currencies was down by 0.25% to 89.67 on the day to slightly below the level it ended 2020 at 89.766. The U.S. dollar weakness added to the downward momentum of the USD/JPY pair on Monday.

The Federal Reserve is due to release the minutes from its December meeting on Wednesday. Investors will be looking for more detail on the discussions about making their forward policy guidance more explicit and the chance of a further increase in asset buying in 2021. Meanwhile, the USD/JPY pair was also down in early trading hours on Monday as the rising number of coronavirus cases throughout the world raised the safe-haven appeal in the market. 

On Sunday, Prime Minister Boris Johnson warned that severe lockdown restrictions would be installed in England to fight against the new variant of coronavirus that has pushed the infection rates to their highest record levels. Whereas, School unions have raised called for the closure of all schools for a couple of weeks as the virus was spreading faster, but Johnson said to parents that they should send children to school as the threats to young kids from the deadly virus were very small.

Meanwhile, on Saturday, Canada reported an estimated 4800 more cases of the deadly coronavirus that added to the country’s total caseload and made it 586,425. Canada said that the rise in the number of coronaviruses was seen after the holiday season. In India, 16,660 fresh cases were reported in a single day that sent the total number of infections to 10,341,291. 

Americans have been reported to flee to Mexico to avoid the lockdown restrictions back at home. According to Times, about half a million Americans traveled to Mexico in November, whereas Mexico has reported an increase in the number of coronavirus cases in November and December.

The global sum of coronavirus cases reached 85,489,058, out of which 60,443,211 have recovered, and 1,850,202 have died so far. The U.S. cases reached a total of 21,110,917 number and remained the worst-hit county by the world’s coronavirus. Despite the vaccine rollout, the rising number of coronavirus cases throughout the globe added to the fears that countries will enter new lockdown restrictions and affect global economic recovery. These fears raised the market’s safe-haven appeal and supported the safe-haven Japanese Yen that ultimately weighed on the USD/JPY pair. 

On the data front, at 05:30 GMT, the Final Manufacturing PMI in December came in as 50.0 against the expected 49.7 and supported the Japanese Yen that added in the losses of the USD/JPY pair on Monday. From the U.S. side, at 19:45 GMT, the Final Manufacturing PMI from the U.S. for December is projected to come as 56.3 against the previous 56.5 and weigh on the U.S. dollar add in the losses of USD/JPY pair. At 20:00 GMT, the Construction Spending for November is estimated to decrease to 1.1% against the previous 1.3% that could weigh on the U.S. dollar and USD/JPY pair as well.

Daily Technical Levels

Support   Resistance

103.02      103.34

102.85      103.49

102.70      103.66

Pivot Point: 103.17

USD/JPY – Trading Tips

The USD/JPY is trading sharply bearish at 102.940, gaining support at the 102.940 level. The USD/JPY pair has formed a downward channel on the two-hourly timeframes, which may extend resistance at 103.300 as at the same level 50 periods EMA is also extending resistance. Today, we need to keep an eye on the 102.940 mark as a violation of this may offer us a sell trade until the 102.598 level. The MACD and RSI are suggesting selling bias in USD/JPY today. Good luck!

Categories
Forex Signals

EUR/USD Completes Retracement – Brace for a Bullish Correction! 

The EUR/USD is trading with a bearish bias today at the 1.2248 level, having violated the upward trendline at the 1.2252 level. Closing of candles below this trendline confirms a breakout, and there’s a strong odd of selling trend’s continuation until 1.2203. The next support may be found around the 1.2175 level below this, along with resistance at 1.2258 and 1.2313. The 50 periods EMA is likely to extend resistance at the 1.2262 level, and supporting the selling trend in the EUR/USD today; however, we are taking a buying trade as the pair is forming Doji, and it may bounce off to continue trading bullish. 


Entry Price – Buy 1.226

Stop Loss – 1.222

Take Profit – 1.23

Risk to Reward – 1:1

Profit & Loss Per Standard Lot = -$400/ +$400

Profit & Loss Per Micro Lot = -$40/ +$40

Fellas, now you can check out forex trading signals via Forex Academy mobile app. Follow the links below.

iPhone Users: https://apps.apple.com/es/app/fasignals/id1521281368

Andriod Users: https://play.google.com/store/apps/details?id=academy.forex.thesignal&hl=en_US


Categories
Forex Course

202. The Effects Of Bond Yields On The Forex Asset Classes

Introduction

Bonds are referred to as loans provided to big organizations, including national governments, corporations, and cities. Each bond includes a substantial amount of loan. This is because the massive operational scale of the units requires them to take money from multiple sources. Bonds are a form of fixed-income investments.

Bond Yields

Bond yield is defined as the measure of profit that you will make by investing in a bog. The less you pay for the particular bond, the more will be your profit, and the higher your yield will be. Similarly, the more money you invest in a bond, the lesser will be the profit, and subsequently, the lower will be your yield.

Bonds are traded within the foreign exchange market known as the currency pairs. It is defined as the relative rate between the currency of one country and the currency of another one. When a currency pair is traded, the traders are also acquiring one currency and selling the other.

A majority of the currency exchange transacted in the spot market. In this currency market, each participant is required to deliver their respective currency within two business days. Moreover, currency trade that involves the delivery of a currency over two days is executed on the forward market.

This market includes the costs of owning a currency relative to owing the other. And the costs are displayed in the forward’s points that are added or subtracted to the spot rate in order to produce the forward rate. Furthermore, the forward points are measured by subtracting one bond yield from the other.

How Bond Yield Impacts The Currency Movement?

Experienced foreign exchange traders will be able to identify the relationship between the value of the currency, stock prices, and bond yield. The movement in the currency value reflects the actions of foreign investors between stocks and bonds.

Additionally, the relationship between bond yields makes government bond yield serve as a valuable indicator for assessing the opinion on the effectiveness of the U.S. Federal Reserve in inflation control.

Considering that inflation is an imperative aspect that determines currency values, the data extended by the treasury is very important. Granted, the bond yield centres on inflation, as it is associated with growth.

[wp_quiz id=”97495″]
Categories
Forex Course

201. The Relationship Between The US Dollar & Crude Oil

Introduction

There is a strong and rather undiscovered string that brings together currencies and crude oil. Price actions in one area, it forces opposing or sympathetic reactions in the other. Such a correlation persists for different reasons that include the balance of trade, resource distribution, market psychology, etc.

Additionally, crude oil makes a considerable contribution to deflationary and inflationary pressures that reinforces the inter-relationships amidst the trending periods, to downside and upside.

The Relationship Between The U.S. Dollar and Oil

Oil is quoted in U.S. dollars; therefore, each downtick, as well as an uptick in the currency or in the communities price, create a direct realignment between the numerous forex crosses and greenbacks. Such movements are not that correlated in countries without major crude oil reserve.

The Changing Scenario Of Oil Correlations

Many countries harnessed the crude oil reserved amidst the historical rise of the energy market between the 1990s and 2000s. Borrowings were made excessively to develop infrastructure, execute social programs, and expand military operations.

Post the economic collapse of 2008; the bills came to sue wherein some nations delivered whereas the others decided to double down by borrowing more against the reserved in order to rebuild the trust among their impacted economies.

The substantial burden of debt assisted in keeping high growth rates until the price of the global crude oil collapses in the year 2014. This also threw commodity-sensitive countries in a recession zone. Brazil, Canada, Russian, etc. experienced a struggling period for a couple of years while they adjusted to the plummeting values of their currencies. However, they did make a comeback between 2016 and 2017.

The pressure to sell more has spread across different groups of commodities, increasing concerns related to global deflation. Subsequently, it strengthened the correlation between commodities that were affected that include economic centres without major commodity reserves and crude oil.

Moreover, currencies in countries that have major mining reserves but inadequate energy reserves witness reduced currency value in comparison to oil-rich countries.

The U.S dollar has benefited from the decline of crude oil because the U.S economic growth is for some odd reasons compared to the trading partners, maintaining the right balance.

[wp_quiz id=”97491″]
Categories
Forex Videos

What Can Slow Down Forex Momentum & What Are The Best Times To Trade?


What can slow down forex trading momentum?

Thank you for joining this forex academy educational video.


In this session, we will be looking at the question of what can slow down forex trading momentum.

The forex market reportedly turns over more than 5 trillion dollars every trading day.  It is the most liquid business on the planet.  And it keeps growing, with the retail side of the business maintaining steady growth, with extra brokerages opening up, and more and more ordinary people trading online from home. The growth of the educational side of the market is also helping to attract would-be traders with promises of unknown secrets being opened up to them and quick riches to be made trading Forex.

While these topics are great material for another video, today we need to get back to the point of forex trading momentum, where one moment the market is absolutely flying about with lots of liquidity and volatility, with huge swings on price action, and exchange rates moving over 100 to 200 pips in a session and then suddenly stopping almost in its tracks and flattening out during periods of consolidation.  So, what causes this?

There are several reasons.  But first of all, let’s take a look at the biggest reason.  Here is a timetable of the trading centres where Forex trading goes on 24-hours a day, 5 days a week.

The time zones are based on Greenwich mean time in this example, and we can see that London, including Frankfurt, begins its trading day around 7 AM in the morning, New York follows from 12 noon, Sydney joins the markets shortly after 9 p.m., with Tokyo joining the market at about 11 PM. 

As with many other businesses, typically, you will find a surge of activity when people begin their day’s work. The forex market is no different. Traders start work at the desks and need to make money as quickly as possible because that’s what they get paid to do and because they will have orders from paying clients that need entering into the market for varying reasons, including hedging, closing out winning trades from overnight or longer time frames, closing out losing trades from overnight or longer timeframes or simply fresh speculative orders to be executed.  They also need to manage or correct positions where they may have gone home in the evening, and the later session pushed particular trades in an unexpected trend. Plus, they will need to try and make money with their own bank’s trades. 

And just like most people, energy levels tend to fade off after a couple of hours from starting work, and people need a break.  And that is why shortly after the beginning of the London and European session and the Sydney and Tokyo sessions, we begin to see lulls in the market after a couple of hours of trading. This also happens during the latter stages of the US session. 

However, this does not include the morning of the New York session, and the key reason is there will likely be economic data releases from the United States during their morning, where the US dollar, being the most widely traded currency, has a greater propensity to affect market direction after the release of economic data than any other release.

And so, another reason for lulls in market activity can be attributed to traders waiting for key market economic data to be released, and where the higher the likely impact of the data, the more likelihood of caution before the data release, which can cause flattening in exchange rates, while traders anticipate the release.

Another major reason for quiet times is the ending of the New York session and the beginning of the Asian session and where it is not unusual for the five areas to have varying views about where are forex exchange rates should be, which adds to the ebb and flow of the foreign exchange market and where typically as well as the slow down which is reflected on charts by periods of consolidation, we can often see price reversals and trend changes in trend direction at the end of one session and a beginning of another.

Categories
Forex Videos

Forex – How To Sell At The Top & Buy At The Bottom!


How to sell at the top and buy at the bottom

Thank you for joining this Forex Academy educational video.

In this session, we will be looking at one of the oldest adages in trading: sell at the top and buy at the bottom.  And how can this be implemented in your trading for maximum results?

20 years ago, financial markets, including foreign exchange, were driven by fundamental analysis over technical analysis.  That is to say that professional traders and analysts would base their trading around fundamental economic data, including policy-making decisions, interest rates, GDP, inflation, and political events, including wars. Technical analysis was in its infancy.  In these times, it was much easier to predict where the bottoms and tops of assets were likely to be based on fundamental reasons alone. 

Today, things have completely flipped to the opposite side. Technical analysis is heavily dependent upon where chart patterns dominate price movement and where fundamental reasons for trading often lag behind technical and sometimes seem to defy logic.

You only have to take a look at the Dow Jones 30 industrial average index, which is at an all-time record-breaking high of over 30,000 while the US economy is still struggling because the pandemic still has it in its grips.  Fundamental analysis has gone out of the window on the basis that technical analysis is fuelling the US stock market to the upside, where hopes of a vaccine roll-out outweigh the fact that hospitals are currently at extremely high levels for covid patients, and where a new bleak record was passed this week of over 3000 deaths in a single day in the United States. Similar circumstances, albeit non-pandemic related, perhaps more to do with an overpriced stock market fuelled by the success of the 1920s where share trading on margin was rife probably caused the famous 1929 US stock market crash, which took years to recover from.  

Currently, the US market is also buoyed by hopes of extra stimulus by the federal governments and where this money is finding its way into the stock market. Even so, the market is overbought, does not comply with earnings per share, and yet is still relentlessly bid.

Even so, where is the top? It is difficult to say in this hyped market, which is pulling back from every attempt to short it.

If the market reaction is so extreme and fundamental analysis is second to technical analysis, traders have to be on their guard and look for several signs that the market is topping or bottoming out to find a good entry point to trade in either direction.

In this daily chart of the GBPUSD pair, we can see a huge push lower at position A during the middle of March 2020, where Britain began to fall into the grip of the coronavirus, which plunged the exchange rate to 1.1400.  Buyers were looking for an opportunity to go long because this was seen as the bottom of the bear move.

We have a high in September at position B, where there is a spike outside of the Bollinger band, where the candlestick is an upturned bearish hammer, and where the subsequent candlesticks are bearish, providing the trader with the knowledge that this is potentially a top at 1.3485. A subsequent high at position C, with a bearish hammer spiking out of the bands, provides chartists with a potential top at 1.3535.

Incorporating these simple chart lines at positions, A B, and C helps us visualize trend reversals.  Once we have one or two candlesticks on the daily chart confirming that there is indeed a trend reversal in progress, we can drill down into lower time frames, as intraday traders, to look for opportunities to go short or long.  We must never ignore fundamental reasons for taking a trade on. However, based on what has been set out today, we must conclude that fundamental analysis often lags behind technical analysis and therefore, by looking at swings in price action forming tops and bottoms outside of periods of consolidation,  traders give themselves a better edge while stacking the odds in their favor and trading in line with institutional size traders who typically trade in this manner.

In conclusion, we are in an age where fundamental analysis often has no bearing on an asset price and where technical analysis and fundamental analysis are often out of kilter,  but where eventually with two will catch up with each other.

Traders best opportunities of bagging more pips must be centered around reversals in price action based on longer time-frames such as daily charts, before drilling down into lower time frames such as an hourly chart and trade in the direction of the daily chart trend, to stack the odds in their favor of a successful trades, while never forgetting the importance of the fundamental reasons why a currency pair exchange rate might potentially be changing direction.

Categories
Forex Fundamental Analysis

EUR/CAD Global Macro Analysis Part 3

EUR/CAD Exogenous Analysis

  • The EU and Canada Current Account to GDP differential

When a country has a high current account to GDP ratio, it means that it is running a current account surplus. That implies that the country is highly competitive in international trade as the value of its exports is higher than its imports. Conversely, a country with a low or negative current account to GDP ratio, is running a current account deficit. It means that the value of its imports is higher than exports.

In 2020, Canada’s current account to GDP is expected to hit -2.7% while that of the EU 3.4%. Thus, the current account to GDP differential between the EU and Canada is  6.1%. This means that the EUR is in higher demand in the international market than the CAD. We assign a score of 5.

In the forex market, interest rate differential helps to show investors and traders which currency will earn them higher returns. In a carry trade, forex traders tend to be bullish on the currency that offers a higher interest rate differential. This means that the currency with the higher interest rate will have a higher demand than the lower interest rate.

The European Central Bank has maintained interest rates at 0% throughout 2020, while in Canada, interest rates were cut from 1.75% to 0.25%. Thus, the interest rate differential for the EUR/CAD pair is -0.25%. We assign a score of -2.

  • The EU and Canada GDP Growth Rate differential

Since countries vary in the economy’s size, it makes it hard to compare them based on absolute GDP. However, the GDP growth rate helps filter out the effects of the economy size and instead compares countries based on their growth.

From January to September 2020, the Canadian economy has contracted by 4.3% while the EU economy has contracted by 2.9%. That means that the GDP growth rate differential between the EU and Canada is 1.4%. i.e., the Canadian economy has contracted more than the EU economy. We assign a score of 4.

Conclusion

The exogenous analysis of the EUR/CAD pair has a score of 8, which means we can expect a bullish trend for the pair in the short-term. This is supported by our technical analysis, which shows the weekly chart bouncing off the lower Bollinger band, implying that an uptrend is looming.

We hope you find this article informative. In case of any queries, please let us know in the comments below. All the best.

Categories
Forex Fundamental Analysis

EUR/CAD Global Macro Analysis Part 1 & 2

Introduction

The global macro analysis of the EUR/CAD pair will analyze endogenous factors that drive the domestic GDP in the EU and Canada. We’ll also analyze exogenous factors that affect the dynamics of the EU and Canada economies, hence affecting the EUR/CAD exchange rate.

Ranking Scale

We’ll rank both endogenous and exogenous factors on a sliding scale from -10 to +10. When the endogenous factors are negative, it means they caused the domestic currency to depreciate. A positive ranking means they resulted in an appreciation of the currency during the period under review. The endogenous scores are based on correlation with the domestic GDP growth.

Similarly, when the exogenous factors get a negative score, they resulted in a drop in the exchange rate. A positive exogenous score means it increased the exchange rate of the EUR/CAD pair. The exogenous scores are based on a correlation with the price of the EUR/CAD pair.

EUR Endogenous Analysis – Summary

The endogenous analysis of the EUR has presented a score of -3. Based on the indicators that we have analyzed, we can conclude that the Euro has depreciated marginally this year.

CAD Endogenous Analysis – Summary

This economic indicator shows the monthly change in the number of Canadians who are employed. It covers both full-time and part-time employment. Normally, employment changes correspond to an increased business activity, which corresponds to changes in the GDP.

In November 2020, employment in Canada increased by 62,000, down from the 83,600 increase registered in October. The November employment change was the lowest since May 2020, when economic recovery from the effects of the coronavirus began. Up to November 2020, the Canadian economy has shed about half a million jobs. We assign a score of -6.

  • Canada GDP Deflator

The GDP inflator is a comprehensive measure of the change in the inflation rate in Canada. It is comprehensive since it reflects the changes in the prices of all goods and services produced within the economy. This contrasts with other measures of inflation like the CPI, which only measures changes in the price of a select basket of goods and services.

In Q3 of 2020, the GD deflator in Canada rose to 111.6 from 108.8 in Q2. Q3 reading is the highest ever in the history of Canada. This shows that the Canadian economy is bouncing back from the economic downturn brought about by the pandemic. We assign a score of 2.

  • Canada Industrial Production

This indicator measures the total output from businesses operating in the industrial sector. Canadian industrial production comprises mining, manufacturing, and utilities. It is the backbone of the Canadian economy, with crude oil production alone accounting for almost 10% of the GDP.

In September 2020, the YoY Canadian industrial production dropped by 7.9%, while the MoM increased by 1.41%, up from the 0.13% drop in August. Up to September, the overall industrial production is down 5.54%. We assign a score of -5.

  • Canada Manufacturing PMI

This indicator measures the Canadian manufacturing sector’s performance from the perspective of firms’ purchasing managers in the sector. The PMI aggregates the following indexes; inventories, employment, new orders, output, and suppliers’ deliveries. The sector is expanding if the index is above 50, while a reading below 50 shows contraction.

In November 2020, the Canada Manufacturing PMI rose to 55.8 from 55.5 in October. This marked the fifth consecutive expansion in the manufacturing sector from July 2020. Thus, we assign a score of 4.

  • Canada Retail Sales

The Canada retail sales data measures the changes in the value of final goods and services purchased by households over a particular period. It is a critical leading indicator of the overall economic growth since households’ consumption is considered the primary driver of GDP growth.

In September 2020, the MoM retail sales in Canada increased by 1.1%  compared to a 0.5% increase in August. YoY retail sales rose by 4.6% compared to 3.7% in August 2020. Up to September 2020, the retail sales figure has risen by an average of 1.38%. We assign a score of 3.

  • Canada Consumer Confidence

Canada consumer confidence is calculated from an aggregate of 11 questions from the survey of households. This survey estimated the current situation to that expected by households in about six months. The questions touch on the areas of the economy, personal finances, job security, household purchases, and savings vs. expenditure goals. Their confidence is measured on a scale from 0 to 100.

In November 2020, consumer confidence in Canada rose to 44.5 from 42.08 in October. It is, however, still lower than during the pre-pandemic period. We assign a score of -5.

  • Canada Government Gross Debt to GDP

In 2019, Canada had a government debt to GDP ratio of 88.6%, down from 89.7% in 2018. The 2019 ratio was the fourth consecutive year since 2016, when the government debt to GDP ratio dropped.

In 2020, it is projected that the Canadian government debt to GDP ratio will increase to 97%. This increase is due to the increased expenditure to alleviate the economy during the coronavirus pandemic. Over the long term, Canada’s government debt to GDP ratio is expected to stabilize around 90%. We assign a score of -2.

In the next article, you can find the exogenous analysis of the EUR/CAD forex pair where we have qualitatively forecasted the future price movement of this pair. Cheers.

Categories
Forex Course

200. The Correlation Between USD/CAD Pair & Crude Oil

Introduction

Crude oil, also known as black gold, is the major energy source that runs the economy. Canada is among the top oil producers in the world. It is one of the major oil exporters to the USA. Canada exports more than 3 million barrels of petroleum and oil products, a figure that is sufficient to impact USD/CAD’s movement.

USD/CAD and Crude Oil – The Correlation

The volume of crude oil that Canada exports to the US generate massive demand for the CAD. Moreover, Canada’s economy depends a lot on its exports, and approximately 85% of the country’s exports go to the US.

Therefore, the value of USD/CAD is significantly impacted by how the consumers in the United States reach oil prices. If the US’s demand increases, manufacturers have to order more oil to cater to the rising demand. This can result in rising oil prices, thereby resulting in reducing the value of USD/CAD.

Conversely, if the US’s demand falls, the manufacturer will not need to order in more oil to make goods. Subsequently, the oil prices might fall, which would be bad from the CAD value. So essentially, USD/CAD has a negative correlation.

It’s all about Supply and Demand

Supply and demand are the prominent influencers of the correlation between USD/CAD and crude oil, impacting the demand and supply of US dollars and Canadian dollars.

Export of cruise oil covers a significant percentage of the US currency acquired by Canada. This means that a shift in the price and volume of crude oil will have a considerable impact on the flow of the Greenback into the Canadian dollar.

Furthermore, high crude oil prices also imply a higher flow of USD into Canada due to its exports. This implies that there will be a strong supply of the USD into the Canadian dollar, thereby increasing the value of the Canadian dollar.

Similarly, when the crude price falls, the US dollar supply will be lowered as opposed to the Canadian dollar, leading to a decreasing value of the Canadian dollar.

[wp_quiz id=”97486″]
Categories
Forex Market Analysis

USD/JPY Complex Correction, What does that mean for Traders?

The USDJPY pair is progressing in an Elliott wave complex correction identified as a triple-three pattern (3-3-3-3-3) of Minute degree, labeled in black. The completion of this downward corrective formation suggests the start of a new rally of the same degree.

Technical Overview

The following daily chart shows the USDJPY pair advancing in a corrective structure of Minor degree labeled in green, which began on last March 09th when the price found support at 101.180, from where the price started an aggressive rally that has found resistance and completed wave A in green at 111.715 on March 24th.

According to the Elliot Wave theory’s alternation principle, if the first move is aggressive, the next path should be a slow move elapsing more time than the previous leg. Likely, the second leg will be a triangle or a complex corrective formation. In this regard, the second leg corresponding to wave B in green shows the progress in a triple-three pattern, which follows an internal sequence subdivided into 3-3-3-3-3, where each three is a simple corrective formation.

On the other hand, the MACD oscillator endorses the downward corrective sequence that remains in progress. Likewise, the momentum and timing oscillator confirms the bearish pressure in play. It suggests the possibility of a new decline completing the ending diagonal pattern in progress corresponding to wave (c) of Minuette degree labeled in blue.

Technical Outlook

The long-term outlook for the USDJPY pair under the Elliott Wave perspective, shown in the following daily chart, foresees a potential limited decline until the demand zone, between 102.357 and 101.180, where the price could find fresh buyers expecting to join in the next rally.

The confirmation of its recovery would occur if the USDJPY breaks and closes above the 103.898 level, which corresponds to the end of wave iv of Subminuette degree labeled in green. This potential next rally corresponding to wave C of Minor degree should follow an internal sequence subdivided into five waves. Likewise, if the price extends its gains, USDJPY could continue rallying toward the next supply zone bounded between 109.033 and 109.850. On the other hand, the invalidation of this bullish scenario occurs if the price extends its drops below 101.180.

In summary, the USDJPY pair advances in an incomplete complex corrective pattern identified as a triple-three formation, which currently moves in its third internal segment of wave ((z)). In this regard, the price could decline toward the next demand zone between 102.357 and 101.180. If the price confirms the bottom and starts the rally, the wave C will be confirmed if the price breaks and closes above 103.898. The first potential target is located between 106.561 and 107.050; the second potential target zone is placed between 109.033 until 109.850. Finally, the bullish scenario’s invalidation level is set at 101.180, which corresponds to the March 09th low.

Categories
Forex Market Analysis

Daily F.X. Analysis, December 31 – Top Trade Setups In Forex – U.S. Jobless Claims Ahead

On Thursday, the German banks will be closed in observance of New Year’s Eve since banks aid most foreign exchange volume. When they are closed, the market is less liquid, and speculators become a more dominant market influence. This can lead to both abnormally weak and abnormally huge volatility. Later throughout the U.S. session, the U.S. unemployment claims will remain in highlights.

Economic Events to Watch Today  


EUR/USD – Daily Analysis

The EUR/USD pair was closed at 1.22998 after placing a high of 1.23099 and a low of 1.22454. EUR/USD pair rose for the 5th consecutive day on Wednesday and reached above 1.23000 level, its highest since April 2018 amid the broad-based U.S. dollar weakness. The reports that the U.S. Senate has delayed a decision on increasing the coronavirus relief checks added pressure on the U.S. dollar. The Republican Senator Mitch McConnell blocked a move by colleague Bernie Sanders to allow a vote on increasing stimulus checks from $600 to $2000. However, Treasury Secretary Steve Mnuchin announced that direct payments of $600 would be out as soon as this week.

Despite a delay in the vote on the increase in the stimulus checks, the greenback dropped as investors were hopeful that the Senate would approve the rise in stimulus checks. The declining U.S. dollar added strength to the rising EUR/USD pair. On the data front, at 13:00 GMT, Spanish Flash CPI for the year dropped to -0.5% against the expected -0.6% and supported Euro that added additional gains in EUR/USD pair. From the U.S. side, at 18:30 GMT, the Goods Trade Balance from November fell to -84.8B against the projected -81.5B and weighed on the U.S. dollar that added further gains in EUR/USD pair. The Prelim Wholesale Inventories from November also fell to -0.1% against the projected 0.7% and supported the U.S. dollar. At 19:45 GMT, Chicago PMI in December surged to 59.5 against the projected 56.6 and supported the U.S. dollar. At 20:00 GMT, the Pending Home Sales from November fell to -2.6% against the projected 0.1% and weighed on the U.S. dollar that ultimately added gains in EUR/USD pair.

Furthermore, the risk-sensitive EUR/USD pair was also supported by the rising risk sentiment in the market after Britain approved another vaccine made by AstraZeneca and Oxford University. On Wednesday, Britain became the first country to approve the emergency use authorization of a vaccine developed by AstraZeneca and the University of Oxford that offers a 90% efficacy rate with the second vaccine shot.

The news about another vaccine available for use to control the coronavirus’s spread and in cheap amounts gave hopes that the global economic recovery process will speed up. These hopes raised the risk sentiment in the market and supported the currency pair EUR/USD on Wednesday.

Meanwhile, the optimism surrounding the Brexit deal also kept the EUR/USD pair on the upside on Wednesday. However, the EUR/USD pair’s gains remain limited throughout the day as the new variant of coronavirus that was originally discovered in the U.K. reached almost eight European Union nations. This urged E.U. nations to start mass vaccination to control the spread of the virus whereas, Spain was set to register people who refuse to be vaccinated against coronavirus and share it with European Union nations.

Daily Technical Levels

Support Resistance

1.2210    1.2279

1.2175    1.2311

1.2142    1.2347

Pivot point: 1.2243

EUR/USD– Trading Tip

The EURUSD continues to trade with a bullish bias after violating the ascending triangle pattern, extending resistance at the 1.2265 level. Above this, the odds of bullish trend continuation remains pretty solid. On the higher side, the pair may find resistance at 1.2308, and a bullish breakout of 1.2308 can lead its price towards the 1.2340 level. Bullish bias dominates today.

GBP/USD – Daily Analysis

The GBP/USD pair was closed at 1.36245 after a high of 1.36255 and a low of 1.34888. The British Pound to U.S. Dollar exchange rate climbed to weekly highs as the U.K. Parliament voted for the Brexit trade deal. Barely 24 hours before the U.K.’s final split from the European Union, Prime Minister Boris Johnson’s post-Brexit trade deal won approval from the U.K. Parliament. The agreement earlier crossed the House of Commons with 521 votes in favor of 73 opposing it. The Scottish National Party (SNP) was against the bills while stating that it will harm Scotland’s fishing industry and told PM Johnson that it would bolster the case for independence.

The Sterling got support from the Brexit deal’s approval in the U.K. Parliament and supported the GBP/USD currency pair on Wednesday. At the same time, the U.K. has ordered 100 million doses of the new vaccine that will be enough to vaccinate most of the population. On Wednesday, the U.K. regulatory approved the emergency use authorization to the vaccine of AstraZeneca and Oxford University that is said to offer 90% efficacy against coronavirus with the second vaccine shot. 

On Tuesday, the U.K. reported a record increase in new infections of over 50,000, the largest daily increase since the pandemic began. THE British Prime Minister Boris Johnson has approved placing more parts of the country into tier-4 restrictions as the country was fighting against the new variant of coronavirus, which scientists have warned that could spread more rapidly.

In parts of Southwest England and Cumbria, the ministers were considering imposing the toughest measures to control the spread of a new variant of coronavirus. Johnson announced that a further 20 million people in England will join the toughest tier of coronavirus restrictions from Thursday. These negative developments could not reverse the GBP/USD pair’s movement on Wednesday, and the pair continued increasing for the second consecutive day.

On the data front, at 11:57 GMT, the Nationwide HPI in December came in as 0.8% against the expected 0.4% and supported British Pound, and pushed the pair GBP/USD higher. From the U.S. side, at 18:30 GMT, the Goods Trade Balance from November decreased to -84.8B against the anticipated -81.5B and weighed on the U.S. dollar that added gains in GBP/USD pair. The Prelim Wholesale Inventories from November also decreased to -0.1% against the anticipated 0.7% and supported the U.S. dollar. At 19:45 GMT, Chicago PMI in December surged to 59.5 against the anticipated 56.6 and supported the U.S. dollar. At 20:00 GMT, the Pending Home Sales from November decreased to -2.6% against the anticipated0.1% and weighed on the U.S. dollar that ultimately added further gains in GBP/USD pair.

The U.S. dollar weakness was driven by the hopes that the increase in stimulus checks will be passed in the Senate even though they have delayed the decision. This weakness of the U.S. dollar kept the GBP/USD pair higher on board on Wednesday.

Daily Technical Levels

Support Resistance

1.3456    1.3533

1.3413    1.3567

1.3379    1.3611

Pivot Point: 1.3490

GBP/USD– Trading Tip

The GBP/USD pair has also violated the resistance level of 1.3617 level, and on the higher side, the next target remains at the 1.3698 level. On the lower side, the GBP/USD pair may find support at the 1.3617 level for now. We can expect a continuation of an upward trend in the Sterling today.

USD/JPY – Daily Analysis

The USD/JPY pair was closed at 103.207 after placing a high of 103.591 and a low of 102.959. USD/JPY pair extended its losses on Wednesday amid the declining U.S. dollar despite the market’s rising risk sentiment. The USD/JPY pair fell to its fresh weekly lowest level below 103.00 level on Wednesday as the greenback was very weak across the board against its rival currencies. The U.S. Dollar Index that measures the value of the U.S. dollar against the basket of six major currencies fell to its lowest level for almost three years below 89.52 on Wednesday.

The U.S. Senate delayed its decision on increasing the number of stimulus checks from$600 to $2000 as the Republican Senator Mitch McConnell blocked a move by colleague Bernie Sanders to allow a vote on increasing stimulus checks. Treasury Secretary Steve Mnuchin has announced that direct payments of $600 would be out as soon as this week. Investors were hopeful that the rise in stimulus checks will be accepted by Senate and continued selling the U.S. dollar on Wednesday that ultimately weighed on the currency pair USD/JPY and dragged the pair towards fresh weekly lowest level.

On the data front, at 18:30 GMT, the Goods Trade Balance from November declined to -84.8B against the estimated-81.5B and weighed on the U.S. dollar that dragged the currency pair USD/JPY on the downside. The Prelim Wholesale Inventories from November also dropped to -0.1% against the estimated 0.7% and supported the U.S. dollar. At 19:45 GMT, Chicago PMI in December raised to 59.5 against the estimated 56.6 and supported the U.S. dollar. At 20:00 GMT, the Pending Home Sales from November dropped to -2.6% against the estimated 0.1% and weighed on the U.S. dollar, increasing the USD/JPY pair’s losses.

Furthermore, the market’s risk sentiment was also improved after Great Britain became the first country to approve the vaccine by AstraZeneca and the University of Oxford for emergency use. This vaccine is said to provide 625 efficacy against coronavirus in the first shot that could be increased to 90% in the second shot. After this news, the hopes for economic recovery took their pace as a cheaper vaccine will be wildly available and help control the loss caused by the coronavirus pandemic. This news raised the market’s risk sentiment and added weight on the safe-haven Japanese Yen that ultimately capped further losses in the USD/JPY pair on Wednesday.

The main driver of the currency pair USD/JPY remained the sell-off in the U.S. dollar amid the rising hopes for an increase in stimulus checks the amount, and it will remain at the mercy of the U.S. dollar for a while as there will be no macroeconomic release from Japanese side until next week.

Daily Technical Levels

Support Resistance

103.39    103.78

103.23    104.01

103.01    104.17

Pivot point: 103.62

USD/JPY – Trading Tips

The USD/JPY violates the sideways range at the 103.500 level. It was a support level extended by an ascending triangle pattern that has already been violated. On the 2 hour timeframe, the USD/JPY pair is gaining support at 103.003 and 102.750 levels along with a resistance level of 103.575, which is extended by a triangle pattern that got violated. The pair is now closing a doji candle over 103.260 support level that suggests odds of bullish correction. On the higher side, the pair can lead towards the 103.575 level and then offer us a sell trade. Let’s brace for it. Good luck!

Categories
Forex Market Analysis

Daily F.X. Analysis, December 30 – Top Trade Setups In Forex – U.S. Trade Balance Ahead! 

The eyes will remain on the Spanish Flash CPI y/y, the U.S. Chicago PMI, and Pending Home Sales m/m figures on the news side. However, these are low impact events and may not drive sharp moves in the market.

Economic Events to Watch Today  

EUR/USD – Daily Analysis

The EUR/USD pair was closed at 1.22489 after placing a high of 1.22748 and a low of 1.22066. EUR/USD currency pair raised on Tuesday for the 4th consecutive day as the U.S. dollar was weak across the board and risk sentiment was high. The European stocks closed higher on Tuesday following a rally on Wall Street in the previous session. The pan-European Stoxx600 indexes ended up 0.76%, with most sectors in the positive territory. The rally has improved the European sentiment in U.S. stocks on Monday that came in after President Donald Trump signed a $900 billion coronavirus relief package into law; the measure will include direct payment to most Americans by $600.

Previously, Trump has demanded a $2000 direct payment days before the signing. On Monday, the House of Representatives voted to increase the second round of direct federal payments to $2000 and left it up to the GOP-controlled Senate. After this, the U.S. stocks rallied and continued rising till Tuesday morning. This pressured on the U.S. dollar ultimately added in the EUR/USD pair’s upward direction on Tuesday.

However, the positive sentiment in Europe came after the Brexit trade deal was secured between the E.U. and U.K. on Christmas Eve. Following this, London’s FTSE100 index rose by 2% on Tuesday. On Monday, the 27 ambassadors from the European Union member nations formally accepted the deal implemented on January 1. This news also supported the upward momentum in the currency pair EUR/USD pair on Tuesday.

Meanwhile, on Tuesday, the European Commission President Ursula von der Leyen said that the European Union would buy an extra 100 million doses of Pfizer and BioNTech’s coronavirus vaccine to bring the total from the two firms to 300 million doses.

She tweeted that they had decided to take an additional 100 million doses of the Pfizer/BionTech vaccine that has already being used to vaccinate people across the E.U. After some of the vaccine contestants organized by the E.U, this plan came in after some of the vaccine candidates faced unexpected delays in clinical trials that forced the bloc and other wealthy nations to rely on shots from fewer manufacturers than initially planned.

The E.U. officials said that the two firms have committed to rapidly deliver 200 million doses after regulatory approval for 15.5 euros per piece. The extra 100 million will be delivered at the same price, but the timetable will be negotiated as they will be delivered in 2021. The E.U.’s goal to roll out vaccine at the mass level also supported the local currency Euro and supported the upward momentum in EUR/USD pair.

The risk sentiment in the market driven by the vaccine rollout, U.S. stimulus, and the Brexit optimism also kept pushing the pair EUR.USD even higher on the board on Tuesday. Moreover, on the data front, at 19:00 GMT, the S&P/CS Composite -20 HPI for the year from the U.S. rose to 7.9% in October from the expected 7.0% and supported the U.S. dollar that capped further upside in the EUR/USD prices.

Daily Technical Levels

Support   Resistance

1.2210     1.2279

1.2175     1.2311

1.2142     1.2347

Pivot point: 1.2243

EUR/USD– Trading Tip

The EURUSD has violated the ascending triangle pattern, which was extending resistance at 1.2265 level, and above this, the odds of bullish trend continuation remain pretty stable. On the lower side, the support stays at the 1.2266 level, and the continuation of an upward trend can lead the pair towards the next resistance level of 1.2317. A slight downward retracement can be expected before a further upward trend.


GBP/USD – Daily Analysis

The GBP/USD pair was closed at 1.35009 after placing a high of 1.35225 and a low of 1.34405. The GBP/USD pair raised on Tuesday despite the rising number of coronavirus cases in the U.K. amid the Brexit development and improved risk sentiment.

The GBP/USD pair was supported on Tuesday from the rising risk sentiment in the market due to more optimistic news from the vaccine front. The U.K. has covered the way for widespread vaccinations with a homegrown shot that will be less expensive and easier to transport and store than other vaccines. For this purpose, the vaccines developed by the University of Oxford and AstraZeneca were set to get approval from the U.K. for emergency use authorization.

The U.K. drug regulator, the Medicines and Health products Regulatory Agency, will imminently authorize the AstraZeneca and Oxford University vaccine for emergency use within days to control the spread of coronavirus in the country. The vaccine’s efficacy rate is 90% after taking two doses, as one dose will provide only 62% efficacy against the coronavirus. Approving another vaccine will help the U.K. government battle against the coronavirus pandemic and lift the severe social distancing restrictions put in place before Christmas.

The new coronavirus cases in the U.K. on Tuesday were recorded as 53,135, and a health regulator of the country has said that the rise in coronavirus cases in the U.K. was of extreme concern. The Health Secretary has announced that the NHS was facing unprecedented pressures as hospitals in England and Wales were treating more coronavirus patients than at the peak of the first wave in April.

On the Brexit front, four days after sealing a free trade agreement with the European Union, the British government warned businesses to get ready for disruptions and bumpy moments when the new rules affect Thursday night. On Monday, the Businesses were scrambling to digest the details and implications of the 1240 page deal sealed between the U.K. and the E.U. on Christmas Eve. Meanwhile, E.U. ambassadors gave their unanimous approval on Monday to the Brexit trade deal with the U.K. However, the deal still needs approval from the E.U. legislature that is expected to come in February. At the same time, the U.K.’s House of Commons is expected to approve it on Wednesday.

After its approval by 27 E.U. ambassadors, the Brexit trade deal’s optimism gave support to British Pound that ultimately pushed the currency pair GBP/USD higher on the board despite the rising number of coronavirus cases in the country. Furthermore, the U.S. dollar was also weak across the board, which also helped the GBP/USD pair keep posting gains on Tuesday. Trump signed the second stimulus bill on Sunday that weighed heavily on local currency. Whereas, on the data front, at 19:00 GMT, the S&P/CS Composite -20 HPI for the year from the U.S. surged to 7.9% in October from the predicted 7.0% and supported the U.S. dollar that capped further gains in the GBP/USD prices on Tuesday.

Daily Technical Levels

Support   Resistance

1.3456     1.3533

1.3413     1.3567

1.3379     1.3611

Pivot point: 1.3490

GBP/USD– Trading Tip

The GBP/USD pair has also violated the resistance level of 1.3520 level, and on the higher side, the next target remains at the 1.3580 level. On the lower side, the GBP/USD pair may find support at the 1.3520 level now. We can expect a continuation of an upward trend in the Sterling today as the MACD and RSI suggest a bullish trend. Alongside, the GBP/USD pair may soar until the 1.3620 level today as the 50 EMA also extending bullish bias for the Cable.


USD/JPY – Daily Analysis

The USD/JPY pair was closed at 103.530 after placing a high of 103.824 and a low of 103.461. After posting gains for two consecutive days, USD/JPY dropped and posted losses on Tuesday amid the broad-based U.S. dollar weakness despite the risk sentiment. The U.S. Dollar was weak on Tuesday as investors were hopeful that Senate would pass the additional $1400 in stimulus paychecks. The greenback that measures the value of the U.S. dollar against the basket of six currencies was down by 0.24% on Tuesday and weighed on the USD/JPY pair.

The House of Representatives approved the rise in the amount of the stimulus checks from $600 to $2000 earlier in the week. Now the eyes have turned to Senate, where the Majority Leader Mitch McConnell moved to block the rise in the amount on Tuesday. Whereas, U.S. President Donald Trump has urged him to approve the increase in the number of stimulus paychecks.

The greenback has seen steady losses since U.S. President Donald Trump has signed the $2.3 trillion coronaviruses and spending bill on Sunday. Investors shifted from the U.S. dollar immediately after as more stimulus prospects reduced the demand for safe-haven assets. The country’s economic recovery was under threat as the U.S. continuously saw a large number of coronavirus cases, and it has increased the hopes for more fiscal stimulus measures from Congress. Hence, investors kept selling the U.S. dollar in hopes that the Senate could pass the increase in the number of stimulus checks at the last minute.

Furthermore, another reason behind the weakness of the U.S. dollar was that some investors warned that the dollar would fall further in 2021 as President-elect Joe Biden will roll out further stimulus measures. Biden and his administration will come into power on January 20. Despite the weakness of the U.S. dollar, the USD/JPY pair was also falling on the back of increasing figures of coronavirus cases in the U.S. There were also reports suggesting that the new variant of coronavirus first discovered in the U.K. has reached the U.S. The health officials in Colorado confirmed that the infected individual was held in isolation in Elbert Country and that the person was in his 20s and had no travel history.

This also raised the fears for global economic recovery and raised the safe-haven appeal that ultimately supported the safe-haven Japanese yen, and added the USD/JPY pair’s downward momentum on Tuesday.

Meanwhile, on the data front, at 19:00 GMT, the S&P/CS Composite -20 HPI for the year from the U.S. advanced to 7.9% in October from the anticipated 7.0% and supported the U.S. dollar that capped further losses in the USD/JPY prices on Tuesday.

On the other hand, the losses in USD/JPY pair were also capped by the reports that AstraZeneca and University of Oxford’s vaccine were set to receive approval from the U.K.’s regulatory for emergency use authorization. This resulted in improved risk sentiment and weighed on the Japanese Yen due to its safe-haven status and capped further losses in the USD/JPY pair on Tuesday.

Daily Technical Levels

Support   Resistance

103.39     103.78

103.23     104.01

103.01     104.17

Pivot point: 103.62

USD/JPY – Trading Tips

The USD/JPY violates the sideways range at the 103.500 level. It was a support level extended by an ascending triangle pattern that has already been violated. On the 2 hour timeframe, the USD/JPY pair is gaining support at 103.250 and 102.980 levels along with a resistance level of 103.575, which is extended by a triangle pattern that got violated. The pair is now closing a doji candle over 103.260 support level that suggests odds of bullish correction. On the higher side, the pair can lead towards the 103.575 level and then offer us a sell trade. Let’s brace for it. Good luck!

Categories
Forex Market Analysis

is EUR-USD Losing its Bullish Momentum?

EURUSD’s big picture reveals an acceleration in its uptrend, which is progressing since the second half of March when the price reached and confirmed its bottom of 1.06359. In this context, since the price saw its yearly low, the common currency is up over 15.2% to date.

Technical Overview

The following 2-day chart illustrates the EURUSD pair shows the primary trendline plotted in blue. We see the trend continuing its progression on the bullish side. The secondary trend identified with the green trendline reveals an acceleration of price action since early November when the common currency found support at 1.16025.

On the chart, we see that once the pair found support in early November, it began to rally, finding resistance at 1.22728 in mid-December, where the price started to consolidate until date.

On the other hand, the MACD oscillator shows a bearish divergence, which leads us to suspect the bullish trend’s exhaustion. However, the exhaustion signal doesn’t mean that the EURUSD will reverse the uptrend in progress. Moreover, the momentum and timing oscillators confirm the bullish pressure; however, the reading over level 80 (yellow box) on both indicators suggest the short-term overbought of the common currency. In this regard, the price could experience a short retracement in the following trading sessions before continuing its rally.

Technical Outlook

The EURUSD outlook for the coming weeks illustrated in the following daily chart shows the possibility of a limited correction, which could retrace until the next support located at about 1.20734, where the price could find fresh buyers with a potential target located in the long-term resistance of 1.25229, corresponding to the highs made in February 2018.

The bullish scenario’s confirmation will happen if the price closes above the resistance corresponding to the yearly high of 1.22717. On the other hand, if the common currency closes below 1.20734, the price could decline to the primary trend-line as dynamic support, it even could extend its decline until 1.17657.

Summarizing, the EURUSD pair continues developing a bullish trend, which currently looks consolidating the last rally that began on early November low at 1.16025. The MACD oscillator suggests exhaustion of the current bullish trend. Likewise, the momentum and timing oscillators reveal the common currency’s overbought condition, suggesting a short-term correction.

In this regard, considering that the bullish pressure persists, the price could retrace until 1.20734, where the EURUSD could find fresh buyers. However, the close above 1.22717 would confirm the upward continuation till the next long-term resistance of 1.25229. On the contrary, if the price closes below 1.20734, the common currency could extend its drops to 1.17657.

Categories
Forex Videos

The US Stock Market Bubble Is About To Burst – Here’s Why You Should GTFO!
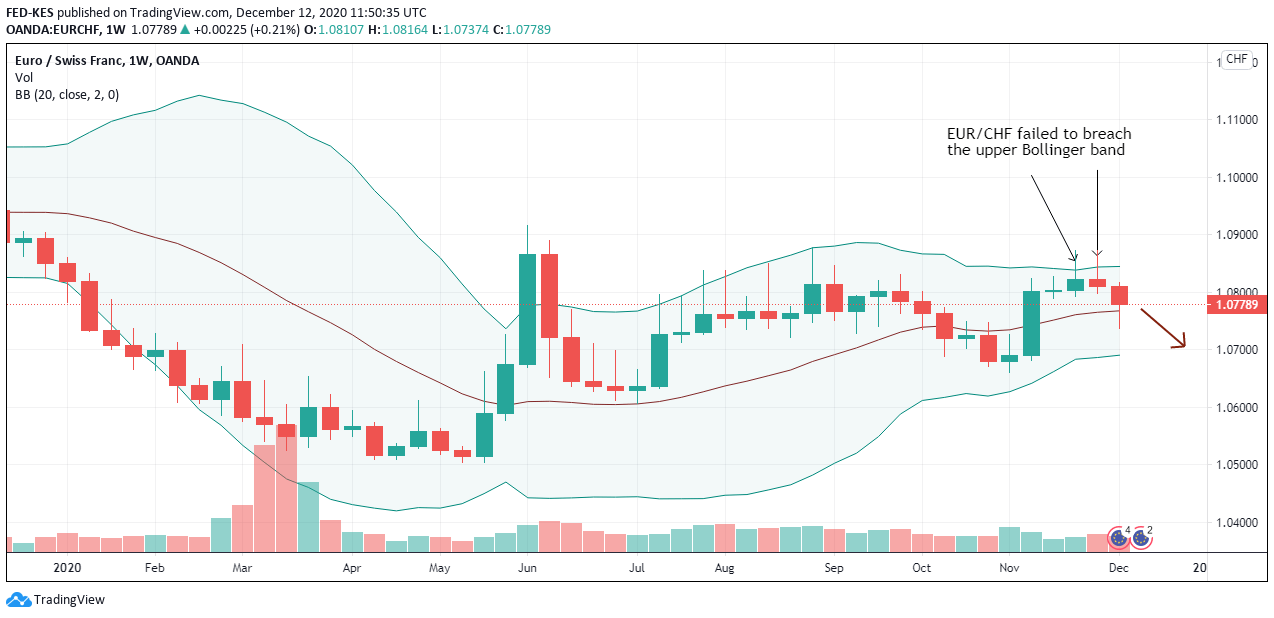
US stock market: Are investors walking into a trap?

Thank you for joining this forex academy educational video.

In this session, we will be looking at US stock markets, which have rocketed to historic highs, even though the United States economy is in the grip of the Coronavirus.

On Friday the 4th December, just post the non-farm payroll numbers, the S&P 500 index reached an all-time record high…

….this was also the case for the DOW Jones 30 industrial average…….
….the NASDAQ Composite index followed suit …….
….and so did the Barons 400 index


For all of these indices to simultaneously hit fresh all-time record highs is a very rare occurrence. It shows that investor sentiment is extremely high, potentially buoyed by a forthcoming and greatly anticipated next round for the Covid stimulus bill, if and when the democrats and republicans can reach an agreement on the size, currently estimated at $900 billion. The markets are also confident that the federal reserve is doing a good job in propping up the ailing American economy and sticking to a policy of low-interest rates for at least the next 2 years, which has typically corresponded with higher investment in stocks and shares, historically speaking.
Investors will look at the fed’s response to the crisis as a kind of insurance policy, that behind the scenes, the federal reserve will not allow the stock market to crash.

However, analysts who follow the Buffett indicator, which is the original measure for US market capitalisation, point out that since 1947 earnings per share have grown at around 6.21% annually, while the economy has expanded by 6.47% annually. This premise that the market capitalisation ratio to gross domestic product is based on the economy driven roughly 70% by consumption, where individuals must earn in order to buy products. And that consumption is where corporations earn their revenues, and ultimately this is where their profits come from.

The Buffett indicator shows that the mean average of around 0.7 has been closely adhered to since the 1950s, and the last time it broke away to the upside was in 1999, when speculators were investing heavily in Dot-Com companies, and where this led to the market crash in March 2000, and where we see that around this time the indicator pulls back to the mean average. Analysts at Deutsche Bank also point out that the recent run in US stocks has taken the market shift above the ratio of price to earnings above the level seen just before the 1929 stock market crash.


And here we see that the currents levels on the indicator are again highly inflated to a record high on the graph above the mean average at around 1.7.
…….
……and coincides with being above 2 standard deviations of the average range, which is an extremely rare occurrence.
And yet with the American economy still suffering from the pandemic, American corporations profit ratios are not reflective of consumer consumption, rather this time we have the Federal Reserve and US government stimulation packages which are churning out dollars into the market, and where investors are using much of those funds to push up the level of stocks due to FOMO, or fear of missing out. and where are the traditional corporate valuation matrix simply do not apply to certain stocks anymore.
Fear of a recurrence of the dot-com bubble correction, where investors ignored earnings per share valuations – many of these Dot-com firms were not making any profit at all – is another reason why we might potentially be looking at the top for stocks. Also, a fairly simple one; many of the favourites for investors, such as Amazon, Apple, and Tesla, for example, are not cheap anymore. This means that investors will be looking at cheaper stocks with growth potential, while others which are too expensive and are seen as potentially overbought. And in an economy which may not see growth return to any kind of normality for years, it adds weight to the thorny issue that the Dow Jones 30 industrial average – home to the top 30 most expensive stocks in the USA – and which is considered as a benchmark of the health of the US economy, may find buyers to be thin on the ground now, in which case a correction could be not too far away, based on everything set out in our assessment today.

Categories
Beginners Forex Education Forex Basics

Why We Love Forex Trading (And Think You Should, Too!)

Forex and trading are becoming an ever-popular activity. For many, it is just about making a little extra money on the side, while for others, it is about the enjoyment that they get out of it. There are a lot of ups and downs when it comes to trading, but overall, those that trade it for a hobby seem to love it. There are plenty of reasons to love it too, from the ups, the profits, the thrills, and more, so we are going to be going through some of the reasons why we love trading and the reasons why you probably will too.

The Incredible Highs

For many people, anything to do with money can give you some serious highs when you win. This is exactly the same when it comes to Forex. When you are winning, or on a winning streak, you feel like you’re on top of the world, you feel like you are on cloud nine and pretty much everything is great. If You have been trading forex for a long time, you will have experienced this a number of times, there isn’t a feeling like it and that is one of the reasons why we love it so much, that feeling is created by something that you have done, which makes it all the better.

The Adrenaline

There are many things in life that can fill us with adrenaline. When we are in charge of our money, and that money is actually doing something, that is one of those situations. When you see the markets moving up and down and your balance moving with it, you will gain a huge boost of adrenaline. This is true for when the markets are going both up and down, you want to win, you don’t want to lose. Whichever way it is moving, it will be playing with your emotions and filling you with adrenaline. It is basically what keeps bringing us back. There are, of course, some traders that are more methodical. They don’t get the emotions that the majority of us do. Instead, they are there simply for the money, but the majority, when things are going really well or really badly, will be filled with this emotion and the feeling of adrenaline going through their veins.

The Money

Let’s be completely honest, we are only trading because we can make some extra money, and the majority of other people are in the same boat. In fact, we have not yet met a single trader that is not taking part in trading for anything other than the money that can be made. Each month we withdraw a little bit of money that we can use to help us live a better life, to pay off debts, or to simply be a little better off. If the money was not there and you did not get any benefit, we certainly would not be trading. So we love trading for the simple fact that it allows us to make a bit of extra money each month.

You Don’t Need A Lot to Start

When I first started out with my trading, we started with about $100, which was great. It meant that we didn’t need to break the bank in order to start our trading journey, this made it very accessible for us. These days you can start with even less, some going as low as $10 or even $1. Of course, you will find it hard to be profitable with such a small amount, but it just shows that anyone can get started as you do not need thousands in order to join in. That is such a great thing for forex when you compare it to other things like stocks where you need a lot more in order to make any sort of decent money.

It’s Highly Accessible

Trading forex can be done from pretty much anywhere. We use our desktop computers, our laptops, and even our mobile phones to do it. The fact that you can use pretty much any platform that you want to access your accounts and the markets means that no matter where we are, we will be able to trade and potentially make money. It also means that far more people can get involved, many do not have a computer or a laptop, but they do have a mobile phone that is compatible with the trading platforms, meaning that they can now trade. A few years back when these platforms were not as easily accessible and so many people just couldn’t trade, that is simply not the fact now and those that missed out can quite easily get involved.

You Can Do It From Home

Normally, when we want to make a little bit of extra money, it will mean that you need to go out and get a second job, and you need to leave the house to do it. This is thankfully not the case with trading forex, you can do that from home, from in your underwear with no need to leave the house at all. This means that there is no commuting, no traffic, no other people annoying you on the way to work.

There Is No Boss

When we trade, we trade for ourselves, we are in charge of what we are doing and there is no one to tell us what to do. We have no boss, something that so many people strive for and something that a lot of people get into trading for. It will take a while to get to this stage, you need to be consistently profitable before you even think about leaving your job, but once you do, you will have all the freedom to trade when you want rather than when you are told to, freedom to choose.

Helps Us Manage Our Risks

When it comes to money, a lot of people are worried about losing it, this is why we use so much risk management when we trade and for good reasons too. The good thing is, that the cautious approach that we put into our trading we can take out into the real world too. Looking at more information before investing any money, before making decisions that will affect our lives. It helps us to better analyse the decisions that we are going to be taking.

It’s Always Changing

The forex markets are always changing, and due to that, we are very rarely bored. There are, of course, slow times when the markets are not really doing anything and our strategy is not relevant, those are times to take breaks. The rest of the time it is always evolving, due to this there are always things for us to do and for that reason, we simply do not get bored with it. We can always develop our own knowledge, we can always try and trade something else, either way, we are simply not bored by the forex and trading markets.

Those are some of the reasons why we simply love trading and the forex markets. It gives us so much freedom, teaches us a lot, and allows us to take part in it pretty much anywhere in the world. There is nothing quite like it, we love it and we are sure that you most likely will too.

Categories
Forex Videos

No Bulls**t Guide to Forex! Why You Are Still Blowing Your Account!
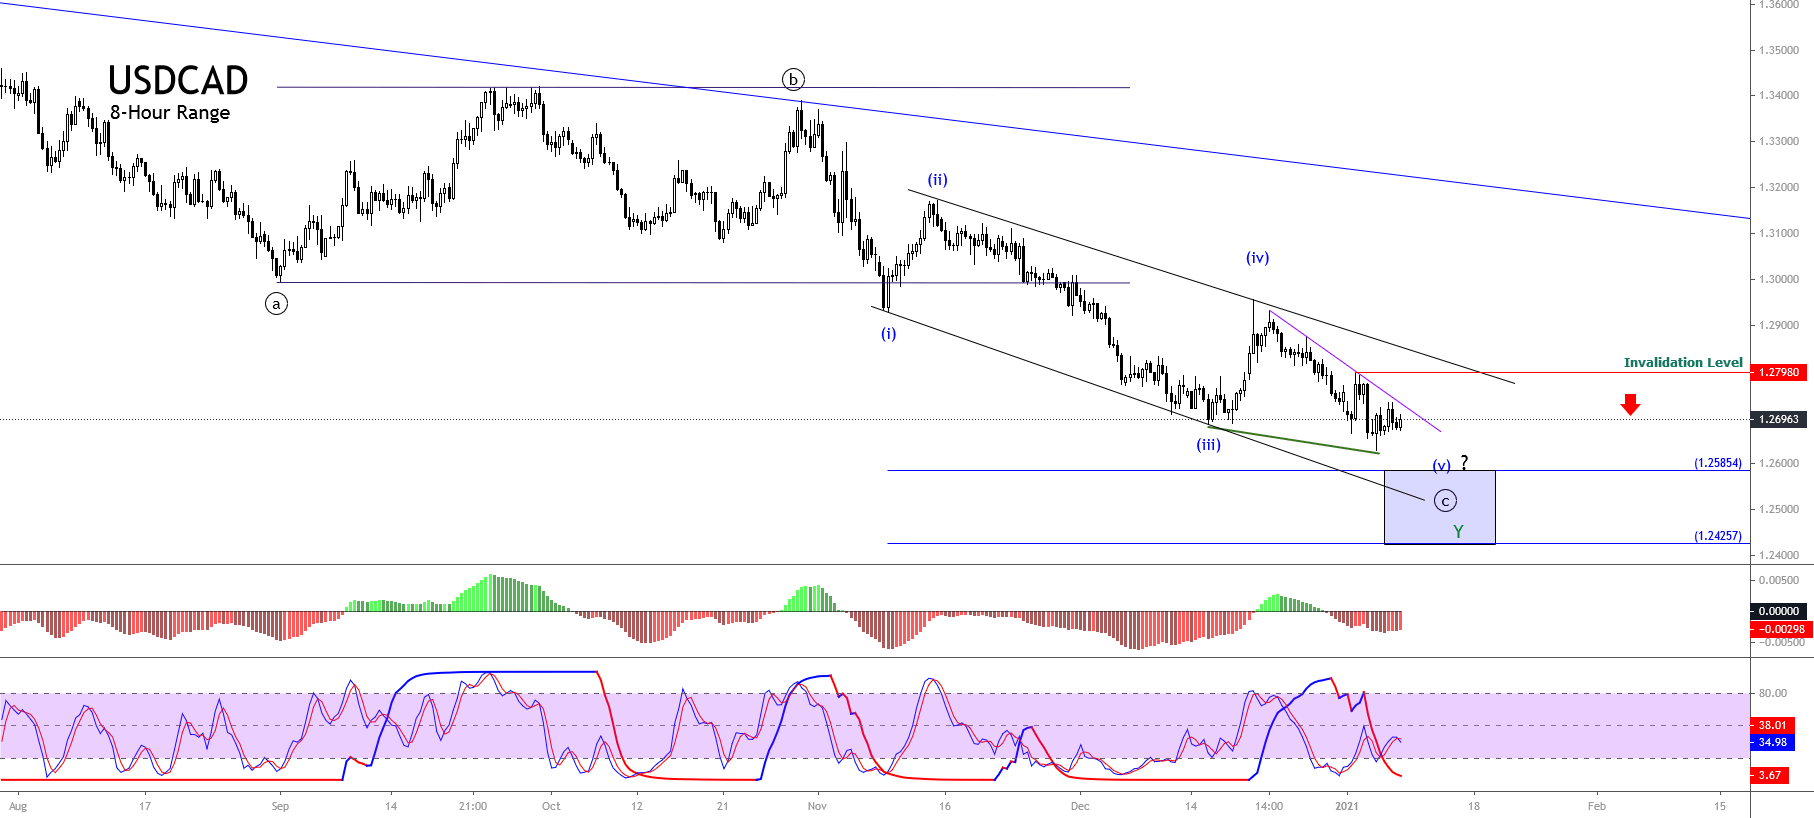

Are there Forex trading secrets? 

Thank you for joining this forex academy educational video.

In this session, we will be asking the question, are there forex trading secrets?  And hopefully coming up with some answers.

The internet is awash with firms, including brokers and educational platforms, offering to teach new traders the secrets of trading forex.  Such as ‘’9 secrets to successful forex trading’’ or ‘’seven-day trading secrets exposed’’ or something along the lines of ‘’the five major secrets to apply to make a killing in forex trading.’’

Some Forex educational platforms and Forex brokers will use any gimmick they can to get new traders on board to service the revolving door of new traders coming in, blowing their accounts – where statistics show that will over 75% of new traders lose their money in the first 6 months of trading – while enticing new traders in to maintain their client numbers and keep their businesses afloat.

And so back to the question, are there any secrets in forex trading? Absolutely not!  This is not the Knights Templar, nor the Freemasons, or a secret society.  And it is most certainly not a get rich quick scheme as some people would have you believe. 

In reality, Forex is a business – the largest business on the planet – which turns over trillions of dollars 24/5.  It is complex: the financial markets are interwoven with each other, where a forex exchange rate trend can turn in an instant, with no apparent reason, other than sentiment.

It is heavily correlated with fundamental reasons and political ones, where a rumour from a tweet, or a speech by a policymaker, can cause severe volatility in the markets.  Where trends can change because of a certain time of day, where perhaps one country stops trading for the day and another begins.

If the market isn’t changing because of fundamental reasons, it is constantly changing because of technical ones.  That’s chart patterns.  Technical analysis, or the study of chart patterns, including exchange rate price action, and the implementation of technical analysis tools and indicators is pretty much the backbone of forex trading, with the upmost single important thing being where the price is at any given time, and which is also known as price action.  This, on its own, is of paramount importance because it shows who’s in control of a forex pair, whether it’s the bulls or bears, or whether the market is simply consolidating and no one is effectively driving the market in any particular direction other than sideways.

If somebody offers to sell you the secret to fixing your car engine troubles, you would probably laugh and take your car to a garage. If they offered you the secret to remove your painful appendix, you would cry in horror and run off to see your doctor.  Forex trading is a profession not a secret ridden gimmick.  The best traders learn about fundamental analysis, technical analysis, market sentiment, market correlation, how currency pairs move and why trends are developing, and when and why they stop and reverse.  And this is the real key to making money while trading Forex:  knowledge.  The more you learn, the more you will earn.

So, in conclusion, don’t be seduced by offers of learning secrets, when here at Forex Academy our professional traders, some ex institutional,  offer a totally free educational, informative service, with its reliable signal service, supported by a broker – EagleFX – which doesn’t need gimmicks, with the idea being that if traders make money on a reliable platform, where education is absolutely free, then everyone is a winner.  

Categories
Forex Course

199. Effects Of Gold On AUD/USD & USD/CHF Currency Pairs

Introduction

Gold is among the most traded commodities globally due to the good intrinsic value of this asset. Considering that Gold is less impacted by uncertain conditions, its prices rise when other economies perform badly and fall when there is an economic boom.

Gold impacts AUD/USD and USD/CHF in opposite manners. Price fluctuations in Gold primarily impact three major currencies that include AUD, USD, and CHF. Let’s discuss how Gold affects AUD/USD and USD/CHF.

The Effect of Gold in AUD/USD

When the price of gold rises, the AUD/USD will move upwards. These two aspects share a positive correlation; most of the time, they move together. An increase in the U.S. dollar generally contributes to the gold prices to fall and vice versa. The price of Gold perfectly depicts the economic health of the country.

During an economic crisis in the country, investors purchase Gold as protection from inflation or an economic crisis. But the inner value of the Gold does not change whether or not there is a crisis. Furthermore, gold value is displayed in the dollar, meaning every gold transaction, you spend/receive a dollar.

Australia’s Economy and its Impact on Gold Prices

AUD and Gold share a positive relationship and are inversely related to the USD. If the gold price rises, the Australian exports will increase, resulting in the expansion of the economy and foreign investment. When the gold price increases, the AUD/USD will move upwards because of the increasing demand for the AUD.

Impact on the USD/CHF

The Switzerland currency holds a positive correlation with Gold. This is because 25% of CHF is supported by the gold reserves. The refineries in Switzerland also process 70% unrefined gold every year. Additionally, Gold and CHF are inflation hedging during uncertain times.

Therefore, when the price of gold increases, the CHF value also appreciates or increases, vice-versa. Gold has a positive relationship with CHF and an inverse relationship with USD/CHF. When the price of gold rises, the value of USD/CHF falls down and vice-versa.

[wp_quiz id=”97481″]