Categories
Forex Fundamental Analysis

How Important Is ‘Mining Production’ For a Nation’s Economy?

Introduction

Mining Production is a key economic indicator as the final output of Mining Production is the primary input for many industries. Therefore, it is the core part of many industries’ business activity.

Fluctuations in the Mining Production figures are bound to translate to all the dependent industries that use the Mined resources as input in their production process. The knock-on effect can be many-fold, and hence it is a vital economic indicator for investors, economists, and government authorities.

What is Mining Production?

Mining Production refers to the entire process of searching for, extraction, beneficiation (purification), and processing of naturally occurring minerals from the Earth. Mining is the process of extracting useful minerals by excavating into the Earth as these minerals cannot be produced on the surface. Minerals are essential for running society to a large extent.

Minerals typically drilled can be Coal, metals like Copper, Iron, Zinc, or industrial minerals like limestone, potash, and other crushed rocks. Coal remains one of the most significant sources of energy throughout the world. Metals like Iron, Copper have a wide range of usage in industries, from small chips in computers to construction of giant buildings. Limestone, Sand, and other rocks have used in cement industries, which all contribute to the construction and housing industries.

In the United States, the Mining Production figures are released as part of the “Industrial Production and Capacity Utilization – G. 17” report by the Federal Reserve. This report is also called the Industrial Production Index (IP Index) or Factory Output.

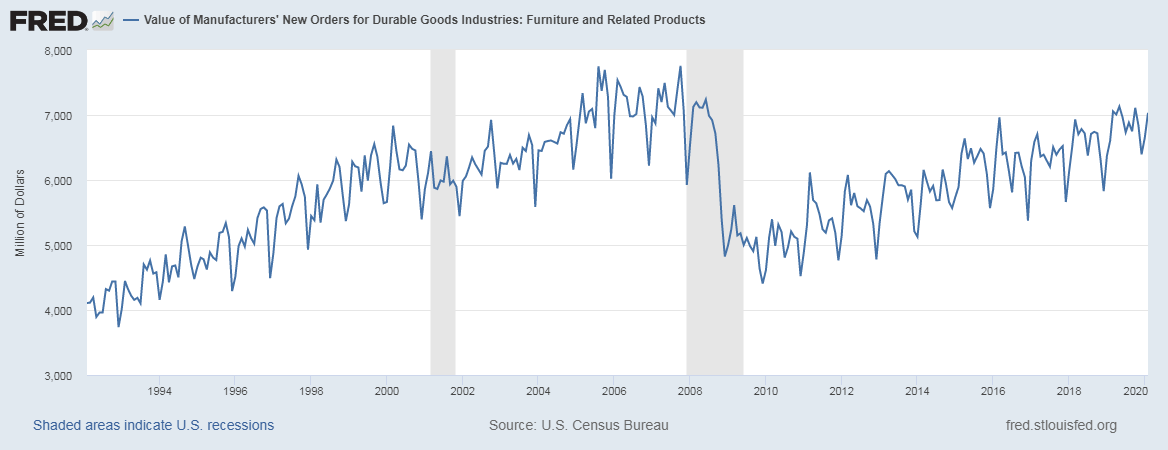
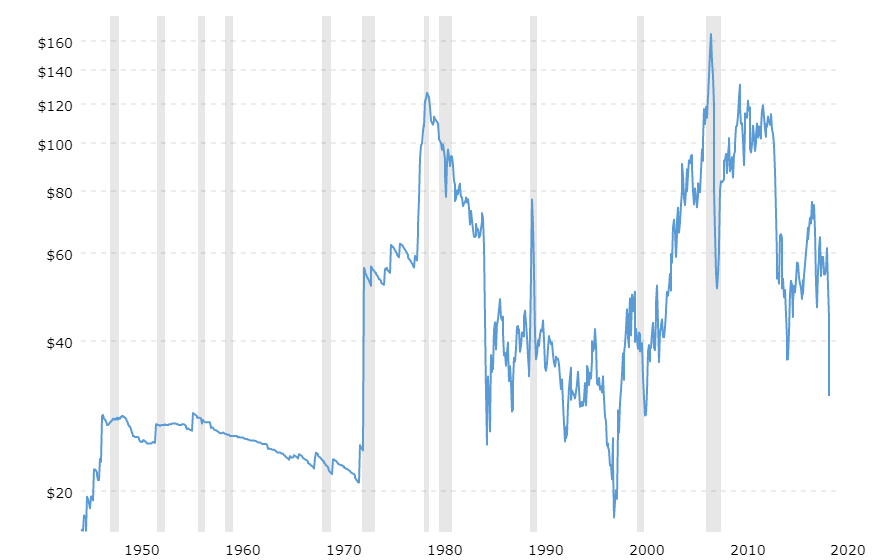
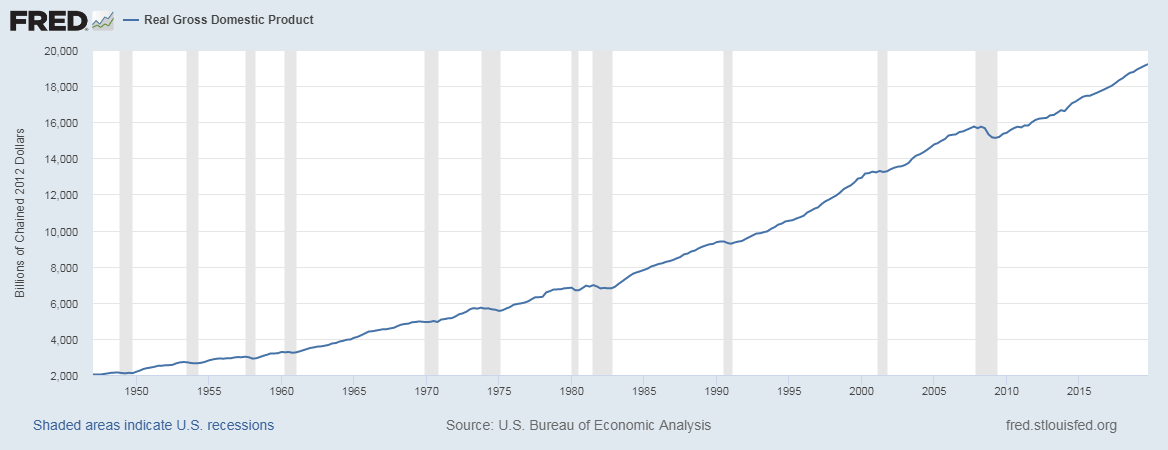
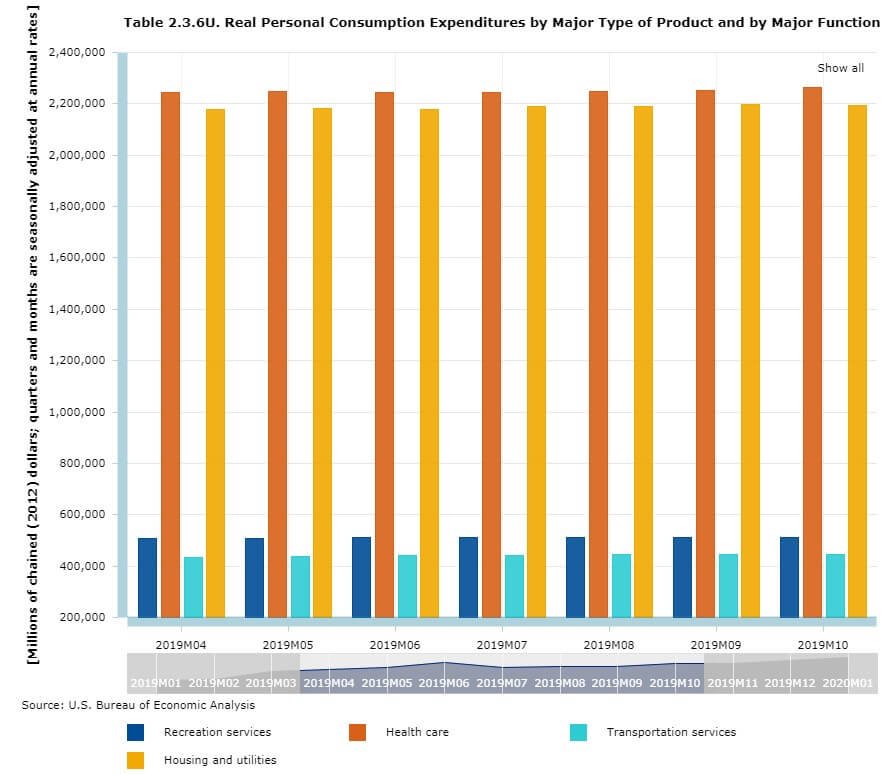
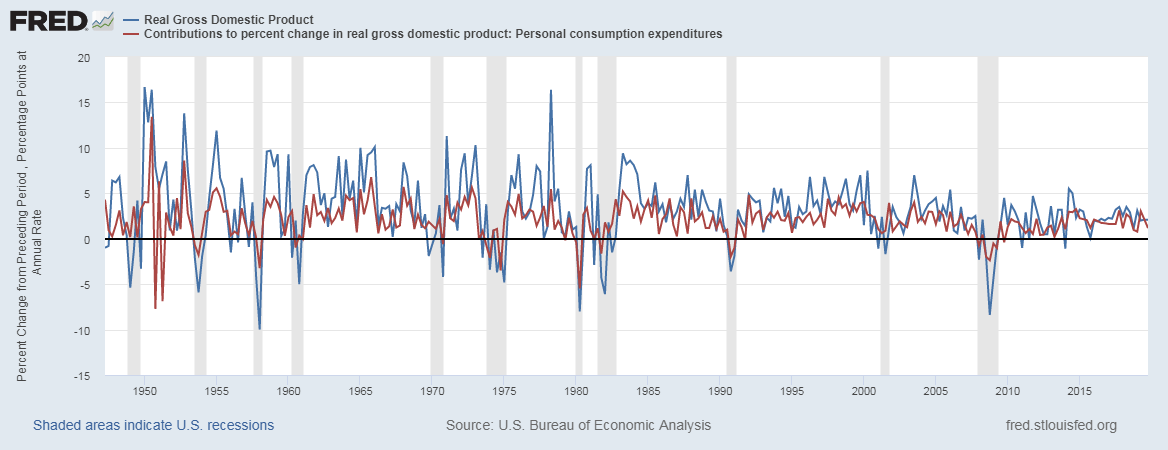
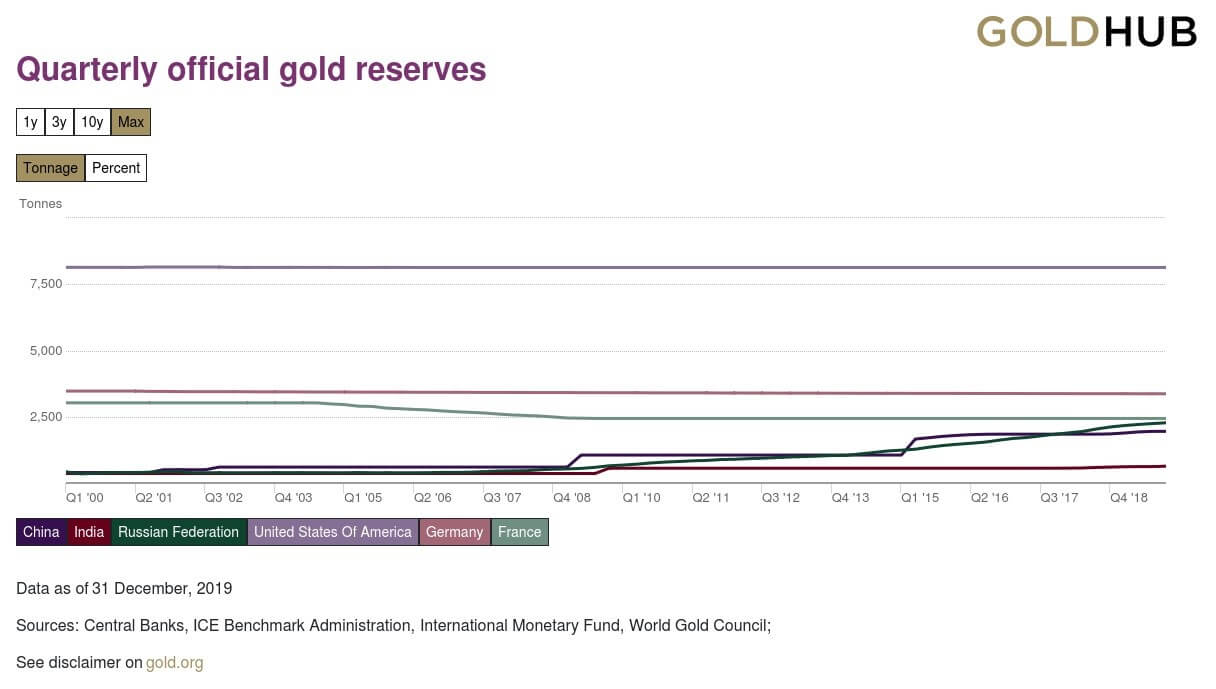
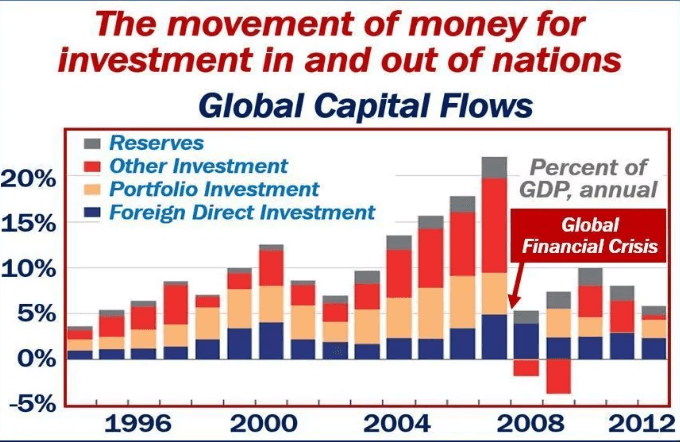
The Mining Production numbers are expressed in index and percentage change formats. The base year for the reference index period is 2012, for which the score is 100. Every month the Mining Production numbers are published according to this index. For example, an index figure of 130 indicates that Mining Production has increased in contrast to 2012 statistics. The percentage change compares the figures to the previous month. It is a seasonally adjusted statistic. The figure below illustrates the Mining figures dating back to 1920.

How can the Mining Production numbers be used for analysis?

Hence, it is apparent that Mining lies at the heart of all industrial activities. A decrease in Mining production can adversely affect all the dependent industries, and correspondingly the effects will pass onto unemployment, layoffs, wages, economic slowdown, etc.

Since the end products of the Mining Industry act as the starting input for many industries, it serves as a leading indicator for the economy. It lies at the very start of the economic activity chain, and the ripple effect through fluctuations in Mining Production figures will effect dependent industries with 1-6 months’ time lag depending upon the nature of dependent business.

Investors, government authorities, and economists extensively use the IP Index report for their purposes. Mining is the extraction of minerals that are essential for the economy; the government monitors and provides the necessary support to improve Mining Production. In 2006, the mining industry alone produced shipments worth 78.65 billion dollars, and that is excluding oil and gas. Coal accounts for 50% of electric power generated in the United States.

Mining Production is susceptible to some of the following:

Resource Availability – Since minerals are non-renewable resources, which means they are exhaustible. Once a region is depleted of the particular resource, search for new mining areas, relocation, and Mining again is expensive to process.

Weather – Bad weather conditions can interrupt Mining Production as it typically involves explosions and heavy drilling equipment. Heavy rains can close down mines and access roads. Lightning can put the massive equipment operations, explosion handling personnel at risk. Strong winds disrupt blasting. High temperatures can affect Mining workers.

Technology – The amount of latest and advanced mining technologies that are available at the disposal of the country determines the Mining Production cost and total output.

Terrain – The type of terrain that needs to be mined can also affect Mining costs and Production levels. Mining Industries are the leading employers at the place of their operation. Mining supports more than 500,000 jobs directly and an additional 1.8 million jobs indirectly through its dependent industries. Hence, wages, employment, economic activity, revenue generation, exports, energy consumption are all affected by Mining Production.

Impact on Currency 

The Mining Production figure is a proportional and leading economic indicator. An increase in Mining production figures translates to stimulated business activity in the dependent industries, higher employment, wages, and improvement in economic activity. It will also generate higher revenue for the nation through exports of Mining Produced goods like Coal, Iron, etc. All this has a positive effect on the currency, and the currency appreciates. The reverse also holds.

Economic Reports 

The Mining Production report is a part of the IP report that is published by the Fed every month. This report is published in the form of estimates with subsequently revised estimates. The first version/estimate is released on the 15th day of every month, and this shows the Mining data of the previous month. This is the major report as it factors in about 75% of the data. The next four estimates account for 85%, 94%, 95% & 96% respectively as the source data becomes available after each passing month.

Sources of Mining Production 

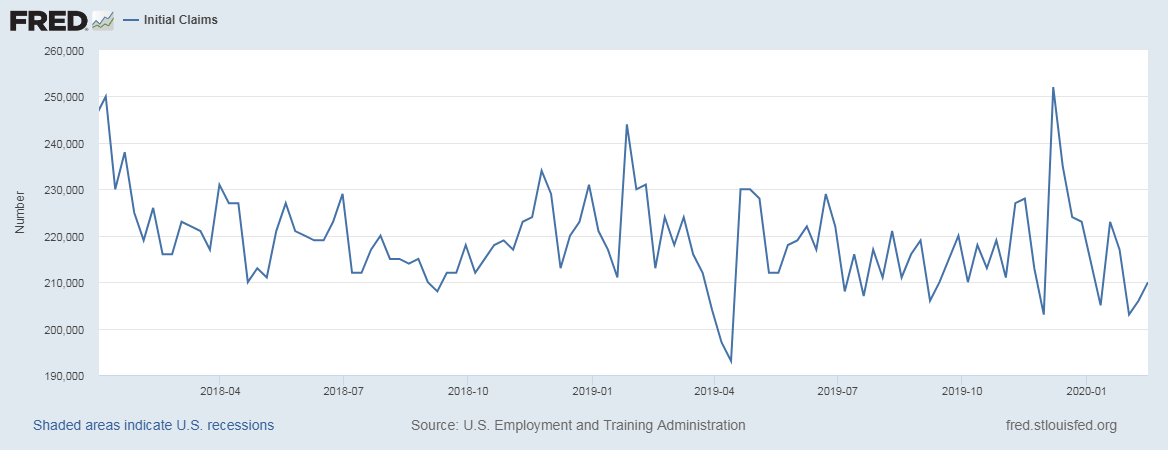
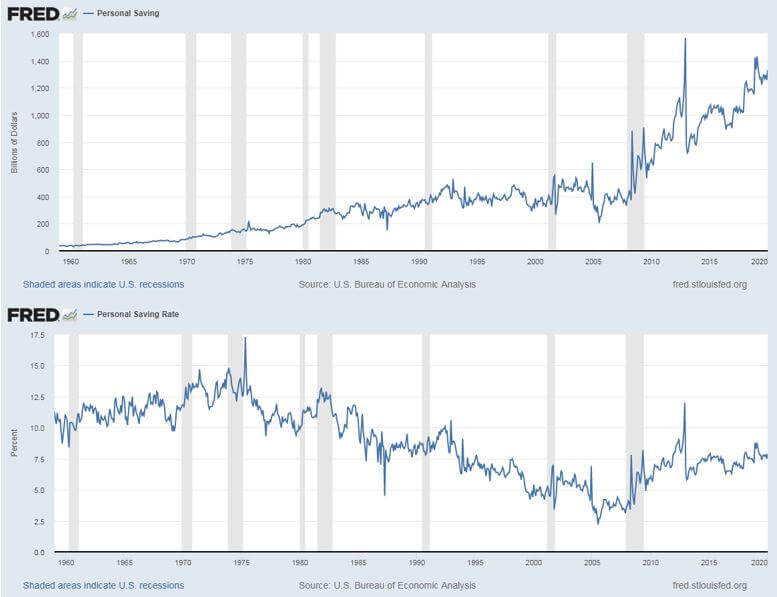
The monthly Mining Production statistics are available on the official website of the Federal Reserve for the United States. The St. Louis FRED provides a comprehensive list of Industry Production, and Capacity Utilization reports on its website with multiple graphical plots. You can find this information here and here. We can also find global Manufacturing Production figures for various countries in statistical formats here.

Impact of the ‘Mining Production’ news release on the price charts

In the previous section of the article, we learned the Mining Production economic indicator and understood it’s significance in an economy. The mining industry is critical to a nation’s economic well-being. It influences the country on a regional and individual level, with significant dependence on the resources under development as well as government policies. The mining industry is today is opening up new opportunities for foreign investments and technical assistance. Mining also impacts employment opportunities and income generation.  Governments and mining companies are working together to achieve these goals.

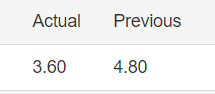
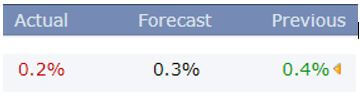
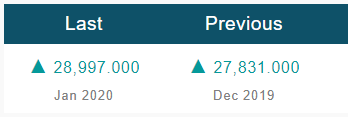
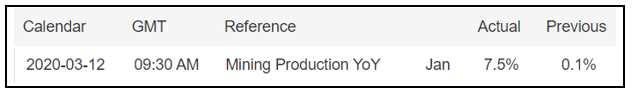
In today’s example, we will analyze the impact of Mining Production South African Rand and witness the change in volatility because of the news announcement. The below image shows that the Mining Production in South Africa increased 7.5% year-on-year in January 2020, following a 0.1% gain in the previous month and beating market expectations by a huge percentage. Let us see find out how the market reacts to this data after the news release.

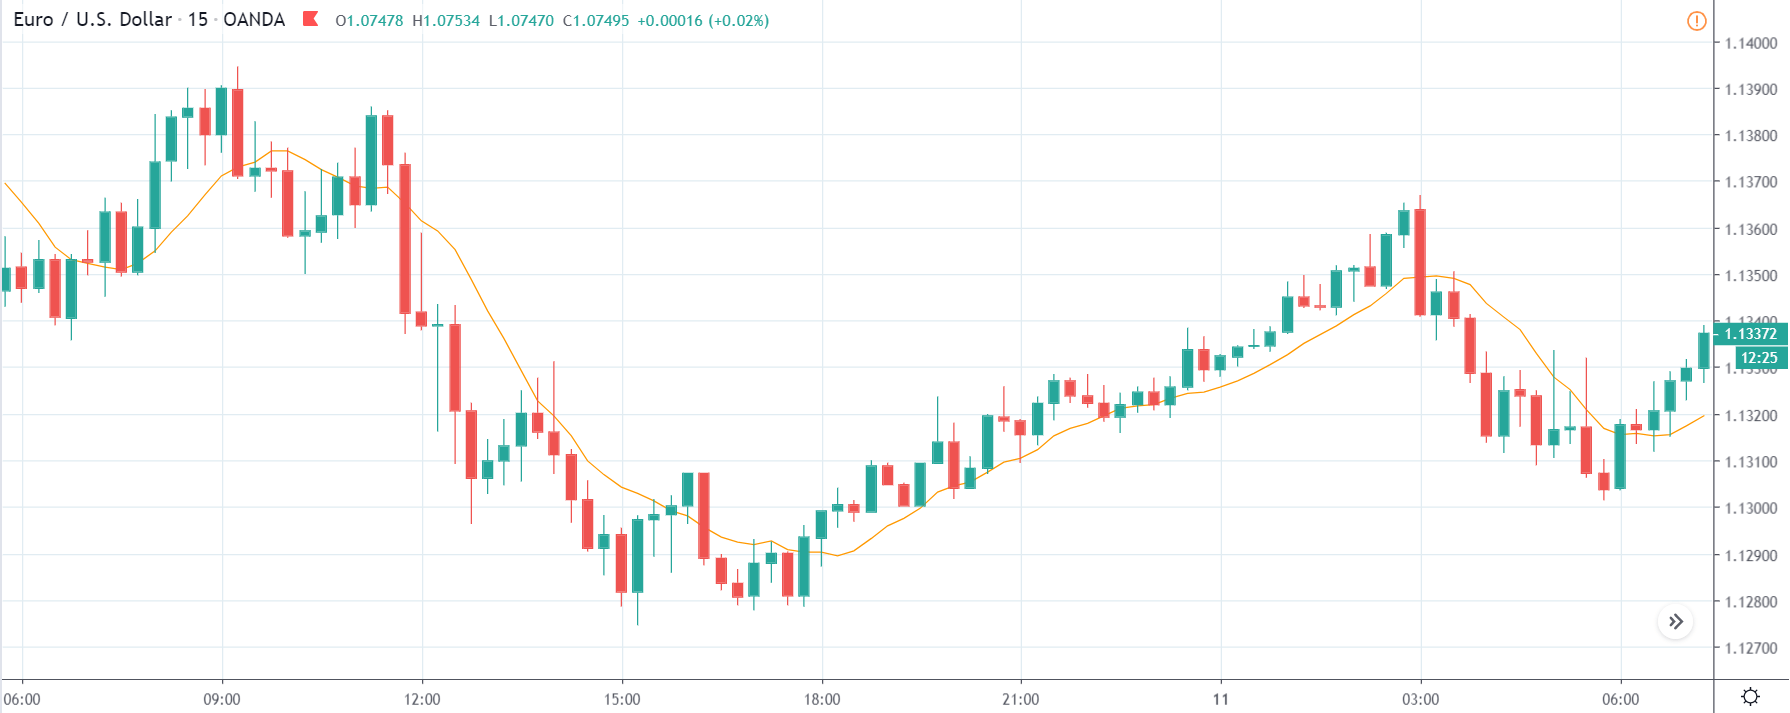
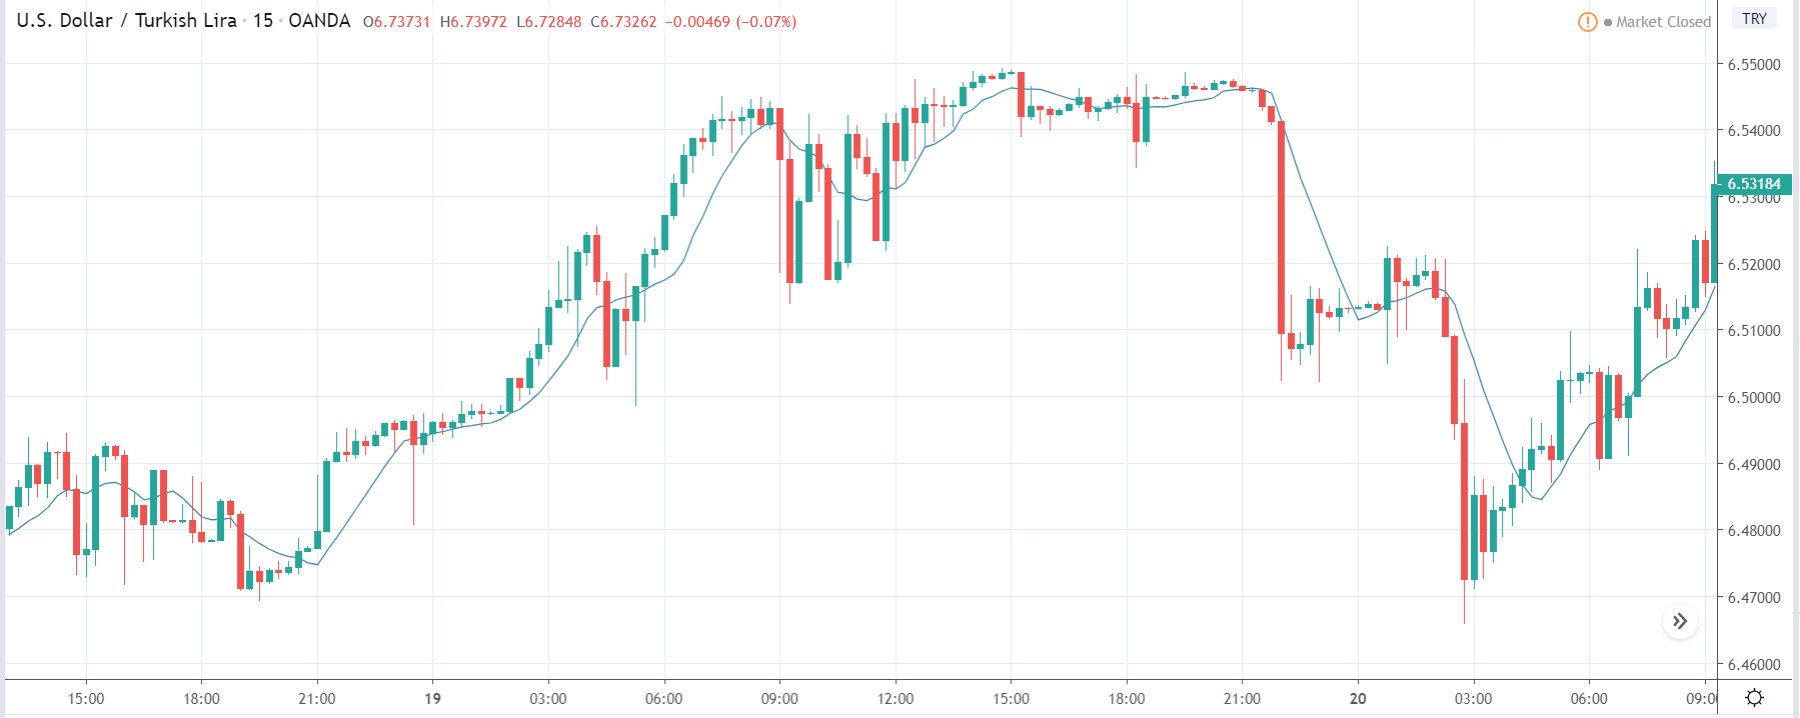
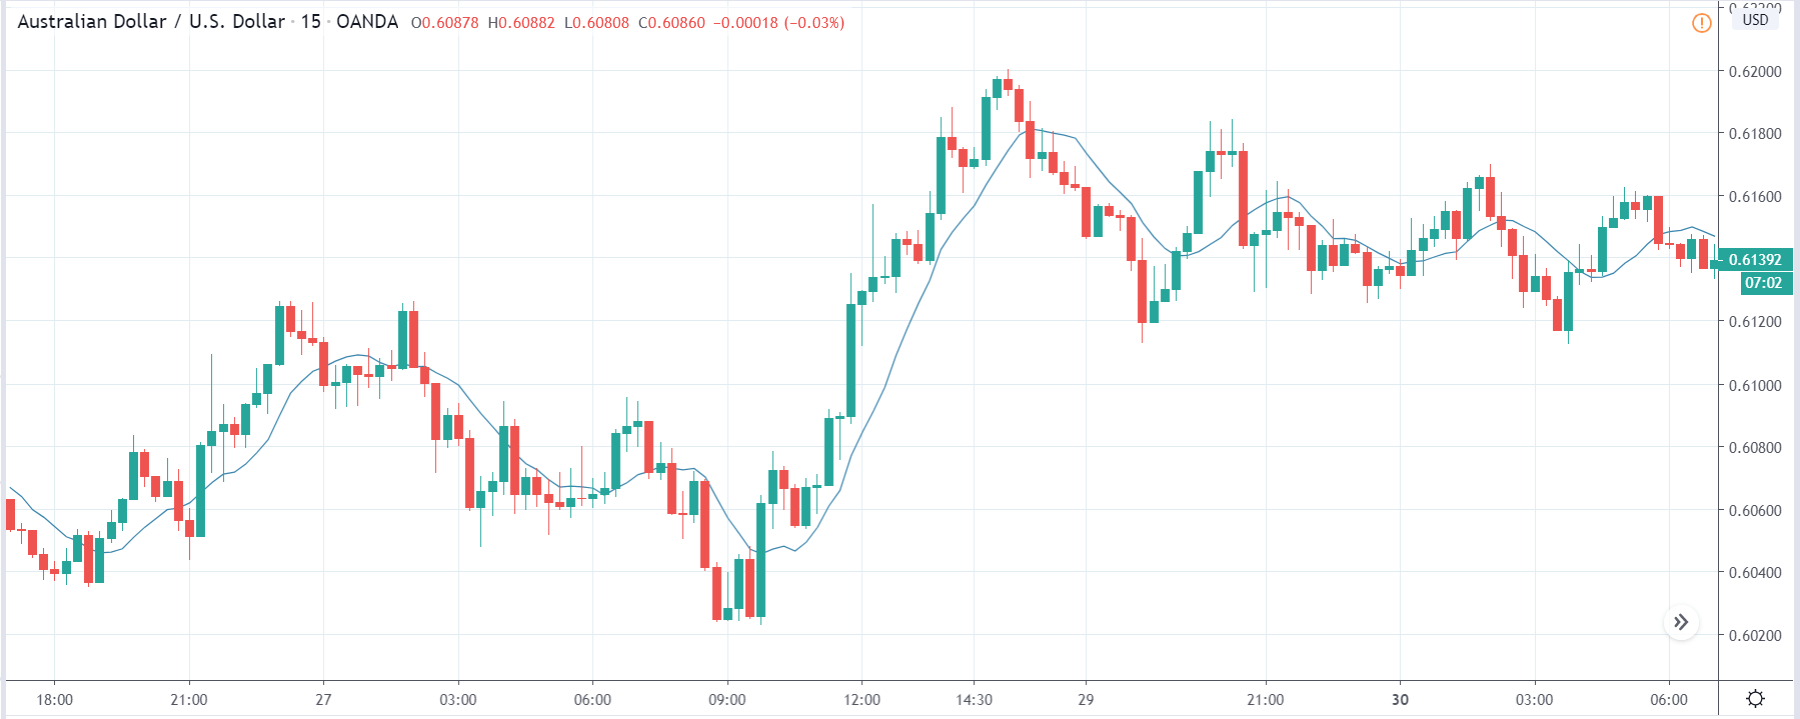
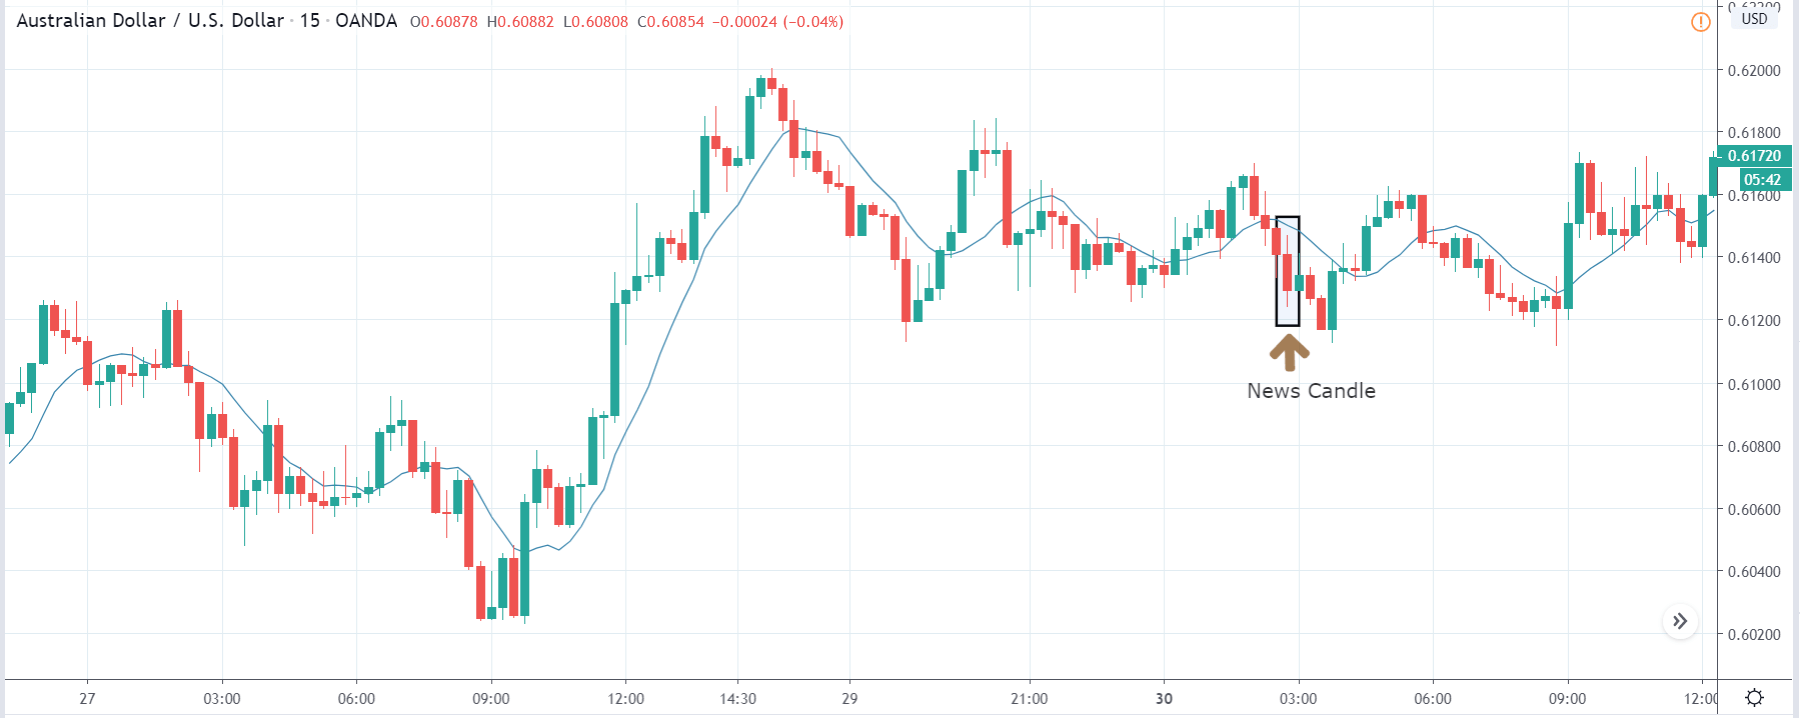
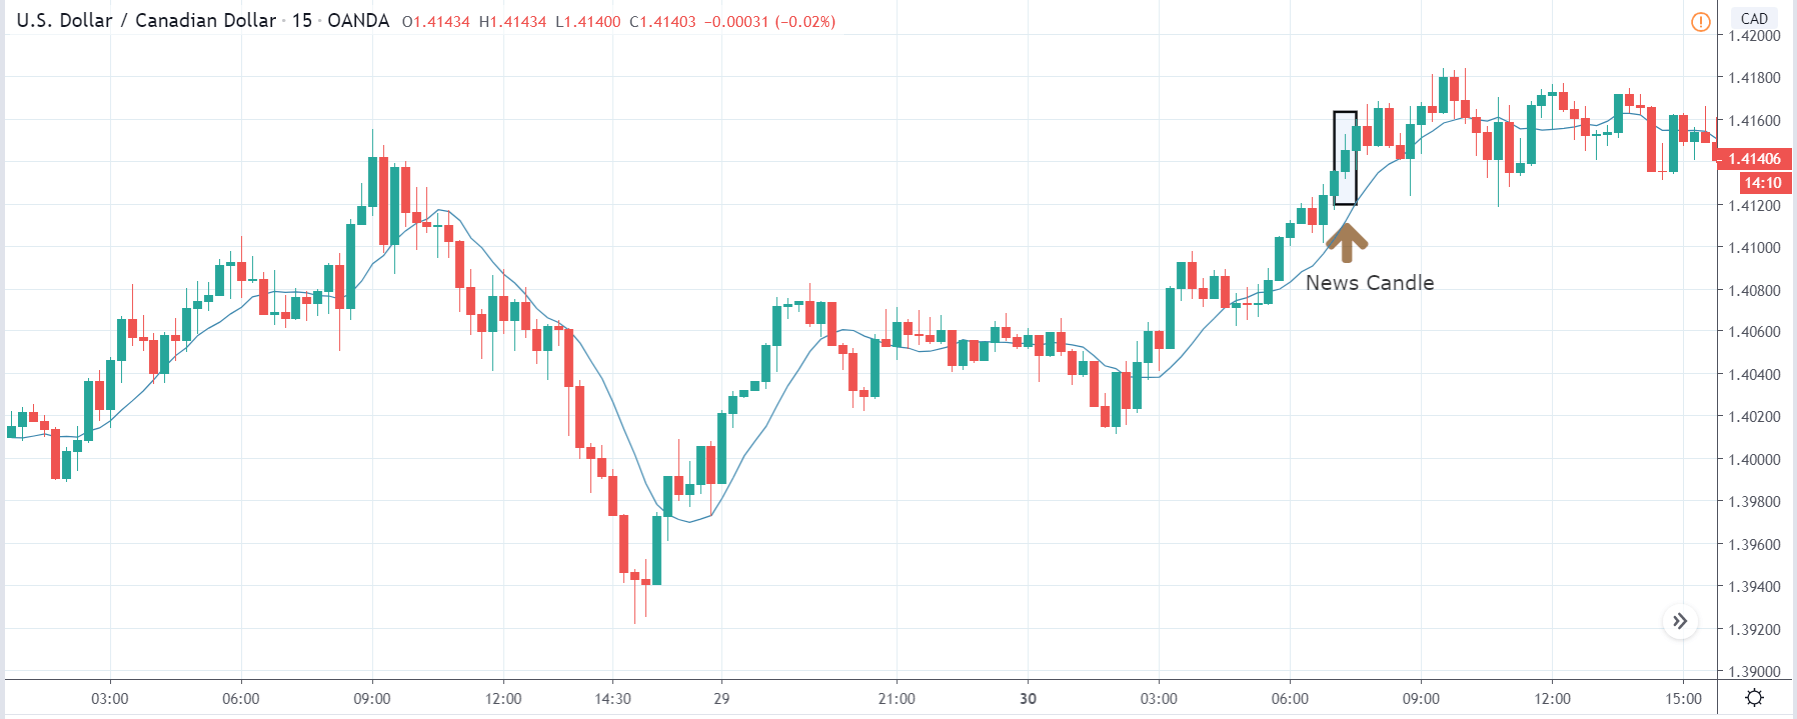
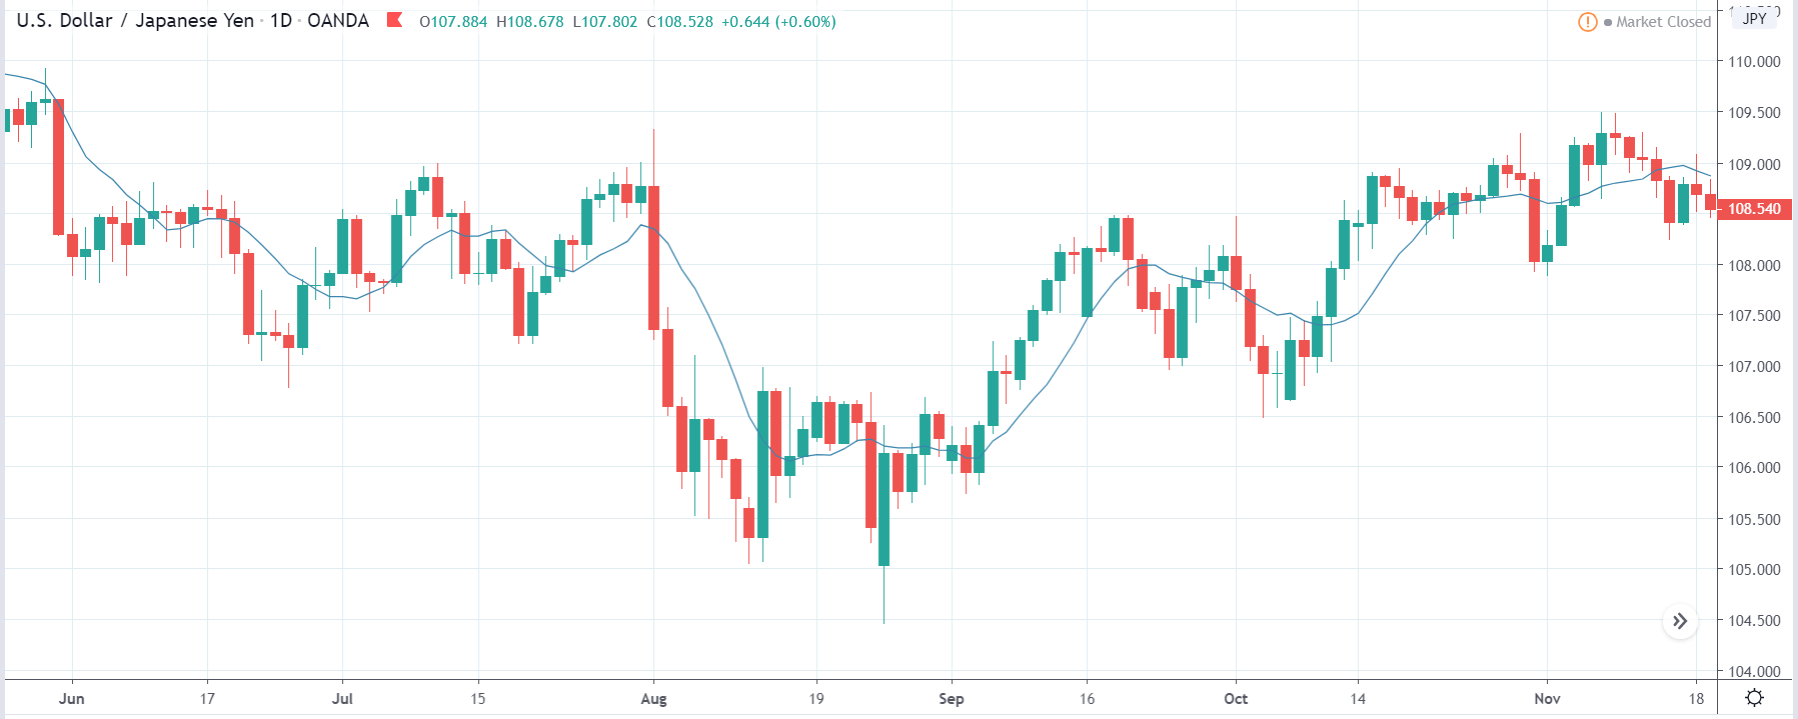
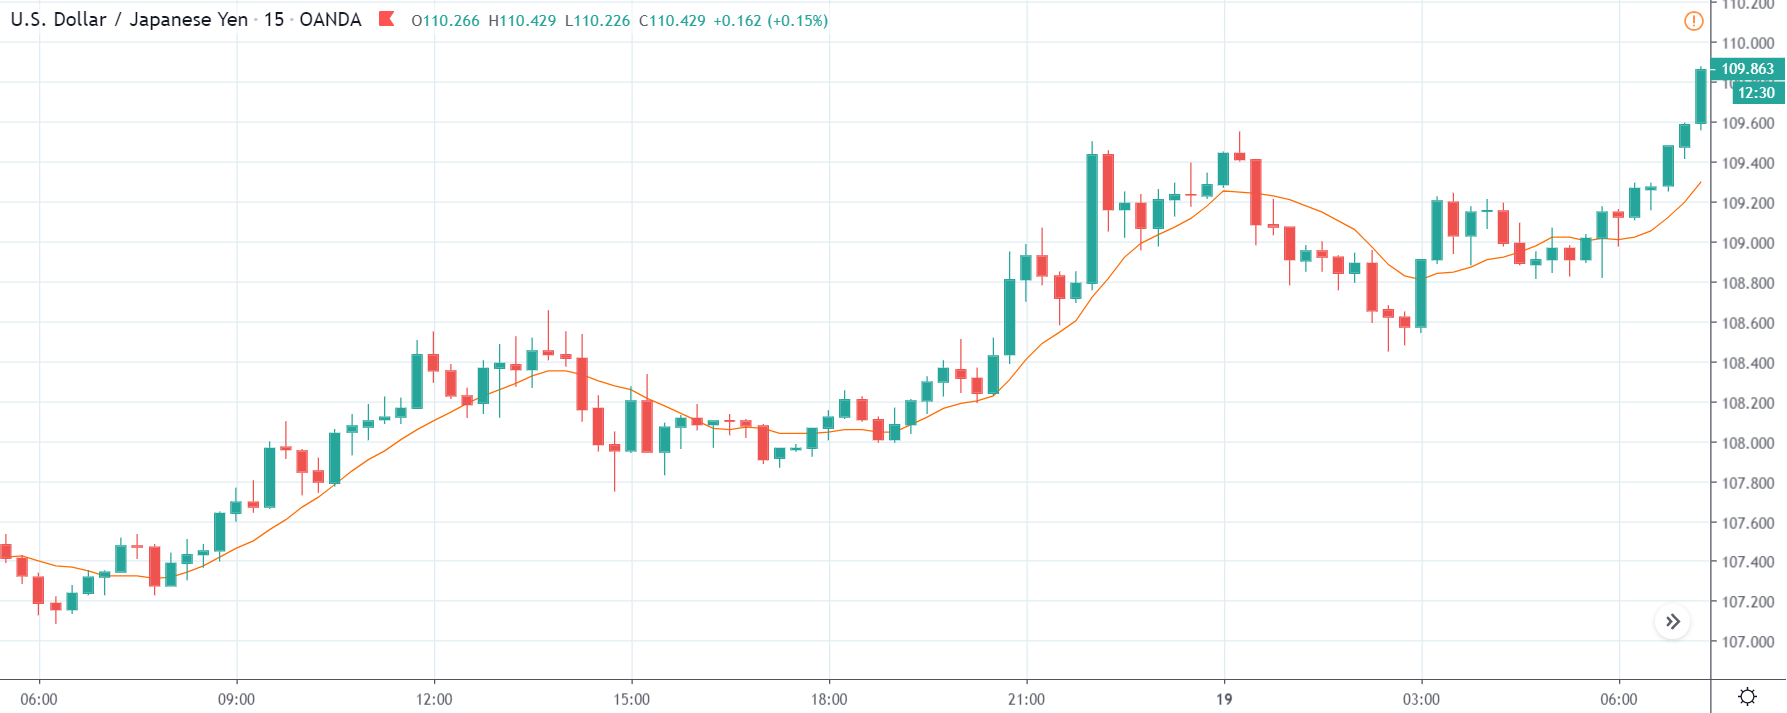
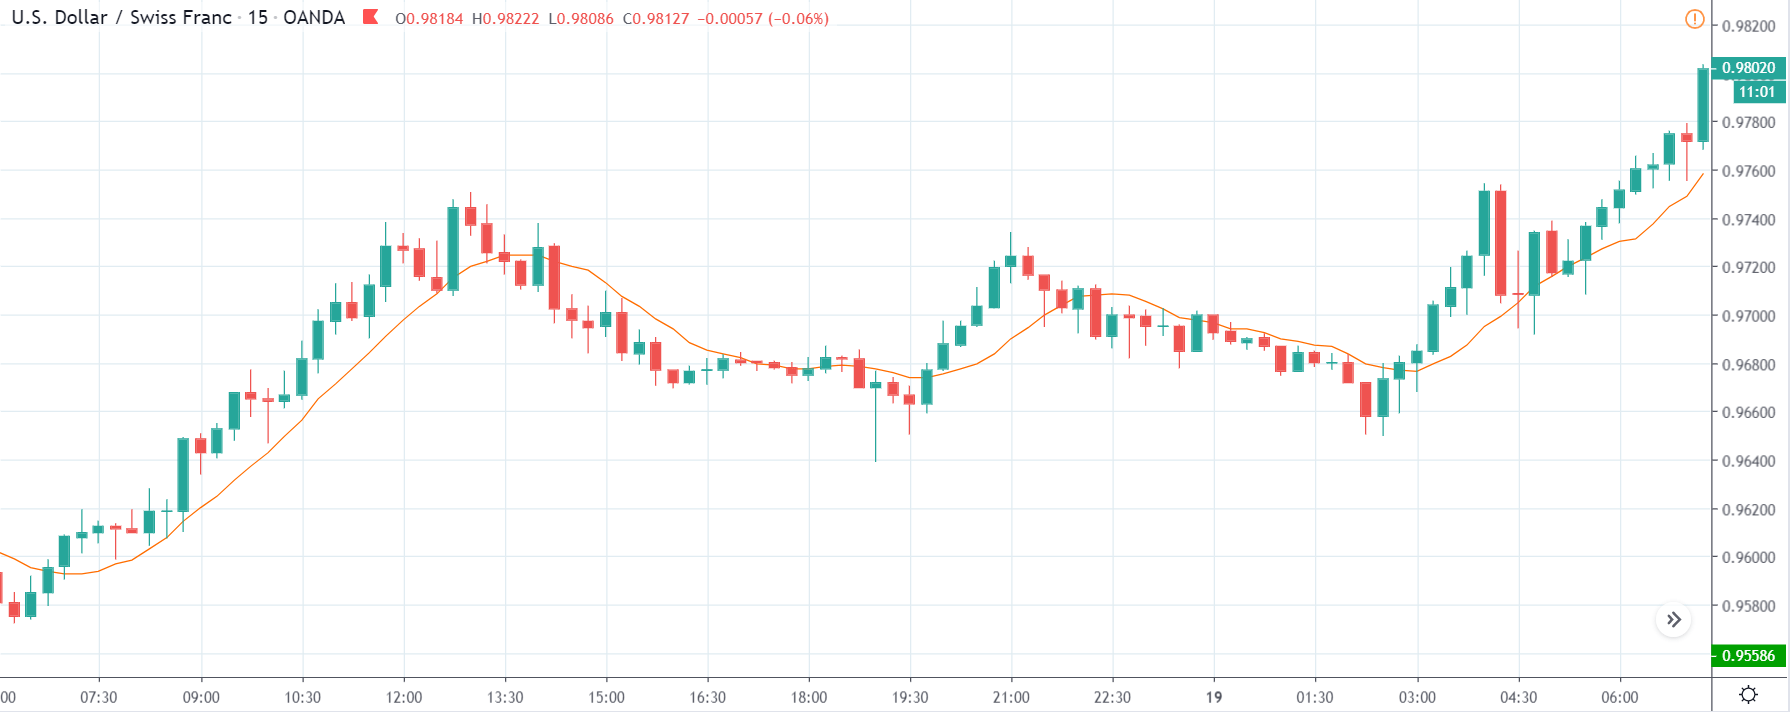
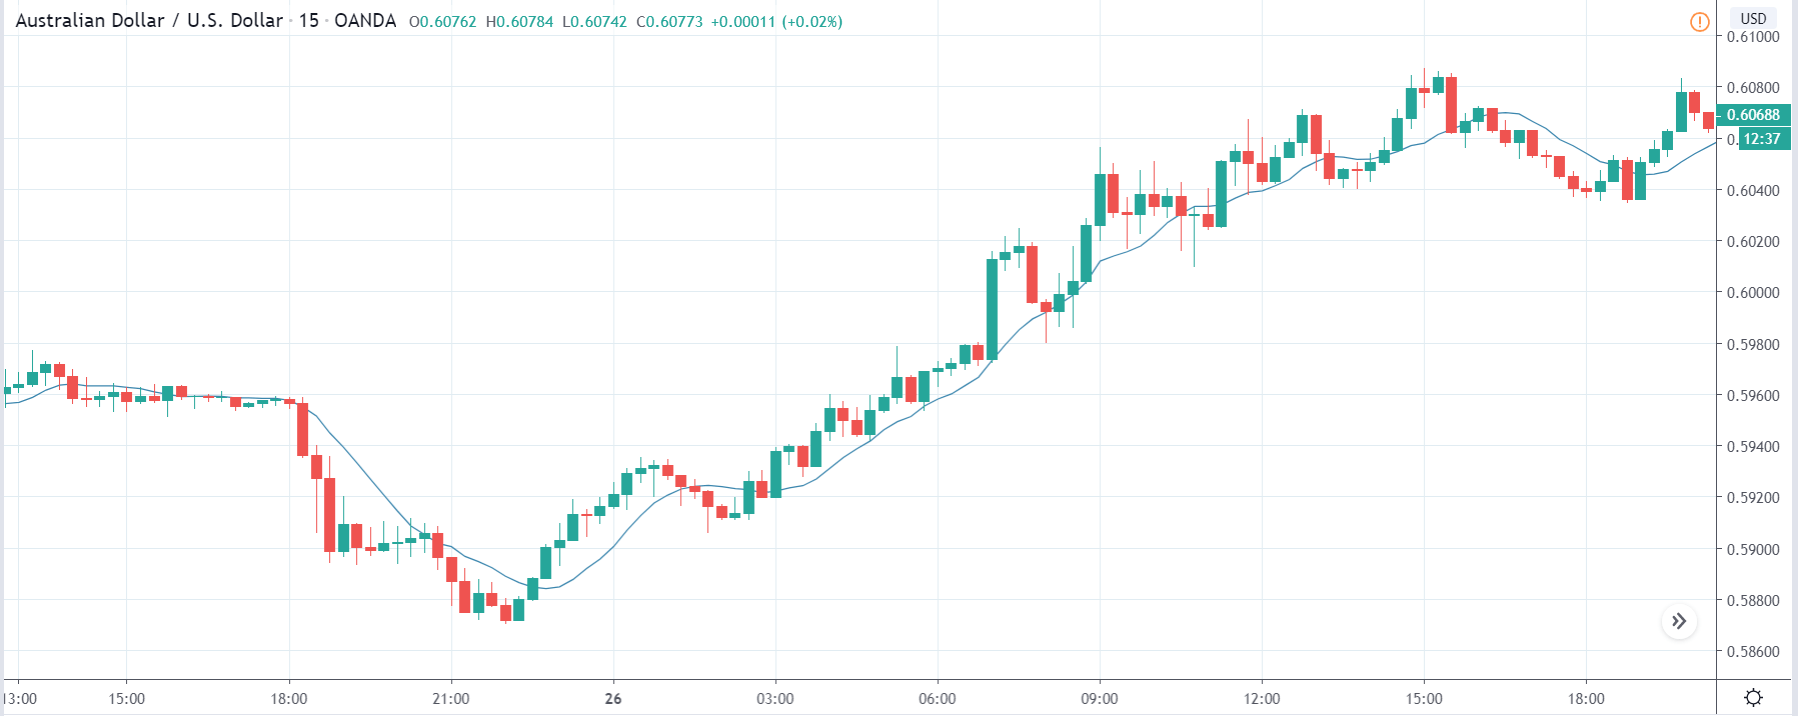
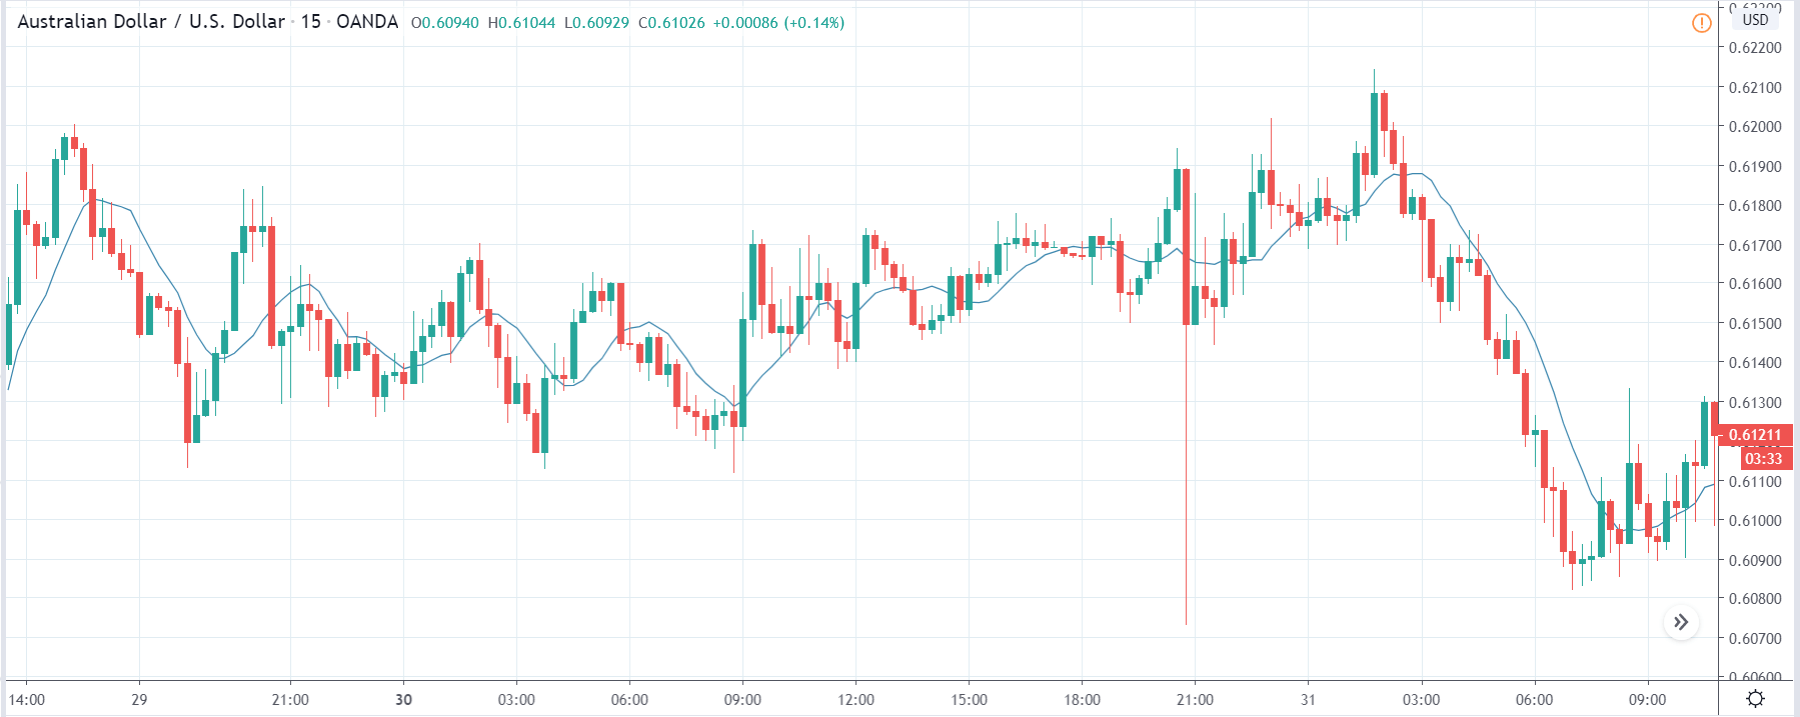
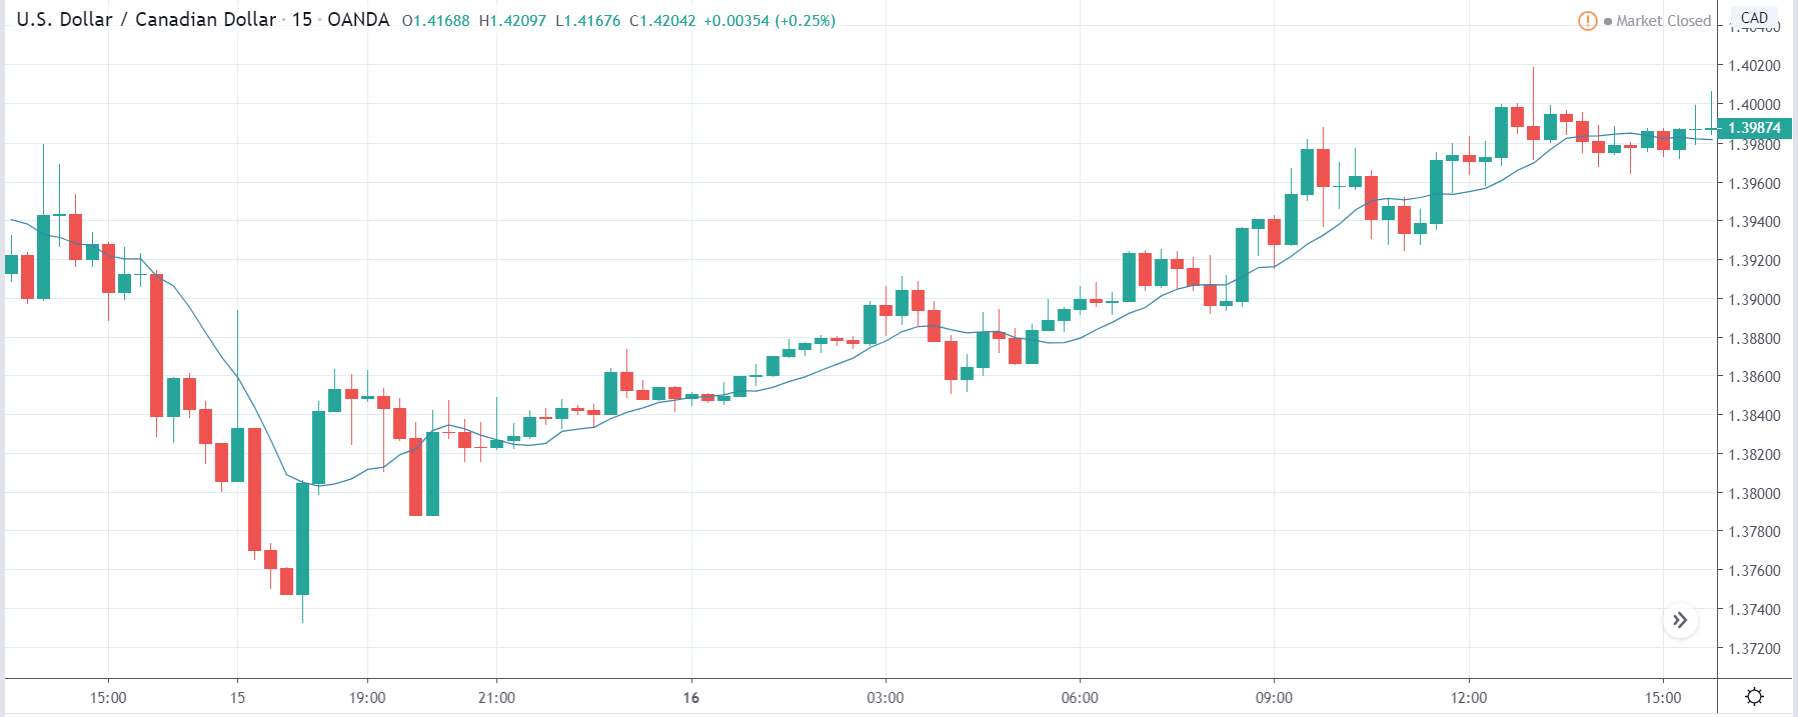
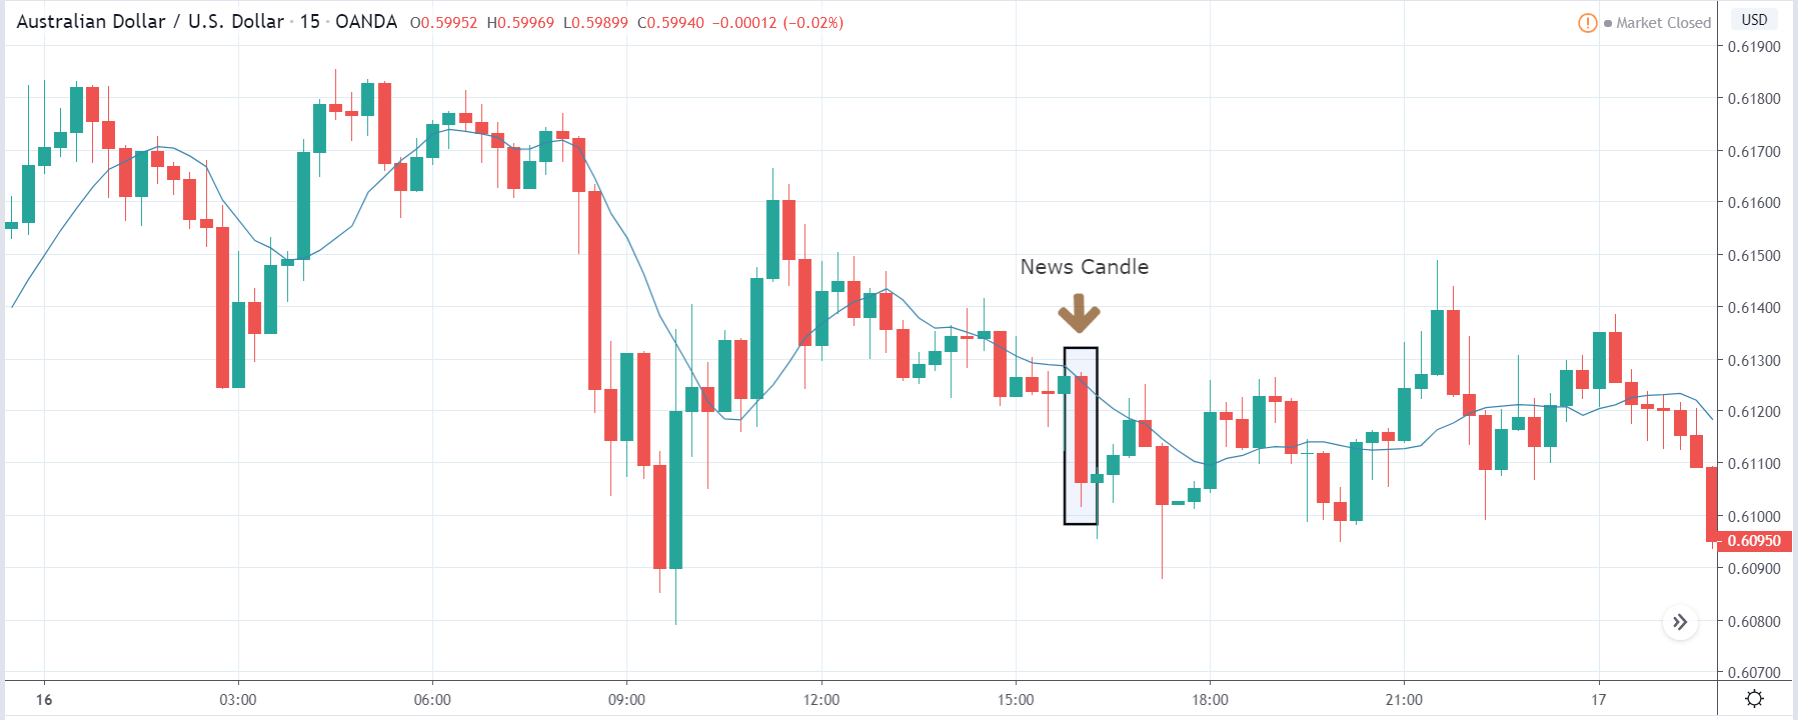
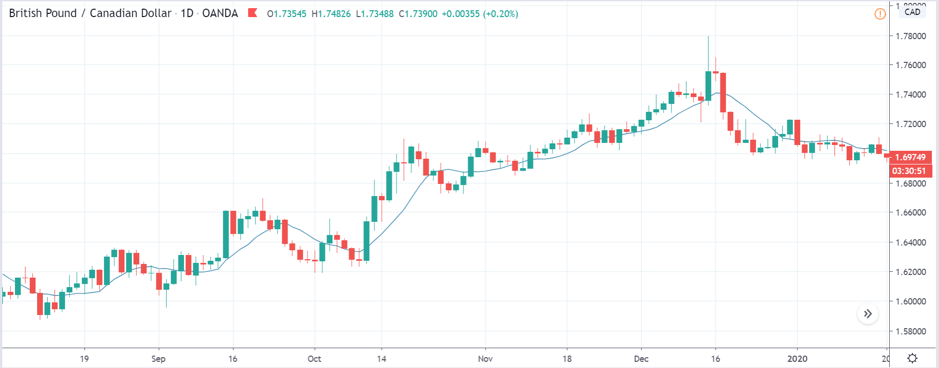
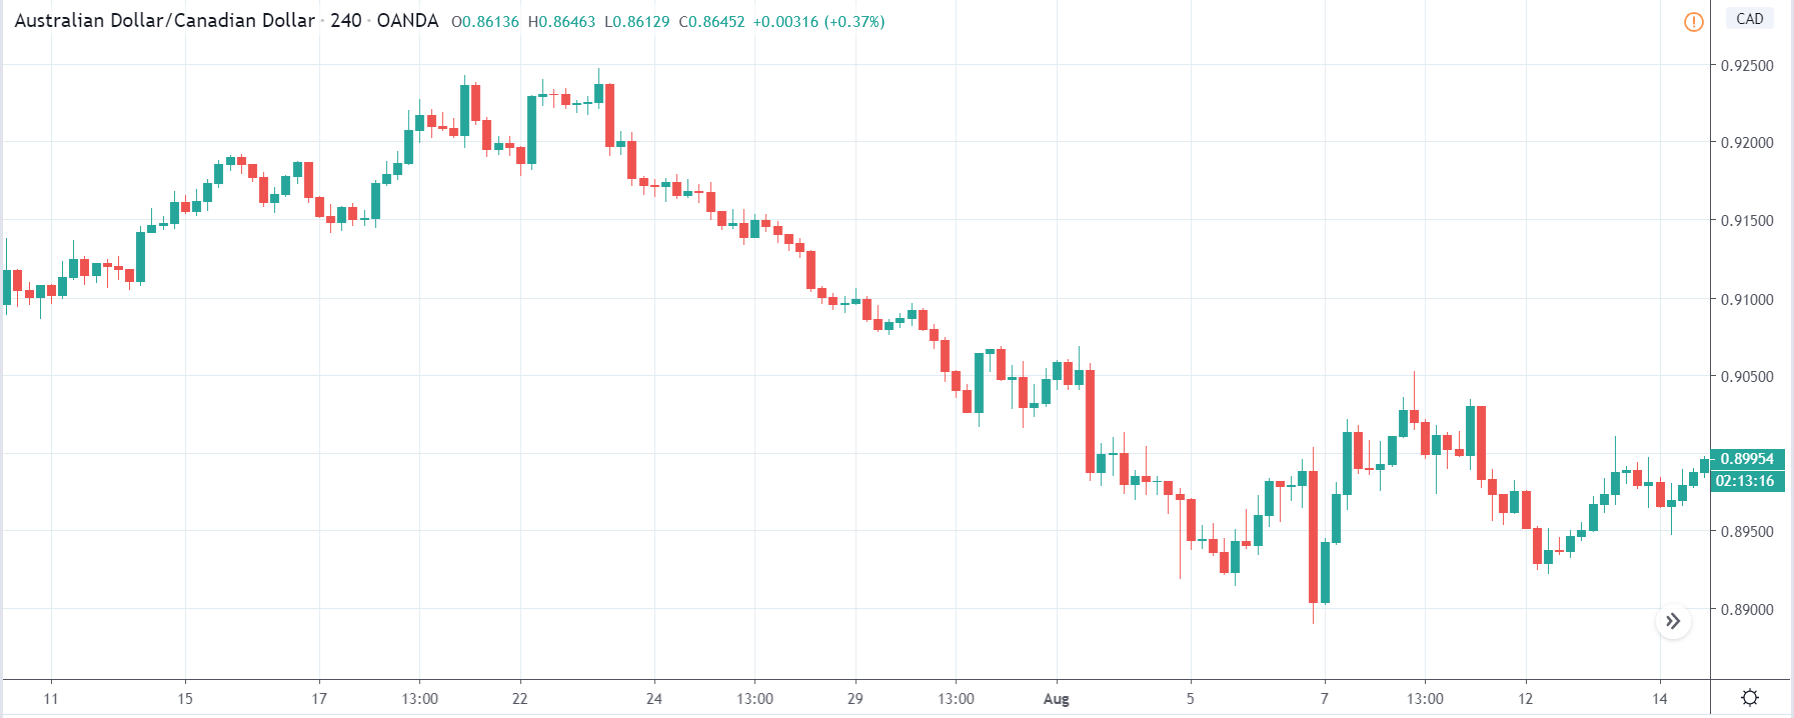
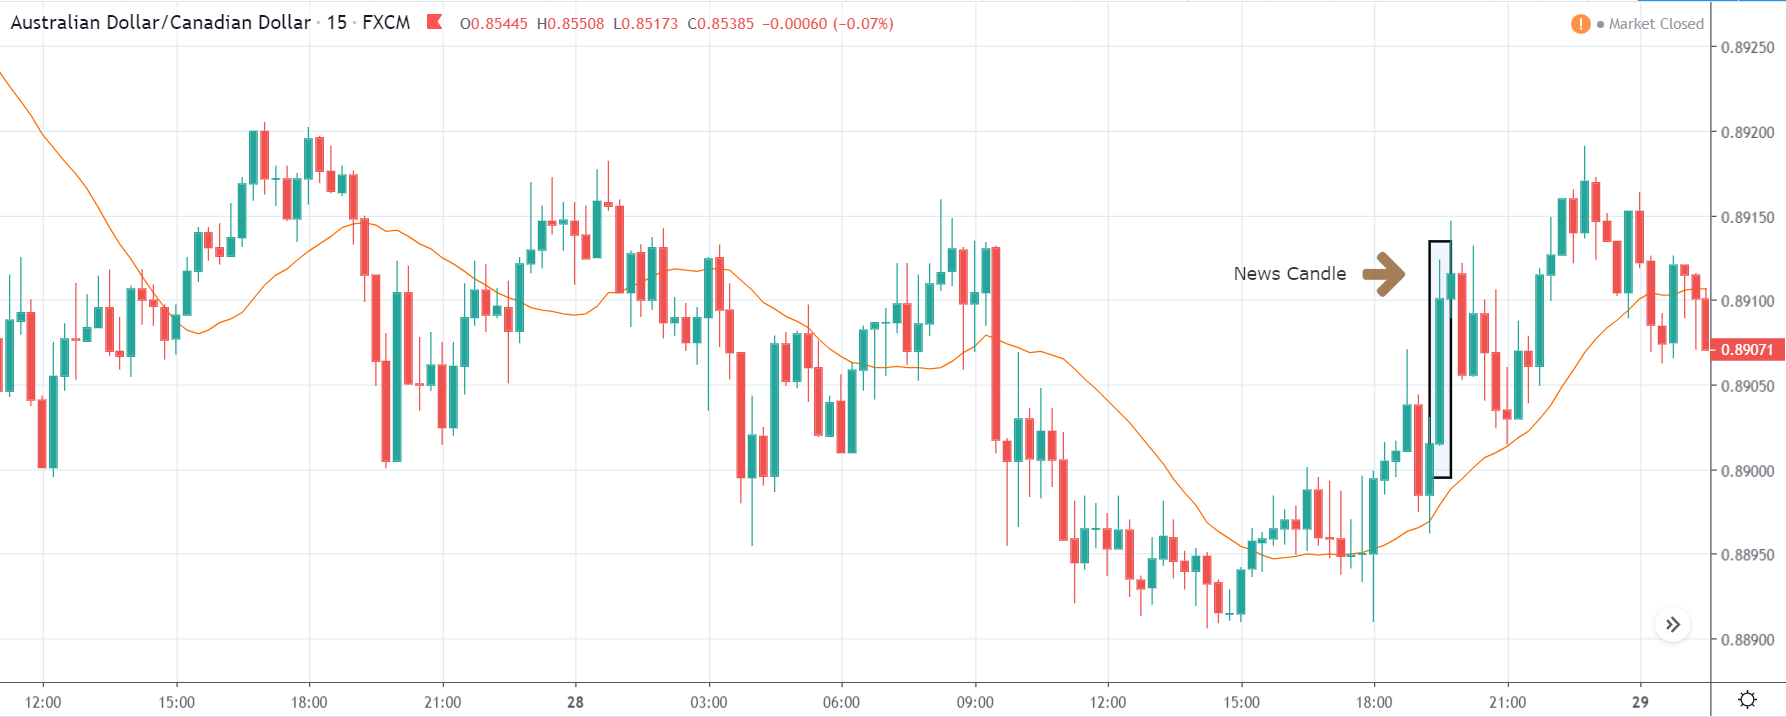
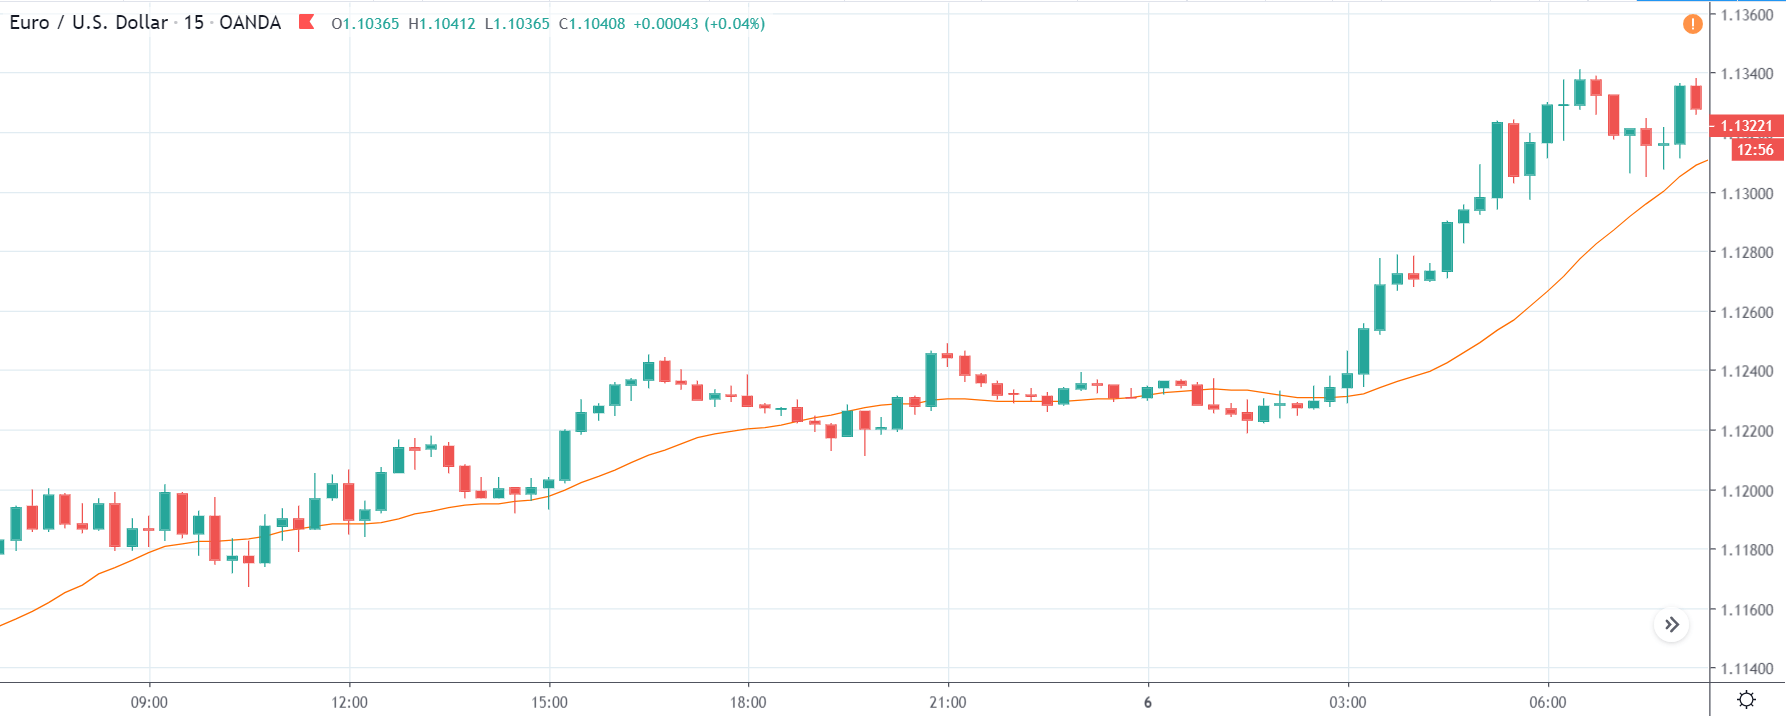
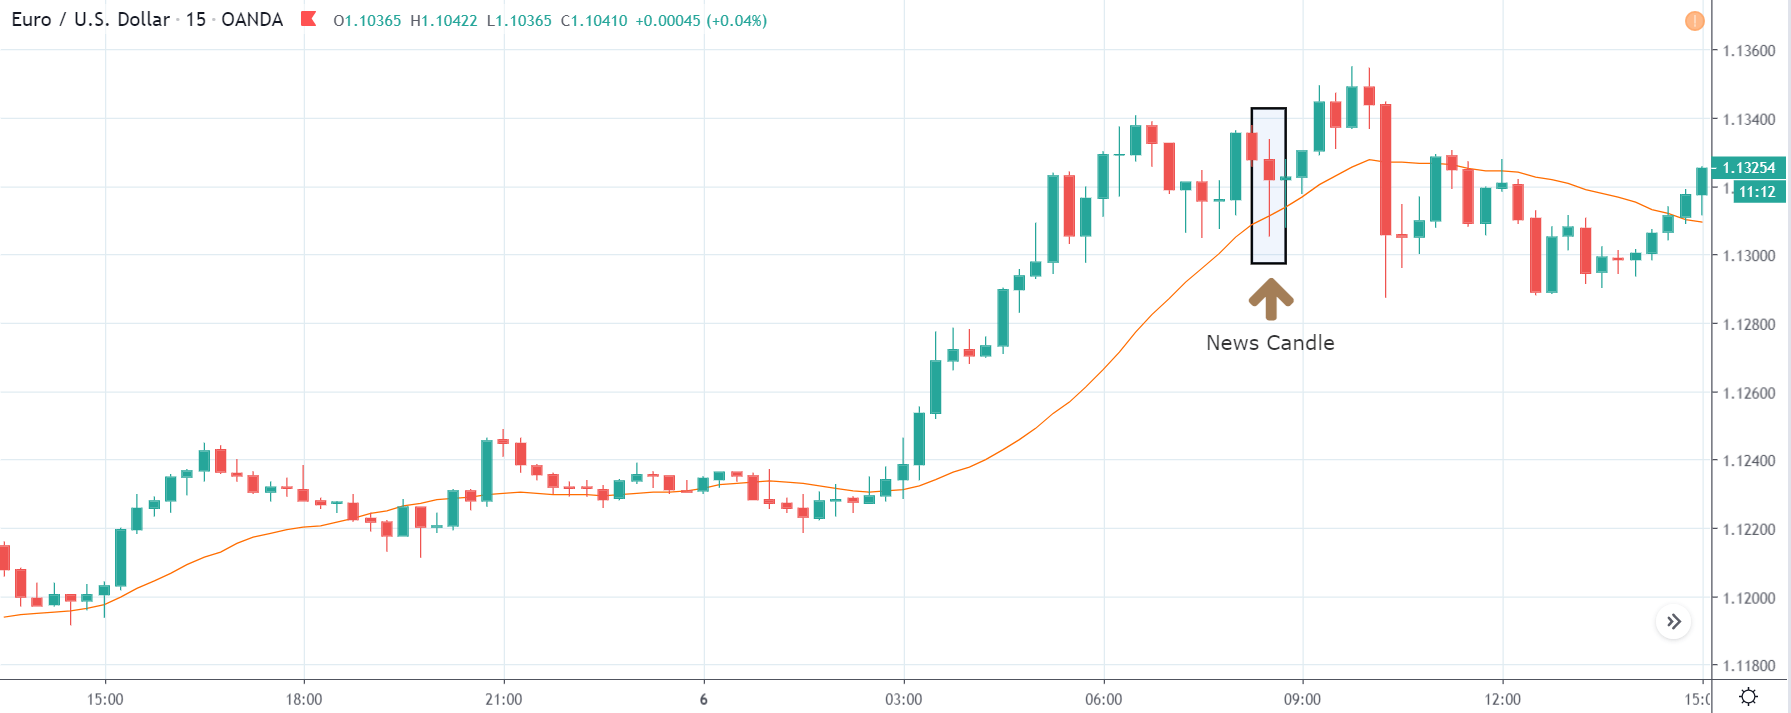
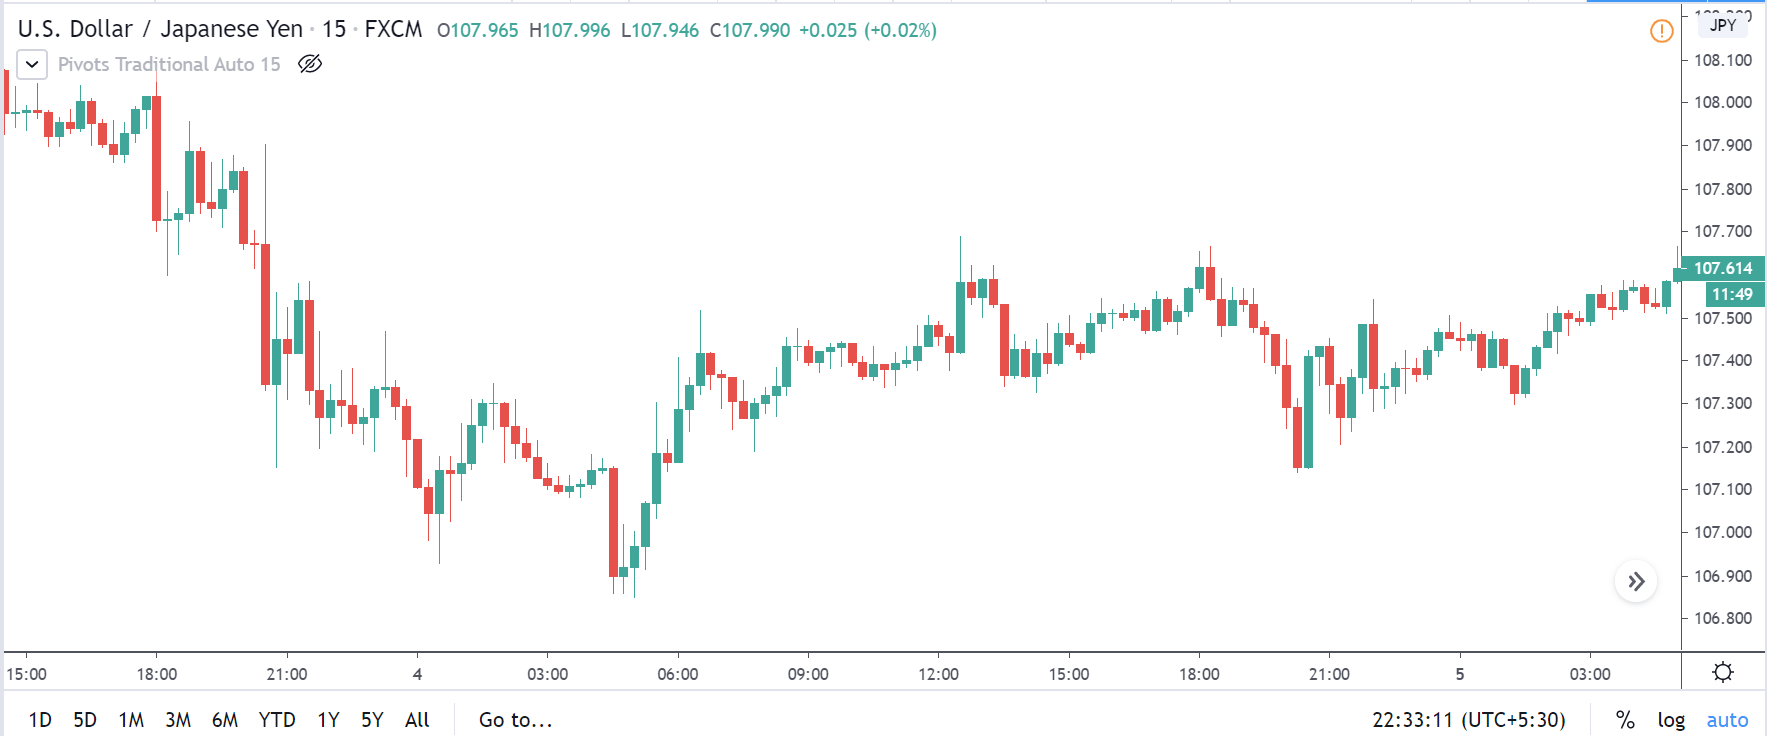
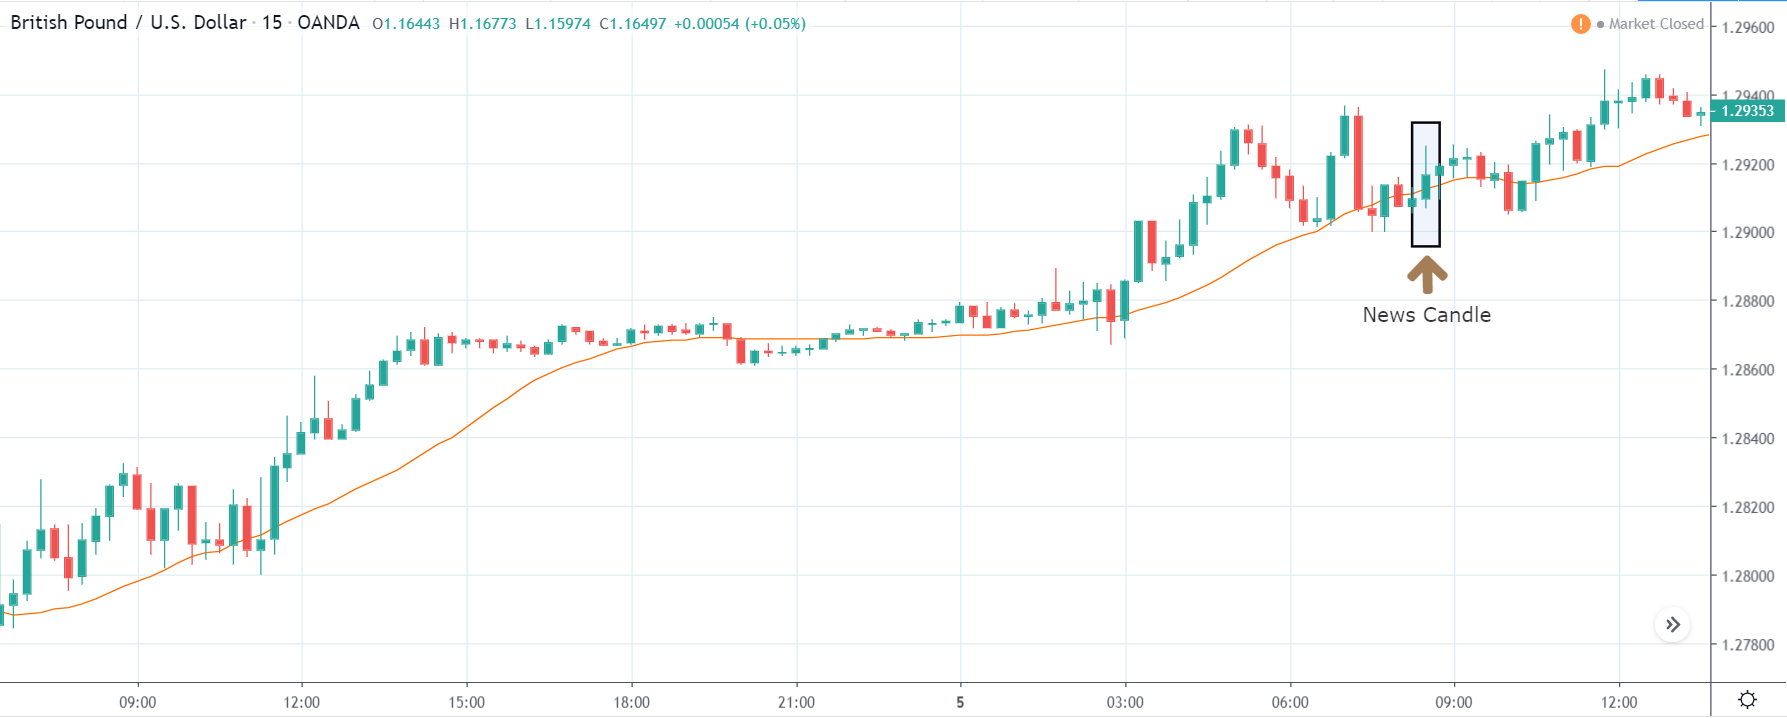
USD/ZAR | Before the announcement:

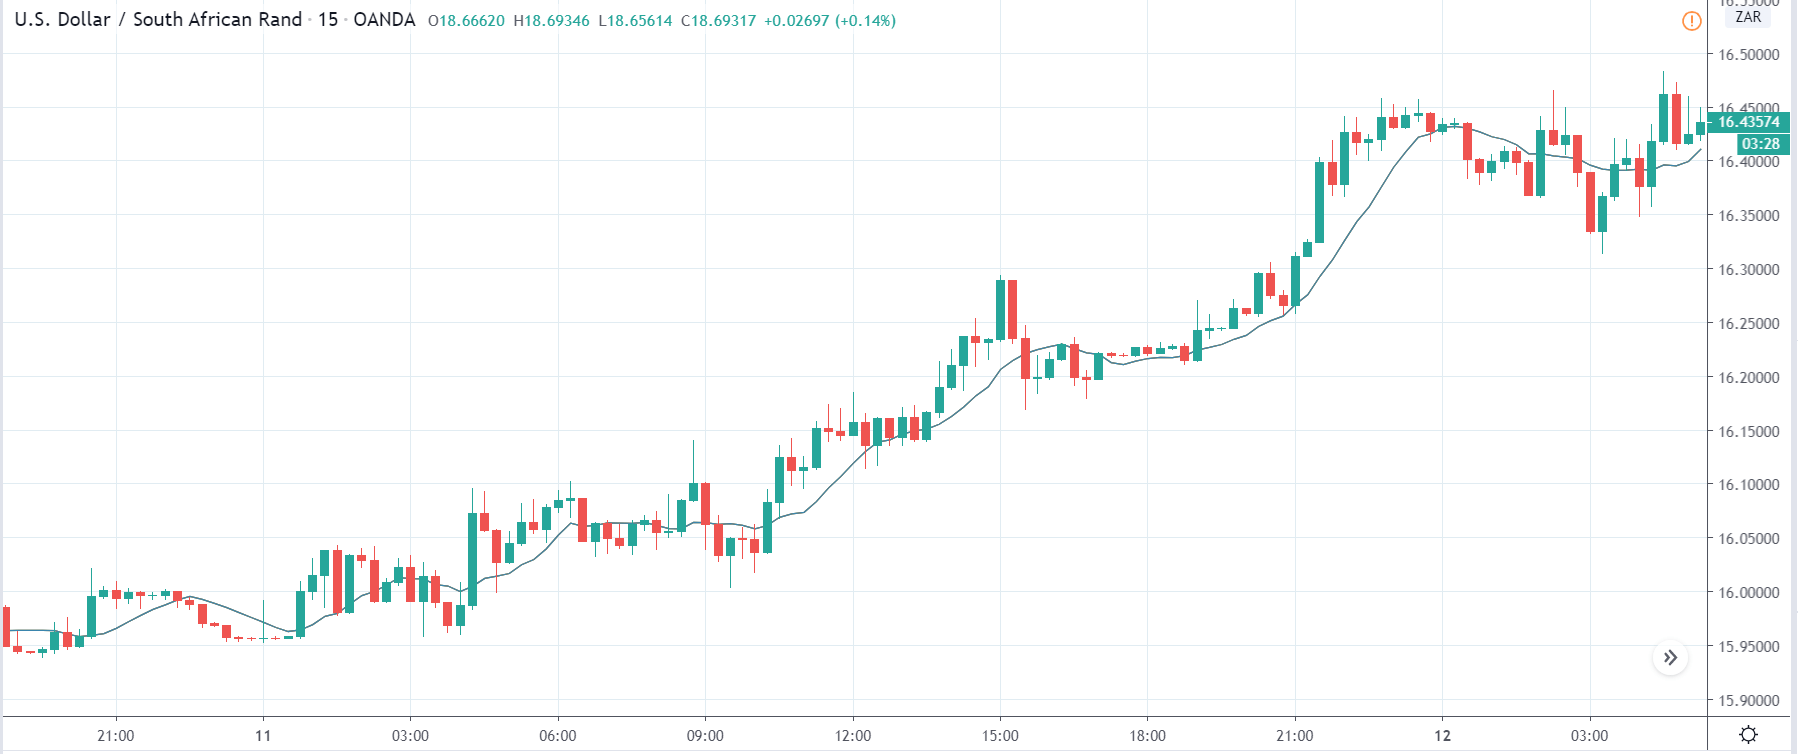
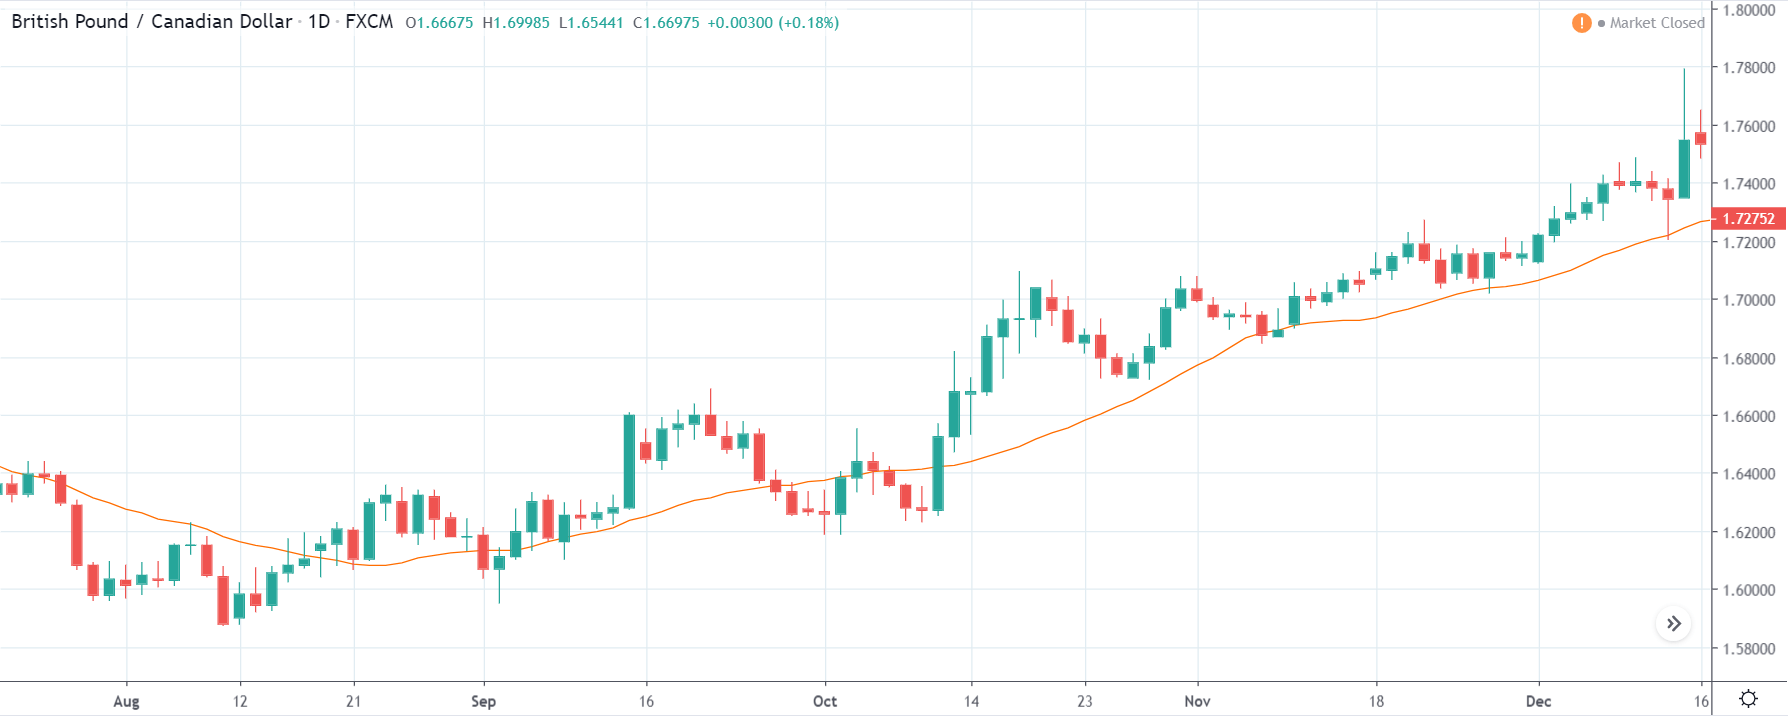
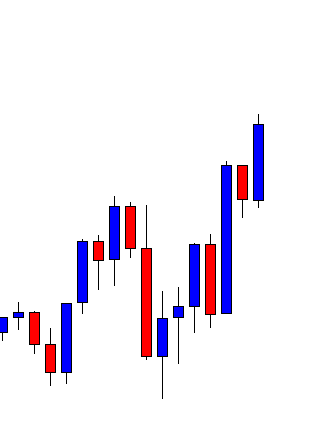
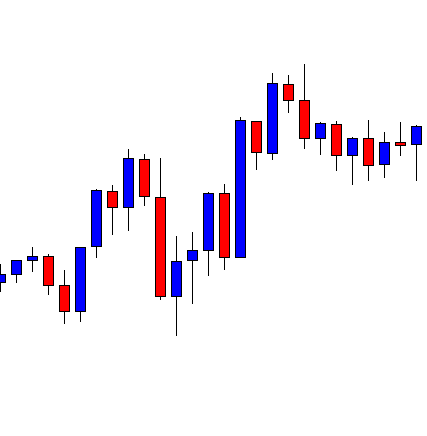
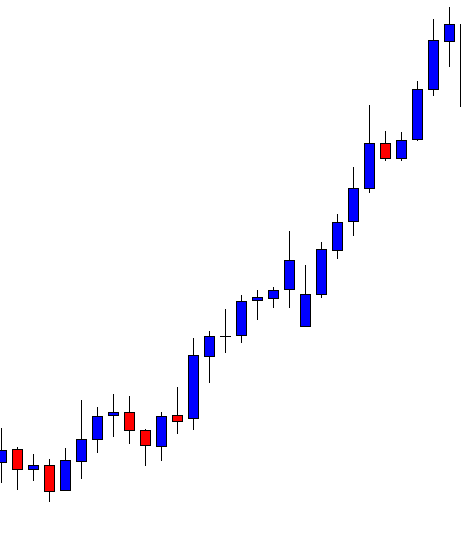
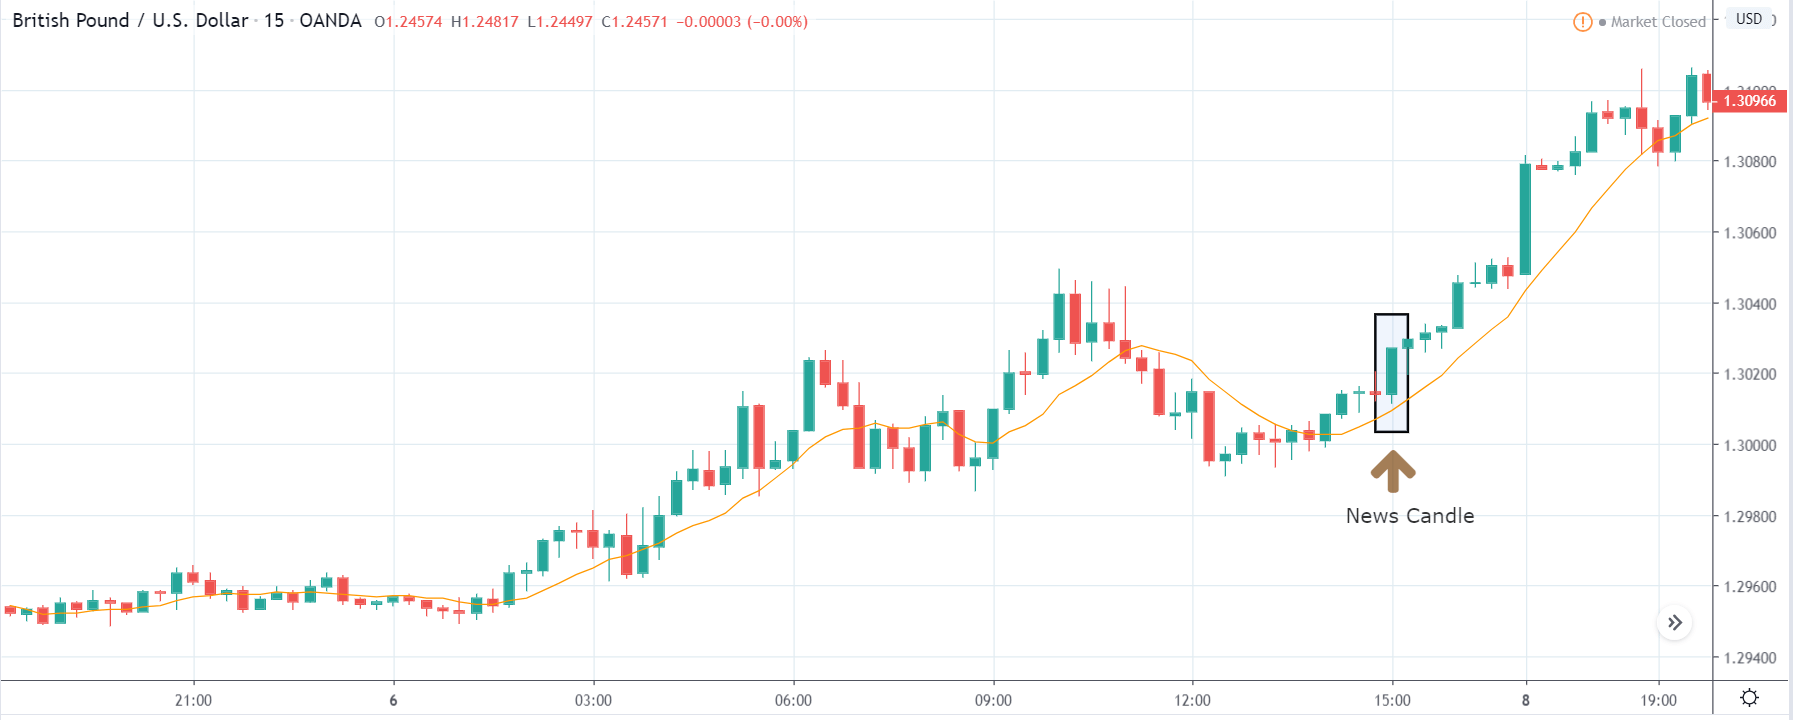
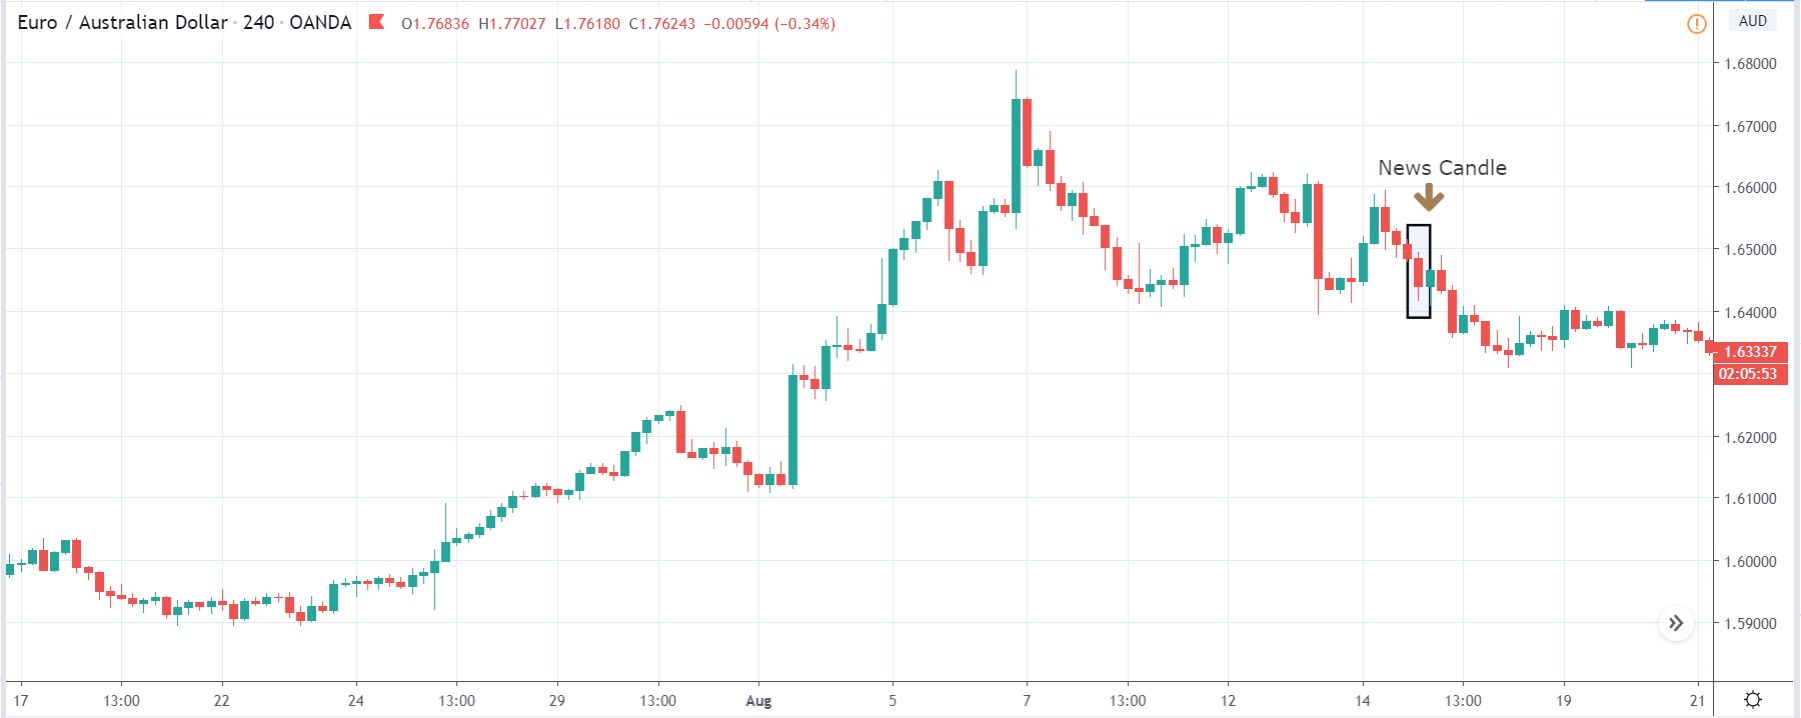
The first pair that will be discussed is the USD/ZAR currency pair. Here, we see that the market is in a strong uptrend before the news announcement, as shown in the above image. As the impact of Mining production is less on the value of a currency, we will wait for the price to retrace near a ‘support’ area and then take a ‘buy’ trade. Until then, we have to watch if the price crashes below or shows signs of reversal.

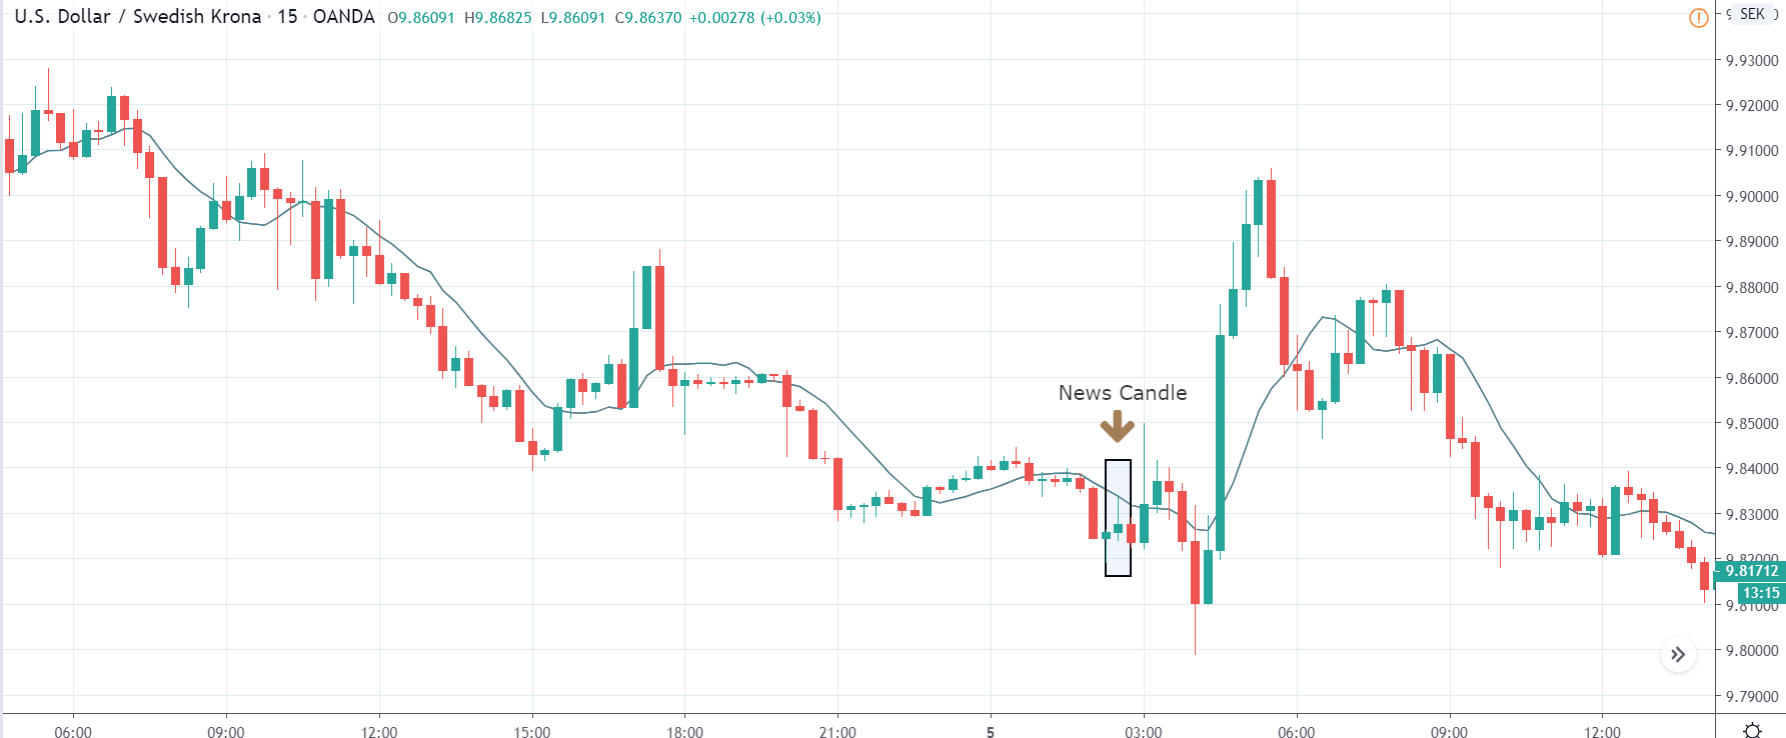
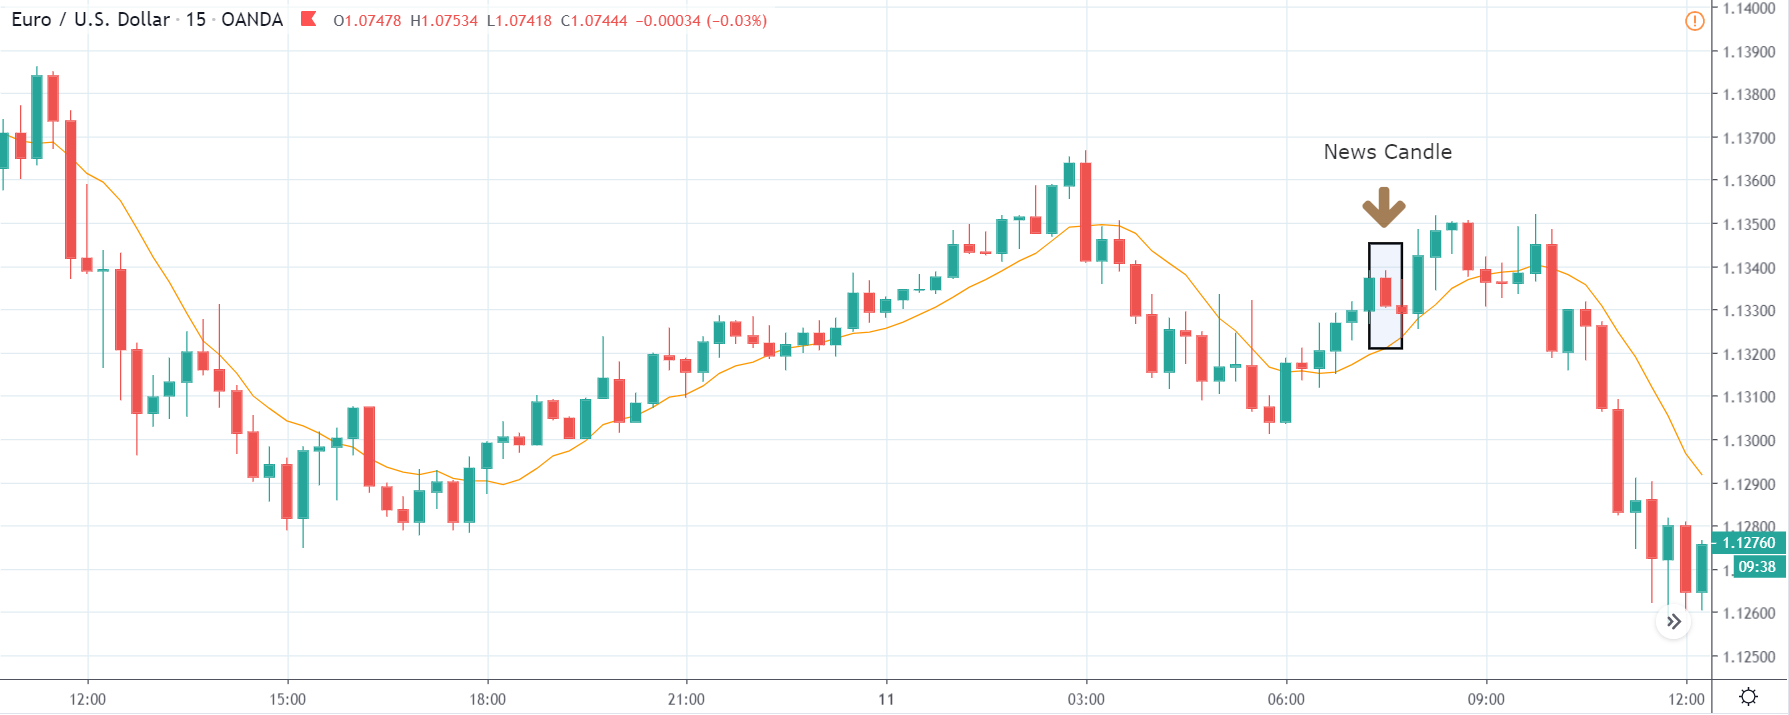
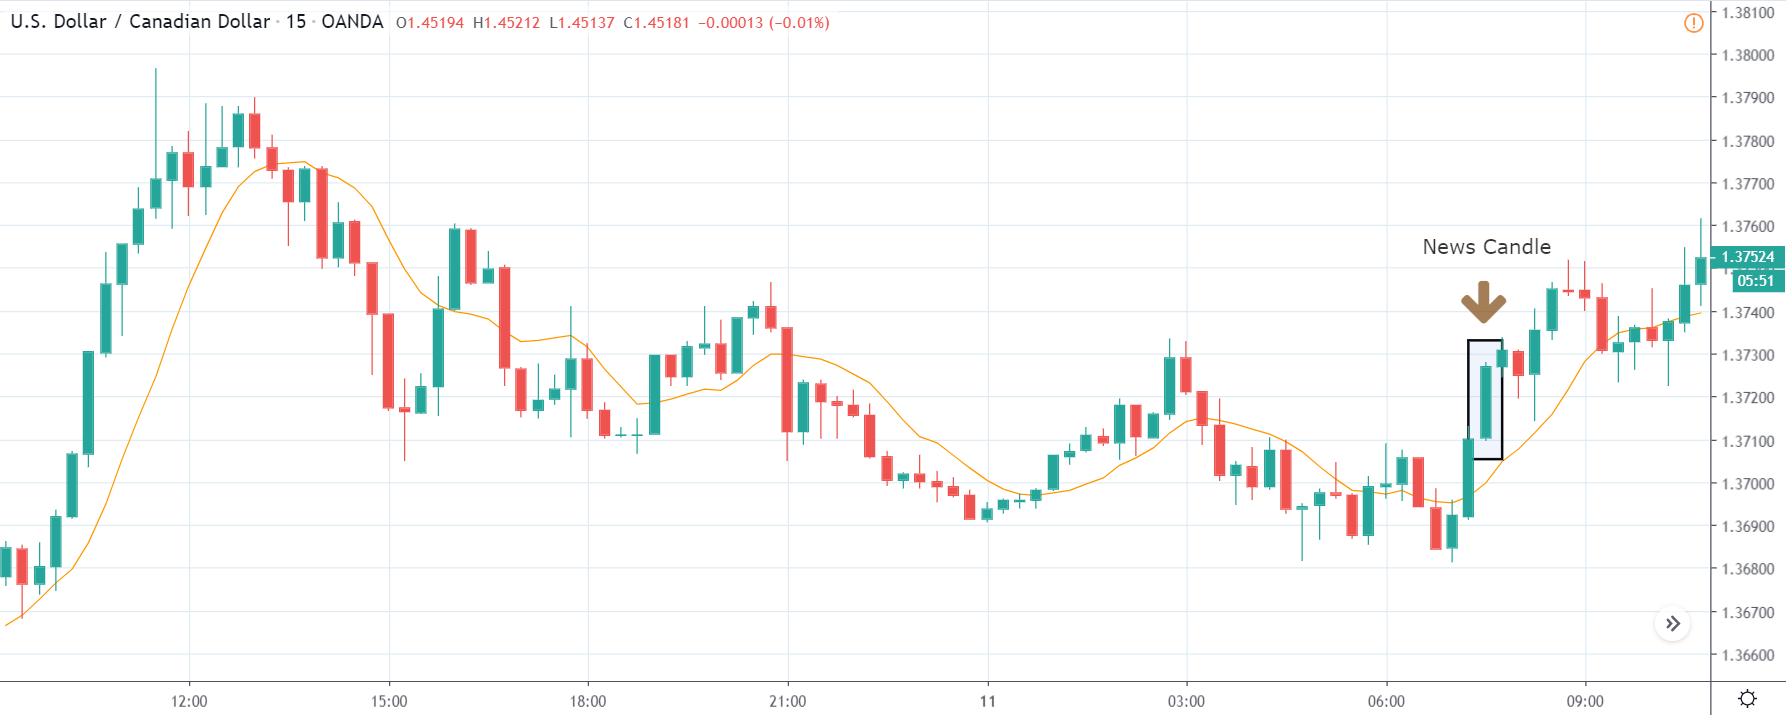
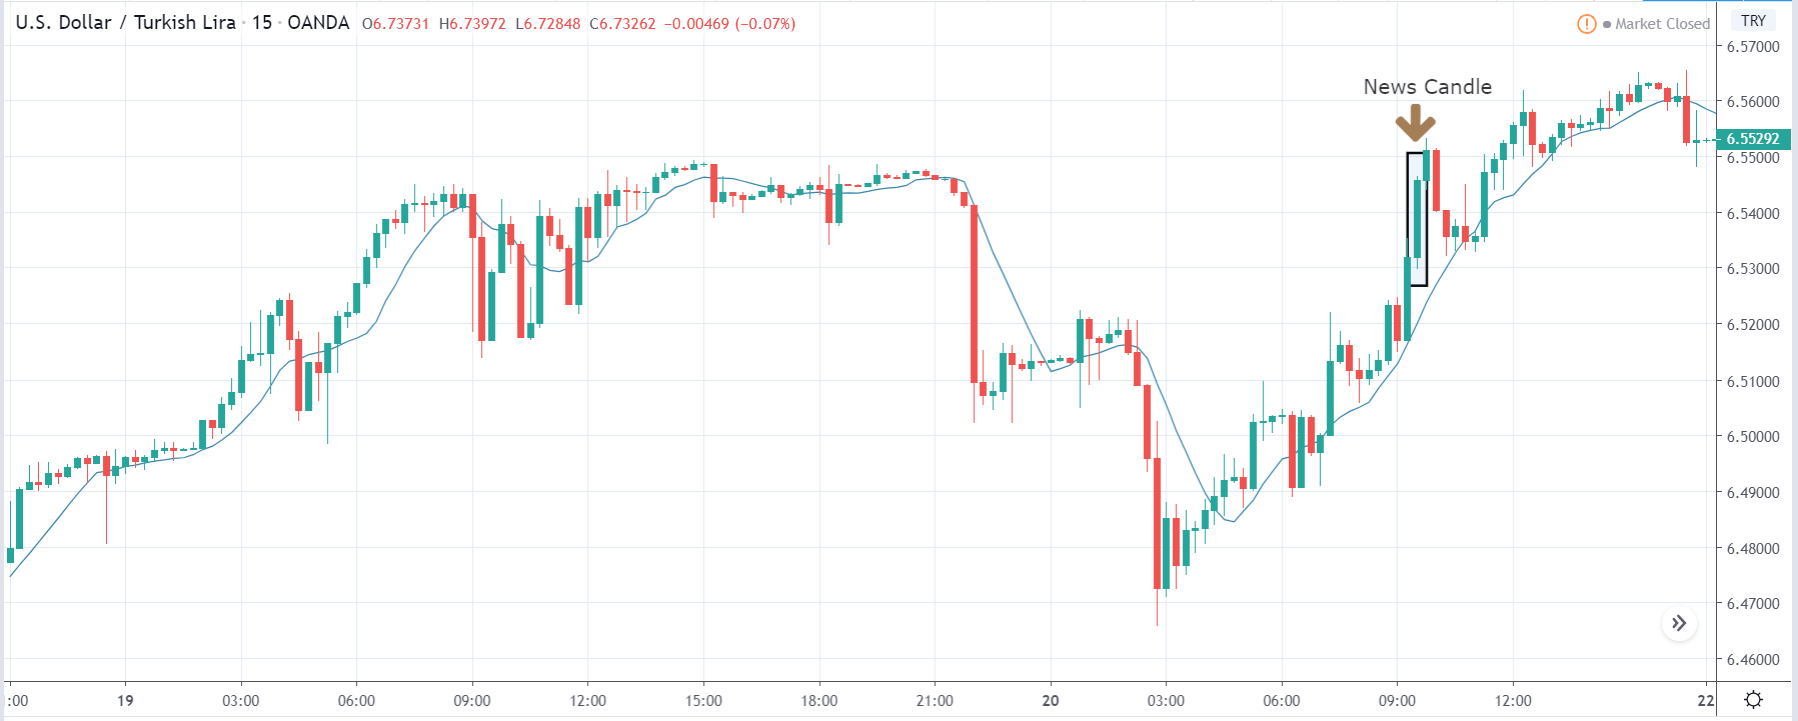
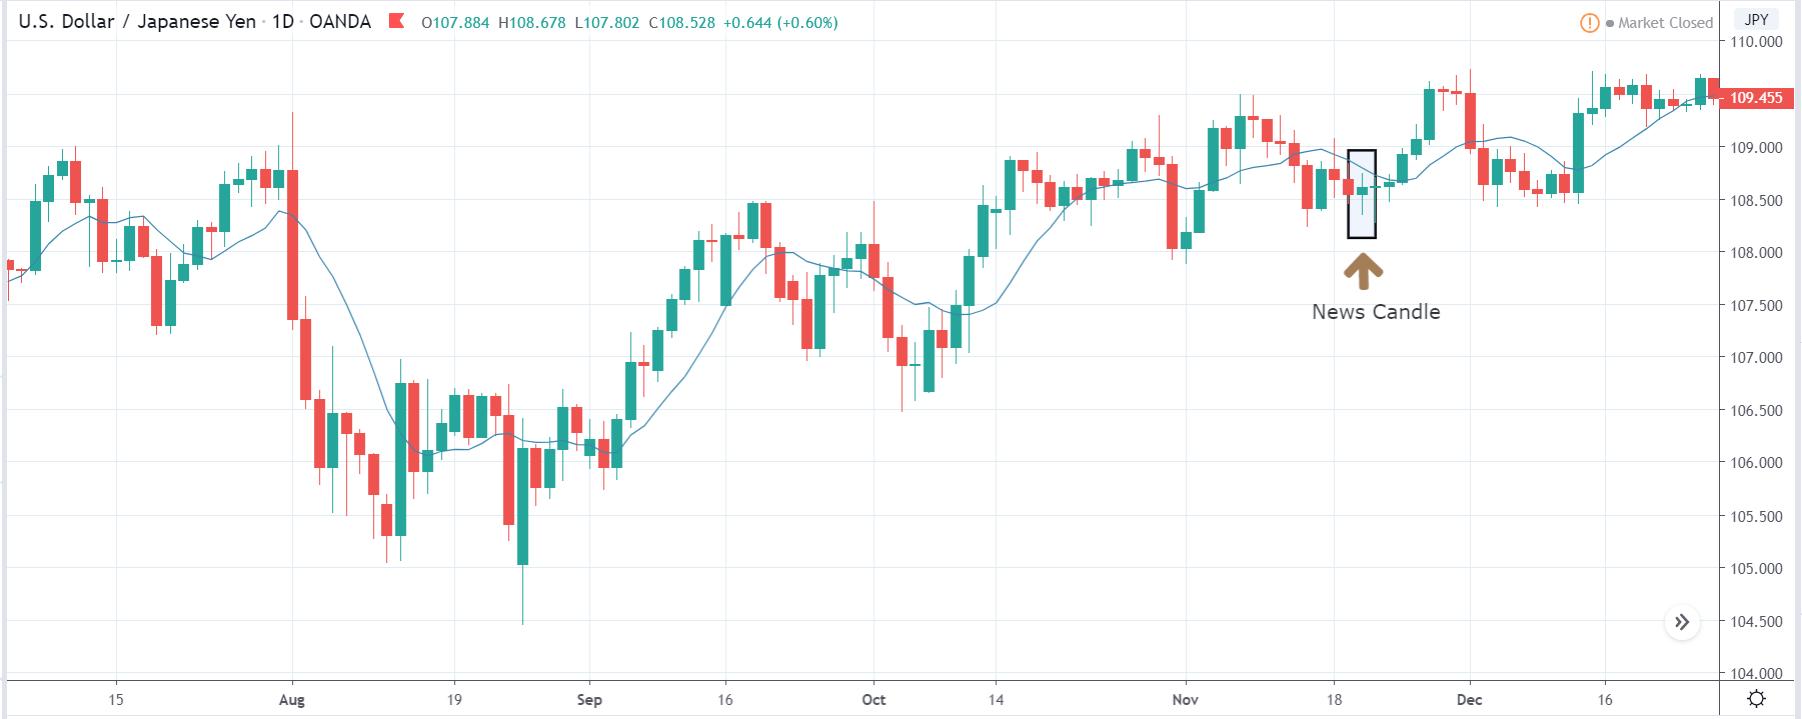
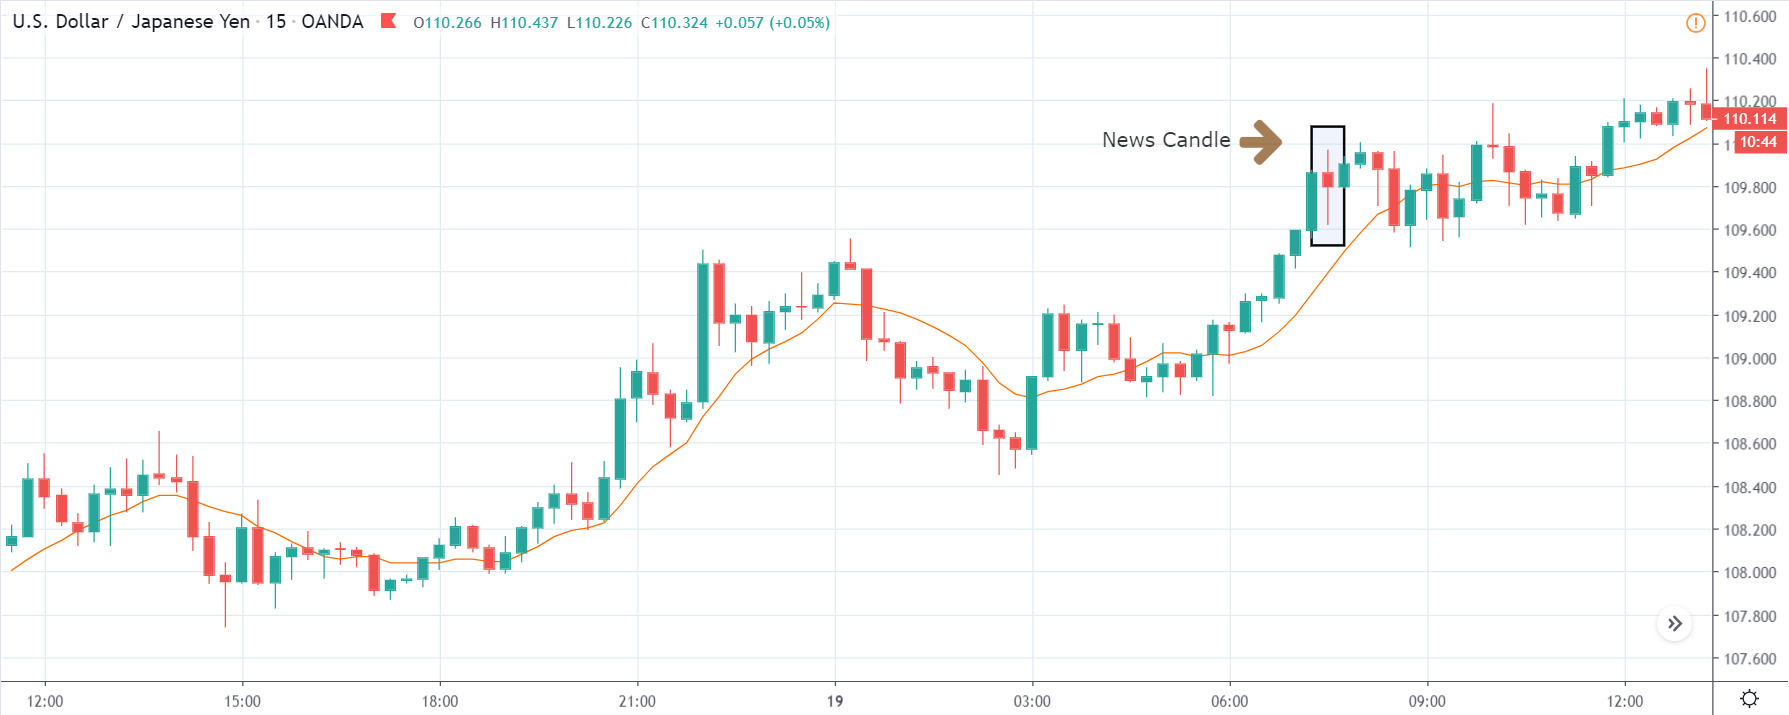
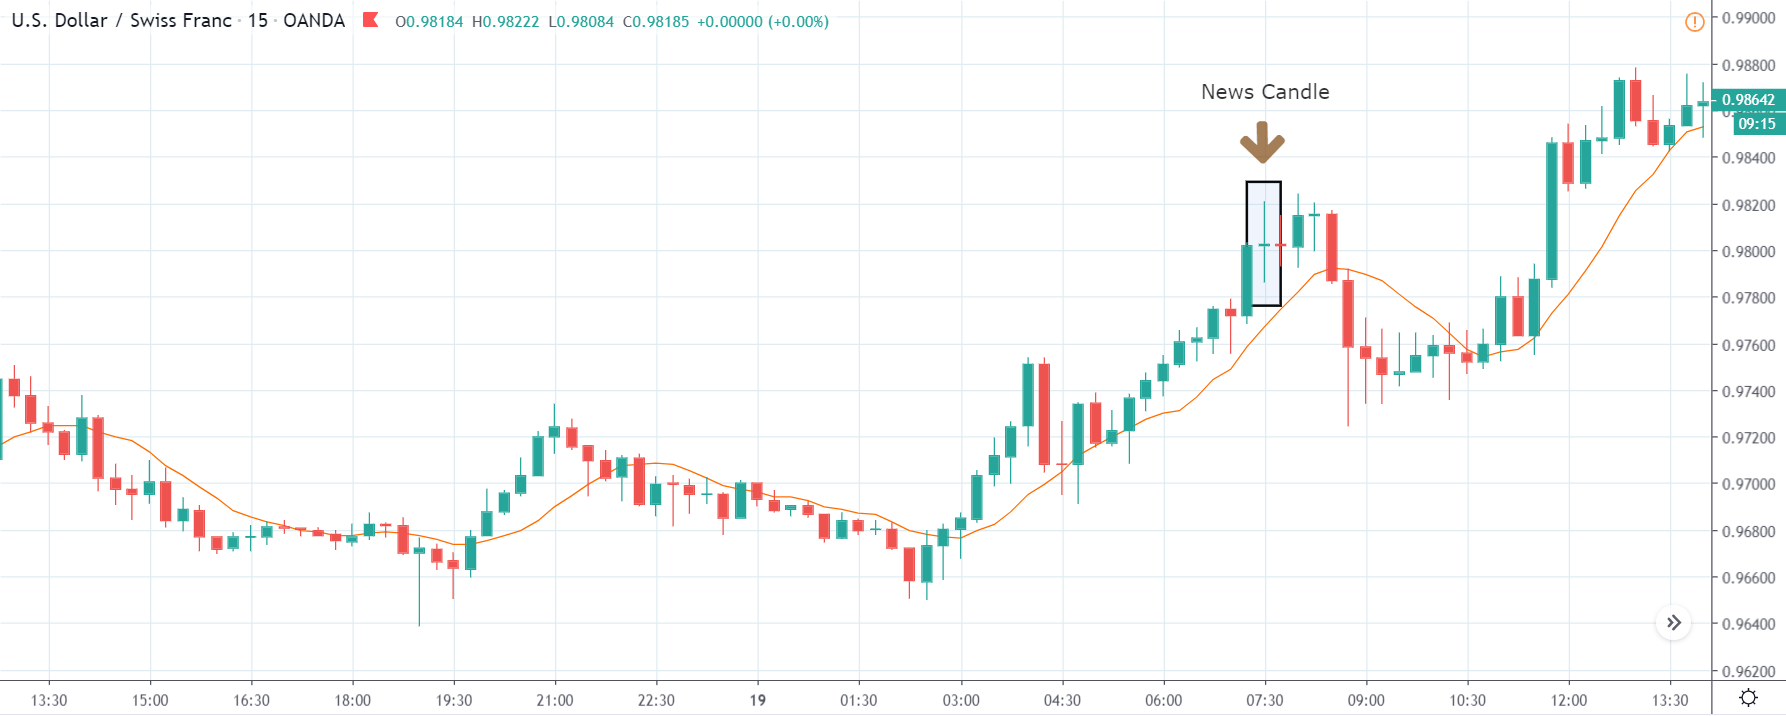
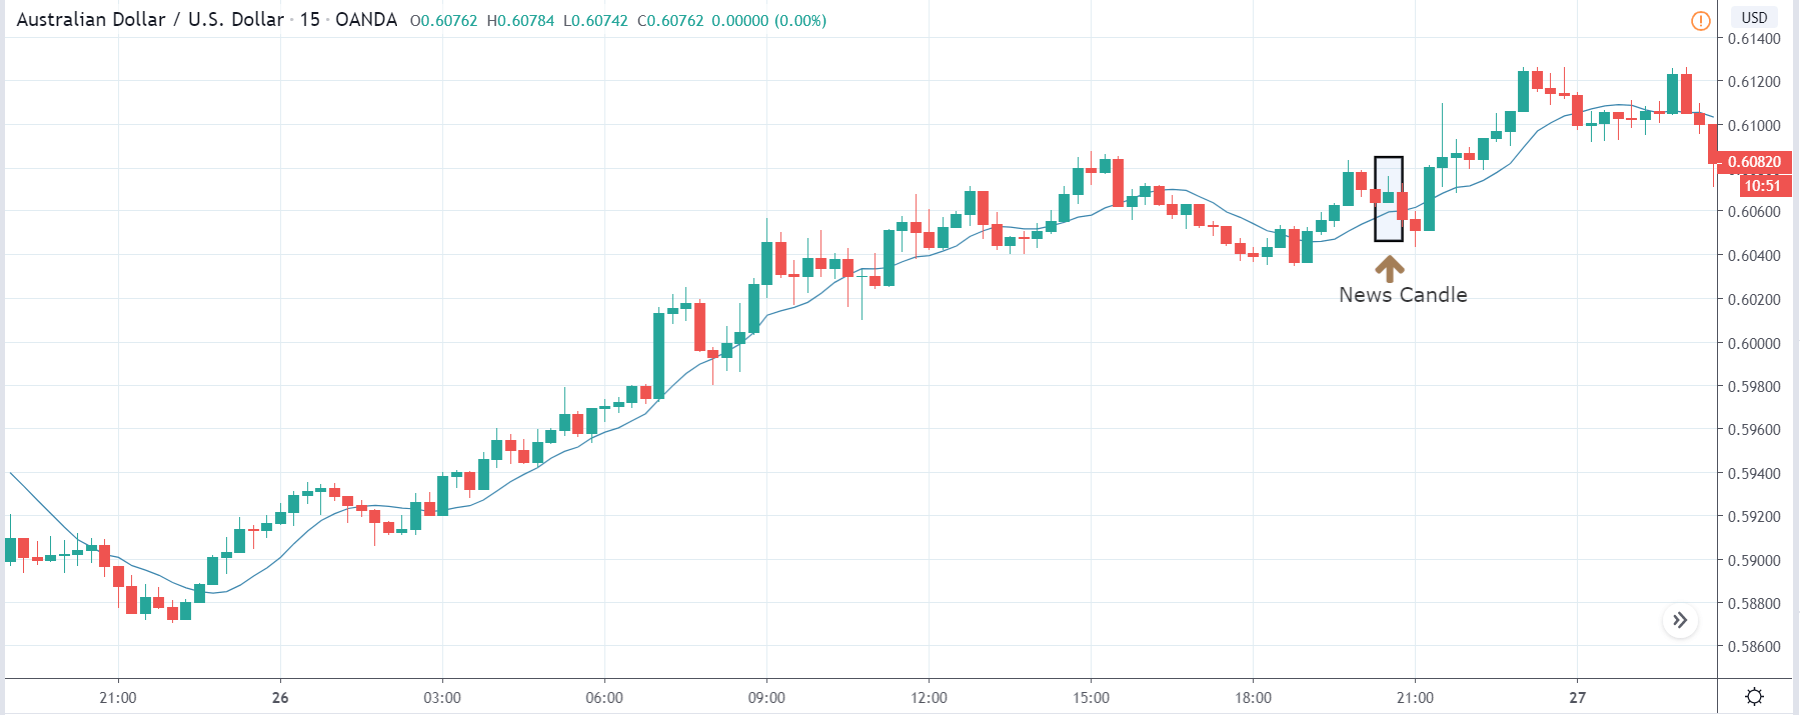
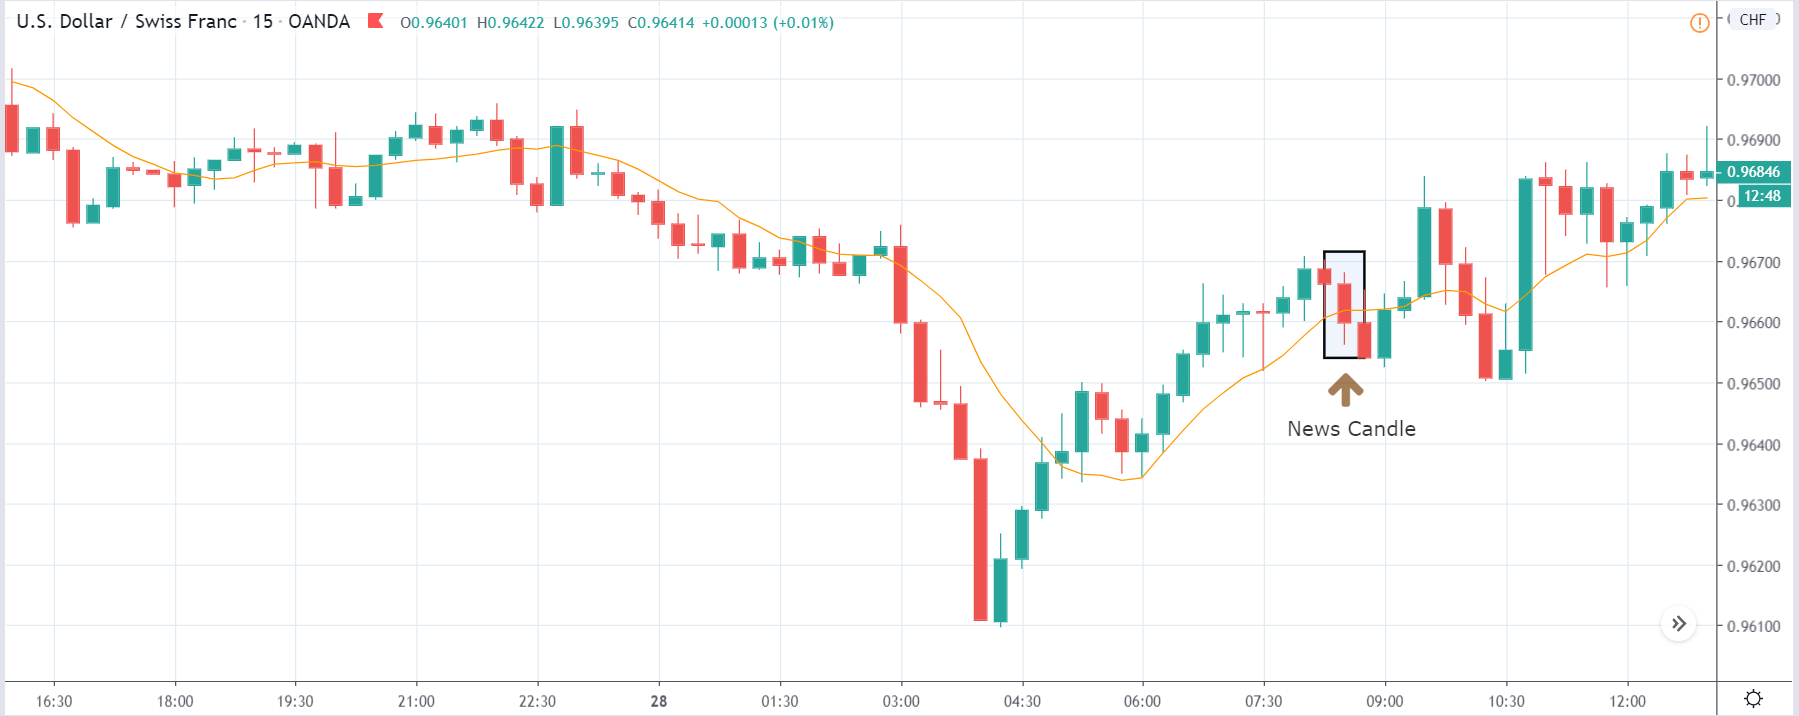
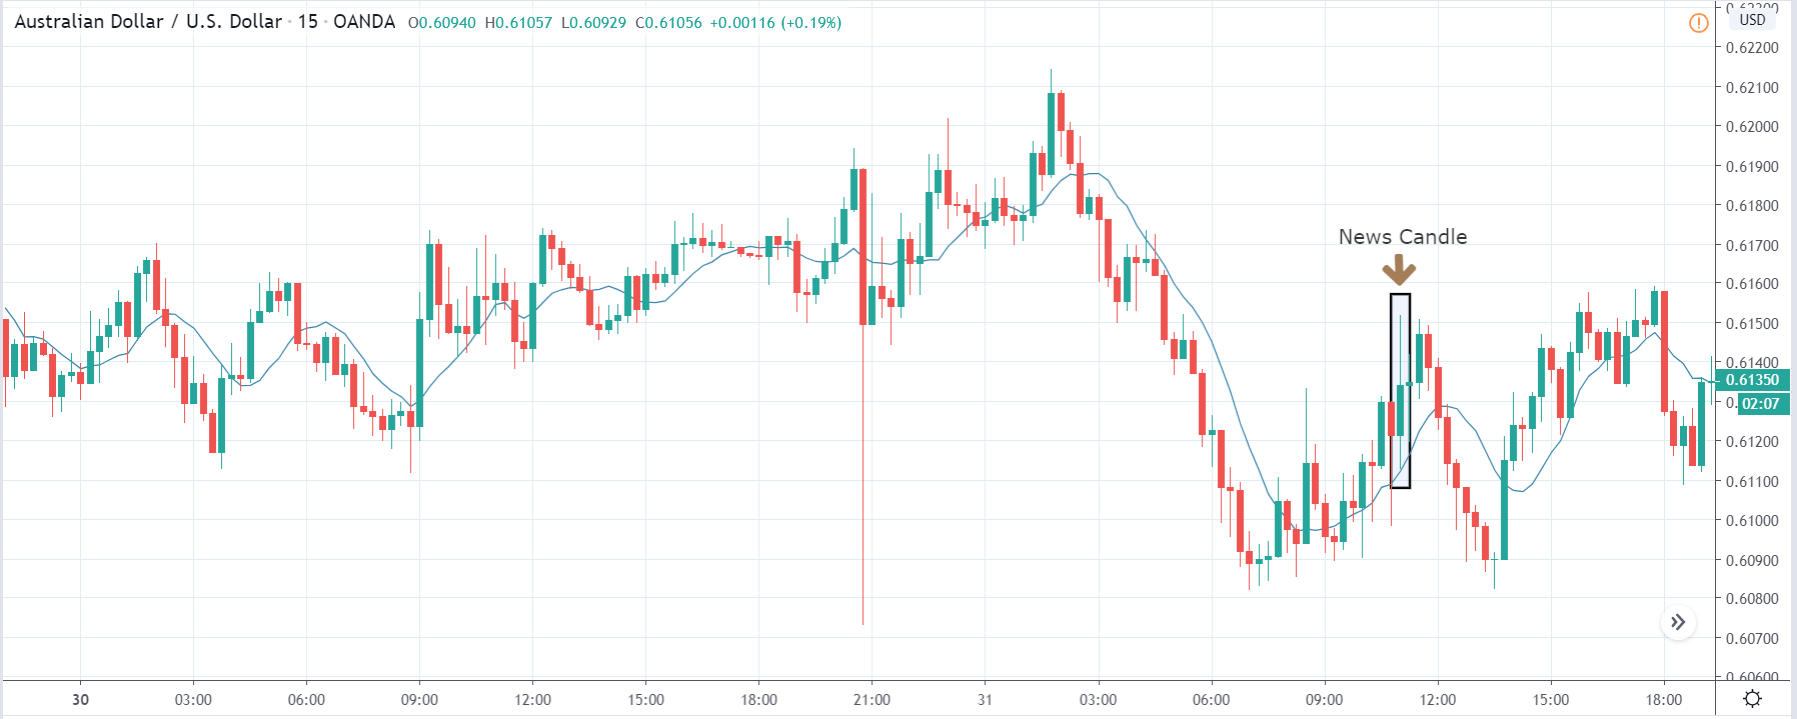
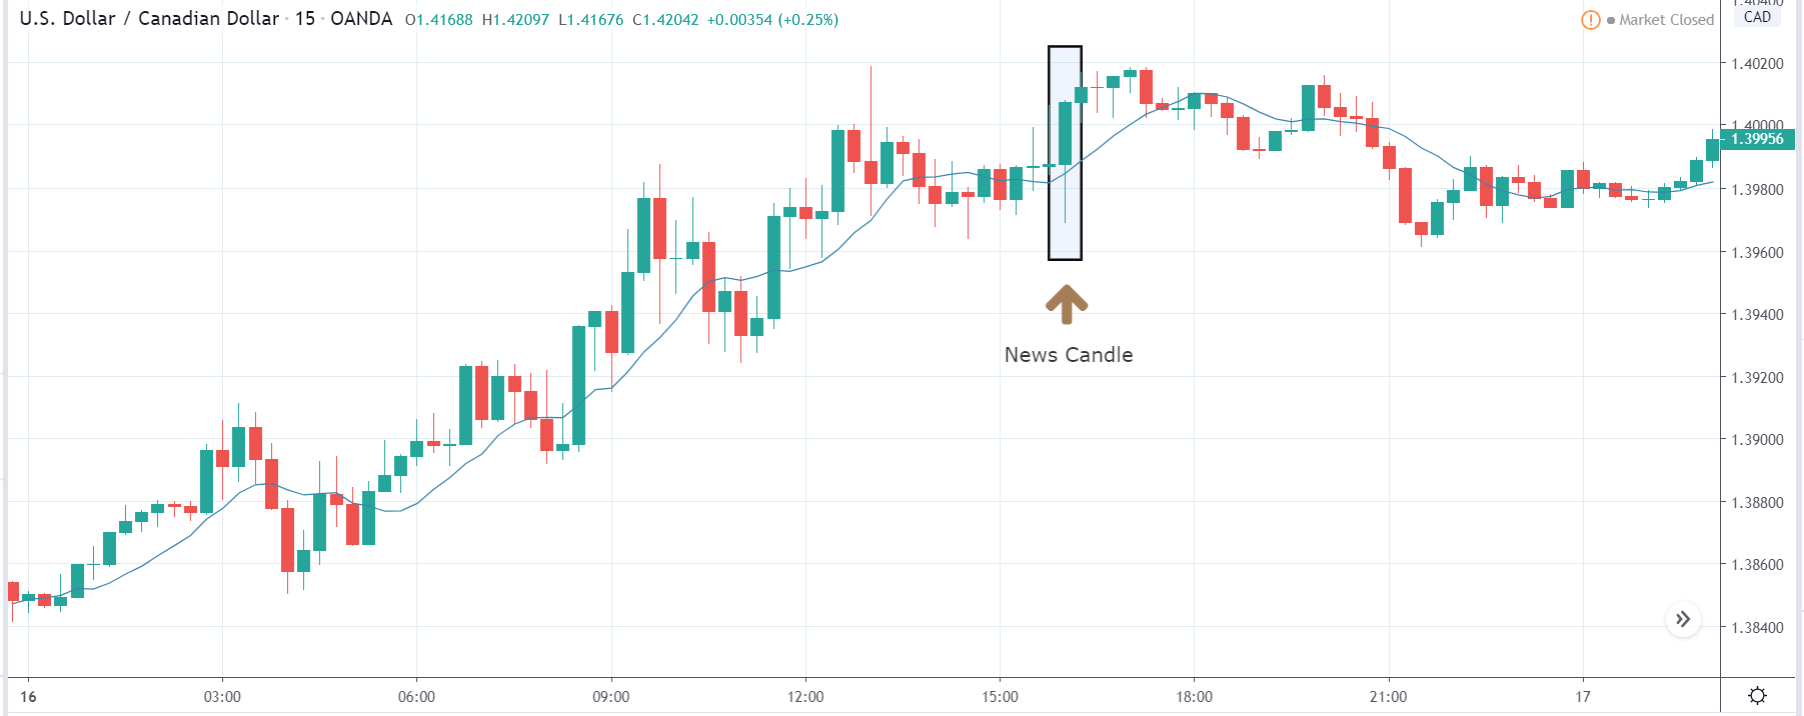
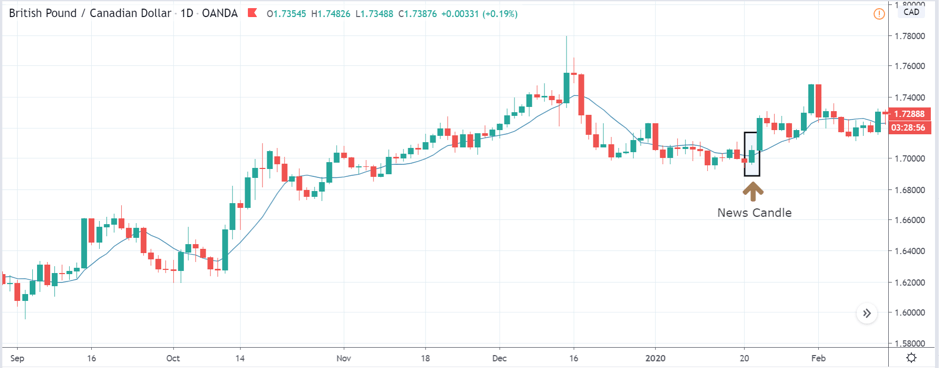
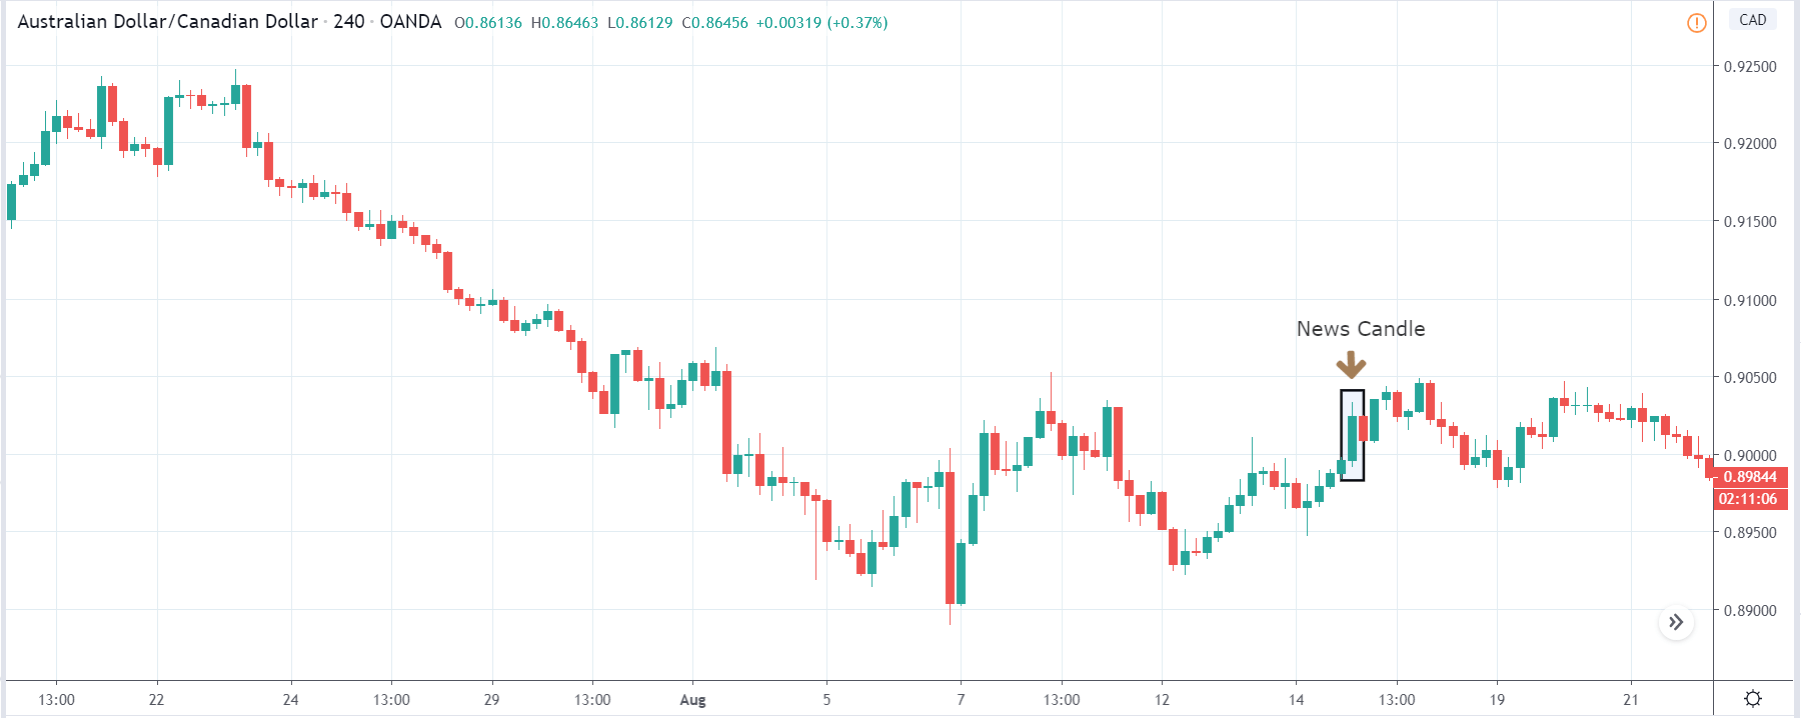
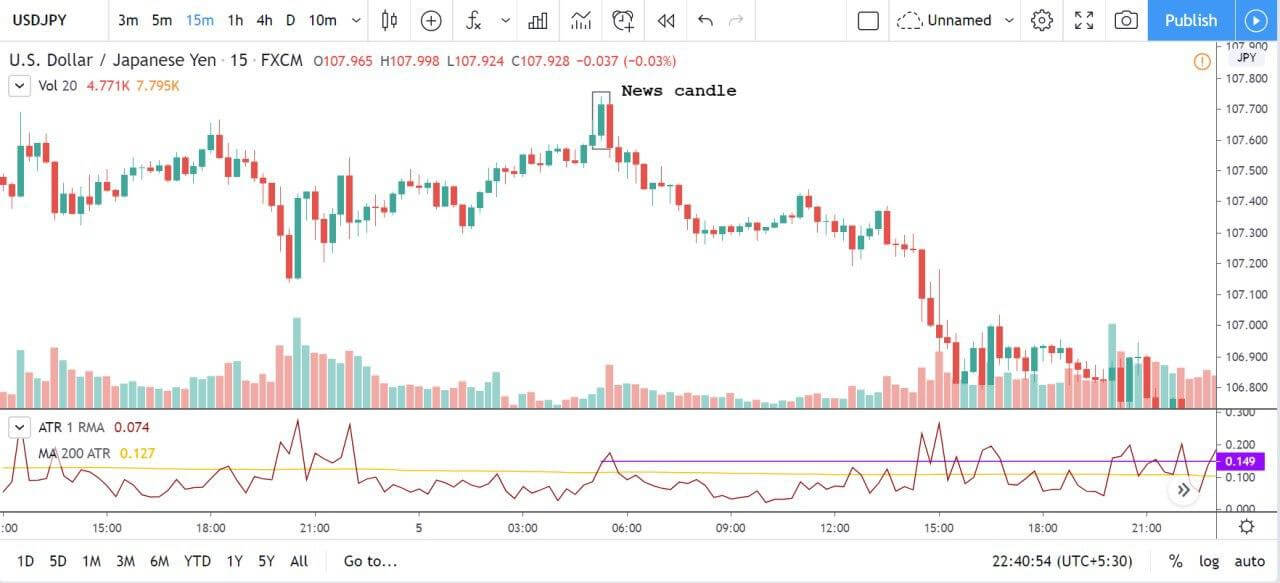
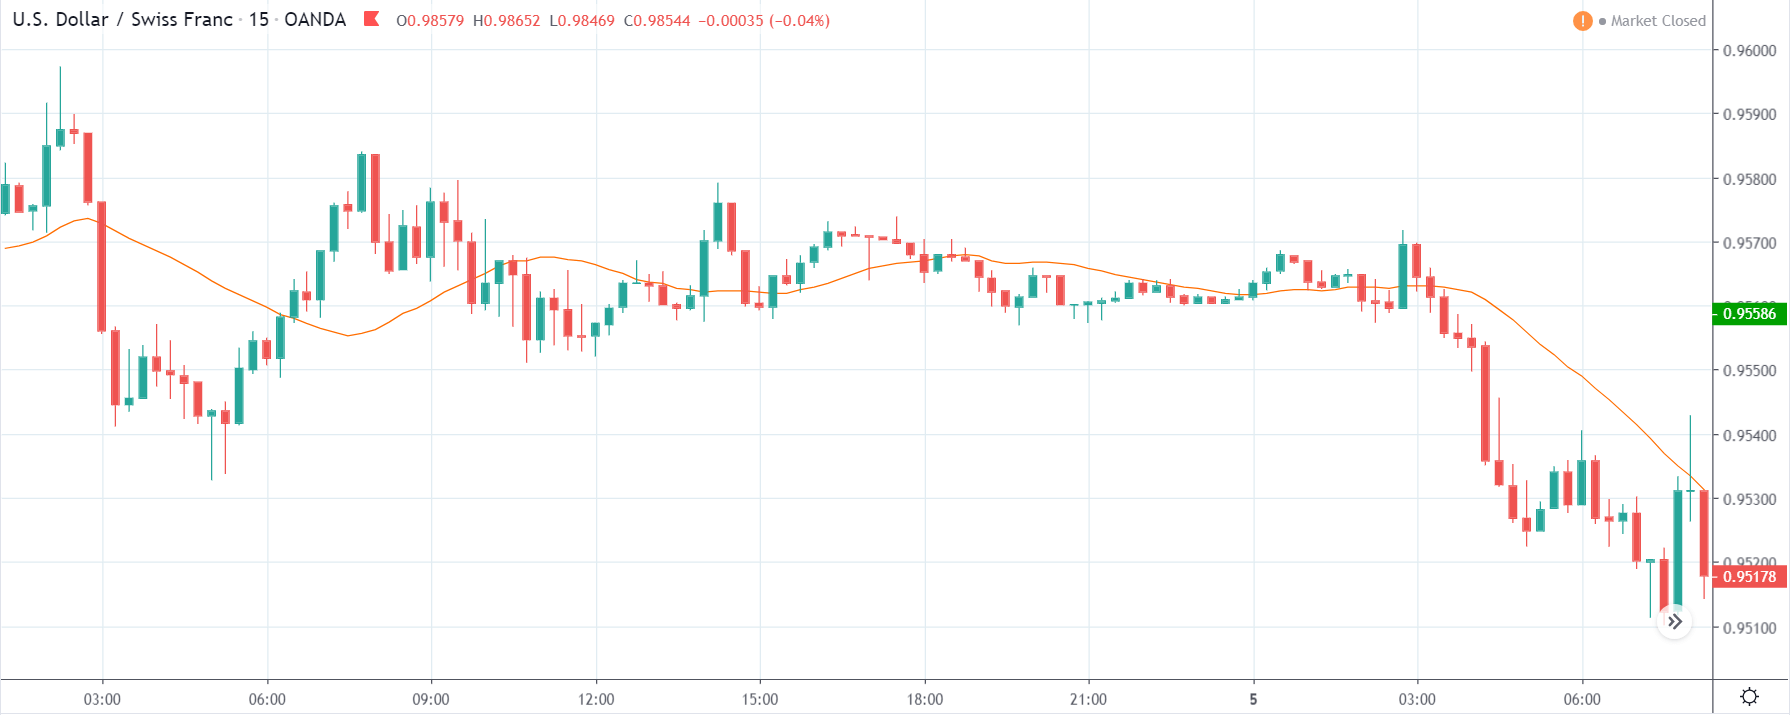
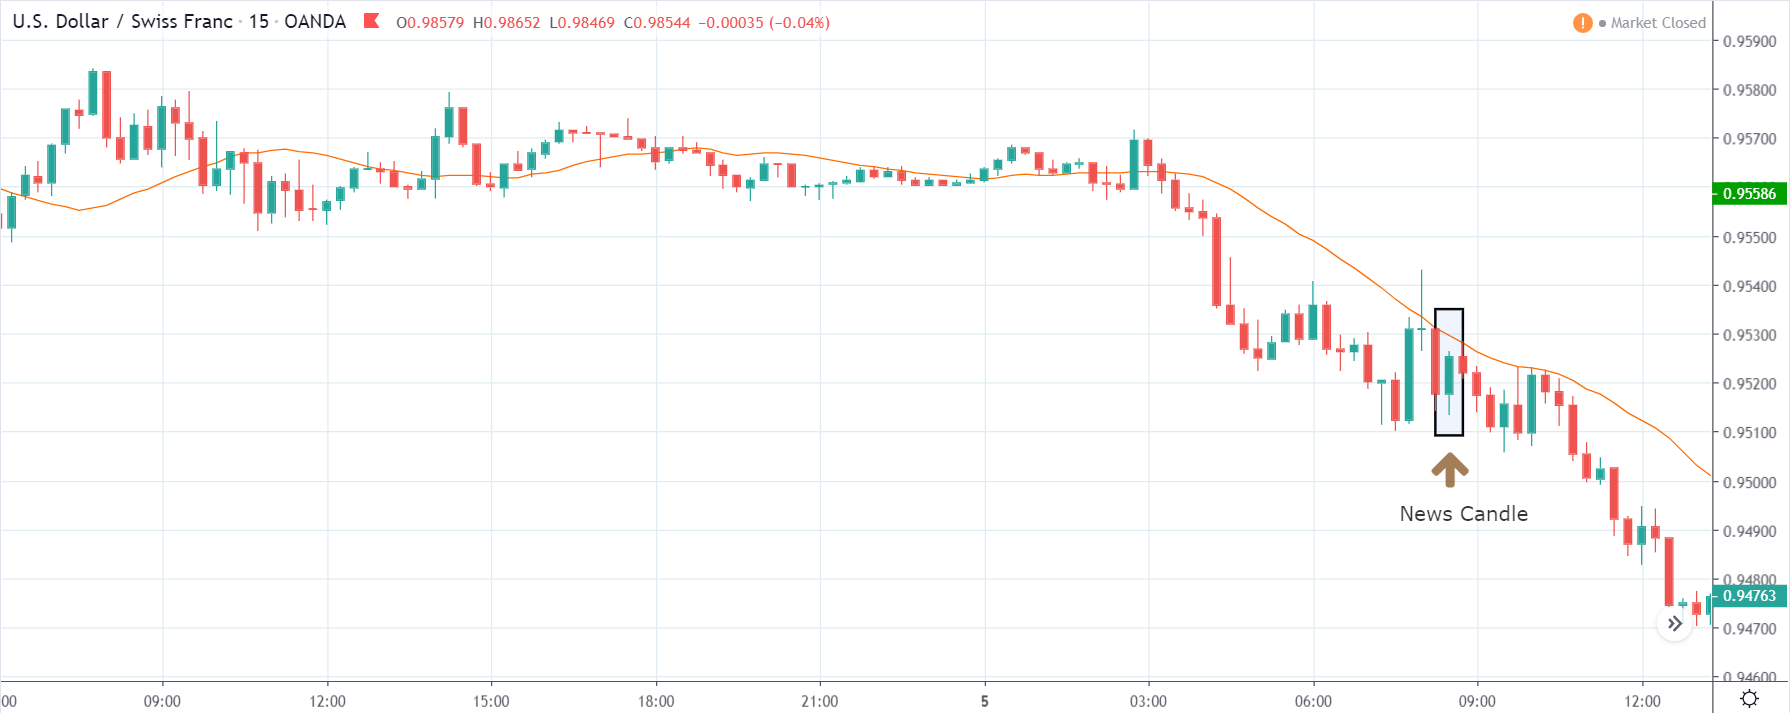
USD/ZAR | After the announcement:

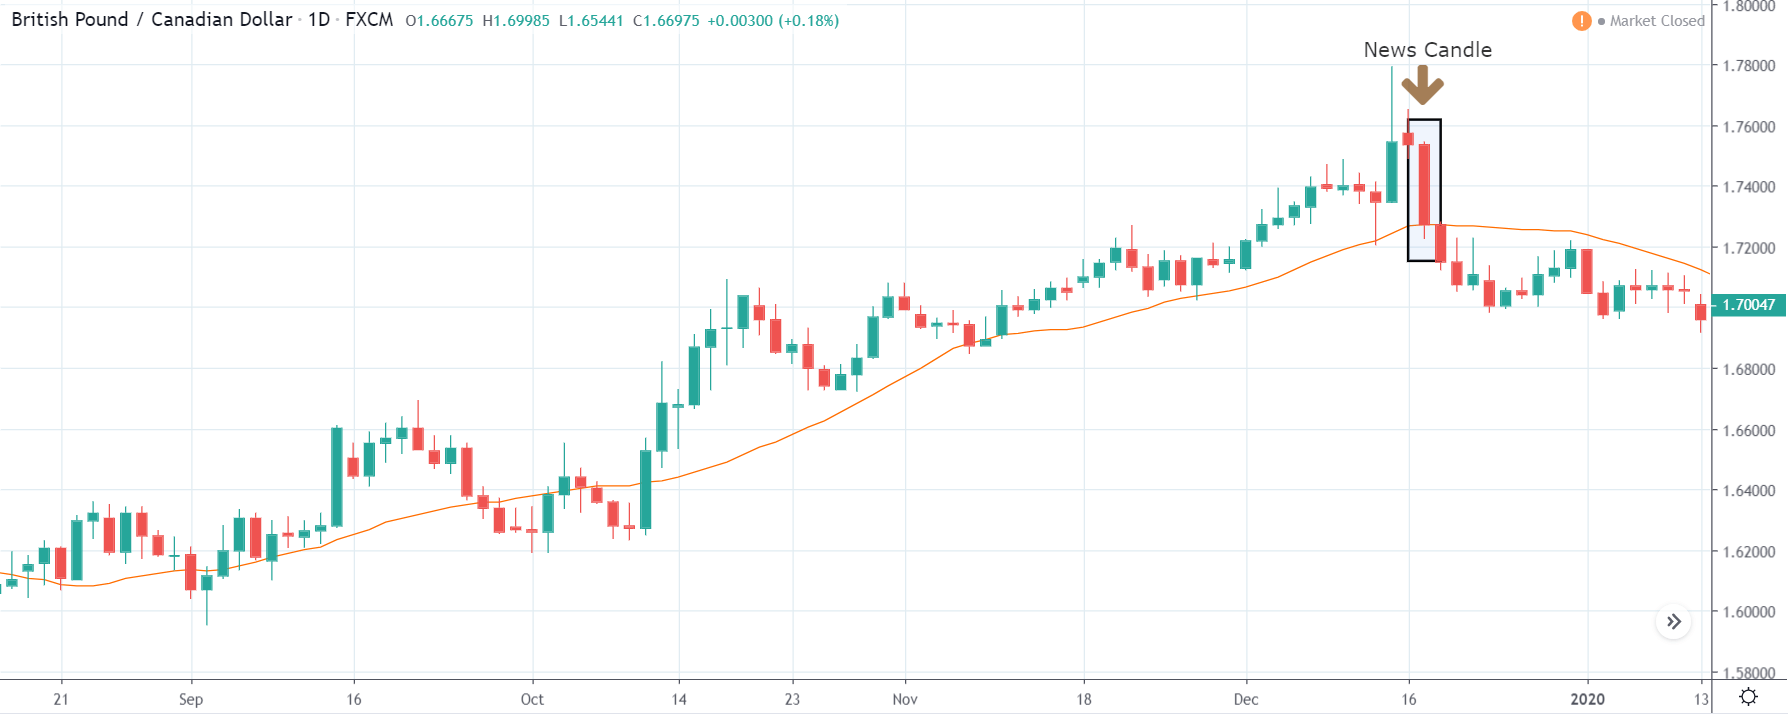
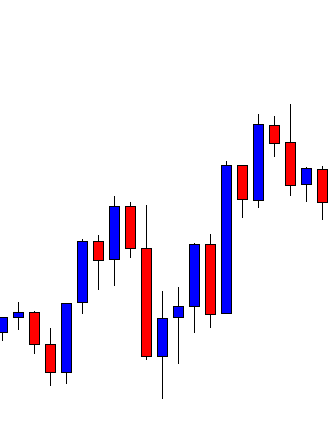
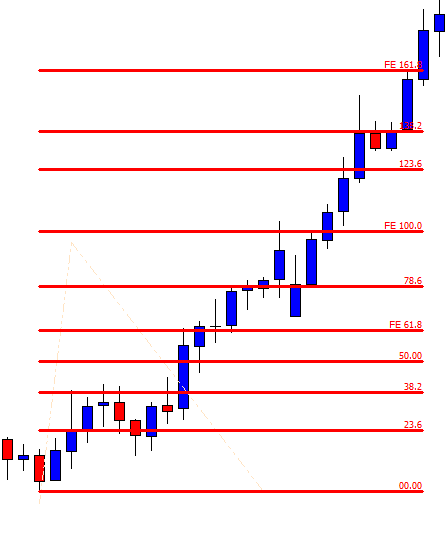
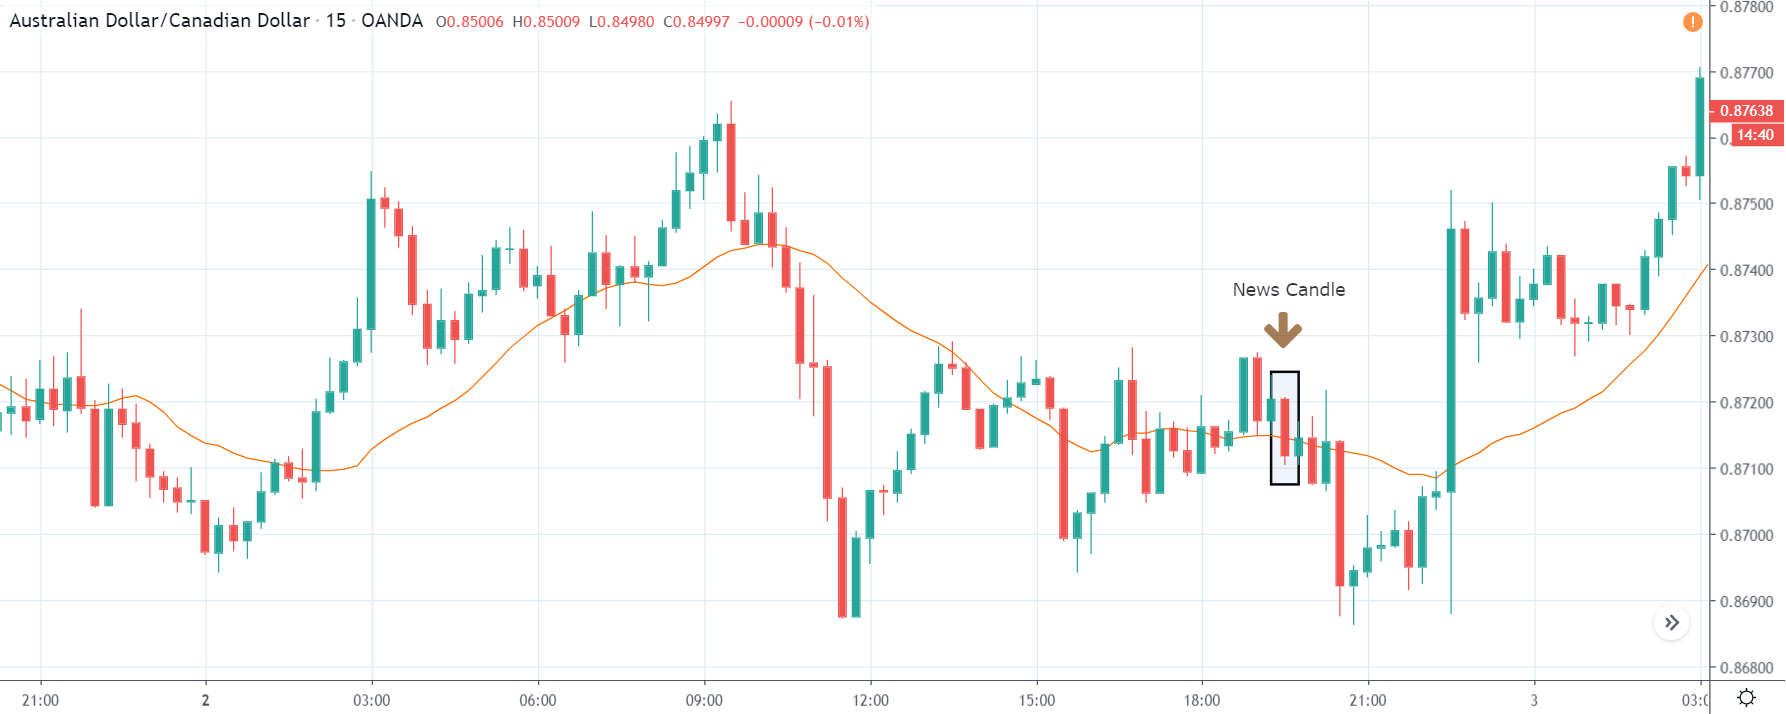
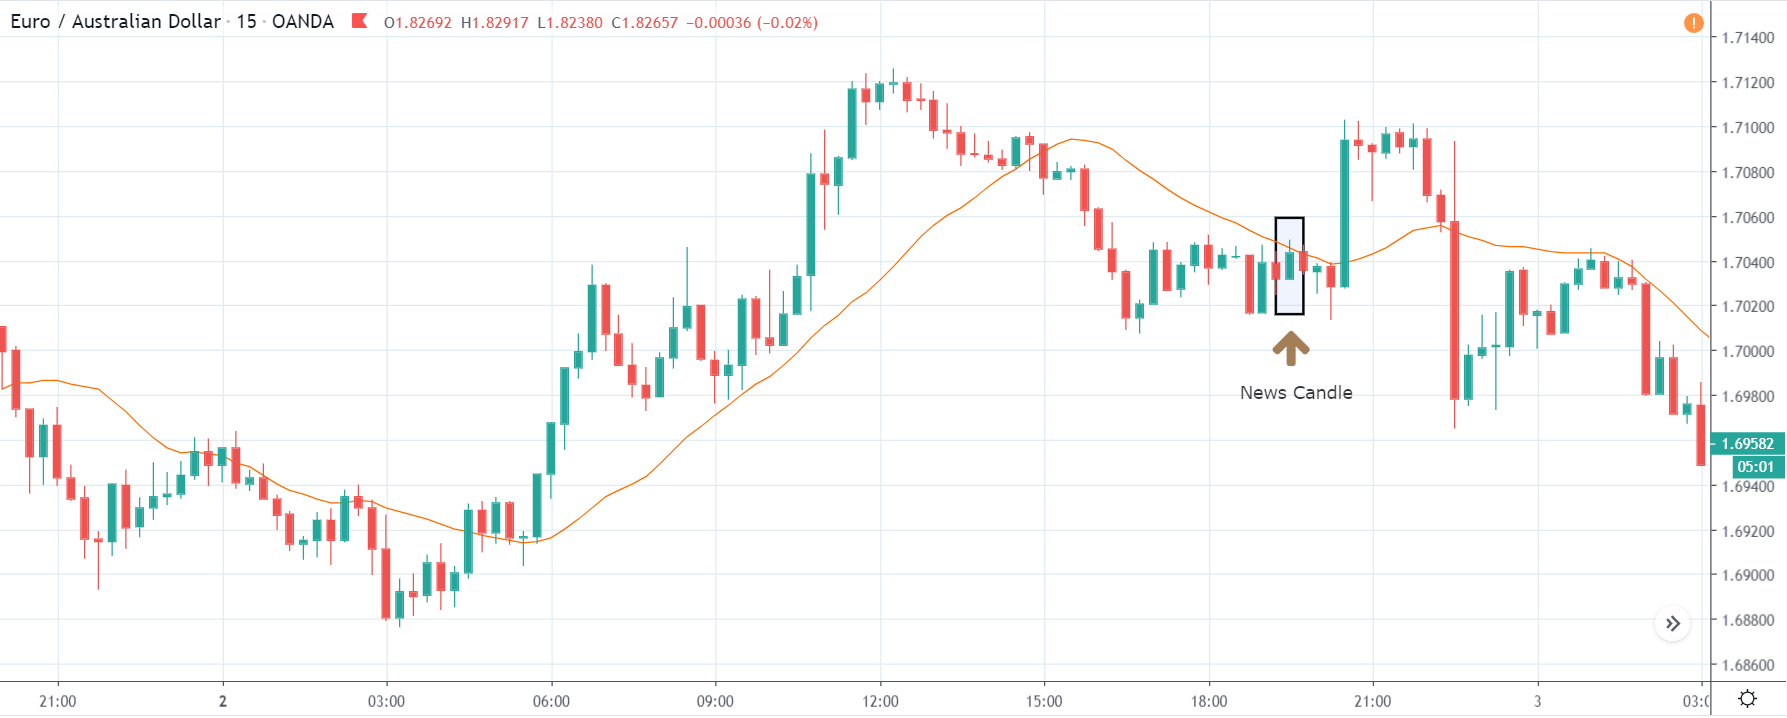
After the news announcement, the market hardly reacts to the Mining Production data keeping the volatility at the bare minimum. Later we see that volatility increases to the downside, which causes the strengthening of South African Rand. The market shows positively to the news release after the close of the ‘news candle.’ As the Mining Production data was bullish, traders are seen going ‘short’ in the currency pair and strengthening the South African Rand, immediately after the ‘news candle.

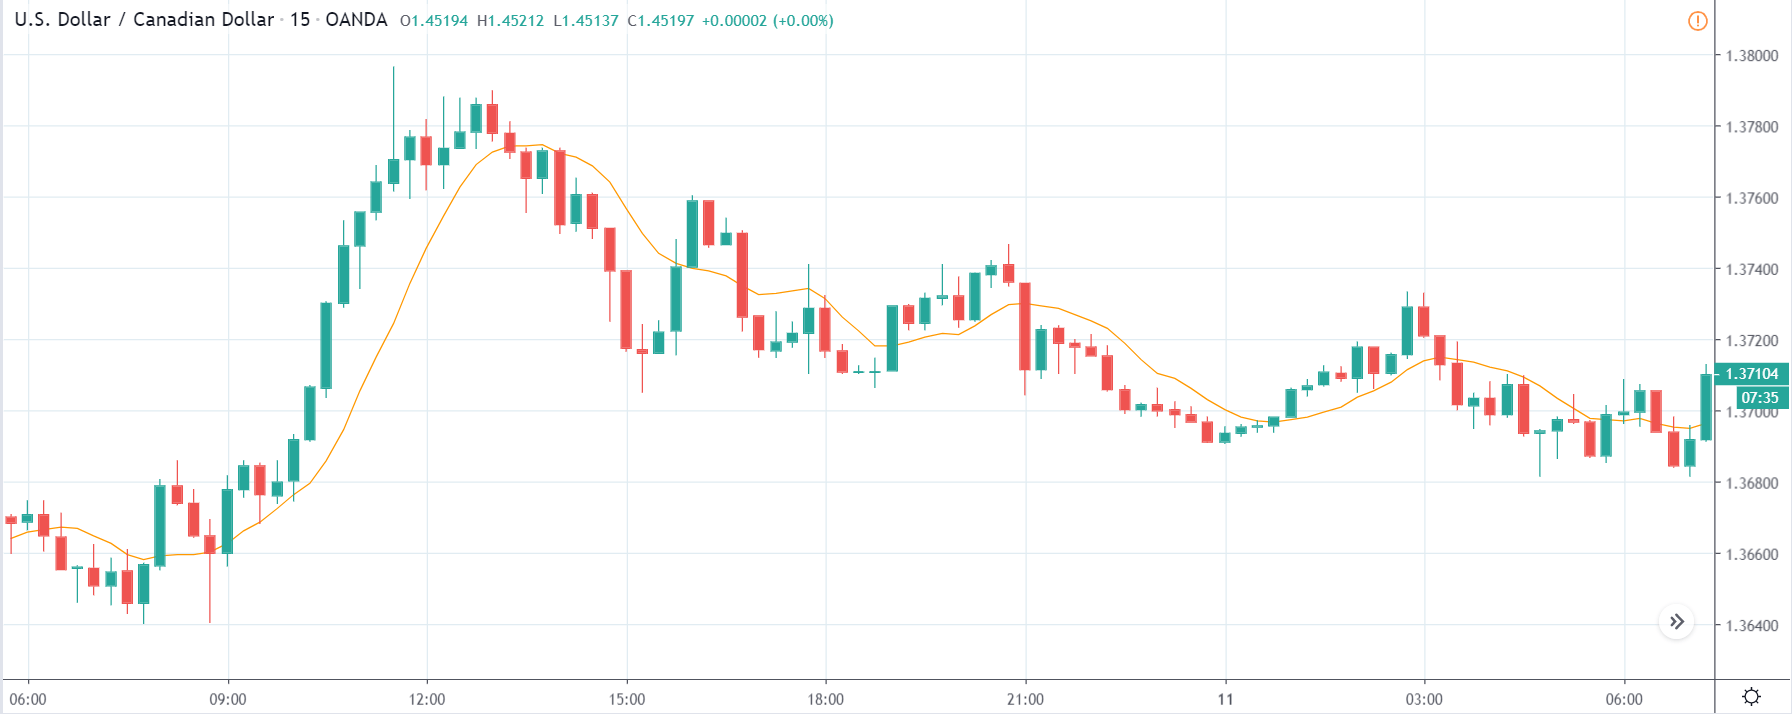
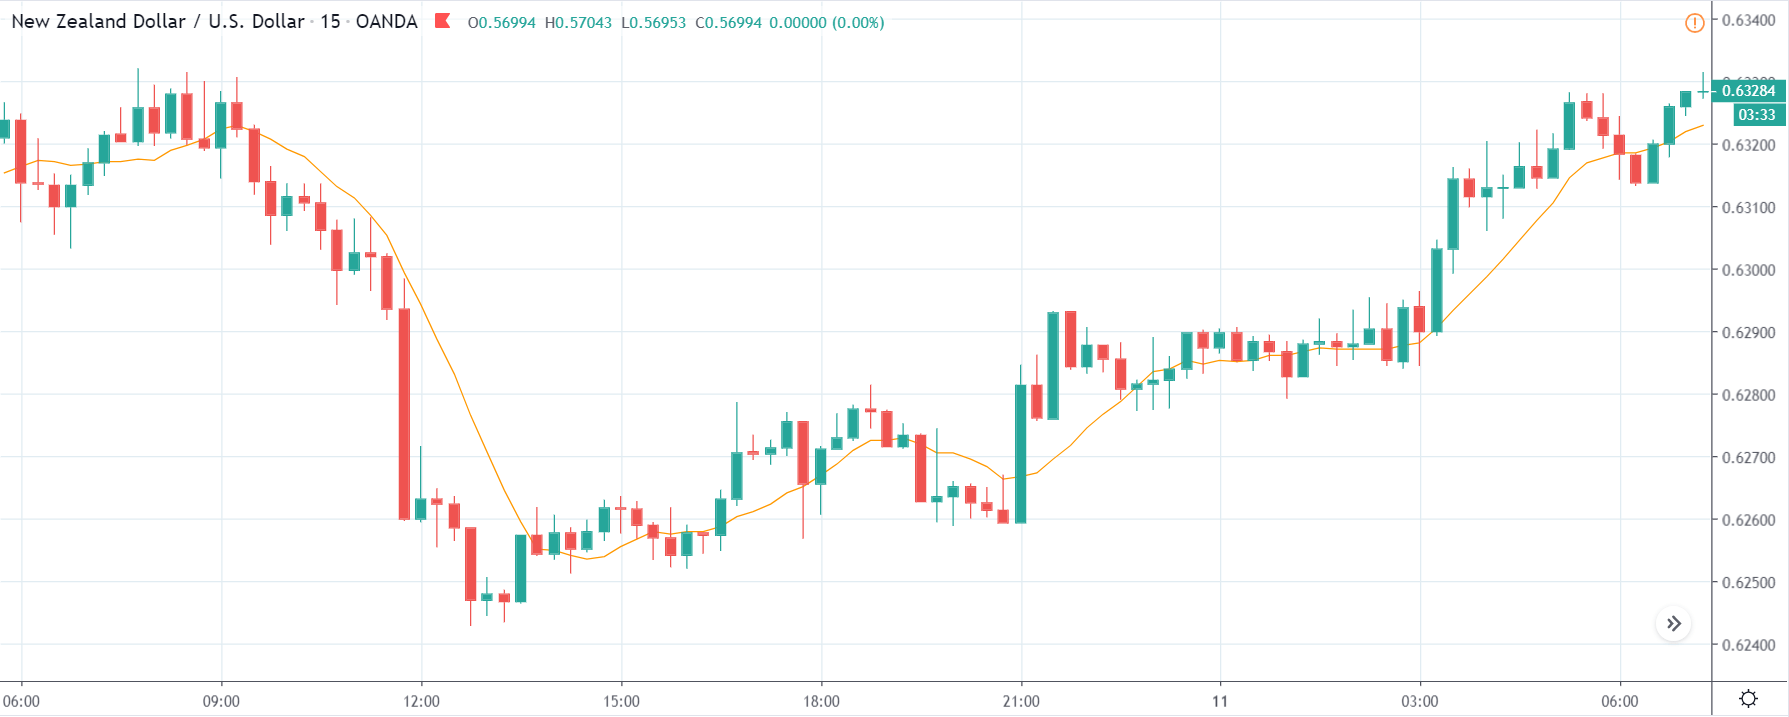
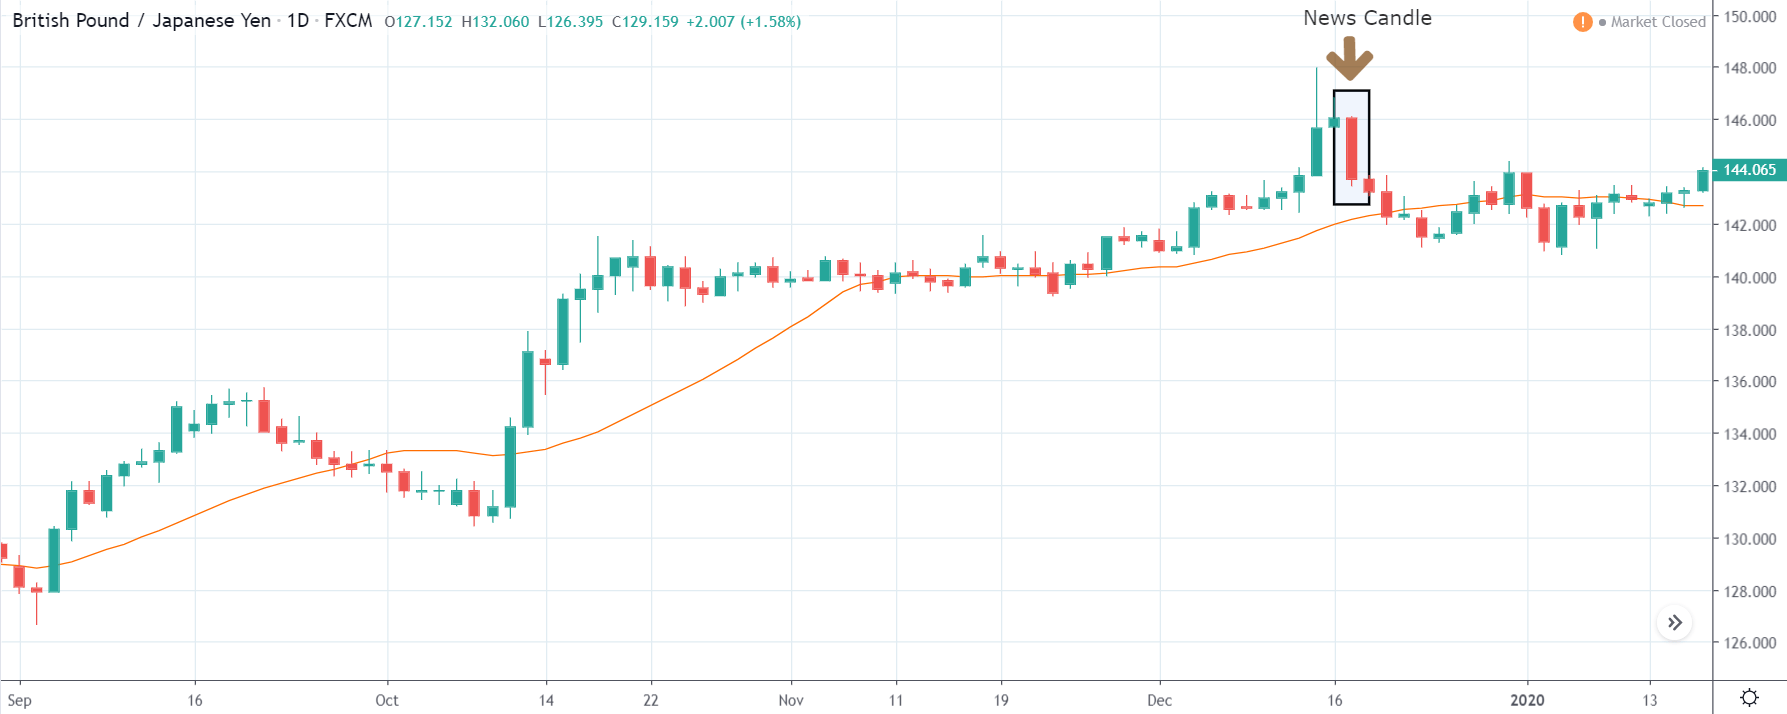
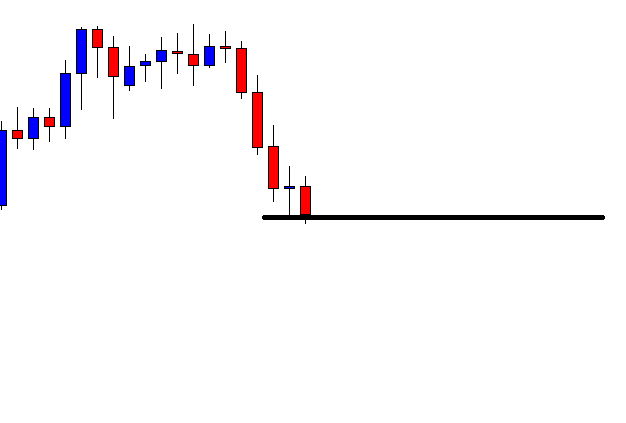
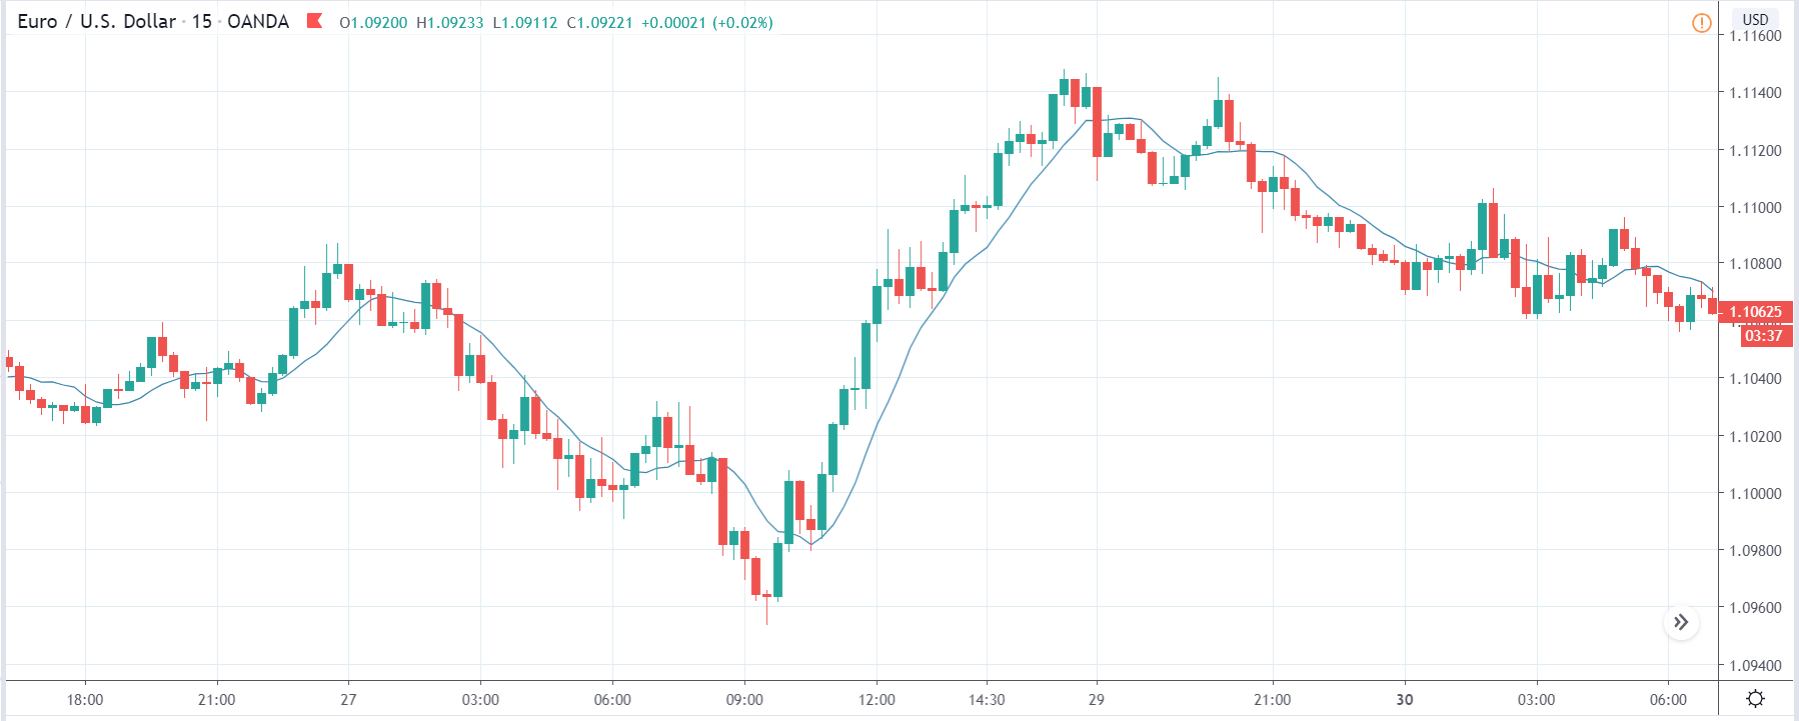
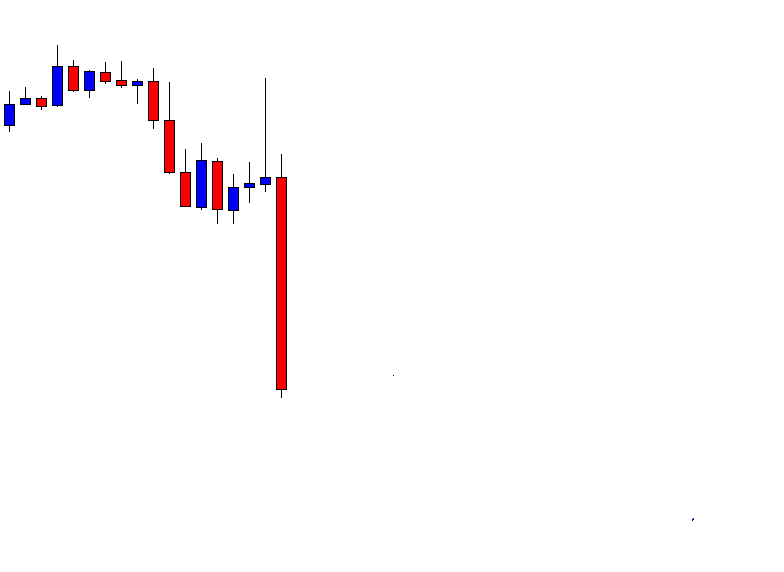
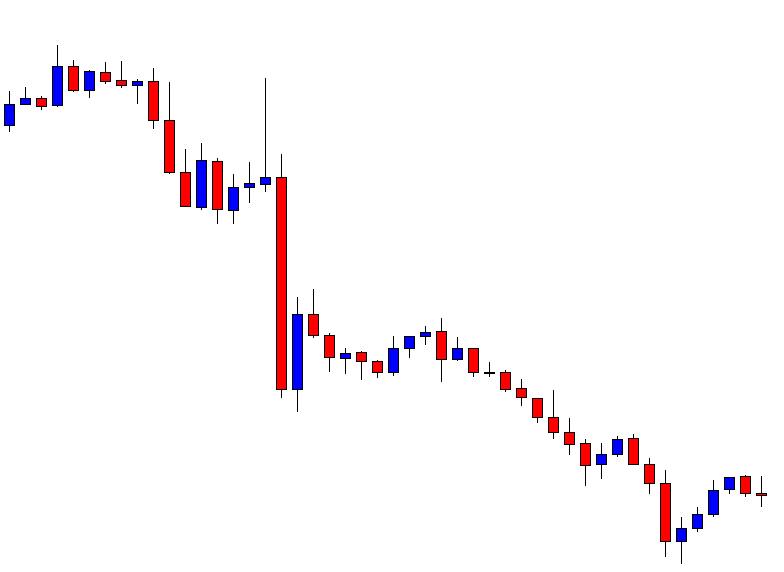
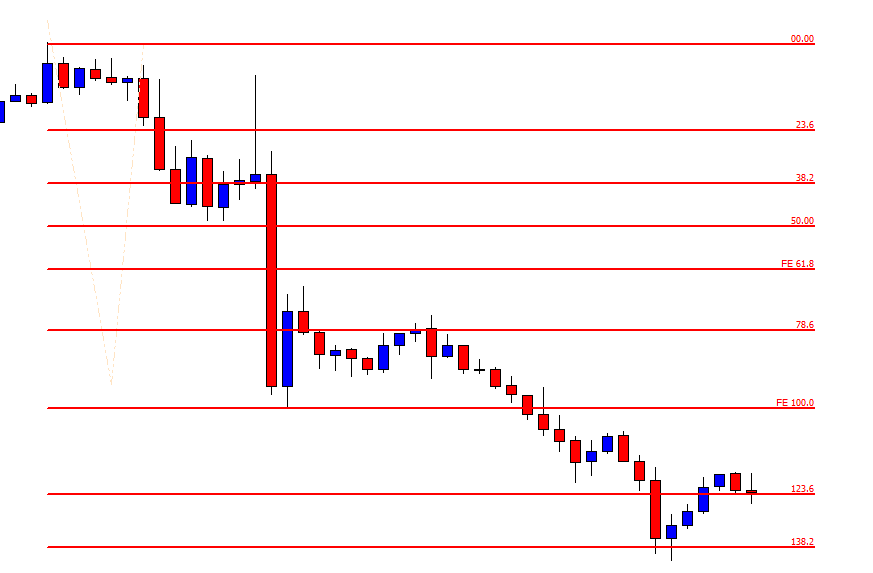
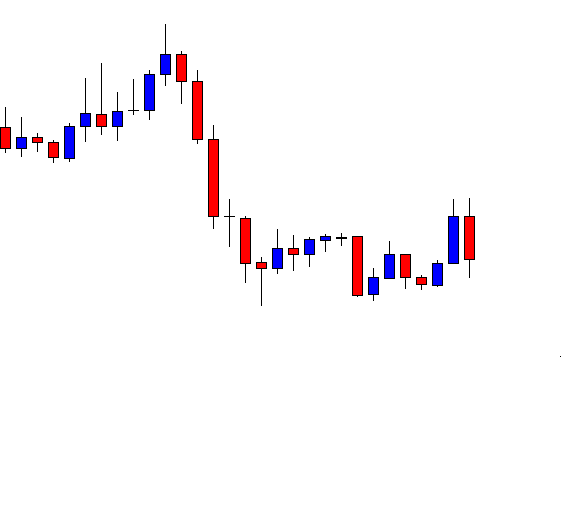
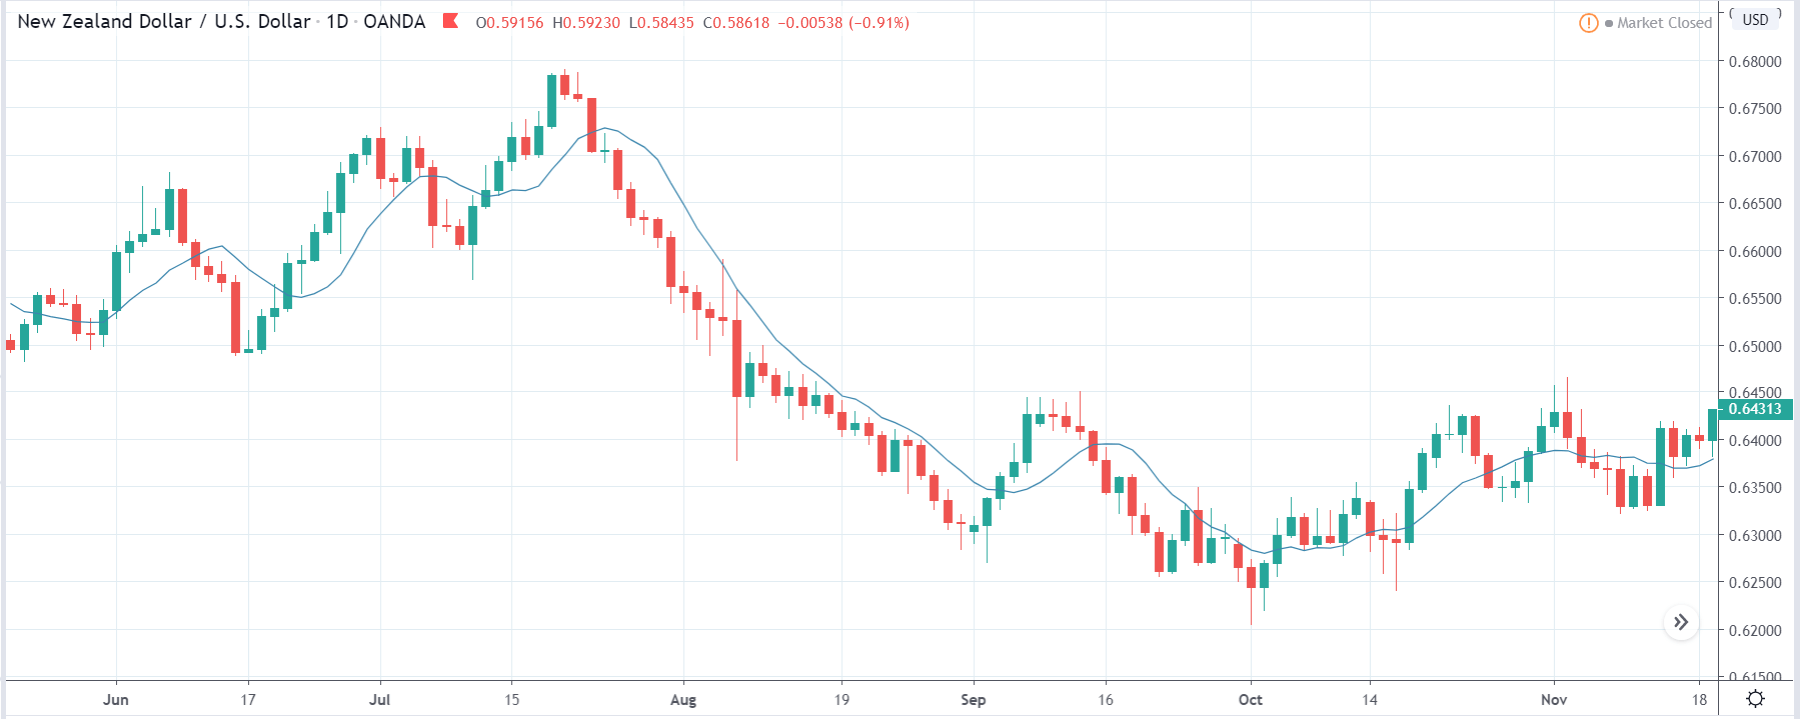
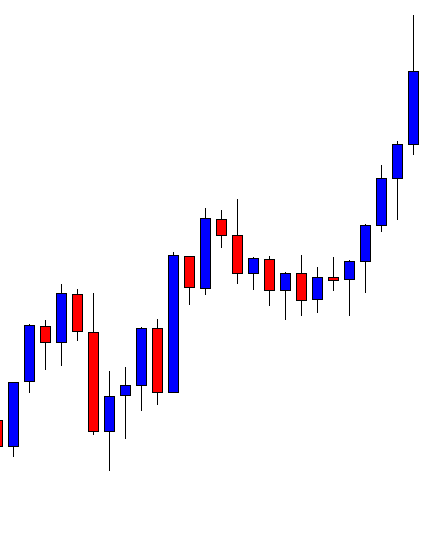
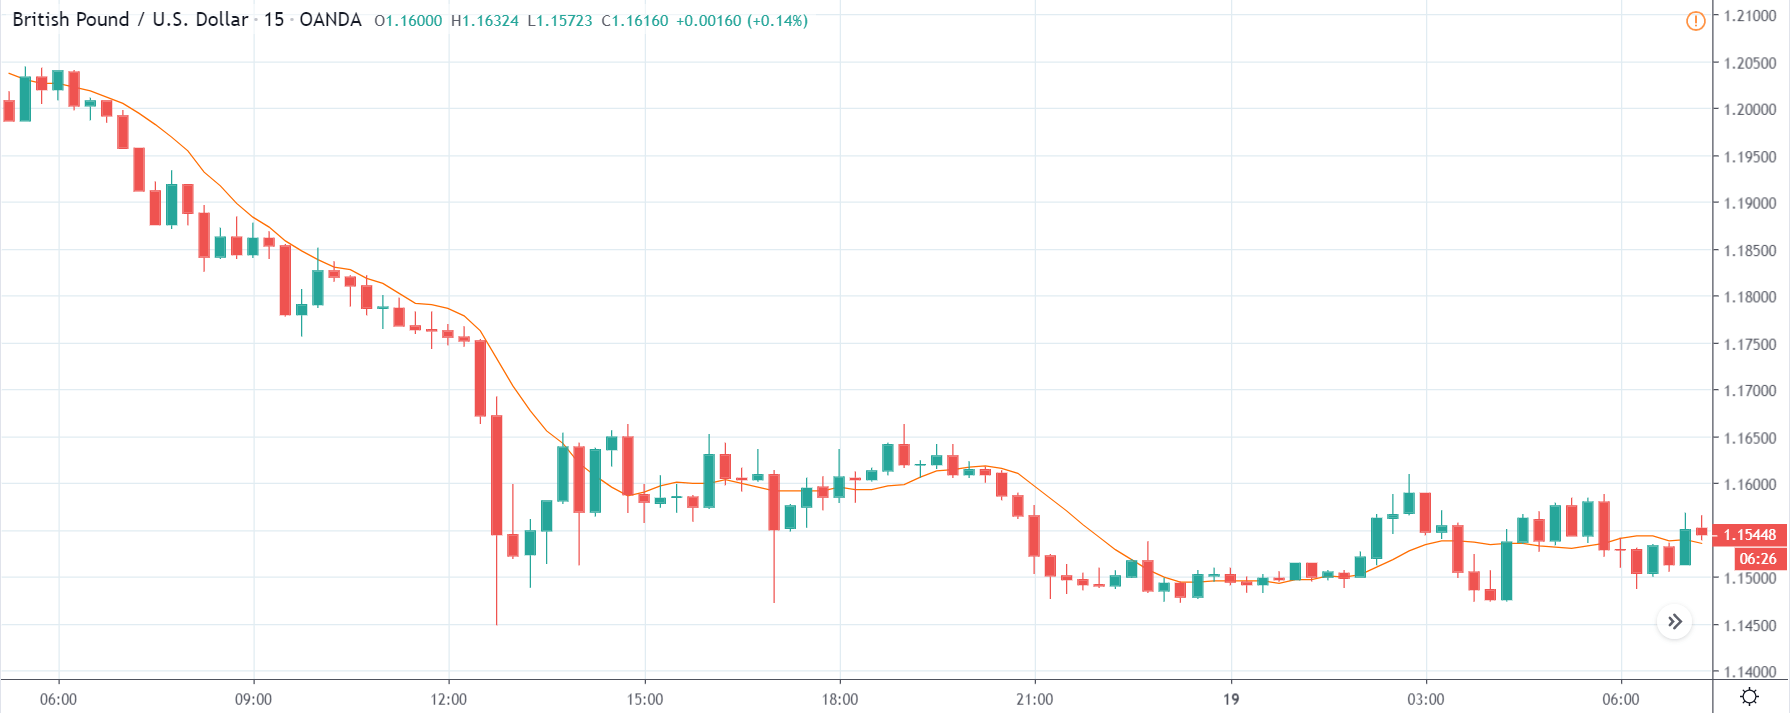
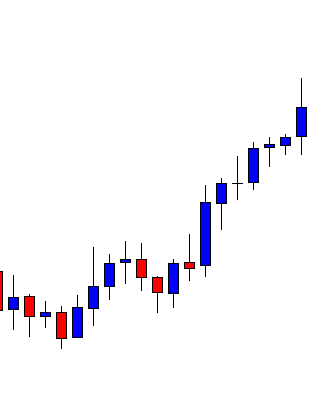
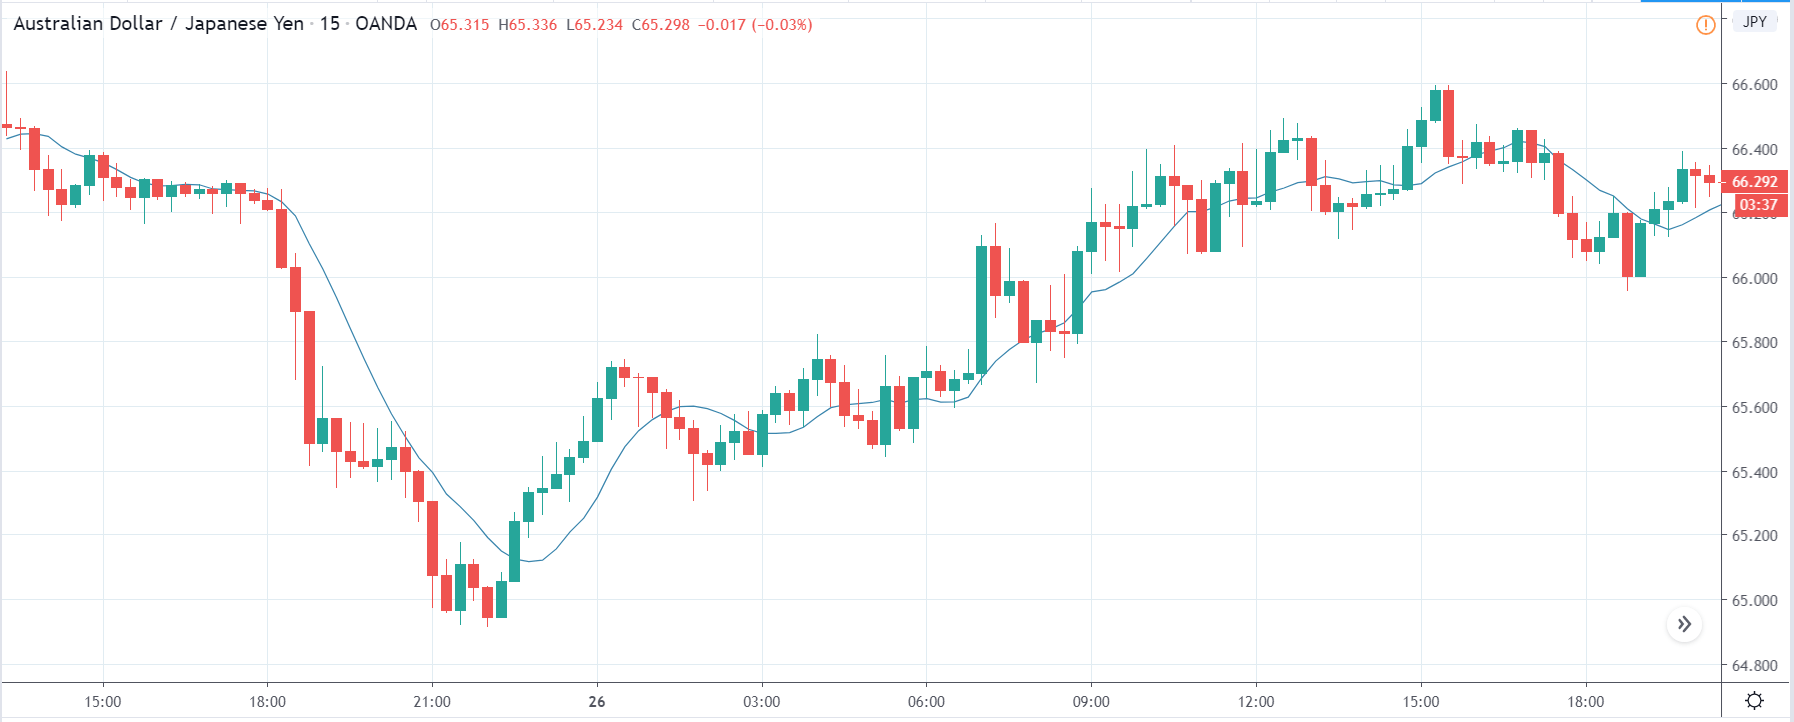
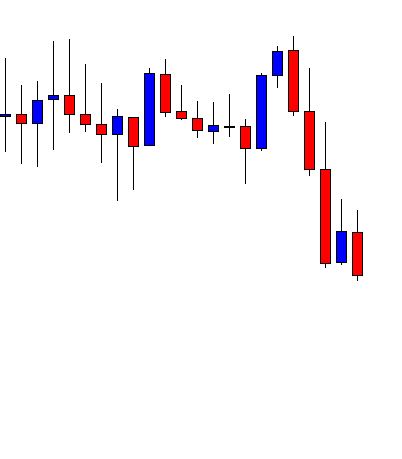
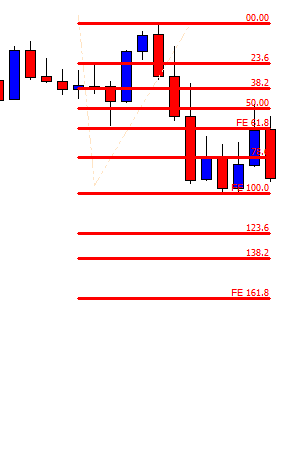
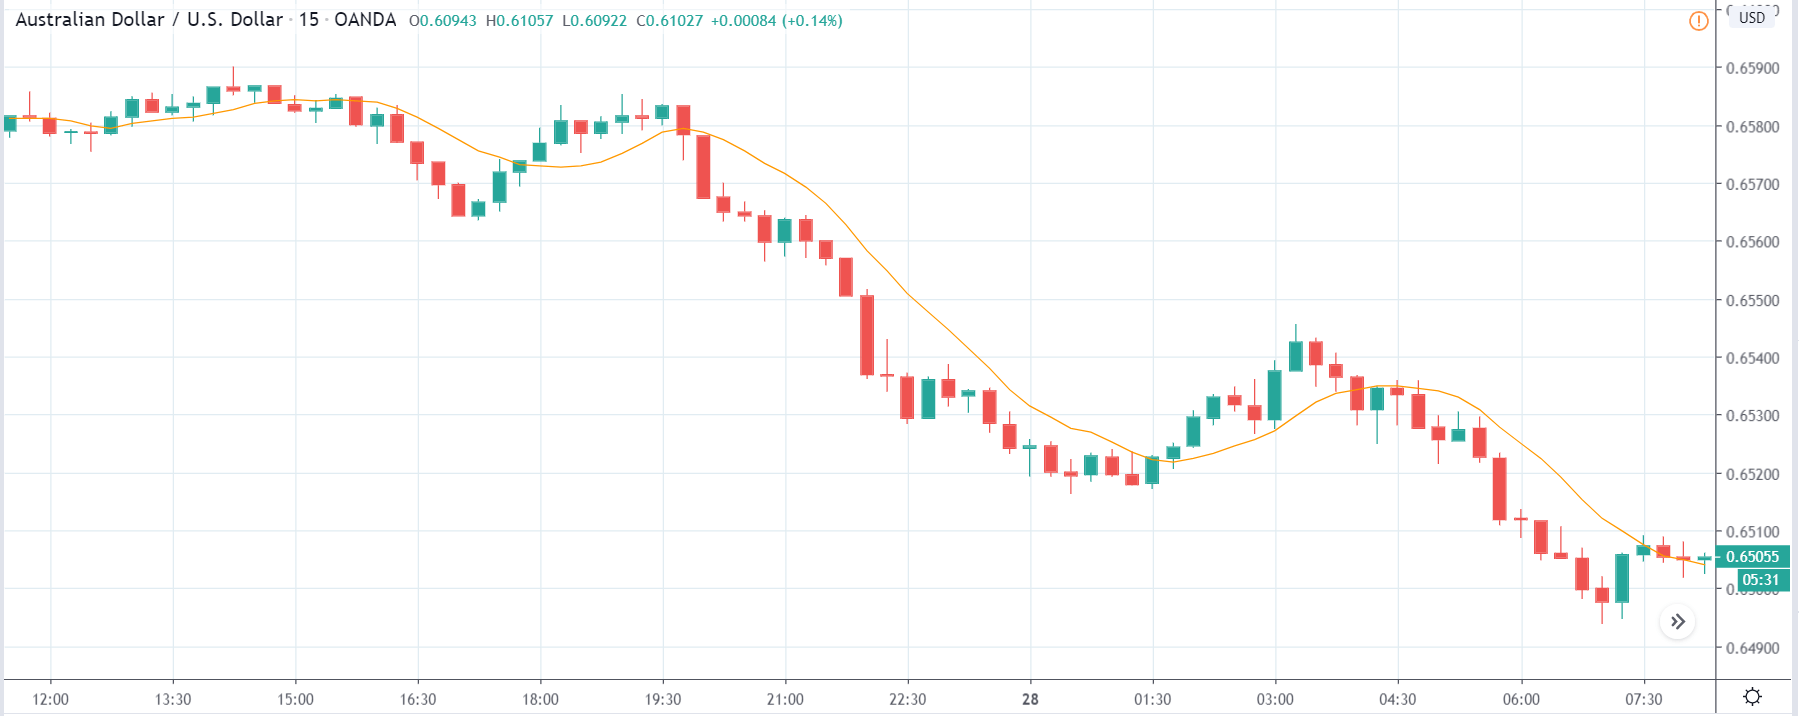
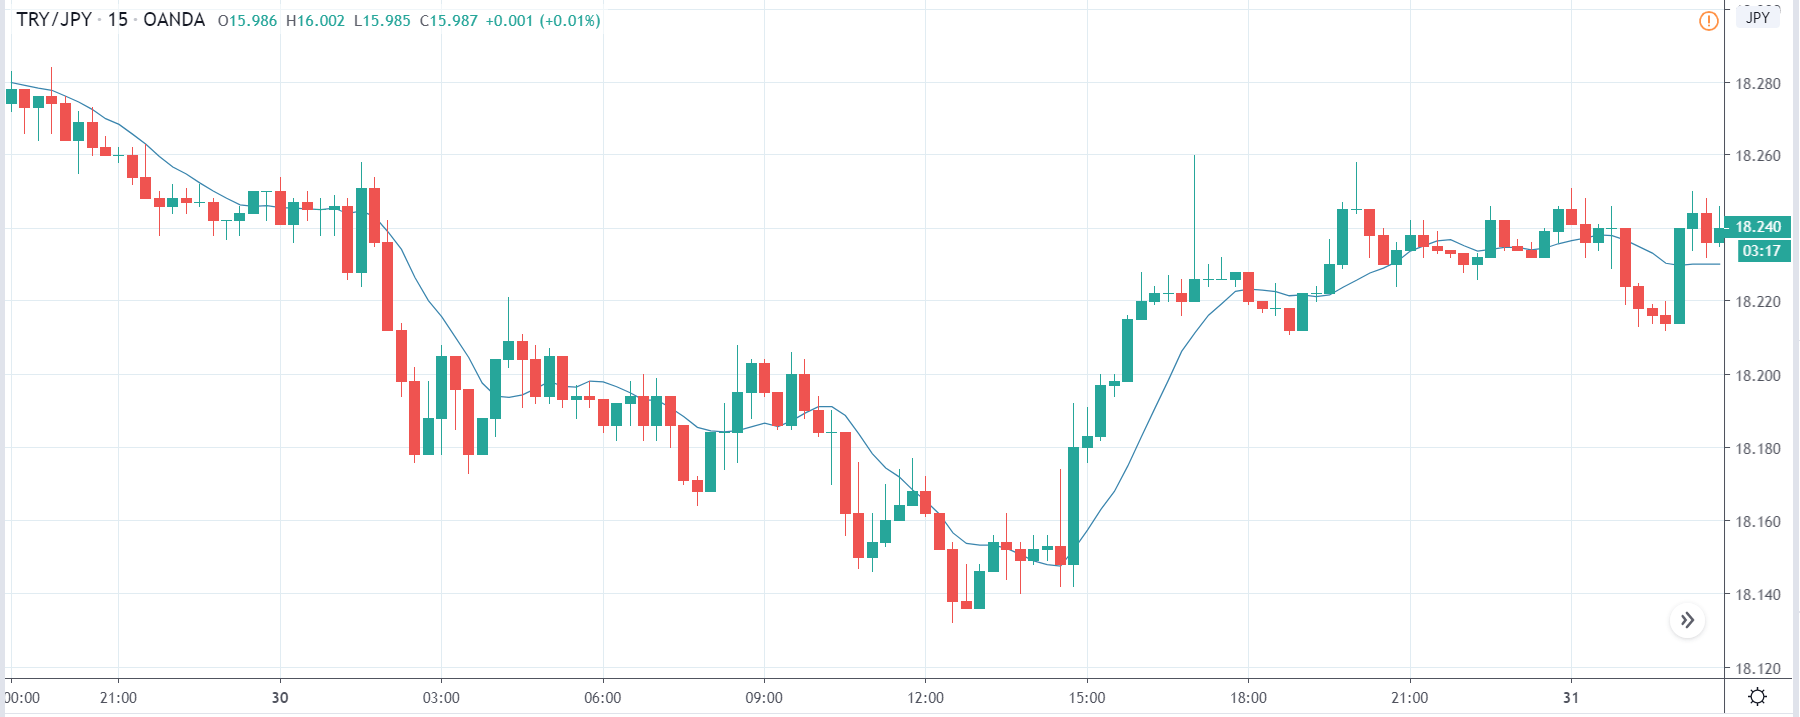
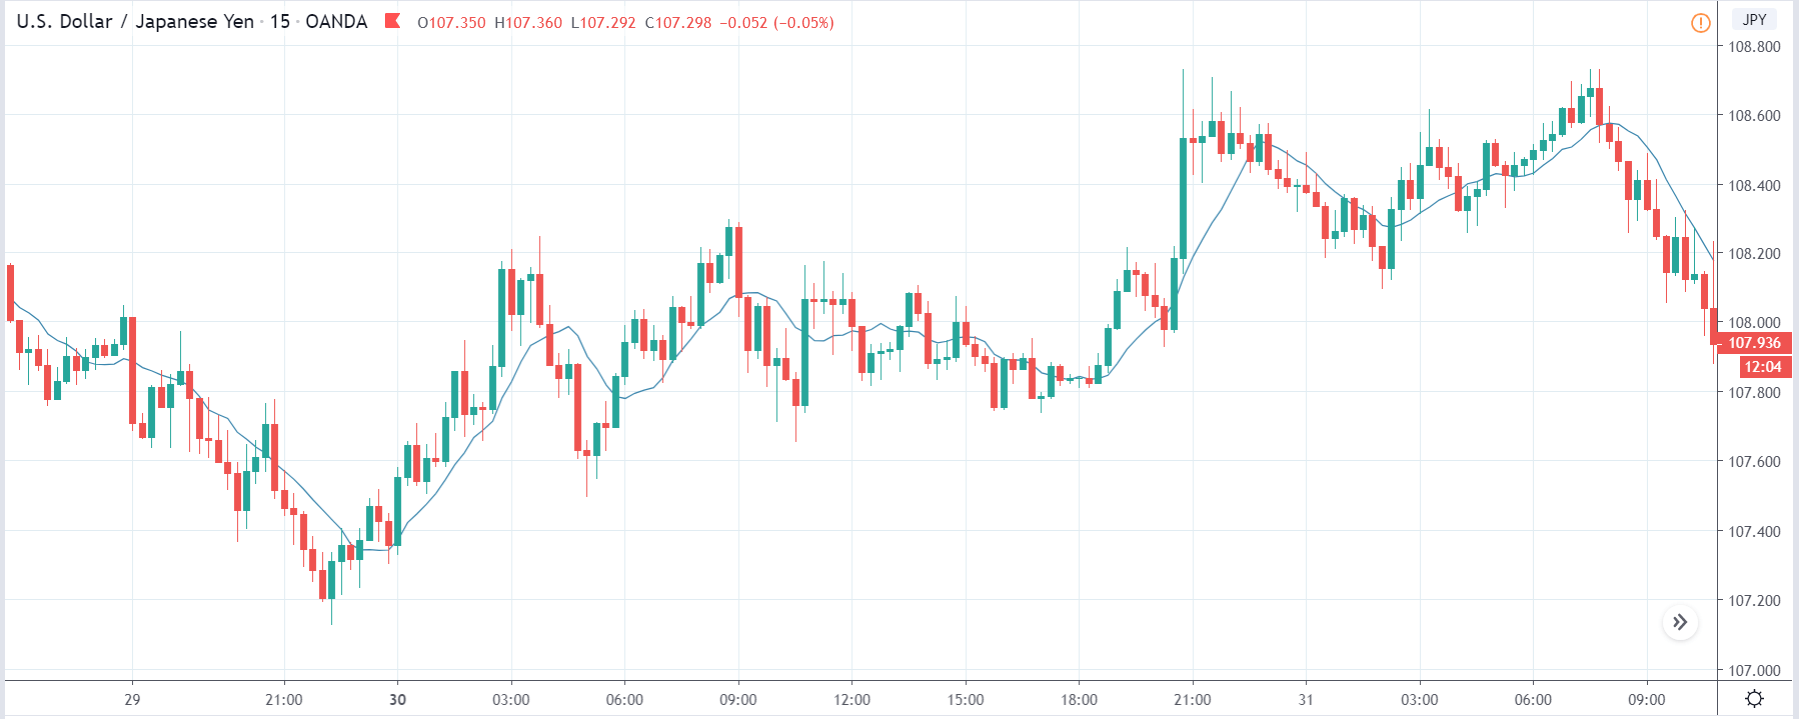
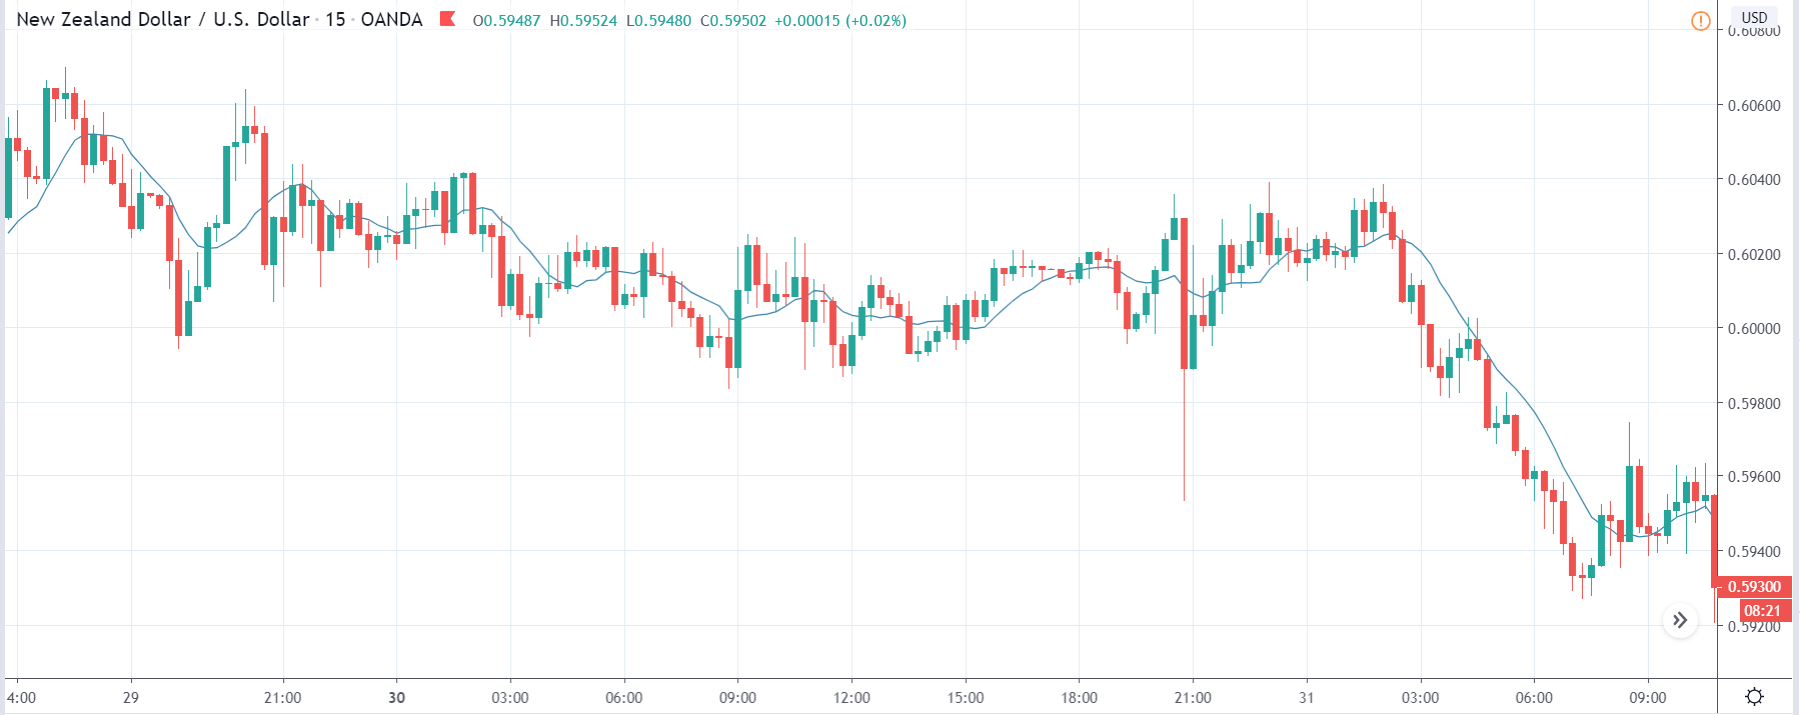
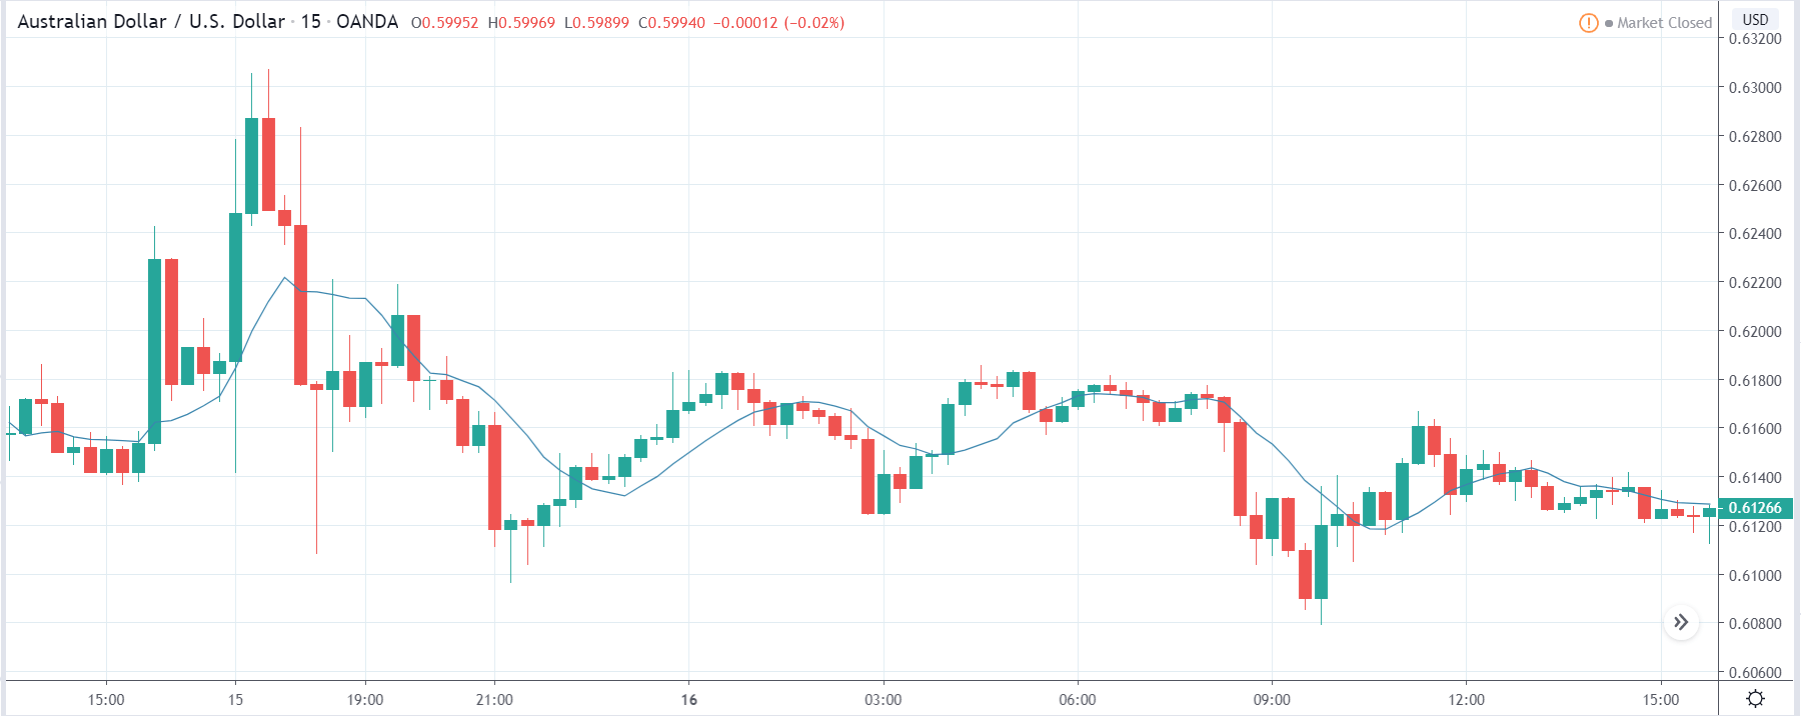
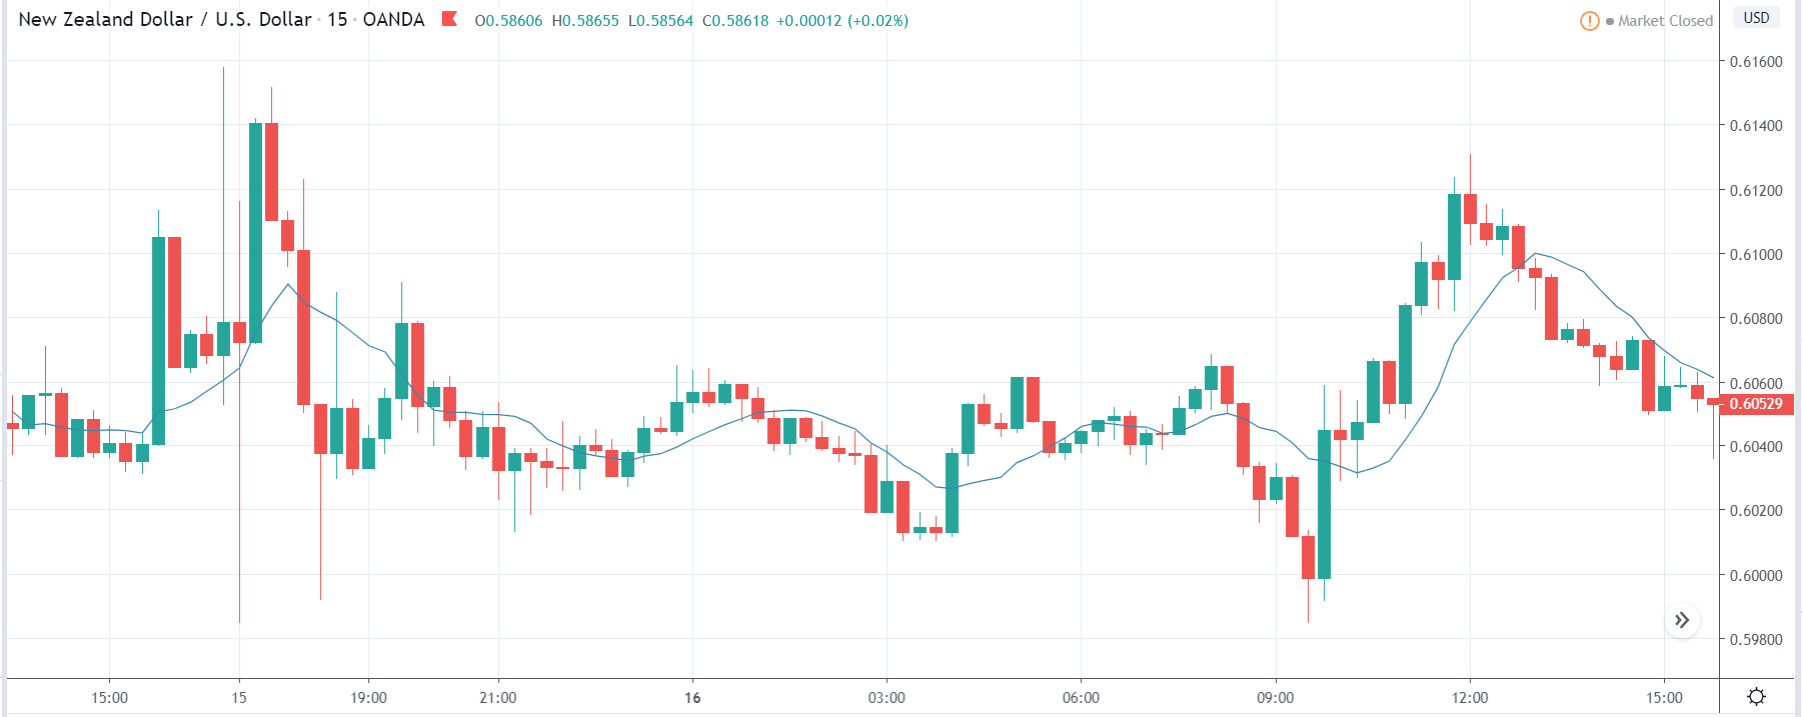
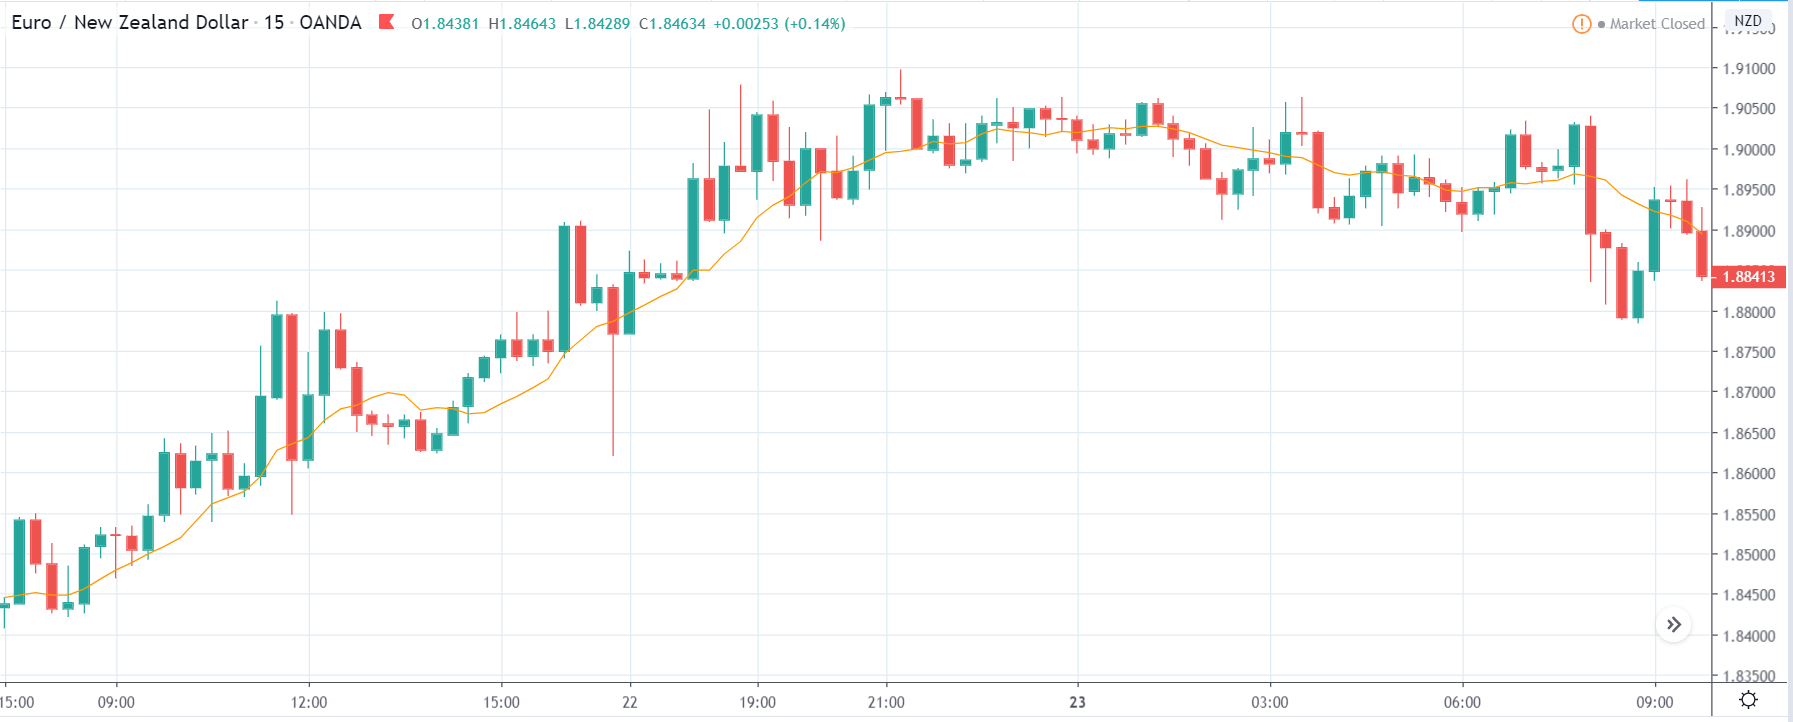
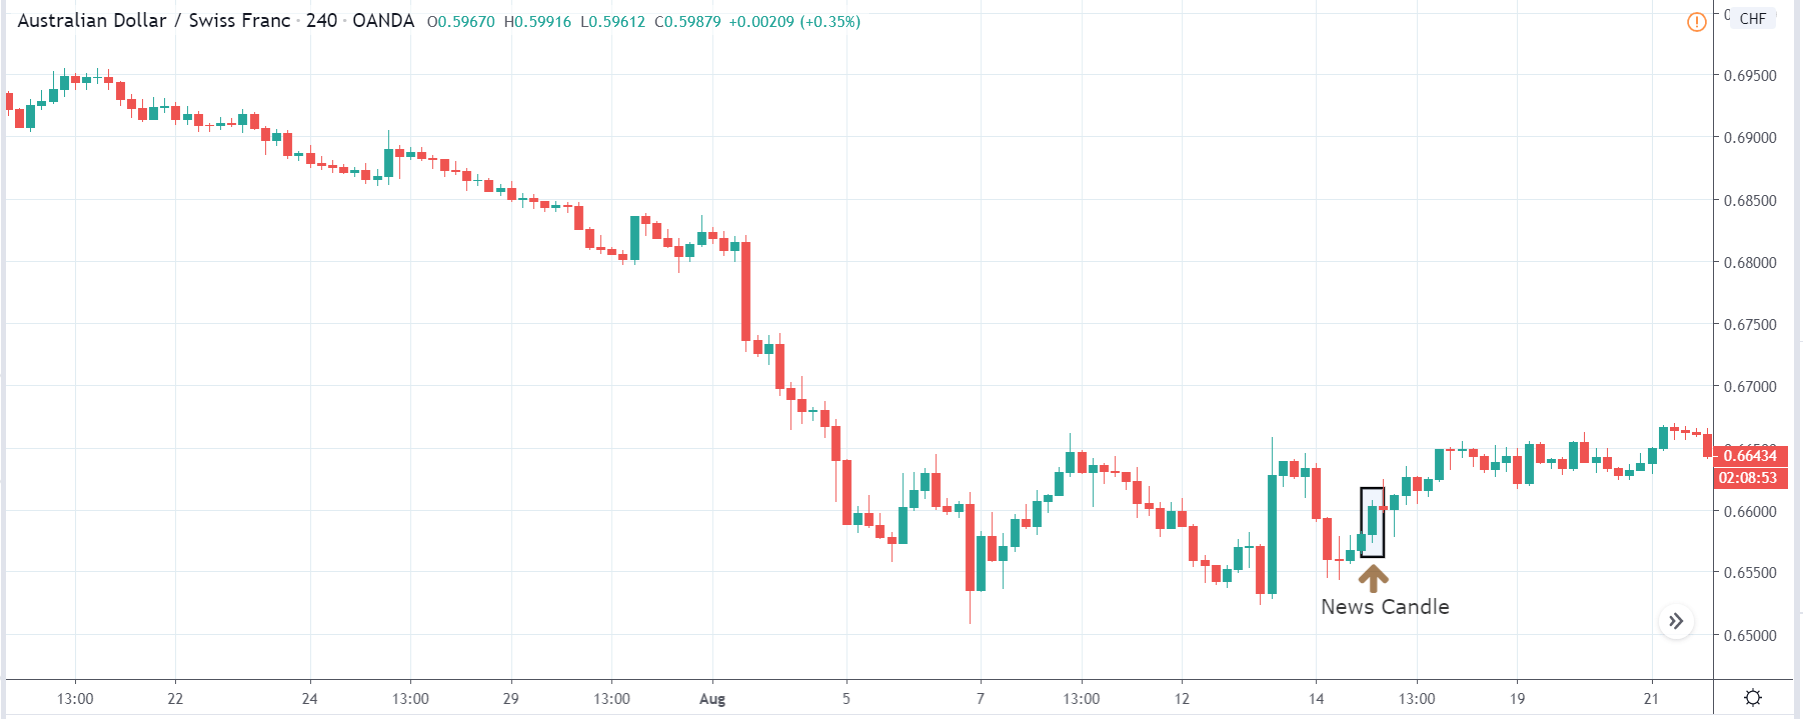
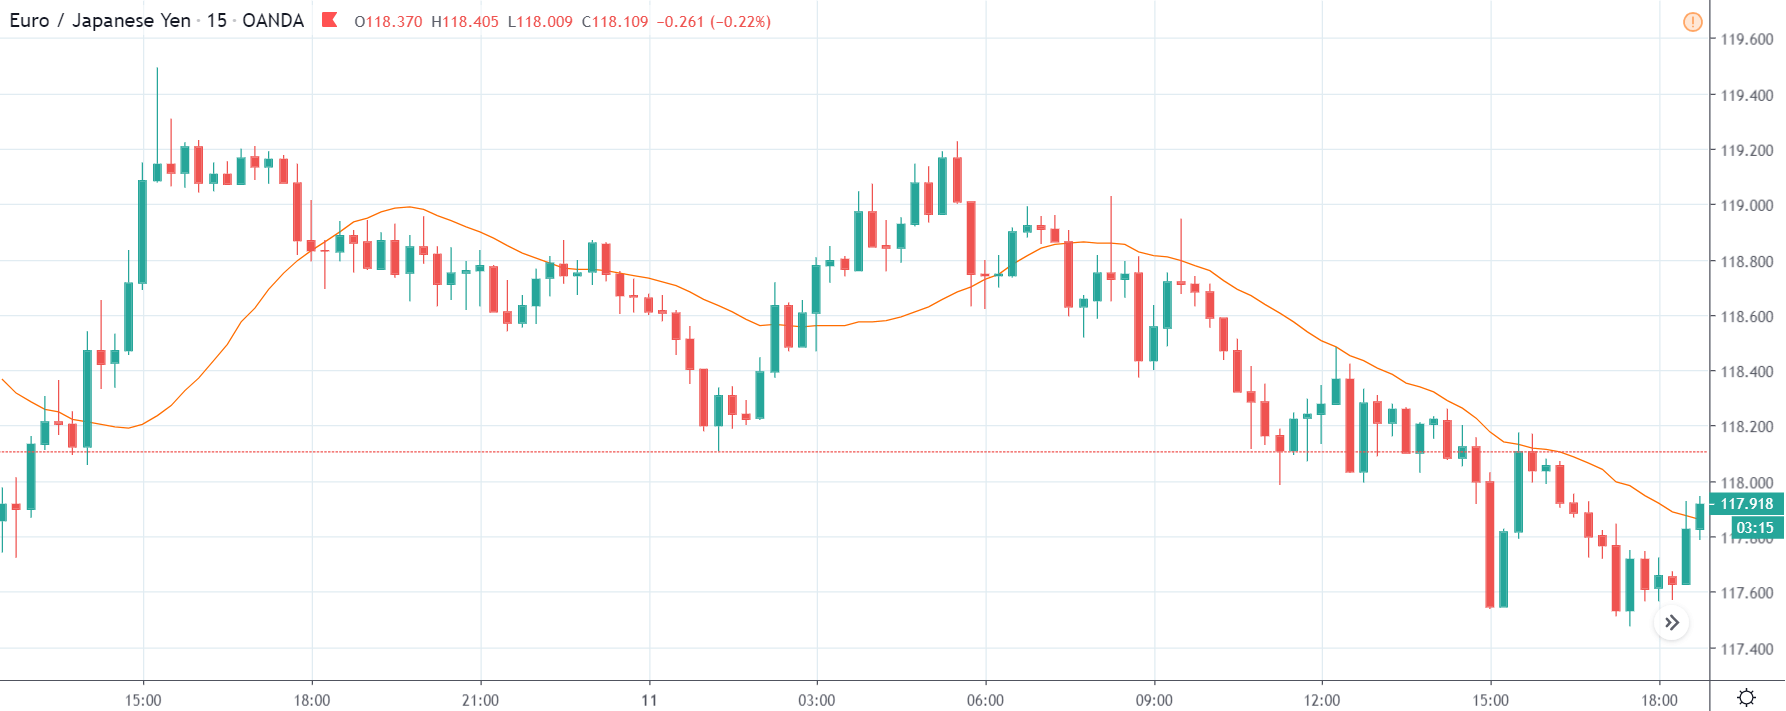
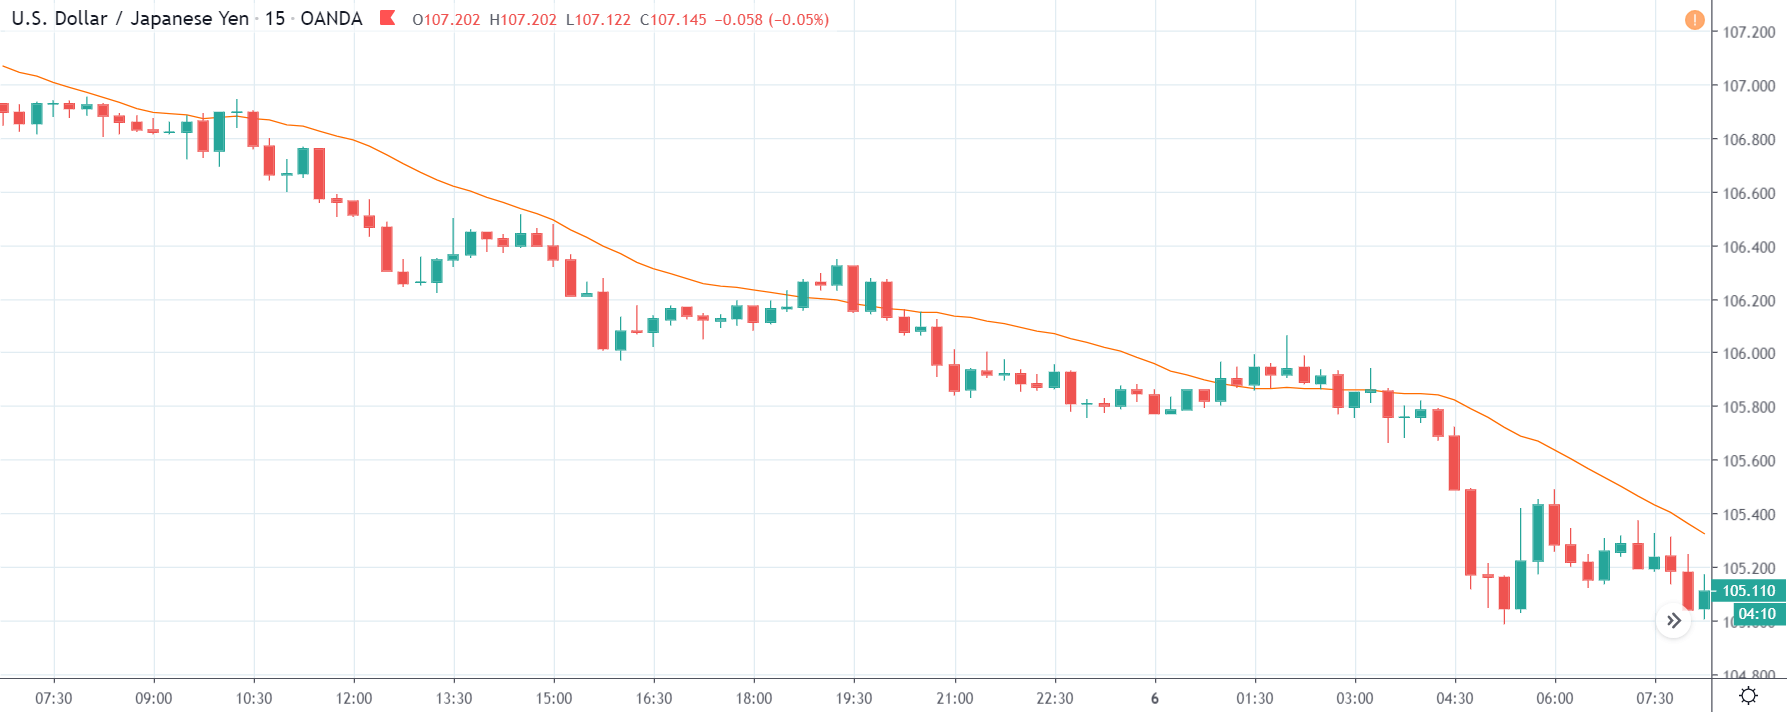
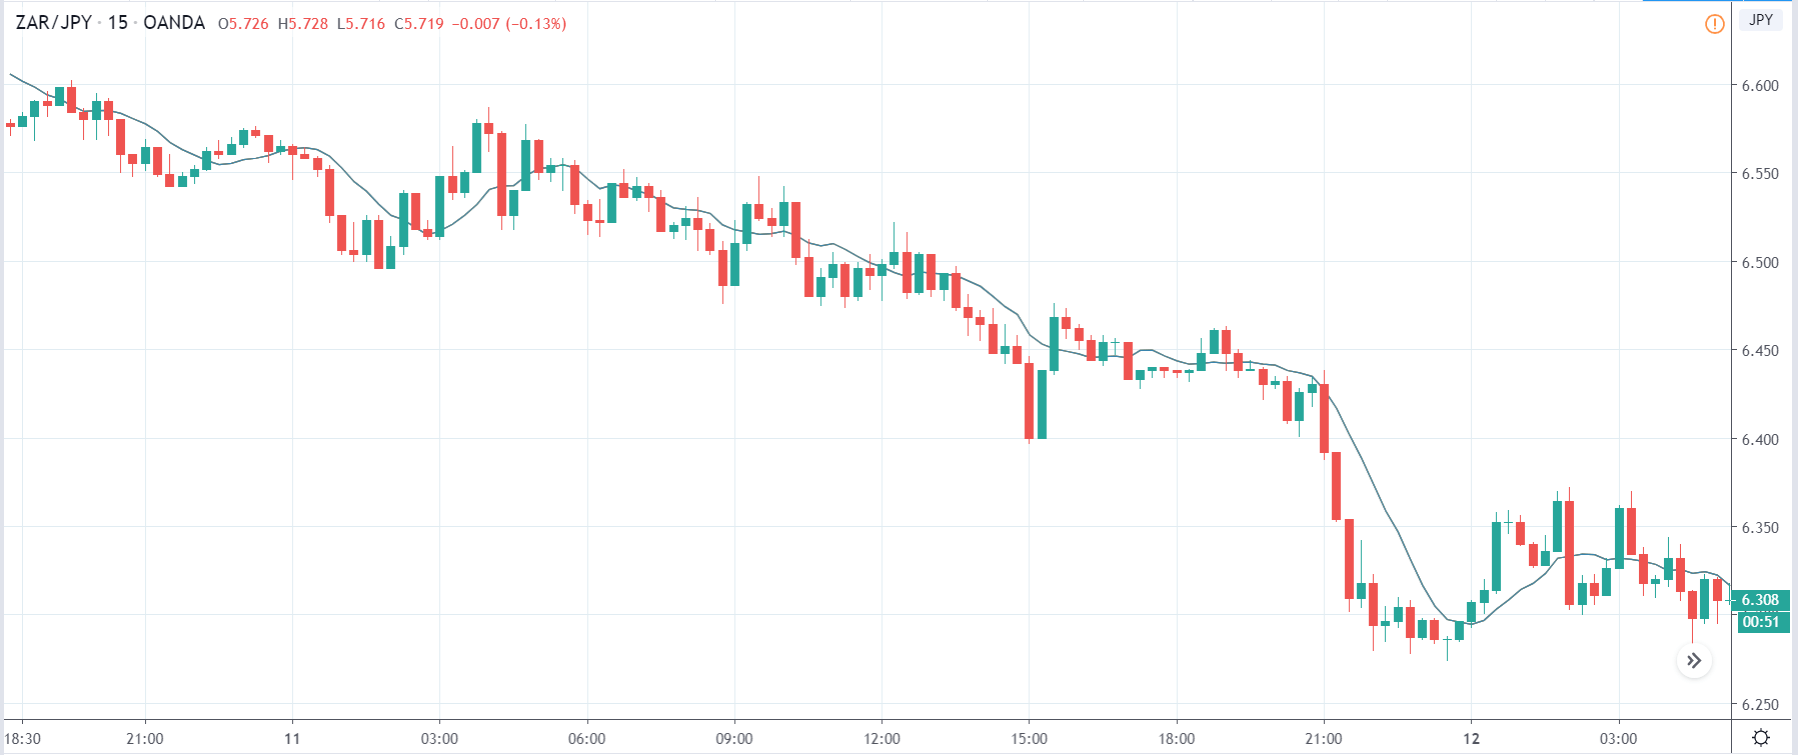
ZAR/JPY | Before the announcement:

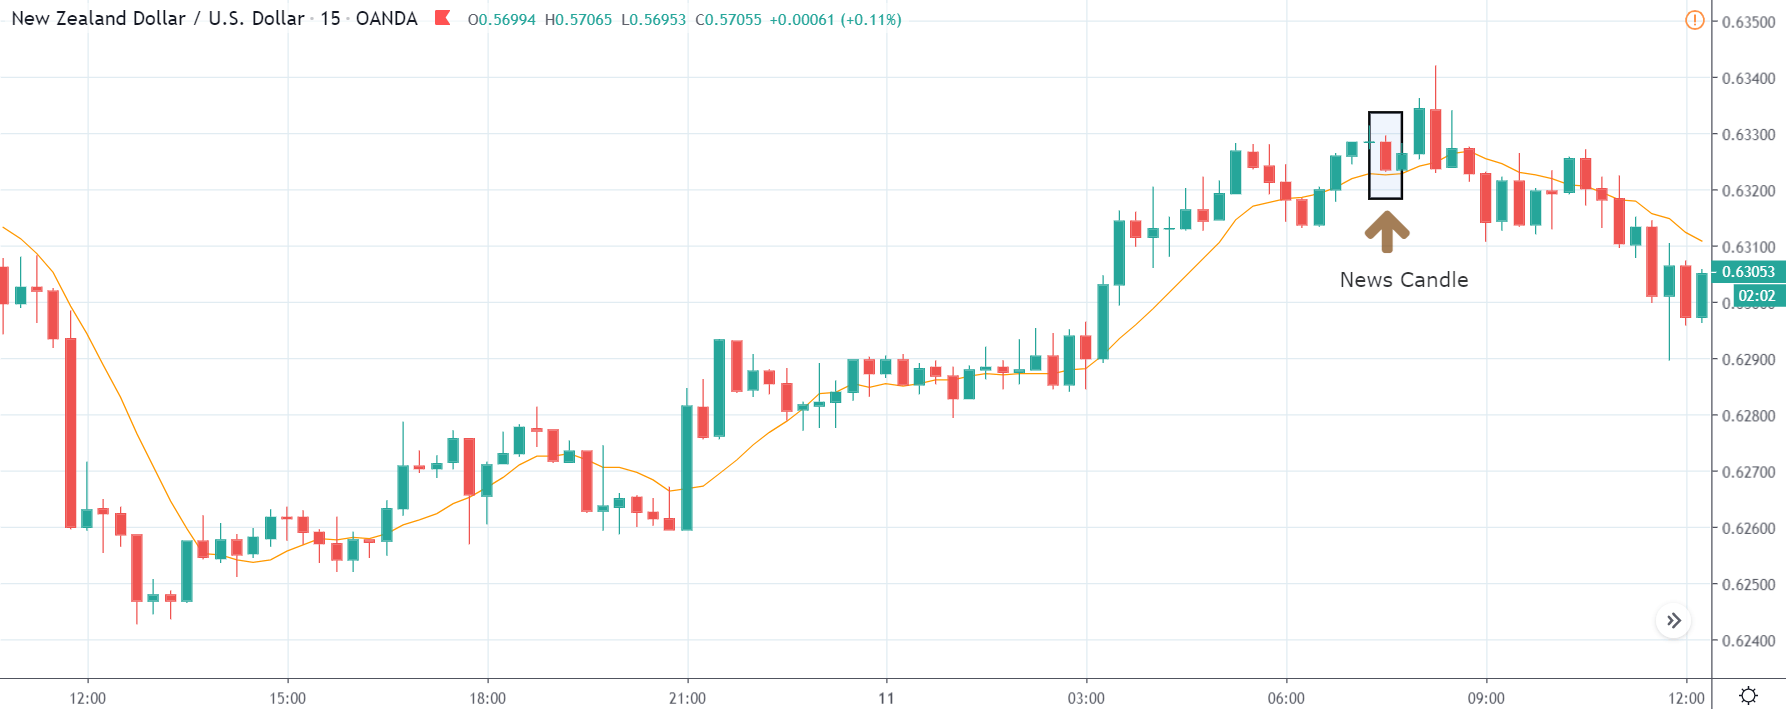
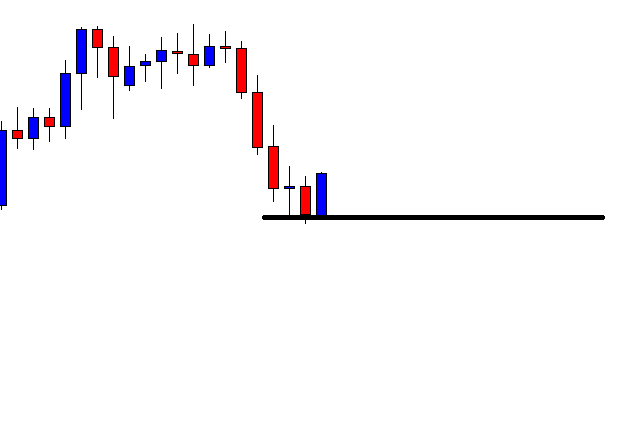
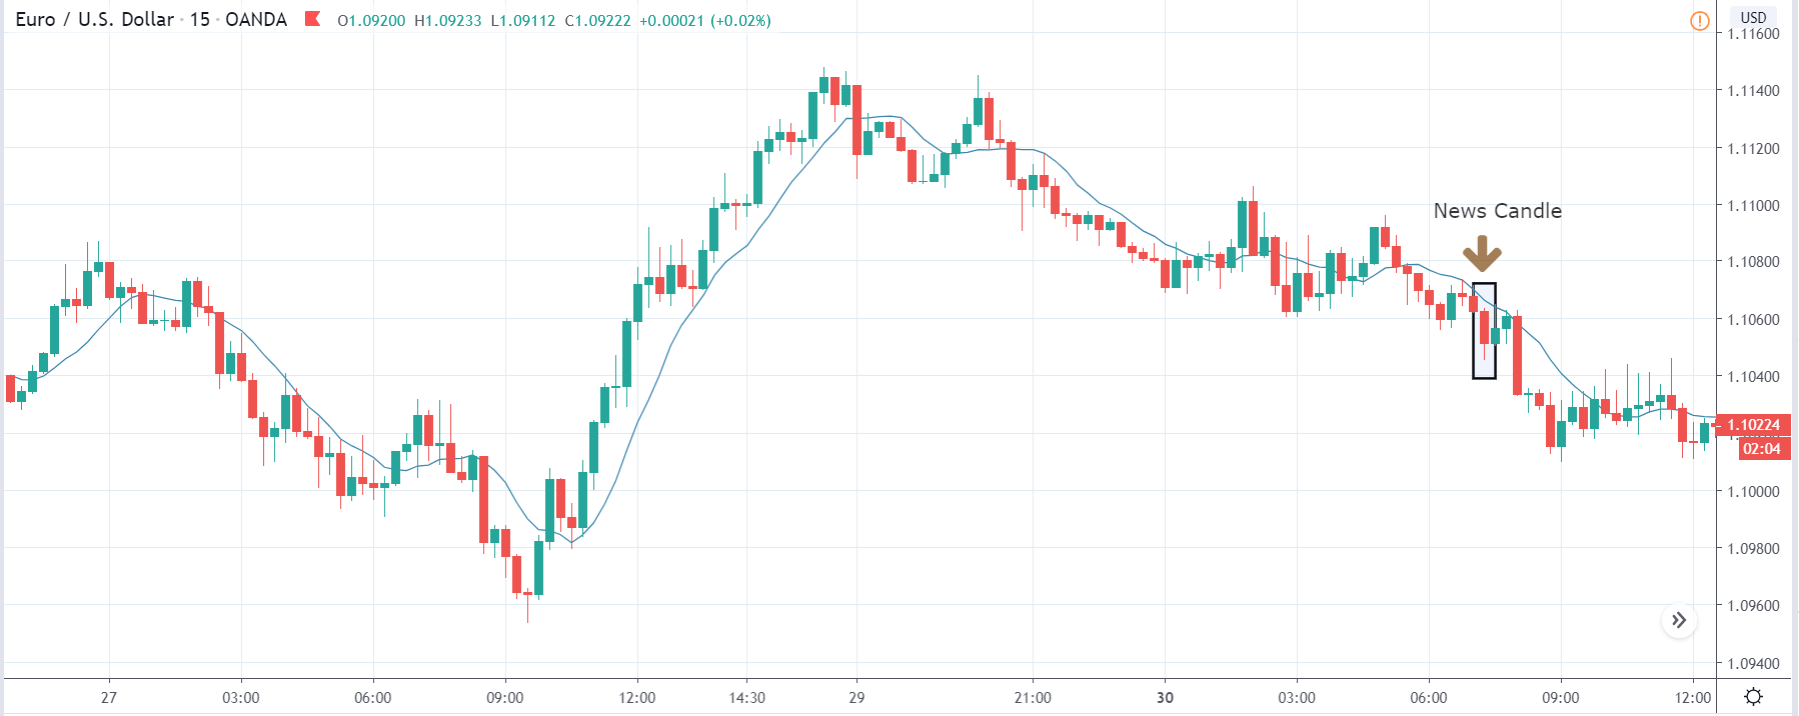
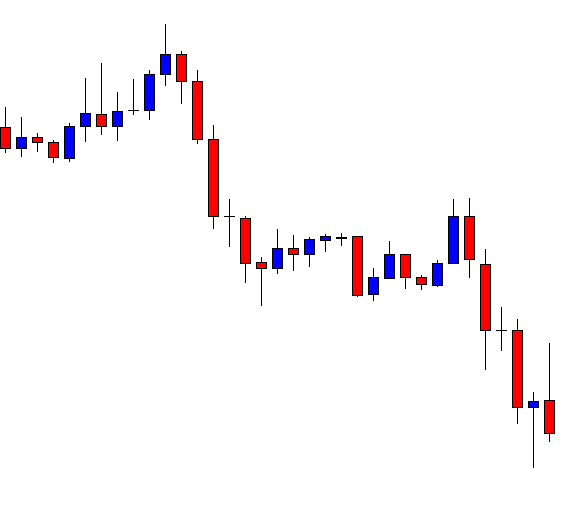
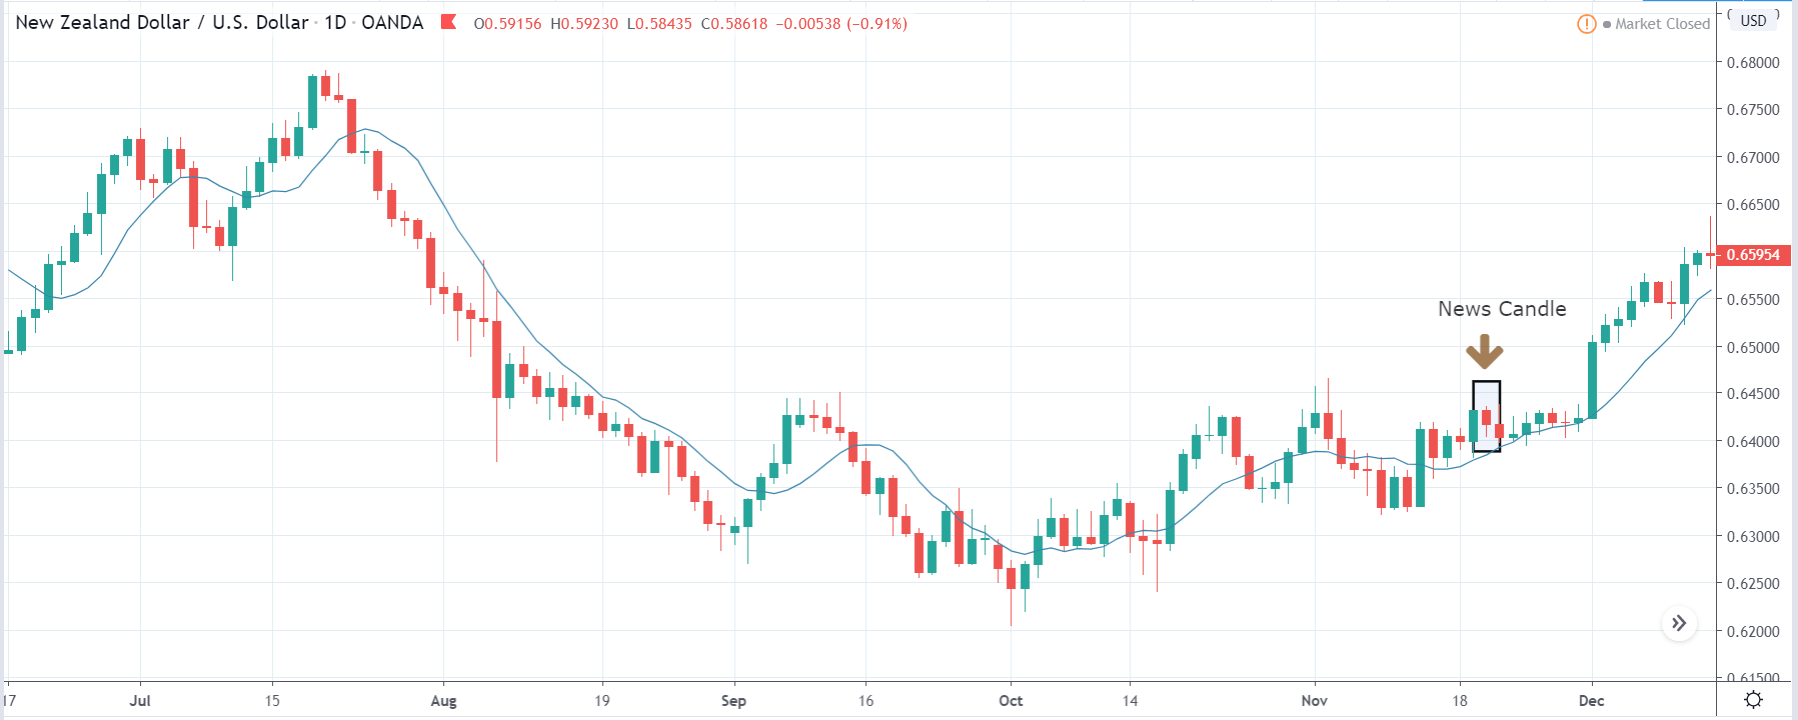
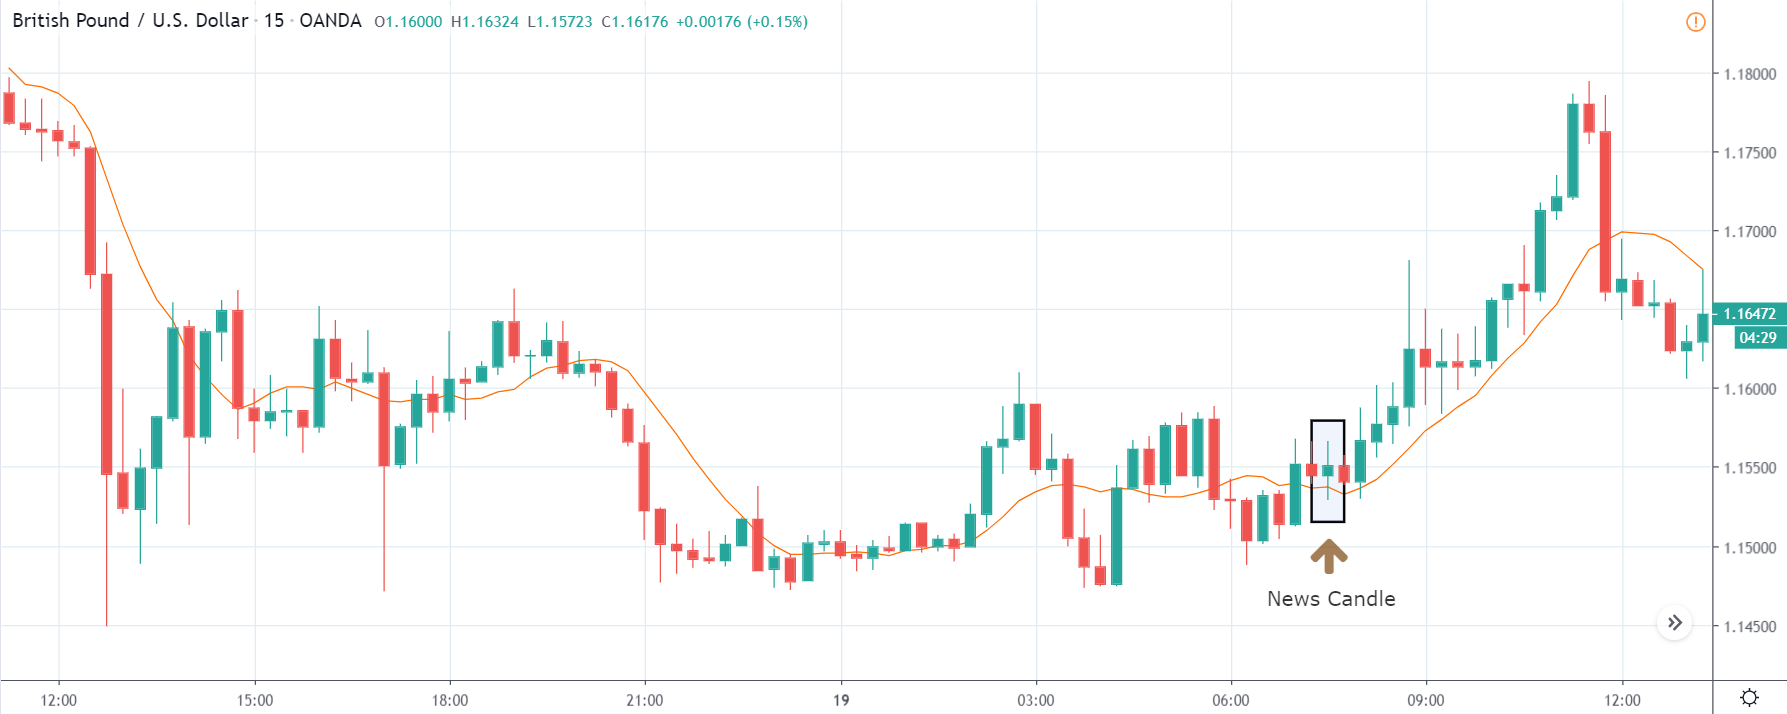
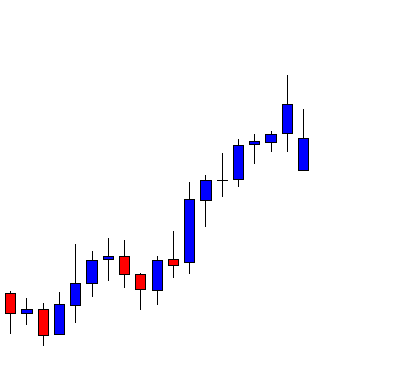
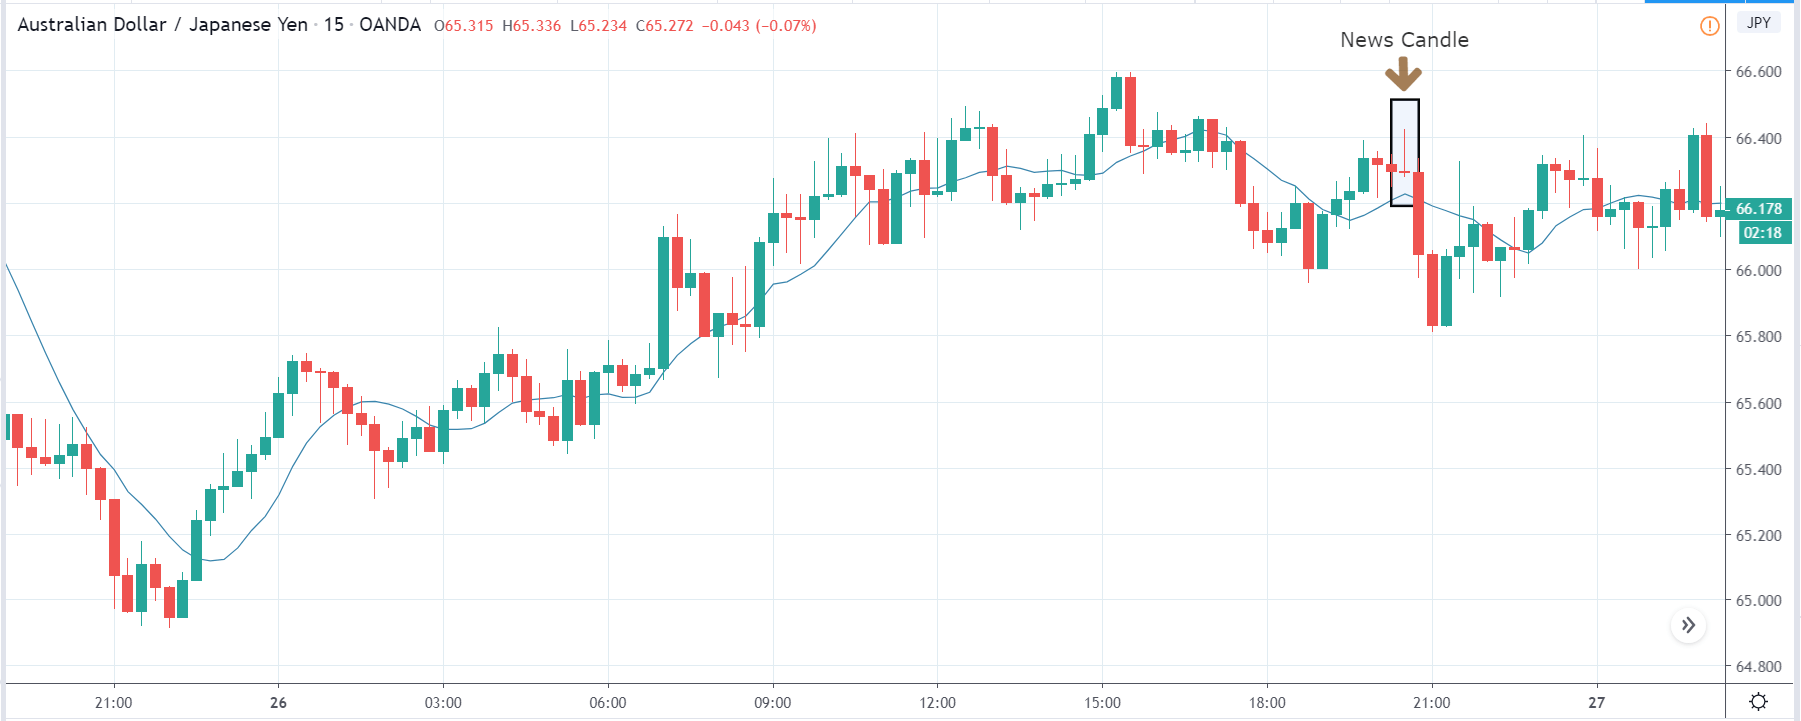
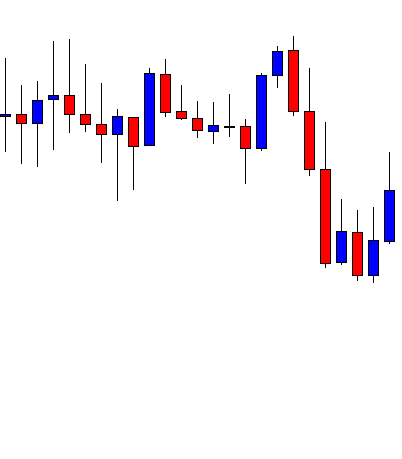
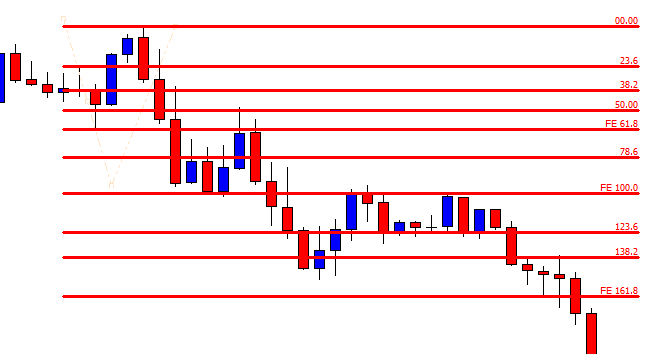
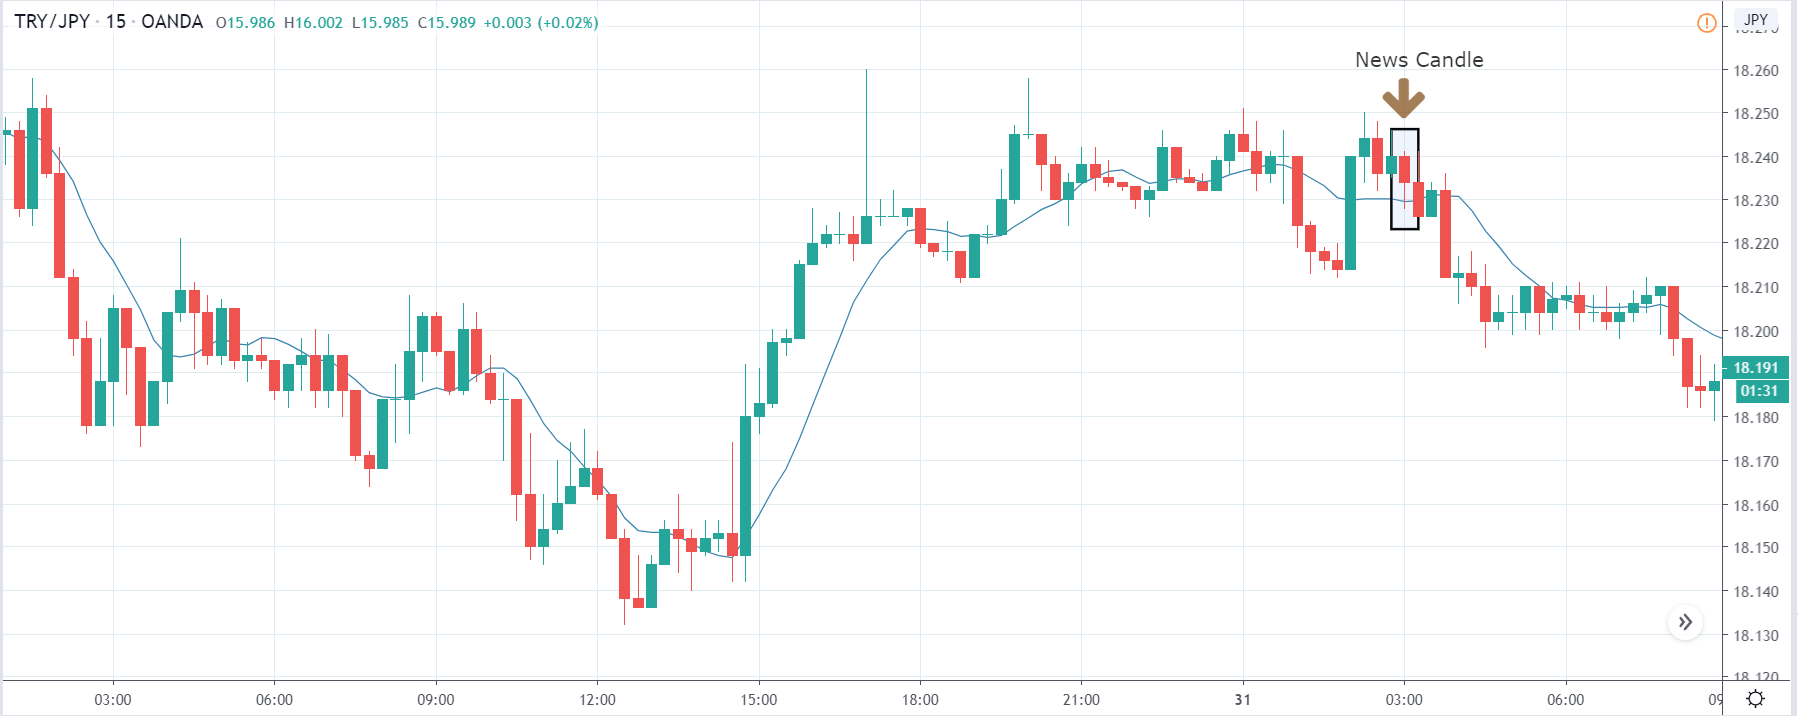
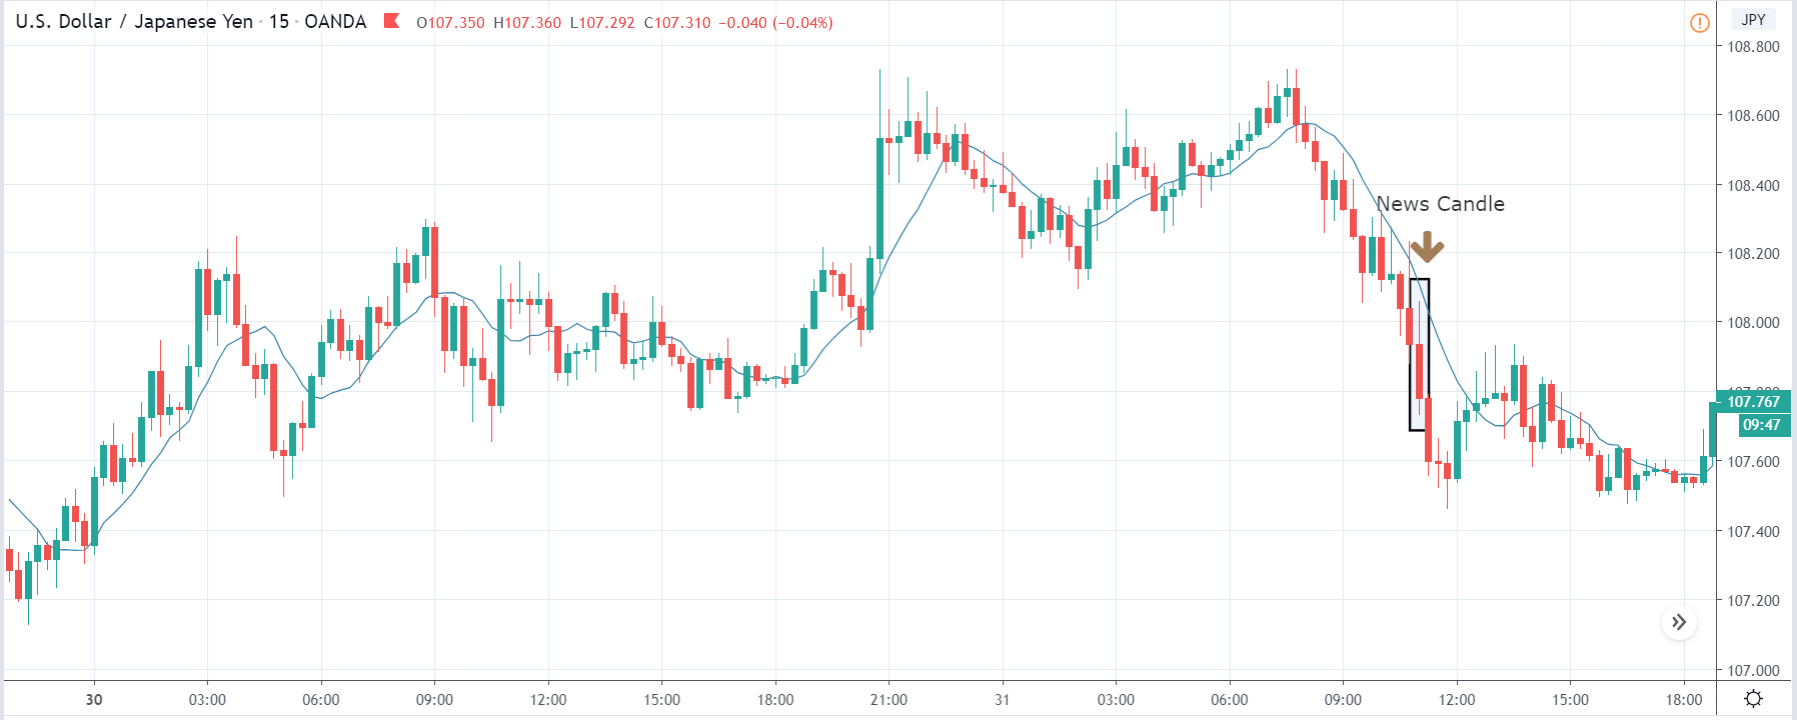
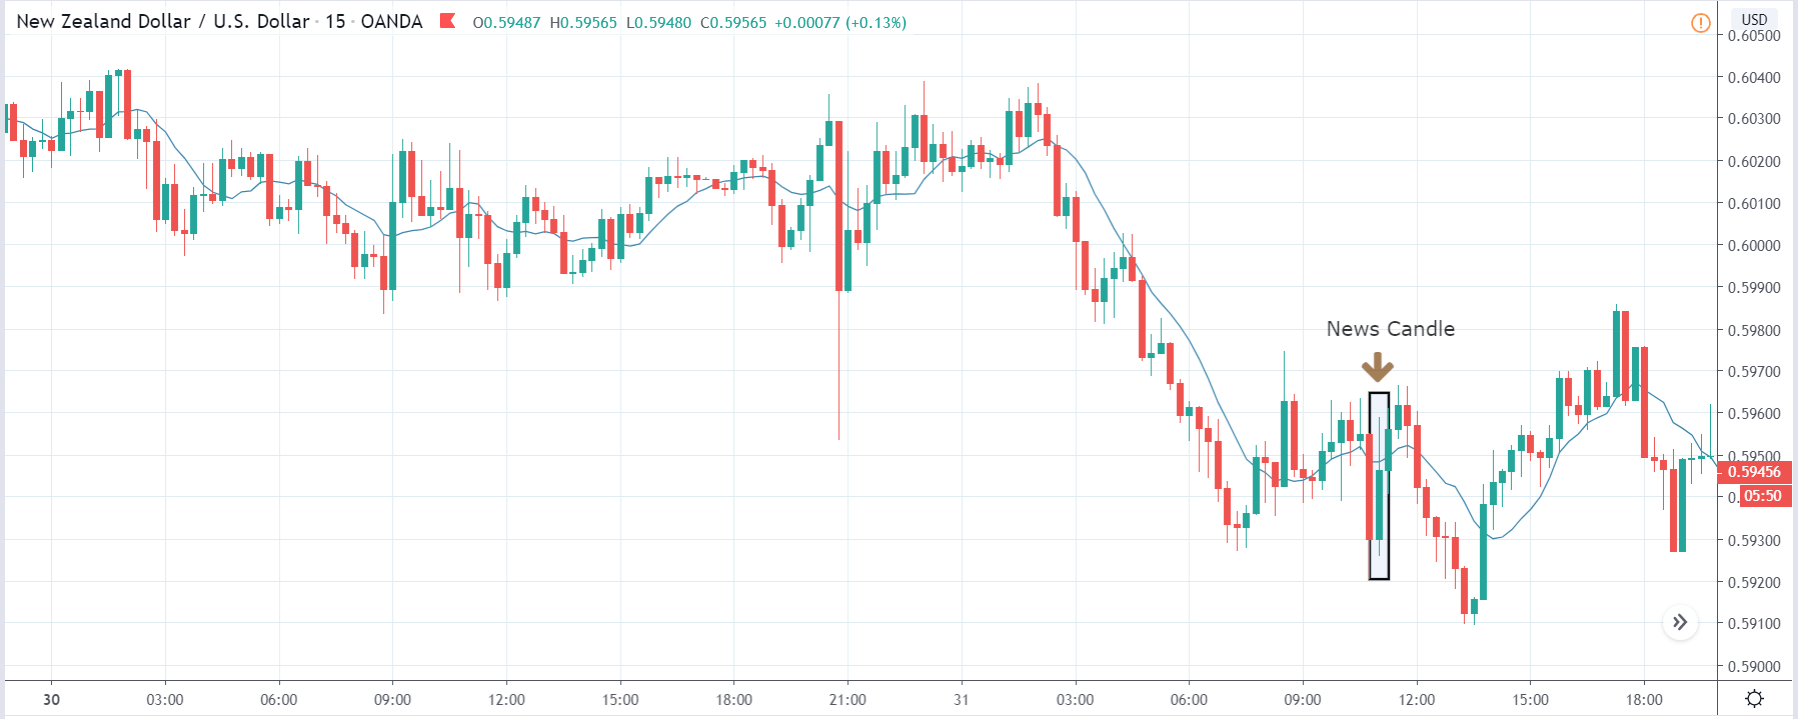
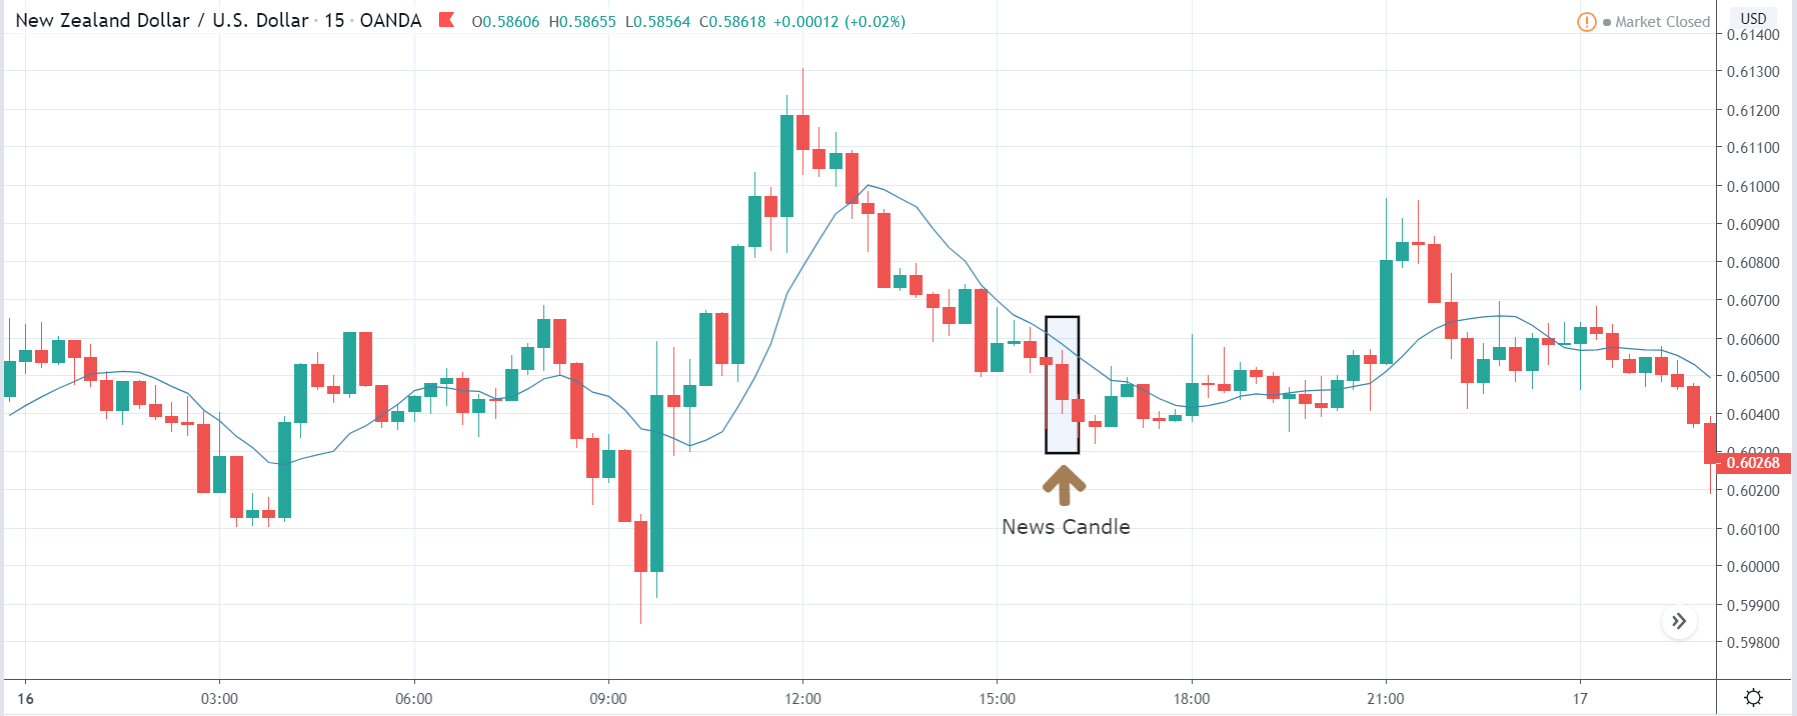
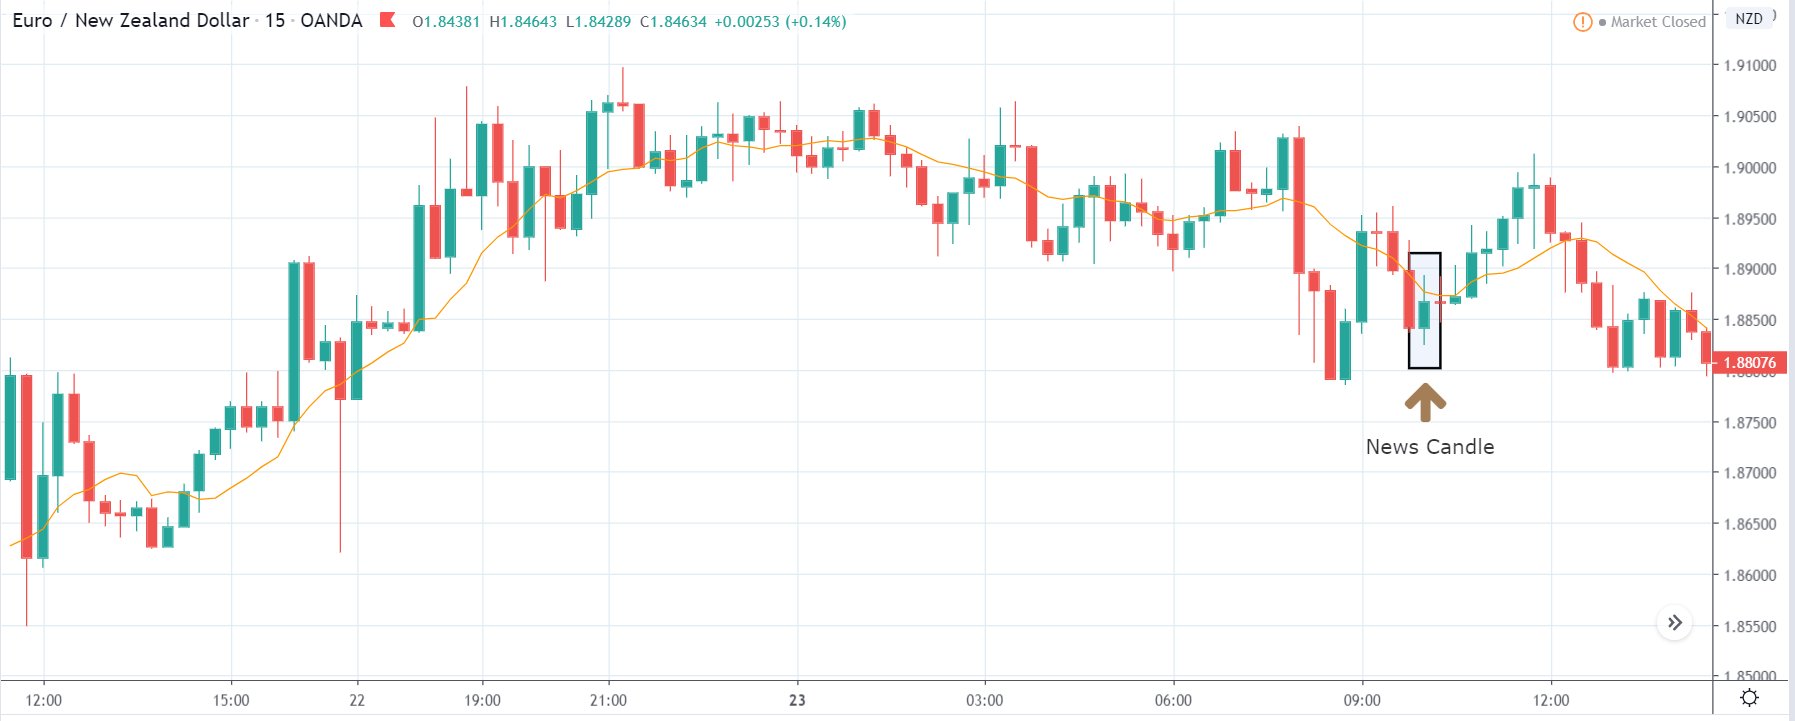
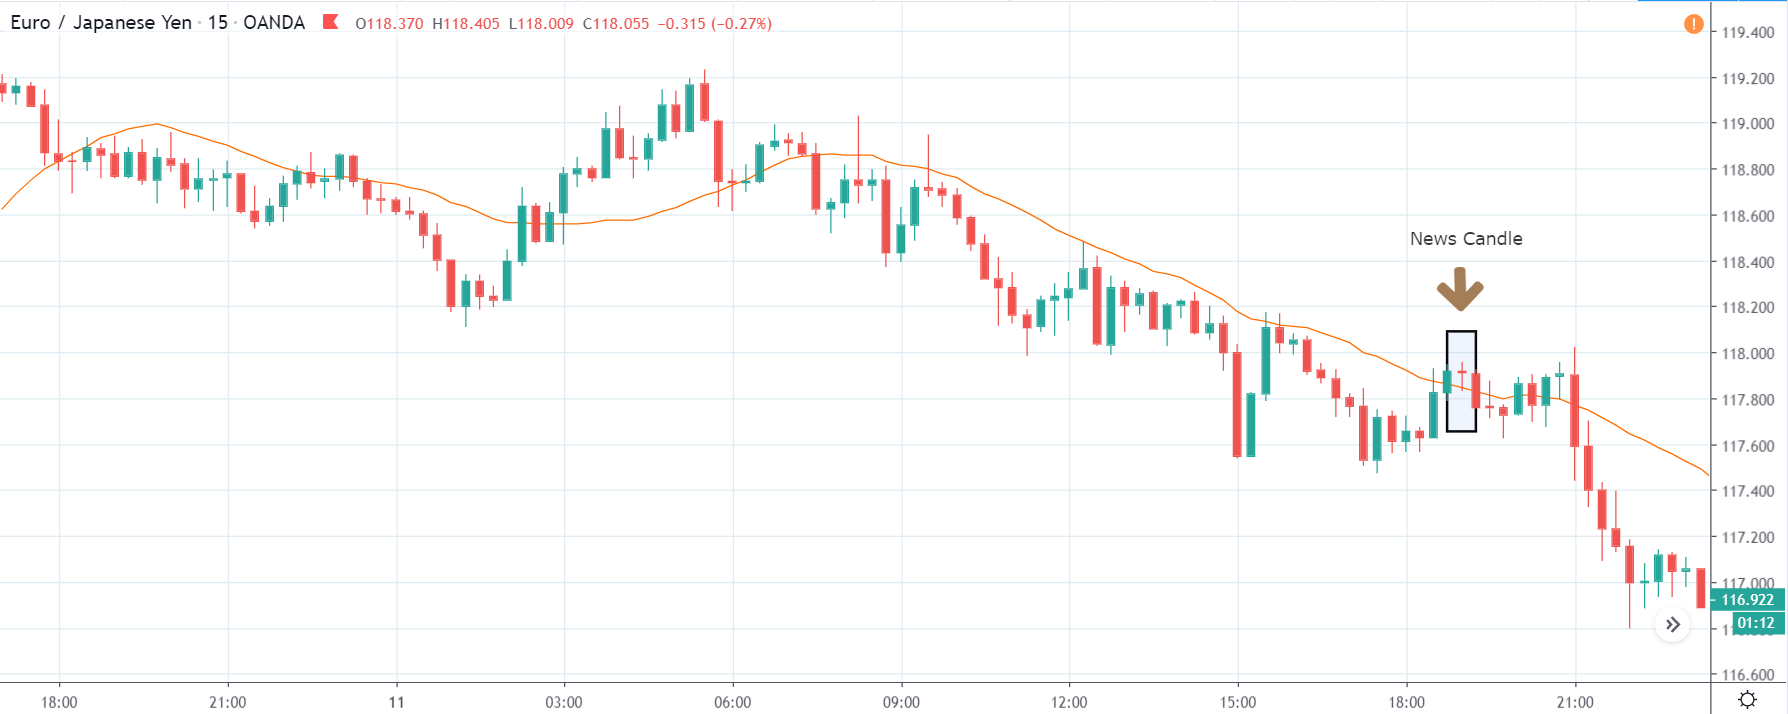
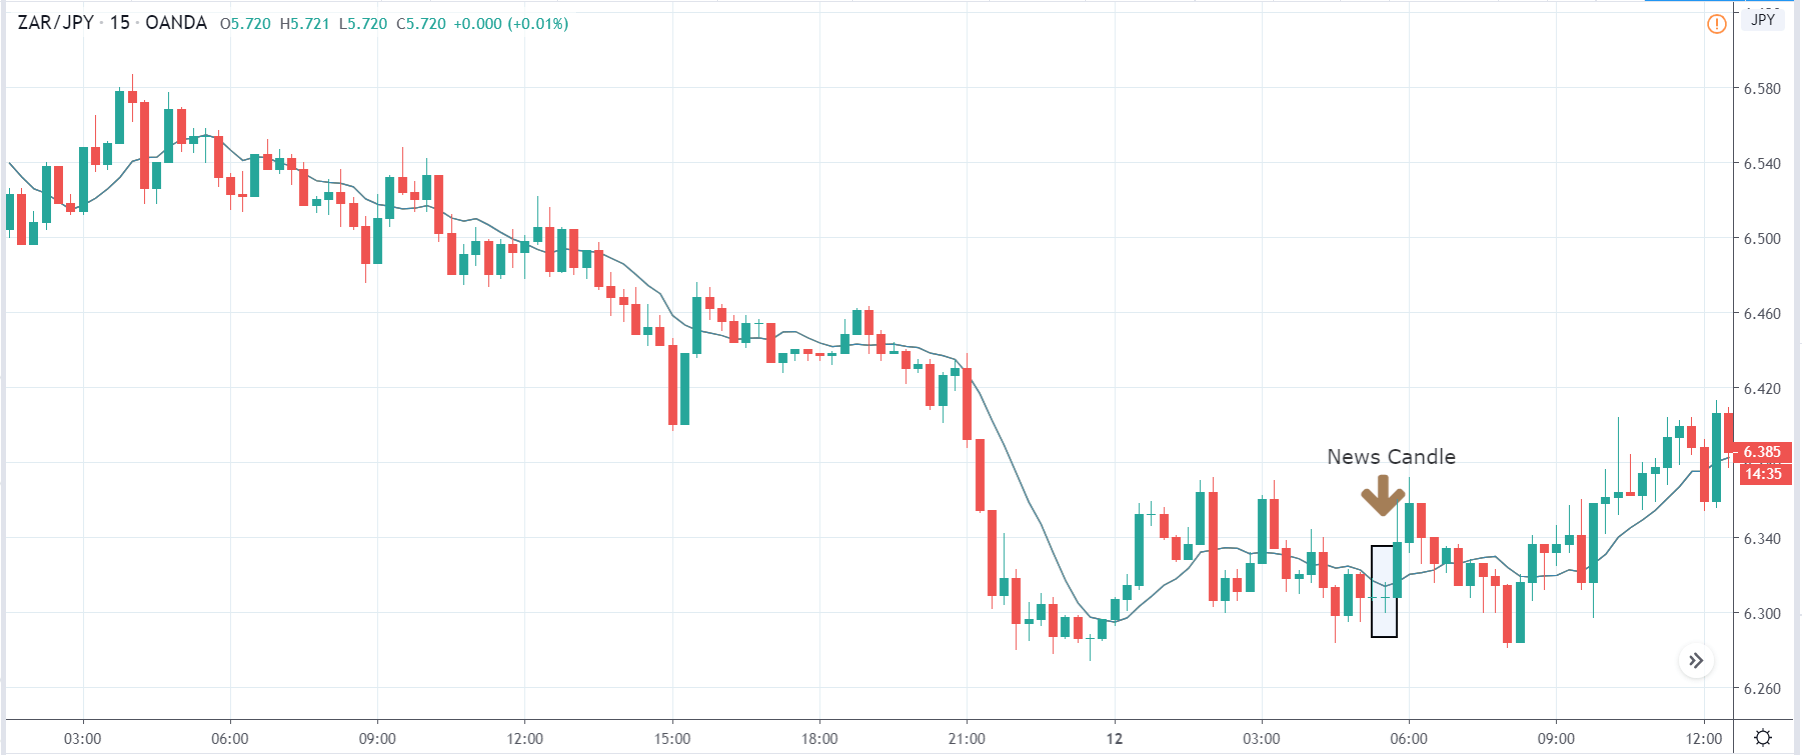
ZAR/JPY | After the announcement:

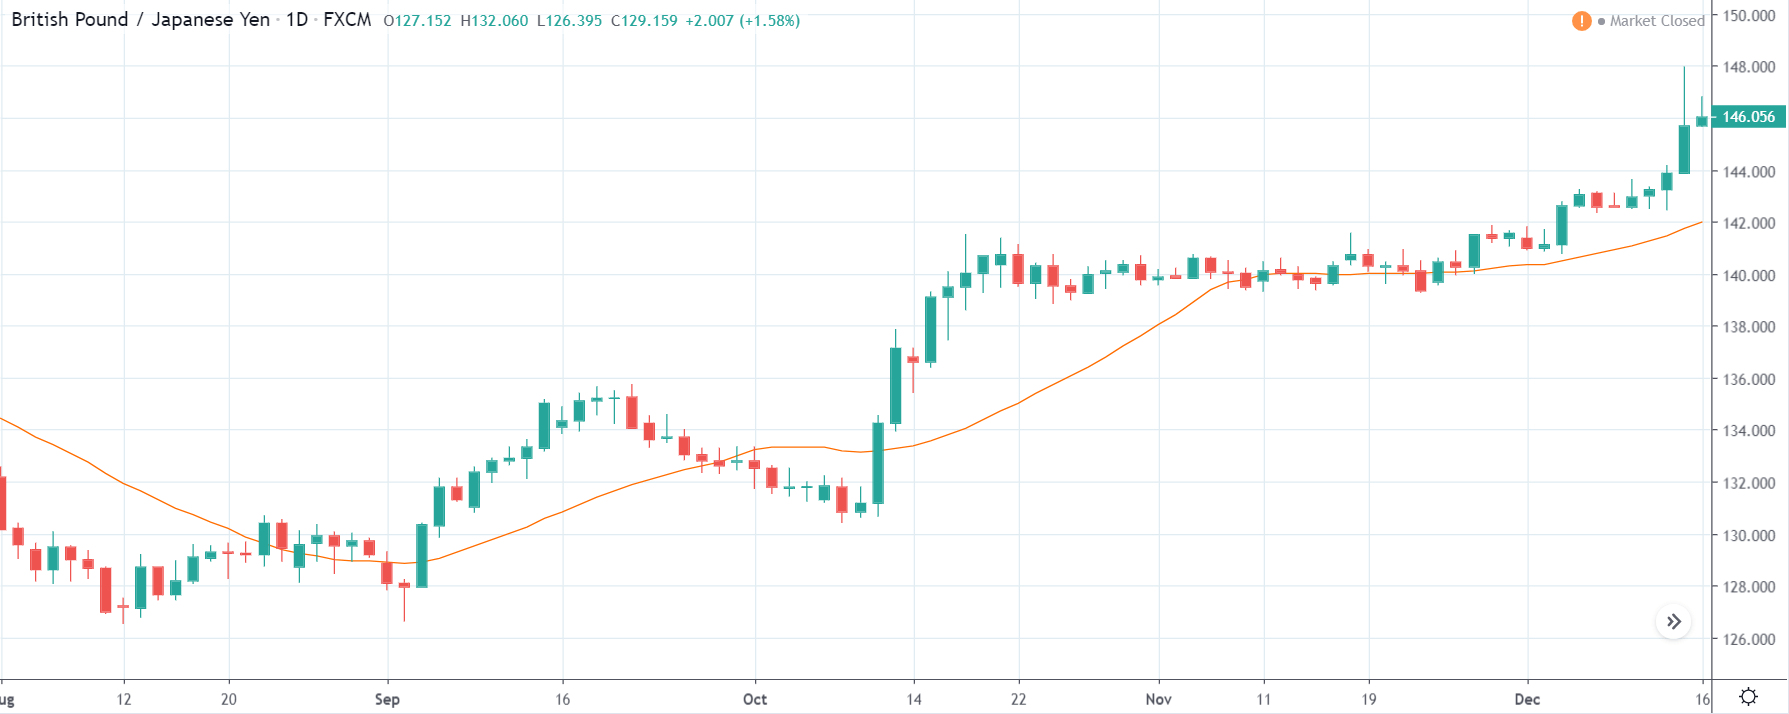
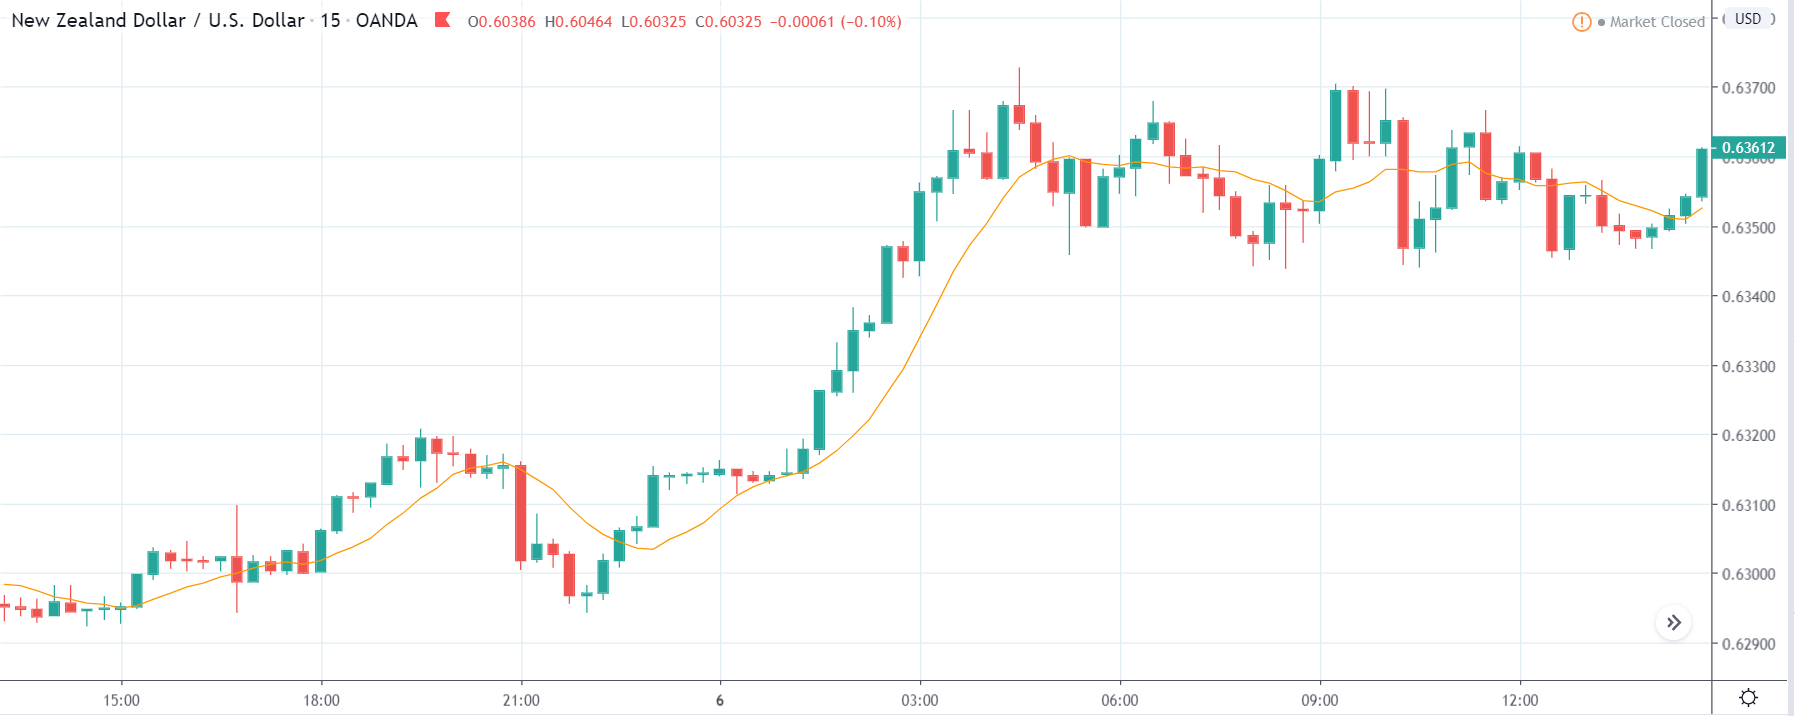
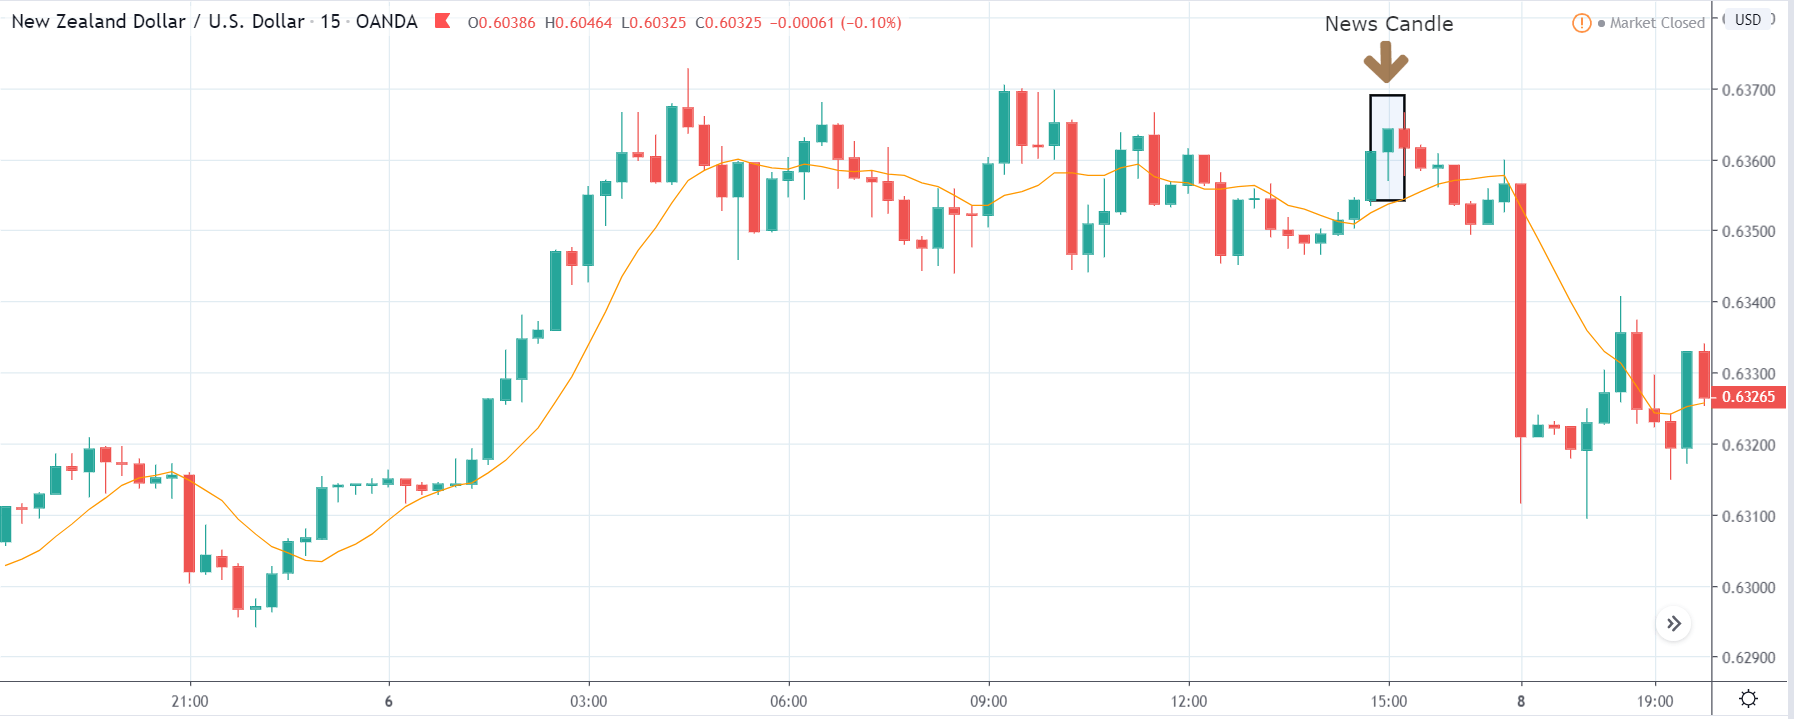
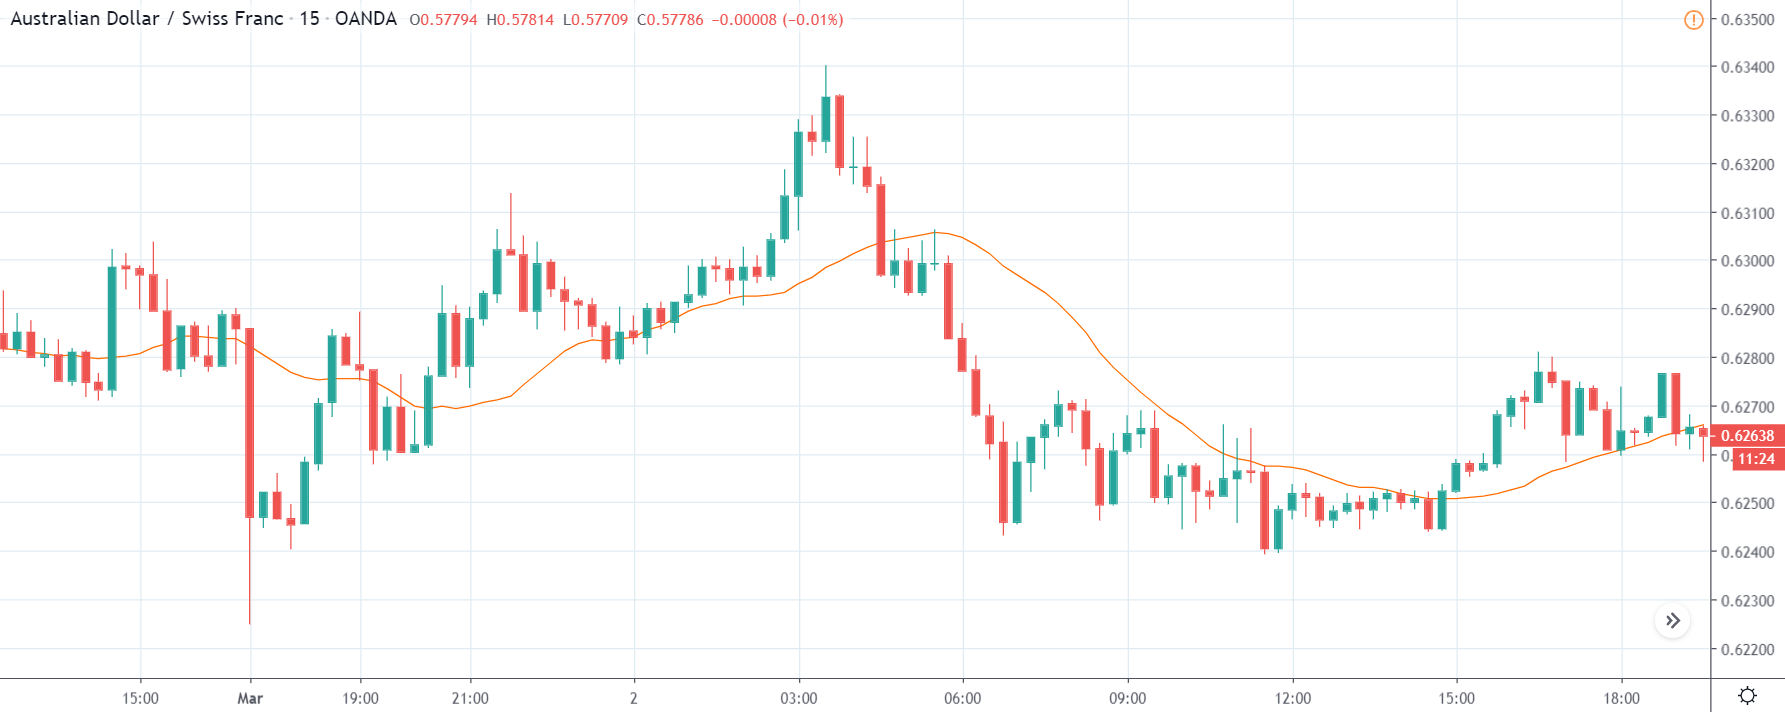
The above images represent the ZAR/JPY currency pair, where the first image shows the characteristics of the chart before the news announcement. We see that the market is a strong downtrend, and since the South African Rand is on the left-hand side of the pair, it signifies extreme weakness in the currency. Presently, the price seems to have formed a ‘range,’ and right now is at the bottom of the ‘range.’

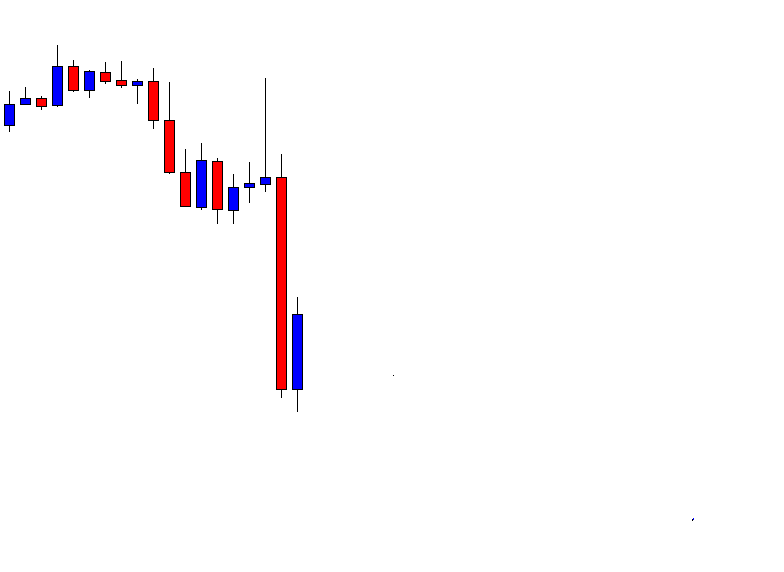
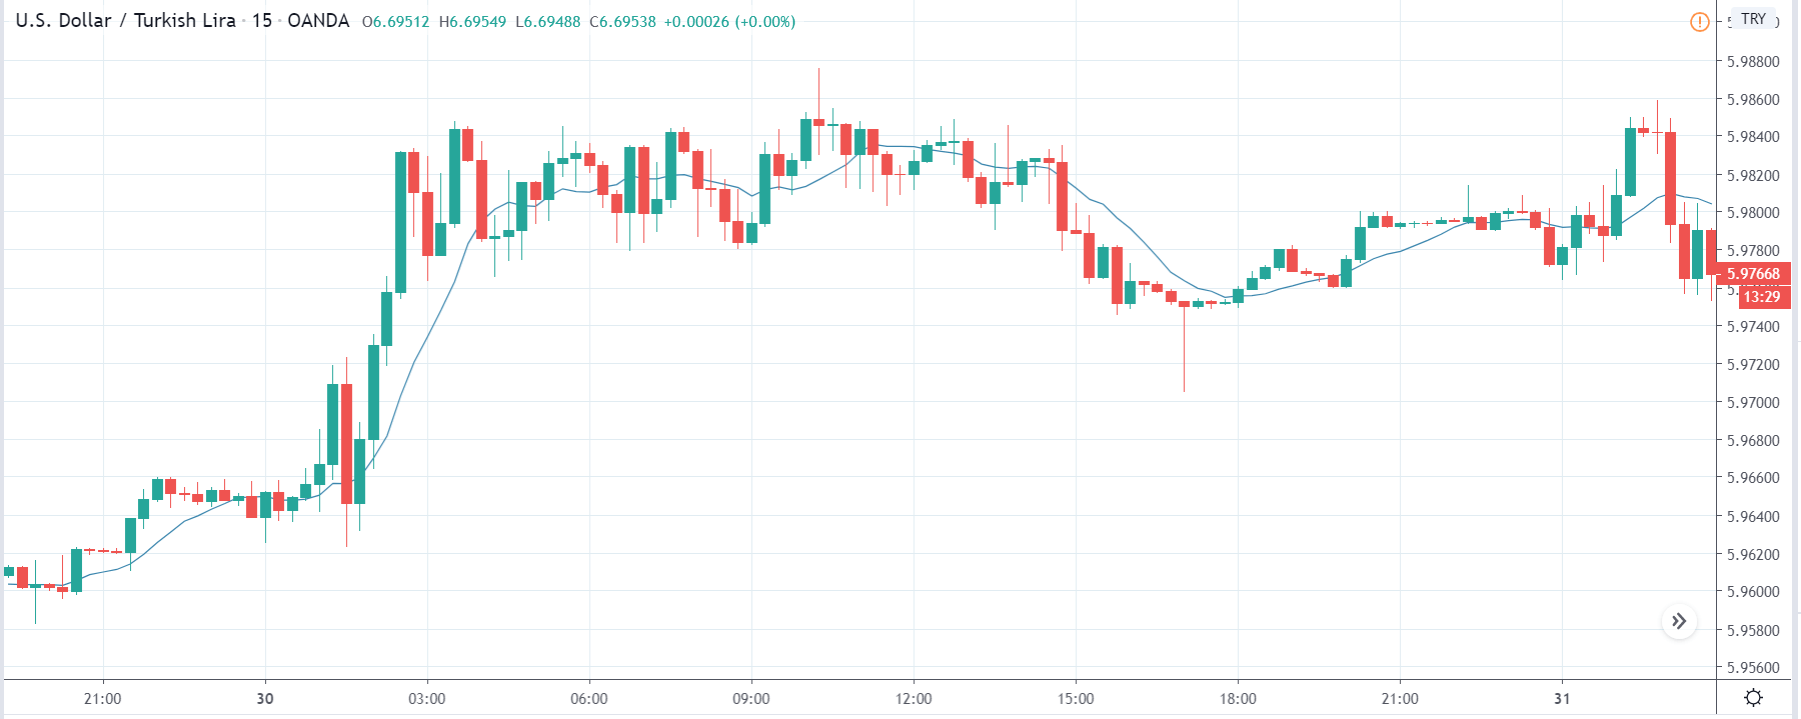
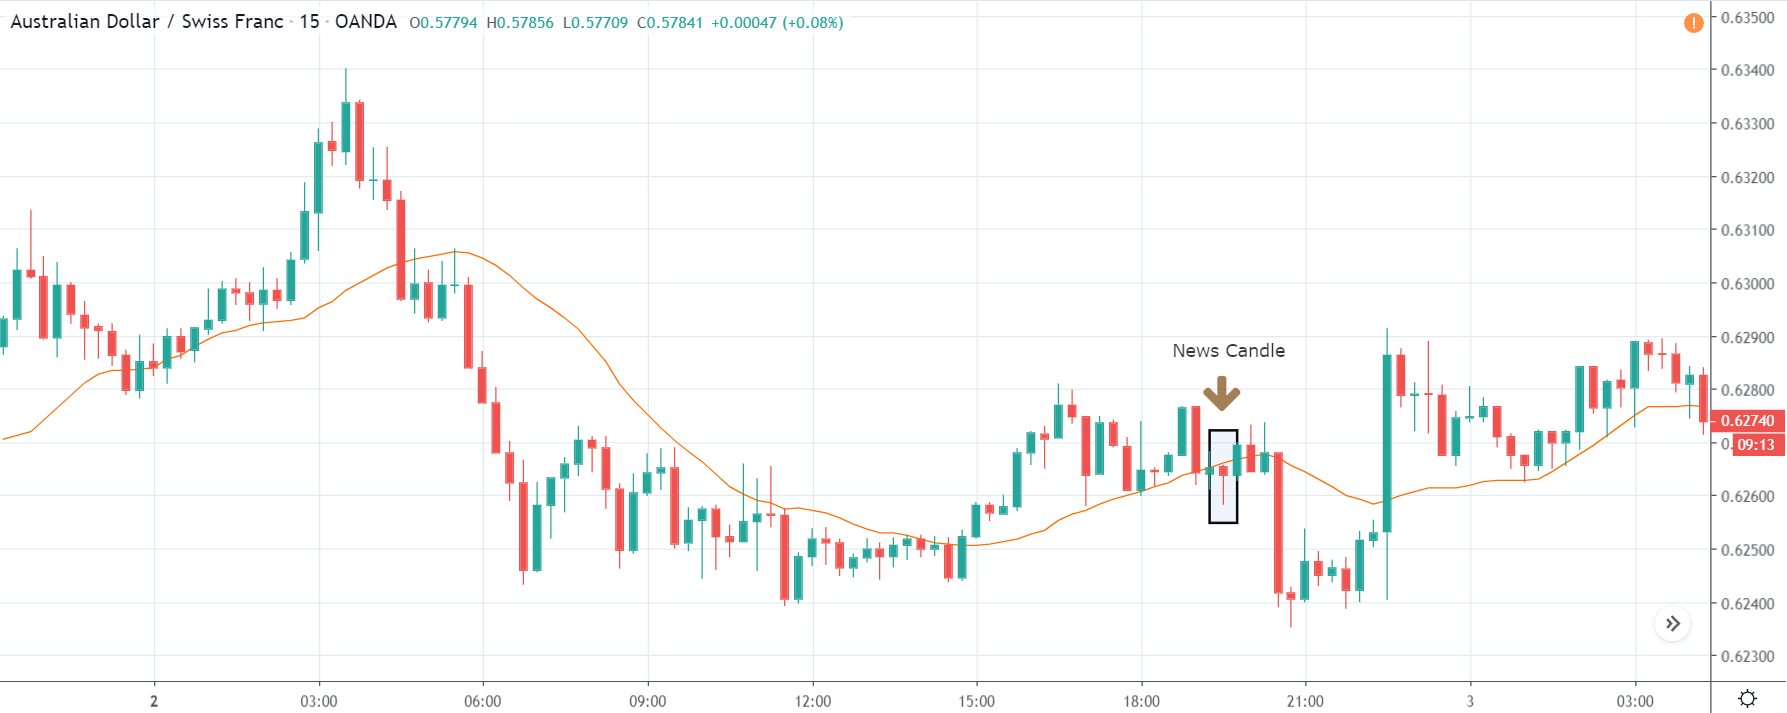
Thus, we can expect buyers to get active at any moment. We cannot take any position in the market at this moment. After the news announcement, volatility remains at the same level as before, and the price does not respond to the news data as expected. The ‘news candle’ forms a ‘Doji’ candlestick pattern where the price closes almost at the opening price. Since the Mining Production data does not have a major impact on the currency, traders should analyze the currency pair from a technical perspective and take suitable positions.

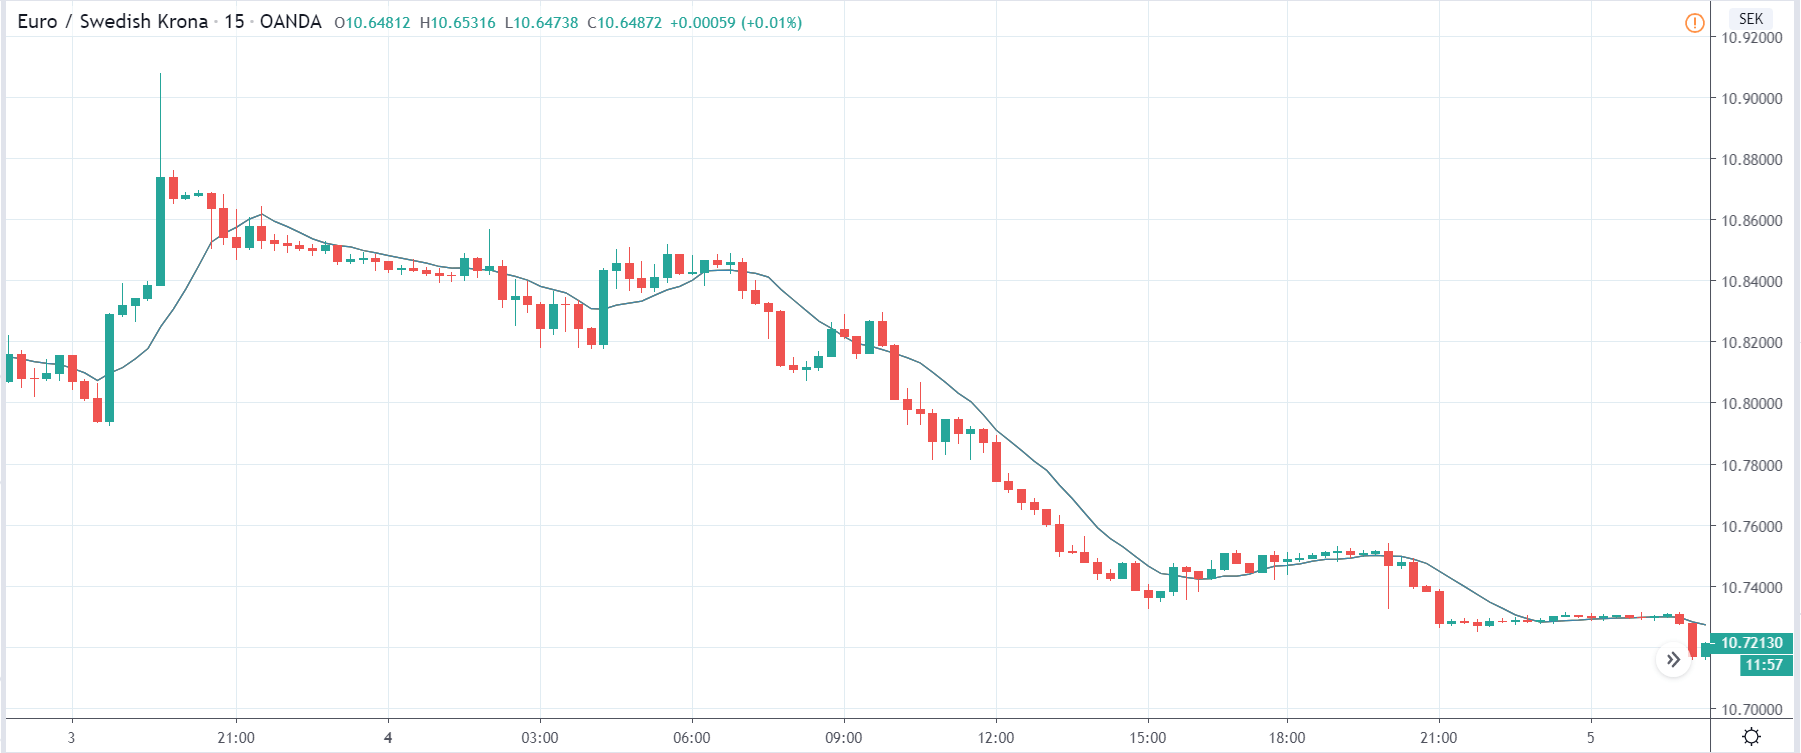
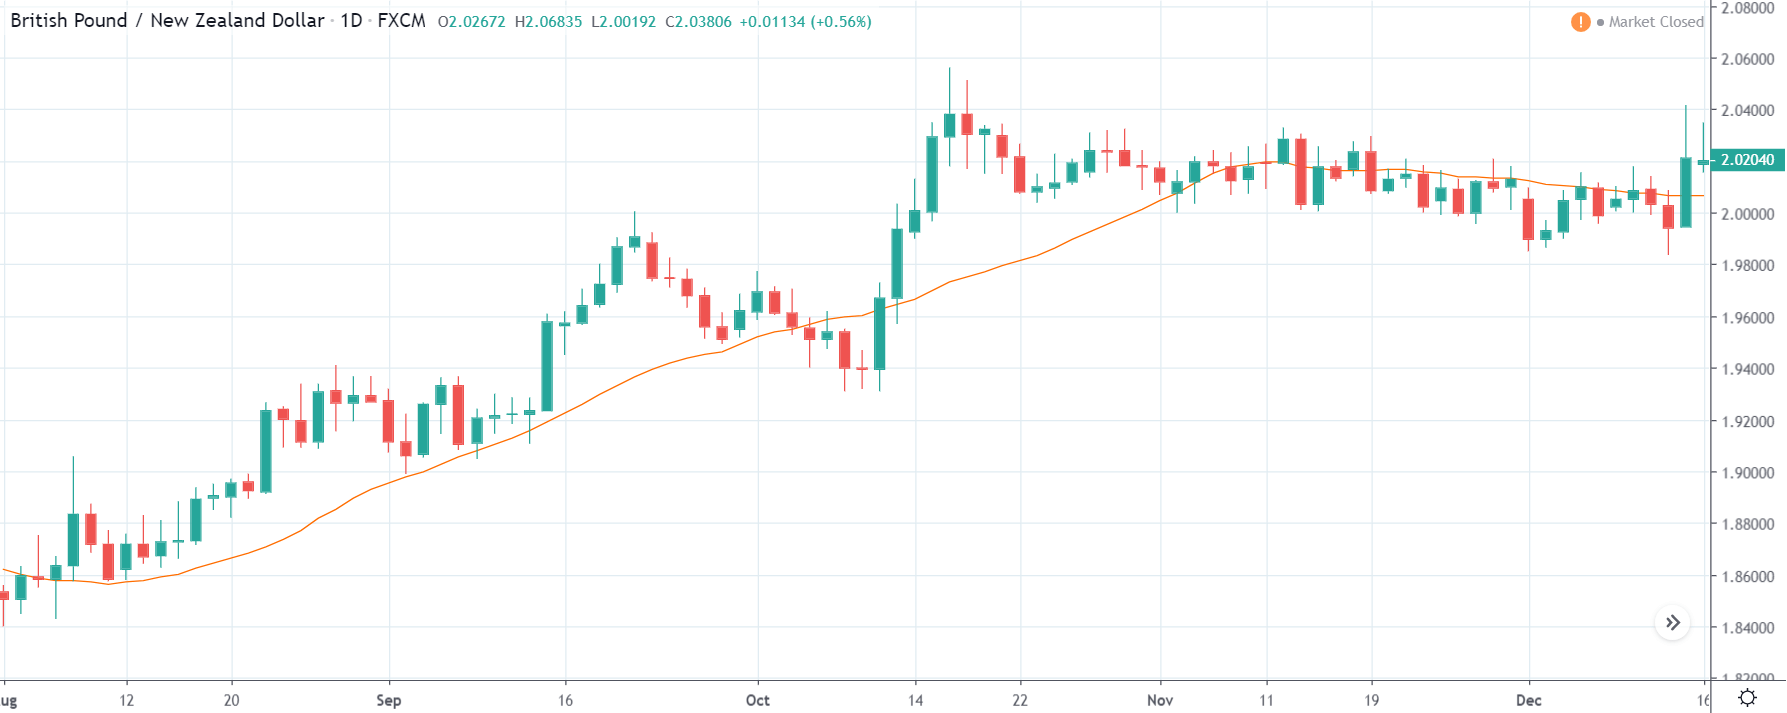
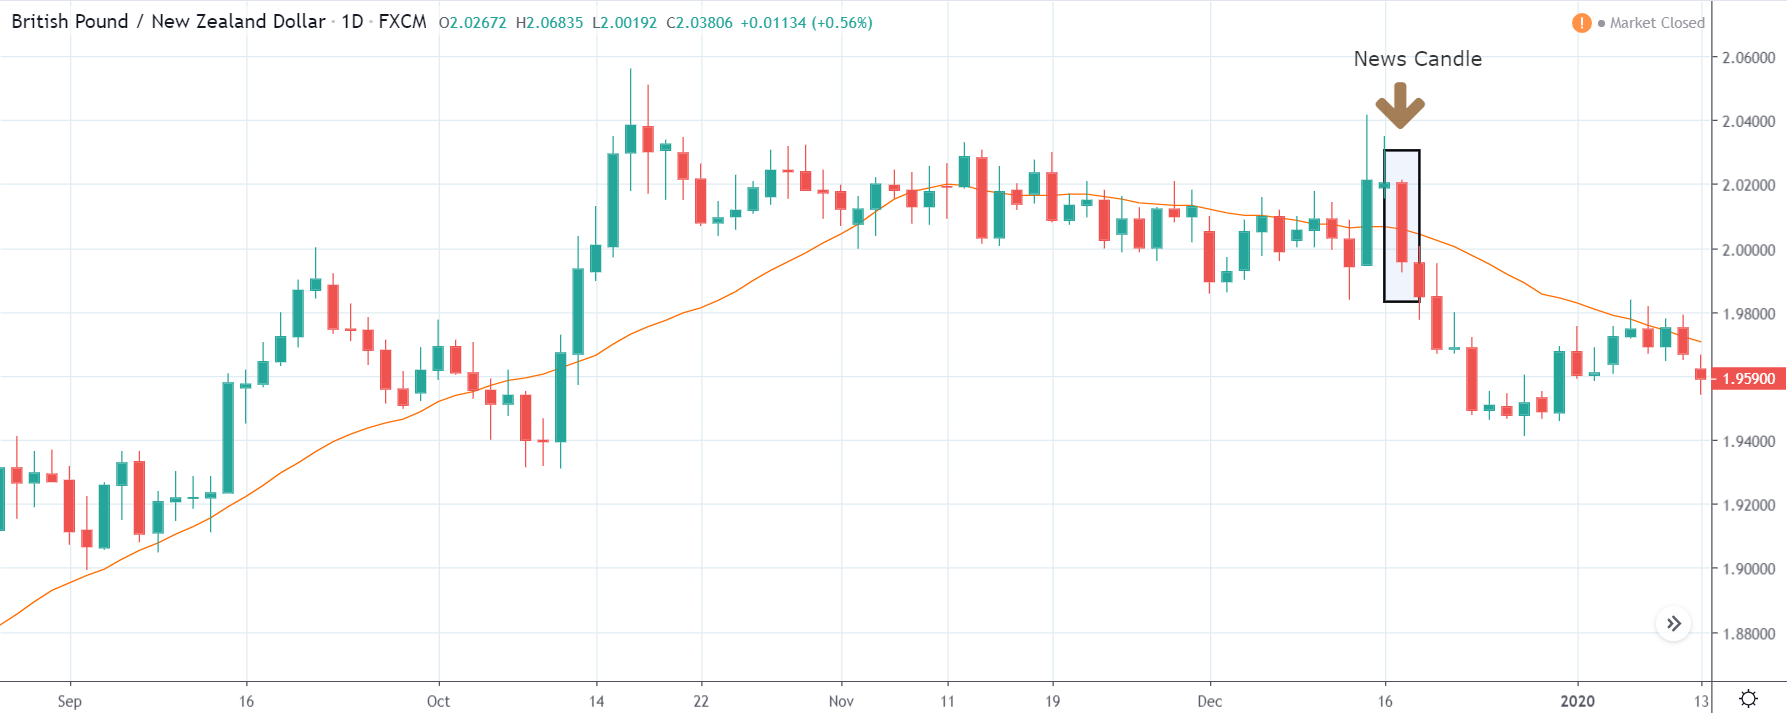
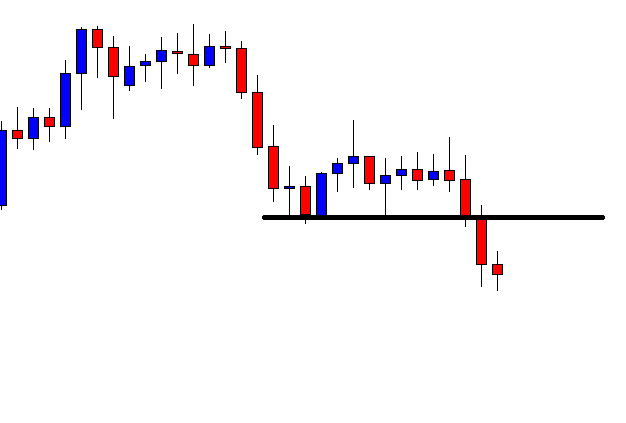
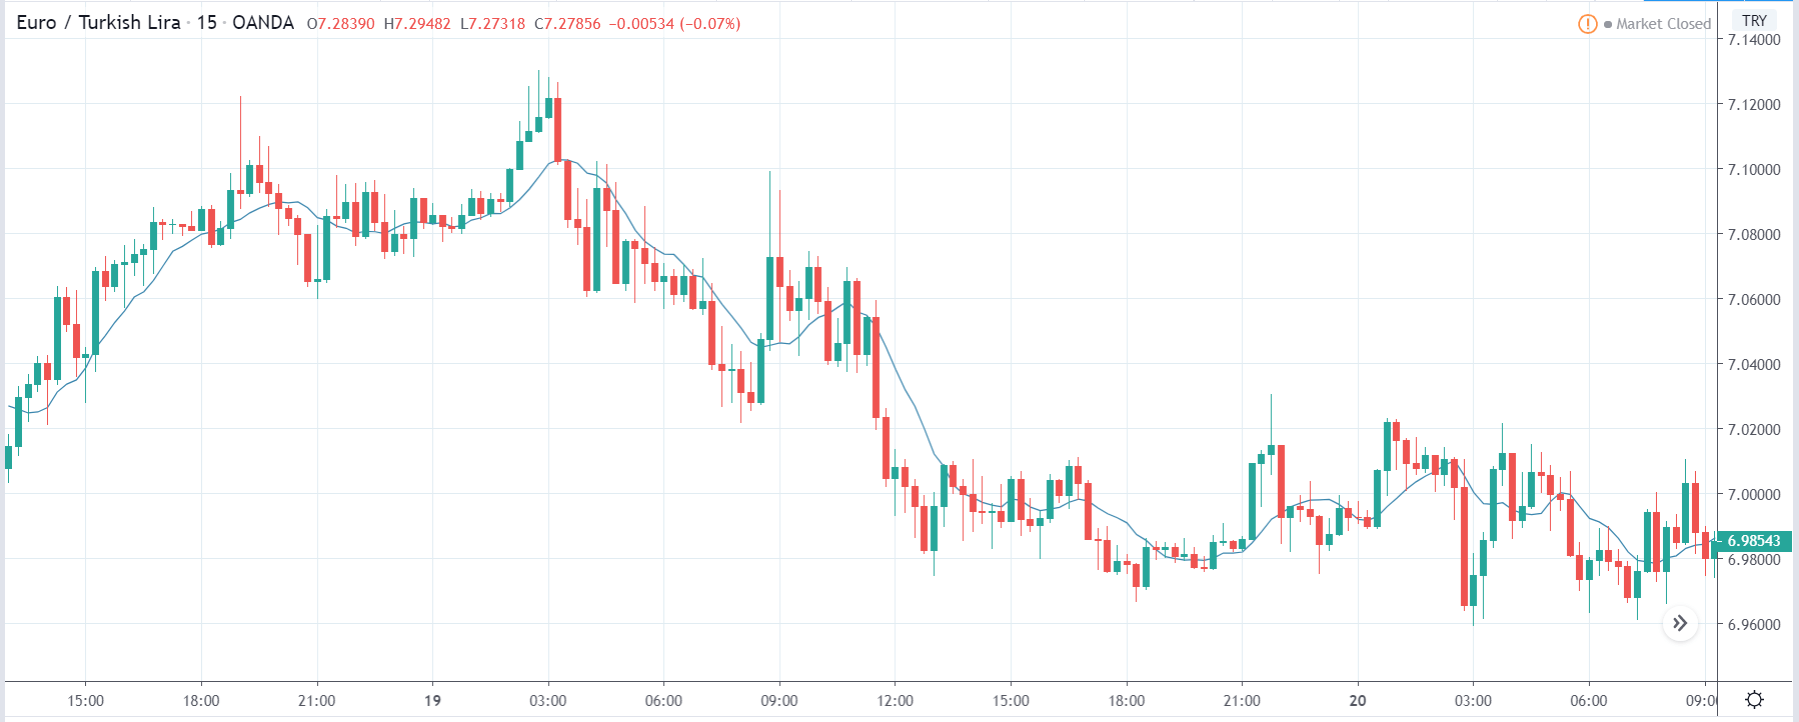
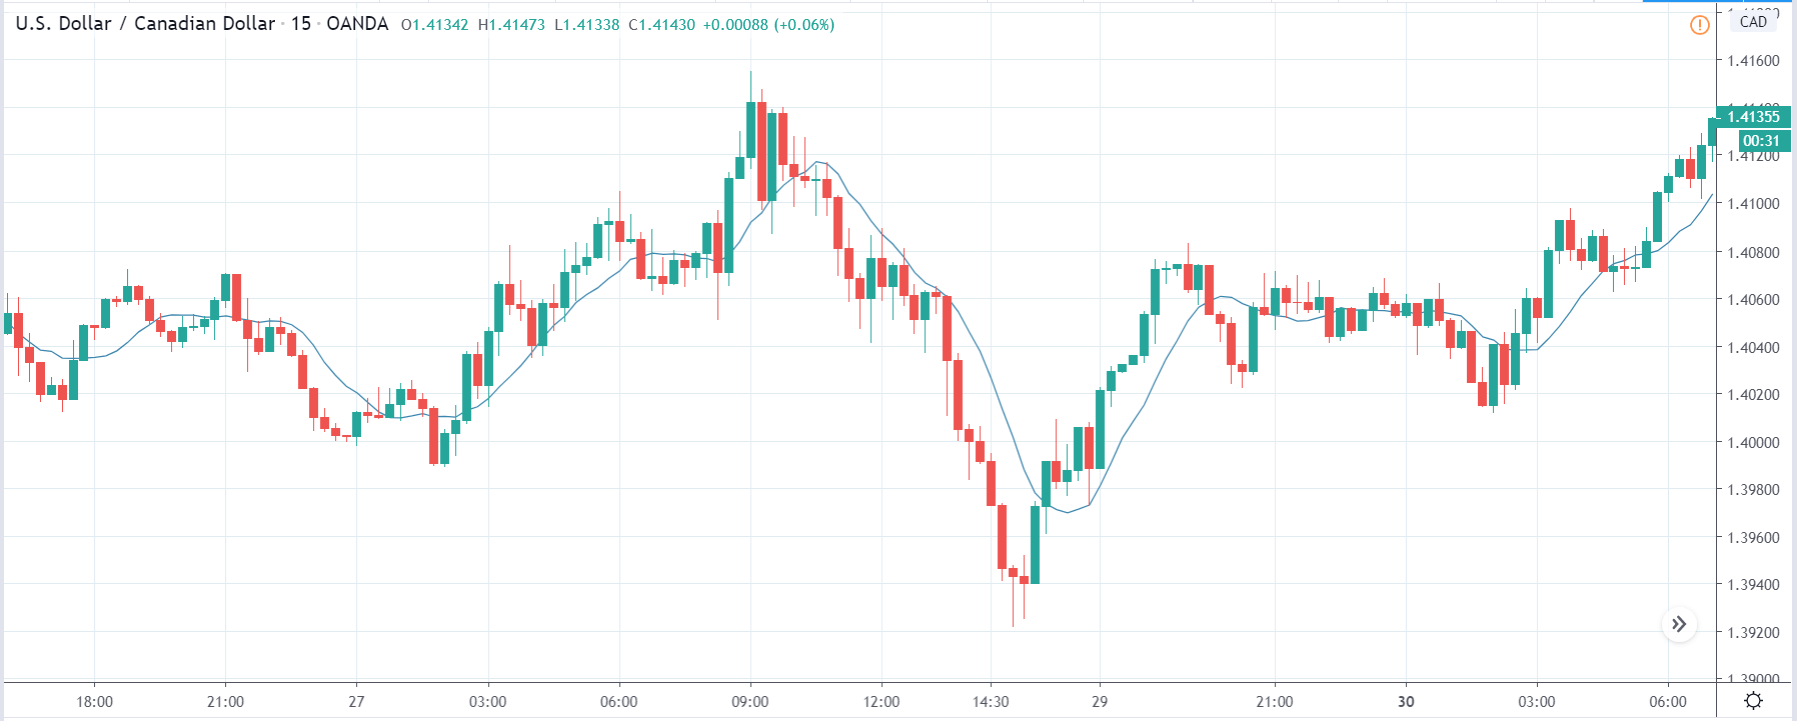
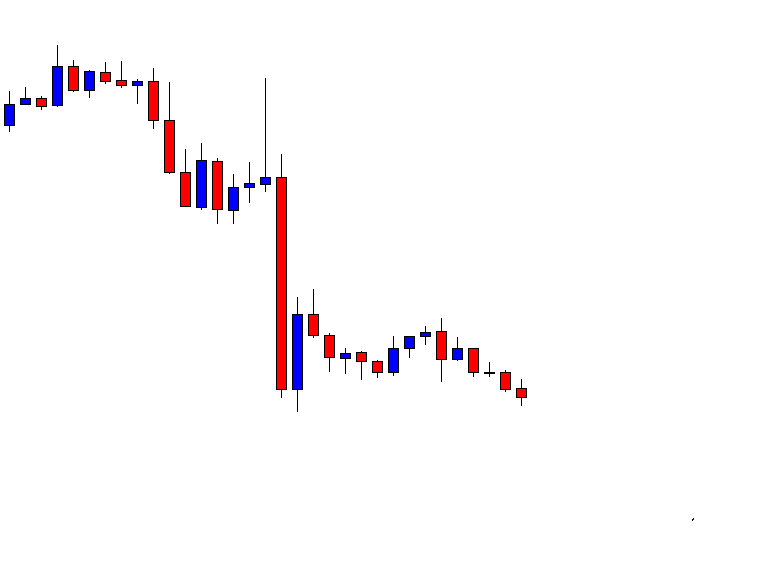
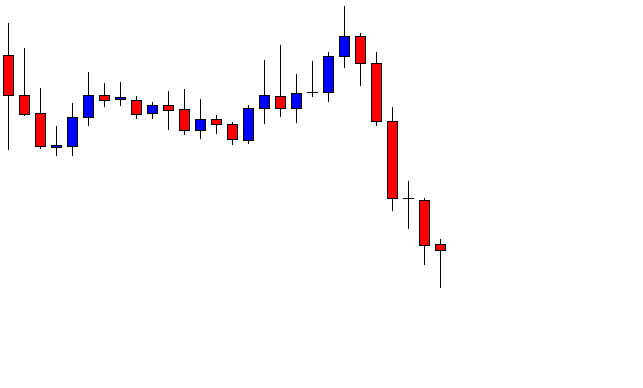
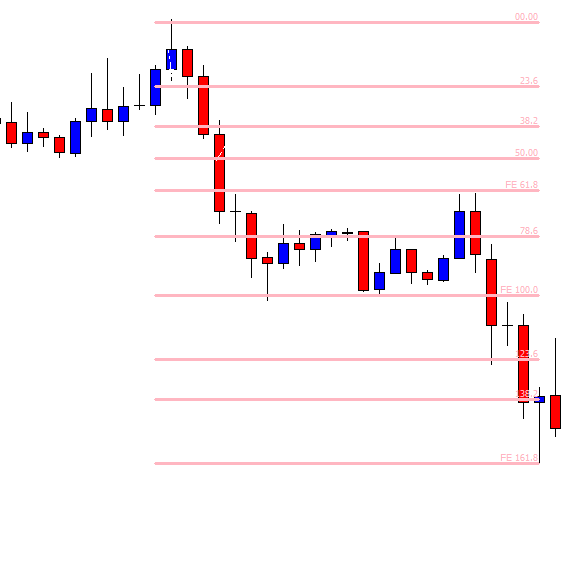
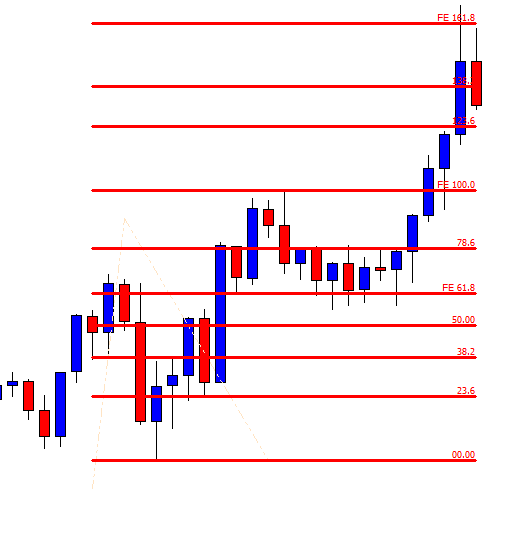
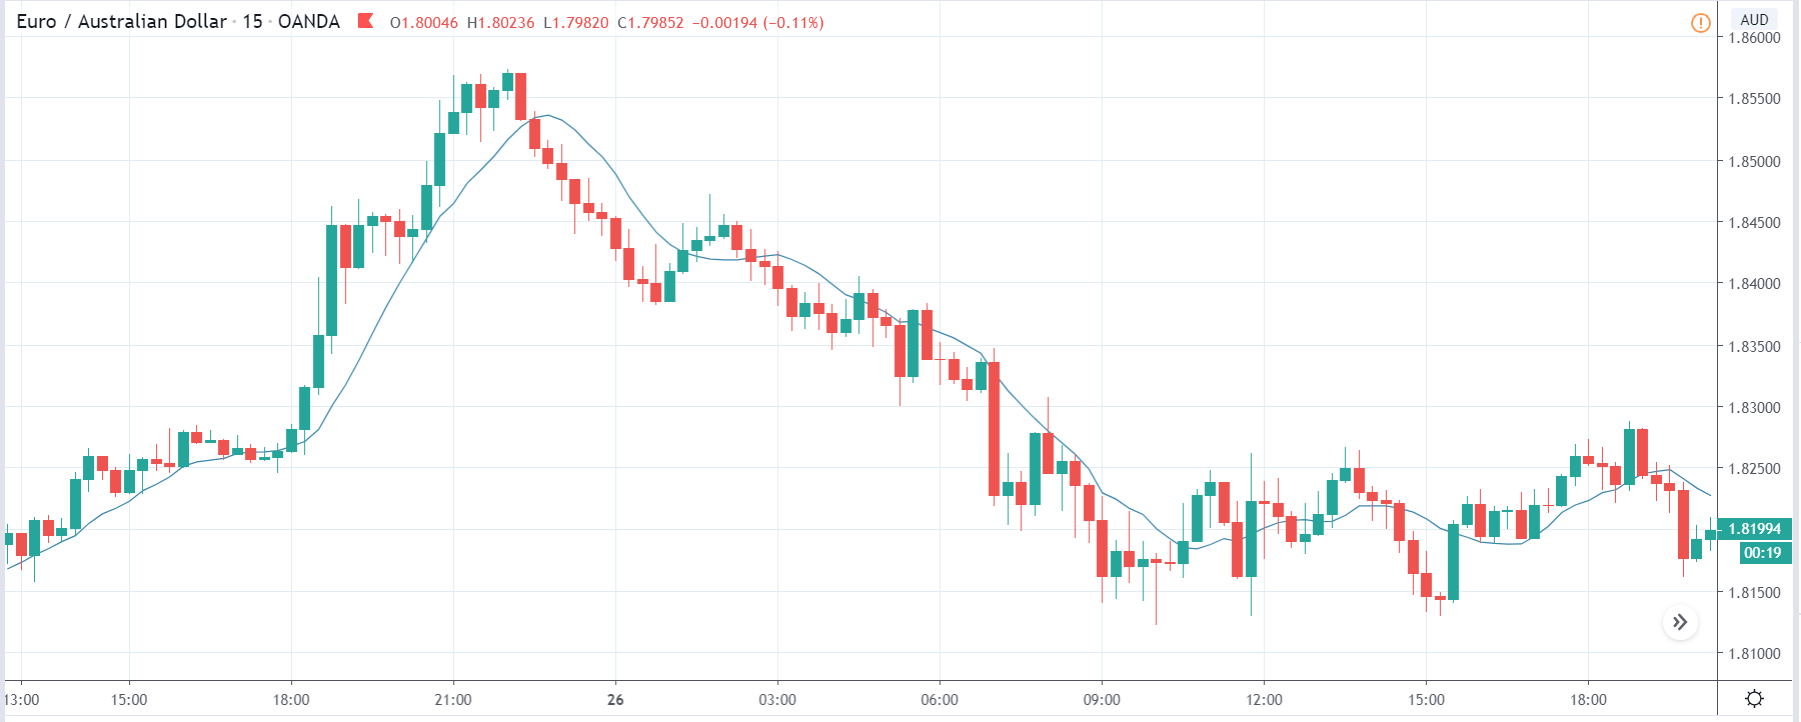
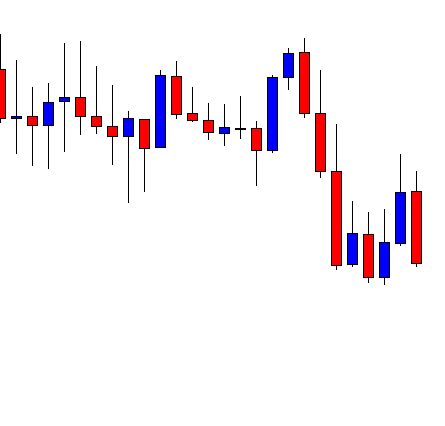
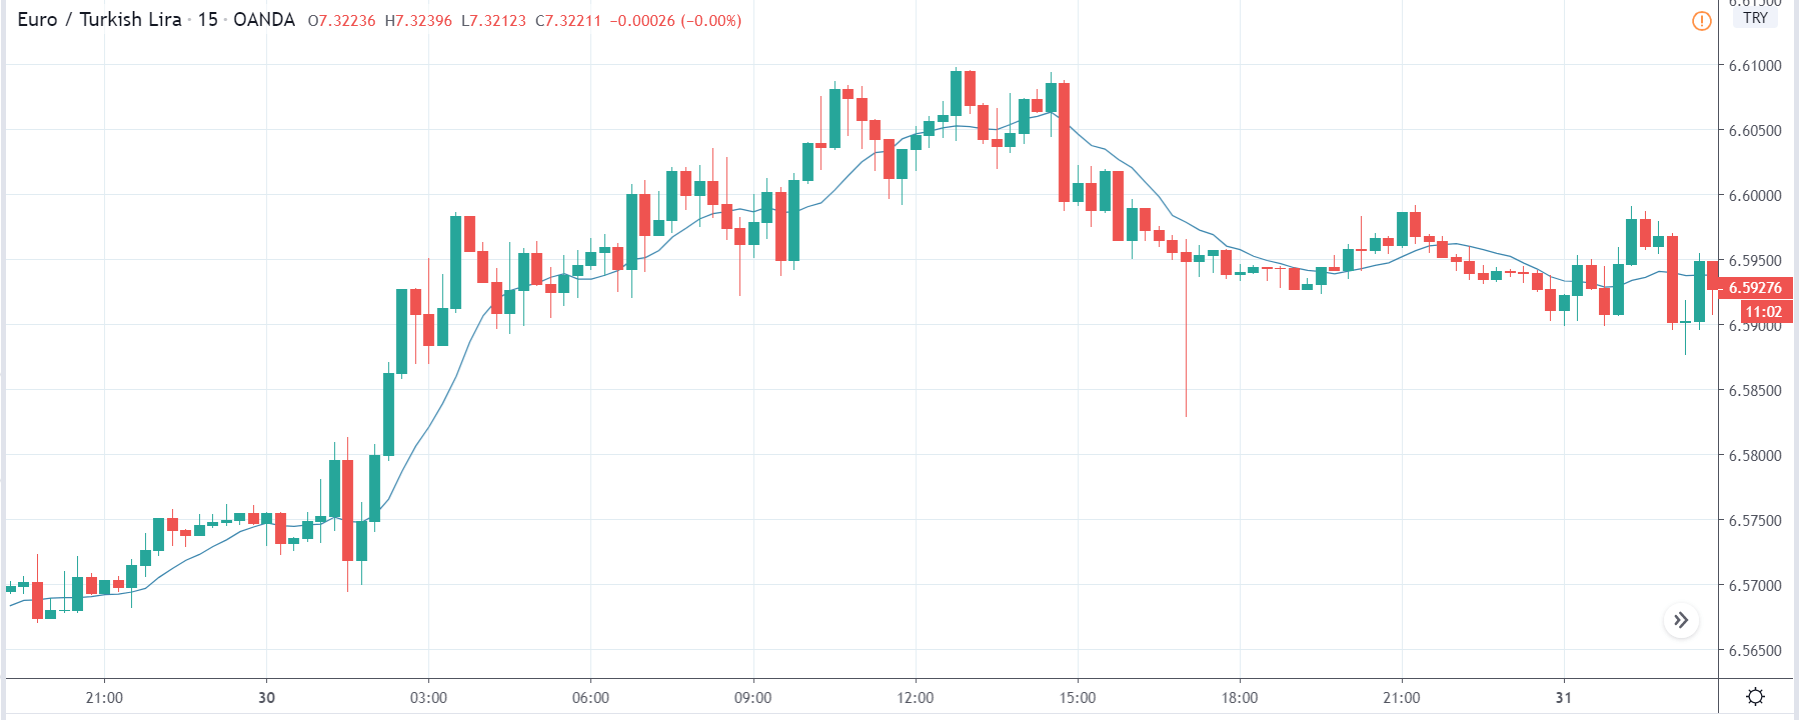
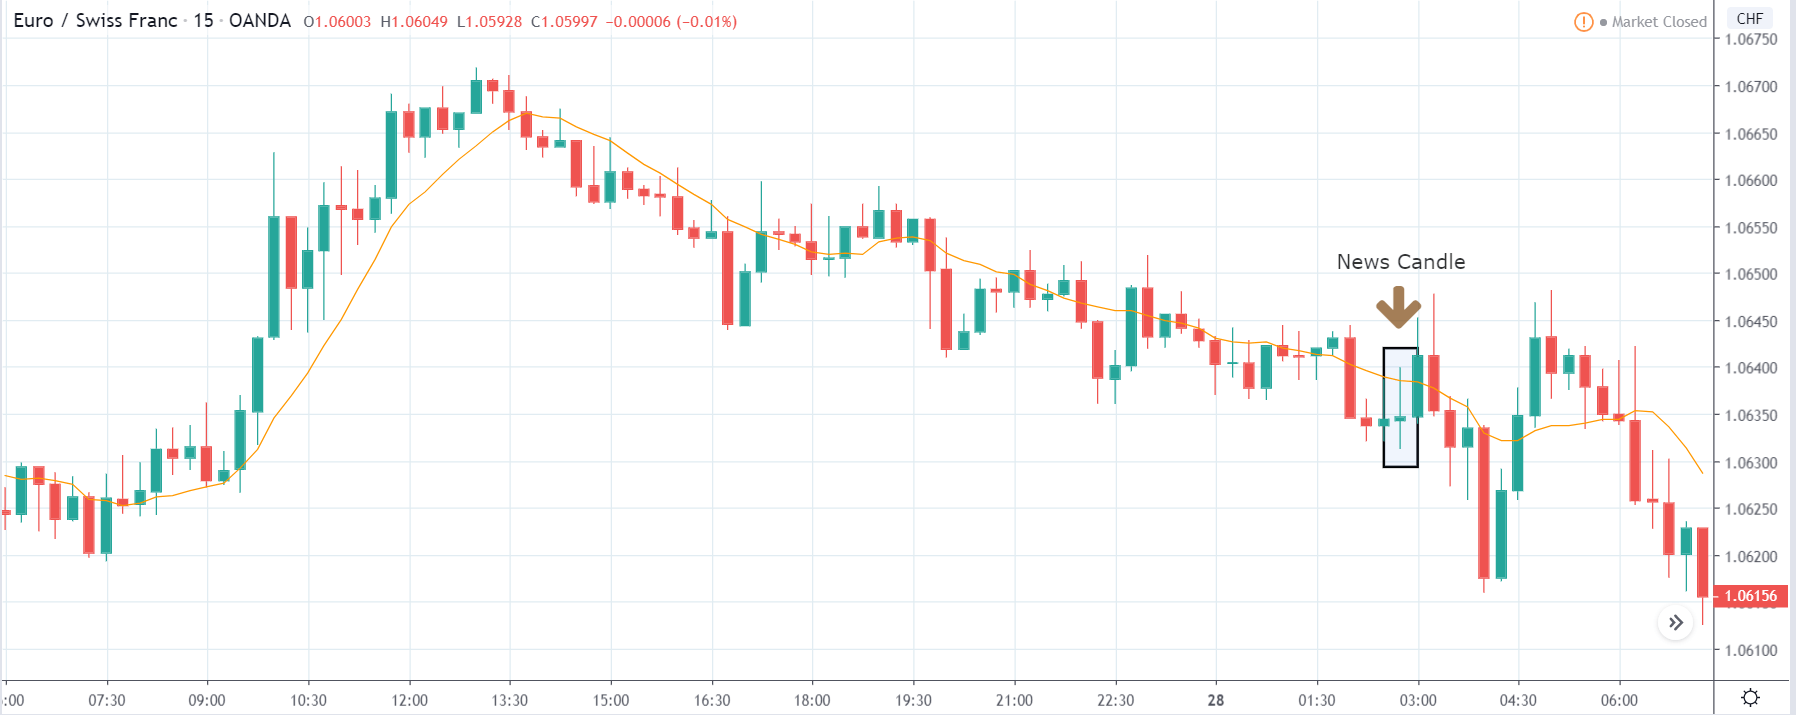
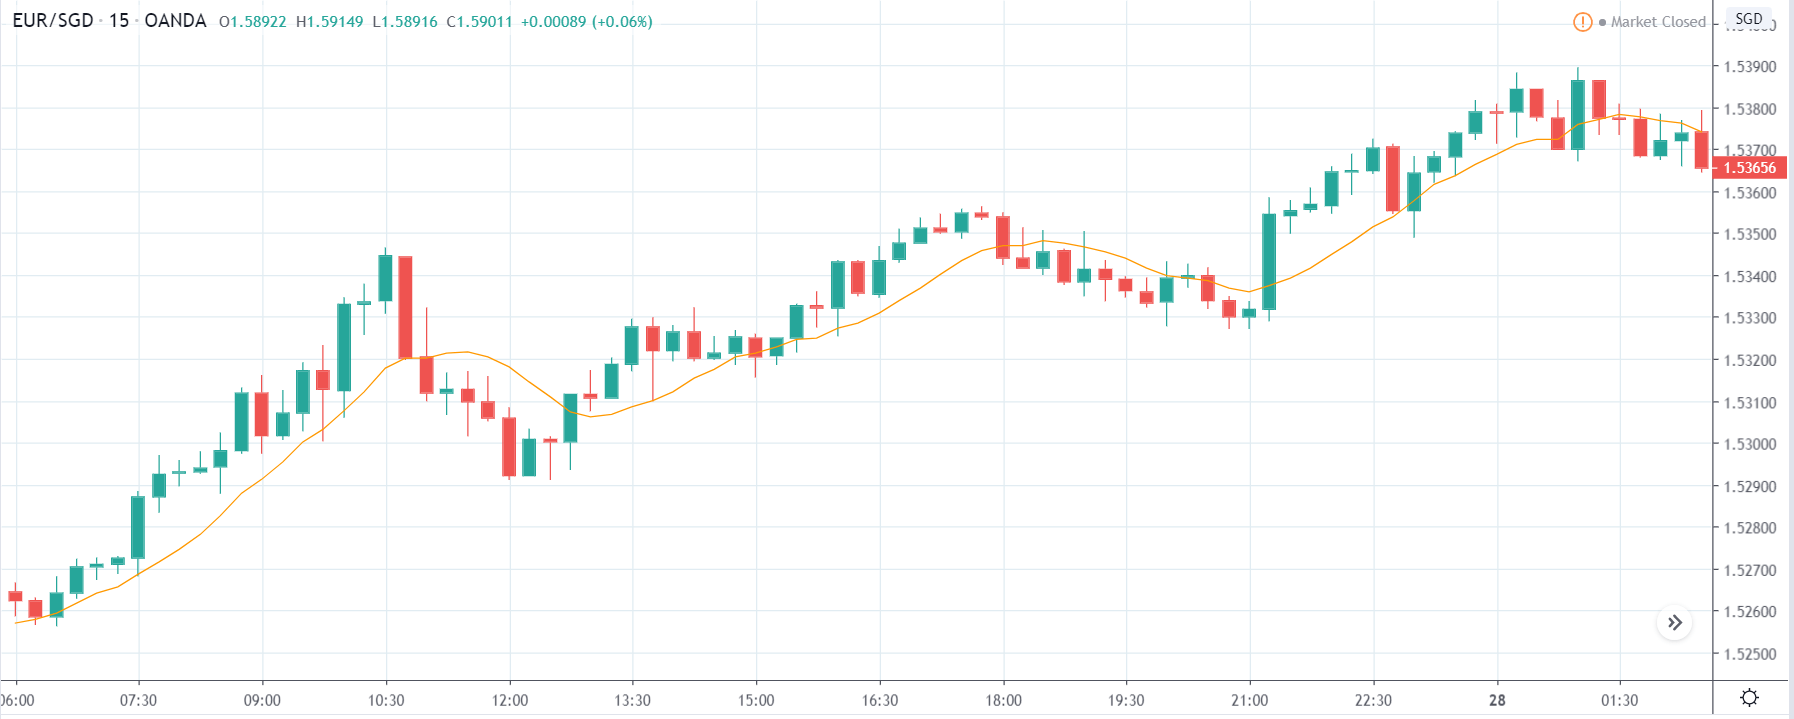
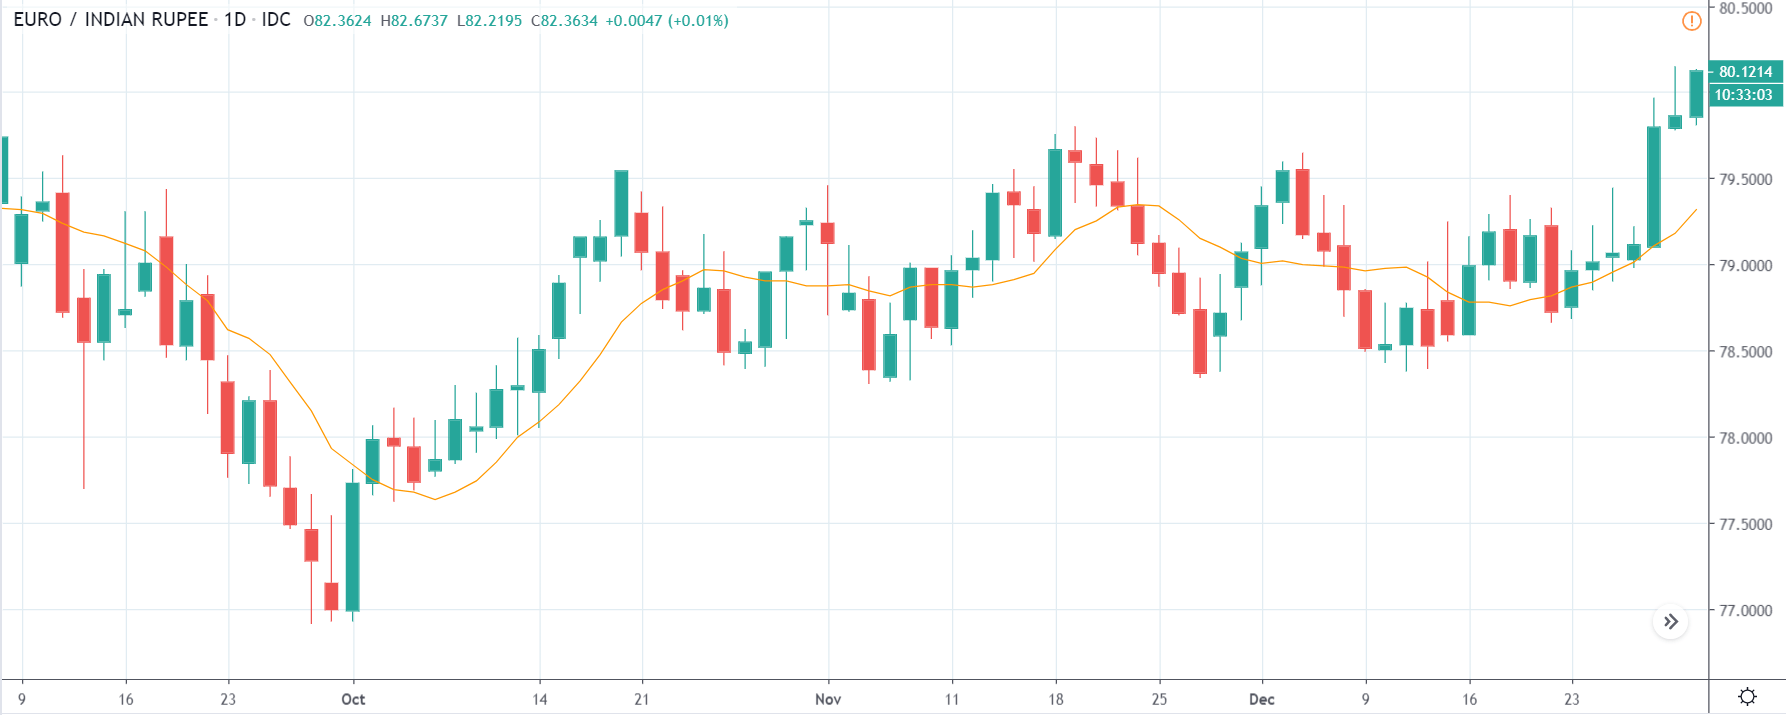
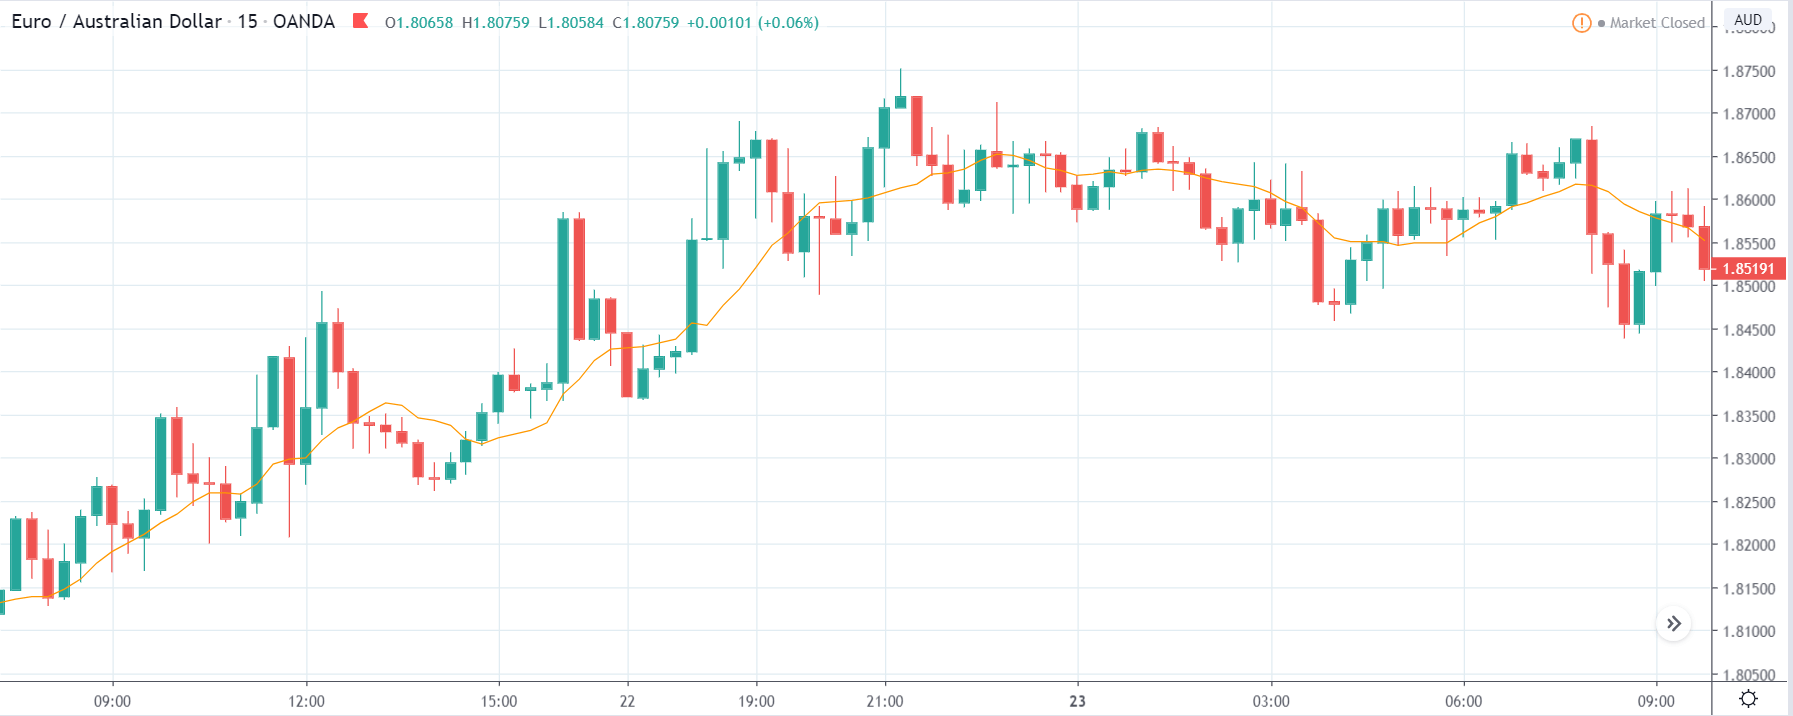
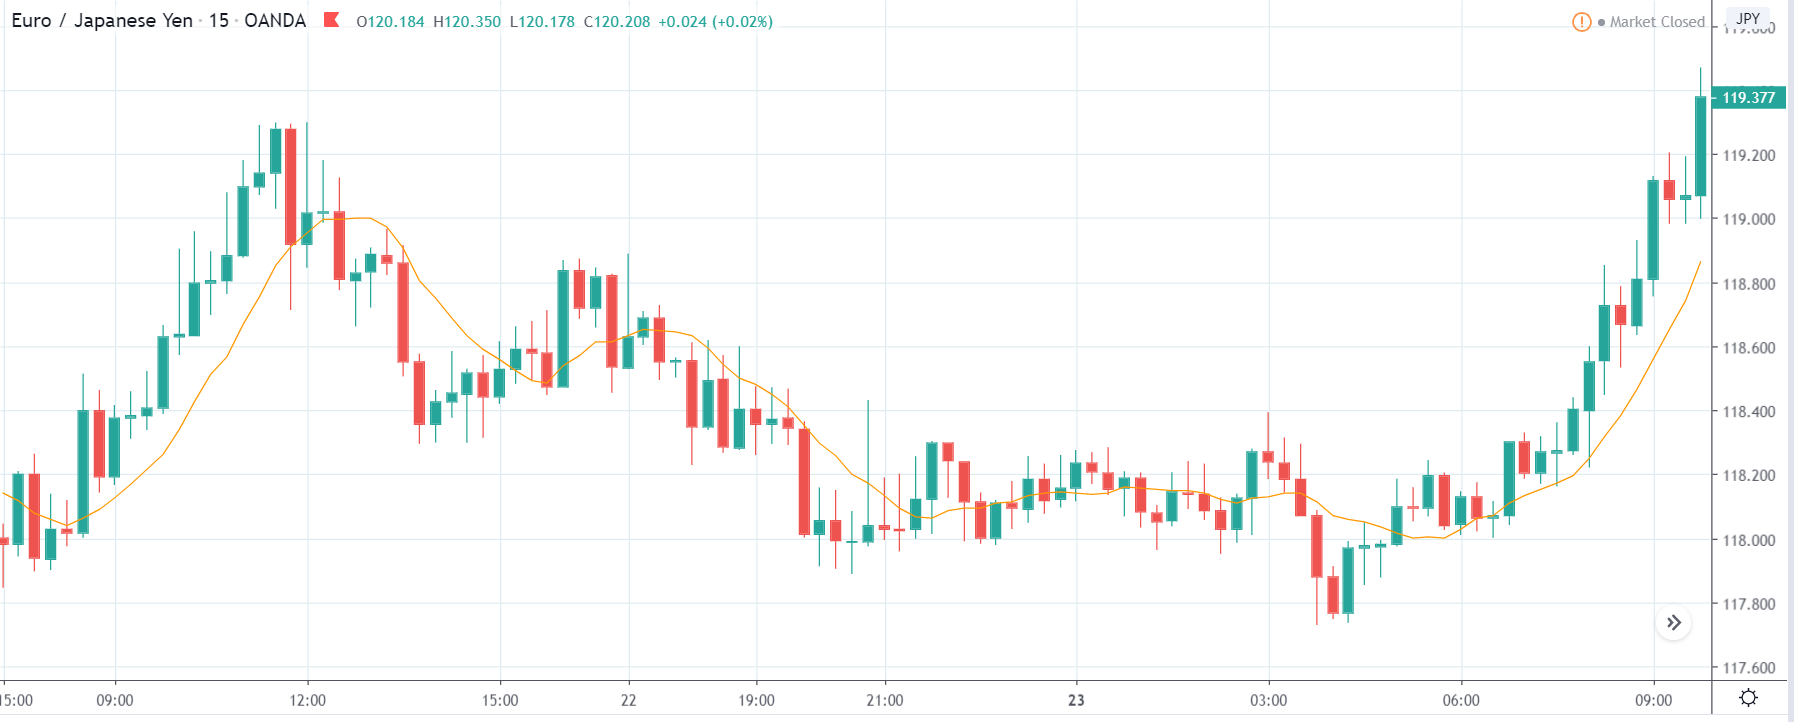
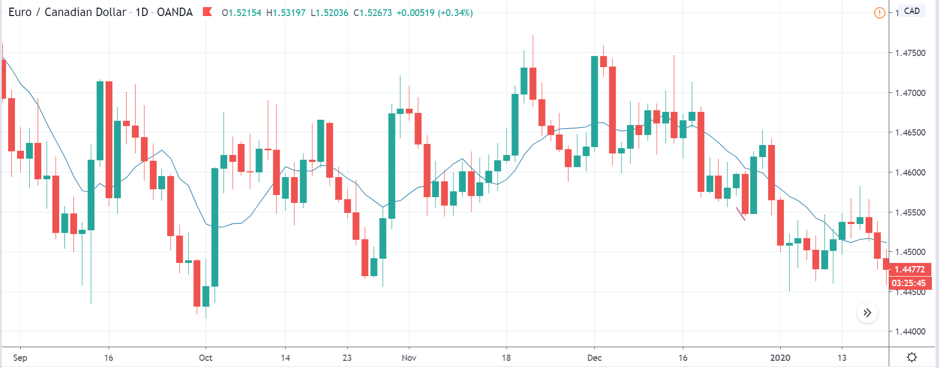
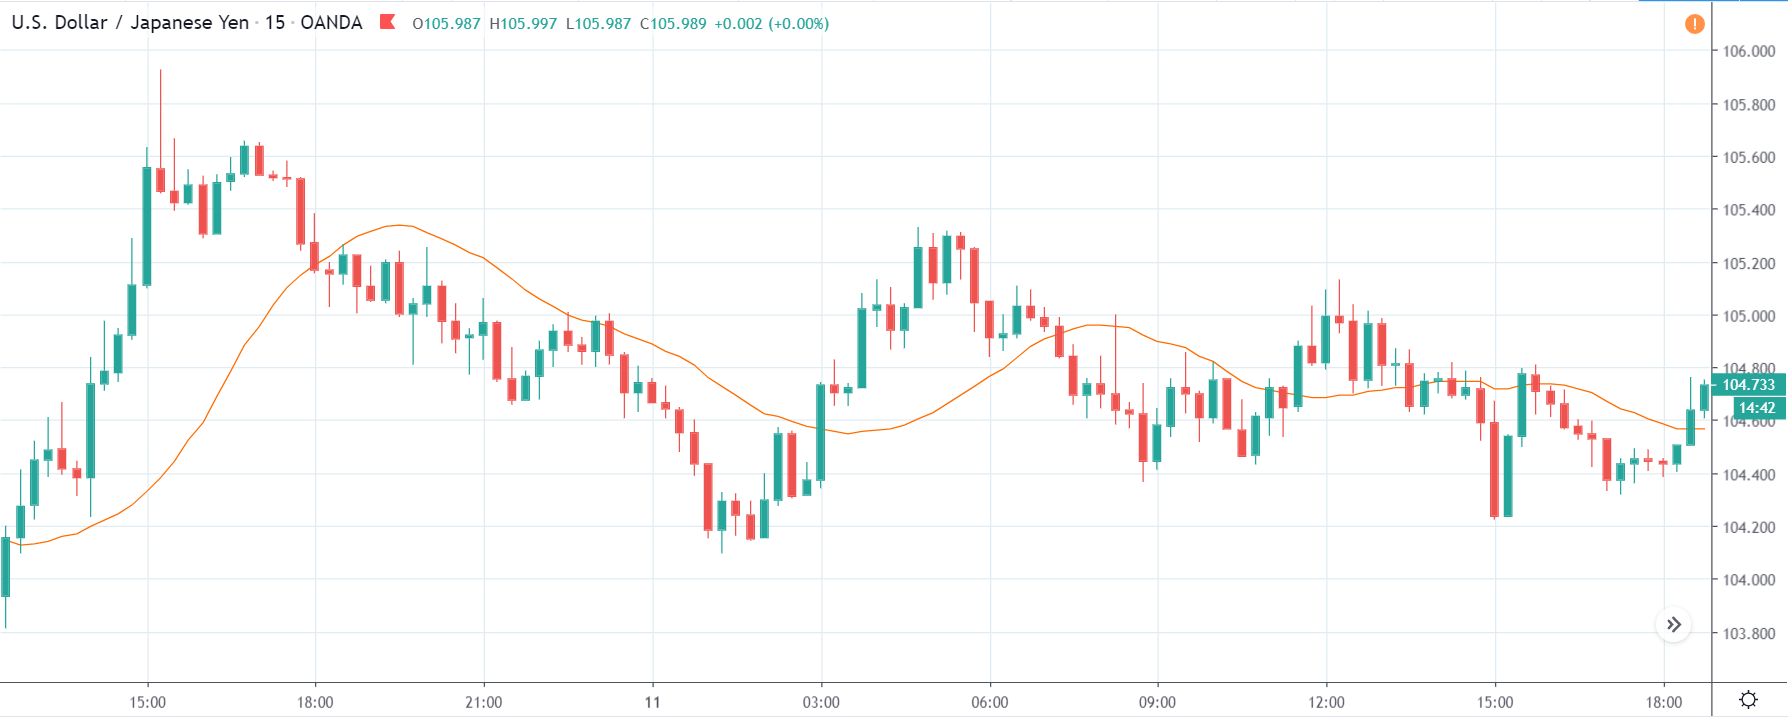
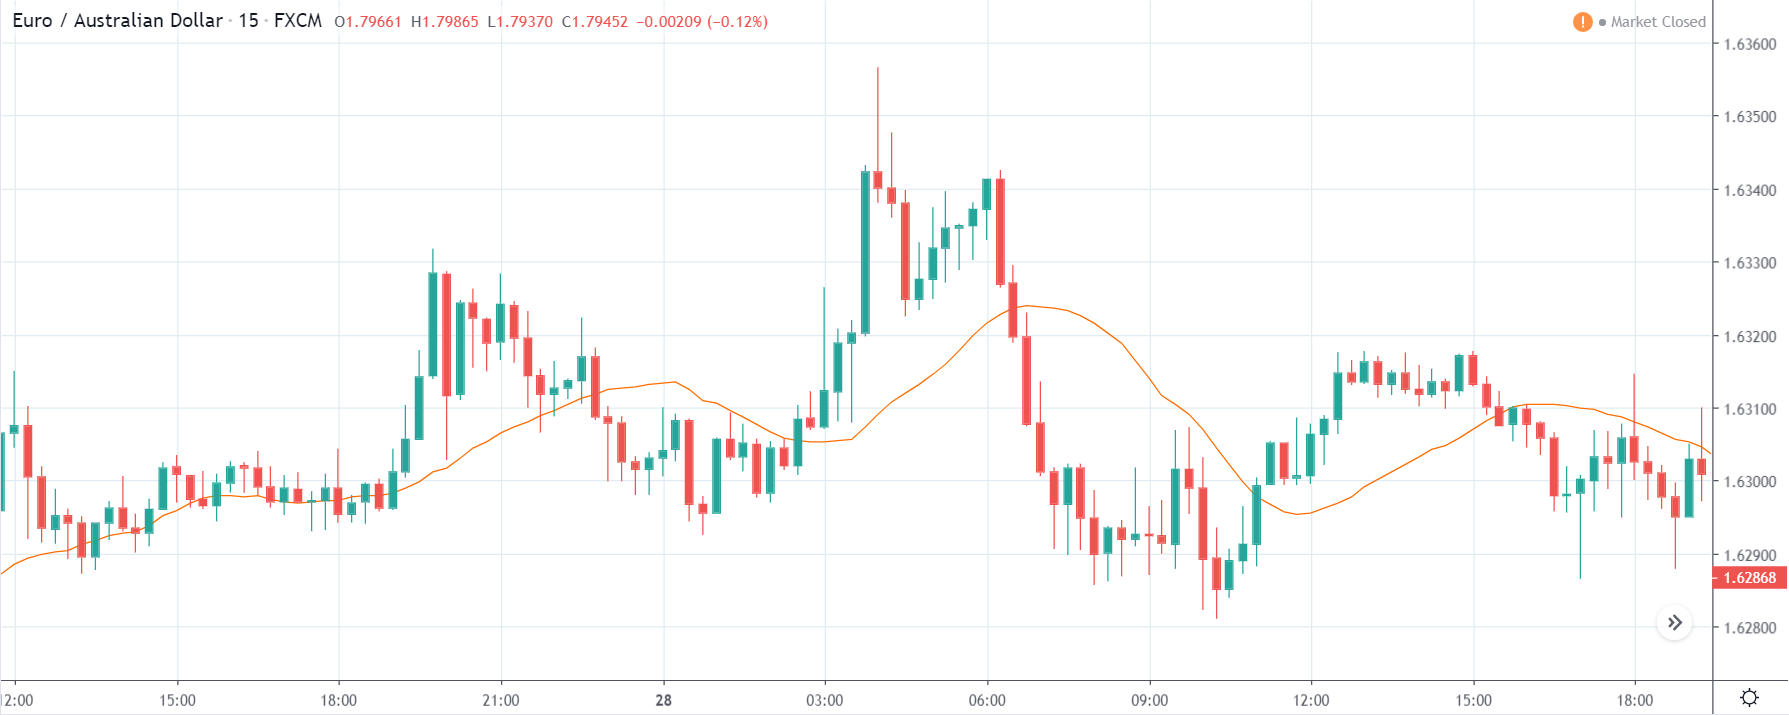
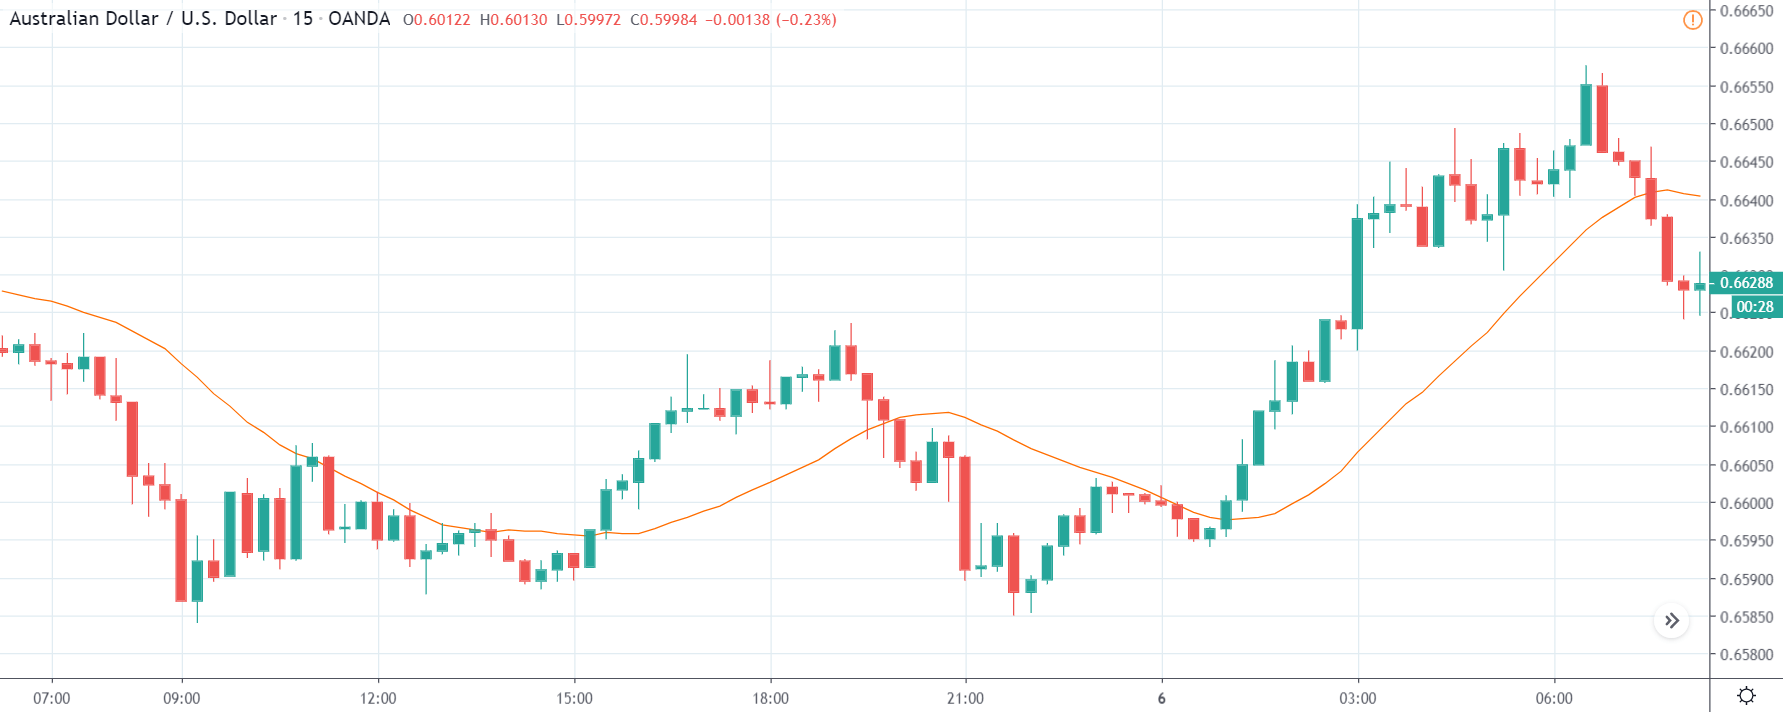
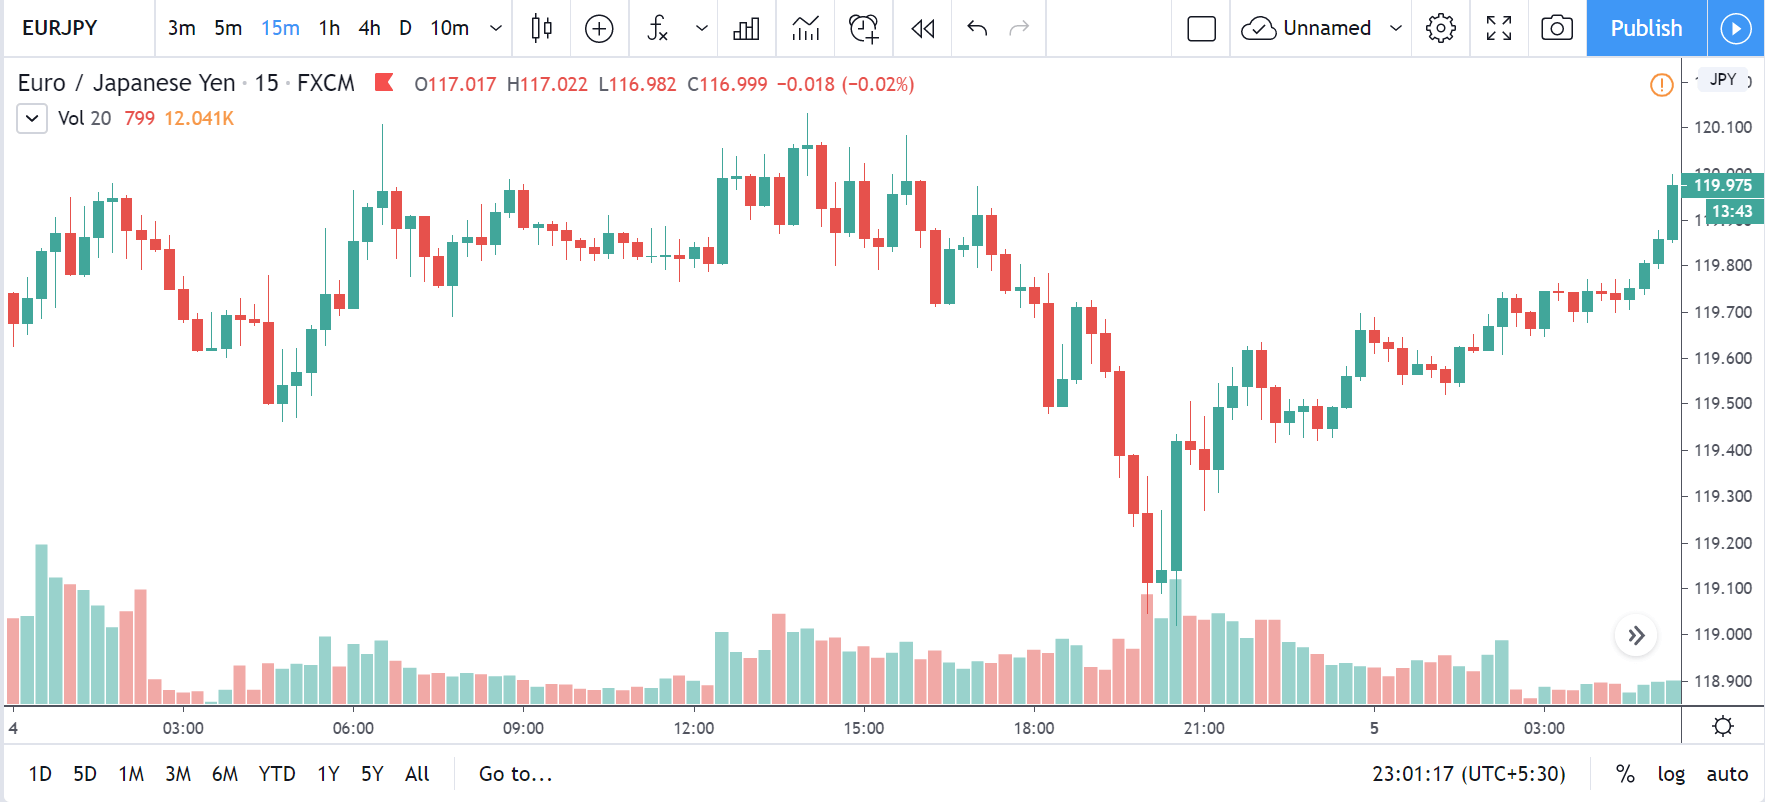
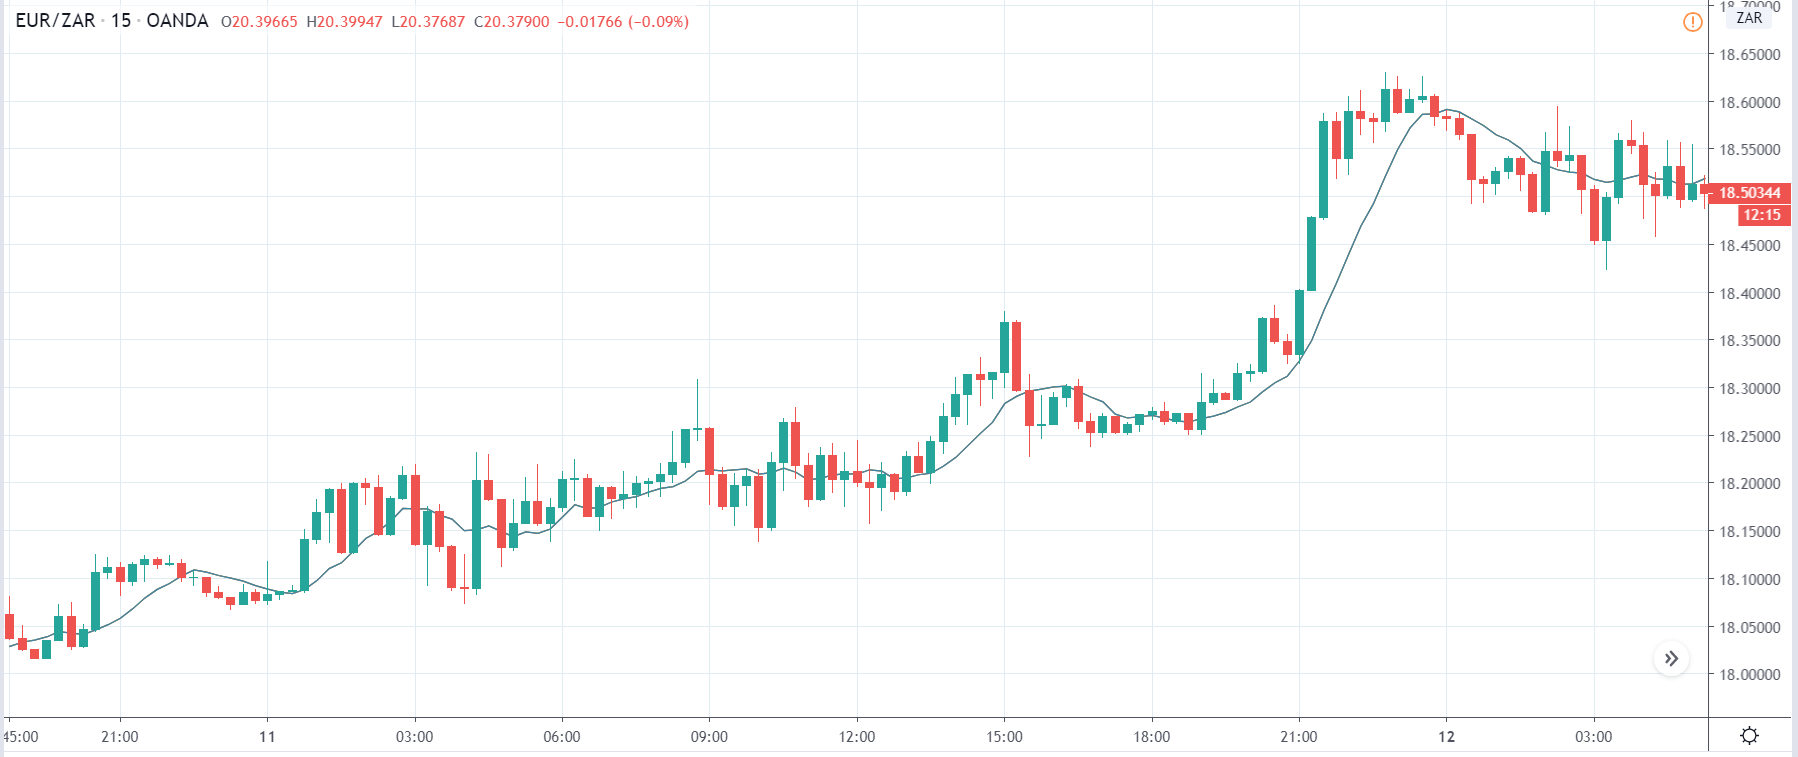
EUR/ZAR | Before the announcement:

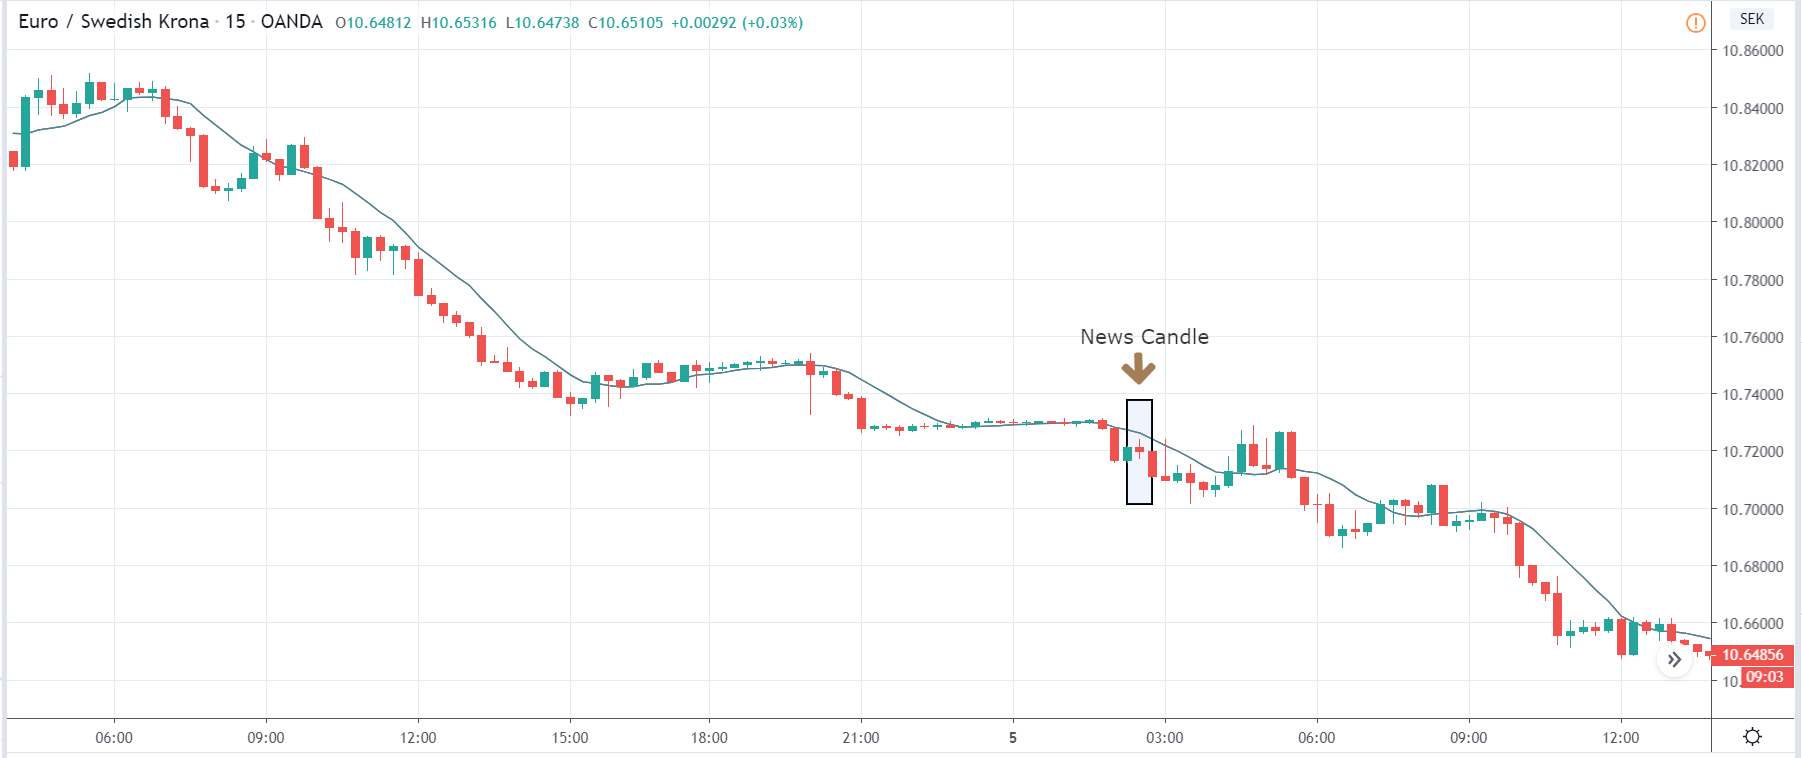
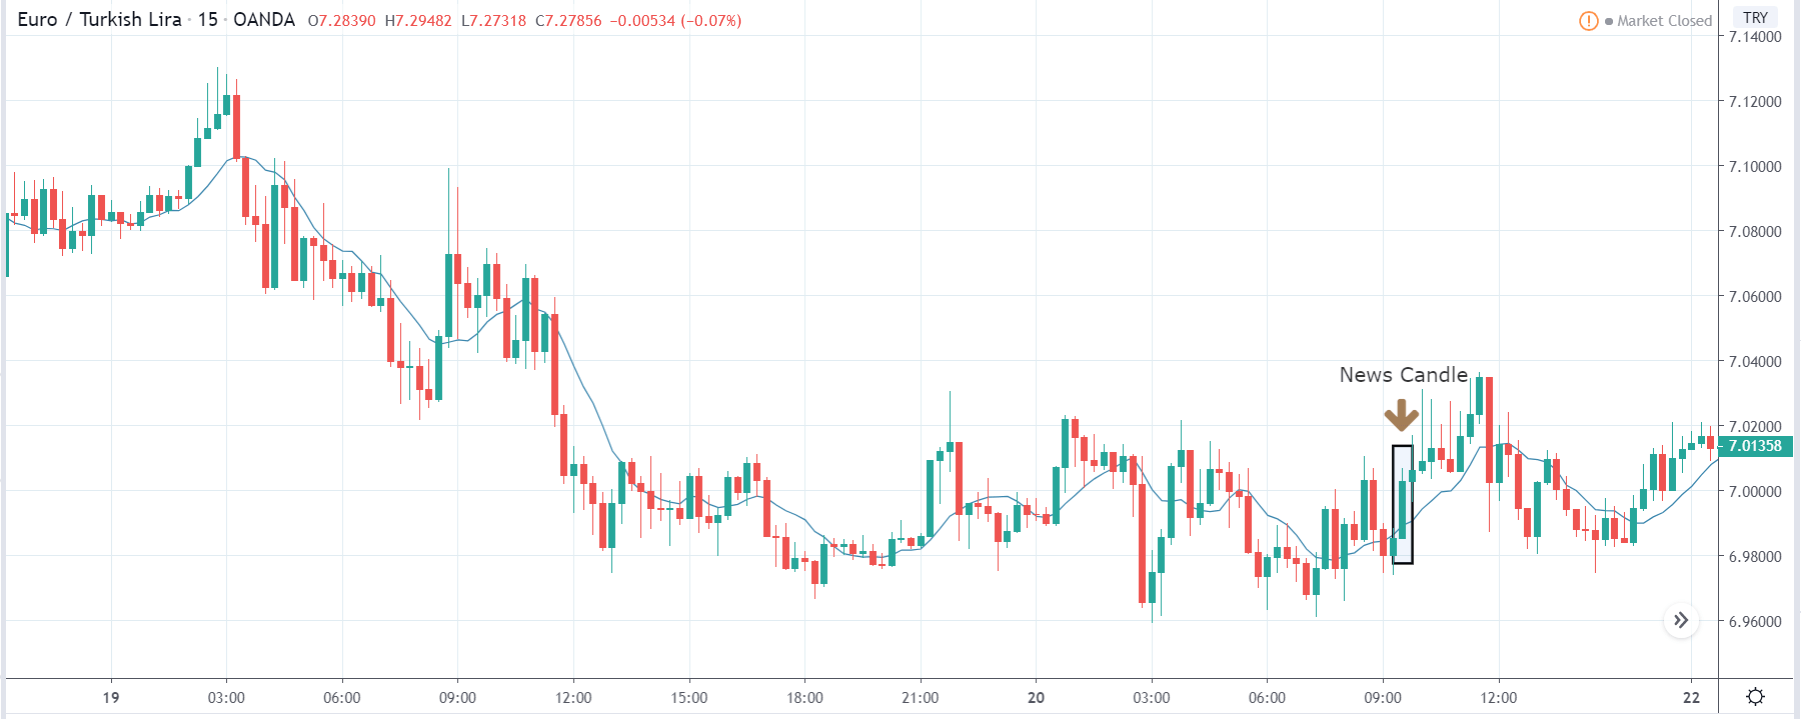
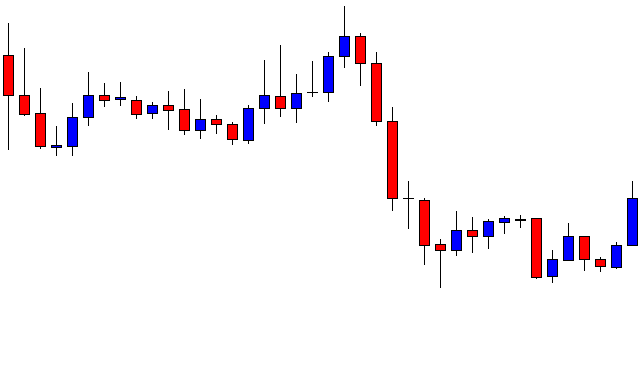
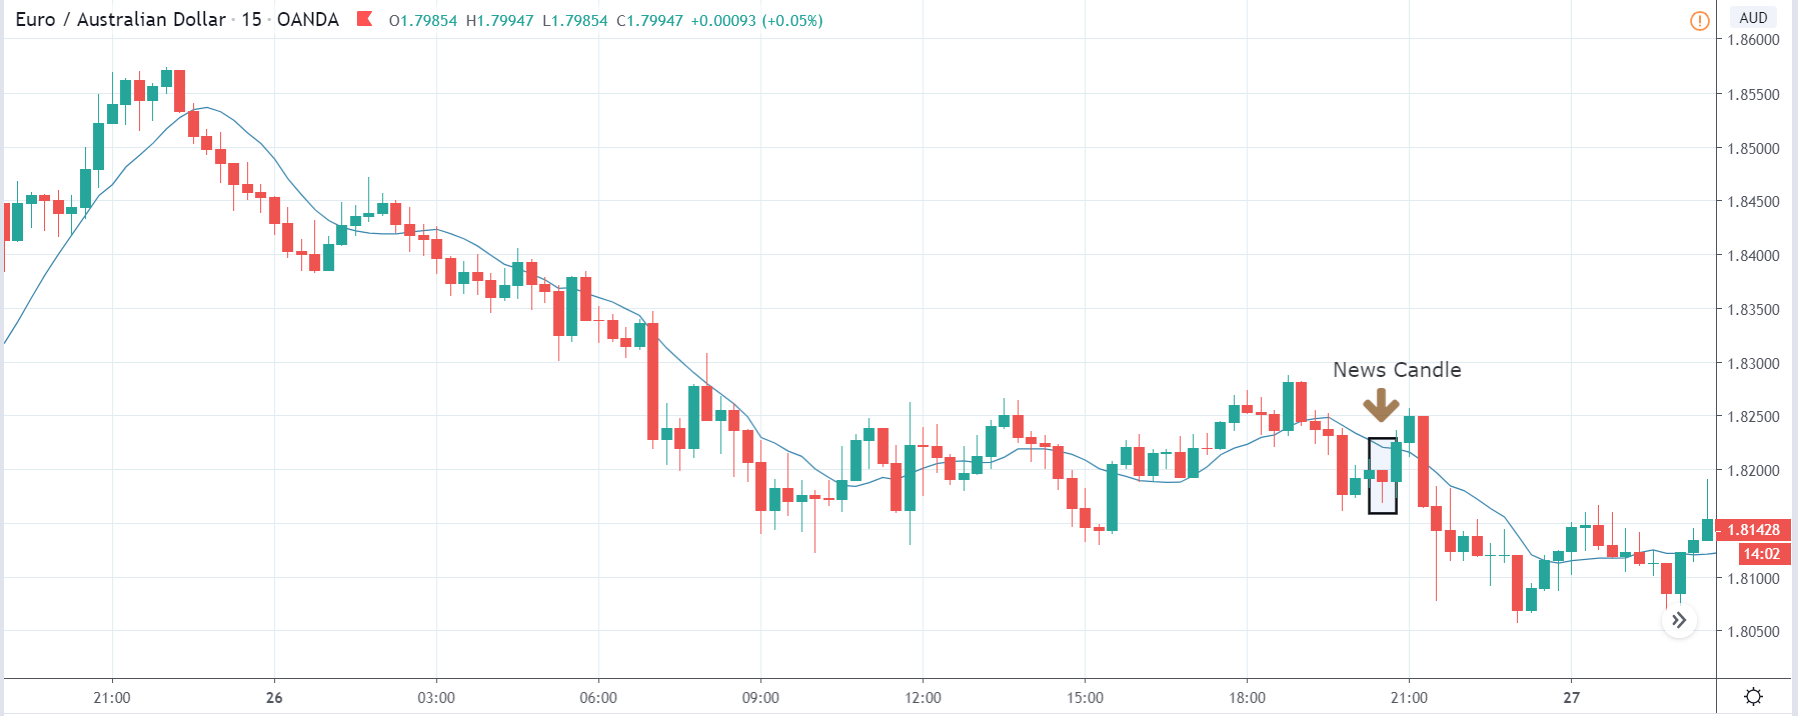
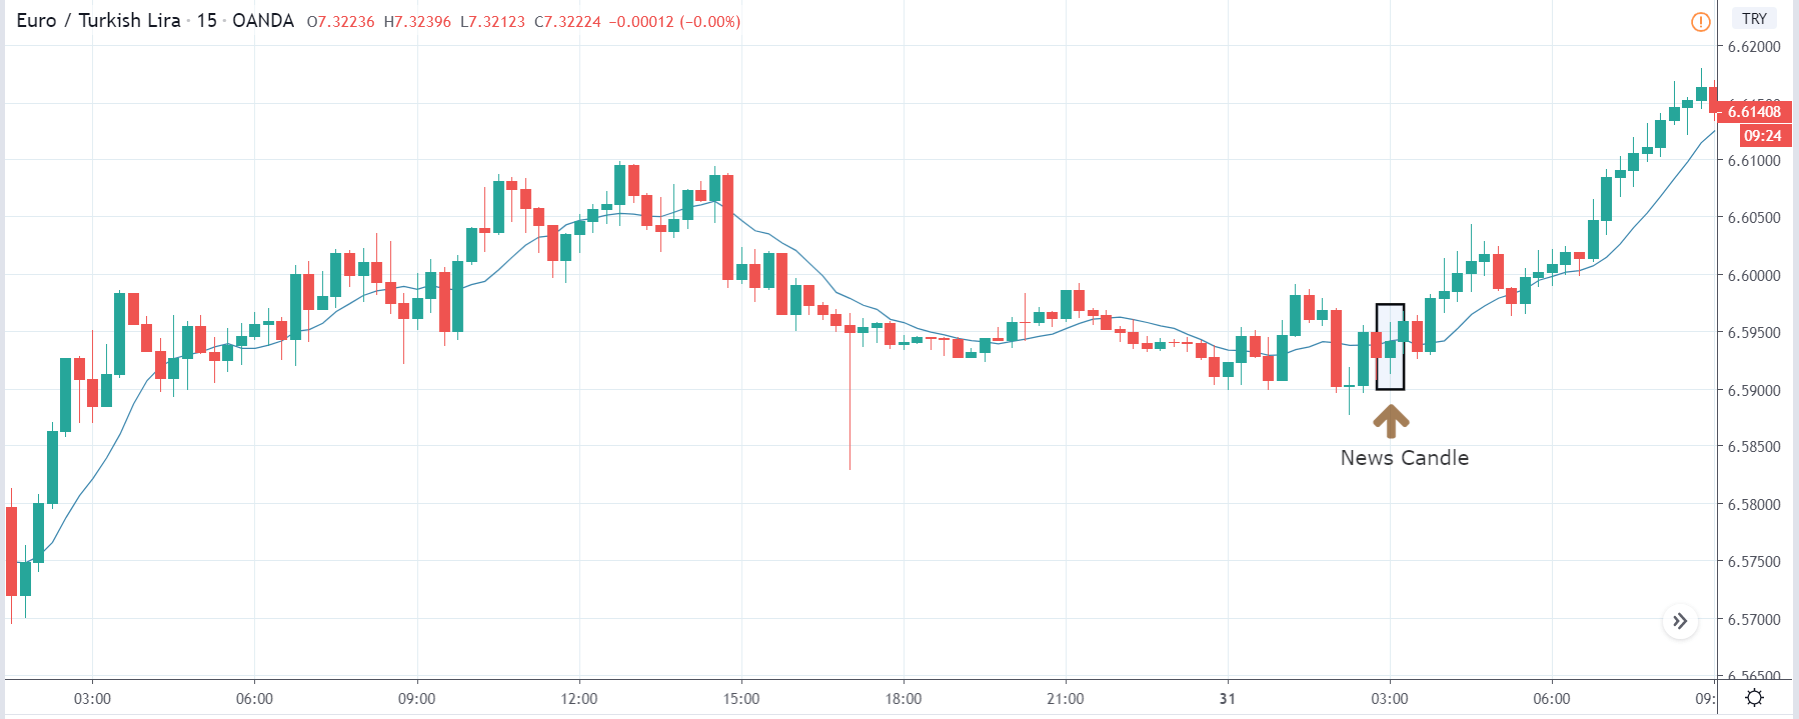
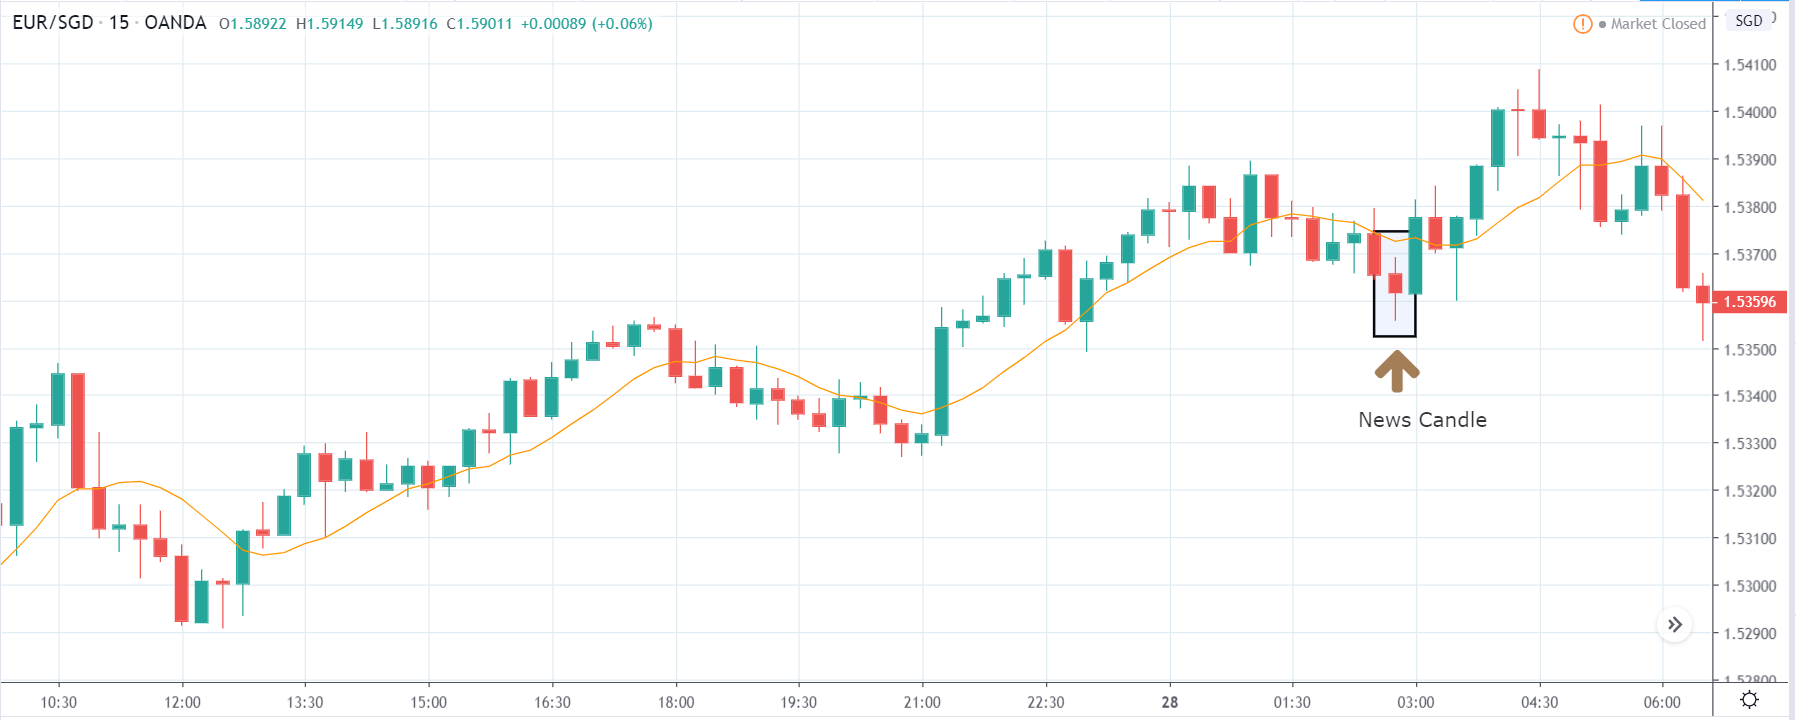
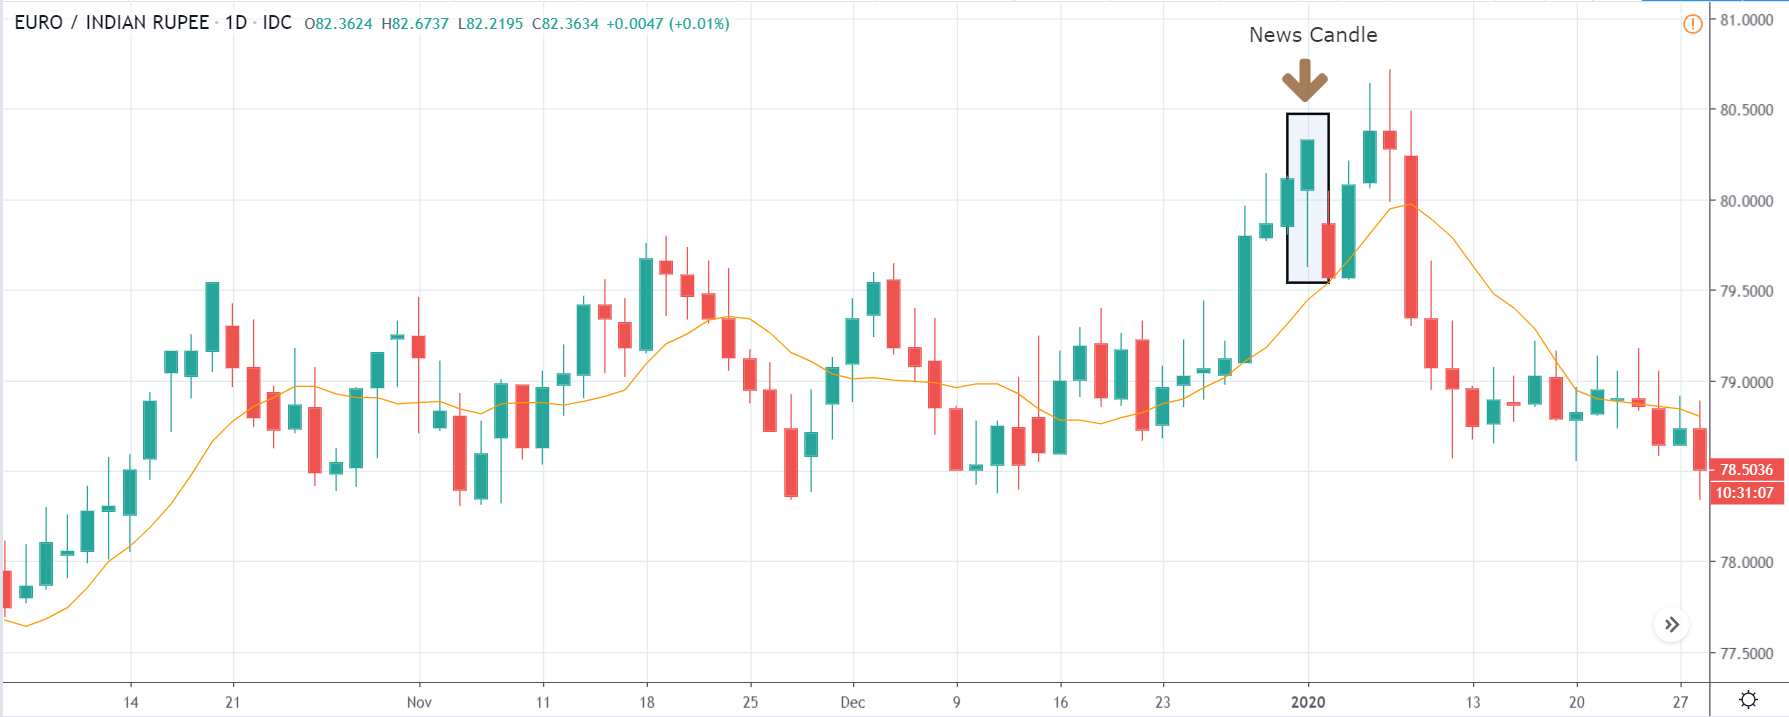
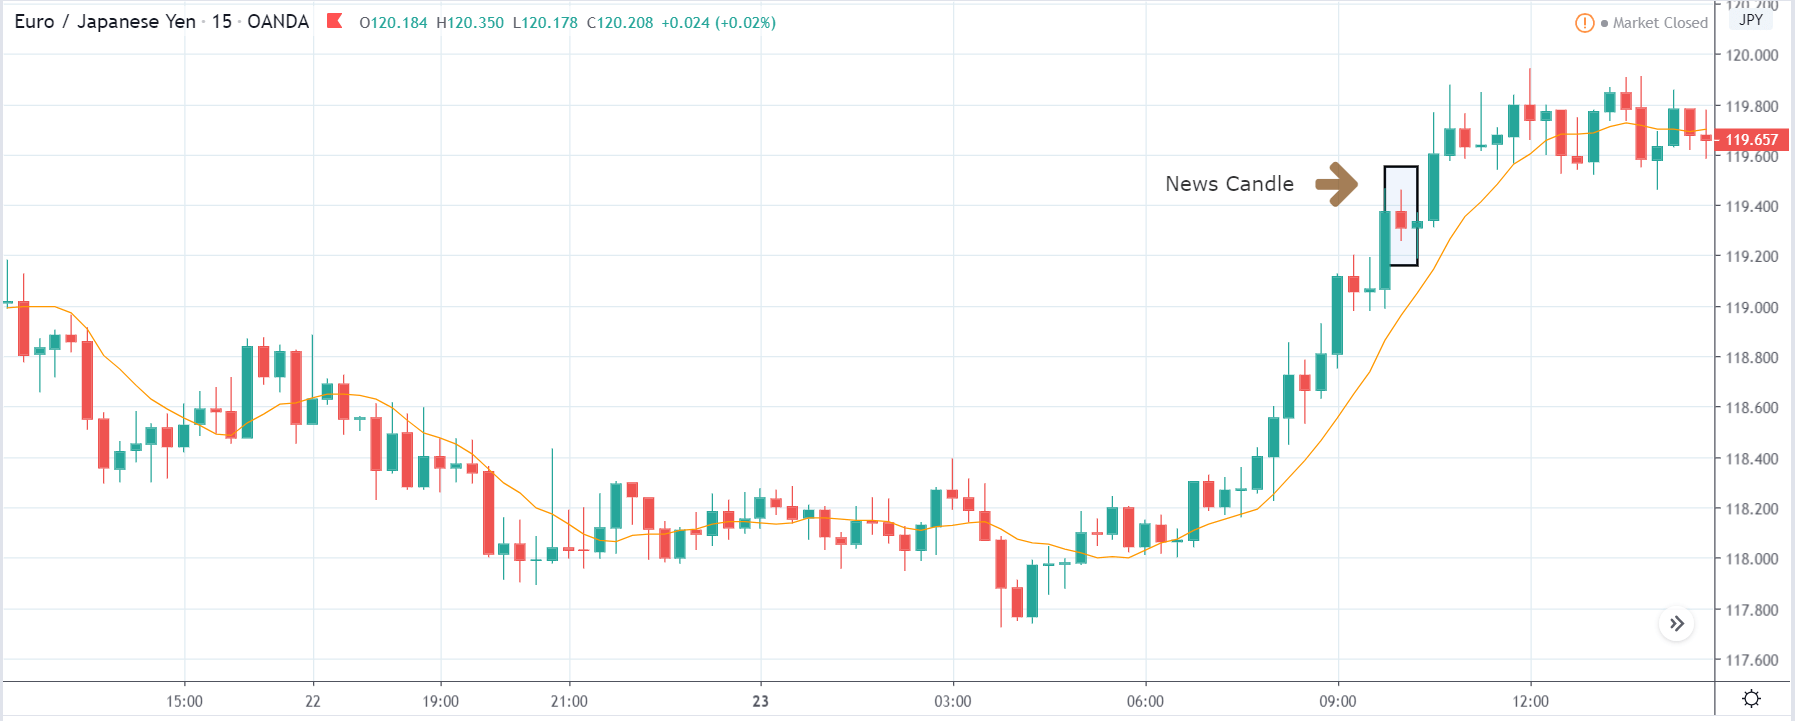
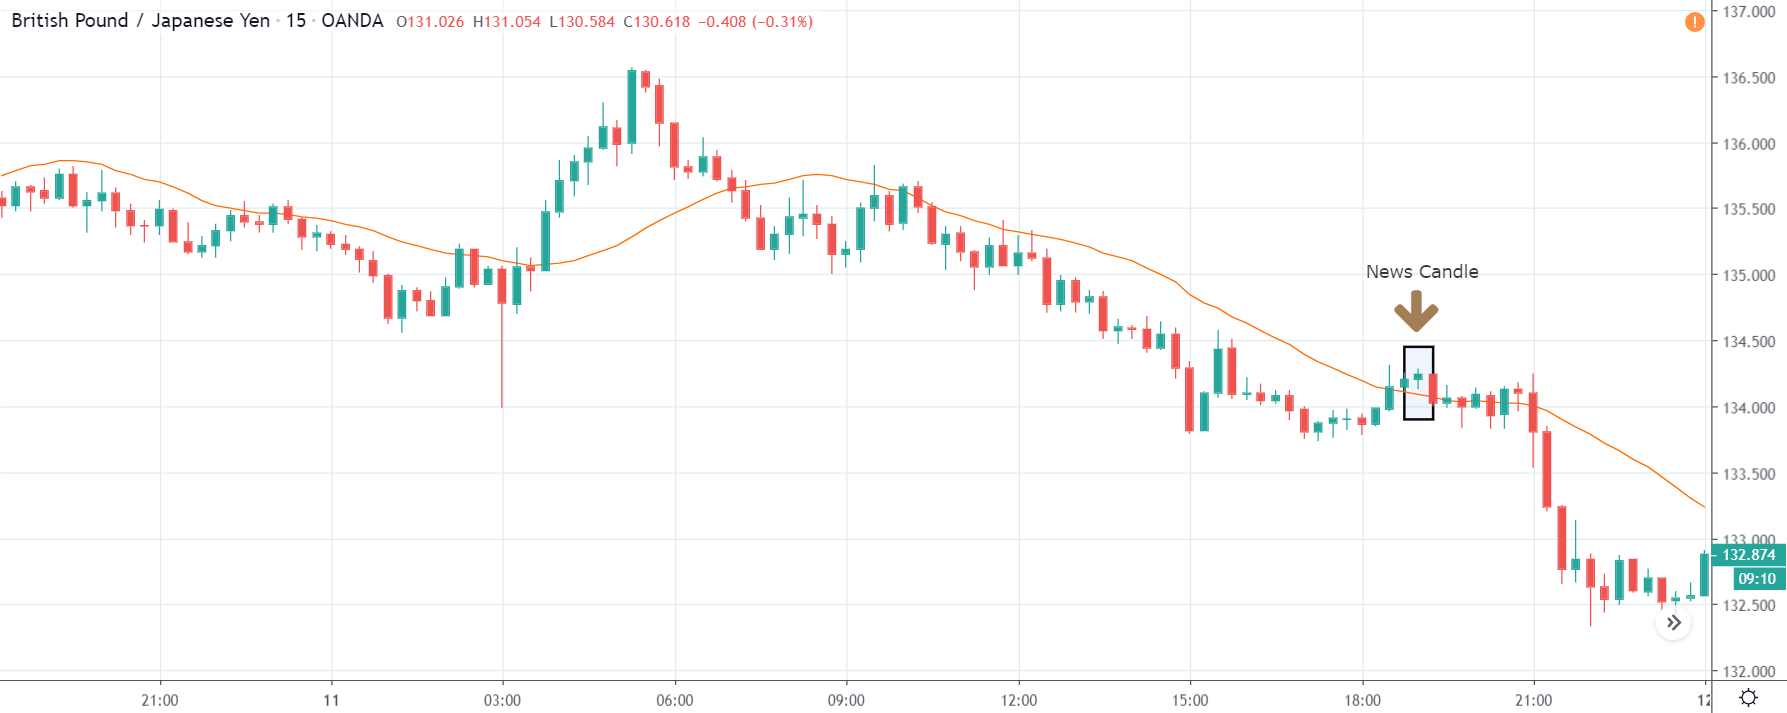
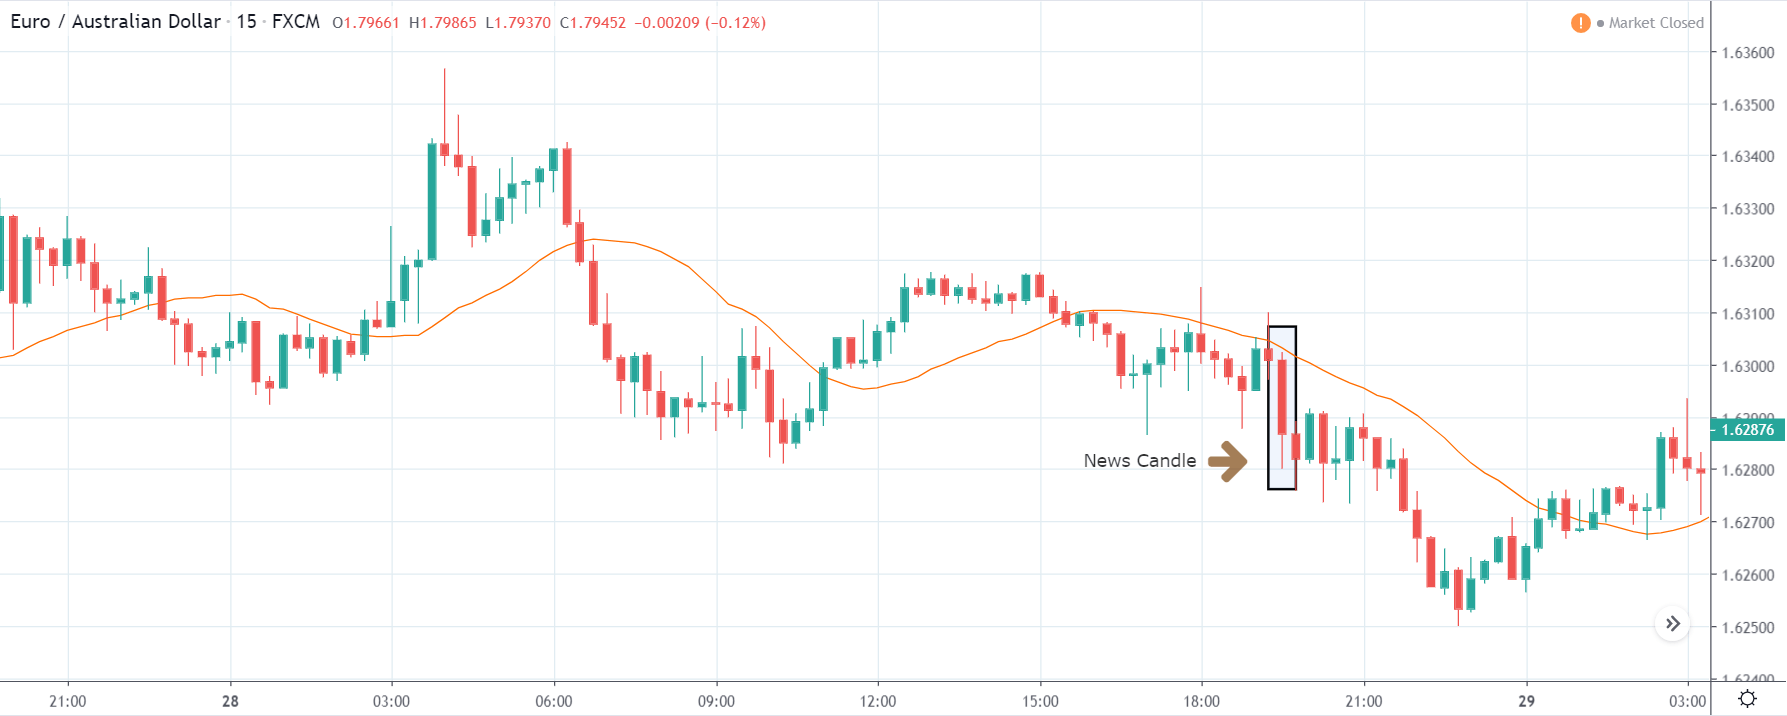
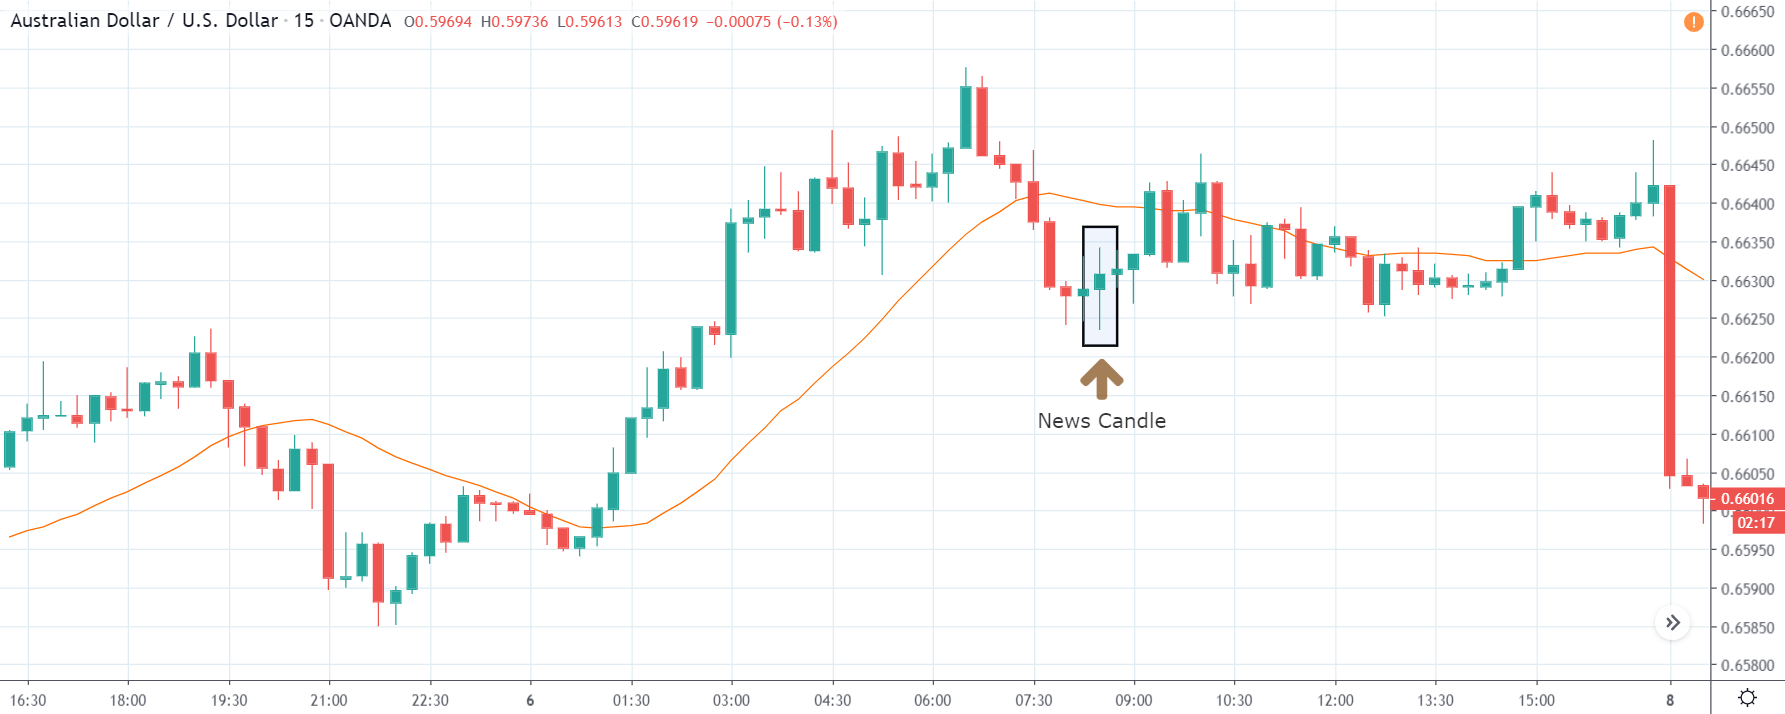
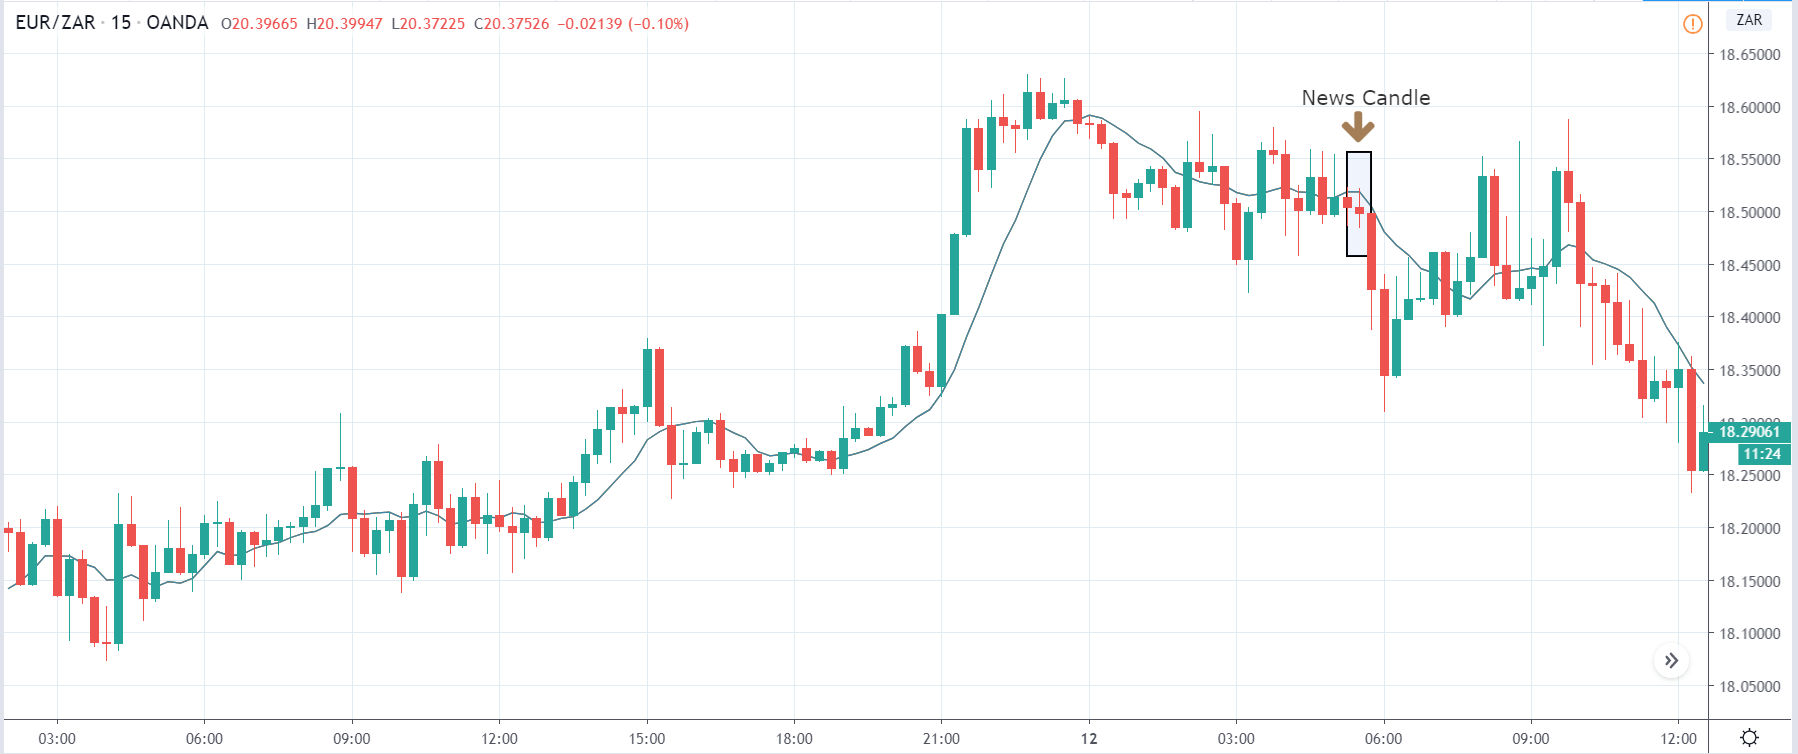
EUR/ZAR | After the announcement:

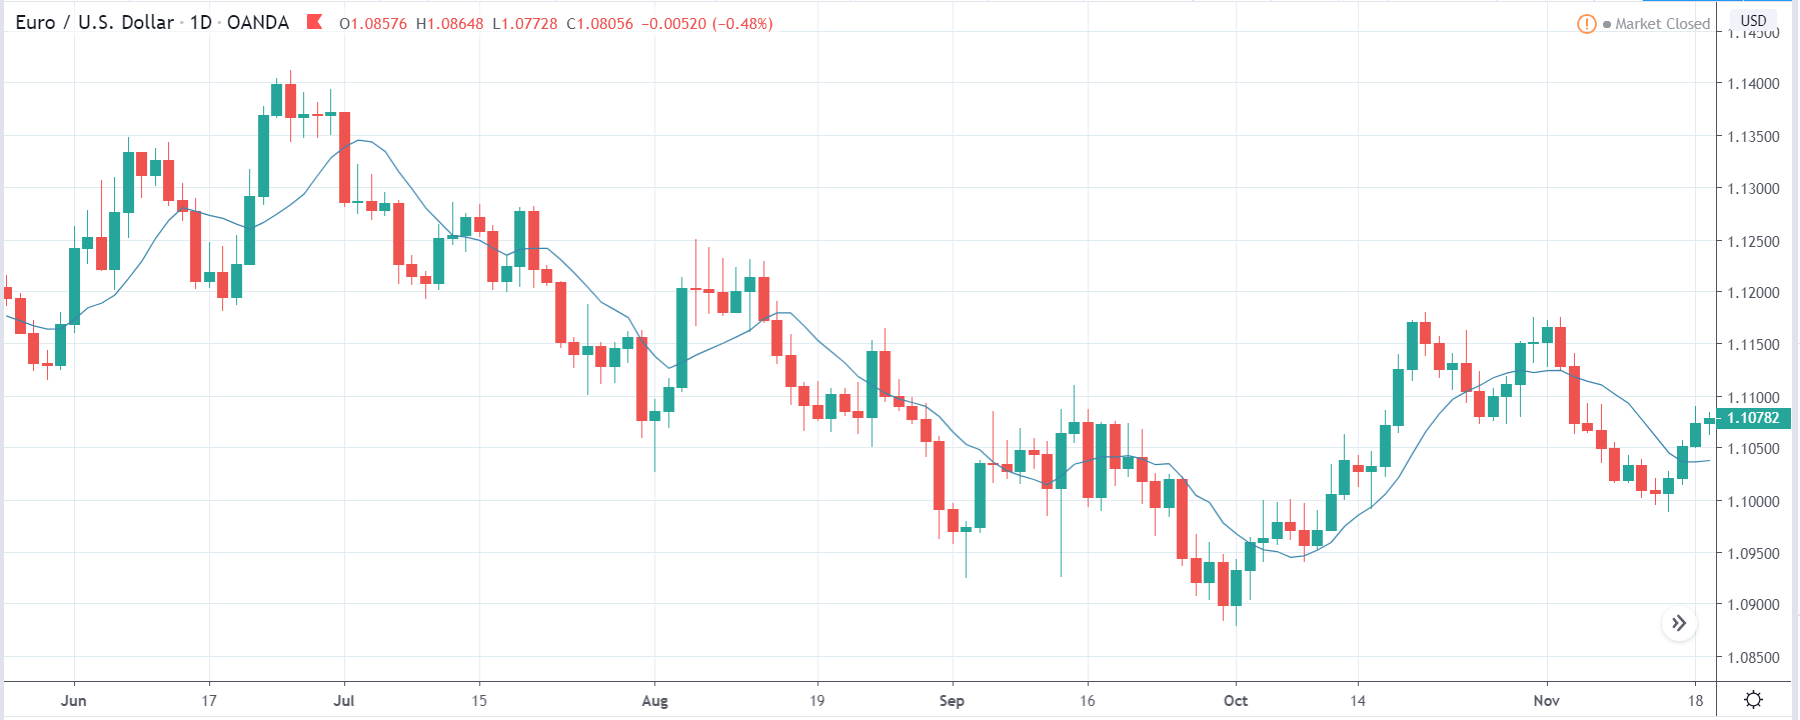
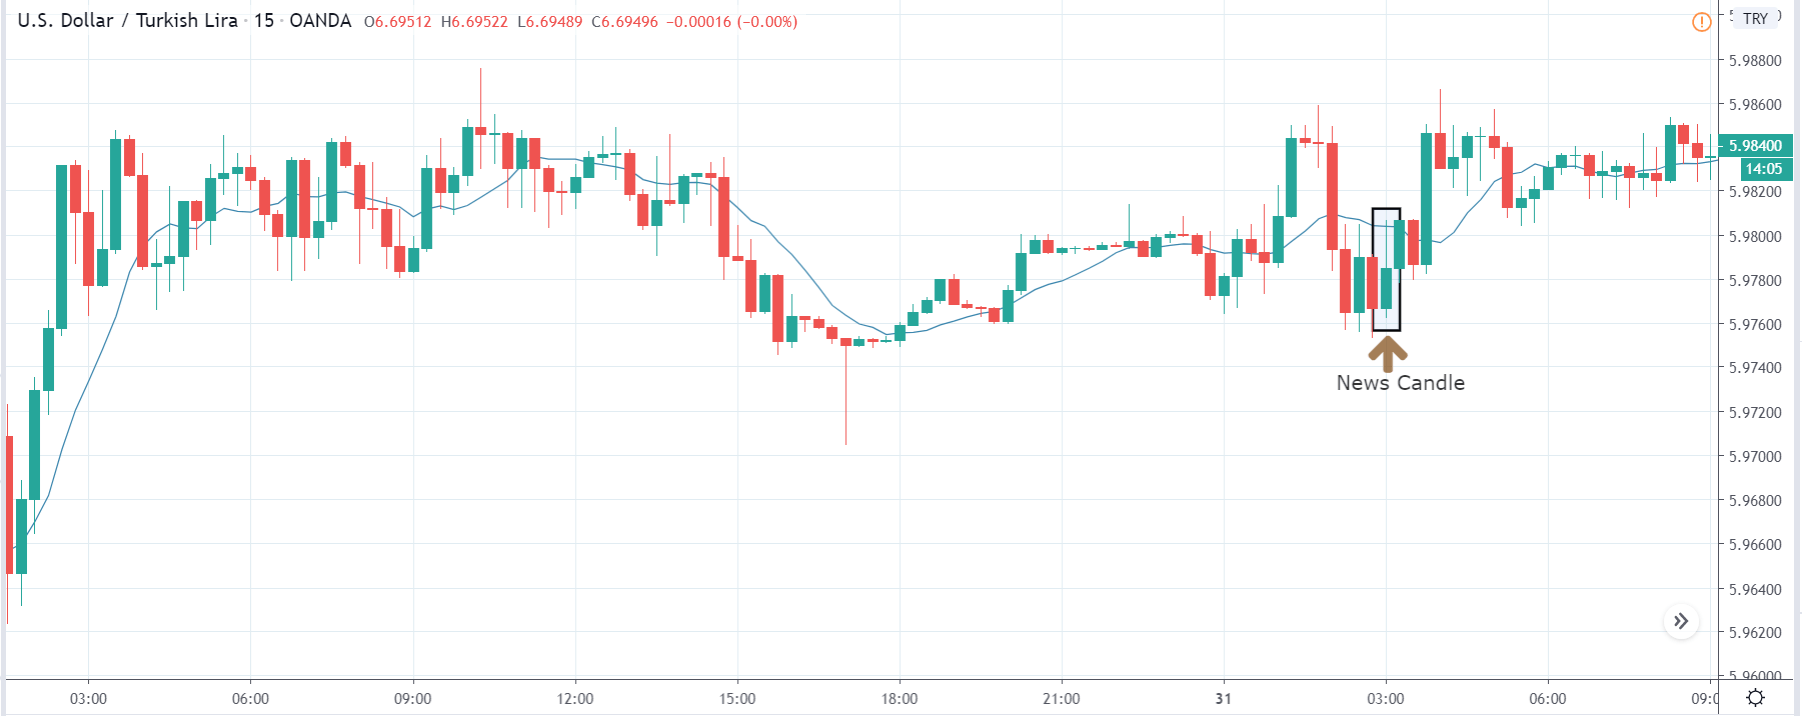
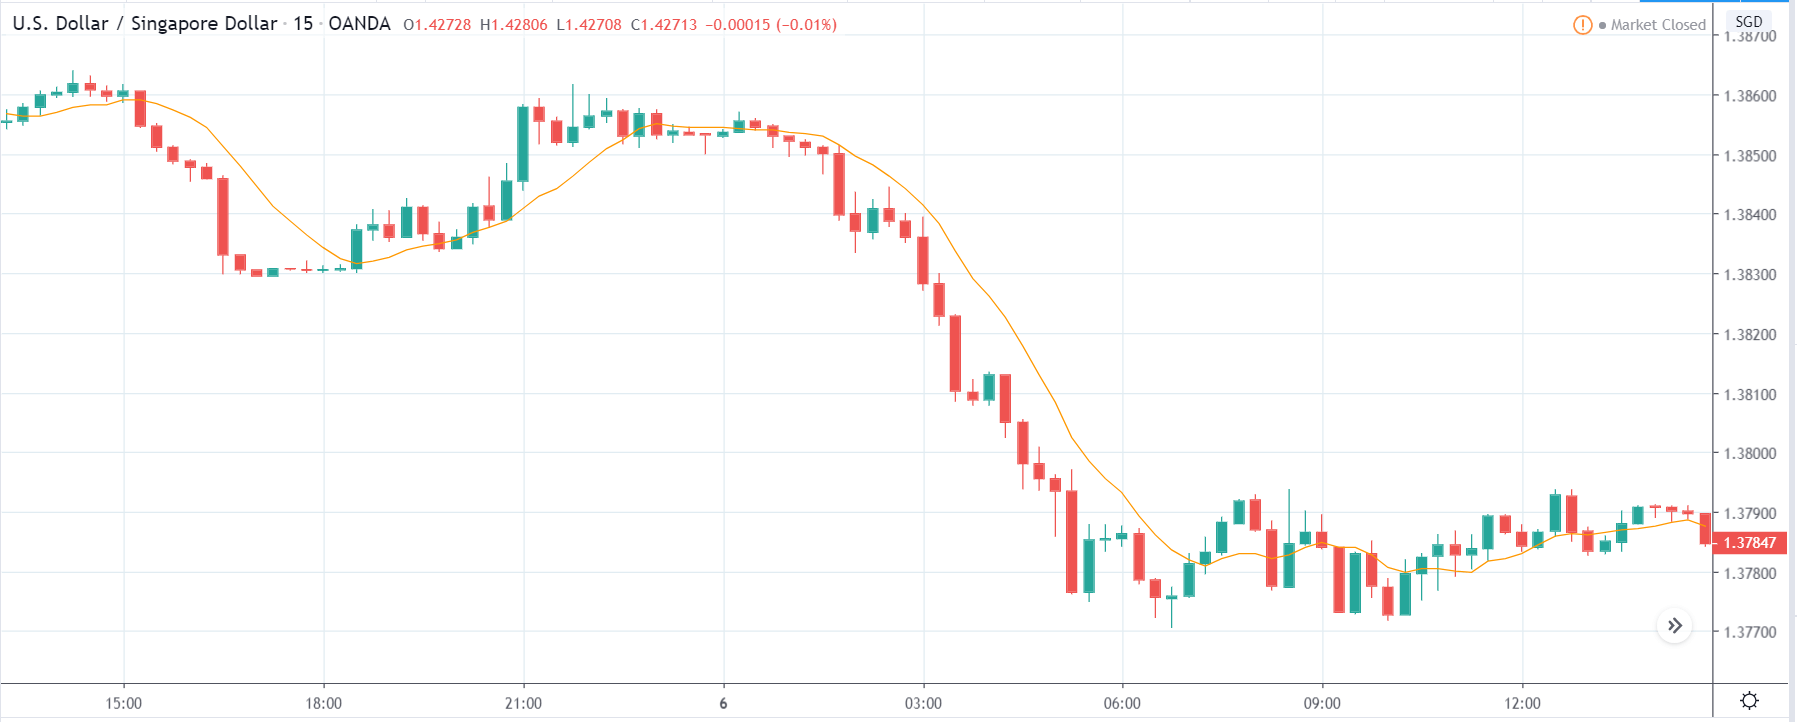
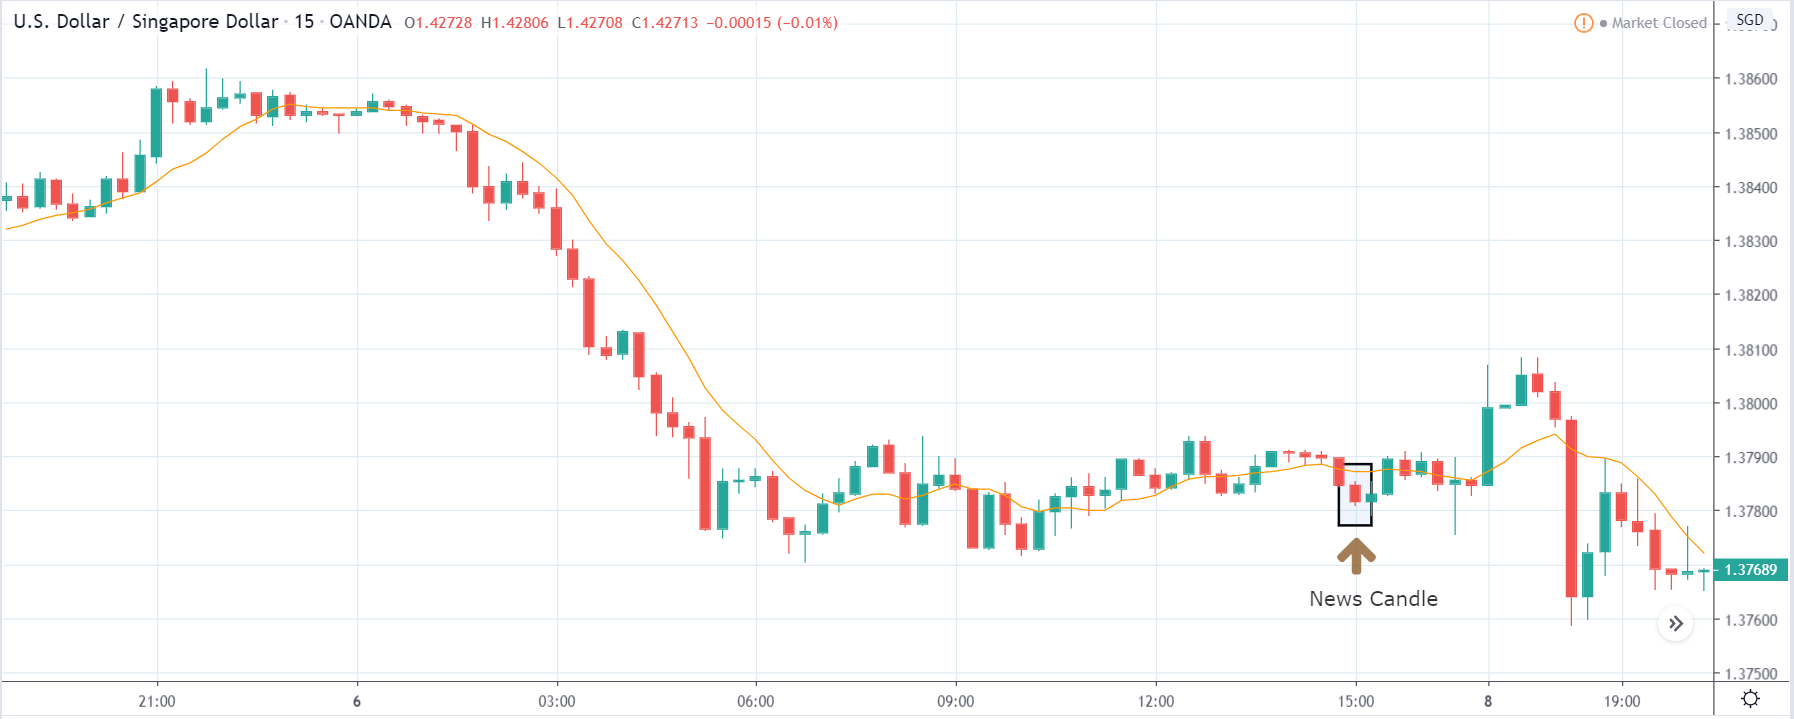
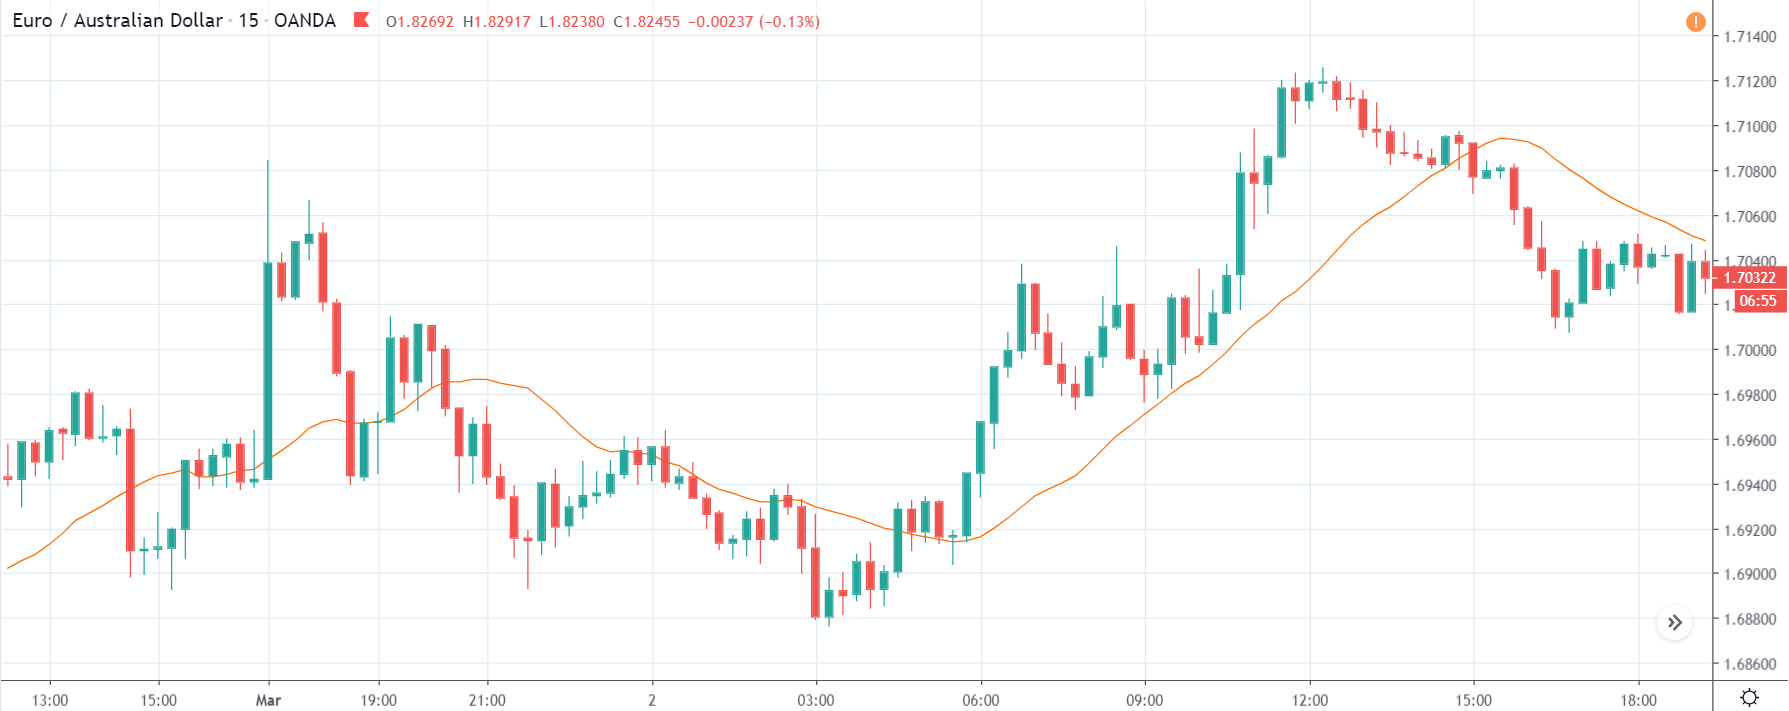
The above images are that of EUR/ZAR currency pair, where we see that the market is in an uptrend, and recently the price is within a ‘range.’ Here as well, the South African Rand is showing weakness with no signs of strength at all. Technically, we will be looking to buy the currency pair once the price ‘pullbacks’ to a key ‘support’ or ‘demand’ area.

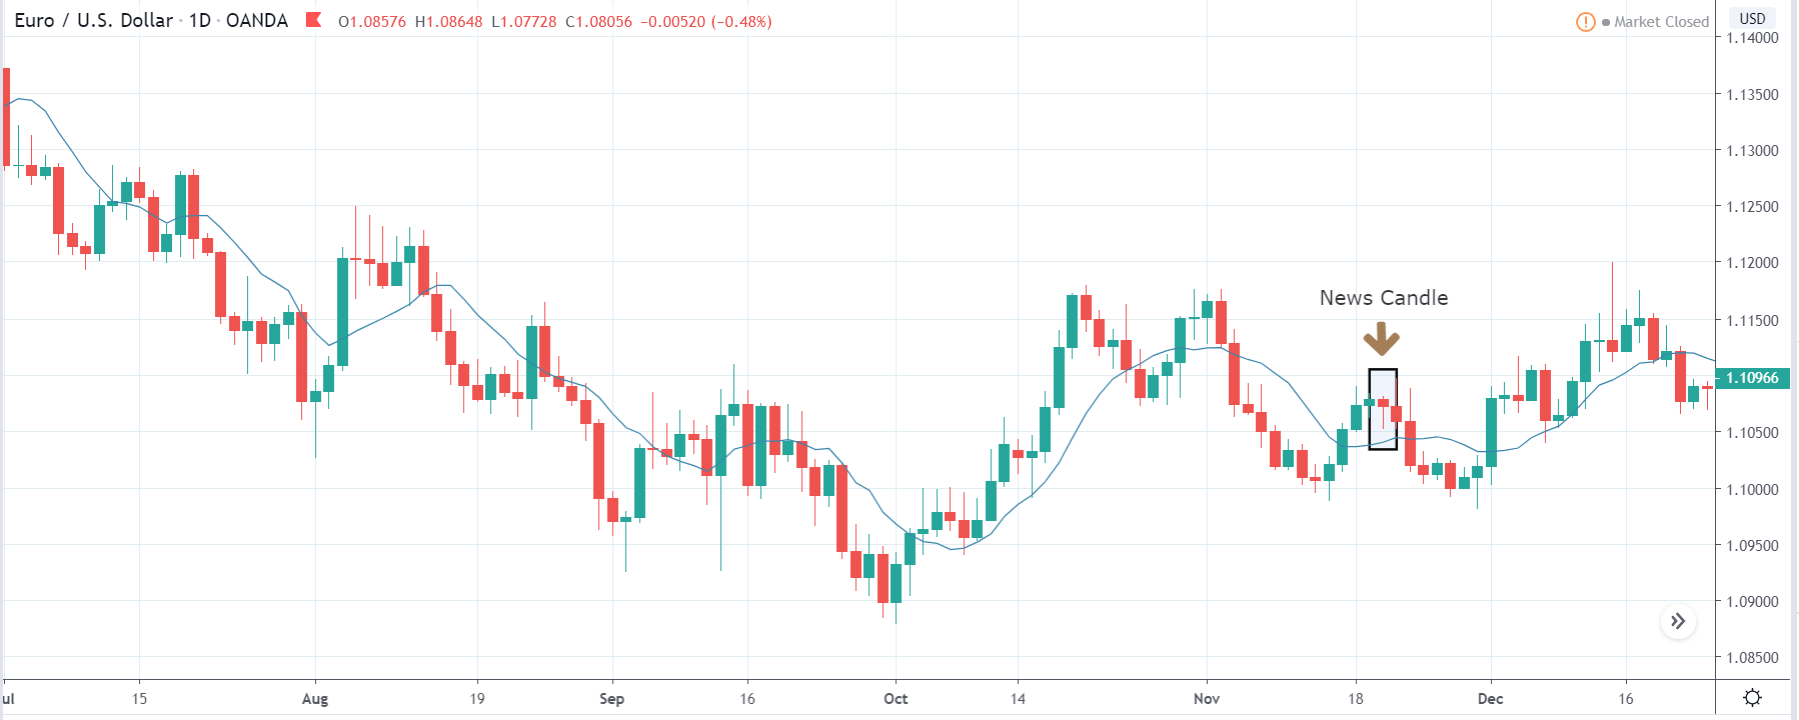
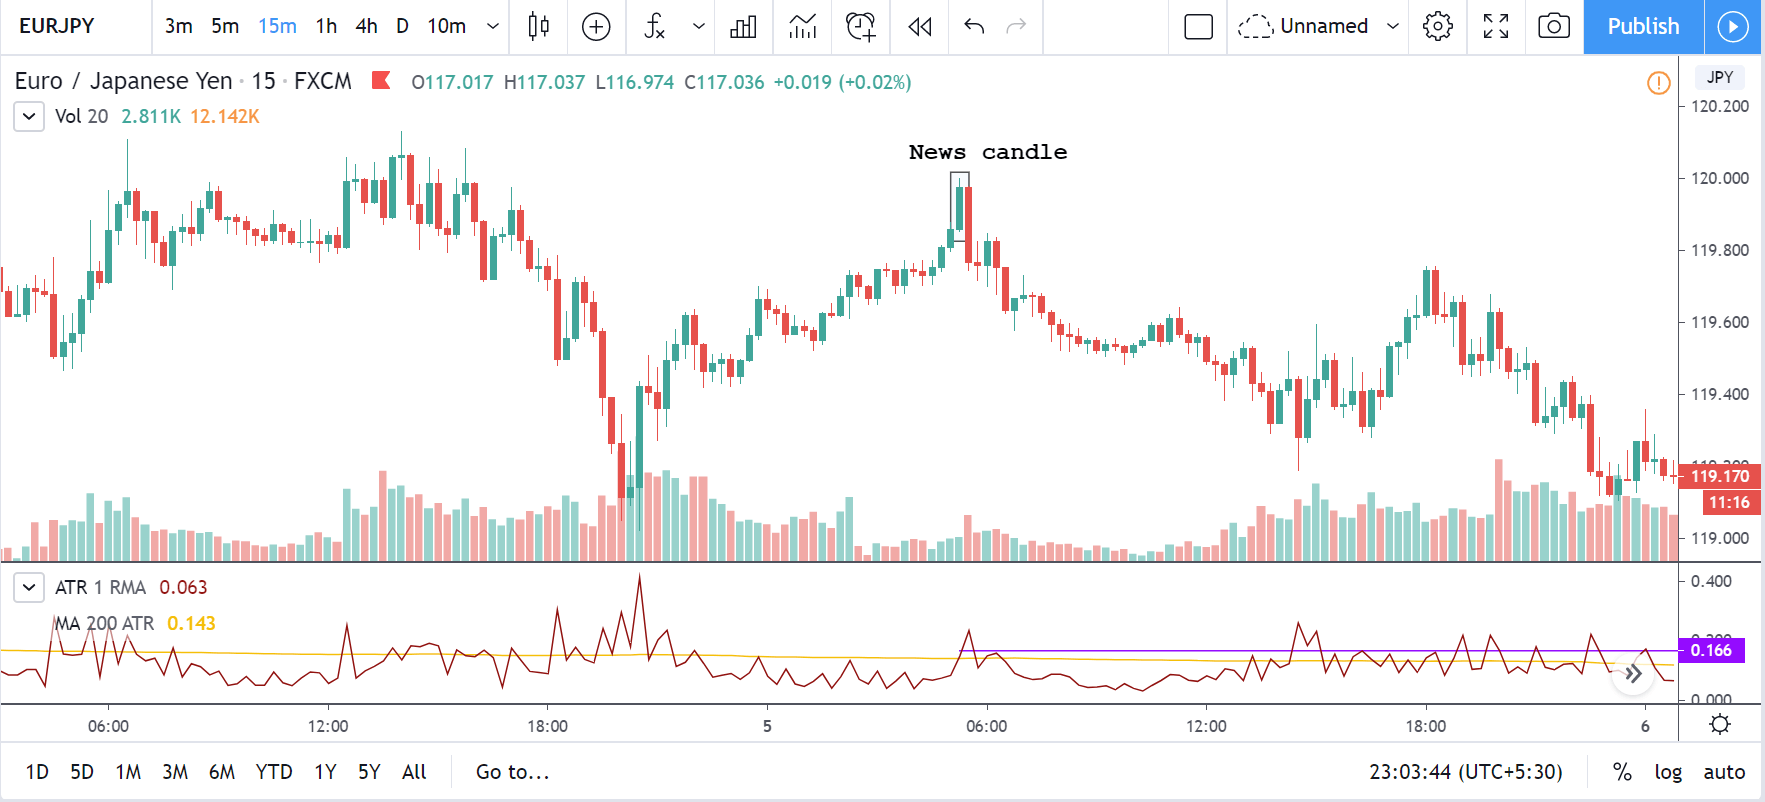
After the news announcement, the price stays at the same level as before and closes, forming a ‘Doji’ pattern. A bullish reaction to the Mining Production data can be witnessed after the close of the ‘news candle,’ which showed an increase in volatility to the downside and thereby strengthening of the South African Rand.

That’s about ‘Mining Production’ and its impact on the Forex market after its news release. If you have any questions, please let us know in the comments below. Good luck!

Categories
Forex Fundamental Analysis

‘New Orders’ – Everything About This Economic Indicator & Its Impact

Introduction

New Orders are essential for economists, government officials, and investors alike. It is a direct indication of oncoming expansion or contraction in the economy. For investors, decisions regarding investment in different sectors are critical, and New Orders figures are perfect tools to gauge an increase or decrease in economic activities. Hence, understanding this economic indicator can help us predict economic prospects better in our Fundamental Analysis.

What is the “New Orders” number?

The New Orders is not in itself a separate report. Still, it is published as part of an overall report that details the performance of Manufacturing Industries in terms of the previous month’s and current business activity and prospective plans.

The New Orders form the part of the report titled: “Manufacturer’s Shipments, Inventories, and Orders,” which is generally referred to as Factory Orders, published by the United States Census Bureau. It is also called the M3 Survey, which constitutes the New Orders Report that we are interested in. The overall report measures the performance of the industrial sectors by factoring in the total Shipments, New Orders, Order Backlogs, Total Inventory, etc. Hence, M3 Survey is a broad measure of economic conditions in the domestic manufacturing sector.

New Orders are reported in the dollar value of goods and services that have been ordered in advance. In the manufacturing sector, generally, orders are made months ahead of supply so that production can be planned and delivered accordingly. Hence, a New Order is conveying an objective to buy for immediate or future delivery from clients. New Orders report of M3 Survey includes all the manufacturing companies in the United States with more than 500 million dollars of annual shipments and specific selected smaller firms overall.

Also, Orders data for industries that have almost immediate deliveries are not recorded. Only the Orders which are supported by legal binding documents like a letter of intent, or signed contracts detailing booking of orders are included. The New Orders report all the New Orders received, excluding the canceled Orders for the previous month.

Special Consideration:

The word “New Orders” is also a component of the Performance of Manufacturing Index (PMI) and Performance of Services Index (PSI), which are also used to gauge business activity through similar survey-based index development. The New Orders in these statistics are also similar to the one we are discussing in this section and differ slightly in methodology, participants of surveys, surveyors, seasonal adjustments, and specific calculations that are different for Service Industries. These New Orders are different from the ones reported by the Census Bureau. Hence, care must be taken not to confuse with similar terminologies in both surveys.

How can the New Orders numbers be used for analysis? 

In the life cycle of production and consumption of goods and services, New Order is the earliest indicator in the manufacturing sector. In this sense, it is an advanced or leading indicator of an increase in economic activity.

The M3 survey is extensively used by government officials to develop economic, fiscal, and monetary policies. The New Orders serve as a warning sign for the officials to support the manufacturing sector as any significant downturns can lead to economic contractions and even employee layoffs. Politicians are motivated to keep employment rates high to ensure their chances of winning during elections.

As illustrated in the plot of the New Orders graph, the shaded areas indicate a recession period where we can observe a significant decline in the New Orders figures well before the actual recession, which confirms the importance of this economic indicator. It is also important to note that the year to year fluctuations are due to seasonally unadjusted figures.

Impact on Currency

Since New Orders are leading indicators of economic growth, the corresponding impact on the currency may be visible only after a certain period, which can vary from 1 month to 6 months. It is also important to note that the percentage change in New Orders from the previous month is not amplified by inflation and is only due to an increase in New Orders.

It is also essential to understand that the New Orders are seasonal for many industries, and it is vital to take the Seasonally Adjusted figures for a more accurate indication of economic growth.

An increase in New Orders indicates an increase in economic activity, which is good for the country and correspondingly to its currency. Hence, the New Orders figure is a proportional indicator, and a decrease in New Orders for previous months indicates a slowdown or contraction of economic activity.

The influence of investment markets on the economy is significant, and hence investors closely monitor for economic signals through New Orders. A positive change in New Orders translates to a positive change in equity markets too.

Economic Reports

The United States Census Bureau publishes the monthly M3 Survey reports on its official website. The Bureau releases two press releases every month.

The first one is “Advance Report on Durable Goods Manufacturers’ Shipments, Inventories, and Orders,” which is available about 18 working days after every month.

The second one is “Manufacturers’ Shipments, Inventories, and Orders,” which includes durable and non-durable manufacturing and is available about 23 working days after every month.

Sources of New Orders Reports

Census Bureau’s Factory Orders report is available here. For reference, you can find the latest advance report of the Census Bureau here. We can find the New Orders for different economies with statistical representation here. The graphical plot of New Orders is available on the St. Louis FRED official website.

Impact of the ‘New Orders’ news announcement on Forex

Till now, we have discussed the New Orders fundamental indicator and understood it’s significance in an economy. New Orders measures the value of orders received in a given period of time. They are legally binding contracts between a consumer and a producer for delivering goods and services. New Orders help in predicting future industrial output and production requirements. Investors feel that the data does not necessarily gauge the growth in the manufacturing and so they do not give a lot of importance to the data during the fundamental analysis of a currency.

Today, let’s analyze the impact of New Orders on different currency pairs and observe the change in volatility due to the news announcement. The below image shows the New Orders data of Sweden, where we see there has been a huge reduction in the percentage of New Orders compared to the previous month. A higher than expected reading is considered as bullish for the currency while a lower than expected reading is considered as negative. Let us see how the market reacts to this data.

USD/SEK | Before the announcement:

The first pair we will be discussing is the USD/SEK currency pair, where the above image shows the position of the price before the news announcement. It is clear from the chart that the market is in a strong downtrend, and the price is presently at its lowest point. Technically, we will be looking for a price retracement to a ‘resistance’ or ‘supply’ area so we can join the trend. At this moment, we cannot take any position.

USD/SEK | After the announcement:

After the news announcement, the market moves higher initially, but due to the selling pressure from the top, the candle closes almost near its opening price. As the New Orders data was extremely weak for the economy, traders go ‘long’ in the currency and sell Swedish Krona in the beginning. But since the trend is down, sellers push the price lower, and the ‘news candle’ leaves a wick on the top. We still cannot take any position after the news release.

EUR/SEK | Before the announcement:

EUR/SEK | After the announcement:

The above images represent the EUR/SEK currency pair, where the characteristics of the chart are similar to that of the above-discussed pair. The market here too is in a strong downtrend signifying the great amount of strength in the Swedish Krona, as the currency is on the right-hand side of the pair. We can see in the first image that the currency pair is not very volatile, which means there will be additional costs (Spreads & Slippage) when trading this currency pair.

Hence, we should trade this pair if the news announcement ignites volatility in the market. After the news announcement, the price hardly reacts to the news data where it stays at the same point as it was just one candle before. Therefore, the news release does not have any impact on this currency pair, and there is no alteration to the volatility.

SEK/JPY | Before the announcement:

SEK/JPY | After the announcement:

Lastly, we will look at SEK/JPY currency pair and see if there is any change in volatility due to the news announcement in this pair. Before the news announcement, the market is in a strong uptrend indicating strength in the Swedish Krona. In order to join the uptrend, we should wait for the price to pull back at a’ support’ area, as the price is at the highest point, and then take position accordingly.

After the news announcement, the price initially falls lower owing to poor New Orders data, but it bounces exactly from the moving average and closes with a wick on the bottom. Hence, we can say that the news release has some impact on this pair, causing a fair amount of volatility after the announcement.

That’s about ‘New Orders’ and its impact on the Forex market after its news release. If you have any questions, please let us know in the comments below. Good luck!

Categories
Forex Elliott Wave

How to Count Using the Elliott Wave Principle Part 3 of 3 – Advanced Level

Introduction

Previously, we presented in a theoric way several criteria to realize wave counting, which could allow the wave analyst to foresee the likelihood next path of the market. In this educational article, we’ll analyze some examples in the real market.

Case 1 – NZDUSD Advances in a Corrective Sequence

The NZDUSD price in its hourly chart shows the progress in two consecutive corrective patterns. Our intraday analysis begins at the intraday high at 0.61305 reached on April 14th.

The price market reveals a decline in five internal segments of Subminuette degree identified in green. Once completed this move, the kiwi reacted bullishly, moving upward in three waves. This move ended a wave (b) of the Minuette degree labeled in blue. 

Observe how the price action completed the wave (c) of Subimiuette degree, developing an ending diagonal pattern, as commented on the previous article. The breakdown of this Elliott wave formation suggests the beginning of a bearish sequence that will correspond to a wave (c) of the Minuette degree.

The bearish sequence corresponding to wave (c) ended at 0.59104 on April 23rd reveals us that NZDUSD completed a zigzag pattern of Minuette degree.

The next move, developed by the NZDUSD cross, reflected the advance as a flat pattern and ended at 0.61758 on April 30th, when the kiwi developed an ending diagonal in the same way that the wave (b) of the previous zigzag pattern.

On the other hand, from the two patterns analyzed, we note the alternation principle in the corrective sequence, while the first correction is a zigzag, the second one is a flat pattern

Finally, the two consecutive corrective patterns, lead us to observe that NZDUSD completed a 3-3 sequence. In this context, the study of previous waves will reveal what should be the likely structure in progress and what could be the potential next move.

Case 2 – EURGBP Begins a Five-Wave Sequence from a Different Low

The second case considers the scenario when the market starts a five-wave sequence from a higher low. 

The EURGBP cross in its hourly chart shows the aggressive sell-off developed on December 12th, when the price plummeted to 0.82758. After this decline, the price consolidated and reached a slightly higher low at 0.82767 from where the cross began an impulsive movement identified as wave (i) of Minuette degree labeled in blue. 

Once the second wave ended, EURGP realized a third extended wave, which boosted the cross until 0.85917 reached on December 23rd. 

In this case, we observe the alternation principle in action. As the second wave is a simple correction. In consequence, the fourth wave must be a complex correction. In fact, from the chart, we observe that EURGBP developed a triangle pattern, which retraced beyond 38.2% of the third wave of Minuette degree. This context leads us to conclude that the cross should not reach a new higher high.

In this sense, the price action realized a limited higher high, which topped at 0.85959 last January 14th, from where it started to decline.

Conclusions

In this educational article, we showed a group of examples. In the first one, corresponding to the NZDUSD cross, we learned how the price action tends to end in ending diagonal patterns. 

In the same way, we observed the alternation principle applied in corrective waves, while the first corrective structure corresponded to a zigzag, the second formation built a flat pattern.

In the second chart, we observed that an impulsive sequence not necessarily will begin in the lowest (or highest) level of the price chart. This context makes us remember that an Elliott wave structure could finish developing a failure in the wave 5 or C.

On the other hand, the retracement experienced by the third extended wave beyond the 38.2% warned us about the exhaustion of the bullish momentum. This context provides us a signal of the limited potential next move corresponding to the fifth wave.


Categories
Forex Fundamental Analysis

Why ‘Core Consumer Price’ Is Considered A Crucial Macro Economic Indicator?

Introduction

The Core Consumer Prices are a sub-segment of the Consumer Prices, which is used by professionals and economists to get a more accurate picture of the inflation within the country. Understanding of Consumer Price movements can help traders predict inflation rates, industrial trends, identify demand, and supply gaps to invest in a particular section of goods and services. It is a widely used statistic and is one of the critical components in assessing economic expansion or contraction, thereby.

What is Core Consumer Price?

The ”Core “ Consumer Price is the generally called name for the “Consumer Price for All Urban Consumers: All Items Less Food and Energy.” This term comes up in the Consumer Price Index monthly published Reports where this is another variant of the CPI-U and is widely known as the “Core” CPI where CPI stands for Consumer Price Index.

What is the Consumer Price Index?

Consumer Price Index is a survey report which determines the average price of some of the most commonly purchased goods. These goods include toothpaste, grocery, fuel, etc. Instead of using a simple average, each good is assigned a specific weight based on the degree of their importance amongst the people. For instance, milk will have a higher weightage in the mean price calculation compared to the furniture.

Core Consumer Price Index is the same Consumer Price Index for all the commonly consumed goods and services except food and energy items. This distinction has arisen due to the highly volatile nature of food and energy prices.

Why are the food & energy prices volatile in the first place?

Let us talk about food first. In the short run, the supply of food cannot immediately accommodate the increase in demand for food. To meet the increased demand,  it has to result in the planting of more seeds and growing, which take somewhere about a few months to at least a year.

Due to this situation, we say the supply is inelastic to the demand, meaning it cannot stretch immediately to meet the demand. Hence, the demand-supply gap causes price volatility. For example, in India itself last year, the price of onions went up to 150 rupees per kg from its usual 30 rupees per kg. This volatility can also occur due to crop loss at the time of adverse weather conditions or due to some other issues like forest fires etc.

The same goes for energy items like crude oil. Industries or Countries that are heavily dependent on these sources have little choice but to pay higher prices when there is a shortage of supply. Switching from one source of energy to another or alternate forms of power is not a small task, nor is it a viable solution. The primary energy source areas have been historically subjected to political tensions, which have led to significant shocks in oil prices worldwide. Factors like weather conditions also hinder oil production, or unexpected incidents can lead to significant dips in the energy supply levels in the global market.

Below is a historical 70-year plot of Crude oil prices where shaded regions indicate periods of recession.

(Source: MACROTRENDS)

With such a massive rise and drops in prices, it is very easy to overlook the actual inflation or deflation within the economy. As the CPI takes into account the food and energy prices, there can be situations where the food and energy prices skyrocket while other items have observed deflationary trends in their prices to a scale that the volatility masks the deflationary trend or vice versa is also true.

To avoid this inaccuracy in CPI, the Core CPI comes into the picture, which is a more accurate inflationary measure than the CPI-U.

Economic Reports

The Bureau of Labor Statistics generally conducts a survey of 80,000 consumer item prices to create the Index and publishes it monthly.

BLS data collectors visit in person, or virtually through the internet, or call thousands of retail stores, service establishments, rental units, and doctors all over the United States. They do this to generate info on the prices of items and then measure price changes in the CPI.

How can the Core Consumer Prices be Used for Analysis?

The index data set goes as way back; for example, Core CPI goes as far back as 1957. With such a large data set, the reliability of the data set is high, and it usually depicts the macroeconomic picture of a country with reasonable confidence.

CPI changes are useful to ascertain the retail-price modifications associated with the Cost of Living. Hence it is widely used to determine inflation in the United States.

Many payment agreements are directly tied to CPI; it can affect the incomes of 80 million people. Social Security benefits, various pension payments are all indexed by CPI. Hence, CORE CPI is essential to understand current monetary conditions and can also be used to assess how the governments and policymakers will act to these changes.

Impact on Currency

In general, CPI is associated as a proportional indicator meaning higher CPI signals currency appreciation for traders and vice versa.

Below is a snapshot of CORE CPI plotted against GDP for the last 15 years, and we see this macroeconomic indicator’s importance in fundamental analysis:

Sources of Consumer Price Index

The U.S. Bureau of Labor Statistics releases all the indexes as mentioned here –

Consumer Price Index and Core CPI

CPIAUCSL: CPI for Urban Consumers: All Items in U.S. City Average: Broadly uses the statistic for a measure of overall inflation in prices. It includes Food and Energy prices, unlike CPIFESL. This info can be found here.

CPIFESL: Consumer Price Index for All Urban Consumers: All Items Less Food and Energy in U.S. City Average: It excludes volatile components like Food and Energy (Oil Prices) and gives more of a Core CPI change within the United States. This info can be found here & here.

Impact of the ‘Core Consumer Prices’ news release on the price charts

The Core CPI is not only an important indicator of inflation but that of the overall economy, thus it is sure to impact the value of the currency. In this section of the article, we will be discussing that impact and look to trade the news announcement. As we can see in the below image, core CPI is said to highly impact the currency when the numbers are being announced. The data released on a monthly and yearly basis, but today we will be analyzing the month-on-month core CPI data of the United States.

The below image shows the latest Core CPI data for the month of February, along with the forecasted and previous numbers. A higher than expected reading is considered to be bullish for the currency while a lower than expected reading is believed to be bearish. The latest figures show that the Core CPI numbers were unchanged from before, which was exactly predicted by economists. The CPI numbers are published by the U.S. Bureau of Labor Statistics, the official agency that carries out surveys and collections. Now let us analyze the impact it created on the U.S. dollar.

EUR/USD | Before The Announcement

We start with the most liquid forex pair in the world, which is the EUR/USD pair. Looking at the from a technical perspective, before the news announcement, we see a market reversal retracement on the downside with a retracement to the nearest ‘higher high’. One can assume that the market has factored in the Core CPI data as it is expected to remain the same as before. Hence, one should not expect a great amount of volatility during the announcement. Technically, we can take a ‘short’ trade in the above pair, but without having a lot of assumptions, it is advised to keep a wide stop loss to protect ourselves from spikes.

EUR/USD | After The Announcement

The Core CPI numbers are announced, and since it was on expected lines, the price falls a little, showing some bullishness for the U.S. dollar. As there was minimal volatility, we can confidently take a ‘short’ trade with a stop loss above the recent ‘higher high.’ The ‘take profit’ for this trade should be near the recent ‘low’ or ‘support’ area. We shouldn’t forget that earlier, it was said that it is a high impactful event, but due to subdued expectations, it did not induce high volatility.

USD/CAD | Before The Announcement

USD/CAD | After The Announcement

The above images represent the USD/CAD currency pair where it looks like, before the news announcement, the market is in a pullback mode, and this is the perfect scenario for going ‘long’ in the market. As the impact of Core CPI is high, it could turn the market either way; hence it is safer to wait for the news release and then a suitable position in the market.

After the news announcement is made, we see that the volatility expands on the upside, which takes the currency higher. This could essentially be the confirmation sign for trend continuation, and we can now enter for a ‘buy’ with a stop loss below the recent ‘low.’ Since there was no reduction in Core CPI numbers, it resulted in being positive for the U.S. dollar, and thus we see a bullish candle after the news release.

NZD/USD | Before The Announcement


NZD/USD | After The Announcement

Here, in NZD/USD currency pair, before the news announcement, we see an uptrend, and since the U.S. dollar is on the right-hand side, it shows the excessive weakness of the same. The behavior of this chart is different from that of the above-discussed pairs due to the strength in the New Zealand dollar.

Therefore, only a significant increase in the Core CPI can result in a reversal of the trend else we can witness volatility on both sides. Since the news announcement was mildly positive for the U.S. economy, the price drops but not enough. Hence, we can conclude that the news release did not cause much volatility in the pair, and the current trend is still intact.

That’s about ‘Core Consumer Prices’ and its impact on the Forex price charts after its news release. If you have any questions, please let us know in the comments below. Good luck!

Categories
Forex Fibonacci

Fibonacci Trading: When Momentum is Lacking

Traders wait for the price to trend from 61.8% Fibonacci level. This is what attracts more traders to trade, which generates good momentum. When the price trends from 61.8% level, it usually goes up to 161.8%. Since the price gets enough space to move, it offers better risk-reward. This is another reason that Fibonacci traders love to trade in a chart when the price trends from 61.8%. However, the Forex market is uncertain. We may see that the price does not head towards 161.8% with good momentum upon trending from 61.8% from time to time. In today’s lesson, we are going to demonstrate an example of this.

This is an H1 chart. The chart shows that the price heads towards the South with good bearish momentum. Upon producing a strong bearish candle, it starts having a bullish correction. Fibonacci traders shall get themselves ready by drawing Fibo levels on the chart to find out potential short opportunities in the pair.

Here it is. The chart shows that the price breaches 78.6% level and trades above the level for two more candles. This means the price is in 61.8% zone. If the price trends from here, it may go towards 161.8% level. Yes, it would be better if the price goes towards the North and trends right from the level 61.8%. Nevertheless, the sellers still are to count the move from 61.8% zone. The chart produces a bearish engulfing candle followed by a doji candle. Since the reversal candle comes out as a bearish engulfing candle forming from 61.8% zone, some sellers may trigger a short entry (some may wait for the price to breach the last lowest low). Let us proceed to the next chart to find out what the price does.

The price heads towards the South and it makes a breakout at the last swing low as well. The pair may get more short orders now. However, the price does not head towards the South. It seems that 161.8% level is far away for the price to reach. It does not usually happen but this is how the Forex market runs. It does not always run on a single equation. A question may be raised here what does a trader do with his entry? Since it is an H1 chart based entry, it must be left behind and let it decide its fate by setting Stop Loss and Take Profit accordingly.

Categories
Forex Elliott Wave

How to Count Using the Elliott Wave Principle Part 2 of 3 – Advanced Level

Introduction

In our previous educational article, we discussed the basic concepts of the Wave Principle developed by R.N. Elliott and the wave counting process.

Glenn Neely, in his work “Mastering Elliott Wave,” describes a series of rules that will allow the wave analyst to objectively identify what kind of structural sequence is developing the price action.

In this educational article, we present a summary of the basic rules described by Neely and their impact on the wave analysis and counting process.

Use of Retracements in Wave Analysis.

When the wave analyst faces his first real-time market analysis, it may seem confusing to define what kind of wave the market is developing.

To solve this problem, Neely defined a set of rules that will allow the wave analyst to determine what kind of sequence the market develops.

These rules are described as follows.

Our reader can examine with more detail these rules and the Fibonacci retracements use in wave analysis here.

Types of Structural Series

R.N. Elliott, in his work “The Wave Principle,” defined some specific patterns that tend to repeat across the time. These patterns are built by different structural series that the wave analyst should know before to start the counting process. These Elliott wave structures are formed as follows.

Impulsive waves (:5)

  • Impulse – 5-3-5-3-5
  • Leading or Ending Diagonal – 3-3-3-3-3

Corrective waves (:3)

  • Zigzag – 5-3-5
  • Flat – 3-3-5
  • Triangle: – 3-3-3-3
  • Double Three – 3-3-3
  • Triple Three – 3-3-3-3-3

Remember that double and triple three are combined patterns.

The First Count and the Recount

As the level of complexity increases, wave sequences tend to create new waves of a higher degree, which can lead to confusing the wave analyst to identify where each wave begins and ends. For this, we use the validation channels and rules we have seen in previous articles.

Usually, the first analysis tends to be the one that presents the greatest challenge, because it tends to consider the highest level, or the lowest, to start the wave count. However, not necessarily the lowest, or highest level will be the beginning of an impulsive structure. This situation occurs because most methods of analysis consider the highest and lowest level as the starting point for analysis.

In terms of wave theory, a structural sequence will not end at the highest (or lowest) point due to the loss of momentum of price action. This situation will be reflected in one of the following four ways:

  1. An impulsive sequence containing a failure in the fifth wave.
  2. A flat pattern will end with a C-wave failure.
  3. A complex formation will end with a non-restrictive contractive triangle.
  4. An impulsive structure ends with a terminal pattern.

The following figure shows each of the four scenarios where the sequence will not end at the lowest level.

When a potential impulsive pattern experiences a reversal higher than its beginning, then the recount must consider that the origin of the previous movement is not the origin of an impulsive structural series, but can be part of a complex corrective structure.

Conclusions

In this educational article, we review different criteria described by Glenn Neely in his work “Mastering Elliott Wave,” which allow the wave analyst to identify what kind of structure the market could be developing.

Later, we reviewed the different patterns that R.N. Elliott described in his work “The Wave Principle” and his internal sequences. Currently, the patterns described by Elliott in the 1930s still can be recognized in the real market.

Finally, we discussed the cases where the market does not finish or start a new impulsive or corrective sequence from the lowest or highest point but will depend on how the previous structural series ends. 

In the next educational article, corresponding to the third and last part of the wave counting process, we will see a series of examples of wave counting and identification.

Suggested Readings

  • Neely, G.; Mastering Elliott Wave: Presenting the Neely Method; Windsor Books; 2nd Edition (1990).
  • Prechter, R.; The Major Works of R. N. Elliott; New Classics Library; 2nd Edition (1990).
Categories
Forex Fundamental Analysis

Comprehending ‘Credit Rating’ & Its Importance as a Macro Economic Indicator

Introduction

The credit rating of an institution, organization, the government is like a pseudo report card of its ability to pay back its debt. The credit rating process is thorough and detailed. The credit rating of a country or a government, in that case, can significantly impact the inflow of domestic and foreign Investments. It is one of the major indicators around which a lot of volatility occurs in the financial markets; therefore, understanding the credit rating system is important.

What is Credit Rating?

Credit Scoring

Among the general population, people who have a job are usually aware of a credit score that is attributed to them buy one or more agencies within that country. For example, in India, CIBIL, which stands for Credit Information Bureau (India) Limited, is the primary agency that assigns credit rating to individuals.

The credit rating of an individual largely determines the eligibility to apply for a loan from any financial institution. A high score would indicate that the individual is capable of repaying on time, and conversely, a low score would mean that there is a high risk of defaulting on repayment by the individual. The credit score of an individual takes into account the history of loans, repayment records and past defaulting records, and his current net income. Based on all these factors, the calculated score then tells their worthiness of credit.

For example, a CIBIL score greater than 750 in India is usually seen as a minimum requirement to be eligible for a loan by most banks. The individual usually seek out to maintain a high CIBIL score to be eligible to borrow a higher amount of loan and lower interest rates as a lower score would greatly diminish their loan eligibility, and even if they do get a loan, they will have to pay higher interest rate than people with a good CIBIL score.

Credit Rating 

Credit scoring applies to individuals within a country, whereas credit rating applies to institutions, organizations, and governments. Similar to credit scoring credit rating tells whether that organization is credit working or not.

Credit rating becomes important as here the borrowers are big institutions, government, large financial organizations, and the lenders are also big investors or foreign bodies. The loan amount is high, often ranging in millions and billions, and the duration of the loan is also long. Hence, investors actively seek credit ratings before deciding to purchase a particular Bond and lending their money.

How are the Credit Ratings calculated?

There are many globally popular credit rating agencies. In the United States, three companies, namely, Fitch Ratings, Standard and Poor’s Global (S&P Global), and Moody’s Corporation, are the most famous and sought after agencies.

The credit rating process is very thorough and accounts for the entity’s entire debt and its repayment history. The process requires credit rating from the agency to meet with the organization and going over their financial records to assess their current financial status and assess their eligibility. They also take into account that past loan repayments and spending patterns, their current financial assets, and future economic prospects.

After this, a group of credit raters will work out the credit rating for that organization. The process may take up to 4 weeks in general. When the credit rating is ready, it is given out to the company and for a press release. The credit rating agencies usually follow an alphabet combination rating system.

For example, according to Standard and Poor’s Ratings, an organization having AAA rating is said to be outstanding, which is the highest rating possible. Next below is AA+, which means excellent this goes down a rating of D, which is the lowest score. The formats of writing may vary slightly from company to company, but in general, they have an understandable notation of alphabet combinations.

Are Credit Ratings important?

The credit ratings became particularly important after the 1936 rule, which restricted Financial Institutions to lend money to speculative bonds, i.e., having low credit ratings in other words.

Many companies now actively seek to get their credit rating assessed to gain the confidence of investors. The financial markets also have seen enough market crashes, the system collapses, and payment defaults even by the most reputed organizations and nations also. The European debt crisis and the Greece default one of the most popular instances wherein national level collapse of financial institutions and debt default occurred in the recent times of 2010-2011.

In one sense, there is a link between capital inflow and credit rating, hence government and financial corporations, when requiring money, the credit rating becomes a significant number.

The credit rating is not a performance report for a particular set year; instead, it is a continuously updated statistic that tells the credibility of the entity at the current time. For example, a country with the best credit rating last year may not have the same rating this year. The credit rating cuts through all the false alarms and directly gauges the financial numbers, which always tell the truth.

Hence, once the agencies publish credit ratings for a particular sovereign body, there tends to be a lot of volatility as investors either become gain or lose confidence in that body. Conversely, a decreased credit rating than the previous number, also stirs down the market in a negative direction.

Credit ratings, particularly sovereign credit ratings, are major indicators for investors, and hence the government bodies take utmost attention to loan repayment to avoid defaulting and thereby spoiling their credit rating, which will cost them future monetary indentures. Government bodies are aware that decreased credit rating will result in foreign investors stepping back, and consequently, losing their funding, which can, in extreme cases, lead to a total collapse of the institution or an economy at a large scale.

How can the Credit Ratings be Used for Analysis?

An institution with a low credit rating is considered a high-risk investment as the prospects of that company being able to repay is low.

A decrease in the sovereign credit rating signals an economic slowdown from which the country may take a significant time to recover. Conversely, a high credit rating for sovereign bodies and conglomerates indicates that the economy is stable and growing, and there are ample financial resources to pay back the debt on time.

Credit ratings are released quarterly, usually, after the financial numbers of the organization are released. They can be used as current macroeconomic indicators and also be used to predict future expansion plans of the borrowing party, as an institution borrows money to expand or invest in its growth.

Sources of Credit Rating Reports

For reference, Fitch credit ratings are published frequently on their official website.

Since Credit Rating is a major indicator, media coverage is huge and is easily available across the internet. For reference, this is a rating table given in Wikipedia.

Impact of the ‘Credit Rating’ news release on the price charts 

After understanding the meaning and significance of Credit Rating in a country, we shall now see the impact it makes on the currency after the Ratings are declared. There are many agencies that give Ratings to different countries, but the two most reliable and followed are the Ratings given Fitch and Standard and Poor’s (S&P). In today’s article, we will be analyzing the Credit Rating of the United Kingdom announced in the month of December. Credit Rating is said to be a major event in both the forex and stock market, which has a long-lasting effect on the value of a currency. Therefore, the rating could largely determine the degree of volatility in the currency pair.

In forex trading, Credit Rating is used by sovereign wealth funds, pension funds, and other investors to gauge the creditworthiness of a county, thus having a big impact on the country’s borrowing costs. As we can see in the above image that Fitch’s Credit Rating for the United Kingdom was last reported at AA with a negative outlook. Since the rating was unhealthy for the economy, let us see how the market reacted to this.

GBP/CAD | Before The Announcement

As the Credit Rating announcement is one of the biggest data releases of a country, volatility caused by the news release can be witnessed more clearly on a daily time-frame chart. Likewise, we have considered the ‘daily’ chart of GBP/CAD that shows an uptrend market. As we do not have any forecasted data available for the same, we cannot take any position in the market based on predicted ratings. The only way we position ourselves in the market before the news announcement is through the ‘options’ segment, where we can essentially take advantage of the increase in volatility on either side.

GBP/CAD | After The Announcement

On the day of the Credit Rating announcement, we see that the market falls by more than 500 pips resulting in a complete reversal of the trend. This shows the extent of the impact of Credit Rating on a currency pair. The reason behind the collapse of the British Pound is negative Credit Rating given by the two most renowned agencies.

This rating is used by institutional investors and fund managers to decide if they want to park their cash in the economy. Therefore, when the rating is downgraded, investors withdraw their money from the market and sell British Pound. From a trading point of view, one can take a ‘short’ position in the market with a high much higher ‘take profit’ since the market has the potential to go much lower.

GBP/JPY | Before The Announcement

GBP/JPY | After The Announcement

The above images represent the GBP/JPY currency pair where the chart characteristics are almost the same as that of the GBP/CAD, but with a difference that, the uptrend is more extended in this pair. When the market is trending strongly in one direction, we need to cautious while making trades in the opposite direction of the market. Here too, since we are not sure of the Credit Rating data, we cannot position ourselves on any side of the market.

After the news announcement, the British Pound falls but as much as in the above case. There is an increase in volatility on the downside but not sufficient enough to take a ‘short’ trade. Another reason behind a lesser fall in price could be the weakness of the Japanese Yen. Also, the price, even after bad news, is still above the moving average.

GBP/NZD | Before The Announcement

GBP/NZD | After The Announcement

In GBP/NZD currency pair, before the Credit Ratings are declared, we can see that the market is showing signs of weakness. Since the overall trend is up, we need to wait for the news release and get a confirmation from the market. We can still trade in the ‘options’ segment of the market and profit from the increased volatility on either side after the news announcement.

After the Credit Rating data is announced by different agencies, the market falls, and volatility increases on the downside. This is a result of the negative Credit Rating given to the United Kingdom, which disappointed the market participants. Since the market was already showing weakness, this could prove to be the best pair to go ‘short’ with a much higher risk-to-reward ratio.

That’s about ‘Credit Rating’ and its relative impact on the Forex market after its news release. If you have any queries, let us know in the comments below. Cheers!

Categories
Forex Daily Topic Forex Price Action

Spot the Chart Accordingly before Triggering for an Entry

In today’s lesson, we are going to demonstrate an example of a chart, which may entice traders to take entry more than once. Some traders may get themselves engaged in taking entry. We find out why we price action traders skip taking those entries. Let us get started.

This is an H4 chart. The price makes a strong bearish move by producing three consecutive Marubozu bearish candles. The last candle comes out as a doji candle. The price may consolidate now. The sellers are to wait for a strong bearish reversal candle upon consolidation to go short in the pair. Let us proceed to the next chart.

The chart produces a bearish Marubozu candle again. As a reversal candle, it is a strong one. However, the price has not consolidated well. It has produced the bearish reversal candle upon having a shallow consolidation. Moreover, the last candle does not close below the level of support. Thus, the sellers may skip taking the entry but wait for the right time to come. The chart still looks good for the sellers.

The chart produces a bullish engulfing candle. The price may make a deeper consolidation this time. The sellers may keep their eyes on the chart again to go short in the pair. Let us proceed to the next chart to find out what happens next.

The price makes a deeper consolidation. Upon finding its resistance, it makes a bearish move. It seems that the price may make a breakout here. A question may be raised here whether the sellers on the H4 chart shall take the entry or not? We find out the answer in a minute. Meanwhile, let us proceed to the next chart.

The next H4 candle closes well below the level of support. The pair trades below the breakout level for one more candle as well. However, the sellers on the H4 chart may skip taking the entry. The reason behind that is the chart takes more than six candles (a day) to make the breakout. This level of support is a daily level of support now. Thus, the sellers may take the trading decision as far as the daily chart is concerned. If they take their trading decision by observing the H4 chart, it may not be that fruitful. The risk-reward may not be a good one. It may not end up being a daily breakout, but the price may come back in. Or, the daily chart may produce a bullish corrective candle next day, which makes the price hit the H4 sellers stop loss. Thus, in such cases, they might have to take losses only because the pair belongs to the daily chart. Thus, for better trading, traders shall take a closer look before taking entry on a chart to determine whether it favors their trading chart.

Categories
Forex Elliott Wave Forex Signals

Gold Could Develop a Bearish Wave C

Description

Gold, in its 2-hour chart, illustrates a decreasing advance that could correspond to a corrective structure in progress, which could result in further declines.

The Elliott wave sequence suggests the possibility of an incomplete wave ((c)) that could be developing its internal wave (ii) of the Minuette degree identified in blue.

On the other hand, the yellow metal retraced until 50% of the last bullish sequence. This retrace makes us foresee that the upward cycle could be in an exhaustion stage, and Gold couldn’t realize a new higher high that surpass the April high at $1,747.74 per ounce.

Our bearish scenario foresees a decline from the current area at $1,696 per ounce, with a potential bearish target located at level $1,676. 

The scenario forecasted will be invalid if the price surpasses and closes above $1,711 per ounce.

Chart

Trading Plan Summary

  • Entry Level: $1,696.62
  • Protective Stop: $1,711.62
  • Profit Target: $1,676.62
  • Risk/Reward Ratio: 1.33
  • Position Size: 0.01 lot per $1,000 in trading account.
Categories
Forex Fundamental Analysis

How The ‘Government Debt’ Numbers Impact A Nation’s Currency Value?

Introduction

Government Debt as an economic indicator has recently been gaining more attention from economists, investors, and traders. Many economies have chosen to actively take on debts to boost economic growth. Hence, it has become a metric & also a concern for many.

Just like a piling up debt is terrible for a householder, huge government debt is a negative sign for any economy. How the debt is used to run economic activities, methods deployed to repay it, all these have a long-term financial impact. In this sense, Government Debt is a critical metric by itself that needs to be watched out for, as investors decide to lend money to governments, basing this also as one of the reasons.

Government Debt levels have consequences that are many-fold to understand. Hence, understanding Government Debt now is more important than ever as the world’s largest economies are taking on debts beyond their revenues.

What is Government Debt?

Government Debt, also called Sovereign Debt, Country Debt, National Debt is the total public Debt and intragovernmental Debt owed by the governing body of the country. It is the money that the Government owes to its creditors.

            Government Debt = Public Debt + Intragovernmental Debt

Public Debt – It is the Debt held by the public. The Government owes this Debt to the buyers of the government bonds, who can be its citizens, foreign investors, or even foreign governments.

Intragovernmental Debt – It is the Debt owed by the Government to other Government departments. It is generally used to fund Government and citizen’s pensions. The Social Security Retirement account would be one such typical example.

Whenever the Government spends more than its generated revenue, it creates a budget deficit and adds to the total Government Debt. To operate in this budget deficit mode, the Government has to issue treasury bills, notes, and bonds, which are promissory notes to lenders that the Government shall pay back the amount along with interests.

Hence, The National Public Debt is the net accumulation of all annual budget deficits of the Federal Government.

How can the Government Debt numbers be used for analysis?

The Governments depend mainly on public spending to stimulate growth in the economy by assisting businesses and individuals in the form of unemployment compensations, wage hikes, etc. This leaves Government no choice but to fall back on taking on more Debt and keep paying interests from the tax revenues and other income sources.

The piling Debt may let things continue smoothly now but will inevitably tighten the belt for the economy in the future. When Debts go out of hand, it can lead to economic collapse, as default on Debts leads to reduced credibility and may lead to a lack of funds during times of need.

When support is lost for the Government, it has to fall back on assets, selling them and thus going to the brink of bankruptcy. At this stage, a nation is vulnerable as enemy nations can also use this situation to their advantage to wage wars in extreme cases. When there is no monetary support, business slowdowns and recessions are unavoidable.

The following are some strategies the Government may opt to reduce the debt burden:

📎 Low-Interest Rates: By lowering interest rates through open market operations, the Government can make borrowing money easy for the business and people in the economy to boost the economy. This has been the case in the United States. Prolonged low-interest-rate environments have not proven to be an effective solution to Debt-ridden Governments.

📎 Monetization: Countries like the United States, whose currency is not pegged to any other currency or commodity, can print off money and clear Debt. But this can lead to hyperinflation and currency depreciation. Hence, it is not preferable.

📎 Spending Cuts: This is the hard pill to swallow that actually works. It is the spending that leads to an increasing debt burden. If the Government cuts back on spending, which is equivalent to cutting back of money supply into specific segments or programs, that will lead to deflationary situations in the economy that can lead to a recession. Furthermore, when the Government cuts back on spending, they lose the support of citizens and fear losing favors in elections by businesses and the population.

📎 Tax Raises: The main culprit is failing to cut back on spending. As the spending continues to rise year after year, increased tax revenues do little to help reduce the burden of Debt. It is the most common practice but is not effective in the long run.

📎 Pro-Business/ Pro-Trade: By selling off real assets like real estate, gold, and military equipment, the Government can reduce the burden. It is like selling your house to pay off the mortgage. This type of solution is not applicable to all countries, but some like Saudi Arabia reduced their Debt significantly from a debt 80% of GDP to 10% in seven years by selling off oil.

📎 Debt restructuring or Bailouts: When the solvency of the Government is at the brink, Debt restructuring (renegotiating the terms of Debt, or partial payments) is one final option. It is a pseudo-defaulting case. This is not also a practical solution, as the credibility is damaged after this, as it tells the world that the economy is weak.

📎 Default: Defaulting may seem the most effective way to get rid off Debt. This is considered only when there are no other options for the Government. This leads to a lack of future monetary support from the rest of the world. Defaulters like Pakistan, Greece, and Spain are good examples of this. Defaulting occurs when the Debt burden crosses way beyond the tipping point, which is 77%. For the United States, it has already passed 100% in recent years.

Impact on Currency

The National Debt is an increasing concern in recent years as the repayments are starting to take more massive proportions of the Government’s revenue. What method the Government decides to opt for to tackle its debt burden in a given year directs the growth for that business year.

The Government Debt is a proportional indicator, meaning higher Government debt numbers are more stimulating for the economy, and appreciating for the currency and vice-versa. The vital thing to note here is that as long as the Debt has not gone way out of control that the Government cannot afford to pay the interests also. For the United States, the Debt burden will be unbearable by 2034, at which point they have to cut back on spending and raise taxes.

The Government Debt is a lagging and reactionary number. It is taken on to solve an issue and is not an initiative effort. Debt numbers follow the already ongoing situation. Hence, it has a low market impact. The more direct implications of the taken Debt are manifested through press releases and other news reports like wage growth, employment statistics, etc.

Economic Reports

The Treasury Department has the “Debt to the Penny” section on their website which shows, the daily Debt after all purchase and sale of the Government Bonds.

The U.S. Treasury Department releases quarterly, end of the period, the Federal Government’s Debt reports.

Sources of Government Debt

The Office of Management has a historical tables section where we can find Federal Debt records. Some of the most reliable sources are given below.

Impact of the ‘Government Debt’ news release on the price charts 

Government Debt which also known as the national debt, is the public and intergovernmental debt owned by the federal government. The government may take a loan from the World Bank and or from other financial institutions for a variety of reasons. It could be required for fulfilling the needs of the people, for defense purposes, or for stabilizing the economy. A moderate increase in debt will boost economic growth, but too much debt is not good for the economy.

It dampens growth over the long term. Higher debt means a higher rate of interest and, thus, more burden on the government while repaying the loan. Investors compare the debt held by the government and its ability to pay it off. Based on this data, they have a short to long term view on the currency. However, traders do not react violently to the Government Debt news release and make few adjustments to their positions in the market.

In today’s article, we will be analyzing the impact of the Government Debt announcement on Turkish Lira as traders identify the debt of the Turkish Government. The below image shows the previous and latest Government debt of Turkey, which indicates an increase in debt from last month.

USD/TRY | Before The Announcement

The above image represents the USD/TRY currency pair before the news announcement. We see that the chart is in an uptrend and the price has broken many resistance points. Currently, it is approaching a major resistance area from where the market has reversed earlier. High volatility on the upside could be an indication that the market is expecting a weak Government Debt data. One can join the uptrend only after the market gives a retracement.

USD/TRY | After The Announcement

As soon as the Government Debt data is announced, the market violently moves higher, and price rises quickly to the top. The reason behind the increase in volatility to the upside is that the Government Debt increased by almost $70B for the month of March. As a rise in Debt is considered to be negative for the economy, this explains why traders and investors sold Turkish Lira and bought U.S. dollars after the numbers were announced. The bullish ‘news candle’ is a sign of trend continuation, and thus one can go ‘long’ in the pair after a suitable price retracement.

TRY/JPY | Before The Announcement

TRY/JPY | After The Announcement

Next, we will discuss the impact of the news on the TRY/JPY currency pair, where we see that the market is moving in a range, and the overall trend is up. As the Turkish Lira is on the left-hand side, a ranging market indicates an indecision state of the market. Before the news announcement, price is at the ‘resistance’ area, and thus one can expect some selling pressure from this point, which can take the price lower. In such a market scenario, aggressive traders can take a ‘short’ trade in the market, expecting bad news for the economy.

The news release resulted in volatility expansion on the downside as the market reacted negatively owing to poor Government Debt data. The price crashed and closed as a strong bearish candle. But this was immediately retraced by a bullish candle, which could be due to the reaction from ‘support’ of the range. Thus, one should go ‘short’ in the pair after the price breaks key levels as the overall trend is up.

EUR/TRY | Before The Announcement

EUR/TRY | After The Announcement

The above images are that of the EUR/TRY currency pair, and here too, the market is range-bound where the overall trend is down. Since the Turkish Lira is on the left-hand side, a ranging market indicates a moderate strength in the currency. Just before the announcement, price is at the ‘bottom’ of the range, and one can expect some buying strength in the market, which can take the price higher from here. The safer approach is to wait for the shift in volatility due to news release and then trade based on the data.

After the data is released, the market, just as in the above pairs, moves higher sharply, and traders sell Turkish Lira. The bullish ‘news candle’ indicates that the Government Debt data was extremely bad for the economy and thereby prompting traders to go ‘long’ in the pair. As now the price is at resistance, one should wait for a breakout and then ‘buy.’

That’s about ‘Government Debt’ and its impact on the Forex market after its news release. If you have any questions, please let us know in the comments below. Good luck!

Categories
Crypto Market Analysis Forex Elliott Wave Forex Signals

Bitcoin Cash Prepares for a New Rally

The price of Bitcoin Cash (BCH/USD) is preparing to develop a new rally that could take it to beat the previous highs of March, located in the area of 352.96.

BCH/USD, in its 4-hour chart, shows the advance of a potential upward impulsive sequence that began when the price found its bottom at level 133.67 last March 13th.

From the previous chart, we observe the price action advancing in its wave ((iv)) of Minute degree labeled in black. At the same time, this ongoing structural series is forming the internal segment corresponding to wave (c) of the Minuette degree identified in blue.

The wave (c) in progress began at the top of April 30th, located at level 275.95, when Bitcoin Cash completed its wave (b).

The internal structure of the wave (c) shows the intraday downward trendline joining the sequence of lower highs, which leads us to conclude that the short-term sentiment maintains on the bearish side.

On the other hand, according to the Elliott wave theory, for the long-term structural series to be a valid impulsive sequence, the wave ((iv)) must not penetrate the area of wave ((i)).

In this context, the corrective downward movement currently being developed by BCH/USD should not fall below the 200 level, which corresponds to the top of the wave ((i)).

On the other hand, one of the aspects that consider both the alternation principle and the construction of the extended wave indicates that an extended wave will be preceded or followed by a complex corrective structure.

Considering this Elliott wave concept, from the 4-hour chart, we observe that the current corrective sequence shows a level of complexity higher than the complexity level developed by wave ((ii)). Consequently, once the structural series of wave ((iv)) will complete, BCH/USD should perform a new upward impulsive movement that should present the characteristic of an extended wave, which could surpass the level 352.

In conclusion, as long as the wave ((iv)) of Minute degree does not finish, our preferred positioning will remain neutral, waiting for confirmation to enter on the bullish side that allows incorporation to the wave ((v)).

Categories
Forex Elliott Wave Forex Signals

EOS Consolidates on the Leading Diagonal Pattern

The EOS prices develop a bullish sequence following the Elliott wave structure of a leading diagonal pattern, which began on the March low at 1.4200.

The price action developed by EOS and reflected in its 4-hour chart, shows the cryptocurrency testing the baseline of the leading diagonal pattern, which links the end of the waves ((ii)) and ((iv)) of Minute degree labeled in black.

According to the textbook, a leading diagonal pattern is an impulsive structure having five internal segments, which are subdivided into an internal sequence 3-3-3-3-3. This pattern tends to appear on the first wave of an impulsive series.

So far, EOS completed a five-wave bullish sequence of Minute degree. This impulsive wave began in the March low at 1.4200. At the same time, this structural series gave rise to a higher-grade impulsive wave corresponding to the wave 1 of Minor degree labeled in green.

Following the wave theory described by R.N. Elliott, since EOS completed an impulsive movement, the market must perform a corrective sequence of the same degree and in the opposite direction to the previous move.

From the previous chart, we observe the price action developing a corrective downward movement. Within its internal structure, we recognize that the sequence in progress could correspond to a wave ((b)) of Minute degree identified in black.

This movement, which is composed of a three-wave internal structure, is moving on the baseline of the leading diagonal pattern. A bearish breakdown would activate the wave ((c)) in black.

Once EOS completes this three-wave sequence, it will end the wave 2 of Minor degree, and consequently, the price action will give way to a third upward wave.

According to the alternation principle between the impulsive waves, considering that the first wave has a lower momentum, the third wave could have a higher momentum than the first one.

In conclusion, in the short term, our preferred positioning remains on the bullish side, which will be confirmed once the Minor degree wave-2 is finished.

Categories
Forex Fundamental Analysis

Does The News Release Of ‘Gasoline Prices’ Impact The Forex Market?

Introduction

Despite the advent of alternate and renewable sources of energy, Oil remains the largest consumed non-renewable energy resource on the planet. Even after the Greenhouse effect debates, pollution, etc. we are still using Oil in a big way.

Although a shift has begun, a complete switch out of Oil will definitely take some decades and a lot of technological innovations. Gasoline Price is very closely tied to Consumer Expenditure, and many industrial activities, volatility in Gasoline Prices, affects the economy directly. Hence, understanding of Gasoline Price changes, its causes and consequences are essential for us in assessing macroeconomic indicators like Inflation, Personal Consumption Expenditures, or Consumer Prices Index, etc.

What is Gasoline Price? And Why is it important?

Gasoline is a carbon-based fuel that is extracted from Crude Oil through a process of distillation and refinement. Crude Oil is dark, heavy, and a sticky liquid that is naturally formed inside Earth. It is extracted, boiled to varying degrees, to distill away impurities to obtain purer forms like Diesel, Petrol (or Gasoline), or Fuel Oils, etc. Gasoline is lighter and is more in demand in the market.

As shown below, Oil is still the largest consumed energy source in the world, accounting for about 34% of all energy sources consumed. Gasoline is one of the first products that is obtained from Crude Oil. The general population and many industries depend on Gasoline heavily to conduct their lifestyle. Today almost, every household has a car or bike that requires Gasoline.

Changing Gasoline prices have a direct effect on the general public and dependent industries like Transportation sectors. Increasing Gasoline prices are always followed by a bitter reaction from the public as it increases their daily expenditures, how industries ship goods.

Gasoline prices are dependent on the following critical factors

(Source: gaspricesexplained.com)

Crude Oil Prices: The raw material used for Gasoline production primarily drives the Crude Oil Price as per the United States Energy Information Administration. Crude Oil is available on almost all the continents, except Australia, where it is quite less relatively. Countries like Saudi Arabia, Venezuela have the most abundant reserves of Crude Oil and are essential players in the global Oil market.

The process of extraction is also dependent on terrain where Crude Oil is found. For example, in Canada, the sandpits of Alberta make it challenging to extract Crude Oil that makes it relatively expensive.

Refining: The number of impurities present in the extracted Crude Oil also categorizes the Oil into “sweet or sour Oil.” Sweeter/Lighter Crude Oil contains lesser impurities and hence is easier to refine. The heavy or sour Oil is more abundant and relatively less in demand. The sweet is the more preferred Oil and is the standard when we see Crude Oil pricing. Refining costs vary seasonally as different parts of the world have to follow different mandates on pollution levels, refining technologies available in the regions. Other ingredients like ethanol that are mixed into Gasoline are also minor factors.

Taxes: Taxes add to the Gasoline prices. The Governing body of the country imposes the excise taxes that add to the final consumer price. As of now, on average, all taxes, i.e., federal and local state taxes, included average to 17% of the total Gasoline price.

(Picture Credits: gaspricesexplained.com)

Transportation: Most of the Gasoline is shipped from refineries by pipeline to terminals near consumer regions. It is delivered through tanker trucks to individual gas stations. The price of all this transportation cost and profits are included in the final price. The taxes and transportation costs remain largely constant relative to the Crude Oil price volatility.

Organization of the Petroleum Exporting Countries (OPEC): It is an organization of 12-oil major producing countries that make up 46% of the world’s oil production. They regulate the price of fuel to sustain this non-renewable resource for an extended period.

Speculation: Energy traders speculate Oil prices frequently that drive up or down the Oil prices based on their projected views about the future Oil prices. The volatility is increased due to speculation and tends to create an asset bubble.

How can the Gasoline Price numbers be used for analysis?

There is a positive correlation between Gasoline and Crude Oil prices in general. The dependency on Gasoline, a high growth rate of the emerging countries, increasing world population, etc. all have increased the demand for Gasoline overtime. For now, there is no significant alternative to compete with Gasoline. Other options like Natural Gas, Electric vehicles are in their budding state and would take some years before they can become worthy alternatives.

Gasoline is a daily consumption, a non-durable commodity that is required by every country. There is no country as of now that is entirely Gasoline-independent. Every country uses Gasoline for one or the other purposes as it has 84% fuel efficiency when burnt (meaning 84% of it is converted into energy).

As attempts to significantly switch to alternate sources of energy are being made, there is still some time left before we see renewable alternatives to Gasoline.

Impact on Currency

An increase in Gasoline Prices is reflected in the Personal Consumption Expenditures reports. As fewer people are able to afford highly-priced Gasoline, Industries dependent on Gasoline mainly observe a cut in their profits that slows down their business. To avoid this, they may increase prices of their end product to compensate for this increase, which again inflates the economy further. The rising costs of Gasoline are terrible for the economy and the currency. It leads to price rises lead to currency depreciation.

Lowered Gasoline prices, stimulate consumption, and increases expenditure in other sectors by public and dependent industries. Changes in Gasoline prices due to Crude Oil price changes take about 4-6 weeks to translate. Gasoline prices are lagging indicators for the Energy traders and have a low impact on the Energy trading community. On the other hand, prolonged increases in Gasoline prices has long term depreciating impact on the currency and the economy.

Economic Reports

Gasoline prices are available daily on the internet on many websites. For the United States, The United States Energy Information and Administration releases the weekly Petroleum status report on its official website.

The OPEC’s Monthly Oil Market Report details the significant causes affecting the world Oil Market that is published on the 12-16th of every month on their website.

Sources of Gasoline Prices

Global Oil market prices & News can be found in the below-mentioned sources.

Oil PricesOPEC – Oil Prices and reserves dataOPEC MOMRGlobal Gasoline Prices – Trading Economics | EIA – Weekly

Impact of the ‘Gasoline Prices’ news release on the price charts 

Gasoline Prices have a major role to play went it comes to the development of the nation. Everyone knows that higher Gas Prices will make each of to pay more at petrol bunks, leaving less to spend on other goods and services. It not only has an effect on the public on an individual level, but higher gas prices also have an effect on the broader economy. Economists and analysts also believe that there is a direct correlation between consumer confidence, spending habits, and gas prices. As gas prices decrease, a large percentage of institutional traders feel that the economy is ‘getting better.’ By this, we can say that the announcement of Gasoline Prices have a major impact on the currency pairs and can cause moderate to high volatility in the pair.

In today’s article, we will be analyzing the impact of Gasoline prices of North America on the U.S. dollar. The Gasoline Prices are published on a Weekly, Monthly, and Annual basis by the U.S. Energy Information Administration. They also provide a statistical analysis of the report. The above image shows the weekly retail Gasoline Prices.

AUD/USD | Before The Announcement

We start our analysis with the AUD/USD currency pair, and the above image shows the state of the chart before the Gasoline Prices are announced. The market essentially is moving in a ‘range’ where the price is repeatedly reacting from ‘resistance’ equals ‘support’ area. Also, the overall trend remains to be up. In such a market scenario, it is prudent to wait for the news announcement and then trade based on the change in volatility in the market. As the Gasoline Price economic indicator is a highly impactful event, there can be extreme movements in the market on either side. However, technically, the bias is on the ‘buy’ side.

AUD/USD | After The Announcement

After the weekly Gasoline Prices are released, price drops sharply, and volatility increases on the downside, owing to a decrease in the Gasoline Prices compared to the previous week. As the U.S. dollar is on the right-hand side of the pair, to buy the U.S. dollar, we need to sell the currency pair. This is why we see a fall in the price after the data is announced, which was positive for the U.S. economy. Even though the market reacted to the news release on expected lines, we should not forget that the price is exactly at the bottom of the range. It is not surprising to see buying strength from here, and therefore we should wait for key levels to be broken to trade based on the News.

EUR/USD | Before The Announcement

EUR/USD | After The Announcement

The above images represent the EUR/USD currency pair. Looking at the first image, we can say that the market is in a downtrend that began recently. Since the selling pressure is above average in the pair, a news announcement that is positive for the U.S. economy is favorable for taking a ‘short’ trade in the pair. On the other hand, we can look to ‘buy’ the pair only if the news release is extremely bad for the U.S. economy.

After the announcement is made, the market falls, and what we see is a firm bearish candle. A decrease in Gasoline Prices is considered to be positive for the economy and, thus, the currency, which is why traders sell Euro and buy U.S. dollars. One can sell the currency pair after a retracement of the price to the moving average.

USD/CAD | Before The Announcement

USD/CAD | After The Announcement

Lastly, we discuss the USD/CAD currency pair where before the news announcement, we see that the market is in a very strong uptrend and currently at a place from where the market had reversed earlier. The continuous bullish green candles suggest a great amount of strength in the U.S. dollar. Thus, a negative Gasoline Price indicator data that is bad enough to cause a reversal in the trend is an appropriate situation for going ‘short’ in the pair. Technically, the chart is more supportive of going ‘long’ in the pair.

After the data is released, we see that the price breaks out above the resistance area and closes as a ‘bullish’ candle. Here too, the market reacted similarly to the above pairs based on the robust Gasoline Prices. One should be ‘buying’ this pair only after the price retraces to the moving average and bounces off from the line. In this way, we will be trading along with the trend, and the stop loss will be below the ‘news candle.’

That’s about ‘Gasoline Prices’ and its news release impact on the Forex market. If you have any questions, let us know in the comments below. Good luck!

Categories
Forex Fibonacci

Fibonacci Levels Help Traders Make Better Trading Decision

In today’s lesson, we are going to demonstrate a chart where the price makes a strong bearish move from a Fibonacci level. It has two messages, which we will find out soon. Let us get started with the chart’s price action.

The chart shows that the price makes a strong bearish move. The last candle comes out as a long bearish candle, which states that the sellers dominate over the buyers. Traders may want to wait for the price to make a bullish correction to go short in the pair with more aggression.

The chart produces a bullish inside bar. The sellers are to keep their eyes on the pair to get a bearish reversal candle to go short. It seems that the pair may produce a strong bearish reversal candle (the signal candle) soon.

The chart produces a bearish inside bar, which is not the sellers’ favorite to go short. The price makes a little bearish move and heads towards the North again. Look at the last candle in the chart. It comes out as a bearish engulfing candle, which is one of the strongest bearish reversal candles.

As expected, the bearish engulfing candle drives the price towards the South. The sellers on the minor chart are going short. Thus, the price is about to make a breakout at the last swing low on the chart as well.

The price makes a breakout at the last swing low and heads towards the South further. Then, it produces two bullish candles in between but continues its bearish journey again. The price may have found its support since it produces four consecutive bullish candles. The price may continue its bearish journey, or it may make a bullish reversal. The bull looks good here. Let us draw Fibonacci levels and see whether it gives us a clue about the trend continuation or a reversal.

The chart produces a bullish inside bar right at 138.2 level. Please note that the price makes its bearish move from 78.6 level. The level of 78.6 has a strong relation with 138.2. If the price trends from 78.6, it often makes a reversal at 138.2. This is what happens here.

To sum up, if we learn the art of using Fibonacci levels and understand how a level is related to others, it becomes easy for us to take trading decisions such as entry, exit, and taking a partial profit. In the end, it makes us prolific traders.


Categories
Forex Fibonacci

Fibonacci Trading and Deeper Correction

In today’s lesson, we are going to demonstrate an example where the chart produces a reversal candle at a Fibonacci level, but the price does not head towards the trend’s direction. It then makes a deeper correction. It finds its new resistance and heads towards the trend’s direction with good momentum. Let us now have a look.

The price heads towards the South with excellent bearish momentum. It produces six consecutive bearish candles, four of them having solid long bearish bodies. The sellers are to wait for the price to make a bullish correction and to produce a bearish reversal candle at the value area. Let us proceed to the next chart.


The price makes a bullish correction and produces a bearish engulfing candle. However, the price does not make a bearish breakout. It rather goes towards the North again. The last two candles come out as bullish candles. The price goes towards the North further for a deeper correction.

The chart produces a bearish Marubozu candle. The combination of the last two candles is called Track Rail. The Track Rail is one of the strongest reversal signal candles. The sellers may keep their eyes on this chart with attention. The Fibonacci traders may draw their Fibonacci levels to find out which level it is trending from.

Let us proceed to the next chart to find out what the price does.

The chart produces another bearish candle and makes a breakout at the wave’s lowest low. The Sellers then take control of the pair and drive the price towards the South at an extreme pace. The last candle on this chart comes out as an inverted hammer. It suggests that the price may keep heading towards the South. However, do not forget that the chart produces a bullish Pin Bar as well, and the last candle closes within the level of support where the Pin Bar bounces off.

Anyway, let’s draw the Fibonacci level on the chart and see how the price reacts to some levels.

The chart gives us a clearer picture. At first, the price produces the bearish reversal candle at 78.6. The asset does not make a breakout. Instead, it goes towards the North and finds its resistance at 61.8. The level produces a bearish reversal candle followed by a breakout at the wave’s lowest low. The price then hits 161.8 level with ease.

If the price makes a breakout by trending from 78.6, it may not hit 161.8 level. The price usually reverses at 138.2 if it trends from 78.6. Stay tuned. We are going to study with some live examples on this soon.


Categories
Forex Fundamental Analysis

How The ‘Terrorism Index’ News Release Impacts The Forex Market?

Introduction

Terrorism Index is a macroeconomic indicator that can influence long term investing and foreign investments flowing into an economy. The smoothness in business activities and productivity of the economy is influenced by acts of Terrorism, thereby affecting the overall Gross Domestic Product (GDP). Hence, understanding the changes in Terrorism Index and its impact can help economists and policymakers make critical decisions towards the country’s growth.

What is Terrorism Index?

Terrorism Index, also known as the Global Terrorism Index (GTI), is a report that gives us a comprehensive summary of the key global trends and patterns in the acts of Terrorism. It is one of the measures of Terrorist Activity in different economic regions.

Terrorism: According to GTI, Terrorism is defined as the threatened or actual use of illegal force & violence by a non-state actor to achieve an economic, political, religious, or social goal through fear, coercion, or intimidation.

It also details incidents of Terrorism throughout the globe for the past 50 years, covering the period of the beginning of 1970 and the change in recent periods. It also identifies and categorizes terrorists into designated groups. GTI also ranks the countries that it covers as per the degree of Terrorist Activity being experienced by those economies. It covers 163 countries that attribute to about 99.7 percent of the world population.

Below is the top ten countries list losing their GDP due to acts of Terrorism.

How can the Terrorism Index numbers be used for analysis?

Acts of Terrorism harm the economy. The impact of Terrorism is calculated through IEP’s cost of violence methodology. The methodology includes direct costs like loss of lifetime earnings, medical bills for treatment, and property loss from terrorism incidents. It also accounts for indirect effects like a loss in productivity, job or earning losses, psychological traumas that impact the victims and their associated family and friends.

Prolonged periods of terrorist activities can result in an unstable economy, where people may panic and fear for their life that impacts social order, political tensions, security threats, and leads to economic contractions. The more the terrorist activities, the lesser the chance for governing bodies to spend on public and growth, and the overall majority of revenue goes into combating Terrorism and bringing back the economy to its normal state.

Overall the economic impact is divided into four categories: deaths, injuries or fatalities, destruction of property, and GDP losses from Terrorism. Terrorism has many implications for the larger economies. It depends on the duration, level, and severity of the terrorist activities. Typically, when countries suffer more than 1000 deaths from Terrorism, IEP’s model includes national output losses that are equivalent to two percent of the total GDP.

The deaths from Terrorism has a significant impact overall, followed by GDP losses. The global economic impact of Terrorism was 33 billion U.S. dollars in 2018, 38 percent lower than in 2017. Terrorism also has wide-ranging economic consequences that have the potential to spread quickly through the global economy with significant social ramifications.

The violence caused by Terrorism, and the fear of Terrorism creates critical disruptions in the economy. It changes the economy’s behavioral patterns, like changes in investment and consumption patterns, diverting public and private away from productive and economic activities towards protective measures. Developed economies are able to absorb the economic shocks of Terrorism better than growing economies. Terrorist activities directed towards specific organizations specifically hurt that company’s stocks in the short-term.

Trades become costlier as it has to account for increased security and higher wage premiums for workers working during such uncertain times. Countries whose main revenue streams include tourism take a severe hit as terrorist attacks significantly reduce tourist arrivals and, accordingly, the revenue from it.

Impact on Currency

GTI is an inverse indicator, meaning; low GTI levels are suitable for the economy and the currency. High levels of GTI results in allocating a lot of government resources in combating and containing Terrorism. In extreme cases, the regions experiencing high levels of terrorist activities can enter curfews for weeks or even months on end that is bad for the economy.

High GTI discourages foreign capital flow into the economy as investors are not sure of a smooth growth of business and industries within that economy when frequent disturbances are expected.

Terrorism Index is an annual metric and has a low impact on the volatility of the market as it is a lagging indicator and shows the long term trends and studies of Terrorism. The more direct consequences are obvious through other macroeconomic indicators, but GTI is useful for investors and impacts long term growth plans of the economy. High GTI can also lead to shying away from foreign companies to invest and expand in the country.

A decrease in the percentage of GTI is indicative of recovering economy and hence, can be used as a positive signal for growth overall.

Economic Reports

The Global Terrorism Index (GTI) report is released by the Institute for Economics and Peace (IEP) and was developed by Steve Killelea, the founder of IEP. It obtains its data from mainly from the Global Terrorism Database (GTD) and some other sources.

GTD data is collected at the University of Maryland by the National Consortium for the Study of Terrorism and Responses to Terrorism (START). It is an annual report that is released at the year-end, usually around November and December, on the official website of Vision of Humanity organization.

Sources of Terrorism Index

The GTI and Peace reports are available on the official website of the Institute for Economics and Peace – Institute for Economics and Peace – Reports

We can refer the 2019 GTI report here: GTI – 2019

We can find the GTI for different countries listed out in various categories here.

Impact of the ‘Terrorism Index’ news release on the price charts 

The report of the Global Terrorism Index is gaining a lot of importance today as it measures the amount of loss incurred by a country due to the destruction caused by the terrorism activities. The report consists of patterns and trends of terrorism activities in 163 countries. It also measures the economic impact of Terrorism.

Terrorism, for instance, impaired the GDP growth of 18 Western European countries from 1971 to 2004, where the GDP per capita fell by 0.4 percentage points. A large terrorist attack can affect financial markets negatively in the short-term. However, in the long term, they continue to function efficiently, absorbing the shock. Therefore, more and more countries try to quantify the effects of Terrorism on the granule level so that the currency is not adversely impacted.

In today’s article, we will be analyzing the impact of the Global Terrorism Index news announcement on various currency pairs and interpret the change in the volatility. For illustration, we have considered the Terrorism Index of the U.S., where the below image shows the Rank, Score, and the Change in Rank from the previous year. It represents the year-on-year Terrorism Index Score of the U.S., which was released in November.

EUR/USD | Before The Announcement

The above image is that of the EUR/USD currency pair before the news announcement, where we see that the overall trend is down, and currently, the price has retraced up to a key level of support equals resistance. From the knowledge of technical analysis, this is the perfect trade setup for going ‘short’ in the market, but since there is a news announcement on the next day, it is wise to wait and then trade based on the numbers. However, aggressive traders take a ‘short’ trade with a larger stop loss above the recent ‘high.’

EUR/USD | After The Announcement

After the Global Terrorism Index numbers are announced, the price goes lower, and there is an increase in volatility to the downside. But the candle leaves a wick on the bottom and closes near the opening price. Initially, traders bought U.S. dollars because of the positive economic indicator data where the Terrorism Score was better than last time, and the rank reduced by two positions. Even though it was positive, there were some traders who felt it was that robust, which is why the selling did not sustain. One can still go ‘short’ in the pair but with a shorter ‘take-profit.’

USD/JPY | Before The Announcement


USD/JPY | After The Announcement

The above images represent the ‘daily’ timeframe chart of USD/JPY currency pair, where in the first image, it is clear that the market is moving within a channel, and now it is at the bottom of the channel. Technically, it is the right place for going ‘long’ in the market as one can expect some buying force from here. A ‘buy’ trade is only for the aggressive traders, and others still need to wait for the clarity in news data. But since a news announcement.

After the numbers are published, volatility increases on both sides, and the candle managed to close in green. The market reaction was again neutral in this case as the Terrorism Index data was mildly positive to mixed, which is why the ‘news candle’ forms a ‘Doji’ candlestick pattern. Thus, one can now go ahead and take a ‘long’ position once the price goes the moving average with a ‘take-profit’ near the upper trendline.

NZD/USD | Before The Announcement

NZD/USD | After The Announcement

These are the images of NZD/USD currency pair, and since the U.S. dollar is on the right-hand side of the pair, a down-trending market means that the U.S. dollar is showing strength. Though recently, the price is moving in a range and right before the announcement, it is at the top of the range, also known as ‘resistance.’ Another important point of consideration is that the volatility has increased on the upside, and this could be a sign of reversal. Therefore, ‘short’ trades from here have to be taken with caution.

After the Terrorism Index data is released, we see that the market moves lower and a moderate increase in volatility to the downside. The news outcome did not create the kind of impact that was expected and seen in other pairs. Thus, we need more indication from the market in order to go ‘short’ in the currency pair.

This ends our discussion on the ‘Terrorism Index’ and its relative news release impact on the Forex price charts. If you have any questions, please let us know in the comments below. Good luck!

Categories
Forex Elliott Wave

How to Count Using the Elliott Wave Principle Part 1 of 3 – Advanced Level

Introduction

Wave counting is a systematic process by which the wave analyst identifies in a logical and standardized order the movement developed by the action of the market.

R.N. Elliott, in his work “The Wave Principle,” comments out that counting is not the most relevant part of the study of wave theory; however, this process empathizes that it is useful when studying the market progress across time.

Elliott, the Wave Principle, and Financial Markets

The Wave Principle, defined by R.N. Elliott, is part of the law of nature, which, when known, can make predictions without knowing the underlying causes that originated this phenomenon.

In this context, financial markets are the result of a socio-economic interaction, which reflects the psychological feeling of the participants interacting in the negotiation process.

Despite the interests of each market participant, the outcome of the trading process is reflected in a price chart.

Elliott, in his work “The Wave Principle,” detected that price tends to make repeated movements over time. 

On the one hand, there are movements that, over time, create trends. Elliott defined these movements as impulsive and are characterized by being composed of five segments.

On the other hand, Elliott described movements that oppose to impulsive moves as corrections and are composed of three internal segments.

Once the price action completes an impulsive sequence and a corrective movement, the market completes a cycle and starts a new one of similar dimension or degree

The following figure shows the complete structure of a cycle.

What We Have Studied So Far

Until now, our study of wave analysis has included the following aspects:

  • Identification of directional and non-directional movement.
  • Impulsive and corrective structure.
  • Types of corrective waves.
  • Extensions.
  • Canalization.
  • The alternation principle.
  • Validation of impulsive and corrective waves.
  • Complex corrective structures.
  • Identification and wave degrees.

The process of analyzing and identifying waves will be an integration of all these concepts, which will allow the wave analyst to make a high probability forecast for the next market movement.

The Degrees Importance

R.N. Elliott defined a set of degrees that do not obey a specific timeframe, for example, hourly chart, or 2-day temporality. But allow the wave analyst to evaluate a structural sequence that maintains a proportionality in terms of price and similar time.

Also, the use of the degrees allows us to identify, and in turn, to predict what will be the next movement that should act for the price in a given time horizon.

The following table shows the different degrees described by Elliott and the contributions incorporated by Prechter & Frost in his work “Elliott Wave Principle.”

In general, our analyses will start from the Subminuette degree.

Conclusions

In this first section, we have seen the basis of the Wave Principle developed by R.N. Elliott. Likewise, we review the structure that makes up a complete cycle and concludes with the description of the different degrees that Elliott defined to maintain a systematic order in the process of analysis.

In the next educational article, we will review the different regression rules that will allow us to systematize the counting process in the first wave count.

Suggested Readings

  • Neely, G.; Mastering Elliott Wave: Presenting the Neely Method; Windsor Books; 2nd Edition (1990).
  • Prechter, R.; The Major Works of R. N. Elliott; New Classics Library; 2nd Edition (1990).
  • Prechter, R., Frost.A.J.; Elliott Wave Principle: Key to Market Behavior; New Classic Library; 10th Edition (2005).
Categories
Forex Fibonacci

Fibonacci Trading: How Fibonacci Levels Can be Used in Trading?

Fibonacci levels and price action around those levels give traders clue what they should do with their potential trade setup. The 61.8% level is the most significant level, which is paid attention by the traders to make a trading decision. The price usually goes towards the level of 161.8% when it trends from 61.8%. Since it creates enough space for the price to travel, different traders trade and make use of the wave-length in differently.  We will learn some other strategies that are integrated with Fibonacci levels. Meanwhile, let us demonstrate an example of a chart where the price reacts at 61.8% and trends towards 161.8% afterwards.

The chart shows that upon producing a double bottom, the price heads towards the North and makes a new higher high. The buyers are to wait for the price to make a bearish correction now.

The price heads towards the South upon producing a bearish inside bar. The last candle comes out as a bearish engulfing candle closing within a flipped support. Let us wait and see whether the level produces a bullish reversal candle.

The price produces three bullish candles at the flipped support. The last candle looks to be the strongest one. The price may head towards the North and makes a breakout at the highest high of the wave.

As expected, the price heads towards the North and makes a breakout at the highest high of the wave. The price continues its journey towards the North further. The last candle on the chart comes out as a bullish candle having a long upper shadow. Do you notice anything interesting here? Look at the next chart.

The price after making a bullish move, it starts having a bearish correction. The price consolidates around the 61.8% level. It produces a hammer and heads towards the North. It makes a breakout at the last highest high and heads towards the North with good bullish momentum. The price hits 161.8% as it usually does when it trends from 61.8% level.

Some traders go long in this chart before the price makes the bullish breakout. As long as 61.8% level produces a strong reversal candle, they trigger their entry. It provides an excellent risk-reward but less winning percentage. On the other hand, some traders trade once the price makes a breakout. This offers not that great a risk-reward but an excellent winning percentage.

Categories
Forex Fundamental Analysis

‘Initial Jobless Claims’ – What Should You Know About This Fundamental Indicator?

Introduction

The Initial Jobless Claims is a weekly statistics released by the United States department of labor. Unlike most other indicators that are released monthly, this report has an additional advantage. Because the Initial Jobless Claims report predicts the unemployment two to three weeks ahead compared to the employment report that is released monthly.

What is the Initial Jobless Claims report?

Jobless claims report comes directly from the United States department of labor, AKA. DOL. The department of labor is an executive branch of the United States Federal government and is mainly responsible for monitoring and promoting employment, employee welfare, improving employee wages, and helping them to claim their employment benefits. To do so, it enforces the main Federal laws and regulations.

The United state has a provision for providing insurance for those who are unemployed. In the year 1935, this policy came into implementation. Although it does not mean that every unemployed person is eligible, it has certain criteria. Insurance is provided to the people who have worked for a certain period and have recently lost their job due to factors that do not directly involve them.

For example, seasonal layoffs or business closure, the unemployment compensation insurance is applicable. The payment of compensations is for about 20-26 weeks, which may vary from state to state. The amount is usually a percentage of their most recent average wage for the year.

The initial jobless claim is different from them continued jobless claims. This report only shows the number of people who have applied for the unemployment benefit for the first time during the last week. In this regard, it becomes slightly more important than the continued jobless claim as it indicates the increase or decrease in the unemployment rate within the country.

How is the Initial Jobless Claims calculated?

The Initial Jobless Claims is prepared by the department of labor, which receives this data from state unemployment offices, which intern receive them from the local unemployment offices. The department of labor releases this report at 8:30 a.m. Eastern Standard Time.

Although many citizens apply for the benefit, it necessarily does not represent all the eligible people. Because, it is just a claiming, which will be either considered valid or invalid by the respective departments later.

Is the Initial Jobless Claims important?

When trying to assess the importance of the Initial Jobless Claims report as an economic indicator, there are many things we need to keep in mind.

The report does not cover the entire population. Not all people who are eligible for benefits apply for the same. Many people who are not eligible for the benefits will also apply. Also, the report is very volatile from week to week and is also a function of seasonality.  Hence, A four week moving average of the Initial Jobless Claims report irons out this volatility.

Below is a snapshot of the initial jobless claim report for the period of January- 2018 to February-2020. As we discussed, the numbers are very volatile, which makes it one of the ‘not-so-easy to decode’ economic indicators.

An increase in the Initial Jobless Claims report numbers relative to the previous numbers tells that more people have lost a job in the recent time. This has been historically associated with times of GDP contraction and economic stagnation. In other words, it indicates the beginning of an upcoming recession. A conversely significant decrease in the report occurs when the economy is coming out of recession and progressing towards economic growth (GDP expansion).

How can the Initial Jobless Claims Report be Used for Analysis?

The Initial Jobless Claims can act as abridge towards assessing the unemployment rate or the employment situation report (which are released monthly). The frequency of the report is the main advantage in comparison to other indicators. Because it allows interested people to get the most current economic situation. As mentioned, it can give us an idea about economic health two to three weeks before the employment reports that are released monthly.

Some Forex traders who are looking to buy or sell the US dollar can use this report for the most recent data in this regard. Higher the number, lesser is the confidence in the economy’s strength and vice versa. But in general, this is a minor indicator in comparison to the monthly reports, which are complete, thorough, and consistently reliable as they cover a greater section of the nation’s population.

Overall the Initial Jobless Claims report is a cruder and rudimentary indicator and is not robust or consistent at all times. But to some extent, it can reflect the direction in which the economy is heading. It may not be easy for us to know the minor movements in the economy accurately, but major movements get definitely reflected. In such cases, the Initial Jobless Claims report can also act as one of the main leading indicators to predict any oncoming recession or expansion of the economy.

Sources of Initial Jobless Claims Reports

The United States Department of Labor releases the Initial Jobless Claims report weekly on their official website in the ‘news releases’ section. Reference link – Initial Unemployment Insurance Claims

You can also find the same indexes diversified and other related categories like Continued claims etc. on the St. Louis website.

Impact of the ‘Initial Jobless Claims’ news release on the price charts 

After understanding the definition and significance of Initial Jobless Claims as an economic indicator, we are ready to find out the impact of the same on the currency. As we know that Initial Jobless Claims measures the number of individuals who filed for unemployment insurance for the first time during the week, and the impact is said to vary from week to week. A higher than expected reading is considered to be negative for the currency while a lower than expected data is taken as positive. The data has a moderate to high impact on a currency that causes a fair amount of volatility in the pair.

The below image shows the previous, forecasted and actual number of people who filed for unemployment insurance for the third week of March. We can see that the Jobless Claims were much higher than before with a rise in 70K people. From prerequisite knowledge, this should be extremely negative for the economy and hence the currency, but let us examine the reaction of the market.

USD/JPY | Before The Announcement

We start our analysis with the USD/JPY currency pair, where we notice a strong uptrend, which a result of excessive buying interest of US dollars. The strength in the US dollar could be due to another fundamental factor that is driving the currency higher. Technical analysis tells that when the market is trending strongly in one direction, we need to wait for a retracement to join the trend or wait for market reversal patterns. Hence, before the news announcement, we do not find any suitable way to position ourselves in the market.

USD/JPY | After The Announcement

After the Initial Jobless Claims are announced, volatility increases on both sides but finally closes in the form of ‘Doji’ candlestick pattern. Even though the data was very bad, it was bad enough to cause a reversal in the market. After looking at the market reaction, we can say that the data created confusion among traders as the market consolidates after the news release. Since the Unemployment data did not cause the price to break key levels of support and resistance, the uptrend is still intact. Therefore, one can enter for a ‘buy’ after an indication from an important technical indicator.

GBP/USD | Before The Announcement

GBP/USD | After The Announcement

The above images represent the GBP/USD currency pair, where we witness a strong downward move on the previous day before the news release. After the big move, market moves in a range, and just before the announcement, the price is at the ‘support’ area. This means traders who are optimistic about the Unemployment data can position themselves on the ‘long’ side with a strict stop-loss below the support.

After the news announcement, we hardly notice a change in volatility, and the candle again forms an indecisive pattern. Since the Jobless Claims data did not cause any drastic change in volatility, traders can enter for new ‘long’ positions or hold on their existing ones and should compulsorily exit at the nearest resistance.

GBP/USD | Before The Announcement

GBP/USD | After The Announcement

The GBP/USD currency pair shows similar characteristics as that of the USD/JPY pair, where before the news announcement, the market is in a strong uptrend. In such market scenarios, we essentially cannot position ourselves on any side of the market as we don’t have any technical factors supporting our trade. Therefore, it is wise to wait for the news release and then act based on the data.

After the Initial Jobless Claims numbers were announced, we see an increase in volatility but with no bias. It results in the formation of an ideal ‘Doji’ candlestick pattern with wicks on both sides and small body. Since the market did not collapse, we can conclude that the data was not damaging to the US dollar. From the trading point of view, we cannot enter for ‘buy’ even after the news release as technically, we need a retracement before we join the trend.

That’s about ‘Initial Jobless Claims’ and its relative news release impact on the Forex price charts. If you have any questions, please let us know in the comments below. All the best.

Categories
Forex Daily Topic Forex Fibonacci

Draw Fibonacci Levels on Your Trading Chart

Fibonacci traders are to find out a good move, followed by a price correction. They keep their eyes on the 61.8% level with extreme attention. If the level of 61.8% produces a reversal candle, traders trigger for entry. Usually, the price goes up to the level of 161.8% if the price trends from 61.8%. This allows an excellent risk-reward to the traders as well. In today’s article, we are going to demonstrate an example of how the golden ratio of 61.8% plays such an important role in moving the market towards the trend. Let us get started.

The chart shows that it makes a bullish move upon producing a bullish engulfing candle. The price makes a downside correction and moves towards the North again. This time the price makes the move with good bullish momentum. The Fibonacci traders are to wait for the price to make a downside correction and draw Fibonacci levels to go long in the pair. Let us proceed to the next chart to find out whether it starts having downside correction or heads towards the North further.

This is an interesting move by the chart. It has a bearish gap, but the candle comes out as a bullish candle. Despite having an upper shadow, this is a bullish reversal candle. Let us find out how the price reacts upon getting such a bullish reversal candle.

The price heads towards the North with extreme bullish momentum. The bull outplays the bear. This is such a strong bullish move that the buyers would love to make full use of it. Do you notice something interesting? Yes, the price trends from the 61.8% zone. Let us draw the Fibonacci levels and see how it looks.

The chart shows that despite having a bearish gap, the chart produces a bullish candle within 61.8% zone and heads towards the North. It hits the level of 161.8% in a hurry as well. This is what the Fibonacci golden ratio level does almost all the time. There are different ways of trading and catch such a move. Some traders enter before the breakout, while some enter after the breakout at the highest high of the wave. Both have merits and demerits, which we will learn in our forthcoming Fibonacci lessons. Meanwhile, concentrate on your chart and practice drawing Fibonacci levels by pointing out the highest high and the lowest low. Start practicing this, so you get well acquainted with Fibonacci significant levels and how the price reacts to them. This will help you trade much better soon.

Categories
Forex Fundamental Analysis

The Impact Of ‘Personal Saving’ News Release On The Forex Price Charts

Introduction

Personal Saving is one of the main components of Personal Income. Savings can give us hints on Consumer Spending patterns and future sentiments concerning financial matters. Personal Spending and Personal Savings are two primary sections into which the Disposable Personal Income divides, and the proportion of these two helps us ascertain short-term and long-term economic activity. Hence, understanding Personal Savings and Personal Savings Rate reports can help us solidify our understanding of fundamental analysis.

What is Personal Saving?

Personal Saving is the difference between Disposable Personal Income and Personal Outlays.

Disposable Personal Income (DPI), also called After-Tax Income, is the remainder of an individual’s income after all federal tax deductions. Hence, It is the amount people can spend, save, or invest.

Personal Outlays, or Personal Spending, refers to all the expenditures incurred to conduct one’s lifestyle, like rent, internet, fuel, transportation, groceries, etc.

For example, If an individual earns 100,000 dollars per year and his tax-deductible is 30%. His DPI is 70,000 dollars. If his year around expenses amount to 63,000 dollars, then the Personal Savings would be 7,000 dollars. Here, the Personal Saving rate would be 10%. Personal Savings would be the amount left after all the expenses have been deducted from the available income.

Personal Savings Rate (PSR) is the ratio of Personal Saving to the Disposable Personal Income expressed as a percentage.

Marginal Propensity to Save (MPS): It is one more metric used to assess Saving, which is defined as the ratio of the amount saved for each additional dollar. If a person got 100 dollars extra as a bonus this month, and if he spends 60 dollars of it and saves 40 dollars, then his MPS would be 0.4 (40/100). His general savings saw an increase of 40 dollars, and his disposable income saw an increase of 100 dollars. Hence, MPS considers the change in savings to change in income rather than the actual Saving.

Factors That Affect Personal Saving

DPI: An increase in Disposable Personal Income generally translates to increased savings once the necessities are met. Low levels of DPI mean that the majority of the available income is spent on Personal Expenditures leaving little room for saving. Personal Saving has been affected by variations in household net worth, consumer debt, and housing investment. In 2008 and 2009, during the most recent recession, the personal saving rate increased by about two percentage points each year, reaching 5.9 percent in 2009.

Economic Stability: Unstable economic conditions and frequent recessionary periods induce higher saving patterns in the general public as they cut back on their expenses to save for future rainy days. A growing and healthy economy see a stable saving rate and an increase in personal consumption, as people spend more when they have a positive sentiment towards their future financial security.

Deposit Rates: Banks pay interest to depositors for their deposited money. Higher interest rates can attract the general public to save money overspending as it would generate more money for future consumption.

Individual preference: How people traditionally see debt, mortgages, and savings also determines people’s saving and spending patterns. Generally, people from unstable economic regions or developing economies tend to save more than people who have always been in a stable economy. For example, the China saving rate is 35%, while that of America is around 8%. This cultural backdrop also plays a role in people’s tendency to save and spend. The proportion of different people within the economy will determine the direction of Personal Saving Rates.

How can Personal Saving numbers be used for analysis?

Changes in the saving rate are inversely related to changes in household net worth (i.e., cost of a house) as a percentage of DPI. The ratio of household net worth to DPI typically rises during periods in which household real estate and financial assets are appreciating and falls when these assets are losing value. As household assets appreciate, incentives to save from current income are lessened, while incentives to save are increased during periods of falling asset values.

An increase in Personal Savings is good for banks as they can give out more loans in one aspect and hence is good in the long run for the economy. But, in the short term, it implies expenses are cut back, which means businesses will see a slowdown, and that is not good either. An optimal balance between Spending and Saving has to be struck for sustained growth.

Personal Savings usually see an increase during economic shocks and recessionary periods. Hence a significant spike in Saving Rate can be considered as an indicator of an ongoing financial contractionary period.

Personal Savings numbers simply would be a function of growing population and inflation. If the economy improves, so does the Personal Savings. For example, saving 100 dollars ten years back and now are two different things. We have to take inflation and increase in wages into account. Personal Saving Rate is more accurate in this regard as it is proportional. This is illustrated clearly in the below graphs of PS and PSR, respectively.

Hence, PSR is more prevalent amongst economists and investors for analysis. Also, Marginal Propensity to Save is higher for wealthier people than for poorer people. Hence, MPS can also be used to understand what is the standard of living and wealth the general public is enjoying, which reflects the strength and wealth of the overall economy itself.

Impact on Currency

As such, there is no direct one-to-one indication of Personal Savings figure to GDP, but there is a pattern here, during deflationary conditions when the currency value depreciates there is an upward spike in Personal Savings figures. In this sense, it is an inverse indicator and has a mild-to-low impact on the currency market. Economic shocks can also increase the Personal Savings figure.

Due to the long-term nature of the figures themselves, the currency volatility is low around these numbers compared to other macroeconomic indicators. Still, they are useful in understanding the long-term direction of the economy.

Economic Reports

The United States Commerce –  Bureau of Economic Analysis releases Personal Saving as part of the monthly report titled “Personal Income and Outlays.”

BEA releases the report in the last week of the month for the previous month. Quarterly and Annual reports, Seasonally adjusted versions of the same, along with Personal Saving Rate Reports, are all available under this release.

Unlike the PCE (Personal Consumption Expenditure) report, the Personal Saving figures are not expressed in percentages. Instead, the Personal Saving Rates is more popular, which is a percentage metric.

Sources of Personal Saving

The monthly Personal Saving numbers releases can be found on the official website of the Bureau of Economic Analysis under the “Current Release” section. This data can be found here – Consumer Spending – BEA. The Personal Saving Rate report can be found here.

Historical and Graphical comparisons are available on the St. Louis FRED website. Visit these pages to access this information. Personal Savings – FREDPSR – FRED.

Personal Savings date for countries other than the USA can be found here.

Impact of the ‘Personal Saving’ news release on the price charts 

The Personal Savings Rate is a big determinant of economic activity. The savings of an individual are directly related to consumer spending, which accounts for 63% of GDP. Higher savings can generate higher levels of investments and boost productivity over the longer term. The Harrod-Domar model of economic growth suggests that the level of Personal Savings is a key factor in determining growth. This has an effect on the value of the currency, and traders have a short to long term view on the currency based on the Personal Savings data. Today we will be analyzing the fourth quarter Personal Savings data of Australia that was released on the following date.

The below image shows the latest and previous Personal Savings data, where it was decreased to 3.6% percent in the fourth quarter of 2019 from 4.8% percent in the third quarter of 2019. A higher than expected reading is considered to be bullish for the currency while a lower than expected reading is considered to be bearish.

AUD/JPY | Before The Announcement

The first pair we will be examining is the AUD/JPY currency pair, and as we can see in the above image, the price has shown signs of reversal and might be going lower. Just before the announcement, the market has retraced the recent down move and is somewhere near the support turned resistance area. Technically, this is the ideal situation for going ‘short’ in the market, but it is wise to do so after we get confirmation from the market.

 AUD/JPY | After The Announcement

After the Personal Saving numbers are announced, there is a sudden surge in volatility where the price the initially moves higher, but this gets immediately sold into, and the ‘news candle’ leaves a large wick on the top. When traders found the Personal Savings to be lower than last time, they sold Australian dollars and weakened the currency. This happened as the news was not healthy for the Australian economy. Once the volatility increases to the downside, one can go ‘short’ in the pair with a stop loss above the ‘news candle’ and a ‘take-profit‘ near the ‘support’ area.

EUR/AUD | Before The Announcement 

EUR/AUD | After The Announcement

The above images are that of the EUR/AUD currency pair, and since the Australian dollar is on the right-hand side, a down-trending market, as in this case, indicates strength in the currency. After the big move to the downside, the market has started moving in a range and volatility appears to be high on both sides. Just before the news release, price is at the bottom of the range, known as ‘support,’ and from here, we can expect some buying force, which can take the market higher.

But as there is news release in the next few minutes, it can bring a drastic change in volatility, and we cannot predict where the market will go. After the announcement is made, we see a similar reaction from the market as in the above pair, and the ‘news candle’ leaves a wick on the bottom. We find that the Personal Savings was lower than last time and poor. This is why we see some buying interest in the market from the support, and thus we can go ‘long’ in the market with a stringent ‘take-profit’ near the resistance.

NZD/USD | Before The Announcement


NZD/USD | After The Announcement

These images represent the AUD/USD currency pair, where we see that the market is in a strong uptrend, and the Australian dollar is showing a lot of strength. Before the Personal Savings numbers are announced, price is above the moving average, and the uptrend is very much in place. As we do not have any forecasted data available with us, we cannot take any position in the prior to the announcement. We need to notice the change in volatility and then take suitable in the market.

After the Personal Savings data is announced, the market falls owing to poor Personal Spending data, and we see some selling pressure. But since the price does fall drastically and we do not see any trend reversal patterns, going ‘short’ in this pair is ruled out. Thus, the news announcement does not have a major impact on this pair as the uptrend is very strong.

This completes our discussion on the fundamental indicator ‘Personal Spending’ and the impact of its news release on the Forex market. If you have any questions, please let us know in the comments below. Cheers.

Categories
Forex Elliott Wave

Alternation and Extensions in the Wave Analysis – Advanced Level

Introduction

In previous articles, we discussed the concepts of alternation and extensions and their importance in wave analysis.

R.N. Elliott, in his work “The Wave Principle,” described alternation as a principle of nature. Likewise, since financial markets are the result of human activity, and consequently part of nature, they are governed by the “law of nature.”

Elliott also identified the existence of extensions as part of impulsive movements. In particular, in his Treatise, Elliott points out that extensions should appear only on one of the three motive waves and never on more than one.

In this educational article, we will review and expand on the concepts of Alternation and Extensions applied in wave analysis.

Alternation

As we have seen in previous articles, alternation can be recognized in different forms, which are detailed as follows:

  1. Price, which corresponds to vertical advance, either increasing or decreasing.
  2. Time, which corresponds to the time taken by the construction of each wave.
  3. Severity, which is the ratio of the wave to the impulsive pattern, this aspect applies only to corrective waves 2 and 4.
  4. Complexity, which refers to the number of subdivisions that the Elliott pattern has in development.
  5. Construction, an Elliott wave pattern, can be a flat, zigzag, triangle, etc.

So far, we have studied the characteristics of alternation in the first three aspects. 

In impulsive structures, they can alternate in terms of time and price. However, in corrective structures, alternation in terms of price is usually not relevant. 

However, on alternation in time, in particular, one must verify the time taken by each phase of the corrective pattern, which in general will be very different from each other. Likewise, in terms of severity, if a corrective wave produces a deep retrace to the previous impulsive wave, likely, the next corrective wave will not show a deep retrace and vice versa.

The next aspect that corresponds to the alternation principle is complexity or intricacy, which refers to the number of internal subdivisions that have an Elliott wave pattern, compared to the number of subdivisions that have the adjacent structure.

In practical terms, it will be useful for the analysis of poly-waves and multi-waves. In this way, it will be helpful for one wave to be subdivided and the other not. 

The following figure shows cases for impulsive and corrective structures.

The alternation in terms of construction corresponds to the patterns that compose an impulsive or corrective structure. 

For example, in a corrective sequence in which the first movement is composed of a zigzag pattern, the next corrective move can be any structure, minus a zigzag. 

In this context, in the real market, a typical sequence is first the appearance of a zigzag and then a movement corresponding to a flat pattern, as shown in the following figure. Likewise, if the price action develops an impulsive structure, the next movement will correspond to a corrective structure of the same degree.


Extensions

Usually, in wave analysis, the extension and subdivision concepts tend to be used interchangeably. However, Glenn Neely, in his work “Mastering Elliott Wave,” shows that both terms are independent.

On the one hand, the extension corresponds to the wave with the longest movement in favor of the trend. As we have seen in previous articles, the extended wave appears in a single wave, and this may be in the first, third, or fifth wave, but it will never be present in more than one simultaneously.

On the other hand, the term subdivision applies to the number of segments constituting a wave, which can be impulsive or corrective.

Thus, the extended wave will not necessarily be the one with the most subdivisions. Likewise, as the complexity of the wave under study increases, the level of subdivisions that constitute it will also increase.

Finally, as indicated by R.N. Elliott in his Treatise, the extended wave is a relevant factor in terms of the behavior of an impulsive wave, either by what the most complex corrective wave will be. It can also lead the wave analyst to avoid losses and obtain gains from its knowledge.

When the first wave is extended, the structural sequence has a wedge shape. In this series of waves, the ends of waves 1 and 3 and waves 2 and 4 are joined. Usually, the fifth wave will end up under the higher guideline. The structure shall be complete when the price action violates the lower guideline joining waves 2 and 4.

When the third wave is the extended one, the fourth wave should not retrace beyond 38.2% of the third wave advance. If the retrace extends beyond 38.2%, this would be indicative of a weakness in impulsive movement, and consequently, the fifth wave should not reach a new high.

Finally, when the fifth wave is the most widespread, waves 1 and 3 may be similar, the third wave being slightly longer than the first and the fourth wave the most complex corrective wave compared to the second wave. The fifth wave will have the appearance of a false rupture of the directive that joins waves 1 and 3.

Conclusions

In this educational article, we have seen the importance of the principle of alternation in wave analysis, which can provide valuable information in the study of price action.

Also, knowledge of the alternation principle can help the wave analyst to identify which wave will be extended. In particular, when the analysts look to incorporate to the trend when it is in progress.

In the next educational article, we will study the process of wave counting and counting.

Suggested Readings

  • Neely, G.; Mastering Elliott Wave: Presenting the Neely Method; Windsor Books; 2nd Edition (1990).
  • Prechter, R.; The Major Works of R. N. Elliott; New Classics Library; 2nd Edition (1990).


Categories
Forex Daily Topic Forex Fibonacci

Fibonacci Trading: The Golden Ratio

Fibonacci trading is one of the most prolific trading methods, which is widely used by Forex traders. Retracement length, Fibo levels as well as reversal candle are three factors that Fibonacci traders need to pay attention to. In today’s article, we are going to demonstrate an example of a chart, which makes an excellent bearish move after having a retracement. The length of retracement, the most significant Fibo level, and the reversal signal all play their part in this example. Thus, fasten your seat belt and read through.

The chart shows that it makes a strong bearish move and makes a breakout at long-held support. The price heads towards the South, searching for its support. The sellers are to wait for the price to have a retracement.

The price starts having retracement. It produces a bullish inside bar followed by another bullish candle. The sellers are to wait for the price to find its resistance and produce a bearish reversal candle. However, the Fibonacci traders are to wait for the price to produce a bearish reversal candle at a very particular level, which is the 61.8 level.

The chart produces a bearish engulfing candle closing well below the last bullish candle. The Fibonacci traders must draw the Fibonacci retracement levels to find out which level produces this reversal candle. If this is the level of 61.8, the Fibo sellers are going to go short in the pair.

The highest high is the level of 0.00, and the lowest low is the level of 100.0. The price has a retracement and produces a bearish engulfing candle right at Fibo level 61.8. Usually, when the level of 61.8 works as support/resistance, it drives the price towards the level of 161.8. This means the price may head towards the South and hit the level of 161.8 next. Let us proceed to the next chart and see what the price does here.

The price hits 161.8 level. It makes an upward correction on its way. However, it reaches the level at last. The last candle shows that it breaches the level of 161.8. The price may head towards the South further.

The level of 61.8 is called the Golden ratio. It is a super significant level as far as Fibonacci Retracement is concerned. The buyers in a buying market and the sellers in a selling market wait for the price to produce a reversal candle/signal candle to go long/short in a pair. Yes, there some equations for the traders to know and obey to be able to trade with Fibonacci retracement. Once they learn them well, Fibonacci trading can make them a handful.

Categories
Forex Fundamental Analysis

Why ‘Personal Spending’ is Considered a Crucial Fundamental Indicator?

Introduction

Personal Spending makes up one half of Consumer Spending. As consumer spending drives total GDP, tracking Personal Spending patterns and changes can help us better understand the direction of the economy’s health.

What is Personal Spending?

In the broader sense, Personal Spending generally refers to Consumer Spending, which is a significant economic indicator as it drives about 70% of the total GDP. Consumer Spending is made up of two main components: Personal Saving and Personal Spending. Consumer Spending refers to the amount spent to meet daily needs and personal expenses to conduct one’s lifestyle.

In other words, it refers to the money paid for goods and services by the general public. The products and services can include all that we, as an individual, consume to live our lives. The groceries, the movies, the savings, the internet bills, phones, etc. all these are part of our lives that the Consumer Spending measures. Personal Spending in this regard is the more specific component of Consumer Spending.

Consumer Spending = Personal Spending + Personal Savings

Economic Reports

The United States Commerce: Bureau of Economic Analysis measures personal Spending in the form of Personal Consumption Expenditure (PCE) or Consumer Spending Report. PCE report measures the goods and services purchased by individuals and NonProfit Institutions Serving Households (NPISHs)—who are resident in the United States.

PCE also includes purchases by military personnel stationed abroad, regardless of the duration of their assignments, U.S. government civilian, and by U.S. residents who are traveling or working abroad for one year or less.

BEA releases the PCE report in the last week of the month for the previous month. Quarterly and Annual reports, Seasonally adjusted versions of the same, along with Personal Saving Reports, are all available under the release titled “Personal Income and Outlays.”

Why Personal Spending?

Personal Spending is one-half of the Disposable Personal Income (the net amount left after all tax payments from the gross income), and it includes the necessities and personal expenditures. Hence, some may refer to Personal Spending to the expenses incurred by money spent on personal enjoyment like going to Restaurants, Trips, buying jewelry, clothing, movies, gaming, concerts, etc.

In this sense, Personal Spending takes a hit during job loss, tight monetary conditions, or recessionary periods as people cut back on personal comforts and tend to save more for the future. Decreased Personal Spending is not a  good sign for the economy as it withdraws money from the system and stays in people’s bank accounts or pockets only.

The correlation between Personal Spending and the GDP of a nation is strong. As we can see below, during recessions, the GDP and PCE (Personal Expenditures Report)  flat out from their usual and trend sideways or downwards (during more extended recessionary periods), otherwise steadily increase at the same pace.

Real Gross Domestic Product (In Billions)

Personal Consumption Expenditures (In Billions)

How can Personal Spending numbers be used for analysis?

Savings are for future consumption, and Personal Spending is for current use. Personal Savings are suitable for the long-term growth and health of the economy, while Personal Spending is more beneficial for short-term growth. Personal Spending becomes essential when an economy is going in or coming out of recession. It is during these periods of economic contraction-edges where changes in the spending numbers can be used to predict the trend of the economic recovery.

Investors can also monitor the Personal Spending sections of the PCE report and determine the spending patterns of people and predict sectorial growth or slowdowns. For example, a few decades ago, the service sector was not as dominant as it is today. Today about 64% of the expenses go towards services. This change in trend is easily observable through PCE. Through PCE, we can predict which markets are likely to see a boom or slowdown.

For illustration, see the below graphical representation extracted from the BEA official website, of the primary services that people are spending their money on. HealthCare and Housing Utilities make up a majority of the services that are chosen by people when compared to other services like Transportation, or Recreation. Such analysis is very useful for investors and stock traders to assess the industrial performance of different goods and service sectors.

(Image Source – BEA official website)

Impact on Currency

Personal Spending is a proportional indicator. Higher numbers in the Personal Spending section signals a growing economy and hence is good for the currency. Dip in the figures results in currency depreciation. As drop signifies, people are spending less, which results in business slowdowns in the economy, which ultimately results in lower GDP print, which is depreciating for the currency.

Personal Spending is a mild impact indicator as the retail sales figures precede the PCE monthly reports where similar tradable conclusions can be drawn as that of PCE reports. A healthy and growing economy would be reflected in the Personal Spending numbers as the people make up the economy. It is important to remember that Personal Spending is a reflection of the present financial situations of the population and hence only shows what the current economic status of the nation is.

It is a coincident indicator in this sense and is dependent on macroeconomic factors like the government’s policies, Quantitative Easing, inflation, etc. which direct the money flow. Hence, it is the effect in the cause-and-effect equation. It reflects the results of an action rather than the act itself. 

Sources of Personal Spending

The monthly PCE numbers releases can be found on the official website of the Bureau of Economic Analysis – Personal Income and Outlays-PCE

As opposed to Personal Spending, you can find the Personal Saving Rate in these sources – Personal Saving Rate & Personal Income and Savings

Personal Spending data and statistics of various countries can be found here – Trading Economics – Personal Spending

Impact of the ‘Personal Spending’ news release on the price chart 

Now that we have a clear understanding of the Personal Spending economic indicator, we will now watch the impact of the indicator on the value of a currency. As Personal Spending measures the change in the inflation-adjusted value of all Spending by consumers, it accounts for a majority of overall economic activity. This report tends to have a mild to severe impact on the currency.

The below image shows the previous, forecasted, and latest Personal Spending data of the U.S., which is announced on a monthly basis. It is published by the Bureau of Economic Analysis and is the authoritative agency that conducts surveys across the country. A higher than expected reading is considered to be positive for the economy, while a lower than expected reading is considered to be negative. Let us examine the reaction of the market for the latest release.

USD/JPY | Before The Announcement

We will start analyzing the impact of Personal Spending data on the USD/JPY currency pair, where the above image shows the state of the chart before the news announcement. It very clear that the pair is in a strong downtrend, which means the U.S. dollar is extremely weak. One of the reasons behind weakness in the U.S. dollar is that the market participants are expecting lower Personal Spending figures for the month of February. At this point, aggressive traders can take ‘short’ positions in the market, owing to pessimism in the market, with a stop loss above the recent ‘high.’   

USD/JPY | After The Announcement

After the Personal Spending data is released, the market as expected goes lower, and volatility increases on the downside. The actual data came out to be lower than the forecasted data, and this made traders to further sell the currency pair. We can say that the poor Personal Spending data accelerated the downfall and took the currency much lower. This is the ideal and risk-free situation when it comes to taking a ‘short’ trade. Thus traders can sell the currency pair soon after the news release and have a much higher ‘take-profit‘ as the indicator has a severe impact.

USD/CHF | Before The Announcement


USD/CHF | After The Announcement

The above images represent the USD/CHF currency pair, where the behavior of the chart appears to be a little different from the previously discussed pair. A similarity in both the pairs is that the major trend is down. But here, the price has shown some signs of reversal before the news announcement. This could even possibly turn into an uptrend. As the volatility is high on both sides, it is advised not to carry positions in the market before the news release. One could even face issues such as high spreads and higher mark-to-market loss.

The news announcement resulted in a sudden price drop, and the market reacts negatively to the Personal Spending data. Thus the market here too gets bearish due to poor news data. As one does not see any trend continuation candlestick patterns after the news release, he/she shouldn’t be going ‘short’ in the market right after the announcement. Only after one sees such patterns, he/she can enter the market.

AUD/USD | Before The Announcement

AUD/USD | After The Announcement

These are the images of the AUD/USD currency pair, where the characteristics of the chart are totally opposite from the above two pairs. Since the U.S. dollar is on the right-hand side, a down-trending market would mean strength in the U.S dollar. Therefore in this pair, the U.S. dollar is extremely strong contrary to the above pairs where it was extremely weak. When the volatility is so high on the downside, it is less certain that an even a negative news outcome can result in a reversal of the trend.

After the news announcement, the market moves a little higher, almost negligible, owing to bad Personal Spendings data of the U.S., but this gets immediately sold, and the ‘news candle’ closes with a  wick on the top. Therefore, we can say that the Personal Spendings data did not have a significant impact on this pair, and volatility increased on the downside.

This completes our discussion on Personal Spending and the impact of its news release on the Forex market. If you have any queries, please let us know in the comments below. Cheers.

Categories
Forex Fundamental Analysis

Comprehending The ‘Tourism Revenues’ Statistics & Its Impact On The Forex Market

Introduction

The global connectivity through the internet, powerful smartphones and gaming technology, we may be led to believe that more and more people prefer to spend time in their home using their entertainment gadgets, but it is not so.

The internet has brought the world closer than ever before, making remote tourist places more accessible and affordable than ever. Tourism Revenues contributes to 2-10% of the total GDP of most countries. Tourist hot spots like Dubai, Mexico, France, Thailand, etc. have Tourism as one of their primary source of revenue generation.

Tourism Revenues, factors affecting it, and measures to improve it all have significant changes in Tourism employment labor, economic growth, and overall development of the economy.  Hence, our fundamental analysis needs to understand the Tourism patterns and its resultant changes in the marketplace.

What is Tourism Revenues?

Tourism is the act of people traveling to and staying in locations outside their usual residing place for leisure, recreation, business, or other purposes for a specified period.  For the general public, a tour typically implies leaving behind their work and home to travel and explore tourist spots with family, friends, or by themselves for refreshment.

Tourists are people coming from outside the current locality into consideration (be it a city, state, or even country) to temporarily visit the place. Business people having to travel on work purposes are also categorized under tourists. Below we have mentioned the three types of Tourism.

Inbound Tourism

Tourists coming into the country to visit are called inbound tourists. This adds to the revenue of the nation as people pay and spend money in domestic currency.

Outbound Tourism

When our citizens go out of our country to foreign destinations for tours, it is called Outbound Tourism. This takes away revenue from our country and adds to the foreign countries, as the domestic currency is exchanged for foreign currency for expenditure purposes.

Domestic Tourism

People of one state visit another state within the country; it is called Domestic Tourism. This is helpful for the visiting state as it brings revenue to the state.

Tourism Revenues

As per the United States Travel Association, in 2019, domestic and international travelers spent 1.1 trillion U.S. dollars. This spending has directly supported 9 million jobs and has generated 277 billion U.S. dollars to the payroll income an 180 billion dollars in tax revenues for federal and local governments.

Travel Industry accounts for 7% of the total private sector employment. The power of job growth through travel is higher than in many other industries. For example, every 1 million dollar sale of travel-related items directly adds to eight jobs compared to only five jobs in the non-farm sectors.

How can the Tourism Revenues numbers be used for analysis?

The following factors affect Tourism Revenues:

 Climate: The environmental conditions at the tourist destination adversely affect tourism. For example, In summer, hill-stations and colder regions see a rise in tourist numbers. If the ecology of the tourist place is balanced (avoiding over-exploitation of nature and over urbanization), unexpected adverse weather conditions can be avoided.

✰ Economic Situations: A healthy economy can support tourism. Financially weak people neither travel nor the Government of a weak economy create and promote an excellent tourist destination. Disposable Income of the people determines whether they can afford to spend on discretionary things like tours and travel. Political unrest and terrorist activities adversely affect tourism. Safeguarding and protection are essential from the Government’s side to assist tourism.

✰ Cultural importance: It is the historical and cultural significance of the places, monuments that attract tourists. Preserving and maintaining heritage sites over urbanization (building roads, houses, malls, or buildings for commercial use) can help foster tourism. 

✰ Research value: Researchers actively seek places undisturbed by human exploitation. The preservation of natural forests, seas, oceans can attract tourists who are Archeologists, Geologists, Biologists, Oceanographers, etc.

✰ Religious places: Tourists usually take tours to escape from their daily challenges and find peace. In this sense, religious destinations are always flooded during specific periods in a year. India is one such example where there are a lot of pilgrimage sites that bring in good revenue for the nation. Preservation and regulation of such religious places support tourism.

✰ Internet: Ease of accessibility to new people via the internet encourages people to explore these places. Enthusiasts only visit unknown and remote sites. The more people have reviewed an area, the more people would be comfortable visiting it.

✰ Amenities: Availability of transport, hotels, guiding services enhance the tourist’s travel experience. Lack of all these necessary facilities would contribute to a mediocre travel experience that would slowly decline the tourist numbers. Ratings of the place affect the tourist numbers in the long run.

✰ Economic Impact of Travel: Travelers create a “multiplier” effect on the economy. Apart from the direct purchase of goods and services by travelers, the indirect acquisition of raw materials needed to manufacture them adds to the indirect travel output.

Due to spending in the local areas, additional sales are generated that are categorized as induced output by tourism. For instance, the total jobs supported by Tourism is 15.8 million. As per the U.S. Travel Association, one in ten non-farm jobs indirectly relies on the travel industry. The travel industry has generated 2.6 trillion U.S. dollars for the economy, contributing about 2.6 % of GDP.

Impact on Currency

Tourism revenue supports jobs and the Income of the economy. Tourism is a proportional indicator. An increase in tourism revenues positively correlates to the currency value. As more tourists arrive, the more the domestic currency is in demand and hence appreciating the currency value and vice-versa.

Changes in Tourism Revenues from year-to-year have a low impact on the currency as it makes up less than 5% of GDP for many countries. For this reason, tourism is seen as a low impact indicator.

Economic Reports

The World Travel and Tourism Council provides a comprehensive summary of Tourism Revenues and its contribution to GDP for most countries on their official website. They publish monthly updates in cooperation with Oxford Economics to provide a brief overview of short term trends in the Travel and Tourism Sector.

The Travel Price Index (TPI) published monthly by the U.S. Travel Association measures the travel inflation and is comparable to CPI (Consumer Price Index).

Sources of Tourism Revenues

The information regarding tourism and related statistics can be found in the sources mentioned below.

Monthly Updates- WTTCWorld Travel and Tourism CouncilMonthly Statistics – USTA for (TPI, Travel Trends, etc.)

Impact of the ‘Tourism Revenues’ news release on the price chart 

Tourism Revenues are slowly becoming a significant source of income for various countries, especially for emerging economies. These revenues contribute a lot to the GDP of a country. Recently, this sector has been gaining a lot of attraction, and as a result,  governments of almost all countries are promoting the tourism industry. Today, we even have an official media release of the revenue generated by tourism alone released by the monetary agency of that country. Therefore, some traders around the world create and remove positions in the market based on the Tourism Revenues data.              

The below image shows the previous and latest Tourism Revenues data of Turkey. This is essentially the amount spent in billions of U.S. Dollars by Foreign tourists. This data is particularly important for developing countries. It is released on a monthly, quarterly, and yearly basis, depending on when the country chooses to publish. A higher than expected reading is considered to be positive for the economy, while a lower than expected reading is considered to be negative.

USD/TRY | Before The Announcement

We shall start with the USD/TRY currency pair and find out the impact of the news release on the pair. As we can see in the above image, the market is moving in a range, and just before the news announcement, it is at the bottom of the range. Technically, this is an area from where the price bounces and moves higher, but since there is a news announcement in some time, it is possible that this level could be broken. Therefore, we need to wait and then trade based on the news outcome and shift in volatility.

USD/TRY | After The Announcement

After the Tourism Revenues data is announced, volatility suddenly increases on the upside, and the candle closes as a bullish candle. The reason behind the sudden weakness in Turkish Lira is from the fact that the Tourism Revenues were almost halved in the fourth quarter compared to the third quarter. This made traders sell Turkish Lira and buy U.S. dollars. The buying strength coming exactly from the ‘support’ is a confirmation sign that the market will move higher, and one can go ‘long’ in the pair with stop loss below the ‘news candle.’

NZD/USD | Before The Announcement

NZD/USD | After The Announcement

The above images represent the TRY/JPY currency pair, where we see that, here too, the market is moving in a range before the news announcement. Since the Turkish Lira is on the left-hand side, price is at the ‘resistance’ area just before the announcement. As volatility is high, traders should wait for the Tourism Revenues announcement to get a clarity of the data. Once we know the actual result, we can trade based on the news.

After the data is released, the market expectedly reacts negatively, and price falls to the downside. This fall is due to extremely weak Tourism Revenues data, which made traders sell the currency. As the volatility increases on the downside and the price goes below the moving average, one can take a ‘short’ trade with a stop loss above the ‘resistance’ of the ‘range.’

NZD/USD | Before The Announcement

NZD/USD | After The Announcement

Lastly, we analyze the impact on the EUR/TRY currency pair, where also the market is moving in a range but with a downward bias. As we witness some selling pressure before the announcement, a positive Tourism Revenue data can be an ideal case for going ‘short’ in the pair expecting further downside. However, if the data was to be positive for the Turkish economy, one should wait for additional confirmation before entering for ‘buy.’

After the Tourism Revenues data released, the moves in both the direction and the candle managed to close in green. We do not see a strong up move in spite of weak Tourism Revenues data because selling pressure is high on the downside. As the candle closes, forming an indecision pattern, it is advised to go ‘long’ in the market only after volatility expands on the upside.

That’s about the macroeconomic indicator – ‘Tourism Revenues’ and the impact of its news announcements on the Forex market. If you have any questions, please let us know in the comments below. Cheers.

Categories
Forex Daily Topic Forex Fibonacci

Fibonacci Retracement: A Magic Trading Tool

Financial traders rely a lot on a tool called Fibonacci Retracement. This shows the percentage of retracement that the price makes after making a strong bullish/bearish move. The percentage of retracement is very significant to the traders. There are some particular levels, where the price reacts heavily and creates a new trend. Thus, financial traders use Fibonacci Retracement tool to measure retracement length and find the potential whether it is going to create a new trend or not. The Forex traders love using the Fibonacci Retracement tool as well. Once we know how to draw it on the chart accordingly, we find out that the currency pairs on almost all the timeframes obey the Fibonacci retracement ratio.

Leonardo Fibonacci, an Italian mathematician, identified a series of numbers such as 0, 1, 1, 2, 3, 5, 8. 13, 21, 34, 55, etc. Each number is the sum of the preceding two numbers.  These numbers produce some significant ratios, such as 23.6. 38.2, 50, 61.8. 78.6, 100, 123.6, 138.2, 161.8. These ratios and the Fibonacci sequence are found in nature as well. Thus, people love using the sequence ratios in their design and plan. At the end of the day, people run financial markets. They buy or sell at certain levels. Since Fibonacci ratios are much related to our nature and life, traders love using these ratios to help decide where to buy and where to sell.

As far as Fibonacci ratios are concerned, the 61.8 is considered as the golden ratio. It is found in flower petals, seed heads, pinecones, fruits and vegetables, tree branches, shells, spiral galaxies, hurricanes, fingers, animal bodies, reproductive dynamics, animal fight patterns, DNA molecule, etc.

In the financial/Forex market, the ratios are used by using a tool called Fibonacci Retracement. There are other Fibonacci tools, but this one may be the trader’s most favorite.

In a buying market, a trader draws his Fibonacci retracement levels from the lowest low to highest high.

The level of 00.00 is the lowest low, and the 100.00 is the highest high of a bullish wave. Traders are to wait for the price to make a bearish retracement. All these levels are significant, and the price reacts to these levels. However, the buyers pay more attention when the price is around 61.8 level to go long in a pair.

In a bearish market, it is just the opposite. Let us have a look at how it looks like.

Fibonacci Retracement levels help traders spout out the trend’s initiating point. Thus, it becomes easy for the traders to take entry with excellent risk-reward. In our forthcoming articles, we are going to demonstrate charts on different pairs, time frames to find out how the price reacts to different Fibonacci levels. Stay tuned.

Categories
Forex Elliott Wave

Understanding the Complexity in Wave Analysis – Advanced Level

Introduction

Financial markets are the result of human interactions where one party buys and the other sells. The results of these actions are reflected in a price chart. 

R.N. Elliott studied the interactions between these two forces that move the market. In his study, Elliott detected that specific patterns repeat themselves over time. He also identified that the price tended to move in impulsive and corrective movements.

Elliott recognized that as time progresses, the price develops movements that, in its basic unit, correspond to segments, those that have a low level of complexity. 

The complexity increases at an additional level as these segments complete a series of three or five movements, giving origin to the wave. 

Later, as a wave is completed, another movement emerges, giving course to a new wave. As this ordered sequence advances in time, the price forms structures that we could call as “poli-waves,” which Elliott defined in the form of patterns corresponding to a structure or wave of higher degree.

The interaction between different sequences of “poli-waves” or basic wave patterns, give origin to a more complex structure, which we can define as “multi-wave.” In turn, when a succession of 3 or 5 multi-waves completes, the price action creates a structure of a higher degree whose complexity level is higher. We can call this complex structure as “macro-wave.”

Multi-wave Construction

Multi-waves are complex structural series that is characterized by having at least one poly-wave in their internal structure. The type of waves can be impulsive or corrective.

Impulsive Multi-waves. They are structures in which one or several of their impulsive waves are poly-waves. Its training requirements are as follows:

  1. Of the three impulsive forward waves, only one must be a poly-wave; the other two can be simple movements.
  2. At least one of the two corrective waves can be a poly-wave, the other can be a poly-wave or a simple wave.
  3. The longer-lasting corrective wave 2 or 4 will occur just before or after the extended wave.

The following figure shows the different patterns of multi-waves of impulsive nature, being the second case, which corresponds to the third extended wave the most common.

Corrective Multi-wave. In the same way as multi-impulsive waves, the corrective multi-waves must contain specific requirements, which are described below.

  1. One or two of the waves that are divided into five waves in the longer pattern should be able to be subdivided as a poly-wave. If it has only one structure subdivided into five, it will be a Flat, while if it has two structures divided into five, it will be a zigzag pattern.
  2. The multi-wave B wave is likely a corrective poly-wave.

The following figure shows two types of corrective multi-waves.


Complex Multi-waves Construction

The complex multi-wave analysis does not differ from complex wave analysis composed of poly-waves. The difference is that complex multi-waves are composed of multi-wave groups and not poly-waves.

Macro-waves Construction

As the market develops, the structural series can be grouped as multi-waves and thus form a macro-wave

Impulsive Macro-waves. This type of structure is composed of a multi-wave in one of its three impulsive waves, while the other two will be a poly-wave. 

Corrective Macro-waves. Must contain at least one multi-wave, and another wave must be a poly-wave. If the structural series has two multi-wave, the complex structure will be a zigzag, and its formation has only one multi-wave, the corrective structure will be a flat pattern.

Conclusions

In this educational article, we have seen how, as time advances, the complexity of the waves also increases. 

However, the wave analysis whose level of complexity is higher, being it a multi-wave or macro-wave, must be realized in the same way to that studied in the wave analysis section corresponding to the intermediate level wave analysis. 

This situation leads us to conclude that the market behaves in a fractal way over time, and wave analysis does not change regardless of the proportion of time studied.

In the next educational article, we will expand on the concepts of alternation and extensions.

Suggested Readings

  • Neely, G.; Mastering Elliott Wave: Presenting the Neely Method; Windsor Books; 2nd Edition (1990).
Categories
Forex Fundamental Analysis

Importance of ‘Consumer Spending’ as an Economic Indicator

Introduction

Consumer Spending is a significant contributor to the annual GDP of an economy. It is released ahead of GDP numbers and hence is widely used by traders and investors alike to make investment decisions. Consumer Spending is what drives the economy mostly. Imagine if consumers stopped spending on anything apart from the basic needs, it would result in the closure of many businesses and services. Hence, understanding the importance and impact of this advanced indicator is crucial for our Fundamental Analysis.

What is Consumer Spending? 

Consumer Spending refers to the amount spent to meet their daily needs and personal expenses. In other words, it refers to the money paid for goods and services by the general public. The products and services can include all that we, as an individual, consume to live our lives. The groceries, the movies, the drinks, the internet, phones, etc. all these are part of our lives that the Consumer Spending measures.

The money we SPEND on CONSUMPTION of goods and services by CONSUMERS is Consumer Spending. A nation in its core is its people, and what those people spend on is what runs the market. What you and I spend on is what will drive the market. Consumer Spending makes up 66% of the total Gross Domestic Product in the United States, and business and government spending contribute to the rest.

Consumer Spending depends on the macro scale on the below vital factors:

Mortgages and Debt: In the United States, almost all the citizens have debt in one form or another, be it student loan, education loan, house mortgage, or healthcare insurances. The more the debt, the lesser the consumer has left for his spending, thereby tightening his pocket on extra expenditures.

Disposable Income: It refers to the remaining part of an individual’s income left after deductions of all federal taxes. It is the difference between the average salary and tax deductions—higher the charges lesser the money available for spending.

Per Capita Income: It tells us the income per individual within the country. Only when the overall income per person is sufficiently large enough to exceed meeting the basic requirements only then will people have a budget for spending. Rising Per Capita Income indicates that the standard of living is improving, which automatically enhances consumer spending.

Income Disparity: The imbalance in the wages of different sections of society is bad for the economy. A sufficiently rich person’s increase in income will not lead to higher spending as he or she will tend to invest or save to accumulate more wealth. Only when the wages of the lower sections of the society increase will the spending increase as they are the ones cutting back on expenditures due to lack of money. Reformation can be brought about in the country if the government focuses more on benefiting the lower sections more than other parts of the society.

Consumer Sentiment: It is the people of the nation who know better than traders and investors about the economic prospects as they are the ones working on the ground and going about their daily routine facing all kinds of situations. Whatever analysts, investors, and traders assess a nation’s economy, it cannot beat the first-hand experience of the people themselves. The Consumer Sentiment tells what the general people feel about the prospects of their jobs, growth, and security.

If a consumer feels his income will increase steadily and is secure, he will tend to spend more now. Conversely, if the consumer is not sure of his job status and not confident about his future employment status, then he or she will tend to save more to meet their needs during times of unemployment. Thereby decreasing spending now and saving more for later.

How is the Consumer Spending Report obtained?

The Bureau of Economic Analysis releases monthly reports on the percentage of changes in the average Consumer Spending titled “Personal Consumer Expenditures.” BEA releases this report at a national level on a quarterly and annual basis. The Bureau of Labor Statistics also releases a report titled Consumer Expenditure Survey in August every year with little variations. They calculate using the statistics form the United States Census Bureau to arrive at this survey report.

Is Consumer Spending important?

It is one of the most significant indicators to predict GDP. It is an advanced indicator meaning it predicts future economic conditions rather than reflecting current or past industrial activities. Since it is a significant driver for the Gross Domestic Product, it is one of the top economic indicators amongst all. Consumer Spending tells us about the strength of the economy and the standard of living of the country’s citizens.  It almost drives 70% of the GDP figure; hence there is no doubt that it is a must for Fundamental Analysis.

Below is a plot of the percentage change in Consumer Spending vs. Real GDP from the St. Louis FRED website to demonstrate this indicator’s importance in comparison to the rest.

(Chart Source)

How can Consumer Spending be Used for Analysis?

What the consumers are willing to spend on can make or break the markets. By analyzing the spending trends and recognizing what sector of goods and services consumers purchase can tell us which market is going to flourish and stagnate. Consumer Spending represents the demand side of the supply-demand market, where supply is the providers or manufacturers of the goods.

When Consumers increase spending, this increases demand, which leads to business growth, increased employment, improved wages to meet the demand. This increase will again lead to increased spending by the newly employed and adjusted salaries, and all this becomes a positive feedbacking loop and continues till it saturates. When demand outpaces supply, we will have inflation, which is terrible for the economy as the increasing prices will make consumers increase spending now than later it will again result in price inflations. The primary job of the Federal Reserve is to prevent this vicious cycle of price inflation.

On the other end, low consumer spending reduces demand for goods and services, which stagnates business and hence the economy contracts and results in lower levels of GDP, which is also not good.

Traders can use the Consumer Spending Surveys, Indices to relatively compare economic situations of nations and also with previous periods to assess currency valuation or devaluation direction in the coming months. Investors can make investment decisions based on which sectors are experiencing increased demand looking at the spending patterns. Consumer Spending can also direct us in Stock Market evaluations of different companies.

Sources of Consumer Spending Reports

We can obtain the Consumer Spending monthly releases from the BEA, and that data can be found here. For illustration, you can refer to this link to see what the U.S. population spends more on. You can also check the University of Michigan’s Consumer Sentiment Index here.  As discussed, it is a primary driver of Consumer Spending.

Impact of the ‘Consumer Spending’ news release on the price chart 

In this section of the article, we will analyze the impact of the Consumer Spending economic indicator on the value of a currency. As we understood in the previous that the Consumer Spending measures the change in the inflation-adjusted value of goods expenditures by consumers, now we shall see how important the data is for traders and investors. Consumer Spending is one of the major economic activities in a country. However, looking at the below image, it seems like traders do not give a lot of importance to the data (Yellow box indicates less important) and may not make significant changes to their positions in the currency. In any case, let us see how the market reacts to the data release.

Below is the image showing the latest Consumer Spending data of France, which will have an effect on the EURO. The National Institute of Statistics and Economic Studies collects and disseminates information on the French economy and society. A higher than expected reading is considered to be positive for the economy, and a lower than expected reading is taken to be negative.

EUR/AUD | Before The Announcement

We start our analysis with the EUR/AUD currency pair, and as we can see in the image above, the chart is a strong uptrend, and the market has retraced recently. One of the reasons behind the violent up move is that the market participants are expecting a better Consumer Spending data for the month of February. Since the market has retraced quite a bit, aggressive traders can go ‘long’ in the market before the news announcement due to optimism in the market.

EUR/AUD | After The Announcement

After the Consumer Spending data is released, the market falls, but it leaves a wick on the bottom, and the price forms a ‘Doji’ candlestick pattern, which essentially indicates indecision in the market. As the data was far below what was predicted, we should wait for more confirmation from the market to notice the change in volatility. We see that that the volatility expands on the upside and goes above the moving average. This is an indication that the news outcome is digested by the market and will continue its trend. Thus, we can enter for a ‘buy’ after the price potently moves higher with a stop loss below the ‘low’ of news candle.

EUR/CHF | Before The Announcement

EUR/CHF | After The Announcement

Next, we discuss the EUR/CHF currency pair where before the news announcement, the market is in a strong downtrend, exactly opposite to the above currency pair. As the volatility is high on the downside, we should not expect a positive Consumer Spending data to cause a reversal of the trend. Whereas, a ‘bad news’ may take the currency much lower. We cannot take any position at this point, not even a ‘buy’ as we are in a strong downtrend, and there are no signs of reversal.

After the numbers are released, it is evident from the ‘news candle’ that there is an increase in volatility on both sides, and finally, the price closes near its opening price. The long wick on top of the ‘news candle’ is an indication that selling pressure is high due to poor Consumer Spending data. Therefore, at this point, one can go ‘short’ in the pair with a stop loss above the recent ‘high.’

EUR/SGD | Before The Announcement

EUR/SGD | After The Announcement

The above images represent the EUR/SGD currency pair, where the characteristics of the chart appear to be similar to that of the EUR/AUD pair. One major difference is that the uptrend is not as resilient as in the case of EUR/AUD. Before the news announcement, the market is at the key area of resistance equals support. This is the place where most traders go ‘long’ in the market and join the uptrend. But since the volatility is high, it is recommended to wait for the news release and then act accordingly.

After the news announcement, some selling pressure is witnessed as a result of weak Consumer Spending data, and the candle closes in red. But later, the ‘news candle’ is immediately is taken over by a bullish candle. This means, due to the bad news, the market initially reacted as per expectations, but this was not sufficient enough to cause a reversal in the market. As the impact of the news was less, we can trade with the trend, by going ‘long.’

This completes our discussion on Consumer Spending and the impact of its news announcements on the Forex price charts. If you have any queries, please let us know in the comments below. Cheers.

Categories
Forex Fundamental Analysis

Everything About ‘Gold Reserves’ & It’s Impact On The Forex Market

Introduction

Gold is one of the most precious metals on the planet. In the field of monetary assets and currencies, Gold is like a nuclear warhead among all weapons. Throughout history, this yellow metal has always held its place as a secure financial investment. For a certain period in the international markets, it backed the major currencies like the United States Dollar.

Even though today’s currencies are no longer backed by any metal and are free-floating fiat currencies, countries still own and purchase gold year after year in tons. This shows that it is still one of the important financial assets of many countries. Change in Gold Reserves will have an impact on the nation’s currencies. Hence the study of the same is important for fundamental analysis for traders and investors.

What are Gold Reserves?

Most of the major nations which participate in international trades through export or import maintain a certain proportion of foreign currencies to hedge their currency at times of hyperinflation or deflation to manage their exchange rate at a fixed level, thereby not incurring losses on exports or imports.

Similarly, Many countries’ Central Banks maintain specific metric tons of Gold as reserves in their nation’s vaults along with other assets. Gold deposits saved in the nation’s vaults or other nation’s vaults as their holdings are called Gold Reserves.

Why Gold Reserves?

Up until a few decades ago, the Gold was used to back up the legal tenders of many countries. Today’s world is run by Fiat currencies, which can be printed as much as required by a government as the United States did before the Vietnam war, which led to the crashing of Bretton wood’s agreement. If, in a hypothetical case, let us say the United States dollar is no longer accepted as a legal tender in the global market, then the United States cannot buy or sell goods and services using their currency. Still, they can sell their Gold in exchange for the same.

The exposure of a currency to the market trends volatility, economic crisis makes it an unsafe form of wealth, which can depreciate over time. In this regard, Gold has always proven that it can hold its ground even during a major economic crisis and continue to appreciate to match with the inflationary trends. At times of economic crisis, extreme inflation, or deflation, which results in currency depreciation of a nation, investors, and people, in general, tend to run towards Gold as a safe financial bet.

Economic Reports

The International Monetary Fund (IMF) tracks and keeps the statistics of all assets of a nation as reported by various countries, which are then used by the World Gold Council (WGC), who are responsible for keeping up the demand and supply for Gold in the global market.

The data is obtained from the Central Bank’s Balance Sheets and compiled by WGC and releases monthly. They also provide historical data about the same for various countries to compare and analyze side by side.

How can the Gold Reserves numbers used for analysis?

Gold is not an abundant metal on the planet, and its rarity, along with unique lustrous yellow radiant color and other physical properties, has always kept it in demand in the market of jewelry, trades, and particular instrument designing sectors.

Gold is seen as one of the standard forms of wealth to be passed on from one generation to another, meaning its value keeps rising with global economic growth. As economies become wealthier, the Gold price also tends to be costlier. The worth of Gold in that sense has always remained constant, i.e., a precious and expensive metal.

The Gold demand increases during times of high inflation, and because of the limited supply, the price of Gold increases against the currencies. In this sense, the countries which are a net exporter of Gold see their domestic currency worth appreciating. Countries that are importers of Gold see their currency worth falling against Gold. In this aspect, Gold is indeed still a form of currency, or we can say it is an alternate form of currency.

Nations purchase Gold from the Bullions market and store up just like an ordinary employee saves up money for future needs or as an emergency fund for a rainy day.  Major Nations increase their Gold Reserves in hundreds of tons per year as it preserves wealth better than most currencies, and also for their concern on long term economic health and growth of their nation.

Below is Gold Reserves numbers for prominent countries having high holdings.

Above image is taken from the World Gold Council Official Website

Impact on Currency

A country with no Gold Reserves is exposed to all the risks associated with Fiat Currencies. Throughout history, there have been many currency crises where the dips have been so low that markets crashed, and governments collapsed, for instance, the Black Wednesday, which pushed the Sterling pound out of European Exchange Rate Mechanism.

Countries having substantial Gold Reserves numbers can face economic crises without market crashes, and the system collapses. As at any time, they can sell their Gold Reserves to increase their Currency worth, and let it float back again in the market against other fiat currencies.

Investors who have invested in foreign companies in that nation’s domestic currency can eliminate the fear of his returns depreciating over time or during economic crises there if the nation has sufficient Gold Reserves. Traders who Carry Trade can also be sure of their deposits not being subjected to major shocks that lead to unexpected volatility in the short run as the country will be able to recover from this through their reserves.

Gold Reserves inherently indicate a nation’s capacity to bounce back from a crisis or to never go into one in the first place. This is the reason why the United States Dollar and Euros are one of the major pairs as their Gold Reserves are in the top five amongst the world due to which the volatility in the currency is so low, making it a safe bet to trade on.

Low Gold Reserves can lose the confidence of investors, which would further depreciate the value of an already weakening currency, thereby pushing the economy further down the drain of a crisis. In Conclusion, the higher the Gold Reserves, the lesser the volatility and vice versa.

Sources of Gold Reserves Index

We can monitor the Gold Reserves changes of various nations across the globe from the WGC monthly reports, and they can be found here. Global Reserves data of different countries can also be found here. You can also go through Gold Reserves of the Federal Reserve Banks of the United States history here. We can derive the same numbers from the Central Bank’s balance sheets or the National Bureau of Economic Research.

Impact of the ‘Gold Reserves’ news release on the price chart 

Gold reserves play a major role in maintaining the economic stability of a country, and thus the government tries to own a lot of Gold. Some of the main uses of Gold include hedging against inflation and determining the value of import and export. The Gold Reserve of the country is released on a quarterly and monthly basis that shows the transactions carried out by different nations. Since the Gold Reserves held by a country is an important economic indicator, it said to have a moderate to high impact on the value of a currency.

The above image shows the previous and latest Gold Reserve data of India, which is published on the 1st of every month. A higher reading than before is considered to be bullish for the currency while a lower reading is taken to be bearish. India’s Gold Reserves was reported at 28.997 USD bn in Jan 2020. This shows an increase from the previous number of 27.831 USD bn for Dec 2019. The Reserve Bank of India is the official organization that provides Gold Reserves in USD.

EUR/INR | Before The Announcement

The first pair with which we will start our discussion is EUR/INR, where the above image shows a ‘daily’ time frame chart of the same. We see that the market is in a range from more than three months and currently seems like it has broken out of the range. Since we don’t have any clue of the Gold Reserves data, we cannot take a position on any side of the market. Technically, we have broken above the range, and we need a suitable retracement to join the trend.

EUR/INR | After The Announcement

As the data is released and the market gets to know that the Gold Reserves were increased than before, we see a sudden drop in prices as a result of strength in Indian Rupee. But later, the price reverses sharply, making the candle to close in green. One of the reasons could be that since the market was in a strong uptrend, it tried to make its last move up and finally collapsed later.

The volatility is seen to increase on both sides. From a ‘trade’ perspective, here’s where the technical analysis should be combined with fundamental analysis. We cannot take a short trade until the price crosses below the moving average, which is a sign of reversal.

GBP/INR | Before The Announcement


GBP/INR | After The Announcement

The above images represent the GBP/INR currency pair where we witness an extremely weak Indian Rupee, and just before the announcement, price is at the recent ‘higher high,’ which means this is the point from where the market fell. Without guessing what the Gold Reserve data might be, it is wise to wait for the news announcement and then take suitable action. However, one can still trade in ‘options’ to take advantage of high volatility when the announcement is being made.

After the news release, we see that the market drops, and the candle closes in red, which means there are high chances that traders may see the data as positive for the Indian economy and hence buy INR. Thus, as soon as the price falls below the moving average, we can go ‘short’ in the pair with a conservative target. Also, the price is in an area that could be a possible resistance.

USD/INR | Before The Announcement

USD/INR | After The Announcement

In the USD/INR currency pair, before the news announcement, the market moves up after reacting from the ‘support’ area and currently is in the middle of the range. Again, we don’t find any way to trade this pair as a news announcement can cause sudden volatility on any side. The overall volatility also appears to be low in this currency pair.

After the announcement is made, we see that the price drops below as a result of an increase in Gold Reserves from the previous month. The sudden increase in volatility on the downside, making the price go below the moving average, may attract one to go ‘short’ in the pair. We can sell the currency pair, but the stop loss needs to be placed above the resistance. The risk to reward ratio of this type of trade would be around 1:1.

That’s everything about Gold Reserves and the impact of its new release on the Forex price charts. If you have any queries, please let us know in the comments below. Cheers.

Categories
Forex Elliott Wave

Complex Corrective Waves Analysis – Advanced Level – Part 2 of 2

Introduction

In the first part of the complex corrective wave analysis article, we presented two conditions that suggest the development of a wave x. 

The first condition considers whether the second compacted corrective wave retraces less than 61.8% from the first correction. The second condition occurs if the second corrective structure retraces more than 161.8% from the first correction.

Glenn Neely, in his work “Mastering Elliott Wave,” indicates that if the first condition occurs, then the market performs a complex correction with a small wave x. While for the second case, the price action develops a complex correction with a large wave X.

Condition 1 – Complex Correction with Small Wave x.

When the wave analyst identifies a non-standard wave, there is a high probability that the wave x is smaller than 61.8% of the previous corrective phase. This type of wave tends to take the form of an impulsive sequence. However, its internal details rule out this possibility.

The non-standard structural sequence or series may have various combinations, which are detailed below:

  1. Double zigzag (5-3-5-wave x-5-3-5)
  2. Double three (5-3-5-wave x-3-3-3-3-3)
  3. Double three (5-3-5-wave x-3-3-5)
  4. Double flat (3-3-5-wave x-3-3-5)
  5. Double three (3-3-5-wave x-3-3-3-3-3)
  6. Triple zigzag (5-3-5-wave x-5-3-5-wave x-5-3-5)
  7. Triple three (5-3-5-wave x-5-3-5-wave x-3-3-3-3-3)
  8. Triple three (5-3-5-wave x-3-3-5-wave x-3-3-3-3-3)

From the above list, the triangular formation likely corresponds to a contractive triangle. On the other hand, waves x can be other corrective waves without altering the entire structure. 

The wave analyst must take into account the application of the alternation principle. In particular, the x-wave will alternate with its preceding wave. For example, if the first compact wave corresponds to a zigzag, the x-wave will be a plane or a triangle.

The following figure shows two examples of complex corrective waves that accomplish thew first condition. In particular, the case corresponds to a double zigzag, and a double three consisting of a zigzag pattern and a triangle structure.

Condition 2 – Complex Correction with Large Wave X 

When the wave analyst detects a complex correction in which the wave X is larger than the previous correction in terms of price, the entire formation will be classified as double or triple three patterns.

This structural series can have various combinations, which are detailed below:

  1. Double three (3-3-5-wave X-3-3-3-3-3)
  2. Double three (3-3-5-wave X-3-3-5)
  3. Triple three (3-3-5-wave X-3-3-5-wave X-3-3-3-3-3)
  4. Triple three (3-3-5-wave X-3-3-5-wave X-3-3-5) 

In summary, the structural series of both conditions have been listed in the most likely order of occurrence.

As in the first condition, the following figure shows two cases of double three patterns.

Conclusions

So far, we have seen the different construction characteristics of complex corrective waves and how to differentiate each type of complex wave.

In particular, we saw the two main conditions that characterize complex corrective waves.

In the following educational article, we will present the conditions associated with each particular formation.

Suggested Readings

  • Neely, G.; Mastering Elliott Wave: Presenting the Neely Method; Windsor Books; 2nd Edition (1990).
Categories
Forex Elliott Wave

Complex Corrective Waves Analysis – Advanced Level – Part 1 of 2

Introduction

Complex corrective waves are groups of waves that do not have an internal structure subdivided into three or five waves. In general, complex corrections tend to appear in waves fourth or B. Moreover, these formations are divided into two categories standard and non-standard.

Standard Type

An impulsive or corrective Standard wave formation does not imply that it is formed by a series of three or five adjacent segments. Usually, one of its corrective waves will possess a greater number of internal subdivisions creating a more extensive structure in terms of time. This condition will create a context in which can verify the alternation principle.

If the standard complex wave is in an impulsive sequence, it may be in wave 2 or 4. Otherwise, if this complex wave appears in a corrective phase, it will be between waves A and B.

The following figure shows a simplification of standard complex waves in an impulsive sequence and a corrective structure.

Non-Standard Type

Complex corrections only occur if there are at least two corrective sequences compacted in their three-wave structure and separated by a corrective formation that acts as a connector between the two corrective patterns. This type of waves must be given under certain conditions; likewise, they must meet specific rules that occur only once the waves have been compacted.

Retracement Rules

If the wave analyst found a compact corrective pattern that confirms a retrace less than 61.8%, or greater than 161.8% by the next corrective wave, and then produces another corrective wave, then the wave analyst should analyze the corrective structure as says the specifications section.

If the grouping conditions commented previously don’t meet, then the corrective structure shall be standard. In this case, the wave analyst should work the corrective sequence in the same way as discussed in the section “Corrective wave analysis – Intermediate level.”

On the other hand, the extension or duration in the time of the corrective wave doesn’t affect its analysis. A complex corrective structure can last for days and even years without this changing its structure. In this context, the wave analyst must maintain order in the use of the labels of each formation.

Non-standard Complex Wave Specifications

The first principle of a complex corrective wave implies the existence of a wave X, which acts as a connector for two standard Elliott corrective wave formations. The wave analyst should keep in mind that this point is the key to understanding non-standard patterns.

There exist two conditions to recognize the behavior of waves x.

  1. The first condition indicating the development of a wave x occurs when two compact corrective waves of a higher degree are separated by an intermediate corrective wave, which may be standard or non-standard. The first corrective wave must experience a retrace of less than 61.8% from the intermediate wave. In general, the wave x (or intermediate wave) will have a lower level of complexity than the other two corrective structures.
  2. If the price action reveals three corrective waves compacted consecutively, so that the second correction is at least 161.8% higher than the first, then it is highly likely that the second corrective structure will be a wave x. In general, the three complex waves will have the same complexity level.

If the market develops one of the two conditions commented previously, the market has likely developed a non-standard corrective formation.

Conclusions

In this educational article, we discussed the fundamental principles of a complex corrective structure and the importance of wave compaction in identifying and analyzing wave structures. 

In previous chapters, we have seen how to recognize the principle of alternation in the analysis of both impulsive and corrective waves. In this sense, the wave analyst must take into account this concept, which will allow him to identify what will be the next most likely movement.

In particular, R.N. Elliott, in his work “The Wave Principle,” defines the alternation of corrective waves and their complexity as follows “if a corrective wave is simple, the following will be complex, and vice versa.” Within a complex corrective structure, the compacted corrective patterns that compose it will also alternate with each other.

In the next article, we will look at the construction of complex corrective waves according to each condition. 

Suggested Readings

  • Neely, G.; Mastering Elliott Wave: Presenting the Neely Method; Windsor Books; 2nd Edition (1990).
  • Prechter, R.; The Major Works of R. N. Elliott; New Classics Library; 2nd Edition (1990).
Categories
Forex Fundamental Analysis

Impact Of ‘Consumer Credit’ Economic Indicator On The Forex Market

Introduction

Consumer Credit is one of the economic indicators used by economists to analyze the health of the economy. It can be useful to infer the direction of other economic indicators like Spending, inflation, and standard of living. Although it is a low impact indicator in the trading world, a good understanding of Consumer Credit can be beneficial for strengthening our overall fundamental analysis.

What is Consumer Credit?

Consumer Credit refers to the debt incurred by individuals to serve their immediate needs. Consumer Credit here, in general, applies to the short-term loans given out to spend on their daily requirements like groceries, paying electricity bills. Consumer Credit is different in this context from long-term loans like House Mortgages, which are secured by real-estate. Consumer Credit is usually unsecured with no collateral.

Consumer Credit in these days comes in the form of Credit Cards mostly although there are other variants. The limit of Credit available on a given Credit Card depends on the net-salary of the individual. In general, the Credit limit is 8-12 times the monthly salary. Credit Cards are issued to people usually who can show a consistent flow of income in their bank statements, which generally translates to job-holders and business people as their default rate is lower than that of unemployed people.

Consumer Credit is made available through banks, retailers (like shopping malls, retail chains) and other small agencies to enable customers to be able to fulfill their immediate needs and pay-off at a later date with interest. The credit limit, interest rate, and the time after which the interest comes into effect vary from one lender to another. There are two different types of credits, and let’s discuss them in detail below.

Installment Credit

Installment Credit is given out for a specific purchase, and is issued for a definite amount for a fixed period and fixed monthly installments. The monthly payments are usually equal, and the time frame ranges from 3-month to 5-years generally. Installment Credit is also called EMI (Easy Monthly Installments) nowadays.

It is popular among the general population as it is widely used to make goods and services which are more on the expensive side, like a car, TV, or furniture, etc.  For example, a 3500$ bike could be purchased with an EMI, where the individual may make the initial downpayment of 500$ and choose to pay the remainder 3000$ as 500$ monthly installments in the form of a 6-month tenure EMI plus a little extra service charge for issuing this Credit.

Revolving Credit

Revolving Credits are used for any type of purchase, unlike Installment Credit. Revolving Credit is mostly available in the form of Credit Cards, where the line of Credit is open to the maximum limit set by the lender.

For example, a 50,000 dollar limit Credit Card can be simultaneously used to purchase a 20,000 dollars item and also again for anything else that is worth up to 30,000 dollars. The Credit line stays open as long as the individual pays the minimum amount to settle the interest on the Credit issued. It may even never be paid in full as long as we pay the minimum interest while the overall credit piles up.

This is unsecured Credit, and hence the interest rates on this type of Credit are high, which is risky as once you default, the interests can pile up very quickly, making it very difficult to recover. For example, a 10,000 dollar revolving credit, when you miss payments, let us say for six months, then the total settlement of the Credit can go up to 20,000 dollars also. This can also affect the credit rating of the individual debarring him from future Credit approvals from the agencies.

How can the Consumer Credit numbers be used for analysis?

As Consumer Credit refers to the short-term loans which are usually paid back with a little interest, generally, Consumers take Credit for personal enjoyment or servicing immediate needs. Hence, it tells us the Consumer’s confidence towards repayment of the incurred Credit.

People facing tight monetary situations during job loss generally cut back on Spending and stay away from such Credits. Hence, an increase in Consumer Credit can be seen as a sign of a healthy and growing economy.

Increased Credit numbers also tell us that banks and other retail agencies are willing to lend out money, as they are confident about the repayment and their prospects. High Credit also signifies that the liquidity of the economy is too high, meaning there is enough cash flowing in the system to give Credit lenders confidence to supply Credits to more and more individuals.

Impact on Currency

Consumer Credit number is a proportional indicator. Higher Consumer Credit numbers are good for the economy and thereby for the currency. Lower Consumer Credit signifies tight monetary conditions resulting in deflationary situations in the marketplace, which is depreciating for the economy. When Credit goes down, so does Spending, and thereby, business slowdowns are apparent once the demand is reduced, which is terrible for the economy anyway. 

Economic Reports

In the United States, the Board of Governors of the Federal Reserve System releases the Consumer Credit report around the fifth business day of every month on their official website under the section called G.19. The reports are released in Billions of Dollars in both Seasonally Adjusted and Not Seasonally Adjusted formats. The data report set goes back until 1945. The report details of the type of credits also, like Car loans, personal loans, with which institutions being the lenders of the Credit and the related maturity periods.

Sources of Consumer Credit

Monthly Consumer Credit Reports can be found here.

Fred Consumer Credit & Consumer Credit Owned and Securitized information can be found here & here, respectively.

If you are interested in comparing the Consumer Credit numbers of different nations, you can do that here.

Impact of the ‘Consumer Credit’ news release on the price chart 

In the previous section of the article, we understood and comprehended the Consumer Credit economic indicator, which essentially measures the change in the total value of outstanding consumer credit that requires installment payments. It is also strongly related to consumer spending and credit. Repeated revisions to the methodology result in volatile figures during a specific period of time. Consumer Credit does not majorly affect the value of a currency, and the volatility witnessed during the news release is on the lower side.

The image below shows the latest month-on-month Consumer Credit data of the U.S. that is published by the Federal Reserve. Traders usually have a short term view on the market based on the data, as it is not an enormous event, and it does not have a long-term impact on the currency. A higher than expected reading should be positive for the currency while a lower than expected is considered to be negative. Let us analyze the market reaction.

GBP/USD | Before The Announcement

First, we look into the GBP/USD currency pair, where we see that the market is pretty much range-bound, and just before the announcement, price is near the ‘support’ area. The volatility appears to be high both sides, and sudden movement can be expected on any side of the market after the news release. Since the economists have forecasted a lower Consumer Credit this time, as the price is at ‘support’ aggressive traders can enter for a ‘buy’ due to pessimistic expectations. Conservative traders will only be able to take a trade after we get a clear indication from the market.

GBP/USD | After The Announcement

After the Consumer Credit numbers are announced, the market quickly goes higher and shows up a strong bullish candle. The market rightly reacted to the bad Consumer Credit data as the data was much lower than expectations. This made traders and investors sell U.S. dollars, and thus volatility increased on the upside. Now that we have got a clear indication from the market, we can confidently enter for a ‘buy’ as the data was terrible for the U.S. economy. In this case, the market is expected to make new ‘highs,’ and thus, we can hold on our trades as long as we see signs of reversal.

NZD/USD | Before The Announcement

NZD/USD | After The Announcement

The next currency pair which we will discuss is the NZD/USD pair, and from the first image (before the announcement), we can clearly say that the characteristics of the chart are similar to the previously discussed pair. The reason is that here too, the U.S. dollar is on the right-hand side. One major difference is that, just before the news announcement, price is at the ‘resistance’ area. So, based on the forecasted Consumer Credit numbers, we cannot enter for a ‘buy’ as technically this is where traders sell a currency pair.

After the news release, the price tries to go down, but it gets immediately pushed up, and the candle closes in green. This happens as a consequence of poor Consumer Credit data. In this pair, volatility is seen on both sides after the announcement. However, from a trading point of view, since some selling pressure is seen, it is advised to wait for a breakout above the ‘resistance’ and then go ‘long’ in the market.

USD/SGD | Before The Announcement

USD/SGD | After The Announcement

The above images represent the USD/SGD currency pair, and since the U.S dollar is on the left-hand side, we see a down-trending nature of the market and recently is moving in a range. The volatility seems to have slowed a bit before the news announcement, and there are no signs of reversal. Right before the announcement, price is at the bottom of the range, also known as ‘support,’ and hence one cannot go ‘short’ in the pair based on the predicted Consumer Credit data.

We should always use technical analysis along with fundamental analysis to enter a trade. After the news announcement, price falls owing to bad data, but it fails to break the ‘support.’ This illustrates the importance of the amount of impact of an economic indicator on a currency pair. Until the impact is visible, we cannot decide as to which side of the market we should be trading.

That’s about Consumer Credit and the impact of its new release on the Forex market. Please let us know if you have any queries in the comments below. All the best.

Categories
Forex Fundamental Analysis

Understanding The Impact Of ‘Crude Oil Production’ On The Forex Market

Introduction

Crude Oil is the primary mineral from which the most widely used petroleum products like Diesel, Petrol (or Gasoline) are produced. For most countries, Oil is a primary energy source. Any decrease or increase in the global production of Crude Oil creates significant Oil market price volatility.

There are many countries whose primary source of revenue is from Crude Oil production alone. Hence, changes in the Crude Oil Production levels hurt the buyers due to raised Oil prices and the sellers due to decreased income. Thus, Crude Oil Production statistics are critical metrics to predict expenditures of Oil Consumers and revenues of Oil Exporters.

What is Crude Oil Production?

Crude Oil

It is a naturally occurring, hydrocarbon mineral, unrefined petroleum product inside Earth. It is dark yellow-black in texture, and, based on the region of extraction, it can have different impurities with it. It is a non-renewable energy source and hence is limited.

If the impurities are more, it is called Sour/Heavy Oil and is generally abundant and is not preferred much due to the additional refining costs that are associated with it. If the impurities are less, it is called Sweet/Light Oil and is the preferred one over the Heavy one and is naturally costlier than its counterpart. Refining of Crude Oil and boiling it distills away the impurities to give useful petroleum products like Petrol, Kerosene, Diesel, etc.

Crude Oil Production

It refers to the process of Oil extracted from the ground after the removal of impurities and inert matter. It consists of Crude Oil, Natural Gas Liquids (NGLs), and additives. It is measured in a thousand tonne of Oil equivalent (toe). The final products, like Gasoline, are measured in the number of barrels produced. One barrel is equivalent to 42 Gallons, or 159 Litres, or 35 Imperial Gallons. The leading Oil Producing countries are the United States, Saudi Arabia, and Russia.

Organization of the Petroleum Exporting Countries (OPEC)

It is an organization of 12-oil major producing countries that make up 46% of the world’s oil production. They regulate the price of fuel to sustain this non-renewable resource for an extended period. In the early 21st century, the advent of new technologies (mainly Hydrofracturing) has led to a boom in the U.S. Oil production numbers, decreasing the influence of OPEC.

How can the Crude Oil Production numbers be used for analysis?

Crude Oil production is susceptible to the following factors:

Political Tensions: Many of the countries sitting on top of Crude Oil reserves are victims of political unrest. Crude Oil supply is drastically affected by political turmoil and wars. Iran-Iraq War, the Persian Gulf wars, Arab Oil Embargo, etc. are some typical examples.

Weather Patterns: Storms and Hurricanes have always threatened Crude Oil deposits and shipments. Oil spillage due to bad sea-weathers is the worst. An example would be the Deepwater Horizon Oil Spill in 2010, where approximately 480 tonnes of Crude Oil was spilled into the Ocean. This type of incident spikes the Crude Oil prices as the supply is reduced.

Exploration and Production: Crude Oil is a non-renewable energy resource. It will be exhausted after a certain period. Exploring new regions for drilling and extraction involves huge costs. Set up of Production units is also a hefty investment

Investments & Innovation: Poor technology and lack of funds can negatively affect Crude Oil Production. The United States gained back its dominance in Crude Oil Production through the innovation of Hydrofracturing that dramatically increased its Crude Oil Production.

Demand: Demand motivates companies and governments to invest more in Crude Oil Production. As the world starts to switch to other resources, it is the demand that will primarily drive the supply of Crude Oil in the long run. Application is linked to population growth and reliance on Crude Oil as an energy source. As emerging economies increase Oil consumption while alternate energy sources are being developed, the current Oil consumption is set to stay steady and, if not, increase more for now.

Impact on Currency

Investors purchase mainly two types of Oil contracts:

Spot Contract: In this, the price of Oil reflects the current market price of Oil. Commodity Contracts in the Spot market are effective immediately, i.e., Money is exchanged, and Oil delivery starts right then.

Futures Contract: This is the more common form of Contracts purchased by traders, as they speculate the price of Crude Oil based on many factors and algorithms. They agree to pay a certain amount for Oil at a set future date. Companies dependent on Crude Oil use these contracts to hedge the risk of price volatility.

In Northern America, West Texas Intermediate (WTI) is the benchmark for Oil futures traded on New York Mercantile Exchange (NYMEX). In the Middle East, Europe, the reference is the North Sea Brent crude exchanged on the Intercontinental Exchange (ICE).

A decrease in Crude Oil Production leads to a rise in oil prices, which is terrible for the economy and currency. As fuels become expensive, currency value depreciates. It creates inflationary conditions within the economy. All Oil dependent industries like textile, chemical, medicine industries increase the cost of their end-products to compensate for the price increase. Gasoline, Petrol, and Other Crude Oil end-products become less affordable.

A sufficient supply of Crude Oil is necessary to keep inflation in check. Hence, it is a proportional indicator. Although the Crude Oil market is more volatile than currency and stock markets, large scale price changes reflect in the currency and stock values over a period. The effect on currency is dependent on the degree of dependence of the nation on Oil. The more dependency, the more the volatility in the currency. Typically, Major currencies do not see a change in values as dramatic as the Oil price.

Economic Reports

Investors, economists, and traders closely watch OPEC’s Monthly Oil Market Report (MOMR). It is released in the middle of the month for the previous month. The International Energy Agency (IEA) Oil Market Report released monthly is also widely used by many. IEA was formed in 1983, and since then, it has been the source for official government statistics from all OECD and few non-OECD countries.

The Weekly Petroleum Status Reports from the United States Energy Information is also a famous report to monitor Crude Oil Inventory levels. The American Petroleum Institute’s Weekly Statistical  Bulletin (WSB) reports the United States and regional Crude inventories and data related to refinery operations.

Sources of Crude Oil Production

The Global Crude Oil Production and Trade statistics can be found in the sources provided below.

OPEC – MOMR | IEA – Oil Market Report

Enerdata – Crude ProductionCrude Oil Production – OECDEIA – Crude Oil Production

EIA Weekly Inventory Status ReportAPI WSB Report

Impact of the ”Crude Oil Production” news release on the price chart 

Crude Oil Production plays a significant role in the economic growth of a country and in determining the rate of inflation. It is especially important for monetary policymakers and Central banks who decide on the interest rates based on oil production. The fundamental factors of demand and supply influence the rise and fall of oil prices. This Crude Oil Production has a direct impact on the oil price.

Low production of crude oil increases the price of Oil, which increases the cost of production and transportation. This increases the cost of goods and services in the country and has an adverse effect on the value of a currency. As Crude Oil Production is such an important news release, it creates a great impact on almost currency pairs, but predominantly more on the U.S. dollar pairs.

In today’s article, we will be analyzing the impact of Crude Oil Production in the Gulf, where the data is published by the Organisation of the Petroleum Exporting Countries, famously known as OPEC. The below image shows the quantity of Crude Oil Production in Barrels for the month of March.

USD/JPY | Before The Announcement

First, we shall analyze the USD/JPY currency pair, and the above image shows the state of the chart before the news announcement.  Around three hours before the release, we see that the market is aggressively moving down, indicating a great amount of downward pressure. If we carefully observe, currently is at a place where this price was portraying as ‘support’ on the previous day. Therefore, we can expect ‘buying’ strength to come back into the market from this point.

USD/JPY | After The Announcement

After the Crude Oil Production data is announced, the price falls drastically, and the ”news candle” closes as a strong bearish candle. The market reacted very negatively because the Crude Oil Production was lower as compared to the previous month. This impacted the U.S dollar adversely, and traders sold the currency, thereby increasing the volatility on the downside. As mentioned in the previous paragraph, since the price at the key ”support” level, taking a ”short” trade can prove to be risky at this point. It is safer to ”sell” after a suitable retracement.

AUD/USD | Before The Announcement

AUD/USD | After The Announcement

The above images are that of the AUD/USD currency pair, where we see that the market is in a strong downtrend, and recently the price has moved higher in the form of retracement. Technically, this is the ideal scenario for trend trading and going ”short” in the pair, but as there is a high impact news announcement in few minutes, the market could sharply move on any side. Therefore, it is wise to wait for the release and then trade based on the data and shift in volatility.

After the news announcement, the price suddenly surges and moves higher in the beginning, but the price sees some selling pressure from the top and closes with a large wick on the top. The sudden up move is because of the weak Crude Oil Production data, which made traders sell the U.S. dollar and cause a short-term reversal in the market. As the ”news candle” still closes as a bullish candle, one should not underestimate the buyer’s strength and go ”short” in this pair. We also cannot go ”long” in the currency pair due to the selling pressure seen later. Thus, we can only trade the pair after he/she gets a sense of clear direction.

NZD/USD | Before The Announcement


NZD/USD | After The Announcement

Lastly, we shall discuss the NZD/USD currency pair, where the first image shows the characteristics of the chart before the news announcement. As we can see, the pair is in a strong downtrend, and just before the release, it is at the lowest point. This indicates a great amount of strength in the U.S dollar, as it is on the right-hand side. If the Crude Oil Production is lower than before, the pair will continue to move lower, and we will not have a suitable trade entry.

On the other hand, if the data is better than last time, we can only go ”long” in the market, if we see some reversal patterns. After the data is released, the market moves sharply higher, almost similar to the above pair, and again leaves a wick on the top. The bad news in the form of lesser Crude Oil Production increased the volatility on the upside and shot the price up.

That’s about ‘Crude Oil Production’ and its impact on the Forex market. Let us know if you have any questions in the comments below. Cheers.

Categories
Forex Fundamental Analysis

Comprehending ‘Capital Flows’ As A Macro Economic Indicator

Introduction

Capital Flow is a useful indicator to assess the relative strength of economies and sectors within an economy. Capital always tends to flow towards growing, improving, and strengthening regions, be it industries, economies, or even currencies. Tracking the flow of Capital can help us understand the expanding areas within a nation and also throughout the world. It also gives us an insight over which sectors are contracting or experiencing a slowdown. Hence, understanding Capital Flow is crucial for investors and traders to make critical investment decisions.

What is Capital Flows?

Capital Flow refers to the money movement within an economy amongst different classes or economies in the broader sense. Capital movement from one sector to another can be for various purposes like an investment, trade, or business operations. On a small scale, individual investors can direct their savings and investment capital into securities such as mutual funds, bonds, or stocks, etc.

On the medium scale, It can include money flow within corporations in the form of investment funds, capital spending on business operations, and R&D. For example, Big tech Giants like Apple or Microsoft can direct their funds on expanding their production sites in other countries. In this case, Capital flows out of the country, or they may choose to invest in Research and Development Sector to develop new products and services, where Capital flows into that division, which is usually headquartered in the native country, in this case, the United States.

On the larger scale, Capital Flows are directed by Government from their federal tax receipts to many outlets like public spending programs, regulatory operations, foreign trades, currencies, and foreign investments, etc. On what aspects the Government decides to direct the flow of Capital can imply many things like development, employment, inflation, foreign goods, imports, etc.

As the entire world runs on money, directing the flow of money is essential. An excess of influx or deficit of money flow can be detrimental for any sector. Hence, the Government segregates Capital Flows into different types for studying, regulating, and policy-making purposes. The following are the Capital Flow types:

Asset-class movements: It refers to the changes of Capital between liquid currency, stocks, bonds and other financial instruments like real estate, metals (ex. Gold, Iron, etc.)

Venture Capital: It refers to the shift in trends of capital movements directing towards startup businesses. Which sector new startup businesses are seeing capital inflow and which are not is tracked through Venture Capital statistics.

Mutual Funds Flow: It tracks the overall addition or withdrawal from the underlying classes of its funds, which can be bonds, stocks, banks, or other mutual funds. Inflow and outflow from one segment to others can imply many things for investors. In general, the influx of Capital Flow into a sector is positive, while outflow is depreciating for that segment class.

Capital Spending Budgets: It refers to the Capital movements for the corporate institutions and is used to monitor growth and expansionary plans of the corporate based on their budget allocation patterns.

Federal Budgets: This is the critical component amongst Capital Flows as it has a long-term impact on the economy and can either attract or drive-off foreign investors. It refers to the budget plans allocated for public spending, running economic operations and regulations, etc.

How can the Capital Flows numbers be used for analysis?

Money accompanies the growth period. Money always follows where there is growth or improvement. In the financial markets, this is called “hot money,” which refers to the funds from investors throughout the world. Whenever a stock market performs good, or an industrial sector improves or comes up with an innovation, it is followed by an increase in the inflow of Capital.

The capital flow can assess the relative strength of capital markets into and out of the markets or the liquidity of that stock market. As the United States is the world’s largest economy and accordingly, it is having the top two stock exchanges, i.e., the New York Stock Exchange (NYSE) and Nasdaq (NASDAQ) beating all the global stock exchanges.

At the corporate level, the flow of Capital helps investors assess the current financial stature of the company and their probable future plans. For example, Investments into expansionary plans are likely to generate more revenue in the future.

The Government’s Federal Budget can be used to analyze how much growth can be expected based on the current public spending and what portion goes into servicing debts. For instance, Higher budget allocation for public spending is indicative of an effort to stimulate the economy in a positive direction. Similarly, interest rates, bond yields can all determine Capital flow in and out of the economy.

Impact on Currency

When Capital flows into the country, the currency appreciates and vice-versa. For example, when the USA regularly imports foreign goods resulting in dollars going out of the country, this results in excess of U.S. dollars in the global economy due to which the value depreciates. On the other hand, if the USA continuously exports its goods, for this other countries send dollars into the USA, creating a deficit in the rest of the world. Accordingly, the demand for dollar increases and currency appreciates.

Generally, High yield rates (ex: Treasury Bonds), bank interest rates deposits relative to other economies attract Capital into the economy. When markets experience a slowdown or heading for a crash, it is amplified by the outflow of cash as it propels the de-liquefication and further drives down the confidence of people. Hence, healthy Capital inflow is essential to maintain the economy and for the currency to hold its value against other currencies. The same is illustrated in the below plot:

(Chart Credits – Market Business News)

Economic Reports

Capital Flow is a broad metric with several components, as discussed. The corporate balance sheets and press releases can be used to understand the Capital Flow within corporate sectors, which they usually release quarterly, or annually on their own official websites. The Federal Reserve System releases of the United States releases its Federal Budget and its recent revisions on its official website. There are many online platforms to track the status of the global stock exchanges themselves to observe the Capital Flow.

Sources of Capital Flows

Fed Balance Sheet Data & Information can be accessed here.

Information on major indices can be found here.

Capital Flow metrics with illustrative graphs for analysis can be found here.

Impact of the ‘Capital Flows’ news release on the price chart 

Now that we have understood the importance and significance of Capital Flows in a country, we shall study the impact of the same on the value of a currency. Capital Flows does not only mean the movement of funds across countries, but it is also measured in terms of investment in asset-classes, venture capital, federal budget, mutual funds, and government spending.

Capital Flows have quite an impact on the economy, if not a major effect. The revenue of the local Exchange Market, money supply and liquidity are some of the parameters which fall prey to any disturbances in the Capital Flows. Traders and Investors keep a watch on the Capital Flows data and monitor the trend of Flows. They will be interested in investing in the country only if they feel that there is growth potential looking at the monthly data.

In this section, we will be looking at the Capital Flows data of the U.S. collected in the Month of February and analyzed the impact on various currency pairs. This data is collected and published by the Department of Commerce’s Bureau of Economic Analysis. A higher than expected reading should be taken to be positive for the currency while lower than expected data is considered to be negative.

USD/CAD | Before The Announcement

Let us first analyze the USD/CAD currency pair. The above image shows the characteristics of the chart before the announcement was made, and we see that the pair in a strong uptrend moving aggressively higher. The uptrend could be due to another fundamental reason which we are not sure about. Thus, we should not be taking ‘short’ trades based on the forecasted data as we don’t see any signs of reversal on the chart.

USD/CAD | After The Announcement

After the Capital flows data is published, we witness a large amount of volatility in the market, and finally, the price closed as a bullish candle. Due to the increased volatility, the price initially went lower, but later, when traders apprehended the numbers, they bought U.S. dollars aggressively, and the ‘news candle’ closed with great strength. This reaction was because the Capital Flows data was largely above expectations and much higher than last time. However, one should not chase the market and enter for ‘buy’ but instead wait for a retracement to join the trend.

AUD/USD | Before The Announcement

AUD/USD | After The Announcement

These are the images of the AUD/USD currency pair, where the first image shows the state of the chart before the announcement is made. In the first image, we see that the price is mostly moving in a ‘range,’ and there is a fair amount of volatility on both sides. Just before the news release, the price is a little above the ‘support’ area, and one can expect some green candles from this point.

This means one should be cautious before taking any ‘sell’ trade from here. After the news announcement, the price sharply drops lower, and we see a rise in the volatility to the downside. Traders again bought U.S. dollars in this pair, and the price closed as a strong bearish candle exactly at the ‘support.’ One could use the supply point of the ‘news candle’ and then take a ‘short’ trade with a  stop loss above the recent high.

NZD/USD | Before The Announcement

NZD/USD | After The Announcement

Next, we discuss the NZD/USD currency pair where before the announcement is made, the market is range-bound, and currently, the price is in the middle of the range. Aggressive traders who wish to ‘buy’ the currency pair based on the forecasted data can do so, but they do should be willing to close their positions after the release if there is a huge difference in the actual data.

But as the volatility is high to the downside, it is advised to wait for the news outcome and then trade based on the market reaction. After the news release, traders sell the currency pair owing to wonderful Capital Flows data for the U.S. economy, and here too, the price closes as a bearish candle. Now we are sure that the weakness could be increasing in the pair, and one can take a risk-free ‘short’ trade with a stop-loss above the ‘resistance’ of the range.

That’s about Capital Flows and the impact of its new release on the Foreign Exchange price charts. Let us know if you have any questions in the comments below. Cheers.

Categories
Forex Fundamental Analysis

‘Consumer Confidence’ & The Impact Of Its News Release On The Forex Price Charts

Introduction

Changes in Consumer Confidence drives macroeconomic indicators like Consumer Spending, which is a significant driver for Gross Domestic Product. Understanding what Consumer Confidence Surveys mean and imply are essential for predicting current and upcoming economic conditions. When understood properly, Consumer Sentiment can give us a hint regarding the direction of economic activity as an advanced or leading indicator.

What is Consumer Confidence?

The Consumer Confidence Statistics reflects the outlook of consumers on the future economic conditions and their financial status. The uniqueness of this indicator lies in the fact that this is a very subjective indicator and may be biased to some extent as it depends largely on the people’s opinion. Two people having the same current job and financial status may give a different outlook on it, but since the scope of the survey is broad, it irons out such exceptions and inconsistencies.

Consumer Confidence reflects how positive or negative people are feeling towards their future in the context of financial security, income, and employment. It is essentially a measure of the Consumer Sentiment in economic and monetary terms.

The numbers shown by Consumer Confidence surveys are not some monetary numbers derived from calculations, but instead, they are opinions rated on a scale in a numeric form similar to how we give a rating to movies on corresponding websites with stars or a ranking from 0-10.

How is Consumer Confidence scaled and assessed?

There are two major survey reports which show Consumer Confidence:

Consumer Confidence Index

It is released monthly by the Conference Board and reflects the general public’s expectations about their economic prospects for the next six months. The Conference Board expertise in these types of surveys (watching Consumer Spending and Buying habits) and take into account a plethora of data and survey information into account (about 5000 households) for their indices. Hence, it is considered a very reliable indicator by many.

Consumer Confidence Index is composed of the Present Situation Index, intended to be a coincident or current economic indicator, and the Expectations Index, expected to indicate future financial health.

Consumer Sentiment Index

The University of Michigan releases a preliminary report on the second Friday and a final report on the fourth Friday of every month. Their Consumer Research center conducts a telephonic survey asking 500 consumers a series of questions on personal finances and their opinions on business conditions. Two components, namely, Expectations Index and Current Conditions Index, make up the questions of Consumer Sentiment Survey.

Is Consumer Confidence necessary for our analysis?

The idea behind Consumer Confidence Surveys is that when consumers are confident of their economic prospects, they will spend more on personal expenses beyond the basic needs. For instance, when you assuredly receive 100$ daily, and the necessary daily requirements are taken care of with 50$. Naturally, we will spend the remaining 50$ for personal enjoyment as the next 50$ take care of tomorrow’s primary needs. In another case, if we were to receive the same 100$ on alternate days, then that money goes only for basic requirements, which cuts off the personal enjoyment expenditure.

Consumer Confidence drives Consumer Spending, which is more than a two-third component of GDP. Consumer Spending is the maker of GDP, and Consumer Confidence is a prime component of Consumer Spending.

How can Consumer Confidence be Used for Analysis?

The University of Michigan’s Consumer Sentiment Index historical data goes back to 1978, which is pretty decent for an economic indicator. Historically it has shown an excellent 85% correlation with the GDP growth rate, and this is a remarkable percentage to rely on these survey indices as leading indicators for the economy’s direction.

A low Consumer Confidence Index is a danger sign showing what is the probable economic crisis ahead in extreme cases. Weak confidence indicates there is a threat to the economy, and a contraction is on its way. Central Authorities may also use this to take corrective measures to change this. On the contrary, A healthy Consumer Confidence Index signals an economic expansion on its way, which stimulates growth and improves the standard of living of the citizens. Consumer Confidence can also be used by businesses to identify recessionary periods and take appropriate steps to minimize their risk and adapt accordingly.

Traders and Investors will always benefit the most from the leading or advanced indicators in comparison to coincident or lagging indicators. With such strong confidence leading indicators, we can significantly reduce our risk on financial investments and come out of trades before the danger signals manifest in the economy or go into the market and ride the economic growth ahead of others.

Sources of Consumer Confidence Indices

The Conference Board, which is a not-for-profit organization, has excellent data analysis for Consumer Confidence Indices. We can go through their surveying methodologies, historical records, samples on their official website. A sample issue of Consumer Confidence Survey pdf file can be found here.

The Michigan Consumer Sentiment Index numbers and corresponding data can be found here. The same is available on the St. Louis FRED website, where we can perform graphical analysis and plot against GDP rates for better understanding.

Impact of the Consumer Confidence news release on the price charts 

After understanding the Consumer Confidence economic indicator, we will now extend our discussion and analyze the impact of the same on the currency. It is a leading indicator that measures the overall economic activity. The reading is compiled after carrying out a survey of about 5000 consumers, which asks them to evaluate future economic prospects. When respondents give high ratings, it shows consumer optimism. Consumer Confidence data does not have a major effect on the monetary policy and the decision of policy-makers. Hence it does not cause severe volatility in the currency pair.

For illustrating the impact, we have considered the Consumer Confidence data of Europe, which is published by the European Commission. The below figure shows the previous, forecasted, and actual Consumer Confidence data in the Euro Zone, which was collected for the month of March. It shows that there was a decrease in the value from the previous month but higher than what was expected. A higher than expected reading is believed to be positive for the currency while a lower than expected reading is considered to be negative.

EUR/AUD | Before The Announcement

We begin our analysis with EUR/AUD, where the above chart shows the state of the currency pair before the news announcement. We see that the market is moving in a range and currently is at the bottom of the range. Since the impact of the news release is less, we need to rely more on technical analysis and trade based on technical indicators, rather than on the outcome of the news. Technically we are at the bottom of the range, so positive Consumer Confidence data is the ideal case for going ‘long’ in the currency pair.   

EUR/AUD | After The Announcement

After the Consumer Confidence data is released, volatility in the market increases on both sides, and the candle closes, forming a ‘Doji’ pattern. The reason behind this indecision is that the Consumer Confidence numbers were better than before but lesser than the forecasted numbers. Some traders took this to be positive, while some felt the numbers were not too great. From the trading point of view, since the market does not break the ‘support’ area, one can enter for a ‘buy’ with a ‘take-profit’ near the ‘resistance’ area.

EUR/JPY | Before The Announcement


EUR/JPY | After The Announcement

The above images represent the EUR/JPY currency pair, and the characteristics of this pair appear to be very different from that of the above-discussed pair. Before the announcement, the market is in a strong uptrend and currently at a point from where the market had reversed earlier. As the market is at a critical point, it is better to wait for the Consumer Confidence data and then trade based on the change in volatility.

After the news release, the price initially goes up but later gets sold into and closes in red. We need to note here that even though the market reaction was bearish, the price did not break the moving average. Instead, volatility increases on the upside and results in a continuation of the trend. One can trade the above pair after price retracement to an appropriate Fibonacci level and then taking a ‘buy.’

EUR/NZD | Before The Announcement 

EUR/NZD | After The Announcement

Now we shall discuss the impact of Consumer Confidence data on EUR/NZD currency pair. The behavior of the chart is similar to that of the EUR/AUD pair where here also the price is moving within a range, and recently the price has broken below the range. Since the selling pressure has increased, it can be risky to go ‘long’ in the market, even if the data proves to be positive for the economy.

After the news release, the market moves higher as a consequence of positive Consumer Confidence data, and the price closes, forming a bullish candle. As mentioned earlier, going ‘long’ can be risky due to the increased selling pressure, and thus conservative traders should not take such trades. Another reason why the up move might not be sustainable is that the impact of Consumer Confidence data on currency is not as much.

That’s about Consumer Confidence and its impact on the Forex Market. Let us know if you have any questions in the comments below. Cheers.

Categories
Forex Fundamental Analysis

What Should You Know About ‘Income Tax’ As A Fundamental Indicator?

What is the Income Tax?

An Income Tax is a percentage of our income that the government takes in the form of taxes. Income Tax is paid by individuals and entities depending on the level of earning and gains during a financial year. In most of the countries, a single income tax does not usually apply to the entire income, but rather various rates apply to different portions of the “taxable income.” The different tax rates and the income levels at which they apply vary widely.

Types of Income which attracts Tax 

Income Tax is a direct tax that is levied on the income and other types of earnings of an individual in a financial year. Below are some types of incomes and taxation rules.

Income from Salary: This includes basic salary, taxable allowances, and profit in lieu of salary, pension received by the person who himself has retired from the service. They all fall under the category of taxable income.

Income from business/profession: This includes presumptive incomes from business and professions that individuals do in their capacity and maybe their part-time work. This is also added to the taxable income after adjustment of the allowed deductions.

Income from properties: A taxable person may also own one or more house properties. These properties can be self-occupied or rented out or even vacant. The rules of Income Tax state that rent from house properties is to be treated for the purpose of calculation of taxable income. An income tax assessee can, however, claim certain deductions for house maintenance in certain areas.

Capital Gains: They are the gains that one makes from selling capital assets like Gold, house properties, stocks, mutual funds, securities, etc. Although capital gains are a part income tax, they are not added to taxable income, as they are taxed at different rates.

Economics and Income Tax

Tax plays a major role in maintaining a balance between people, businesses, and governments,  which broadly represents the economic activity of a country. Here are two ways in which changes to Income Tax affects the economic activity and well being of people.

Tax Incentives

By granting incentives, taxes can affect both supply and demand in an economy. Reducing marginal tax rates on wages can motivate workers to work more. Expanding the income tax credit can bring more low-skilled workers into the labor force. Reducing Tax rates can also encourage to employed persons to invest in stocks and bonds, which improves the capital flow of companies.

Budget Deficit

Large Tax cuts can slow economic growth by increasing budget deficits. When the economy is operating at its potential, a sudden reduction in tax rates may provoke the government to borrow capital from foreign investors and institutions. They will also divert some funds allocated to private investment, reducing productive capacity relative to what it could have been. Either way, deficits increase and thus reduce well-being.

The Economic Reports

The Income-tax rates are announced every year by the Finance Ministry during a press release, which puts out all the slabs and tax brackets based on the income level. This is usually the Central Government tax rate, but there is also a yearly announcement made by all the states, which impose income taxes in the same way the federal government does. In some countries, a single tax rate is applicable to everyone, regardless of the income level. This is called a “flat tax.”

Analyzing The Data

Investors, when analyzing a currency Fundamentally, give extreme importance to the Capital Gains tax of that country. Income Tax is not a major concern for investors when taking a position in the market. But a major deviation from the standard Income Tax rates catches the attention of investors. However, if the Federal government has been maintaining a fixed rate over the years without any major changes, there is no reason to worry, as they fell, the economy is stable. However, an increase in Capital Gains tax is not taken well by the institutional investors, which changes their stance on the economy and the currency, mostly to negative.      

Impact on the currency

A study conducted by economists examined the impact of taxes on the real exchange rates through their effects on economic activity. Their report says that an increase in the capital interest tax rate leads to depreciation in the currency, while an increase in the wage or consumption tax leads to a real domestic currency appreciation. This hypothesis is supported by the data estimations of annual data from 10 OECD countries over 17 years.

A marginal increase in Income Tax is considered to be good for the economy as it increases the revenue of government organizations, but a substantial increase in tax rate can have a reverse effect on the economy, and this will be unbearable for salaried persons.

Source of information on Income Tax rates

Income Tax rates are available on the official website of the finance department of the country, where one can also find the rates for previous years as well (of more than 30 years). Using this information, a trader can analyze the trend in the Income Tax rates over the years. Here is a list of major countries of the world with their Income Tax rates.

Links to Income Tax information sources

GBP (Sterling)USDEURCHFCADNZDJPY

Income Taxes is a compulsory contribution to state revenue, levied by the government on workers’ income and business profits. This gives the ability to the government to provide basic safety and community systems for the public. This ensures freedom and basic living standards that citizens expect. Therefore, it is the duty of citizens to timely file Income Tax returns and be a responsible civilian.  

Impact of the Income Tax news release on the price chart 

After having a clear understanding of the Income Tax and its role in the economy, we will now extend our discussion and study the impact of the same on the value of a currency. Investors and traders mainly consider the Capital Gains tax rates, which is also a form of Income Tax. Any major changes to the Capital Gains tax cause extreme volatility in the currency pair and a change in the outlook for that currency. Thus, the income tax alone is not explicitly taken into account by traders.

In the upcoming sections, we will analyze the change in volatility in the currency pair due to the announcement of Income Tax rates. The above image shows the Federal Tax rates of Canada for 2020, where we can see the percentage of income that will be levied as Income Tax on individuals of the country. This is also known as ‘Tax Bracket.’ The maximum Income Tax rate stood at 33%, and this rate has been maintained from the past four years. This data is published by the Canada Revenue Agency, where one can find other tax rates as well.

GBP/CAD | Before The Announcement

We start our discussion with the GBP/CAD currency pair, where the above image shows the behavior of the chart before the news announcement. Price action suggests that the price seems to be retracing the big uptrend and is at a key ‘support’ level. If the Income Tax rate announcement comes out to be negative for the Canadian economy and not per expectations, one can take a ‘buy’ trade in the above pair. Whereas positive data might not result in a trend reversal as the overall trend is up.

GBP/CAD | After The Announcement

After the announcement, we see that the price moves higher, and it closes with a fair amount of bullishness. The increase in volatility to the upside is a sign of continuation of the trend, and this shows that the data was not very positive for the Canadian dollar. The bullish ‘news candle’ indicates a weakness in the currency where traders find the data to be negative for the economy. As the market moves higher, once can go ‘long’ in the market with a stop loss below the ‘news candle’ and ‘take profit’ at the recent ‘high.’

EUR/CAD | Before The Announcement


EUR/CAD | After The Announcement

The above images represent the EUR/CAD currency pair. In the first image, we see that the price is moving within a range, and just before the announcement of Income-tax rates, the price is at the bottom of the range. Since the price is at an optimal place for going ‘long’ in the market, aggressive traders can buy the currency pair with a strict stop loss of a few pips below the ‘support’ area.

We are essentially advantage of the increased volatility and movement in the pair. After the Income Tax rates are published, the market moves higher similar to the GBP/CAD pair, but later, the market gets sold into, and the candle closes with a large wick on the top. We can say that the news data was neutral to negative for the economy. Thus, there some confusion among traders can be seen. As the ‘news candle’ is not a bullish candle, it is wise to wait for the price to cross above the moving average and then a ‘buy’ trade.

CAD/JPY | Before The Announcement

CAD/JPY | After The Announcement

Lastly, we discuss the CAD/JPY currency pair, where the characteristics of the chart appear to be different from the above two pairs. Since the Canadian dollar is on the left-hand side, an uptrend in the first image signifies a great amount of strength in the currency. As the market is continuously moving higher before the announcement, we need a lot of confirmation from the market in order to go ‘short’ in the market. I

f the news data is positive for the economy, the move gets accelerated to on the upside and, in that case, once can join the trend after a retracement. After the news announcement, the market crashes, and volatility increases to the downside, thereby indicating a possible reversal. The bearish ‘news candle’ shows that the Income Tax rates were not very positive for the economy, and thus traders sold Canadian dollars. One should take ‘short’ trade only after the price goes below the moving average.

That’s about Income Tax and the impact of its new release on the Forex Market. Let us know if you have any questions in the comments below. Cheers.

Categories
Forex Fundamental Analysis

What Impact Do ‘Building Permits’ News Release Have On The Forex Market?

Introduction

The building permits monthly reports is one of the major indicators closely watched by economists and Fundamental analysts. It is also one of the most misunderstood numbers even by experienced traders. Understanding the difference between building permits report, housing starts report, and housing completion reports and what they imply is key here. It is important to understand the building permits report because it plays a key role in predicting GDP growth.

What is a Building Permits Report?

Building Permit Report

It is an official authorization by the local governing body to allow construction of a new building or the reconstruction of an old one. An individual owning land cannot simply build a house or a commercial store without any approval from the concerned legal authorities. The building which has obtained its permit implies that it has received the planning permission by the local state planning department.

The governing body dictates construction rules and regulations, which will be specific to that geographical location. For example, a state which is vulnerable to earthquakes is likely to have a mandate which dictates that building should be able to tolerate a certain level of seismic activity. A coastal region-building permit might require the builders to construct the building to tolerate high-velocity winds etc.

Housing Starts Report

It is a monthly report which tells the number of houses that have started their construction activity recently and are at the beginning stage of the construction process.

Housing Completion Report

It is also a monthly report which tells the number of houses that have reached their finishing stage with the majority of the construction work completed recently.

How is the Building Permits Report obtained?

In the United States, the United States Housing Sector monitors building permits. The Housing Sector releases the U.S. Housing Starts report from which the United States Census Bureau releases the monthly building permits report. The report is released every month in the second or third week for the previous month (eighteenth working day to be precise).

As per the Census Bureau, the organization conducts a voluntary mail survey, to which the officials give a response with their reports and figures from which they generate the final report. They cover almost the entire country through the individual permit offices, which in most cases, are the municipalities. Based on geographical locations, the reports can be categorized for area-specific analysis. 

Is the Building Permits Report important?

The number of building permits applied is genuine, as it costs around 500 to 2000 dollars on the type of building, which can be a residential home or a commercial store. All the numbers are, in actuality, going to translate into real newly constructed buildings.

Construction of a building involves a lot of economic activities like the hiring of the labor force, preparing raw materials, purchasing construction items, hiring engineers, etc. Because of the scale and nature of the activity, more money gets circulated into the economy. A large increase in the number of building permits can indicate an increase in employment, increased consumption of goods and services, flourishing businesses, etc.

Construction permits also indicate that the population has enough funds or has the necessary means, which is usually bank loans. Most people construct a home through a mortgage, which implies that banks are ready to lend money; this again implies that money was injected into the economy to stimulate economic activity.

An increase in building permits can also mean that the population has more confidence in their economic prospects and trust the solvency of the plan. Since the construction of a home or a commercial store involves a significant amount of money, we can also give an insight into the nation’s liquidity and health of the economy. An increase in building permits also gives us an idea about the country’s lending environment, i.e., whether the health of the banking sector for the monetary base of the nation will expand or contract, which can be inflationary or deflationary respectively.

How can the Building Permits be Used for Analysis?

The data set goes back to the 1960s, which is a fairly decent range to rely on its correlation with economic activity with good confidence. The U.S. Census Bureau publishes building permits report, housing starts report, and housing completion report. Among these, the building permits report is the most closely watched reports as it indicates an upcoming economic activity. Whereas the housing starts report tells us about the current economic activity, while the housing completion report tells us of the past economic activity.

An increase in the building permit report tells that the construction sector people are confident about an increase in demand for house sales, which implies more money will be in circulation soon. Conversely, decreased building permits report tells us that the economy is slowing down or contracting due to which people are not ready to buy new houses or do not have sufficient funds to afford the cost.

The building permits report is an advanced indicator, whereas the housing starts report is a current indicator, and the housing completion report is a trailing indicator. The building permit indicates first of an upcoming economic surge or plunge while the housing starts report reflects the current economic condition, and the housing completion report shows the effect of a past economic surge or plunge.

It is noteworthy to mention that the housing completion follows the housing starts numbers, and the housing starts number follow the building permits numbers. An increase in the building permits will automatically result in a rise in the housing starts number in the subsequent months, and a few more months later, the same numbers will appear in the housing completion report. Hence, understanding which reports implies what economic activity is key here.

Sources of Building Permits Reports

We can browse through the historical building permits survey reports on the official website of the United States Census Bureau here. You can also find the construction-related statistics here.

Impact of Building Permits news release on the price chart 

In the first part of the article, we understood the importance of Building Permits in a country, which is a key indicator of demand in the housing market. The ‘Building Permits’ indicator, also known as ‘Building Approvals’, is one of the most impactful events in the forex market.

Traders and investors around the world pay a lot of attention to this data and keep close on its numbers. The ‘Building permits’ data is released on a monthly basis and is said to cause a fair amount of volatility in the currency pair. In the following section, we shall see how the data of ‘Building Permits’ affects the price charts and notice the change in volatility.

For illustrating the impact of the news, we will be analyzing the latest month-on-month ‘Building Permits’ data on Australia and measure the impact of the same. A higher than expected reading is considered to be positive for the economy, while a lower than expected reading is considered to be negative. In this case, the ‘Building Permits’ of Australia was reduced to -15.3% from +3.9%, which is a reduction of a whopping 19.2%. One would already imagine this to be very bad for the Australian economy but let us see what it meant for currency traders.

AUD/CAD | Before The Announcement

We shall begin with the AUD/CAD currency pair, where the above chart shows market action before the news announcement. We see a decrease in volatility as the announcement is nearing as the market players are eagerly waiting for the ‘Building Permits’ data. We already have an idea from what is forecasted by economists that the data is going to much worse than before due to a fundamental factor that has affected the Australian economy. Instead of predicting what the numbers are going to be, it is better to wait for the actual news release and trade based on the shift in momentum.

AUD/CAD | After The Announcement

In the above chart, after ‘Building Permits’ data is released, the market collapses, and the price goes below the moving average. The market reaction was as expected, where there was a sudden increase in volatility on the downside. The data shows that there was the least confidence in the housing market of Australia in the month of February. As the market falls and given that the ‘Building Permits’ data was very bad, we can ‘short’ the currency pair with certainty.

A few hours later, we see that the market shot up and reversed completely.  This move was influenced by the announcement of ‘Interest Rate’ by the Reserve Bank. We need to always be aware of such events, especially when we are already in a trade. This teaches us the importance of trade management, which crucial for every trade.

AUD/CHF | Before The Announcement

AUD/CHF | After The Announcement

The above images represent the AUD/CHF currency pair, where it seems like the market has factored in weak ‘Building Permits’ data before the news announcement. After a big downward move, the market has retraced from the ‘lows,’ which is the ideal use case for going ‘short.’

Also, at present, the price is below the moving average, which shows the weakness of the Australian dollar. After the data is released, the price goes lower but leaves a spike on the bottom, and we see increased volatility on both sides. But this shouldn’t scare us, and we need to stick to our plan of going ‘short’ in the currency pair as the data was really bad.

EUR/AUD | Before The Announcement

EUR/AUD | After The Announcement

In the EUR/AUD currency pair, the Australian dollar is on the right-hand side, which means a news release positive for the currency should take the price lower and vice versa. The characteristics of this pair are different from the above-discussed pairs since the price has retraced the major uptrend by a lot. This means the Australian dollar is very strong against the Euro.

Therefore, any news release that is negative for the Australian economy may not collapse the Australian dollar here. Therefore, it needs to be traded with caution. After the news announcement, the price does go up because of the weak ‘Building Permits’ data, but after a couple of candles, the price goes below the ‘news candle.’ We see that the news data does not have much impact on this currency pair and not suitable for trading based on news.

That’s about Building Permits and the impact of its new release on the price charts. Let us know if you have any questions in the comments below. Cheers.

Categories
Elliott Wave Guide Forex Elliott Wave

Intermediate Level Elliott Wave Analysis Guide

We have finished the section that covers the Intermediate Level of the Elliott Wave Analysis based on the work of Glenn Neely. These concepts are described and include the following aspects.

1.- Introduction to Intermediate Wave Analysis. In this section, we present the concept of grouping waves and how to apply them in the real market.
2.- Motive Waves Analysis. This section, divided into three parts covers the following aspects:
– The first part presents the extension concept and its application in the real market.
– The second part extends the concepts of Alternation, Equality, and Superposition, and we identified how the price action follows these rules.
– The third part presents the canalization process.
3.- Corrective Waves Analysis. This part unfolded in five parts, includes the following concepts:
– The first part reviews the rules of construction of corrective formations and the flat pattern, including its variations.
– The second part presents how to analyze the zigzag pattern and its variations.
– The third part exposes the characteristics and rules of the triangle pattern.
– The fourth part discusses the contracting triangle, including its variations, rules, and target zones.
– The fifth part dedicated to expanding triangles presents its variations and rules.
4.- Validation Rules. This two-part section exposes the next principles:
– In the first part, we learn how to validate impulsive waves.
– The second part shows how to validate corrective waves.
5.- Simplification of Wave Analysis. This last section illustrates how the compaction process can help the wave analyst to ease its analysis.

Categories
Forex Elliott Wave

How to Simplify Wave Analysis – Intermediate Level

Introduction

How to simplify wave analysis can seem a confusing task. However, if we consider the concepts we have previously studied, the process may be more straightforward. 

Until now, we have studied concepts and principles such as types of waves, internal characteristics of each kind of pattern, wave channeling rules, price and time alternation, and wave validation criteria, among other aspects.

In this section, we will see procedures in which we will transform the complexity into a basic market structure.

Waves Compaction

Compaction is the analysis process in which a sequence of adjacent segments that make up an impulse or correction structure (5 or 3) is grouped. Given the dynamic nature of price action, any Elliott wave pattern, once completed, can be labeled as impulsive or corrective. Therefore, this technique cannot be applied, while Elliott’s formation is in progress.

Once an Elliott wave pattern has been completed, the structure of the series can be compacted, which will make as a basic structure. Then, the formation we will use as a base in the following process for the analysis and compaction can be repeated.

Regrouping

Regrouping is the process you perform after compacting waves. At this stage, the wave analyst will use the compacted wave as the base structure of the following wave group and thus construct a series of larger waves, which may be standard or non-standard.

Integration

Integration is the process in which the wave analyst uses short-term compacted waves to form larger wave structures to be included in long-term charts. For example, once a short-term wave pattern is completed, this structure can be transferred with its labels to the long-term (or higher degree) chart. 

This process can be useful for information references when comparing short-term and long-term graphs to obtain a more logical and accurate idea of the next market movement.

The Principle of Complexity

This principle is useful for the classification of subdivisions of an Elliott pattern. Its usefulness lies in the possibility of combining large scale patterns and determining the relative name of the degree of each segment.

In other words, when a wave advances in the short term, it is straightforward to identify each segment and thus identify and label wave pattern. As time progresses, this wave increases its complexity, and the process of compacting waves is required. Once the wave is compacted, another wave is completed on a higher degree. 

Consequently, the complexity tends to grow as the waves increase, and they combine to give way to new waves.

The principle of complexity may not be relevant in the short-term analysis. However, as the horizon of analysis increases, the usefulness of this principle becomes essential. In this respect, the Elliott guidelines identified at the same consecutive level, have the same degree.

The Concept of Degree

Until now, we have used the term Degree superficially referring to an ambiguous time horizon as short, mid, or long term. 

In Elliott wave theory, the degree is not related to a specific timeframe, for example, 15 minutes, an hour, 5-day, etc. It is related to the order in which the different wave patterns are completed. 

R.N. Elliott, in his Treatise “The Wave Principle,” states that both labeling and degrees are not the ultimate purpose of wave analysis, but are an instrument that allows keeping an order to be maintained within the analysis process.

A wave degree is determined by the wave compacting process from the short to the long-term. Once the short term wave has been completed, it will be a segment in a higher time range or greater degree.

R.N. Elliott defined the following degrees to classify the order of market movements.

  • Subminuette
  • Minuette
  • Minute
  • Minor
  • Intermediate
  • Primary
  • Cycle
  • Supercycle
  • Grand Supercycle

The different degrees are represented in increasing order in terms of temporal magnitude. 

On the other hand, Prechter & Frost, in their work “Elliott Wave Principle,” incorporated six additional degrees, as shown in the following table.

In practical terms, to have a reference to the temporality to be used in the analysis process, when Elliott developed wave theory, the smallest data time range available corresponded to the hourly graph. Consequently, the wave analyst can begin by assigning the Subminuette degree to the wave structures that are completed in this temporality and thus advance successively from there.

Conclusions

In this article, we have seen how a systematic process can simplify the process of wave analysis.

The wave analyst can simplify the market analysis helped by the use of the compaction process, which should be realized once completed a wave pattern. Later, by using grades and labels, the wave analyst will be able to maintain a simplified order in the study and, in turn, make a forecast of the next most likely market movement.

In the following article, we’ll start the advanced level of the wave analysis with the study of complex corrective waves.

Suggested Readings

  • Neely, G.; Mastering Elliott Wave: Presenting the Neely Method; Windsor Books; 2nd Edition (1990).
  • Prechter, R.; The Major Works of R. N. Elliott; New Classics Library; 2nd Edition (1990).
  • Prechter, R., Frost.A.J.; Elliott Wave Principle: Key to Market Behavior; New Classic Library; 10th Edition (2005).


Categories
Forex Fundamental Analysis

Understanding The Impact Of ‘Corporate Tax’ On The Forex Price Charts

Introduction

The Corporate Tax is one of the most poorly understood economic indicators when it comes to fundamental analysis of currency pairs and the broader stock market. Most economists have concluded that the Corporate Tax is among the least efficient and least defensive Tax. Although, there is an ongoing debate among economists about the efficiency of Corporate Tax collection from various companies. Beurocrats have agreed that it causes significant distortions in economic behavior.

The common person on the street believes that the Tax is directly paid by Corporations, which is not true. Owners and Managers of corporations often assume that the Tax is simply passed along to consumers—the vagueness about who actually pays the Tax accounts for its continued popularity among officials.

What is Corporate Tax?

The Federal Corporate Tax differs from the individual income tax in two ways. First, the Tax is levied on the net income and not on gross income. This means the profit of the organization is also included in the net income with permissible deductions of business costs. Second, it applies only to businesses that as registered as Corporations and not as partnerships or sole proprietorships.

The Corporate Tax is levied at different rates for different brackets of income. For example, in the U.S., 15% on taxable income under $50,000, 25% on income between $50,000 – $75,000 and rates varying from 34% to 39% on income above that. The federal government has kept the rates low for small corporates with a lower turnover as it can benefit companies to a greater extent. However, lower rates have little economic significance. More than 90% of all the Corporate Tax revenue came from 1.5% of corporations with assets higher than $10 million.

States levy further income taxes on these corporations, the rates ranging from 3 to 12 percent. One of the main reasons behind low State Corporate Tax is that the states can easily relocate out of states that impose unusually high taxes.

Effect on Capital Flow due to Corporate Tax

Today, economists are of the opinion that the burden of Corporate Tax falls entirely on the owners of capital. The latest research says that, since capital is mobile, it will flow to investments that produce the highest after-tax returns. High Corporate Tax raises the cost of capital and reduces after-tax returns in the corporate sector, thus leads to relocation of capital into Tax-exempt sectors of the economy.

When governments reduce the rates under various tax brackets, it has two major effects. Firstly it increases the supply of capital available to corporations, and secondly, it increases the rate of return on investments in the non-corporate sectors as capital becomes more plentiful there.

The major drawback of the relocation of funds due to higher tax rates is that the burden of Tax ultimately shifts to workers and employees. The workers, over time, become less productive and earn lower real wages.

The Economic Reports

The Economic Reports of Corporate Tax are announced on a yearly basis for most of the countries. However, during economic emergencies, changes to the Tax rates will be made by the Finance Ministry to stabilize the money flow into the companies. In the U.S., the Corporate Tax data is published and maintained by the Internal Revenue Service (IRS), which is the government agency responsible for the collection of taxes and enforcement of tax laws. The IRS also handles corporate, excise and estate taxes, including mutual funds and dividends. People in the U.S. refer to the IRS as the “tax man.”

Analyzing the Data

Corporate Tax plays a vital role in the long term growth of a country. Most investors pay close attention to the Corporate Tax rate of a nation as it determines the development of the Manufacturing sector and GDP as a whole. Institutional traders compare the Corporate Tax rates of different economies and invest in those countries where the Taxes are low. They feel that lower tax rates lay down the path of growth for companies, and they will also be able to pay dividends to their shareholders.

Impact on the currency

When the government reduces tax rates, companies will be able to retain their profits, and hence this will lead to reinvestment in the company. This directly leads to the expansion of the business and will be able to increase production. When the Manufacturing sector starts to perform well, investors will be prompted to invest in the economy either by purchasing shares of a company or in the currency. When large investors invest, smaller fund houses also start buying the currency, which leads to an appreciation in the currency.

Sources of information on Corporate Tax

Corporate Tax data is available on the official website of every country’s Finance department, which also provides a comprehensive analysis of the same. Here are the Corporate Tax rates of some of the major countries of the world.      

Sources to find more information on Corporate Tax 

GBP (Sterling)AUD | USD | CAD | NZDJPY

There are many arguments in favor of the removal of Corporate Tax, but this is from the perspective of industries. When we think from the government’s point of view, the Corporate Tax is said to increase the revenue of the government, which is very much needed for running the nation. Executives believe that ‘an old tax is a good tax’ holds validity even today. Any major change in the tax regime imposes new costs and complications during the transition period.

Impact of Corporate Tax rates news release on price charts

We understood in the previous section of the article, the meaning of Corporate Tax, and the role it plays in an economy. In the following section, we will see how the Corporate Tax announcement impacts the value of a currency and cause volatility in the pair. The data of this economic indicator is keenly watched by long term investors and representatives of the manufacturing sector. In the below image, we can see that the Corporate Tax rate announcement has a moderate to high impact on the currency, and in most cases, the announcement is made by the Deputy Governor.

Today we will be analyzing the Corporate Tax rate of Australia, which shall be imposed on the companies for the current financial year. It is published on the official website of the Australian Taxation Office, which gives statistics of previous data as well. The below image shows that the Base Rate was fixed at 27.5%, while for the general category, the Tax rate was fixed at 30%. There were no changes in the Tax rate as compared to the previous year. Let us see how the market reacts to this data.


EUR/AUD | Before The Announcement

We shall first look at the EUR/AUD currency pair, where the above image signifies the state of the chart before the announcement is made. What we see is that the overall trend is up, and recently, the price has been moving within a range. We should be cautious before taking any sell trades in such chart patterns, as the price is at the bottom of the range, and the major trend is up. Depending on the news data, we shall trade the currency pair.

EUR/AUD | After The Announcement

After the Corporate Tax announcement is made, market crashes below, and we witness selling a fair amount of pressure, which takes the price lower, thereby strengthening the Australian dollar. One of the reasons behind the sudden downfall is that the Corporate Tax rates were maintained at the same level as before, which is said to be good the economy (due to overhead costs of changing rates). At this point, we cannot immediately go ”short” in the market as the price is the key ”support” level. Therefore, we should wait for the price to break the ”support” and then take a ”breakdown trade.” In such trades, the ”take profit” should be small based on the overall trend.

AUD/CAD | Before The Announcement

AUD/CAD | After The Announcement

The above images represent the AUD/CAD currency pair, and in the first image, we see that the overall trend is down, suggesting weakness in the Australian dollar, and now the price seems to be retracing the down move. If the data were to be positive for the Australian economy, we need to be extra cautious before attempting a buy trade as the trend is down, and there is a high chance that it might get sold into. However, bad news can work in our favor and might result in a further down move. After the news announcement, we see an increase in volatility to the upside, and the price closes with a bullish ”news candle.” Traders buy Australian dollars after they realize that the Corporate Tax rate was unchanged, which is good news for the manufacturing sector, particularly. One should be trading the pair on the long side, only after suitable reversal patterns are seen in the market.

AUD/CHF | Before The Announcement

AUD/CHF | After The Announcement

This is the AUD/CHF currency pair, where the chart characteristics appear to be similar to the AUD/CAD currency pair. Also, here the market has recently formed a range and currently at the bottom of the range. In this pair, positive news data can prove to the ideal case for going ”long” in the market as the price is at a point from where some buyers can pop up anytime. In any case, it is advised to analyze the data and then trade. After the Corporate Tax rate announcement, the market again moves higher, and volatility increases on the upside, which strengthens the Australian dollar by little. The sudden surge in price is because of the positive Corporate Tax data, and thus traders turn bullish on the currency. One can go ”long” in the market with a ”take-profit” at the ”resistance” of the range and stop-loss below the ”support.

That’s about Corporate Tax rates and the impact of its new release on the price charts. Let us know if you have any questions in the comments below. Cheers.

Categories
Forex Fundamental Analysis

‘Producer Price Index’ & The Degree Of Its Impact On The Forex Charts

Introduction

Producer Price Index PPI, which sounds very similar to the Consumer Price Index CPI is also an equally important indicator. It is widely used as a leading indicator to predict the upcoming CPI and thereby draw economic conclusions accordingly ahead of time. Hence, understanding the Producer Price Index, its history, and the resultant effect it has on the market is significant for traders who trade on Fundamental Analysis.

What is the Producer Price Index?

As the name suggests, the calculation of this index is from the viewpoint of the Producer, i.e., a manufacturer or maker of goods and services. Producer Price Index, in the simplest sense, measures the average of the selling prices of the goods and services at the manufacturing end place. In other words, it is the average of the prices at which the manufacturer sells his products and services to the retailers, who then take it to the local markets and make it available to the general public.

Understanding the difference between what Producer Price Index and Consumer Price Index represent is the key here. Consumer Price Index CPI represents the cost at which goods and services are made available to the general public. Hence, CPI is the measure of average weighed in COST PRICE of finished goods while the Producer Price Index represents the weighted average of SELLING PRICE of the manufactured goods. CPI represents what the end consumer or customer pays, and PPI represents what the manufacturer receives for his commodities.

An item when manufactured and sold from the place where it got manufactured incurs certain costs before it reaches the end consumer. These costs include transportation fees, some specific goods & service taxes, storage costs, etc. Hence, Producer Price is a more rudimentary or cruder form of CPI, and there is an inherent correlation between both. For this reason, PPI is considered an advanced signaling tool to assess CPI and make informed economic decisions by various groups.

How is the Producer Price Index PPI calculated?

The Bureau of Labor Statistics (BLS) surveys almost all industries in the goods manufacturing section and a majority of service sectors. This organization continues to include more and more divisions as time progresses. Producer Price Index of BLS is calculated by first collecting data from all the listed industries by field economists. These people collect data through various means like an onsite visit, phone calls, or even emails, etc.

The producer Price Index uses an altered version of the Laspeyres index. For any given set of goods, it compares the base period revenue to the current period revenue.

Producer Price Index =  (∑QoPo(Pi/Po)) / (∑QoPo)  ×100
  • Qo: Commodity Quantity shipped in the base period
  • Po: Commodity Price in the base period
  • Pi: Commodity Price in the current period

The above equation tells clearly that based on size & importance, items are weighted. The base price corresponds to 100 for which the base year corresponds to 1982. The PPI is published as a percentage increase or decrease with regards to the previously released number, which may be monthly, quarterly, and annually.

Why is the Producer Price Index important?

CPI measures consumer inflation, and PPI measures business inflation. The significance of the Producer Price Index is many-fold. First are the range and history of the data. The index data set goes way back in time. For example, PPIFGS (Producer Price Index by Commodity for Finished Goods) goes as far back as 1947. With such huge data, the reliability of the data set is high, and it usually depicts the macroeconomic picture of country and industrial health with good confidence.

Also, The PPI program is the oldest continuous series of the Federal Government going back to 1902. Second is the frequency & direct ground-level nature of the statistic meaning this data is a real-time reflection of the current industrial health. Thirdly, PPI is very closely related to CPI in the sense that it is an index of the same goods at an earlier stage of the life cycle.

While CPI shows the stats for a product at the near-end of its transaction life cycle in terms of changing hands, PPI shows the stats at the first transaction life cycle, which is very helpful. In this Index, there are many subcategories, wherein certain goods and services get included or excluded from the basket to give a more accurate picture of the concerning market in absolute or relative terms. For example, PPILFE Producer Price Index Excluding Food & Energy (Core PPI) strips away food, gas, and oil prices from the equation whose prices are volatile and measures the absolute changes.

How can the Producer Price Index be Used for Analysis?

The range of PPI is such that there is something for everyone here. Narrowing down into the PPI, any industry can be analyzed. Broadly there are three most popular classifications:

Industry classification: Here, groupings of commodities are done based on the industry sector they represent. The PPI releases about 535 indexes with more than four thousand specific product lines and product category sub-indexes.

Commodity classification: Here, the grouping of items is done based on the similarity of goods and services in terms of their making.

Commodity-based Final Demand-Intermediate Demand (FD-ID): Here, Based on the consumer group, the commodities are classified and are one of the most used PPI stats.

Due to the diversity in the statistics, different sectors of economists can isolate and use the Producer Price Index for their purposes.

Producer Price Index is a widely used indicator for predicting Consumer Price Index. Manufacturers and Industrialists also use these PPI to adjust pricing on the goods and services they buy and sell to fellow manufacturers to avoid having fixed pricing or unfair price changes during the duration of their business contract, which usually tends to be very long periods.

Sources of Producer Price Index

The U.S. Bureau of Labor Statistics releases all the indexes as mentioned above here

You can also find out the same indexes along with many others with a comprehensive summary and statistics of various categories on the St. Louis Fed website.

Impact of PPI’s news release on the Forex market 

After understanding the definition and significance of the Producer Price Index (PPI) in an economy, we shall look at its importance on price charts. For analysis purposes, we have taken the PPI data of Japan, where the survey responses from large Japanese manufactures provide the data for the report. Even though the PPI is a key indicator of the manufacturing sector of the economy, currency traders do not consider it to be the most important indicator of the overall economy. The below image The Business Manufacturing Index (BSI), along with PPI, measures the business sentiment in manufacturing.

The PPI data is released by ‘Bank of Japan’ that measures the change in selling prices of goods purchased by Japanese Corporations. A higher than expected PPI is considered to be positive for the currency and vice versa. The PPI data is released on a monthly, quarterly, and yearly basis, but the highest importance is given to the year-on-year data. The below image shows the latest year-on-year PPI data of Japan that was released in the month of March. As we can see, there is so much variation in the data from ‘previous’ to ‘forecasted to the ‘actual.’ This means, there are many other factors that influence the manufacturing industry that it is difficult to measure for the economists.

EUR/JPY | Before The Announcement

The above chart is that of EUR/JPY, and since the Japanese Yen is on the right-hand side, a down-trending market indicates the strength of the Japanese Yen. The reason behind this downtrend before the news release is because of the bullish expectation of the PPI data from market players. Traders have already forecasted the PPI to be around 1%, which 0.5% lower than the previous reading. Since it is lower, we should expect weakness in the Japanese Yen, but 1% seems to be a good PPI figure for the Japanese economy, hence the downtrend. We need to remember that a higher PPI data is not compulsory to take the currency higher, but rather sometimes the data alone plays importance.

EUR/JPY | After The Announcement

After the PPI numbers are announced, the price barely goes above the moving average line, and there is not much change in the volatility. As the PPI is not an impactful event, the volatility is as expected. A reduction in PPI is bad for the currency, but even though the PPI was reduced, the Japanese yen did not get weak. Therefore, we should just not be paying attention to the news but also use technical analysis to take trades. In this example, we can go long in the market only if we get ‘reversal’ signs, but we don’t see any such patterns. Thus, we should be looking for trend continuation patterns and join the downtrend.

GBP/JPY | Before The Announcement


GBP/JPY | After The Announcement

The above image represents the GBP/JPY currency pair, which shows similar characteristics as that of EUR/JPY, where the downtrend is much stronger than the latter. Since the downtrend is prominent, only a much worse PPI than before can take the currency higher. Even if the PPI was very low, the uptrend would not last as it is not an important measurement of the economy. After the news announcement, there is hardly any effect on the currency pair, and the volatility is in the same range. The PPI data was almost the same as that was forecasted by traders, and we can say that it was as per the market expectations. This made the Japanese Yen to strengthen more and downtrend extended on the downside after a bit of consolidation. Once the market slips below the moving average, a ‘short’ trade can be taken with a stop loss above the ‘news candle.’

USD/JPY | Before The Announcement


USD/JPY | After The Announcement

This is the USD/JPY currency pair, where the chart characteristics are a little different than the above two charts. Here we don’t really witness a downtrend but rather a ranging nature of the market. Since we are near the resistance area, any positive news release should be taken as an opportunity to ‘short’ in this pair. This is the way we should combine fundamentals with technical analysis. After the news is released, we don’t see any change in the volatility, and the ‘news candle’ leaves a wick on the top. The PPI data was again positive for the Japanese Yen, where the price crashed right after the ‘news candle.’

That’s about PPI and how the Forex price charts get affected during the news release of this fundamental indicator. Let us know if you have any questions in the comments below. Cheers!

Categories
Forex Fundamental Analysis

The Momentous ‘Consumer Price Index’ & How It Impacts The Forex Market

Introduction

Consumer Price Index, in short, known as CPI, is one of the most closely watched Fundamental Indicators. It is the most direct measure of the current inflation in the economy that a citizen can look at and find out. Hence, Understanding the Consumer Price Index, its history, and the resultant effect it has on the market is very important to build an understanding of the macroeconomics of a nation.

What is the Consumer Price Index?

As the name suggests, the calculation of this index is from the viewpoint of the end consumer, i.e., a regular citizen who buys his/her daily needs from a local grocery store or market. Consumer Price Index, in the simplest sense, is the average of the most commonly purchased household goods and services like toothpaste, milk, grocery, petrol, etc. But instead of a simple average here, each good and service is assigned a certain weightage based on their importance or usage degree amongst the population.

For example, milk, which is a daily need for many consumers, will have a higher weightage in the mean price calculation than that of furniture, which we do not purchase daily or frequently. Also, when we say most commonly purchased goods and services, it covers a wide range of goods and services (over 80,000 items) and does not include rarely purchased items like stocks, bonds, foreign investments, or real estate.

How is the Consumer Price Index CPI calculated?

The Bureau of Labor Statistics (BLS) surveys the prices of 80,000 consumer items to create the index and publishes it monthly. The Consumer Price Index has two subcategories; one is CPI-W, which stands for Consumer Price Index for Urban Wage Earners and Clerical Workers. CPI-W statistics are published first, and later the CPI-U (Consumer Price Index for Urban Consumers) values are released. CPI-U is a broader statistic in terms of population and goods & services coverage.

CPI-U is the more accurate and complete statistic relatively as it takes the urban population, which represents about 93% of the United States population into account. While the CPI-W covers only about 29% of the population. Hence, It is the measure of an aggregate weighed in the price level of most commonly bought goods and services. The list includes items like food, clothing, shelter, fuel, transportation fares, service fees (water and sewer service), etc.

Consumer Price Index, whenever released, is given out as a percentage change, and here the change is concerning the previous number, which can be monthly, quarterly, or yearly.

Note: Here, the base year cost amounts to 100, and this base year is in the year 1982 to 1984, where the average amounted to 100. But the data released monthly is shown as a percentage increase or decrease concerning the previous period (usually the previous month).

Why is the Consumer Price Index important?

The importance of the Consumer Price Index is many-fold. First are the range and history of the data. With such a huge data set, the reliability is pretty high, and it usually depicts the macroeconomic picture of a country. For example, the history of CPIAUCSL (Consumer Price Index for All Urban Consumers: All Items in U.S. City Average) goes all the way back to 1947. Second is the frequency & direct ground-level nature of the statistic meaning this data brings out. CPI is a real-time reflection of the current economic situation faced by the end customer or citizens.

Thirdly, the change in CPI is useful to ascertain the retail-price changes associated with the country’s cost of living. Hence it is used widely to assess inflation in the United States. In this Index, there are many subcategories, wherein certain goods and services get included or excluded from the basket to give a more accurate picture of inflation in absolute or relative terms. For example, Core CPI strips away food, gas, and oil prices from the equation as the prices of these items are relatively volatile.

How can the Consumer Price Index be Used for Analysis?

Due to the diversity in the statistics, different sectors of economists can isolate and use the Consumer Price Index for their purpose. For example, the United States Bureau Of Labor Statistics provides indexes based on various geographic areas also. Moreover, they even release average price data for select utility, automotive fuel, and food items, which gives this Index the status of a key indicator in gauging multiple economic indicators.

Consumer Price Index is a widely used indicator for inflation measure. For other economic indicators like hourly wages and currency worth within the nation (dollar’s purchasing capacity to procure goods and services), CPI can be considered as a regulator. On average, for a developed nation like the United States, 0.2-0.5% of Consumer Price Index increase is common, and any number beyond these figures usually indicates volatility in the growth of the economy in either direction.

Sources of Consumer Price Index

The U.S. Bureau of Labor Statistics releases all the indexes that are mentioned above. This data can be found here – Consumer Price Index

You can also find the same indexes along with many others with a comprehensive summary and statistics on the St. Louis Fed website as given below.

CPIAUCSL (CPI for All Urban Consumers: All items in U.S. City Average)

This is a broadly used statistic for measuring the overall inflation. It includes Food and Energy prices, unlike CPIFESL. The information related to this index can be found here.

CPIFESL (CPI for All Urban Consumers: All items minus the Food and Energy in U.S. City)

It excludes volatile components like Food and Energy (Oil Prices) and gives more of a Core CPI change within the United States. The information related to this index can be found here.

Impact due to news release

In this section of the article, we will analyze the impact of the Consumer Price Index (CPI) on a currency right when the announcement is being made and see where the market finally gets to. The image below shows that the CPI data has a huge impact (Red box indicates high impact) on the currency, which means it might cause a drastic change in the volatility after the news announcement. Ideally, if the actual CPI numbers are greater than the forecasted numbers, it is good for the currency and vice versa.

We have taken the recent CPI data of Australia, which is quarter-on-quarter. The quarterly data is more important and impactful than the monthly numbers. The below image gives the 4th quarter data of CPI that was measured in January, and the next quarter data will be released in April. We see below that the CPI data for the 4th quarter was 0.7%, which is 0.2% greater than the previous reading. It is also 0.1% greater than the forecasted number. But, let us see how the market reacted to the data.


AUD/USD | Before The Announcement

The above image represents the chart of AUD/USD, where we see that the market is in an uptrend showing the strength of the Australian dollar. One of the reasons behind the uptrend is that traders and investors forecast the CPI data where they are expecting a 0.1% increase in the same. If the CPI numbers are increased more than expected by the ‘Australian Bureau of Statistics,’ it could be the best-case scenario for going ‘long’ in the market. However, if the numbers are below expectations, volatility could increase on the downside.        

AUD/USD | After The Announcement

Here, we see a sudden surge in volatility on the upside that after the news announcement is made. The reason for this is that the CPI got increased by 0.2%, where the market was expecting a 0.1% rise. The large green candle shows how impactful the CPI data is on the currency. From a trading point of view, one should not be chasing the market but instead, wait for a pullback at the nearest support and resistance area and then take suitable positions. The CPI data was so positive for the Australian dollar that the price does not even come below the moving average. Take Profit‘ for the trade can be at the new ‘high’ with a stop-loss below the opening of the news candle.

AUD/CAD | Before The Announcement

AUD/CAD | After The Announcement

The AUD/CAD currency pair appears to be in a ‘range’ just before the news announcement and is at the bottom of the range. An interesting way of positioning ourselves in the pair is by having small ‘buy’ positions before the news announcement. Because the forecasted CPI data is greater than the previous reading, and we are at a technically important level that is supporting our ‘buy’ positions. The news outcome makes the ‘support’ area work beautifully as the market shoots up to the resistance area. Here too, the data proved to be very positive for the Australian dollar as a higher CPI data drives the currency higher. We can hold on to our trades even if the price is at ‘resistance’ since the news data is very good for the currency, and it has the potential to break the ‘resistance’ and move further.

EUR/AUD | Before The Announcement

EUR/AUD | After The Announcement

In this currency pair, the Australian dollar is on the right-hand side, which means a positive CPI data should take the currency lower. We can see that the Australian dollar already strong as the market is in a downtrend, and the market participants are optimistic about the CPI data of Australia. After the CPI announcement, the volatility increases on the downside, taking the price to a new ‘low.’ Again, when we witness better than expected data of any economic indicator, we should not be chasing the market but wait for a retracement to key levels. In this case, since we don’t see a retracement after the red ‘news candle,’ only aggressive traders can take ‘short’ positions with the confidence that the CPI numbers were exceedingly better than before and that it will take the currency lower.

That’s about CPI and its impact on the Forex market. We hope you find this information useful and if you have any questions, shoot them in the comments below. Cheers.

Categories
Forex Elliott Wave

Validation Rules of Corrective Waves – Intermediate Level

Introduction

Contrary to the case of impulsive waves, corrections do not require a sequence of retracements. The confirmation of the corrective patterns depends on the lengths of waves A and B within the correction. 

The validation of a corrective structure is defined in two stages. If both stages are verified, then the wave analyst will be sure that the corrective formation is correct. It should be noted that there is the possibility that only one of the two stages is validated; this does not limit that the pattern being valid.

Flats and Zigzag Patterns

Case 1 – Wave A is Larger than Wave B

In this case, the wave analyst must draw a trendline linking the origin of waves A and the end of B.

The first stage will verify the authenticity of the corrective formation if the price action violates the trendline O-B within a period equal to or less than the interval of wave C formation.

In case the time-lapse is longer, then the price action could be developing a terminal structure, or wave 4 of wave C could be incomplete, or the corrective pattern analyzed is not correct.

If the analyzed pattern is correct, then the second stage must be revised. In this stage, the wave analyst must study time lapsed in the complete retracement of wave C, which must be in a time equal to or less than the time spent in the formation of the wave C.

Case 2 – Wave B is Larger than Wave A

In this case, the first stage would fulfill if the wave C undergoes a complete reversal in the same or shorter time when the time lapsed in the wave C construction. 

The second stage will fulfill if the price action exceeds the trendline O-B in a period less than or equal to the time that took the wave C formation.

Triangles

As we have seen in previous articles, there are two types of triangles, contracting and expanding. Unlike flat and zigzag patterns, where the first stage of validation consists of the violation of the trendline O-B, in the case of triangles, the trendline B-D violation is the one considered.

Contracting triangles are the easiest to validate after the violation of the trendline B-D. However, this does not happen in the same way in expanding triangles. 

In expanding triangles, validation comes determined through the “no confirmation.” That is, once the wave E finishes, the price action should not reverse the advance of wave E completely. 

Therefore, this retracement would discard out any possible violation of the guideline B-D, or it would take longer to reverse the advance of the wave E than the duration of the wave E.

Validation of a Contracting Triangle

As mentioned above, in the case of triangles, the guideline B-D is used instead of the line O-B. The first stage of validation of the contracting triangle pattern will occur if the price exceeds the line B-D for a period less than or equal to the time it took to construct the wave E.

The second stage is defined by the thrust that occurs after the wave E in a triangle, which should exceed the highest (or lowest) price achieved by the triangle. In turn, the thrust should finish within a time range that not exceeding 50% of the duration of the triangle.

Conclusions

In this educational article, we have seen that the criteria for validation of corrective waves differ from impulsive waves in terms of the conditions to consider for a valid pattern. 

Also, we reviewed the importance of validating each structure under analysis. That will help the wave analyst to verify if the pattern identified is correct or not. 

This knowledge will allow the analyst to facilitate the realization of forecasts on the potential next movement of the market.

In the next educational article, we will review some key concepts for the process of analyzing waves such as wave compaction, degrees, and introduce the concept of complexity in the wave analysis.

Suggested Readings

  • Neely, G.; Mastering Elliott Wave: Presenting the Neely Method; Windsor Books; 2nd Edition (1990).
Categories
Forex Elliott Wave

Validation Rules on Impulsive Waves – Intermediate Level

Introduction

In our previous articles, we have seen that impulsive waves have construction rules. However, some rules, or principles, allow the wave analyst to validate or confirm each guideline. These rules are divided into two groups, which we will detail in this educational article. 

First Rule – Validation of the Trend Line 2-4

This rule will apply once the impulsive pattern ends. The wave analyst must trace the trendline joining the end of waves 2 and 4. Then, the impulsive wave will be confirmed if the price action pierces the trendline 2-4 in the same or less proportion of time it took to form wave 5.

In case the fifth wave takes longer, the price develops a terminal structure or wave 4 that has not still ended, another possibility is the wave analyzed does not correspond to an impulsive formation, but to a corrective wave.

Second Rule – Retracement from the fifth wave

Within an impulsive wave, the wave analyst must recognize which the extended segment is. Depending on this factor, it will be possible to determine the level at which the price could fall, determined by the wave 2 and 4 price range within the momentum structure.

First Wave Extension

In this case, the retracement should go to the end of wave 4. However, if the price extends its retracement beyond the end of wave 4, then the impulsive wave will end up with a larger correction in terms of price and time.

Third Wave Extension

The price has to return to the fourth wave area of ​​the impulsive pattern and will generally finish near the end of that wave. If the retracement comprises more than 61.8% of the complete motive sequence, then the third wave would involve a higher degree impulse wave completion.

Fifth Wave Extension

When the extension appears in the fifth wave, the price should reverse at least 61.8% of that wave, although it might not retrace the complete wave. If the price retraces the complete progression of the fifth wave, then the retracement would complete a higher degree pattern.

In this case, the following could happen:

  1. The fifth wave extension pattern is part of a higher degree impulse, which is also a fifth wave extension, or
  2. The extension of the fifth wave is a wave C of a flat pattern or a zigzag.

Fifth Wave Failure

A fifth wave failure occurs when wave 5 of an impulsive sequence is shorter than wave 4 high. It generally occurs when the opposing trend is stronger than the initial impulsive movement trend. Consequently, if the wave analyst detects this type of failure, it should notice that the movement following the fifth wave is highly likely to reverse the forward movement of the impulsive movement completely.

On the other hand, if the motive movement was bullish, there should not be further highs until the price has fully retraced the impulsive bullish sequence. This affirmation is analogous if the impulse is bearish.

Conclusions

In this educational article, we have seen how to validate an impulsive sequence in terms of its correction. Also, we commented on the potential of the next path, respecting the fifth wave retracement and what is the extended wave in the impulsive sequence.

Likewise, we have seen the case of the failure in a fifth impulsive wave and what will be the impact in the next movement.

In the next educational article, we will see the process of validation of corrective structures.

Suggested Readings

  • Neely, G.; Mastering Elliott Wave: Presenting the Neely Method; Windsor Books; 2nd Edition (1990).


Categories
Forex Fundamental Analysis

‘Non Farm Payroll’ as a Macro Economic Indicator & Its Impact On The Forex Market

Introduction

The NFP is one of the most important fundamental indicators in the Forex market, which causes large price movements in currency pairs. This article will explain the basics of NFP, the role of NFP in economics, and how to interpret the NFP data after its release.

What is the Nonfarm Payroll (NFP)?

The Nonfarm Payroll report gives the number of jobs added or lost in a country compared to the previous month. These numbers do not include agricultural farmers, employees belonging to the non-profit organization, self-employed individuals, private households, and employees of military agencies. NFP also provides the statistics of the long-term employment and youth unemployment rates. This indicator tells which sector of the economy is generating jobs and which are not. The government investigates these numbers carefully and takes appropriate actions to improve the employment situation of that sector.

The economic reports of NFP

The ‘Employment Situation’ report is a monthly report that is released by the Bureau of Labor Statistics (BLS) on the first Friday of every month. The report is released at approximately 8:30 in the morning. The NFP report is a comprehensive report that is made after the survey of two major sectors of the economy. The two sectors are the ‘Household Sector’ and the ‘Establishment Sector.’ The ‘Household Survey’ gives the employment rate of individuals in various categories, and the ‘Establishment Survey’ provides the number of new nonfarm payroll jobs added within the economy.

Survey of the ‘Household Sector’

Key components of this survey include

  • The total unemployment rates
  • Unemployment rate based on Gender
  • Unemployment rate based on Race
  • Unemployment rate based on Education
  • Unemployment rate based on Age
  • Reason behind unemployment
  • Participation (for employment) rate by individuals

Survey of the ‘Establishment Sector’

Key components of this survey include

  • The total nonfarm payrolls added by industries of durable goods, non-durable goods, services, and government
  • Hours worked by employees
  • Average hourly earnings of employees

Analyzing the Data

The economic report of NFP is an essential factor of fundamental analysis that investment managers evaluate before making investment decisions. This data is crucial when determining the strength of the economy and, thus, the value of the currency. One can analyze the data by comparing the release of the current month to that of the previous month. This comparison helps to determine if the country has generated more jobs for its people or have, they lost more jobs compared to the previous month.

Based on the month on month numbers, we can conclude if the economy is strengthening or deteriorating. We can also anticipate if the US economy will perform at the expected growth rate, or there will be a reduction in the GDP.

Impact on currency

When unemployment rates are low, banks and institutions gain confidence in that economy and will be willing to invest in that country. When several other banks invest in the country, it leads to an appreciation of the currency and the economy. Forex traders and investors consider this factor as a very important indicator for predicting the future value of a currency.

NFP data has a direct impact on most of the asset classes, including Forex, commodities, equities, and Index CFDs. It is seen that the market reacts quickly to the data with a huge rise in volume. During the news announcement, all major market players and institutions take new positions in the market or exit their existing positions. As millions of positions are created and removed at the same time, one can witness heavy volatility during the news release. The condition of the job market has a direct link to consumer spending, which represents the health of the economy. When people of a nation are employed, they use their wages for purchasing various goods and services to fulfill their needs.  This means the consumer spending automatically increases.

Sources of information on NFP

The Bureau of Labour Statistics (BLS) releases the typical NFP data on the first Friday of each month. However, the first round of data is released on the third Friday after the end of the reference week. But as traders, we need to focus on the data that is released on the first Friday of each month and monitor it carefully. We also need to keep with us the previous month’s data and the forecast for the current month. There are many financial websites that give a graphical representation of the historical data that will give a clear understanding of how the NFP data has changed over time.

Sources of information for major economies  

USDCHFCAD

Nonfarm Payroll is vital because it is released monthly and is a very good indicator of the current state of the economy. This data can be found on the ‘economic calendar’ of every broker. When the unemployment rate is high, policymakers tend to have a monetary that will increase economic output and increase employment. There are timely revisions that take place to review the components of NFP, and the components may change if necessary. Another aspect of unemployment is the number of working hours and hourly wages. It is possible that people are employed but will be working part-time or earning less for that work.

The NFP data release is accompanied by increased volatility and widened spreads, which means in order to avoid getting stopped out, we recommend using larger stop loss without changing the risk to reward ratio. This is possible is we use no leverage at all during NFP news release and enter with a smaller position in the market. We need to do 90% of the analysis even before the news is released so that when the actual data is out, we should quickly be able to decide if we have to go ‘long’ or ‘short’ in any given Forex pair.

Impact Of NFP News Release On The Forex market

The non-farm-payroll (NFP) is a key economic indicator that measures the health of the economy for the United States. The NFP represents the number of jobs added in a period of one month that excludes farmers, government employees, and employees of other non-profit organizations.

So, a higher than expected reading should be taken as positive for the US dollar, while a lower than expected reading is taken to be negative for the US dollar. NFP releases generally cause large movements not only in the forex market but also in the commodity and stock market. In this section of the article, we will explain the impact of NFP on the price chart and see how to apply the NFP data in our trading strategy.

The below image was taken from Forex Factory, and the red indication there implies that this Fundamental Indicator’s new release will have a strong impact on the Forex price charts.

The below image shows the latest NFP data that was collected for the month of February. The NFP data is published by the Bureau of Labor Statistics (BLS), which also carries out surveys across the country. Based on the NFP data, traders and investors from all over the world take suitable positions in the market, which is the reason behind increased volatility. The expected NFP results for March 8, 2020, was around 175k (job additions), and the actual data came out to be 273K (job additions), which was much better. Even though this should be positive for the US economy, let us see how the market reacted.

EUR/USD | Before the announcement | March 6th, 2020

We shall start with the most liquid currency pair in the world and see the impact of NFP news release on it. In the above chart, EUR/USD is in strong uptrend signifying the weakness of the US dollar. One of the reasons behind the weakness is lower NFP expectations from economists as compared to the previous data. The market feels that there were fewer job creations in the month of February, and hence they don’t want to buy US dollars. From a technical perspective, the market is just going up without a retracement, and we cannot take a position on any side at this point. When there is constant movement on one side, it is better to wait for the news outcome, and then based on the data, one can enter the market.

EUR/USD | After the announcement | March 6th, 2020

The NFP numbers were the same as before, and an equal number of jobs were created this time too. This was more than what the market was expecting and optimistic data for the US dollar. In the above chart, we see that the price falls soon after the NFP data was announced, and the US dollar strengthens all of a sudden. The volatility expands on the downside as NFP data was above expectations, but it could not result in a reversal of the trend. The ‘news candle’ leaves a wick on the bottom, and the price rallies further up. Since the current data was no better than previous data, some traders consider it to be negative for the economy and hence sell US dollars. Until one gets clear reversal patterns, he/she should not go ‘short’ in the market, thinking that the data is positive.

USD/JPY | Before the announcement | March 6th, 2020


USD/JPY | After the announcement | March 6th, 2020

The above images represent the chart of the USD/JPY currency pair, where the market is in a strong downtrend, again showing the weakness of the US dollar. Since the impact of NFP is high, robust data can result in a reversal of the trend, and a weak to not-so-positive data can result in trend continuation. For risk aversion, one needs to go ‘long’ in the market with a great amount of caution, and we need to combine the news outcome with technical analysis. However, it is much easier to go ‘short’ in the pair if the NFP data is not good. After the news announcement, we see the bullish candle and witness increased volatility on the upside. But this NFP data was not sufficient to talk the price even to the recent ‘higher high,’ this means the data was mildly positive for the US economy.

AUD/USD | Before the announcement | March 6th, 2020

AUD/USD | After the announcement | March 6th, 2020

In the AUD/USD currency pair, the US dollar is much stronger than other pairs where the price is below the moving average before the news announcement. Since the US dollar is already showing strength, we can say that a mildly positive data can take the currency lower and result in an extended downward move. And only a negative NFP data can result in an up move. After the NFP data is released, we see a formation of the ‘Doji’ candlestick pattern, indicating indecision in the market. As the price continues to remain below the moving average, we can expect the volatility to increase on the downside.

That’s about Nonfarm Payrolls and its impact on the Forex market. If you have any questions, let us know in the comments below. Cheers.

Categories
Forex Fundamental Analysis

Understanding ‘Foreign Exchange Reserves’ & Its Impact On The Forex Market

Introduction To Foreign Exchange Reserves

Foreign Exchange Reserves are foreign assets held by a country’s central bank. Most of the foreign reserves are held in the form of currencies, while the other reserves include deposits, bonds, treasury bills, other government securities. There are plenty of reasons why central banks hold reserves. And the most important reason is to control their currencies’ values. The reserves act as a backup for their liability. From an economic point of view, it essentially influences the monetary policy.

When a country’s currency falls considerably, the foreign exchange reserve acts as a backup of their economy. Typically, countries hold the US dollar as their forex reserves because it is the most traded currency in the world. Apart from that, the Great Britain Pound, Chinese Yuan, Euro region’s Euro, and Japanese Yen are the currencies that are held as FX reserves.

Understanding Foreign Exchange Reserves

Let us understand with an example, how exactly are the forex reserves accumulated.

Consider two countries, the United States and Great Britain Pound. In the present situation, let’s say the value of USD and the GBP is the same with stable economies. Now let’s say the investors start believing that the USD is going to perform exceptionally well in the coming years. So, they begin flowing in cash into the US’s real estate and the stock market. This brings up a massive demand in the US dollar, while supply in Pound.

In such a situation, people must pay more Pounds to purchase one US Dollar. Or in USD’s perspective, people must pay lesser US dollars to buy one Pound. Moving further, let’s say the US does not want its currency to get very strong. This is because it has led to high volatility in the price and dramatic moves in the market.

With this concern, the central banks start printing more of their currency (US Dollar). And this money is deployed into buying the GBP. In doing so, the supply and demand of both the currencies stabilize again. Now the Pounds that the US central banks own are the foreign reserves. This hence appears on the balance sheet of the US.

What is the Purpose of Foreign Exchange Reserves?

There are several ways central banks use FX reserves for different purposes.

The countries use their foreign reserves to keep their currency’s value at a fixed rate. An example of the same is given above. Countries with a floating exchange rate system use FX reserves to keep the value of their currency less than the US dollar. For example, Japan follows a floating system. The central bank of Japan buys US treasury so that the Yen stays below the Dollar.

Another critical function of the reserves is to maintain liquidity in case of economic crises. For instance, a natural calamity might bring a halt to local exporter’s ability to produce goods. This cuts off their supply of foreign currency to pay for imports. In such scenarios, central banks can get their local currencies in exchange for the foreign currency they have. Hence, this allows them to pay for and receive imports.

The foreign currencies are supplied by the market to keep markets steady. It also buys the local currency to prevent inflation and support its value. Central banks provide confidence to investors through reserves. They assure their foreign investors that they’re ready to take action to protect investors’ investments. This will prevent the loss of capital for the country.

Some countries use their foreign reserves to fund sectors. For example, China has used its reserves for rebuilding some of its state-owned banks.

How Forex Reserves impact the currency?

Foreign exchange reserves are important to investors as it controls the supply and demand of the currency in the forex market. Knowing that central banks try keeping the currency values stabilized, we take advantage of this and try predicting the value of a currency pair.

Let’s say the US is buying large quantities of Australian goods, bonds, etc. This would create a demand in the Australian Dollar against the US dollar. That is, the value of AUD/USD would rise in doing so. Now, if the value rises to a significant amount, the central banks will buy back the US dollars from them, which creates a demand in the USD. And this hence will bring down the value of AUD/USD to keep it stable again. Therefore, traders can look to go short on AUD/USD knowing that USD would buy back their currency to keep both the currencies stable.

Reliable Source of information on Foreign Exchange Reserves

Traders and investors need the data of foreign exchange reserves to make their investments. And this data is publicly available for free. Below are the portals to access the reports on the Forex reserves of different countries. Apart from the current data, one can access the historical data with graphical charts as well.

USD | CAD | GBP | AUD | EUR | JPY | CHF

Impact Of Foreign Exchange Reserves’ News Release On Forex

From the above topics, it is evident that Foreign exchange reserves affect the currency of an economy. Now, we shall see how the price charts are affected when the reports are released. Typically, the impact of the news after its release is low. The Forex reserves of a country are released on a monthly basis and usually at the beginning of a moth. However, the source of the announcement is different for different countries.

For analysis, we will be considering the data released by Japan. The reports on the FX reserve is announced by the Ministry of Finance of Japan. Specifically, we will be considering the reserves that are held as USD. Consider the below report of Foreign exchange reserves (USD) held by Japan’s central bank. The news was announced on 5th March 2020. We can that the newly released data was higher than the previous month by 16.7B.

Source: Investing.com

USD/JPY | Before the Announcement | 5th March 2020

Below is the chart of USD/JPY on the 15min timeframe before the release of the news. Currently, the market is showing some strength from the buyers.

USD/JPY | After the Announcement | 5th March 2020

Below is the same chart, but after the release of the news. We can see that a green candle popped at first but was eaten up by a red candle. Basically, the up move was nullified by the sellers. Also, we cannot really say that the up and down move was due to the news because the volume didn’t show any sudden spike up. Typically, for impactful news, the volume increases drastically, which did not happen for this news. However, the volatility rose a little above the average but dropped below in a few minutes. One of the reasons we could account for the low volatility and volume is that the report was almost the same as the previous month’s report.

EUR/JPY | Before the Announcement | 5th March 2020

EUR/JPY | After the Announcement | 5th March 2020

Consider the chart of EUR/JPY on the 15min timeframe given below. The news candle is marked by a rectangle around it. We can see that the price action of this pair is very similar to that of USD/JPY. Initially, the market showed a bullish move but dropped the next candle. Speaking of volatility, it was a pip or two above the average volatility. The Volume, too, did not increase during the announcement of the news, which usually happens for other impacting news. Hence, in this pair too, the FX reserves did not have an immediate impact on the currency pair.

GBP/JPY | Before the Announcement | 5th March 2020

GBP/JPY | After the Announcement | 5th March 2020

Below is the chart of GBP/JPY on the 15min timeframe. Similar to the above two pairs, in this pair too, the price action is almost the same. In 30 mins after the release of the news, the market showed a little bullish but ended on a bearish note. The volatility at this time was at the average line, and the volume was feeble. In fact, it was lesser than the time when the London or New York market opens. Hence, with this, we can come to the conclusion that the impact of Foreign exchange reserves on GBP/JPY was insignificant.

Conclusion

Foreign exchange reserves are the assets of other countries held by the central bank of a country. The reasons for doing so are plenty. The Foreign Exchange Reserves has its influence in determining the monetary policy. FX reserves can control the rate of a currency and can use to stabilize the same.

However, if we were to see its immediate impact on the price charts, it is low. The impact on the currency pair is usually when it is significantly overvalued or undervalued. FX reserves are also helpful to central banks in bringing up the economy to an extent. This indicator may not predict the future economy but can help economists in several other ways.

That’s about Foreign Exchange Reserves and their impact on the price charts. If you have any questions, let us know in the comments below. Cheers!

Categories
Forex Fundamental Analysis

‘Productivity’ as a Fundamental Indicator & Its Impact On The Forex Price Charts

Introduction

Productivity is an important fundamental indicator that talks about the levels of the industrial output of a country. It is one of the leading indicators in the Forex market, which has a long-term impact on the currency’s value. The industrial output is linked to the theory of demand and supply, which means the availability of raw material and policies set by the monetary policy committee directly affects the overall output. Let us understand this concept in depth by looking at the definition of Productivity first.

What is Productivity?

Productivity is defined as the ratio of total output volume to the total input volume. The ratio is mentioned in the form of an average, which expresses the total output of a category of goods divided by the total input, say raw materials or labor. In simple words, Productivity measures how efficiently the inputs such as labor and capital are being used in a country to produce a given level of output.

Productivity determines economic growth and competitiveness and hence is the basic source of information for many international organizations for measuring and assessing a country’s performance. Analysts use ‘Productivity’ data to also determine capacity utilization, which in turn allows one to assess the position of the economy in the business cycle and to forecast economic growth.

Measuring Productivity

Before we see how Productivity is analyzed, we need to consider various methods of measuring the output and input components of Productivity and the limitation of using each of these estimates.

Output

When we are talking about output, the number of units produced of each category of commodity or service should be counted in successive time periods and aggregated for the company, industry, and the whole economy. This output should be measured in comparison to some other indicator of equal importance, usually cost or price per unit in a period. The changes in the price of the goods produced are observed for two or more periods that are said to influence the aggregate output volumes. Price deflation is usually employed to get the estimation of the real gross product by sector and industry. The obtained estimates will be used as numerators in the productivity ratios.

The limitation of using the above methods is that quantities and prices for many outputs of finance and service industries are deficient.

Input

Labor input is easy to measure, as it only involves counting the heads of persons engaged in production. But in fact, the number of hours worked is preferable to just the number of people. This dimension, too, is related to the compensation received per hour of work, also known as wage. The official estimates, however, do not differentiate among various categories of labor where they measure labor inputs by occupation, industry, and other categories.

The drawback of using this method for estimating the labor input is that it is difficult to find the relation between the number of hours worked and hours paid for during paid holidays and leaves.

Determinants of Productivity

Technology determines the maximum level of output that can be reached and the quality of output that is required. In this age of technological advancement, innovations and automates systems play a major role in carrying out the production activity. Technological changes are happening very fast in some industries while it is gradual in others.

The Skills of the workers matter a lot when determining Productivity on an individual level. For example, if an unskilled worker tries to carry out a task, he might make more mistakes and will not be able to optimize the time to work, whereas a skilled worker will need less time to do the same job.

Some other methods of attaining high Productivity are through adequate levels of earnings, high job security, quality education and training, good and safe working conditions, and an appropriate work-life balance.

The Economic Reports

The economic reports of Productivity are published every month for most of the countries. There is also the collective data that combines the monthly statistics of a country which is published on a yearly basis. The productivity data is maintained and provided by two big OECD (Organisation for Economic Cooperation and Development) databases, which are ISDB (International Sectoral DataBase) and STAN (Structural Analysis DataBase). At these sources, we can find the data from 1970 for countries like the United States, Japan, and other European countries.

Analyzing The Data

From a trading perspective, Productivity plays a vital role in the fundamental analysis of a currency pair. The productivity data shows the production capacity of a country. Using this data, various agencies decide which goods need to be imported and exported from the country. By comparing the data of two countries, one can determine which economy is stronger and has the potential to grow.

One thing to keep in mind when analyzing the data is to compare similar economies as different countries will have a different level of development. When looking at developed countries, it is fair to expect the productivity ratios to be in triple digits, and for developing economies, it could be in two digits.

Impact on the currency

The impact due to Productivity on the currency is split into two different categories, i.e., the ‘traded’ and the ‘non-traded’ sector of the economy. The ‘traded’ sector is made up of industries that manufacture goods for import to foreign countries and hence have a presence in the foreign exchange market. The ‘non-traded’ sector is comprised of industries that produce goods for the domestic market only.

So, as the prices of goods of the ‘traded’ increase, the currency of that country is set to appreciate and thereby increasing the inflow of funds into the country. In the case of ‘non-traded’ sector goods, an increase in the price of such goods is not good for the economy as this would make the products costlier and people will have to spend more to purchase them. This would negatively impact the currency, and institutions will not be willing to invest in such countries.

Sources of information on Productivity

Productivity data is available on the most prominent economic websites that provide a detailed analysis with a comparison chart of previous data. Using this information, a trader can analyze and predict the future data of the economy. Here is a list of major countries of the world with their productivity stats.

GBPAUDUSDEURCHFCAD | NZDJPY  

Higher Productivity has an impact on the profit of a company and the wages of the employees. High profits due to high Productivity generate cash flow, increase loan provision from banks, and, most importantly, attract investment from foreign investors. Due to this, companies can afford to pay more wages to their employees without losing market share.

Impact Of Productivity News Release On The Price Charts 

Productivity is one of the most important economic indicators that measure the annualized change in the labor efficiency of the manufacturing sector. As Productivity plays a major role in an economy, it is necessary to analyze the impact of the same on the currency. The below image shows that Productivity is not a crucial factor for forex traders, which means the Productivity data might not have a long-lasting effect on the currency. However, one should not forget the data that affects the manufacturing sector and hence indirectly impacts the GDP. Therefore, we should not underestimate the figures.  

To explain the impact, we have considered the NonFarm Productivity of the US, which is released by the Bureau of Labor Statistics of the US Department of Labor. A ‘higher than expected’ reading should take the currency higher and is said to be positive for the economy, while a lower than expected reading is considered to be negative for the economy and should take the currency lower. The latest figures show that there has been a 1.4% rise in Productivity levels from the previous quarter. Let us find out the impact on the US dollar.

NZD/USD | Before the announcement | 5th March 2020

The above chart is of the NZD/USD currency pair before the Productivity numbers are announced. What we essentially see is a strong down move that has resulted in a reversal of the uptrend. The volatility is high even before the news release. The reason behind this move is much greater expectations of Productivity than before, which is making traders buy US dollars. Now, if the Productivity numbers were to be lower than before, we can expect a reversal of the downtrend, but it might not be sustainable as it is not a high impactful event.

NZD/USD | After the announcement | 5th March 2020

After the Productivity data is announced, volatility further increases on the downside, and the market moves much lower. What we need to observe is that even though the market goes lower, it fails to make a ‘lower low.’ This is because the productivity data is not of much importance to traders, and hence the impact will not last long. Therefore, the market respects the news for just a couple of candles and later takes support at the lowest point and goes higher. From a trading point of view, the only way to trade Productivity news release in this pair is by going ‘short’ after the news outcome and exit at the nearest opposing point.

GBP/USD | Before the announcement | 5th March 2020

GBP/USD | After the announcement | 5th March 2020

The above images represent the GBP/USD currency pair, where the characteristics of the chart are totally opposite to that of the NZD/USD chart. Here, the uptrend seems to be dominating, which is also confirmed by the moving average indicator. The forecasted productivity data is not having any impact on the pair before the news announcement, which means the data is relatively weak against British Pound. After the announcement is made, we see the market moves up as the data was no better than the forecasted data. The ‘news candle’ leaves a wick on the top since the data was mildly positive for the US dollar but has no significance. Therefore, the volatility increases on the upside with a minor impact, and the market continues its uptrend. In this pair, we don’t really see a point of ‘entry’ as we don’t have technical factors supporting the trade and hence should be avoided.

USD/CHF | Before the announcement | 5th March 2020

USD/CHF | After the announcement | 5th March 2020

The above chart of USD/CHF is similar to that of GBP/USD pair, but since the US dollar is on the left-hand side, the chart is in a downtrend. Here too, the US dollar is showing a great amount of weakness before the news announcement, which means even a positive Productivity data is less likely to result in a reversal of the trend. After the news announcement, we see that the price suddenly shoots up, and the price closes as a bullish candle. As the impact of Productivity data is less, the sudden rise in volatility shouldn’t last, and hence this could provide an opportunity for joining the trend. When volatility increases on the downside, we can take ‘short’ positions in the market with a stop loss above the ‘news candle.’ This is how we need to analyze such news outcomes.

That’s about Productivity and its impact on the Forex market. If you have any doubts, please let us know in the comments below. Cheers.

Categories
Forex Elliott Wave

Analyzing the Triangle Pattern – Intermediate Level Part 3

In the previous article, we expanded the ideas of the triangle pattern; in particular, we talked about the contracting triangle and its variations. In this last part dedicated to the triangle pattern, we will review the non-limiting triangle.

Non-Limiting Triangle

Non-limiting triangles do not differ much from limiting triangles. Both types of triangles must meet the minimum construction requirements. However, they will have the following characteristics:

– Channeling. In the case of the non-limiting triangle, the trend lines are not convergent but divergent.

1. Congestion occurs just at or near the apex of the convergence lines.

The wave analyst should note that the term “just or near the apex” refers to the end of wave E being close to the intersection of both trend lines and the extent of wave E to be measured in terms of the time spent in the triangle formation.

b. The triangle pattern is considered Non-Limiting if the measurement of time elapsed from its beginning until the end of wave E, and the apex occurs after 40% of the interval has passed.

c. There must be a post-thrust correction that must return to the apex area.

If the triangle met any of these three conditions, then the triangle will be said to be of the non-limiting type.

Post-Triangular Thrust

The distance of the thrust outside the limits of the non-limiting triangle does not have a specific restriction. However, it can reach the length equivalent to the longest segment of the triangle. 

Likewise, once reached this extension, there is a possibility that the price will continue in the original direction of the thrust.

Expanding Triangles

Expanding triangles are very frequent in complex corrections. It is characterized because as it progresses in its formation, each segment, or the majority, is larger than the previous one.

The rules that characterize the expanding triangles are described below:

  1. Wave A or Wave B will always be the smallest wave in the triangle.
  2. In most cases, the E wave will be the longest.
  3. Expanding triangles cannot be part of wave B of a zigzag pattern. Nor can they be part of an intermediate wave, that is, waves B, C, or D of a triangle of higher degree.
  4. In most cases, the E wave will be the longest and most complex segment of the triangle. This wave can be formed by a zigzag or by a complex correction.
  5. Generally, wave E will pierce the trend line joining the ends of waves A and C.
  6. Line B-D should act similarly to contracting triangles.
  7. The extension of the thrust of the expanding triangle must be less than the longest wavelength of the triangle.
  8. When comparing the length from wave E to wave A, it must be verified that each previous wave must be greater than or equal to 50% of the next wave.

The following figure shows the three most common types of expanding triangles, of which the irregular is the most likely to appear in the real market.


In expanding triangles also exists limiting and non-limiting triangles. However, in this type of formations, there is no post-triangular variation between one and the other. The difference lies in the wave position that the triangle holds, which can be “standard” or be part of a complex correction.

Limiting Expanding Triangle

The term “limiting” refers to whether the triangle is a fourth wave or a B wave. Its main characteristics are described below.

1. An expansive limiting triangle usually appears in wave B, particularly in irregular failures or in flat wave formations with failure in wave C.

2. The thrust outside the triangle is a minimum of approximately 61.8% of the structure, measured from its highest to the lowest level.

Horizontal Expanding Triangle

This variation rarely appears in the real market. However, this does not mean that there is no possibility of it showing up in real markets.

The main characteristics of a horizontal triangle are:

1. Wave A must be the smallest of the formation.

2. Waves B, C, D, and E y must each exceed the final point of the previous wave.

3. There is a possibility that wave E will exceed the guideline of waves A-C.

Irregular Expanding Triangle

This variation is more common, and its characteristics are as follows:

1. Wave B is smaller than Wave A, while the rest of the waves maintain their increasing characteristics.

2. The longer the duration of the pattern, the higher the chance that the guideline will tilt up or down.

Continuous Expanding Triangle

This expanding triangle has a bias due, on the one hand, because wave B is longer than wave A, and on the other hand, because wave C is the shortest. The E wave, meanwhile, can be more volatile or “violent” than the rest of the waves.

Non-Limiting Expanding Triangle

These types of triangles tend to appear in complex corrective formations, for example, in the first or last stage of a complex sequence. In this sense, in a complex corrective structure, the thrust will generate a wave X.

Finally, concerning the apex, it is located before wave A and must be produced before it reaches 20% of the construction time of wave A.

Conclusions

With this article, we have ended the standard corrective patterns defined by the Elliott wave theory. As we have seen in previous examples, expansive triangles also usually appear on waves 4 and B. However, this does not mean that they cannot appear on wave 2.

In the next educational article, we will see the process of validating impulsive structures.

Suggested Readings

  • Neely, G.; Mastering Elliott Wave: Presenting the Neely Method; Windsor Books; 2nd Edition (1990).


Categories
Forex Elliott Wave

Analyzing the Triangle Pattern – Intermediate Level Part 2

In our previous article, we saw that the triangle pattern is the most common of the three standard formations defined by R.N. Elliott. In this educational post, we will review the different types of variations of this corrective structure.

Contractive Triangle

Within the group of triangles, this formation is the most common of all. The minimum requirements of this structure are:

1. Once the contractive triangle is completed, the price must make a “thrust” that should be greater than or equal to 75% of the largest internal segment. On the other hand, this movement should not exceed 125% of the most extended triangle segment.

The following figure shows two cases. In the first, we see that wave A is the most extended segment of the contracting triangle after wave E is completed. The thrust can reach between 75% and 125% of wave A.

In the second case, we observe that wave B is the most extensive of the contracting triangle. Analogously to the previous case, we distinguish that the thrust made by the price should not be less than 75% nor greater than 125 of wave B.

2. In this type of triangle, the thrust must further exceed the highest (or lowest) end it reached during structure formation.

In other words, when the contracting triangle is about to be completed, two parallel lines should be drawn over the most extended segment, depending on which side the thrust is on, the price should touch the top or bottom line.

3. The E wave must be the smallest of all the segments of the triangle in terms of price.

As we observe in the following figure, the internal segment corresponding to wave E must be the smallest of all in terms of price, but not the time it takes for this movement to complete.

Limiting triangle

R.N. Elliott defined the limiting triangle as a formation that occurs in the waves fourth and B. Its name is because its completion must occur under specific conditions,

The completion of the limiting triangle in wave E must happen in the range of 20% to 40% before the apex point of the triangle.

Horizontal Limiting Triangle

1. The trendlines of the triangle must move in opposite directions.

In other words, when drawing the ends of the triangle corresponding to the end of waves A-C and B-D, the trendlines must correspond to a contracting triangle respecting the basic structure defined by Elliott.

2. The apex of the triangle must be within a range whose amplitude is 61.8% of the most extended segment of the triangle and whose center is the midpoint of that segment.

In the case of the previous figure, the most extended wave is wave B. However, this is analogous for the situation in which wave A or wave C is the longest in the triangle.

3. Wave D must be smaller than the internal leg corresponding to wave C. Likewise, the segment corresponding to wave E must be shorter than wave D.


Irregular Limiting Triangle

This type of triangle must perform a higher thrust and with greater speed than in the case of the horizontal triangle. The distinctive element of this formation is wave B, which must be longer than wave A. In general, its main characteristics are as follows.

  1. Wave B should not be higher than 261.8% of Wave A. Under normal conditions, it should be less than 161.8% of Wave A.
  2. Waves C, D, and E must be smaller than the previous wave.
  3. The trend lines of the triangle must have opposite directions.

Running Limiting Triangle

This type of wave can be confused with the Double Three corrective structure. Its main characteristics are:

  1. Wave B is longer than Wave A. It is also the largest segment of the triangle.
  2. Wave C is smaller than Wave B.
  3. Wave D is shorter than Wave C.
  4. Wave E is shorter than Wave D and is the smallest of the triangle.
  5. The thrust after the completion of wave E can become more extensive than wave B and even reach 261.8% of wave B.

Conclusions

In this educational article, we have examined the different variations of triangles and expanded their contracting variants. We must emphasize that its importance lies in the fact that this type of formations, in particular, the contracting triangle, is the most common of all triangular patterns. The knowledge of how triangles behave can provide the wave analyst with an advantage that would allow him to more accurately predict what the next market move would likely be.

In the next article, we will see the last part of the corrective formations. In particular, we will review the non-limiting triangles and their main characteristics.

Suggested Readings

– Neely, G.; Mastering Elliott Wave: Presenting the Neely Method; Windsor Books; 2nd Edition (1990).

Categories
Forex Elliott Wave

Analyzing the Triangle Pattern – Intermediate Level – Part 1

The triangle is a corrective pattern that has five internal segments. In this educational article, we will review how to analyze the triangle formation.

Triangles and their Characteristics

Within the set of corrective structures defined by R.N. Elliott, triangle formations are more complex to analyze compared to flat and zigzag patterns. This complexity occurs because there is no specific time span that marks the end of this structure.

Despite the complexity of the triangles, it is the most common Elliott pattern to find in the real market. The knowledge of this formation will help wave analysts to understand the price position within the market.

Construction Rules

The construction rules defined for the triangle pattern are detailed as follow:

– Triangles have five internal waves, regardless of the complexity of the inner segments.
– A complete three-wave corrective structure builds each part that makes up the triangle.
– The triangle can have a bullish or bearish inclination. However, its internal structure should not change.
– The triangle has six reference points of the same degree, the origin of wave A, and the end of waves A, B, C, D, and E. From these six extremes, the wave analyst should only channel four points through the contraction lines. The points to consider are the end of wave A with the end of wave C and the end of wave B with the end of wave D.
– The base-line of the triangle is the line that joins the end of waves B and D, and its function is similar to the guideline that joins waves 2 and 4 in an impulsive wave.

The following figure represents the construction model of the triangle pattern.

As can be noted, the triangle pattern tends to appear in a fourth wave or a wave B, in some exceptional cases, this pattern could appear in a second wave.

GBPUSD Consolidates in a Triangle Sequence

The next figure illustrates the GBPUSD pair in its 4-hour timeframe. In the chart, we observe that the Cable rallied since September 03rd when the price found its bottom at level 1.19589.

Once the GBPUSD pair moved in three waves identified in green, the fourth wave consolidated sideways, developing an expanding triangle.

The triangle pattern reveals the alternation principle in terms of time and price.

The GBPUSD pair alternated in terms of time being the triangle pattern more extended in comparison with the second wave. In the same way, the retracement developed by the second wave is sharp compared with the narrow correction realized by the fourth wave.

JP Morgan Consolidated in a Triangle Pattern

The chart below shows JP Morgan Chase & Co (JPM) in its log-scale 2-day timeframe. The ticker JPM developed a bullish impulsive sequence subdivided in five waves from early 2016 when the price found buyers at $52.50 per share.

In the same way, the third wave that was formed corresponds to an extended wave, which makes us conclude that the first and fifth waves will not be extended, and they will be similar in terms of price, time, or both. In this case, both waves are identical in terms of time.

On the other hand, we observe that JPM consolidated developing an expanding triangle pattern with a slight bearish bias. Besides this structural bias, the internal sequence is respected by the price action.

Also, we distinguish the wide extension of the triangular sequence, which moved from late February 2018 until mid-August 2019, when JPM ended its internal wave E labeled in green.

Once JPM completed its fifth internal segment, the price action continued its previous bullish trend and soared to record highs at $141.10 per share.

Conclusions

From the cases analyzed, we can verify the Genn Neely’s affirmation that suggests that “the triangle pattern is a common formation that appears in the market.”

Also, we verified how the alternation principle works in the real market, while a corrective wave is simple, the other will be complex.

Finally, according to the examples reviewed, the triangle pattern could appear independently of the market analyzed,  as on currencies, stocks, indices, etc.

In the next article, we will review the different variations of the triangle pattern.

Suggested Reading

  • Neely, G.; Mastering Elliott Wave: Presenting the Neely Method; Windsor Books; 2nd Edition (1990).