Description
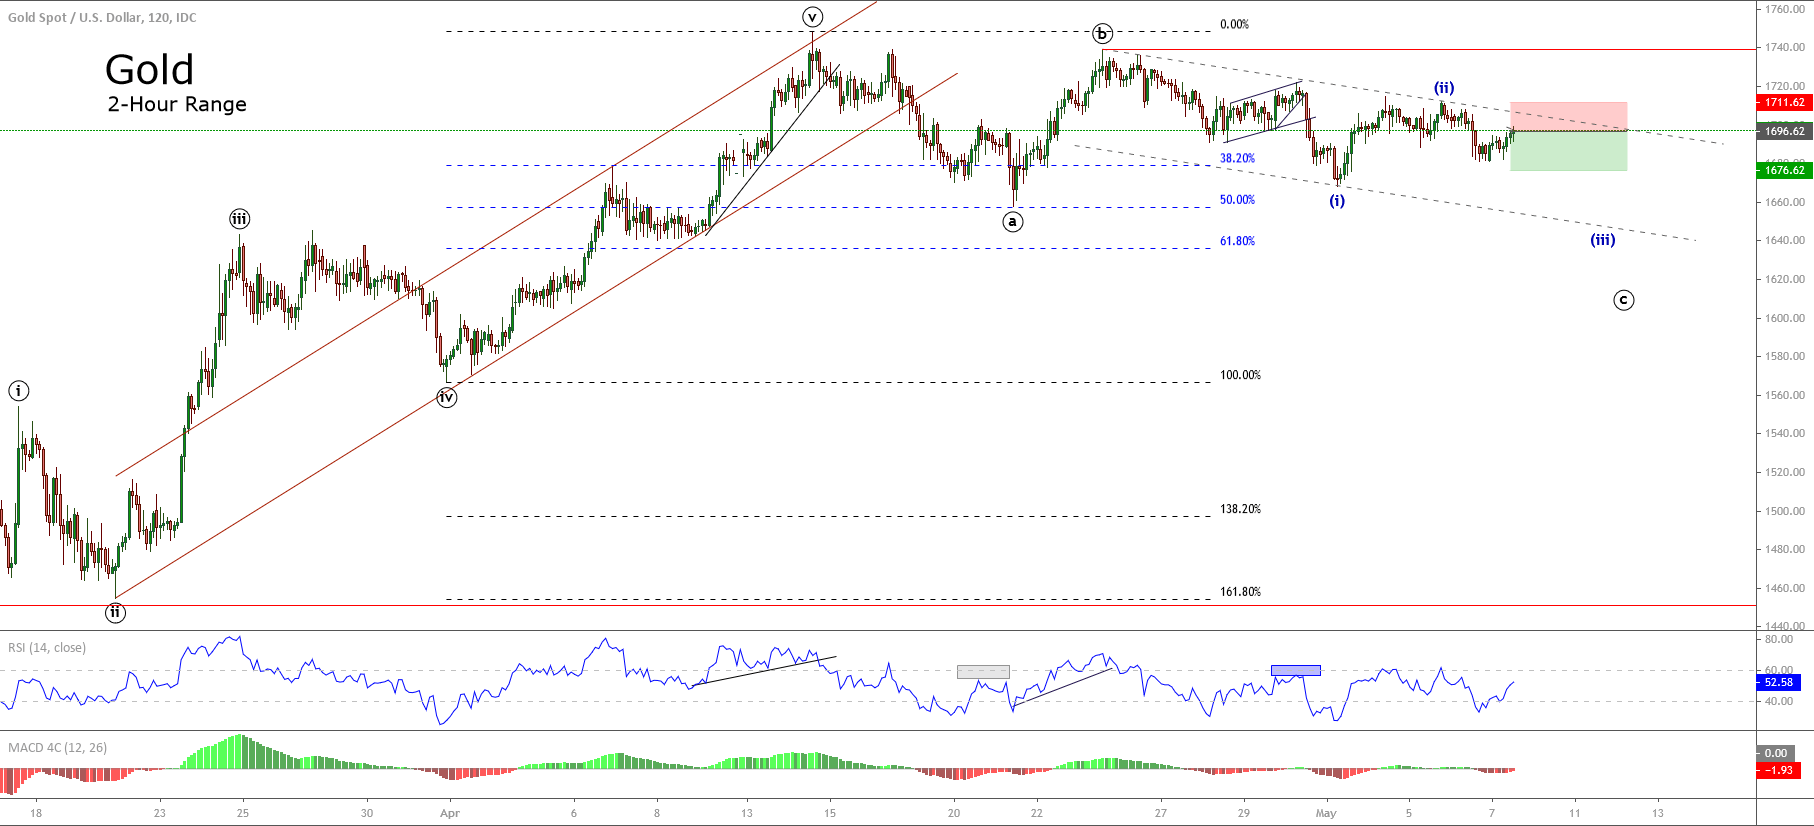
Gold, in its 2-hour chart, illustrates a decreasing advance that could correspond to a corrective structure in progress, which could result in further declines.
The Elliott wave sequence suggests the possibility of an incomplete wave ((c)) that could be developing its internal wave (ii) of the Minuette degree identified in blue.
On the other hand, the yellow metal retraced until 50% of the last bullish sequence. This retrace makes us foresee that the upward cycle could be in an exhaustion stage, and Gold couldn’t realize a new higher high that surpass the April high at $1,747.74 per ounce.
Our bearish scenario foresees a decline from the current area at $1,696 per ounce, with a potential bearish target located at level $1,676.
The scenario forecasted will be invalid if the price surpasses and closes above $1,711 per ounce.
Chart
Trading Plan Summary
- Entry Level: $1,696.62
- Protective Stop: $1,711.62
- Profit Target: $1,676.62
- Risk/Reward Ratio: 1.33
- Position Size: 0.01 lot per $1,000 in trading account.