Educational Themes of Intermediate and Advanced Complexity. In this section, we include all that is needed to master technical analysis such as complete coverage of price action themes: Support-resistance, volume, volatility, breakouts, reversals, trend and range trading, candlestick and chart patterns and formations, Elliott wave and Fibonacci retracements and extensions, and harmonic patterns. It includes also a section covering all indicators from simple moving averages to the complexity of Ehlels Filters.
Another sub-section is dedicated to trading systems desing.
Becoming a full-time trader is something that a lot of people aim for, it is the main goal for a lot of people, to get rid of that 9-5 job, to get out from under that boss from hell, but a lot of people who eat it, are not fully prepared for what is actually involved in it. Going full time is a huge step and it can put you under a lot of pressure, the pressure that you didn’t have as a part-time trader due to having other sources of income or not needing to rely on it.
Becoming a full-time trader is something that a lot of people aim for, it is the main goal for a lot of people, to get rid of that 9-5 job, to get out from under that boss from hell, but a lot of people who eat it, are not fully prepared for what is actually involved in it. Going full time is a huge step and it can put you under a lot of pressure, the pressure that you didn’t have as a part-time trader due to having other sources of income or not needing to rely on it.
Becoming a full-time trader is something that a lot of people aim for, it is the main goal for a lot of people, to get rid of that 9-5 job, to get out from under that boss from hell, but a lot of people who eat it, are not fully prepared for what is actually involved in it. Going full time is a huge step and it can put you under a lot of pressure, the pressure that you didn’t have as a part-time trader due to having other sources of income or not needing to rely on it.
We are going to be looking at some of the things that you need to think about in terms of your mentality if you are planning to become a full-time trader, you may already be doing some of them, or maybe you aren’t doing any of it yet. What we hope is that this can be used to give you a better understanding of what is yet to come for you on your journey and also some of the things that you will need to think about before you decide to ditch the job and go full time.
Are you actually ready?
This takes a few different things into consideration, firstly, do you have enough money to survive? Remember, you will be relying on the income from your trading for everything, what would happen should you not make enough? Do you have enough capital and reserve funds to survive? Think about your bills, the rent, mortgage, food, car insurance, Netflix, and everything else. If you were to not make any money one month, would you still be able to afford all of this? The recommended amount to have saved up is at least 3 months living costs, if you have less than this then it could be looked at as not being ready to pack in the day job, you need to have enough available should things go south and you don’t make any money.
It is also important that you have enough capital to actually trade at the level that you are required to. If you are required to make $3,000 per month, then if you have an account balance of $1,000 it is just not feasible or realistic. You need to ensure that you can SAFELY make enough each month and to be able to survive any drawdown that comes with trading.
You need to be mentally prepared to have to stop doing certain activities that take away your finances, it is fine for months where you have made enough, but on those where the income is a little lower, you need to be prepared to make sacrifices and knowing this beforehand is vital so things do not come to you as a shock, there will be times where you need to sacrifice things, it will happen, so be prepared.
The other thing to think about is your recent results, or at least the past 6 months of results. It is all well and good having the last month be a good one, but one profitable month does not mean that you will be able to be consistent. We need to look at the past 6 months or so to ensure that we are profitable. If you have not been, if your average for those 6 months is below what you need, then you are not yet ready to go full time and you are not quite ready to support yourself fully just from trading.
Setting Realistic Goals
You need to be able to set yourself some realistic goals, as a full-time trader you are relying on this money and the income that trading creates. When you are trading as a hobby, it is ok to say that you want to make a million dollars, but that is not realistic when trading full time. It’s great to imagine buying that dream car, but let’s not forget that you also have your bills to pay, so your first goal simply needs to be to make enough to sustain your own lifestyle, not a new one, the lifestyle that you are currently living right now.
Your goals also need to move back a little bit, you won’t be going for such fast results, you now need to be more careful with your trading, so that new car may need to take 3 years instead of 1 to achieve, this helps you to keep things a little safer and will keep you trading for a long period of time. Set your goals realistically based on what you have been trading before, not what you want to be trading in the future.
Are you willing to change your lifestyle?
Are you one of the people who loves going out in the afternoons, or have a busy family life, well unfortunately things will need to change. While it sounds great having no boss and being able to work when you want, that does not mean that you won’t be working a lot, and we mean a lot. Some full-time traders work far more hours than they would with a normal full-time job. You need to be able to set yourself hours. Unfortunately, these may not always be to your liking and may need to be set based on the strategy that you are using.
This also means getting rid of potential distractions, if you love your Playstation, then are you able to trade for hours at a time without being distracted and wanting to play it? If not then it will be hard for you to stay dedicated and more strict scenarios may need to be put in place like getting rid of it completely. It is not easy to stay concentrated on trading, both subtle and big changes may need to be made to your lifestyle.
Are you able to treat trading like a business?
Often when people start working from home they start doing it in their pajamas, they start to get slack with their wake up times and so start working later, and later, this won’t work with Forex trading. Trading is such a disciplined task and job to do that you need to be able to treat it like a business. You need to be getting up in time and starting work at the same time, you need to show it the respect and education that it needs and you need to be able to act as if you are at a job.
So those are some of the things that you need to be able to consider should you decide to go full time, it is an easy choice to make, most would jump at the opportunity, but it is important that you understand the consequences and requirements of trading full time. If you are prepared, and your strategy is ready, then good luck, it is a difficult journey ahead of you but it is certainly a rewarding one too.
When you start out trading, often the first bit of advice that is given to you is to use a demo account, keep using a demo account until you perfect your strategy. While this isn’t necessarily bad advice, it is, however, advice that can lead you into a sense of false confidence. Yes, we agree […]
When you start out trading, often the first bit of advice that is given to you is to use a demo account, keep using a demo account until you perfect your strategy. While this isn’t necessarily bad advice, it is, however, advice that can lead you into a sense of false confidence. Yes, we agree […]
When you start out trading, often the first bit of advice that is given to you is to use a demo account, keep using a demo account until you perfect your strategy. While this isn’t necessarily bad advice, it is, however, advice that can lead you into a sense of false confidence. Yes, we agree that using a demo account is great, to begin with, however, there are a few things that you should keep in mind for when you move over to a live account.
Reduction in Emotion
When you are trading on a demo account, there is nothing to lose, which means all of the stress that comes with a loss is not there, make a loss and you shrug it off, blow the account, just open up a new one and all that money is back. This isn’t how it will work on a real account, each and every loss is you losing something of yours, this can be devastating to some, we have seen people lost thousands, others have lost $10 yet it can have the same psychological effect on someone and can be hard to take.
These negatives can cause a snowball effect and can cause some people to chase losses which can lead to more losses and even account closure and debts. It can also work for winning, your first winning trade on a demo account feels ok, but nothing special when you compare it to your first winning trade on a live account, it is a fantastic feeling, just don’t let it get into your head, stick to the strategy and you will have many more wins, don’t start trading just because you are on a high of the previous win.
The Need for Greed
If you were to ask someone if they are a greedy person, they will 90% of the time say no, watching someone trade is a good way to see the truth. We touched briefly on it in the previous post, but when you make a winning trade, that is actual money coming into your account, real money that you can withdraw and spend, it feels great, but I want more. Maybe I could get more by putting in trade here or there, obviously, these are not in line with my strategy but they could make me more money. My trade is going the wrong way, let me just move my stop loss further down so it doesn’t close because it will definitely turn. My trade is going the right way, let me move my take profit level higher so I can make a bit extra.
These are all things that we have done on a live account, but never ever think of doing it on a demo account, simply because we can make some money. These are not good habits to have, you set these initial trades or limits for a reason, stick with them, do not change them just because you think you could squeeze a little extra out of the markets, the markets will not be afraid to take it all back from you.
Risk Elimination
This works in a similar way to the emotions, there is no risk when trading on a demo account if you lose, you aren’t losing anything, but in the same way, if you win, you aren’t actually winning anything (apart from the knowledge of course). On a live account, seeing your balance going up or down can have a huge psychological impact, when it goes up, you are full of confidence and on a high, but when it goes down, it can really impact on your confidence and desire to continue learning.
So how do you avoid these sorts of things? It isn’t easy, any professional trader will tell you that, the hardest part of trading is taking out the emotion and sticking to your strategy, especially when things are starting to go wrong. Ensure that you are sticking to your plan, you created a strategy on the demo account, stick to the exact same on a live account, think of it as a process and try not to look at the profits, you could even hide them on your trading platform.
Ensure that you are using a trading journal, both on the demo account and on the live account, this way you will continue to use what is working and will be able to see if you are changing anything fro the demo account, allowing you to stop and move back towards your strategy.
It is a big change going from demo to live trading, but ensuring that you are fully prepared and taking your time not to rush into things are the first steps in becoming a successful live trader.
Private Sector has a significant and crucial role to play in the economic growth of capitalist economies. The development of private sectors can single-handedly drive the GDP and development of the country forward. Credits and loan availability to the private sector can significantly impact the pace of expansion of the country. Hence, an analysis of the loans disbursed to the private sector can offer us much insight into the country’s growth.
What are Loans to Private Sector?
Loan
It is a credit incurred by an individual or entity. The creditor is generally a financial institution or the Government. The lenders give borrowers money on certain conditions that can include terms relating to the repayment date, interest charges, or other transactional fees. A loan can be secured or unsecured. In secured loans, the loan is given out against collateral like property, mortgages, or securities.
Private Sector
It refers to the part of the economy, which is not under state or central government’s control. The private sector industries are mostly privately owned and for-profit businesses. Private sectors can produce productive jobs, higher income, productivity growth. When private sectors are complemented with the Government sector’s support, the growth rate is multiplied many folds.
Loans to Private Sector
It refers to credits provided to the private sector by financial corporations. Credit can be as loans, nonequity securities purchases, and trade credits, etc. Financial corporations here can be monetary authorities (ex: Central Banks), finance and leasing companies, lenders, pension funds, insurance companies, and foreign exchange companies.
How can Loans to Private Sector numbers be used for analysis?
Most modern economies are capitalist economies, i.e., most of the GDP is derived from the private sector that operates on profitability. Economic indicators like employment, wage growth, the standard of living, GDP, etc. are all heavily dependent on the private sector. In the United States, the private sector contributes more than 85% of the total GDP. Hence, private sector growth is almost equivalent to the country’s growth.
In capitalist economies, the private sectors are competitive, provide high employment, better income, and lie at the forefront of technological innovation in general. Due to competition amongst fellow business organizations, the benefits of working in the private sector far exceed that of the public sector.
Credit plays a vital role in the economic growth of capitalist economies. Credit serves as a crucial channel for money transmission from central authorities to the private sector. Loans can fund production, consumption, and capital formation for businesses that, in turn, generate revenue for the country.
Loans can help private businesses to expand beyond just the cash in hand and speed up their growth rate. The ease with which credit facilities are made available to the private sector will largely control the pace of economic growth. The Government and the Central Bank authorities’ support in providing credit to private industries have historically proven to be very beneficial for the state and country’s urbanization and rapid growth.
On the flip side, a decrease or lack of credit availability can significantly impact small and medium businesses, resulting in halting expansion plans, laying off employees, or in the worst close filing bankruptcy.
The public sectors can only take care of the essential services and set rules and regulations in different areas. The required development has to come from the private sector. But it is the private sector that can boost economic growth through investment, employment, competition, innovation, and better wages.
In the underdeveloped economies, the Government’s support in credit and business support to the private sector has mostly helped uplift people from poverty. In the developing economies, private sector investments have dramatically improved the standard of living for many countries like China, Japan, and India. Private sectors of developed countries already enjoy the support from the public and banking sector, which explains their high GDP and consistent growth rate.
Impact on Currency
An increase in loans to the private sector is a positive sign for the economy. It indicates more businesses are now creditworthy and are working on expansionary plans. A healthy increase in the number of loans to the private sector is good for the future economy. An increase in loans to the private sector also indicates the market is more liquid, and the currency will lose value for the same set of goods and services. Conversely, a decrease in loans to the private sector means the market is less liquid, and money is costly. Currency appreciates, but economic growth is difficult to achieve.
Loans to private sector statistics are useful for the Governments and international investors and companies to check the health of the private sectors in a particular economy. International companies open businesses where ease of doing business is high. For them, it is a useful indicator. Private Sector Loan is not a significant economic indicator for the FOREX markets. Hence it is a low impact indicator.
Economic Reports
The World Bank collects domestic credit data to the Private Sector as a GDP percentage on their official website. The dataset is annual and covers most countries. The datasets are updated once they receive the latest data from the respective countries.
Sources of Loans to Private Sector
The World Bank’s Domestic Credit to private sector reports is available here.
We can also find a consolidated list of Loans to the private sector on the Trading Economics website.
How Loans to Private SectorAffects The Price Charts?
Loans to the private sector is not a statistic most forex traders keep an eye when making their trades. The lack of interest is because it is considered a their-tier leading indicator. It is, however, essential to know how the release of this fundamental economic indicator affects the forex price charts.
The Eurozone private sector loans data is released monthly by the European Central Bank about 28 days after the month ends. It measures the change in the total value of new loans issued to consumers and businesses in the private sector. The most recent release was on July 27, 2020, 8.00 AM GMT can be accessed here. A more in-depth review of the economic news release can be accessed at the ECB website.
Below is a screenshot of the Forex Factory official website. On the right side, we can see a legend that indicates the level of impact the Fundamental Indicator has on the EUR.
As can be seen, low impact is expected on the EUR.
The screengrab below is of the most recent change in private loans in the EU. In June 2020, private loans grew by 3% as compared to the same period in 2019. This change represented a flat growth from the previous release. Based on our fundamental analysis, this should be positive for the EUR.
Now, let’s see how this positive news release made an impact on the Forex price charts.
EUR/USD: Before Eurozone Private Sector Loans release on July
27, 2020, Just Before 8.00 AM GMT
From the above chart, the EUR/USD pair is trading on a neutral trend before the data release. The candles are forming around the flattening 20-period Moving Average. This trend is an indication of relative market inactivity.
EUR/USD: After Eurozone Private Sector Loans release on July
27, 2020, 8.00 AM GMT
After the news release, the pair forms a 15-minute bullish candle as EUR becomes stronger as expected. However, the news release was not strong enough to cause a shift in the pair’s trend since the pair continued to trade in the previously observed neutral trend.
EUR/JPY: Before Eurozone Private Sector Loans release on July
27, 2020, Just Before 8.00 AM GMT
Before the news release, EUR/JPY traded in a similar neutral trend as observed with the EUR/USD with the candles forming around a flattening 20-period Moving Average.
EUR/JPY: After Eurozone Private Sector Loans release on July
27, 2020, 8.00 AM GMT
As observed with the EUR/USD pair, EUR/JPY formed a 15-minute bullish candle after the news release as expected. The subsequent trend does now significantly shift.
EUR/CAD: Before Eurozone Private Sector Loans release on July
27, 2020, Just Before 8.00 AM GMT
EUR/CAD: After Eurozone Private Sector Loans release on July
27, 2020, 8.00 AM GMT
The EUR/CAD pair shows a similar neutral trading pattern as the EUR/USD and EUR/JPY pair before the news release. After the news release, the pair forms a 15-minute bullish candle but later continued trading in the earlier observed neutral trend as the 20-period Moving Average flattens.
Bottom Line
Loans to the private sector play a vital role in stimulating a country’s economic growth. From the above analyses, the release of the loan growth data has an instant short-term effect on the EUR. The data is, however, not significant enough to cause any relevant shift in the prevailing market trend.
If you have been looking over the internet, at the various social meiosis sites, forums, and trading communities, you would have seen some of the amazing success stories out there. Having seen them, at one point or another, you probably thought to yourself that this is something that you are able to do too. There […]
If you have been looking over the internet, at the various social meiosis sites, forums, and trading communities, you would have seen some of the amazing success stories out there. Having seen them, at one point or another, you probably thought to yourself that this is something that you are able to do too. There […]
If you have been looking over the internet, at the various social meiosis sites, forums, and trading communities, you would have seen some of the amazing success stories out there. Having seen them, at one point or another, you probably thought to yourself that this is something that you are able to do too. There is nothing stopping you from achieving this, apart from yourself.
One of the traits needed to become good at anything in life, including trading, sports, or even going up the career ladder, that trait is dedication. Dedication is also vital for becoming a successful trader, most people recognise this when they are starting out. However, a lot of people don’t necessarily understand exactly how much dedication is needed or how much work will need to be put in in order to actually achieve these goals.
Those people who have come into trading expecting or wanting some quick results are often the ones that fall victim to the amount of work that is needed and so then eventually gives up. There are people out there from all walks of life who will, unfortunately, decide to jump into trading with tier life savings, hoping to make it big, especially those that are used to gambling or taking larger risks in life. There is an expectation that they will be able to make it, with little other understanding of the ins and outs or the work that is actually involved in it.
Getting into trading is becoming more and more accessible, due to this the expectation from those getting into it is that it must be quite easy to achieve some targets and goals. All you need to do now is to sign up to a broker, send in your ID, deposit some money and you are ready to trade. No lessons, no knowledge needed (even though there is a lot of education and resources available out on the internet), many use it to get a headstart, however, there are those that do not and the ease of getting into trading just makes it an enticing thing to get into with very little fuss involved.
While there have been a number of different traders who have gotten into it and become successful over a very short period of time, this is certainly not the norm. Those success stories and few and far between, however, they are the ones that get the most publicity, and so this gives people the impression that it is an easy and common thing to occur, something that is far from the truth. Not everyone gets the brown success story like this, in fact, the majority of them will not, the majority will lose out. One of the major things that you can do to help improve your chances are to put in the work to learn and to keep some dedication towards your goals and learning.
If we look at the importance of dedication in some other professions, there are very few writers who manage to write a bestseller on their first attempt. In fact the majority of them, it will take many books and failed attempts before one is even looked at by a publisher. Some people also need to put themselves in the right environment. If we look at K.K. Rowling, the author of the incredibly popular Harry Potter books. When she started her writing career, she was a single mother, near bankruptcy, but she still dedicated herself to her writing, going to school, and writing novels. Through this determination to work and to write, she eventually came up with the Harry Potter books and now she has more money than she knows what to do with. If she didn’t have the determination and the dedication to writing when she had been given her first few rejection letters, she most likely would have given up and so she would not be in the situation that she is now.
What about Michae Jordan? You may well know him as one of the best basketball players to have played the game, but did you know what back in high school, he was actually dropped from the team? For many this would have been more than enough reason to give up, but did he? No, he stuck with it, worked hard, and then became one of the best.
Those are just some of the real-world examples of how powerful dedication can be, if you really want to achieve something and you are willing to put the work in to achieve it then there is no reason why you cannot achieve that goal. This works exactly the same for trading, if you really want to do it, you understand that it is a lot of work but you are still willing to put in the work then there is no reason why you won’t be able to do it and to do it well.
Forex is a long process, a really long process, many of the successful traders that you see today (not the ones that got lucky with a single big trade) have taken a long time to get to where they are today. Years at a minimum, in fact, a lot of them would have still been making a loss after their first year. That time is used to get used to how things work, to find yourself and what sort of style of trading best suits you. This is not the time to be thinking of that new car or that you will be quitting your job to do this full time. That will come, but a lot later down the road.
What we need to take from this is the fact that once we have started with something we need to stick with it. This counts for trading as a whole, but it also counts for the smaller parts within trading. If you are trying out a new strategy, you cannot simply try it for a week and then decide that it does not work. Strategies take a long time to create and also a long time to test, at least six months should be put into a strategy before it can be declared as not working (unless it completely fails with a lot of losses). If you have started something, put the work into it, stick with it, and show some dedication to making it work.
Dedication is something that comes naturally to some, they have the ability to start something and then stick with it with little effort. Others may find it harder, those with short attention spans or those that easily get bored can find things harder to stick to in the long run, however if you manage to, you will see the huge differences to your trading ability and your results. So if you are just coming into trading, be prepared for the long haul, not some quick and simple profits, which will most likely never come without having the dedication to push on.
In today’s lesson, we are going to demonstrate an example of a chart that made a long bearish move obeying a bearish trendline. The price after forming a bearish trendline does not offer entry to the sellers. It makes a breakout at the first trendline and then produces another bearish trendline ending up offering short entries. Let us now have a look at the chart and find out how it happens.
In today’s lesson, we are going to demonstrate an example of a chart that made a long bearish move obeying a bearish trendline. The price after forming a bearish trendline does not offer entry to the sellers. It makes a breakout at the first trendline and then produces another bearish trendline ending up offering short entries. Let us now have a look at the chart and find out how it happens.
In today’s lesson, we are going to demonstrate an example of a chart that made a long bearish move obeying a bearish trendline. The price after forming a bearish trendline does not offer entry to the sellers. It makes a breakout at the first trendline and then produces another bearish trendline ending up offering short entries. Let us now have a look at the chart and find out how it happens.
The chart shows that it makes two swing lows trending from two swing highs. By joining those points, we can draw a trendline shown in the above chart. The sellers may wait for the price to go back at the trendline’s resistance and produce a bearish reversal candle to go short in the pair. However, the price action has been choppy around the trendline’s resistance. The last candle comes out as a bullish engulfing candle. It does not look good for the sellers.
The price makes a breakout at the trendline’s resistance. It heads towards the North and then makes a strong bearish move. Such price action may puzzle traders. Do you notice something interesting here? Have a look at the next chart.
The sellers may draw another bearish trendline by joining two swing lows. As long as the price makes new lower lows, we can draw a bearish trend line by joining two higher highs. We know what sellers are to do here. Yes, they are to wait for the price to go back to the trendline’s resistance and produce a bearish reversal candle to go short in the pair.
The chart produces a bearish inside bar. It is not a strong reversal candle. However, it is produced at a trendline’s resistance. The sellers may keep their eyes in the pair to go short according to their trading strategies. The price may find its next support at the last swing low. The chart shows that the price has enough space to travel towards the South.
The price heads towards the South at a moderate pace. It makes a long bearish wave, though, by making a breakout at the horizontal support. In the end, it comes out as an excellent trade for the sellers.
If we recap, the first drawn trendline is disobeyed by the price. It is breached, and the chart looks slightly bullish biased. It does not make any more bullish breakout but makes a long bearish move by making a breakout at the last swing low. It gives the sellers an opportunity to draw another bearish trendline, and that ends up offering an excellent entry.
When it comes to forex trading, it’s a good idea to take advice from seasoned professionals so that we can avoid learning hard lessons for ourselves. One of the biggest lessons that these traders can teach us revolves around risk-management, which has to do with how much we risk on any single trade. For beginners, […]
When it comes to forex trading, it’s a good idea to take advice from seasoned professionals so that we can avoid learning hard lessons for ourselves. One of the biggest lessons that these traders can teach us revolves around risk-management, which has to do with how much we risk on any single trade. For beginners, […]
When it comes to forex trading, it’s a good idea to take advice from seasoned professionals so that we can avoid learning hard lessons for ourselves. One of the biggest lessons that these traders can teach us revolves around risk-management, which has to do with how much we risk on any single trade. For beginners, it might seem like risking more can pay off in the long run, because one large win could increase your investment significantly. Unfortunately, this way of thinking has lead to the end of many trader’s careers before they really even got started. If you risk 15% on one trade, 20% on another, and so on, you’re likely to blow through your account quickly. Its true that you might get lucky with a couple of trades, but it only takes one loss to wipe out all those winnings.
The well-known trader Bill Lipschutz is a great example of how improper risk-management techniques can be devastating. This trader inherited $12,000 and turned it into $250,000 while in college. While this sounds like an inspiring story, the future millionaire blew his entire portfolio with one bad trade because he did not practice proper risk-management. Imagine building up that much only to lose it all on a single trade! Know that the story went on to have a positive ending despite this setback, as Bill did not give up and went on to open his own investment firm while being regarded as one of the top traders in the world.
Still, we can always learn a lesson from other’s mistakes so that we don’t have to experience the same heartache. The trader in our example would have only lost a small portion of his portfolio if he had not risked as much. One of the most effective ways to limit your losses is to limit the amount you risk on any one trade. So, how much should you risk? Is the answer 2%, 5%, or higher?
Actually, experts recommend risking no more than 1% on any single trade. This may not seem like much, but it makes sense. For example, if you risk 1% on a $100 trade and lose, then you’ve only lost $1. This obviously won’t be a career ending move and you’ll barely notice the difference. If you were to risk 20% on the same trade, you’d lose $20 out of your $100 investment, leaving you with only $80. You’re far more likely to notice the difference in our second example. Once you apply this same principal on a larger scale, the difference is even more significant. Consider Bill Lipschutz from our above example. If he had only risked 1% on his trade, then he would have lost $2,500 out of $250,000. This might still seem like a large loss, but the smaller risk makes a huge difference. A trader could still walk away from this bad trade with most of their portfolio intact.
If you take away anything from our article, you should know that managing risk is essential for successful trading results. It’s true that you might miss out on some opportunities, but you’ll have more profits in the end without suffering any career-ending blows. Just imagine how it would feel to lose everything in your account, whether its $100 or $100,000. We shouldn’t let the fear of losing cripple us, but we can take more control of what we can lose by only risking a small portion of our balance. Even if you don’t agree with out 1% recommendation, its always a good idea to keep your risk at a low percentage.
Forex trading is often referred to as an emotional rollercoaster ride due to the ups and downs of various emotions that humans can experience while trading. When we’re winning, we feel excited or on top of the world and may never want to stop. When we’re down, we might feel anxious, afraid, or depressed. Although […]
Forex trading is often referred to as an emotional rollercoaster ride due to the ups and downs of various emotions that humans can experience while trading. When we’re winning, we feel excited or on top of the world and may never want to stop. When we’re down, we might feel anxious, afraid, or depressed. Although […]
Forex trading is often referred to as an emotional rollercoaster ride due to the ups and downs of various emotions that humans can experience while trading. When we’re winning, we feel excited or on top of the world and may never want to stop. When we’re down, we might feel anxious, afraid, or depressed. Although our thoughts on these emotions might be black in white, for example, excitement is usually regarded as a good emotion, these feelings can all have negative influences on our trades. This is because someone that is feeling excited might keep going when they should stop, thus resulting in a loss. Today, we will talk about the way greed can influence our trades.
Greed could be considered a mixed bag when it comes to positive and negative outcomes. The truth is that greed mostly has a negative influence on our trading decisions, although it is associated with ‘riding the wave’ in trading. This is a common tactic that can be highly rewarding, as long as one knows when to get out. It only works in highly volatile trending markets and can be done using various indicators or with some background knowledge. Traders generally label this strategy as greedy, and this can be one of the only benefits of being greedy in the forex market. However, many greedy traders do not know when it’s the right time to get out of the trade because they are always looking to make the most profit possible.
Most professionals will tell you that there’s nothing good about getting greedy when you’re trading. Many of these seasoned traders have experienced the devastating effects of the emotion firsthand, so they want to pass along this lesson to save others from its devastating effects. Here are some of the negative ways that greed can interfere with your trading:
Greedy traders risk too much because they are often seeking a big return. This can backfire and result in a large loss instead. These traders might ignore their take profit levels and fail to exit trades when they previously planned to.
A greedy trader might miss out on one opportunity and want to make more the next time around, only to end up with a loss.
Greedy traders never feel as though they have accomplished enough. Rather than congratulating themselves for a job well done, they feel the need to keep going.
A greedy trader often focuses on making profits in general and might fail to think far enough ahead.
Some greedy traders set limits but deviate from those limits once greed takes over.
A greedy trader might trade too much out of a constant fear of what they’re missing. This is also known as ‘overtrading’. A good trader knows when to step back and take a break. Sometimes, the best move is doing nothing.
As you can see, greed can really interfere with our trades and cause one to keep going past their take profit level, only to lose in the end. A trader might get lucky a few times doing this, but this tactic is too close to gambling and is bound to cause more losses than gains in the end. Trading too much, or overtrading, is not a good move if you want to be successful. Many greedy traders might not realize that they are making these mistakes. In fact, they probably feel that they are making logical decisions. This is why it’s important to recognize this emotion and how it can hinder you before you begin.
If you’re already trading and feel that greed is affecting you, take a step back and look at the big picture so that you can focus on solving the problem. Sure, greed is associated with riding the wave, which can be highly profitable for some traders, but this emotion causes more harm than good. Always try to be vigilant about the ways that greed might be affecting your trades and invest some time into learning about trading psychology if you haven’t yet.
In today’s lesson, we are going to demonstrate an example of a chart that makes a strong bullish move upon producing a bullish engulfing candle at a key Fibonacci level. We know an engulfing candle creates good momentum. If it is created at a significant Fibonacci level, it often pushes the price towards the trend […]
In today’s lesson, we are going to demonstrate an example of a chart that makes a strong bullish move upon producing a bullish engulfing candle at a key Fibonacci level. We know an engulfing candle creates good momentum. If it is created at a significant Fibonacci level, it often pushes the price towards the trend […]
In today’s lesson, we are going to demonstrate an example of a chart that makes a strong bullish move upon producing a bullish engulfing candle at a key Fibonacci level. We know an engulfing candle creates good momentum. If it is created at a significant Fibonacci level, it often pushes the price towards the trend further than traders’ expectations. Let us see and find out what and how that happens.
It is an H1 chart. The chart shows that the price heads towards the South. It keeps making new lower lows. At the last bounce, the chart produces a Morning Star. It may make a bullish reversal now. Let us wait and see whether it makes a breakout at the last swing high or not.
The chart produces four consecutive bullish candles. The price breaches the last swing high. The buyers may wait for the price to consolidate around the breakout level and get a bullish reversal candle to go long in the pair.
It produces a bearish candle closing within the breakout level. The buyers may keep their eyes sharp to see how the next candle comes out. A bullish reversal candle followed by a breakout at the highest high is the signal to trigger a long entry. If the reversal candle comes out as a bullish engulfing candle closing above the resistance, the buyers may trigger a long entry right after the candle closes.
The candle comes out as a bullish engulfing candle closing well above the resistance. The buyers may trigger a long entry right after the candle closes. Since it is an H1 chart, Fibonacci levels come extremely handy to determine the take profit level. We find out that in a minute. At first, let us find out what the price does.
The price heads towards the North with extreme bullish momentum. It produces only one bearish candle and resumes its bullish journey. With naked eyes, we can tell that the price travels about 4R. It means as far as risk-reward is concerned, it is an excellent deal. Let us draw Fibonacci and see price trends from where to where.
The price makes the bullish reversal at 61.8% and heads towards the level of 161.8% in a hurry. It makes a breakout at 161.8% consolidates and resumes its bullish move. Ideally, the buyers should set their take profit at 161.8%. It would allow them to take 1:2 risk-reward. However, we have seen here that the price travels towards the North even further than that. It often happens when the reversal candle comes out as a bullish engulfing candle, and it is produced at the key Fibonacci level at 61.8%. We may not be too greedy but set our take profit at 161.8% in such cases. However, back in our mind, we know that we are dealing with an excellent trade setup.
Introduction Loan Growth is a suitable parameter for us to check whether the monetary strategies implemented by the Central Authorities are coming into play yet or not. Loan Growth also helps us to gauge the health of the economy in terms of liquidity. Loan Growth percentage serves as a litmus test, especially in a capitalist […]
Introduction Loan Growth is a suitable parameter for us to check whether the monetary strategies implemented by the Central Authorities are coming into play yet or not. Loan Growth also helps us to gauge the health of the economy in terms of liquidity. Loan Growth percentage serves as a litmus test, especially in a capitalist […]
Introduction
Loan Growth is a suitable parameter for us to check whether the monetary strategies implemented by the Central Authorities are coming into play yet or not. Loan Growth also helps us to gauge the health of the economy in terms of liquidity. Loan Growth percentage serves as a litmus test, especially in a capitalist economy, where credit and inflation primarily drive the economy forward.
What is Loan Growth?
Loan: It is a debt incurred by an individual or entity. The lender is generally a bank, financial institution, or the Government. The lender credits the borrower a sum of money. The borrower agrees to specific terms and conditions that can include finance charges, interest payments, due dates, and other conditions.
Loans can be secured or unsecured. In secured loans, the loan is given out against collateral with a financial value like a property, mortgages, or securities, etc.
Loan Growth: Loan Growth refers to the percentage increase in the number of loans issued overall by banks in a particular region over a particular time frame. The time frame can be monthly, semi-annual, or annual.
Most modern economies today we see are capitalist economies, i.e., they grow through capitalism. A capitalist economy requires money to expand and grow. Hence, credit is an inevitable fuel required for economic growth.
How can the Loan Growth numbers be used for analysis?
A healthy increase in the percentage of Loans is suitable for a stable and healthy economy. But as with any case, there is no perfect economy, and there are two sides of analysis to Loan Growth.
First Scenario
A healthy economy means it is growing at a stable rate year over year with mild inflation each year. Credit fuels economic growth in this type of economy. In this type of economy, an increase in the number of loans taken can be considered a positive sign for the economy.
Businesses can grow beyond just cash in hand. Householders can purchase homes without saving the entire cost before purchase. Governments can meet their spending needs without relying solely on tax revenues. Be it a business, householder, or a Government can smoothen out their economic activities in terms of money. They will take credit when in deficit and payback when in surplus.
An increase in Loan Growth can imply that more people are creditworthy, and more businesses are taking credit to expand and grow. Both of these scenarios are good for the GDP and is a good sign for the economy.
Second Scenario
The first scenario takes into the assumption that the economy is strong and stable. In reality, currently, most of the developed nations are struggling to maintain their economic growth. For example, the United States debt to GDP ratio is above 100%, which indicates that even if the entire GDP were given out to repay the debt, it would still be in some debt. Most of the developed nations have taken substantial credits to keep the economy from ticking over.
Keeping economic growth and global competency in mind, most countries have invested heavily in overgrowing in the short-term. By taking on more and more debts, countries may have achieved the necessary growth and needs now but have pushed their problems to the future.
Economists argue that eventually, there would be a time when countries cannot afford any more debt and would be backed into a corner. The only way out then would be at a considerable cost of losing out more than what they had made. Studies also show that rapid loan growth than the long term average also has seen an increase in underperforming or bad loans.
It is also essential to know that increase in Loan Growth should be accompanied by the fact that no bad loans are given out. Giving loans to people and businesses who do not have the eligibility but just because money is lying around is also a problem.
In the United States itself, the Government has been injecting money into the economy since the financial crisis in the form of Money Supply and Quantitative Easing programs to inflate their way out of depression or recession. Until now, the Government has not been able to reduce debt and is only taking on more debt to sustain the current growth.
An increase in loans is good or bad for the economy remains debatable for many. Without credit, sector growth is almost unimaginable in present times. For our analysis, we can use the Loan Growth rate as a litmus test to see whether the injected money from the Central Authorities has started reaching the public and businesses.
When the Central Authorities want to inflate the economy, they reduce interest rates by injecting money into the interbank market. The injected money takes time to get into the economy, and loans are one form in which this money gets circulated.
Overall, for our analysis, once Loan Growth shows increasing numbers, we can assume that the injected money is reaching the intended sectors, and consequent effects could be predicted on businesses and consumers. Loan Growth is indicative of a growing economy in general and is more prominent in developing countries.
Impact on Currency
Loan Growth is a by-product of a reduction in interest rates from the Central Banks of the country and an increase in employment and business growth. An increase in Loans indicates that money is “cheaper” to borrow. It is inflationary for the economy and is given out to induce growth (which may or may not happen).
An increase in Loan Growth depreciates currency as more money is competing against the same set of goods and services. A decrease in Loan growth appreciates the currency as the reduced liquidity forces goods and services to come at reduced prices.
Overall, Loan Growth is a low-impact indicator, as the Central Bank’s interest rates are the leading indicators, and the desired effect from increased loans can be traced from other leading indicators like Consumer and Business surveys.
Economic Reports
Since Loan Growth is not a significant economic indicator, official publications for significant countries are not explicitly published but can be obtained through reports analysis. For our reference, the Trading Economics website consolidates the Credit Growth in different sectors for data available countries on its official website. Since it is a consolidation, frequency and time of publication vary from country to country.
Sources of Loan Growth
Loan Growth consolidated available data for different countries are available here.
Loan growth is not a statistic. Most forex traders keep an eye when making their trades. The lack of interest is because it is considered a their-tier leading indicator. It is, however, essential to know how the release of this fundamental economic indicator affects the forex price charts.
In the EU, loan growth data is released monthly by the European Central Bank about 28 days after the month ends. It represents the change in the total value of new loans issued to consumers and businesses in the private sector. The most recent release was on July 27, 2020, 8.00 AM GMT can be accessed here. A more in-depth review of the economic news release can be accessed at the ECB website.
Below is a screengrab of the Forex Factory website. On the right, we can see a legend that indicates the level of impact the Fundamental Indicator has on the EUR.
As can be seen, low impact is expected on the EUR.
The screengrab below is of the most recent change in the loan growth in the EU. In June 2020, private loans grew by 3% as compared to the same period in 2019. This change represented a flat growth from the previous release. Based on our fundamental analysis, this should be positive for the EUR.
Now, let’s see how this positive news release made an impact on the Forex price charts.
EUR/USD: Before Loan Growth release on July 27, 2020,
Just Before 8.00 AM GMT
From the above chart, the EUR/USD pair is trading on a neutral trend before the data release. The candles are forming around the flattening 20-period Moving Average. This trend is an indication of relative market inactivity.
EUR/USD: After Loan Growth release on July 27,
2020, 8.00 AM GMT
After the news release, the pair forms a 15-minute bullish candle as EUR becomes stronger as expected. However, the news release was not strong enough to cause a shift in the pair’s trend since the pair continued to trade in the previously observed neutral trend.
EUR/JPY: Before Loan Growth release on July 27, 2020,
Just Before 8.00 AM GMT
Before the news release, EUR/JPY traded in a similar neutral trend as observed with the EUR/USD with the candles forming around a flattening 20-period Moving Average.
EUR/JPY: After Loan Growth release on July 27,
2020, 8.00 AM GMT
As observed with the EUR/USD pair, EUR/JPY formed a 15-minute bullish candle after the news release as expected. The subsequent trend does now significantly shift.
EUR/CAD: Before Loan Growth release on July 27, 2020,
Just Before 8.00 AM GMT
EUR/CAD: After Loan Growth release on July 27, 2020,
8.00 AM GMT
The EUR/CAD pair shows a similar neutral trading pattern as the EUR/USD and EUR/JPY pair before the news release. After the news release, the pair forms a 15-minute bullish candle but later continued trading in the earlier observed neutral trend as the 20-period Moving Average flattens.
The release of the loan growth data has an instant short-term effect on the EUR. The data is, however, not significant enough to cause any relevant shift in the prevailing market trend.
Gold continues on the fifth consecutive week of consolidation. The pattern is developing a contracting triangle which remains incomplete. The internal structure observed in this consolidation pattern suggests a limited upside before completing the corrective formation in progress.
Market Sentiment Overview
The price of Gold continues moving sideways by the fifth week in a row, testing the support on the extreme bullish sentiment zone of the 52-week high and low range. Although the precious metal eases 7.5% from its all-time high at $2,075.14 per ounce to date, the yellow metal report gains over 27.7% (YTD).
The following chart presents the yellow metal in its weekly timeframe. In it we distinguish the price movement testing the extreme bullish zone support located at $1,917.81 per ounce. This market condition leads us to expect a new decline for the coming trading sessions, finding support in the 26-week moving average, which currently moves in the $1,850.10 per ounce.
The potential decline in Gold’s price is backed by the strength of the U.S. Dollar Index, shown in the next intraday chart. In the figure, we observe the Greenback showing recovery signals moving above the 120-hour moving average.
On the other hand, the Gold Volatility index continues consolidating in a flag pattern. As discussed in our previous analysis, the current sideways movement, in progress, converges with gold’s consolidating formation, suggesting a new decline in the valuation of the precious metal.
Summarizing, the market sentiment for the yellow metal reveals the exhaustion of the extreme bullish sentiment that dominated the market participants’ activity until early August when the yellow metal reached its record high at $2,075.14 per ounce. At the same time, the recovery signals unveiled by the U.S. Dollar Index lead us to expect further declines in the precious metal.
Elliott Wave Outlook
The short-term Elliott Wave perspective for the yellow metal illustrated in the following hourly chart reveals a consolidation formation identified as an incomplete contracting triangle pattern.
In the hourly chart, we recognize the price action advancing in an incomplete corrective structural series, which began after the yellow metal topped at $2,075.14 per ounce from where the golden metal started to find sellers. The first decline corresponding to wave (a) of Minuette degree identified in blue found support at $1,832.62 per ounce. This bearish aggressively-looking leg alternates with wave (b), which still remains in progress.
The incomplete wave (b) in progress follows the internal sequence of a contracting triangle pattern, which currently ended its wave d of Subminuette degree labeled in green. According to the Elliott wave theory, the price should develop a marginal advance completing a wave e, in green, before continuing its bearish path. The limited upward move expected corresponds with the potential decline foreseen in the Gold Volatility Index, which shows a consolidation in the form of a flag pattern.
In today’s lesson, we are going to demonstrate an example of a chart that trends towards the North by obeying a trendline. It offers a long entry once the trendline is established. At the fourth bounce, it produces a bullish reversal candle. We find out whether the buyers should take a long entry or not upon getting the bullish reversal candle at the trendline’s support. Let us get started.
In today’s lesson, we are going to demonstrate an example of a chart that trends towards the North by obeying a trendline. It offers a long entry once the trendline is established. At the fourth bounce, it produces a bullish reversal candle. We find out whether the buyers should take a long entry or not upon getting the bullish reversal candle at the trendline’s support. Let us get started.
In today’s lesson, we are going to demonstrate an example of a chart that trends towards the North by obeying a trendline. It offers a long entry once the trendline is established. At the fourth bounce, it produces a bullish reversal candle. We find out whether the buyers should take a long entry or not upon getting the bullish reversal candle at the trendline’s support. Let us get started.
The chart shows that the price heads towards the North upon producing a bullish reversal candle. It consolidates and resumes its bullish journey. The chart looks like the buyers’ hunting ground.
The price upon producing a spinning top, it produces a long bearish candle. It consolidates with some candles and produces a bullish engulfing candle. The buyers may keep an eye in the chart to go long above the last swing high. If the price makes a bullish breakout, the buyers get two swing lows and two swing highs to draw an uptrending trend line.
Here it goes. The price makes a bullish breakout and heads towards the North further. The chart produces a bearish engulfing candle. It may make a bearish correction. As it looks, the chart belongs to the Bull without any doubt.
The price makes a bearish correction; consolidates and heads towards the North again. The breakout traders may find a long opportunity and grab some pips. The price makes a long bearish correction. In fact, it makes a breakout at a significant level of swing low. It seems that the chart is slightly bearish biased. Have a look at the chart below.
The trendline’s support holds the price and produces a bullish engulfing candle. The trendline traders may go long in the pair right after the last candle closes. The last swing high is the safest option to set take profit. It means the risk-reward ratio looks good for the trendline traders.
The price heads towards the North with good bullish momentum. However, it seems that the horizontal level of resistance is too strong to be breached. The price consolidates here with several candles. The last candle comes out as a bearish engulfing candle. The buyers may close the entry. The question is does the price come back to the trendline’s support or it makes a breakout at the highest high. Let us proceed to the next chart and find out what happens.
The price comes back at the trendline’s support. It produces a hammer. Should the buyers go long from here as far as trendline trading is concerned? Think about it for a minute.
If your answer is ‘No’, you are right. The reason why the buyers should not go long from here is it does not make a new higher high upon getting its last bounce. In fact, traders may wait for the price to make a breakout at the trendline’s support and go short in the pair. In our forthcoming lessons, we will learn about trendline breakout and trendline breakout trading. Stay tuned.
Apart from inflation, gross domestic product growth is one of the most closely monitored macroeconomic statistics. This interest in the GDP growth rate is because GDP is one of the leading indicators of economic health in any country. Therefore, apart from understanding how the GDP growth rate impacts a nation’s economy, forex traders must comprehend how it affects the exchange rate.
Understanding the GDP Annual Growth Rate
GDP: A country’s gross domestic product is the monetary measure of the entirety of goods and services that have been produced within an economy over a specific period. The formula for calculating the GDP for a country is summing up the households’ consumption expenditure, expenditure by the national government, spending by businesses, and the net value of exports. The fact that the GDP covers the entire expenditure within an economy makes it a robust leading indicator of economic health.
GDP Growth Rate: The measure of how the various components in an economy are changing over a given period is the GDP growth rate. The GDP growth rate shows how much a country’s economy has expanded or shrunk relative to the previous period. Thus, the GDP growth rate is the primary measure of how well or poorly an economy is performing.
GDP Annual Growth Rate: The GDP growth rate is calculated every quarter. However, the annual growth rate measures the change in the real GDP between a given quarter and a similar quarter in the previous calendar year. While the QoQ GDP growth rate gives a more recent picture of how the economy is fairing, the annual growth rate is necessary to indicate the longer-term trajectory of the economy.
How the GDP Annual Growth Rate is Measured
It is worth noting that the GDP annual growth rate is calculated using the “real” GDP, meaning that the GDP has been adjusted for inflation. This adjustment is made to ensure the effects of inflation do not result in a false sense of economic progression. There are two ways of determining the GDP annual growth rate.
The first one is by annualising the QoQ GDP growth rate. Annualising means converting the short term QoQ GDP growth rate into an annual rate.
Annualised GDP growth rate = (1 + QoQ GDP)4 – 1
The second method for calculating the annual GDP growth rate is by comparing the rate of change from a given quarter with that of the same quarter in the previous year.
YoY GDP growth = (Current quarter GDP/ Similar Quarter's GDP – previous year) – 1
How the GDP Annual Growth Rate can be used for analysis
Economists track the GDP growth rate not just because it shows the current state of the economy but because it the primary objective of fiscal and monetary policy formulation. The annual GDP growth rate shows a long-term trajectory of the economy. It provides an effective measure to compare the sizes of economies of different countries.
Governments and central banks formulate their policies around the GDP growth numbers. When the YoY GDP is falling, expansionary monetary and fiscal policies that will be implemented. A falling GDP is an indicator that the economy is heading to higher levels of unemployment; reduced wages; and a general reduction in aggregate demand and supply. Therefore, to avoid recession, expansionary policies like a reduction in interest rates are introduced. These measures are reducing the cost of borrowing, which in turn leads to increased expenditure by households, businesses, and the government.
Conversely, a rapidly increasing growth rate of the annual GDP signifies that the economy is performing well. This economic prosperity translates to a higher rate of employment, higher wages; increased levels of investment and re-investments; and higher aggregate demand and supply within the economy. However, although an increasing GDP is good, a rapidly increasing annual growth rate could forebode an overheating economy.
An overheating economy is one that is experiencing an unsustainable period of prolonged economic growth. This prolonged growth risks high levels of runaway inflation in the economy due to the continually rising wages. More so, an overheating economy results in inefficient allocation of the factors of production since producers oversupply the economy to take advantage of the higher prices. These inefficiencies are likely to result in a nationwide economic recession.
To prevent the effects of an overheating economy, the government and central banks will implement contractionary monetary and fiscal policies. They include a reduction in government expenditure and increasing the interest rate. These policies will help slow down the rate of inflation and increase the cost of borrowing, effectively reducing the aggregate demand.
Therefore, the YoY GDP growth rate provides an important metric for the relevant authorities to ensure that the economy is progressing at a sustainable pace. Furthermore, it is a way for the governments and central banks to gauge the effectiveness of the policies put in place.
Impact on Currency
Forex traders keenly follow the changes in fundamental economic indicators to establish whether there will be a future hike or cut in the interest rate. A falling annual GDP growth rate is accompanied by expansionary monetary policies such as a reduction of the interest rate. This cut tends to depreciate a country’s currency. Therefore, a falling annual GDP growth rate is negative for the currency.
Conversely, an increasing annual GDP growth rate forestalls an increase in the interest rate to prevent runaway inflation. Therefore, it is expected that a rising annual GDP growth rate leads to the appreciating of the currency.
How GDP Annual Growth Rate Data Release Affects The Forex?
This analysis will focus on the annual GDP growth rate in Australia. The most recent data release was on September 2, 2020, at 1.30 AM GMT and can be accessed at Forex Factory here. A more in-depth review of the data release can be accessed from the Australia Bureau of Statistics.
The screengrab below is of the annualised QoQ GDP growth rate from Forex Factory. On the right of the image is a legend that indicates the level of impact it has on the AUD.
As can be seen, both the annualised QoQ GDP growth rate data is expected o result in a high impact on the AUD.
In the 2nd quarter of 2020, the Australian economy contracted by an annualised rate of 7% compared to a 0.3% contraction in the first quarter. This contraction was worse than analysts’ expectation of 6%. This contraction is expected to depreciate the AUD relative to other currencies.
Let’s now analyse the impact made by this release on the Forex price charts of a few selected pairs.
AUD/USD: Before Annualised QoQ GDP Growth Rate Release on
September 2, 2020, Just Before 1.30 AM GMT
From the above 15-minute chart, the AUD/USD pair was trading in a neutral trend before the data release. This trend is evidenced by candles forming just around an already flat 20-period Moving Average. However, 30 minutes to the news release, the pair adopted a steep downtrend forming two long bearish candles with the 20-period MA falling.
AUD/USD: After the Annualised QoQ GDP Growth Rate Release on
September 2, 2020, at 1.30 AM GMT
After the data release, extreme volatility is observed. As expected, the pair forming a long 15-minute bearish candle due to the weakening AUD. The 20-period MA continued to fall steeply even though the pair started recovering from the worse than expected data release. Subsequently, the steepness of the 20-period MA subsided.
GBP/AUD: Before Annualised QoQ GDP Growth Rate Release on
September 2, 2020, Just Before 1.30 AM GMT
The GBP/AUD pair traded in a similar pattern as observed with the AUD/USD pair before the annualised GDP data release.
GBP/AUD: After the Annualised QoQ GDP Growth Rate Release on
September 2, 2020, at 1.30 AM GMT
As expected, after the news release, the pair formed a long 15-minute bullish candle due to the weakening AUD. As with the AUD/USD pair, the GBP/AUD pair underwent a period of correction with the 20-period MA flattening and the subsequent candles forming lower than the news candle.
EUR/AUD: Before Annualised QoQ GDP Growth Rate Release on
September 2, 2020, Just Before 1.30 AM GMT
EUR/AUD: After the Annualised QoQ GDP Growth Rate Release on
September 2, 2020, at 1.30 AM GMT
Like the other pairs, the EUR/AUD pair traded within a neutral trend with a significant shift in the trend immediately before the GDP data release. Like the GBP/AUD pair, the EUR/AUD pair formed a long 15-minute bullish candle after the news release due to the worse than expected data.
Bottom Line
The above analyses have shown that the GDP annual growth has a significant effect on price action. The period of relative market inactivity before the data release indicates that most forex traders avoid opening any new, significant positions until the data is released.
In the previous part, we introduced the walk-forward analysis concept, its objectives, and its advantages. This educational article will continue discovering the benefits of using the WFA and how to set it up.
Walk-Forward Analysis and Market Impacts
The walk-forward analysis provides information about the impact of changes in trends, volatility, and market liquidity on the performance of the trading strategy or system. Generally, when these changes occur, they arrive at a fast pace, heavily degrading the trading performance.
The WFA may extend its study in a wide range of time; however, analyses and evaluates the trading performance by separate windows. The broad range of results obtained by the study could provide the developer with a piece of useful information about the market changes impact the trading strategy performance.
Parameters Selection
As a robust optimization system, the WFA can provide the most appropriate parameters for real-time trading.
Simultaneously, the walk-forward analysis provides the strategy developer with the duration of the optimal period of time in which the set of parameters will consistently produce real-time benefits before the deterioration in trading system performance occurs.
Statistical Rigor in the Walk-Forward Analysis
As mentioned above, a large amount of data provides greater confidence in any phenomenon’s statistical study. This concept is also valid in the walk-forward analysis.
In this context, the walk-forward analysis must be large enough to produce several trades such that a large amount of data can be generated for the study. According to Pardo, in his work, he says that a WFA must be as long as possible, usually at least 10 to 20 years, whenever possible. Finally, he adds that these multiple walk-forwards combined performance will often be sufficient to produce the statistical rigor required in the analysis.
As a result, WFA’s multiple optimization windows will be able to give the developer a better idea of how the trading strategy will behave in the face of market changes.
Developing the Walk-Forward Analysis
A walk-forward analysis consists of two stages. In the first section, traditional backtest optimization is developed. The parameters of the trading strategy are analyzed using a sample established according to the developer’s objectives.
The second stage, which is the one that characterizes a walk-forward analysis, evaluates the performance of the parameters using an additional sample that was not used during the previous optimization stage.
The walk-forward analysis process requires the following elements to be set:
Scan range for variables to optimize. The developer must define the time frame in which the trading strategy’s optimization should be performed. The developer should consider that the scan range uses a computational resources level that it will use to evaluate and weight the parameter to be optimized. In this regard, an exploration in a small number of historical simulations will consume less computational resources than a more extensive optimization.
Identify a target or a search function. The developer must define what the purpose of the optimization study is. A usual target can be a mix of the normalized average trade return (the reward/risk factor), the standard deviation of this figure, and the percentage of winning trades. These three factors will define the quality of any trading system. A fourth key factor is the number of monthly trades delivered by the system.
Size of the optimization window. Generally, this optimization range can vary from 3 to 6 years. This duration depends on different factors such as, for example, the market, the type of trading strategy, the confidence level required by the developer in the optimization results, among other factors determined by the developer.
Size of the walk-forward out-of-sample window. This period is defined based on the optimization window. In most cases, this window can be between 25% and 35% of the optimization time.
The length of the optimization window is determined by:
Availability of data. Depending on the type of market and accessibility of the data to perform the analysis, the developer might find a restriction on the amount of historical data needed to perform strategy optimization.
Trading strategy style. A short-term trading strategy should require a smaller optimization window than a long-term strategy.
The pace of trading strategy. The pace of strategy is highly variable and tends to vary from strategy to strategy. For example, a long-term strategy, such as swing trading, will slower than a short-term trading strategy, which will require less time to produce the same number of trades.
The relevance of data. The relevant data depends on a large number of factors that could empirically be determined. However, Pardo proposes a basic guideline stating that a short-term strategy can be tested using one or two years of data, whereas an intermediate-term strategy would require two to four years, and a long-term strategy four to eight years of data.
The validity of the strategy’s parameters. The developer expects the parameters employed will generate benefits in the historical simulation. Furthermore, it also requires a trading strategy to produce profits in real-time market trading.
Finally, the walk-forward analysis is a post-optimization method, highly effective and revealing when it comes to discriminating a trading system’s robustness. Regarding that, the market is dynamic and changes periodically; the trading system should be re-optimized with a certain periodicity.
For example, a properly optimized short-term strategy could be re-optimized between three and six months of real-time trading. While the long-term between one and two years.
Conclusions
In this second and final part, we reviewed the basics of walk-forward analysis, characterized by providing the trading system developer with a powerful tool for testing, validation, and measuring trading strategy. Among the benefits that this stage of the development of a trading system provides we can mention:
Measurement of robustness.
Reduction of overfitting.
Assessment of market changes in the trading strategy.
Selection of optimal parameters for the strategy.
Statistical reliability, when correctly applied.
Finally, despite the benefits provided by this analysis methodology, the strategy developer should consider that the trading system may need to be re-optimized with a certain periodicity.
Suggested Readings
Jaekle, U., Tomasini, E.; Trading Systems: A New Approach to System Development and Portfolio Optimisation; Harriman House Ltd.; 1st Edition (2009).
Pardo, R.; The Evaluation and Optimization of Trading Strategies; John Wiley & Sons; 2nd Edition (2008).
When you go ahead and type into the Google Currency Strength Meter, believe it or not, you will see that this tool gets over 14000 searches per month average. This is almost the same as one of the most popular indicators RSI. Can you imagine? So, what is the currency strength meter? This is the […]
When you go ahead and type into the Google Currency Strength Meter, believe it or not, you will see that this tool gets over 14000 searches per month average. This is almost the same as one of the most popular indicators RSI. Can you imagine? So, what is the currency strength meter? This is the […]
When you go ahead and type into the Google Currency Strength Meter, believe it or not, you will see that this tool gets over 14000 searches per month average. This is almost the same as one of the most popular indicators RSI. Can you imagine?
This is the kind of visual map – guidance that demonstrates which currencies are strong and which ones are weak in a certain moment. It uses the exchange rates of different currency pairs to show comparable strength of each of those currencies. There are different Currency Strength Meters to be found out there. The simpler ones may not use any weighting, while more complex and advanced ones may apply their own weightings. Some may even combine other indicators with the currency strength measurement in order to provide trading signals. For example, to calculate the strength of the EUR – this tool would calculate the strength of all pairs that consist of EUR currency, and then use those calculations to determine the strength of the EUR.
What this tool actually does is to give you information about 8 major currency pairs, mostly, based on the fact how strongly these currency pairs performed over a certain time frame. It tries to give you an overall picture of which currencies have been strong and which ones have been weak for those periods. For Currency meters, the most common time frame is 24 hours. The one that knows will notice that most similar to this tool are Forex Heat Maps – which essentially do the same thing.
As it may happen with any tool, Currency Strength Meters may have their own issues, particularly when they are poorly coded. If CSM cannot give accurate currency strength indicator values, it is of little use – regardless of their other features. With outdated Currency Strength Meters, traders may experience the following issues: MT4 can freeze, PC or laptop can freeze, stutters, whipsaw signals, memory leakage, your CPU keeps on 100%, and so on. Some of these tools that you can find out there might even produce data that were not part of the original concept of Currency Strength Meter. Some traders apply smoothing filters to this tool, like moving averages, for example, while some traders apply other filters like the RSI or MACD. By adding these filters on top of the CS meter, traders may even experience getting some false trading signals, and they can enter some bad trades which may lead to the money loss.
In years of existence, Forex strength meters developed to currency correlation matrices that could quite possibly deliver more accurate and better information, so this can be one of the ways to measure currency strength that a CS meter gives you. Since currencies are traded in pairs, for example, EUR/USD, you can use correlations to measure the strength of individual currencies like EUR and compare it to Currency Strength Meter.
Some advantages to using Currency Strength Meter including its obvious simplicity, are the usefulness as a short-term indicator, the ability to avoid double exposure and unnecessary hedging, the possibility to signal high-risk trades, and last but not least, it is available for free.
There is an opinion of certain traders that the most usual thing that new traders do when they discover these tools, they get an idea that the hardest thing in trading is to put some money on the account for start, and after that money just comes – drops from the sky in loads, you just need to apply this easy and cool tools. Indeed.
They conclude that these are the tools that only tell you what just happened, not what is going to happen – suppose that this should help you profit in your trades? Their standpoint is that charts already give you this information. Actually, what they mean is that you have charts for 27-28 different currency pairs and this has been confirmed as better and more reliable than any Currency Strength Meter. Carefully built experience in trading, so far, has shown that brokers that make money by taking the other side of your trade very much love this tool – to put you on to use it frequently in order to make money on your trades.
From their point of view, how these tools work is that the meter is taking readings from every forex pair over the last 24 hours and applies calculations to each. Then it by algorithm finds the current strength in the pair and gives you a visual guide. It displays which currencies are strong and which are weak at any given moment, reflecting that movement in a gradually colored matrix. Only by using an effective currency strength meter, you will have another tool at your disposal that will empower you to become a profitable trader. You must admire the sound of it!
The claim is that another thing that can attract the novice is the simplicity that this tool has. It is quite easy to use it, even though it doesn’t give much of a result in practice, to be honest. Listening to this, the conclusion to be drawn is that Heat Maps and Currency Strength Meters are not very useful. If you wish to stick to it, after all, you can do it on your own and they wish you a load of luck because you will need it by far.
Now, what they say about the Currency Strength Indicator, is that it is a little bit different in the outer look. They explain it as a graph with an overview of the strength of a currency, presented with lines in different colors. It is just a line version of Currency Strength Meter. It measures the strength of a currency based on all of the currencies that are available with your Forex broker in the last 24 hours or the period setting of your choosing. It then applies calculation and assigns individual strength to each currency and presents information in an easily understandable way.
What this indicator actually does is to allow you to overlay several currency pair graphs (lines) on top of each other so you can see and try to predict where the price of a certain pair may go next. This also can be used as a two-lines cross indicator – a position where you would make a move after two chosen lines finish crossing each other, or as a reversal trade, when two different lines both appear at their extremes.
We gave this indicator enough of our time and attention and tested it thoroughly. Unfortunately, it doesn’t give results strong enough to rely on it and to base your future trades on its results. However, you may discover something we don’t know yet, and we are all different people. The systems each trader builds, even if based on the same ideas are also different. If you like the idea of it, our suggestion is to try, to test it and see where it will get you. It could be worth trying.
Some prop trading firms use individual currency baskets, also called currency index. Traders may be familiar with the dollar index, DXY, but other major currency indexes are not common. By analyzing how each major currency is holding against the others in the form of a simple chart, prop traders have an insight on what currency they should be trading. Custom currency baskets can be easily made using the now-famous Tradingview platform.
What you can do, also, is to go out to search for other places where different versions of Currency Strength Indicators can be found. Choose a couple, or more, that you like, download them, and start to test them. Try to test the indicator, up against a chart and see how it performs on its own first, before testing it out against other indicators or with other indicators.
You will certainly get better results by adding any momentum indicator that has enough volume behind it. We suggest doing the back-testing standalone and after that, test it together with the volume indicator already attached and measure test results when you are showing enough volume to do so. This thing should give you a million of false signals when there is no real volatility in the market. By our experience so far, it should make a big difference in overall results and this could be the most efficient way. Even though we don’t truly endorse it, there is a possibility that it might work for you.
This indicator is very unique to most of the indicators out there and should be handled accordingly. The conclusion from this would be that Currency Strength Meter is a sort of useless standalone, redundant and it is made only to get the novice in trading excited and in a better position to lose their money very fast.
Currency Strength Indicator could be, possibly, a little better – it may be worth testing if you choose to do it wisely and properly. The currency strength indicator is not an indicator that should be used on its own. Rather, this indicator can complement your existing trading strategies and could help you to pick the right combination of the currency pair to strength.
If you are new to forex trading, chart patterns are likely to attract your attention quickly because the trader community is full of praises for this kind of trading. They will certainly seem appealing due to habits developed from a young age when our parents used different shapes and forms to keep us entertained and […]
If you are new to forex trading, chart patterns are likely to attract your attention quickly because the trader community is full of praises for this kind of trading. They will certainly seem appealing due to habits developed from a young age when our parents used different shapes and forms to keep us entertained and […]
If you are new to forex trading, chart patterns are likely to attract your attention quickly because the trader community is full of praises for this kind of trading. They will certainly seem appealing due to habits developed from a young age when our parents used different shapes and forms to keep us entertained and amused. Nowadays, the entire toy industry and children based video games are based on shapes and forms used to provide preschool education to toddlers and children. Our brains are naturally wired to see patterns in every abstract form, be it star constellations or forex charts. We give meaning to randomness. Therefore, who could blame you for jumping on the chart pattern bandwagon once you enter the world of forex trading?
Indeed, some pattern names will easily trigger childhood memories that instantly attract you to explore more about pattern trading: triangle, wedge, rectangle, flag, and pennant. Some of them are appealing enough, such as head-n-shoulders or cup-n-handle. It just sounds like fun and games, and why not have some of it while trading. To make things more serious, most traders will tell you that it works and they will provide you with an abundance of examples. But the question is: have you learned to lose fun games when you were a kid?
The question is posed because there is not much information available on when chart patterns are not working. In reality, chart patterns supporters will show you examples when chart patterns have already worked but will rarely share the failed stories on using patterns that have completely misled them. The first instance would obviously create an image of a prominent trader, while the latter would discredit them and portray them as a showoff. Therefore, psychology plays a significant role in chart pattern trading as the availability of successful examples plays hand in hand with the trader’s inclination and ability to boost self-confidence. Reliance on the limited information that is available to the narrow circle of traders and a strong belief in skills that provide an advantage over the competition will eventually lead to overconfidence. Such a mindset represents a perfect stage for doubtless use of chart patterns as successful examples visible only in the aftermath is seen as an actual confirmation of self-confidence and perceived ingenuity. This fact is your first red flag when considering chart patterns as your go-to strategy in forex trading.
It is also important to keep in mind that the overwhelming majority of traders are impressed by chart patterns, which is why new traders are attracted to this kind of trading. It is a classic example of social learning theory that can be summarized as the acquisition of new behaviors by noticing and imitating the behavior of others in the group. That same theory is proven in social experiments in which a random person not aware of the experiment is acting the same way as the group participating in the experiment, without even knowing the reasons for such behavior and regardless of how ridiculous that behavior may be. Simply put, chart patterns should not be utilized without any doubts just because the overwhelming majority is doing so, according to the contrarian traders’ opinion. This resonates as the second red flag especially if you put in the perspective that the majority of traders are on the losing end of the forex market.
As a beginner, it is not easy to spot a forming shape when looking at charts. In fact, you have to draw it yourself and there are no clear instructions on how to do it. Line drawing can cause a lot of frustration, consume much of the precious time, and requires plenty of creativity. You are bound to make mistakes, redraw numerous lines and shapes and it still does not guarantee success. A good example that demonstrates drawing patterns is a matter of frustration rather than efficiency is drawing trend lines. As you may know already, traders analyze charts in numerous different manners and therefore see trend lines arising at different points. Therefore, your decision on breakouts and entry points will differ from other traders and chances are that the same is applicable to drawing chart patterns. There is simply no consistency in drawing patterns. When the first red flag is added to the equation, the fact that chart patterns work perfectly for others makes us question our own abilities and we quickly start blaming ourselves when the drawn patterns are not giving results.
Finally, it is not shapes and forms that move the prices but the big banks reacting to the retail traders. None of them are putting effort into creating triangles and wedges on the charts. On the contrary, they are bound to form eventually as a natural process of market movements. Their natural formation is not a clear indicator that prices are going to take a direction predicted by the pattern, despite the time amount invested in identifying the pattern. The reality is that the prices still have even odds of going one way or another, and there are more systematic ways to connect the dots that give us a higher chance of success than chart patterns.
Forex trading is not universal science and many different strategies and approaches could be used – and even developed – by traders. Those who develop unique trading systems based on evidence that demonstrate consistent results are more likely to achieve success, simply because they start to trust the process over time. In the process of building their exclusive trading system, traders develop a greater understanding of arising issues and use distinctive rationale thus dealing with market obscurities more effectively. Such traders do not waste time identifying and drawing shapes nor do they adjust their skills and knowledge to the chart pattern system that has not been empirically proven.
Although chart patterns are not supported by practical evidence that would confirm their (in)famous reputation, the red flags pointed out in this article represent just one school of thought. There is no need to change the system heavily relying on chart patterns that yield profits, as it certainly is a powerful tool for those traders who found the winning formula. Such traders may have a strong argument on using chart patterns; however, they cannot draw the lines and shapes for all the traders who just can’t get it right. And it is no surprise overwhelming majority struggles with chart patterns since there is more evidence available on why chart patterns do not work in practice. Once caught in its web, it is difficult for traders to break away from the habit of identifying shapes on the chart. Moreover, they tend to modify their systems and overthink when they spot a shape on the horizon. In an effort to avoid this trap, any trader should eventually pose the same question when getting lost with chart patterns: would I rather trust my own work and judgment or follow the signs along the way?
Some of the best advice that you can be given is to do with your risk management, risk management is often seen as the key to successful trading, it can make or break a trading strategy. One of the most well-known risk management plans is known as the 1% rule. It is quite simple in […]
Some of the best advice that you can be given is to do with your risk management, risk management is often seen as the key to successful trading, it can make or break a trading strategy. One of the most well-known risk management plans is known as the 1% rule. It is quite simple in […]
Some of the best advice that you can be given is to do with your risk management, risk management is often seen as the key to successful trading, it can make or break a trading strategy. One of the most well-known risk management plans is known as the 1% rule. It is quite simple in principle, you will simply risk just 1% of your account with each trade. So if you have a balance of $100, that 1% will be %1, if you have a balance of $1,000 then that 1% will be equal to $10. It could not be any simpler than that, of course, this 1% will be a different value for all traders as most will of course have different account balances, so it needs to be based on your own account and not simply copying someone else. We are going to be looking more into the 1% rule and giving a few ideas as to why so many traders follow it and even live by it.
So why is it the 1% rule? It is simple really, it is because your plan is to be able to trade today, tomorrow, the day after, and so on. Successful trading is all about being able to survive long enough to become profitable, if you are making large trades and taking large risks, then there is a good chance that this might not happen. The 1% rule simply reduces the amount of risk that you are using when you trade, which is paramount should you wish to be able to last as a trader and to survive a number of losses in a row.
The centre of any good trading strategy should be its risk management, I know we have said that multiple times already and we will continue to say it as it is paramount for your trading survival. You need to remember that the aim of forex is not to make a fortune overnight (although many come into it wanting this), the goal is to make a profit over an extended period of time. Trading is not a gamble and should not be treated like it, control your risks. When you make a number of different small trades, it has reduced the risks and the odds of you being successful will have gone up, simply because there are more opportunities to make a profit. Along with that, your account will last longer, and an account that lasts longer is able to make money for longer, it also gives you more opportunities to learn new things. Not to mention that if you lose a trade and it only losses 1% of the account, it will be far easier to make that 1% back than it will to make back the 30% another trader lost.
The 1% rule is a lot more relevant to those that are trading the shorter-term trading styles, things like day trading and scalping due to the fact that they place far more trades. You need to also bear in mind that each trade will have a slightly different amount of risks, yes it remains at 1% but you need to adjust for the previous results. A win would mean that you are trading a little extra, while a loss will mean that you are trading a little less. You should also consider broker fees, many brokers especially on accounts with low spreads will add a little commission on to each trade, if you can, try to take these figures out first, so you know what you will be left to trade with.
One thing to think about is the fact that not every trade needs to follow this rule, there may be times where the opportunity presents itself where it may be better to risk either more or less than the 1% that you usually do. It should also be noted that you should not be making more trades simply because you are risking less. We have seen people put on 3 or 4 identical trades, this is pointless and you may as well have just put on one large trade instead. One other way of implementing this rule is to simply put on a top-loss at 1% below the level that the markets were entered, if they lose the trade then they will have lost just 1%, this is called an equal risk method, as the take profit is normally set approximately 1% above the price that the market was entered.
We briefly mentioned it but you also need to be able to consider your returns or the profits that you are risking this 1% to get. Part of your analysis should be looking at the potential profits, if you have the chance to make a 0.8% gain, then you probably shouldn’t be risking 1% to get it, if you can make a potential 2% then the 1% risk could be worth it and justifiable. Your risk to reward ratio will be what you need it to be, but you should probably be aiming for something around the 1:2 ration, which is 1% risk for a 2% profit, anything less than that and it may not be worth it. Some people go even higher and won’t trade anything under 1:5, but really it is up to you and the style and strategy that you are using.
So you need to consider whether using the 1% rule is right for you because it certainly won’t be right for everyone. It takes a lot of willpower and determination to stick to it as you will be putting a lot of rules and limits on what you are able to do. Having said that, you do not need to follow it exactly every single time, you can have a few variations here and there should your analysis allow it. 1% can seem a little ringing and a little strict to many, if you are finding it hard to stick with the majority of the time then it may not be the right risk plan for you. If you are the sort of person that loves seeing big profit numbers then this may not be for you, there is enough room to make some decent money, but it will come in little bits rather than a big windfall.
Deciding whether the 1% rule is right for you is something that only you can decide. Even if you do not follow it, it is important that you take some of the principles away from it, things like a proper risk to reward ratio, that you are limiting your losses and that you maintain a certain level of discipline within your trading.
For forex traders, the producer prices change come as an afterthought. The changes in the prices of the output by domestic producers is a vital macroeconomic indicator since it is considered a leading indicator of inflation. Therefore, understanding how these changes impact the economy, the rate of inflation, and the currency can be useful to forex traders.
Understanding Producer Prices Change
Producer prices change in the United States is measured using the producer price index (PPI). The PPI is a weighted index that measures the change in the price of finished goods and services sold by producers.
The consumer price index is the most cited metric for measuring inflation. However, PPI can be used as a measure of inflation; because it tracks the changes in prices from the perspective of producers. CPI tracks price changes from the consumers’ perspective. Therefore, PPI can be used as the foremost tracker of inflation since it measures the changes in the prices of output before it is distributed to the consumers. PPI can be considered to the purest change in the prices of output since it does not include the changes caused by sales taxes and mark-ups by retailers. Hence, PPI is predictive of the CPI, as shown by the correlation in the chart below.
Since the PPI does not represent the general and final changes in the prices of goods and services in an economy, it is regarded as a weak economic indicator in the forex market.
How PPI is measured
Although the PPI is quoted as the change in the price of the producers’ output, it is measured in three distinct stages based on the level of production. They include the PPI Commodity Index, which measures the changes in the price of input materials, PPI Processing Index, which measures the changes in the price of intermediate goods, and Core PPI, which measures the finished output.
It is worth noting that the prices of food and energy are considered to be highly volatile and are therefore not included in the computation of the core PPI. This omission is justified by the fact that their prices are reliant on the short term supply and demand, which makes it difficult to compare these prices in the long-run.
As mentioned earlier, PPI is a weighted index. Weighting means the size and importance of the items sampled are used. The changes in prices compared to those of 1982 as the base year.
How can the PPI be used for analysis?
The inflation data is among the most-watched economic indicators because the rate of inflation informs the monetary and fiscal policies in a country. Being a leading indicator for the CPI, the PPI serves an important role. This role is precipitated by the fact that inflation is one of the primary drivers of monetary and fiscal policies.
Rising inflation signifies the availability of cheap money, which encourages spending and investments. The Federal Reserve then raises interest rates to reduce the amount of money in circulation. At higher interest rates, borrowing money becomes expensive hence reducing consumption. Similarly, it becomes lucrative for households to save money since they earn more. Postponing consumption tends to reduce the amount of money I circulation hence lower rates of inflation.
Inarguably, low rates of inflation result in a stagnant economy. Although inflation is good for the economy, when it gets out of hand, it results in a rapid depreciation of a country’s currency. It is for this reason that the central banks use interest rate policies to set the desired maximum and minimum inflation rate. In the US, for example, the Federal Reserve has set the country’s inflation target at an average of 2%.
An increase in the PPI signifies that the overall rate of the CPI will also increase. This increase will reduce the purchasing power of the country’s currency since the same amount of money will afford a lesser quantity of goods and services. Therefore, an increasing rate of inflation encourages consumption within an economy because savers will be afraid that their money will lose value.
This increased consumption leads to growth within an economy. Conversely, a decreasing PPI signifies that the overall inflation is likely to reduce. This reduction, in turn, encourages people to save their money hence reducing the rate of consumption in an economy.
Inflation can result in a feedback loop. Hence, rising inflation will encourage more expenditure and investment in an economy leading to further inflation. This feedback loop occurs when savers opt for consumption to avoid the depreciation of their money; this, in turn, increases the amount of money in circulation, which causes the purchasing power of money even to reduce further.
Impact on Currency
The end goal for any forex trader is to establish whether a change in any fundamental indicator will lead to an interest rate hike or cuts. This anticipation is what primarily impacts the price action in the forex market.
A rising PPI signifies rising inflation, which would be accompanied by an increase in the interest rates. Since the increasing interest rate is good for the currency, an increase in PPI results in appreciation of the currency relative to others.
Conversely, dropping levels of PPI signifies that the overall rate of inflation will fall. Therefore, a steadily dropping PPI forestall a drop in the interest rate. Therefore, decreasing levels of PPI leads to a depreciating currency.
Sources of Producer Price Changes
The producer price changes data can be accessed from the US Bureau of Labor Statistics, along with the monthly updates. A comprehensive look into the US PPI data can also be accessed from St. Louis FRED website. Statistics on global producer price changes can be accessed at Trading Economics.
How PPI Data Release Affects The Forex Price Charts
The most recent PPI data was released on August 11, 2020, and can be seen at Forex factory here. A more in-depth review of the PPI report from the Bureau of Labor Statistics can be accessed at the BLS website.
As can be seen, both the monthly PPI and core PPI data are expected to have a high impact on the USD upon release.
The screengrab below shows the most recent changes in the MoM PPI and core PPI in the US. In July 2020, the monthly PPI increased by 0.5% compared to a 0.3% decrease in June. The core PPI increased by 0.6% in July compared to a 0.2% decrease in June. Both changes in the MoM PPI and core PPI were better than analysts’ expectations of 0.1% and 0.3% increase, respectively.
Now, let’s see how this release made an impact on the Forex price charts of a few selected pairs.
EUR/USD: Before Monthly PPI Release on August 11, 2020,
Just Before 8.30 AM ET
As can be seen from the above 15-minute chart of EUR/USD, the pair was on a steady uptrend before the release of PPI data. This trend is evidenced by candles forming above the steeply rising 20-period MA. However, 30 minutes before the release, the steady uptrend tapered with the 20-period MA peaking.
EUR/USD: After Monthly PPI Release on August 11, 2020,
at 8.30 AM ET
After the PPI data release, the pair formed a 15-minute bullish candle followed by a period of volatility. The pair later adopted a bearish trading pattern with the 20-period MA steadily sloping downwards, showing that the USD became stronger as expected.
GBP/USD: Before Monthly PPI Release on August 11, 2020,
Just Before 8.30 AM ET
Before the news release, the GBP/USD pair showed a similar steady uptrend as observed with the EUR/USD pair. As seen above, the 20-period MA is steeply rising with candles forming above it.
GBP/USD: After Monthly PPI Release on August 11, 2020,
at 8.30 AM ET
After the PPI release, the pair formed a 15-minute bullish “hammer” candle. As with the EUR/USD, the pair subsequently reversed the uptrend and traded in a steady downtrend, the 20-period MA sloping downwards.
AUD/USD: Before Monthly PPI Release on August 11, 2020,
Just Before 8.30 AM ET
AUD/USD: After Monthly PPI Release on August 11, 2020,
at 8.30 AM ET
Unlike the strong uptrend observed with the EUR/USD and GBP/USD pairs, the AUD/USD pair traded in a weak uptrend before the PPI data release. This trend is evidenced by candles forming just around the slightly rising 20-period MA. After the news release, the pair formed a 15-minute “bearish Doji” candle signifying a period of volatility. The pair subsequently reversed the trend adopting a steady bearish stance with the 20-period MA sloping downwards.
Bottom Line
Although the PPI is a relatively low impact fundamental indicator compared to the CPI, this analysis has proved that its release has a significant impact on the price action. Forex traders should avoid having any significant positions open before the release of the PPI.
In today’s lesson, we are going to demonstrate an H1 chart offering an entry by using intraday support/resistance. To go with it, Fibonacci levels are used to spot out the stop-loss and take-profit levels. Let us now get started.
In today’s lesson, we are going to demonstrate an H1 chart offering an entry by using intraday support/resistance. To go with it, Fibonacci levels are used to spot out the stop-loss and take-profit levels. Let us now get started.
In today’s lesson, we are going to demonstrate an H1 chart offering an entry by using intraday support/resistance. To go with it, Fibonacci levels are used to spot out the stop-loss and take-profit levels. Let us now get started.
The chart shows that the price makes a long bearish move. The H1 chart makes a breakout at the last day’s lowest low (black drawn line). Usually, the chart attracts the sellers to look for short opportunities upon getting a bearish reversal candle. However, look at the combination of the last three candles. It is called Morning Star, which is one of the strongest bullish reversal patterns.
The price heads towards the North and goes back in the last day’s lowest low. Moreover, it makes a breakout at today’s highest high as well (black drawn line). Within four candles, the chart looks good for the buyers. The buyers may look to go long in the pair upon getting a bullish reversal candle at the breakout level.
The chart produces a bearish candle. The breakout level seems to hold the price as a level of support. A bullish reversal candle at the level may attract the buyers to go long and push the price towards the North further.
Here it comes. The chart produces a bullish engulfing candle right at the breakout level. The buyers may trigger a long entry right after the last candle closes by setting stop loss below the lowest low of the signal candle. We are going to talk about the take profit level in a minute. Let us find out how the trade goes.
The chart produces a bullish candle. The price heads towards the upside with the next candle as well. However, the candle comes out as a Doji candle having a long upper shadow. It suggests that the price may make a bearish correction or make a bearish reversal. Since the trade setup is based on the H1 chart, the buyers may lose a good number of pips if they are to wait for the chart to produce a reversal candle to close their entry. It is tough to manage trade in the H1 chart manually. Thus, setting the take profit is the best way. The question is, where should we set our take profit? In this regard, Fibonacci levels come extremely handy. Let us draw the Fibonacci levels in the chart and find out how they work in the chart above.
There you go. The price produces a bullish reversal candle at 61.8% level and heads towards the level of 161.8%. It means the buyers may achieve 1:2 risk-reward easily by using Fibonacci levels in intraday trading. In our fore coming lessons, we are going to demonstrate more examples of integration of Fibonacci levels and intraday trading. Stay tuned.
The GDP and Inflation rate are two of the most closely watched macroeconomic statistics by economists, business analysts, investors, traders, government officials, and the general population. The inflation rate has an impact on everyone, and no one is exempt from it. Understanding its effect on the currency, economy, living conditions, and how to use it for our analysis is paramount.
What is Inflation Rate, MoM?
Inflation: The increase in the prices of commodities over time is called inflation. It is the rise in the cost of living over time where the purchasing power of the currency depreciates. Inflation erodes the value of the currency, meaning a unit of currency can procure lesser goods and services than before. Inflation occurs when more currency is issued than the wealth of the country.
Inflation Rate: The percentage increase in price for a basket of goods and services for a particular period is called the inflation rate. It is used to measure the general increase in the cost of goods and services. It is contrasted by deflation, which refers to the appreciation of the currency and leads to decreased prices of commodities. When more currency chases, fewer assets inflation occurs.
Inflation Rate MoM: The general measure of the inflation rate is YoY, i.e., Year-over-Year. It serves as a means to measure how currency has faired over the year against inflation. The rate tells how fastly prices increased. The inflation rates are often low and incremental over time and hence make more sense for a YoY comparison for general use. However, for traders and investors, MoM is more useful for close monitoring to trade currencies.
How can the Inflation Rate MoM numbers be used for analysis?
As inflation continues, the standard of living deteriorates. Inflation is an essential economic indicator as it concerns the standard of living. Hence, it requires much attention to understand and analyze. Inflation can occur due to the following reasons: cost-push inflation, demand-pull inflation, and in-built inflation.
Demand-pull inflation: When too few goods are chased by too much money, we get demand-pull inflation. It is the most common form of inflation. The demand for commodities is so high that people are willing to pay higher prices.
Cost-push inflation: It occurs when there is a limit or constraint on the supply side of the demand-supply equation. A limited supply of a particular commodity makes it valuable, pushing its price higher. It can also occur when the cost of manufacturing or procuring raw materials increase that forces businesses to sell at higher prices.
Built-in inflation: It occurs out of people’s adaptive expectations of future inflation. As prices surge, workers demand higher pay due to which manufacturing costs increase and form a feedback loop. It forms a wage-price spiral as one feeds of another to reach a new higher equilibrium.
Inflation mainly affects middle-class and minimum wage workers as they immediately experience the effects of inflation. Generally, the monthly inflation rates would be less than 1% or 0.00 to 0.20% in general. Such increments can be useful for currency traders to short or long currency pairs by comparing relative inflation rates.
Central authorities are committed to ensuring a low and steady inflation rate throughout. The policies are also drafted to counter inflation or deflation. The central authorities would likely intervene with a loose-monetary policy to inject money into the system and induce inflation when the economy is undergoing a slowdown or deflation. A tight monetary policy (withdrawing money from the economy) would be used to induce deflation to counter hyperinflation.
Impact on Currency
The monthly inflation rates are essential economic indicators for both equity and currency traders. It is an inversely proportional high-impact coincident indicator. An increase in the inflation rate deteriorates currency value and vice-versa. As it has a direct impact on the currency, the volatility induced as a result of significant changes in the inflation rate is also high.
Economic Reports
There are multiple indices to measure the inflation rate. The CPI, Producer Price Index (PPI), Personal Consumption Expenditures (PCE), GDP Deflators are all popular statistics used for measuring inflation in a variety of ways.
The Bureau of Labor Statistics (BLS) of the United States releases the CPI and PPI reports on its official website every month. The GDP Deflator is published by the Bureau of Economic Analysis (BEA) every quarter. The PCE is also published by BEA every month.
Sources of Inflation Rate MoM
BLS publishes the Consumer Price Index (CPI) and Producer Price Index (PPI) on its official website. The data is available in seasonally adjusted and non-adjusted versions, as inflation is also affected by business cycles. A comprehensive and visual representation of these statistics is available on the St. Louis FRED website. The BEA releases its quarterly GDP deflator statistics and monthly Personal Consumption Expenditure (PCE) on its official website for the public. Consolidated statistics of monthly inflation reports of most countries are available on Trading Economics.
How the Monthly Inflation Rate Data Release Affects The Price Charts
For this analysis, we will use the monthly consumer price index (CPI) to measure the rate of inflation. The Bureau of Labor Statistics releases the MoM CPI data in the US. It measures the change in the price of goods and services from the perspective of the consumer. The most recent data was released on August 12, 2020, at 8.30 AM ET and can be accessed at Forex factory here. An in-depth review of the latest CPI data release can be accessed at the BLS website.
The image below shows the most recent changes in the MoM CPI in the US. In July 2020, the US CPI changed by 0.6%, the same increase as that of June.
Now, let’s see how this release made an impact on the Forex price charts.
EUR/USD: Before Monthly CPI Release on August 12, 2020,
Just Before 8.30 AM ET
From the above 15-minute chart of the EUR/USD, the pair can be seen to be on a steady uptrend before the CPI data release. The 20-period MA in steeply rising with candles forming above it.
EUR/USD: After Monthly CPI Release on August 12, 2020,
8.30 AM ET
After the data release, the pair formed a long 15-minute bullish candle indicating that the news release negatively impacted the USD. The pair subsequently continued trading in the previously observed uptrend.
AUD/USD: Before Monthly CPI Release on August 12, 2020,
Just Before 8.30 AM ET
The AUD/USD pair traded in a subdued uptrend before the data release. The 15-minute candles are forming just around an almost flattening 20-period MA.
AUD/USD: After Monthly CPI Release on August 12, 2020,
8.30 AM ET
Like the EUR/USD pair, the AUD/USD formed a long bullish 15-minute candle after the news release. Afterwards, the 20-period MA steeply rises as the pair adopted a steady uptrend.
NZD/USD: Before Monthly CPI Release on August 12, 2020,
Just Before 8.30 AM ET
NZD/USD: After Monthly CPI Release on August 12, 2020,
8.30 AM ET
Before the data release, the NZD/USD pair traded within a neutral pattern with the 15-minute candles crisscrossing an almost flattening 20-period MA. As observed with the other pairs, the NZD/USD formed a long 15-minute bullish candle after the news release. It subsequently traded in a steady uptrend with the 20-period MA steeply rising.
Bottom Line
In theory, an increasing rate of CPI should be a strong USD, but as observed in the above analyses, a high CPI resulted in a weakening USD. The CPI is often considered a leading indicator for interest rate; hence, a rising CPI is accompanied by a rising interest rate. However, since the US Fed had already indicated that it has no intention of increasing the interest rate, a high CPI implies a depreciating USD. It is, therefore, imperative that forex traders have the Fed’s decision in mind while trading with CPI data.
Before the Service sector dominated the Industrial sector as a significant contributor to the GDP, it was the industrial production alone that was seen as a measure of economic growth. It still holds for many developing economies. Economies like China, Japan, India, etc. all had significant industrial revolutions that helped their countries to improve their economy. The industrial sector still contributes a considerable percentage to the economy and employs millions of people.
What is Industrial Production MoM?
Industrial Production: It refers to the total output produced by the industrial sector. Here the industrial sector consists of the mining, manufacturing, electric, and gas utility sectors. It is like a mini-GDP report for the industrial sector. By definition, it must be apparent that it primarily deals with tangible commodities or physical goods. On the other hand, The Service sector comprises of non-tangible entities largely.
The Industrial Production Index goes as back as 1919 if required, and is published by the Board of Governors of the Federal Reserve System in the United States. The extended time-frame availability of data makes it a more robust, reliable economic indicator as more data points are available relative to other sectors.
The data is aggregated by combining data in different units. Some of the data may be in dollar terms, some may be in tonnes (e.g., the weight of barrels of oils and steel), or inferred by the number of hours worked. The logged-in hours are obtained from the Bureau of Labor Statistics. It is expressed as a percentage of real output relative to a base period. The base year is currently 2012. The methodology incorporated to calculate the Industrial Production is the Fisher Ideal Index, where the contribution of each sector is weighted (the higher the contribution, the higher is the weightage in the index calculation).
Industrial Production Indices comes in YoY and MoM versions comparing production size with the previous year and month, respectively. The YoY figures deem more use to analysts and government officials to analyze the performance of the industrial sector for this financial year. The MoM (Month over Month) figures are useful for closely monitoring for the expected uptrends or downtrends during business cycles. The MoM figures are more useful for investors in this regard.
How can the Industrial Production MoM numbers be used for analysis?
We have to understand the significance of this statistic historically. Before the development of the service sector, i.e., before the era of computers and the internet, the most industrialized countries were the most advanced economies. Countries that had many factories manufacturing tons of commodities were seen as highly advanced economies back in the day. Hence, it is no surprise that at such times the Industrial Production figures were a direct measure for the economy’s economic activity and growth.
The general trend in economic growth has been that underdeveloped economies have the primary sector as a significant contributor to the GDP. The developing economies have the secondary sector (industrial sector) as the primary contributor to the GDP, while the developed economies have the tertiary (or service) sector.
For the United States, the Industrial Sector now contributes less than 20% to the overall GDP, while more than 80% comes from the Service sector itself. Although it may sound like only 20%, it is only in comparison, but individually the industrial sector is in itself huge and employs millions of people. 15-20% is still a significant contribution, and that is the reason why it is still being published as well as analyzed by investors, traders, analysts frequently to infer significant economic conclusions.
With machine automation, the advancement of technologies, and the introduction of artificial intelligence, many traditional jobs in the industrial sector are getting replaced. This trend is likely to continue further down the line. As of now, the Industrial Production figures bear some relevance, though it is only a matter of time that its contribution further falls and is overlooked by investors and analysts.
The industrial sector is more sensitive to business cycles as well as economic shocks, as evident from the historical plot. The current COVID-19 pandemic has had a more significant impact on the industrial sector than the service sector due to the nature of business.
Impact on Currency
Since the Industrial Production figures only account for a few sectors of the economy, hence it is not a macroeconomic indicator encompassing all industries into its statistics. For this reason, the relative significance of this indicator in the currency markets is less. Whereas, investors looking to invest in stocks of companies belonging to the Industrial sector use Industrial Production MoM figures to make investment decisions. Overall, it is a low-impact coincident indicator that bears no significant volatility in the currency markets but has a significant influence on the equity markets.
Economic Reports
The Board of Governors of the Federal Reserve System publishes reports of the Industrial Production statistics as part of its monthly “G.17 Industrial Production and Capacity Utilization” report on its official website. It is released around the 15th of the month for the previous month. It is a preliminary estimate and is annotated with a superscript ‘p’ in the tables. It is subject to revision in the subsequent five months as more data becomes available. The report details both seasonally adjusted and unadjusted versions for our convenience.
Sources of Industrial Production MoM
The Federal Reserve publishes Industrial Production MoM reports on its official website. The same statistics are available with more tools for analysis on the St. Louis FRED website. Similar Industrial Production MoM statistics for most countries is available on the Trading Economics website.
How the Monthly Industrial Production Data Release Affects The Price Charts
In the US, the monthly industrial production data is released by the Federal Reserve about 16 days after the month ends. It measures the change in the total inflation-adjusted value of output produced by manufacturers, mines, and utilities. The most recent data was released on August 14, 2020, at 9.15 AM ET and can be accessed at Investing.com here. An in-depth review of the industrial production data release can be accessed at the Federal Reserve website.
The screengrab below is of the monthly industrial production from Investing.com.
As can be seen, the industrial production data is expected to have a low impact on the USD upon its release.
The screenshot below represents the most recent changes in the monthly industrial production in the US. In July 2020, the US industrial production increased by 3% down from a 5.7% increase in June. This change was in line with analysts’ expectations of a 3% change. Therefore, this is expected to be positive for the USD.
Now, let’s see how this release made an impact on the Forex price charts.
EUR/USD: Before the Monthly Industrial Production Data Release
on August 14, 2020, Just Before 9.15 AM ET
Before the data release, the EUR/USD pair was trading in a renewed uptrend with the 15-minute candles forming above a steadily rising 20-period Moving Average. This pattern indicates that the USD was weakening against the EUR.
EUR/USD: After the Monthly Industrial Production Data Release
on August 14, 2020, at 9.15 AM ET
As expected, the pair formed a 15-minute bearish candle after the data release indicating a momentary strength in the USD. The data was, however, was not significant enough to bring forth a change in the trading pattern. The pair continued trading in the earlier observed uptrend with the 20-period Moving Average steadily rising.
NZD/USD: Before the Monthly Industrial Production Data Release
on August 14, 2020, Just Before 9.15 AM ET
Similar to the trend observed with the EUR/USD pair, the NZD/USD was trading in an uptrend before the data release. The 20-period Moving Average can be seen to be steadily rising in the above 15-minute chart.
NZD/USD: After the Monthly Industrial Production Data Release
on August 14, 2020, at 9.15 AM ET
After the data release, the pair formed a 15-minute bearish candle. As observed with the EUR/USD pair, NZD/USD continued trading in the earlier observed uptrend with the 20-period Moving Average steeply rising.
AUD/USD: Before the Monthly Industrial Production Data Release
on August 14, 2020, Just Before 9.15 AM ET
AUD/USD: After the Monthly Industrial Production Data Release
on August 14, 2020, at 9.15 AM ET
Before the data release, the AUD/USD pair was trading in a similar uptrend pattern as the EUR/USD and NZD/USD pairs. After the data release, the pair formed a 15-minute bearish candle and subsequently continued trading in the earlier observed uptrend similar to the other pairs.
Bottom Line
The monthly US industrial production data an important leading indicator of the economy’s health. From this analysis, however, while the data release affects the USD, it is not significant enough to cause a shift in the prevailing market trend.
Last week, in one of our lessons, we showed an example of how the price gets bullish based on the double bottom and flipped support. In today’s lesson, we are going to demonstrate an example of a double top and flipped resistance. a Double Top is the opposite of a Double Bottom, so it drives the price towards the South. It is one of the strongest bearish reversal patterns. Traders love to go short when a chart produces a double top in the Forex market. Let us now proceed and find out how it usually works.
Last week, in one of our lessons, we showed an example of how the price gets bullish based on the double bottom and flipped support. In today’s lesson, we are going to demonstrate an example of a double top and flipped resistance. a Double Top is the opposite of a Double Bottom, so it drives the price towards the South. It is one of the strongest bearish reversal patterns. Traders love to go short when a chart produces a double top in the Forex market. Let us now proceed and find out how it usually works.
Last week, in one of our lessons, we showed an example of how the price gets bullish based on the double bottom and flipped support. In today’s lesson, we are going to demonstrate an example of a double top and flipped resistance. a Double Top is the opposite of a Double Bottom, so it drives the price towards the South. It is one of the strongest bearish reversal patterns. Traders love to go short when a chart produces a double top in the Forex market. Let us now proceed and find out how it usually works.
The chart shows that the price heads towards the North and finds its resistance. It produces a bearish engulfing candle. Sellers on the minor chart may look to go short in the chart. However, the sellers in this chart may wait for either the price consolidates and makes a bearish breakout or to produce a double top.
The price finds its support and heads towards the level of resistance again. It consolidates around the level of resistance. A bearish reversal candle followed by a breakout at the last support may attract the sellers to go short in the pair since the chart would produce a double top, and the breakout would be a neckline breakout.
Here it goes. The price heads towards the South with good bearish momentum. It makes a breakout at the neckline and produces one more bearish candle. The sellers are going to wait to go short in the pair below the lowest low. However, it is best to wait for the price to consolidate around the breakout level and produce a bearish reversal candle to get a better risk-reward.
The price consolidates around the breakout level and produces a bearish engulfing candle at the breakout level. The sellers may go short below consolidation’s support by setting stop-loss above consolidation’s resistance and by setting a take-profit target with 1R at least. Please note, a double bottom/double top and consolidation around the neckline breakout level usually offers more than 1R. Let us find out how the trade goes.
The price heads towards the downside with extreme bearish momentum. It produces an inverted hammer. The price may make a bullish correction from here. Count the length that the price has traveled so far. It has traveled a long way offering about 6R to the sellers. One trade like this in a week may make a trader fulfilled. Thus, keep your eyes on patterns such as the Double Top/Double Bottom. Remember the procedure; wait for the price to consolidate and produce a reversal candle at the breakout level; trigger an entry below consolidation support/resistance, and manage your trade accordingly.
Seasoned forex traders will tell you that there are several mistakes that can keep you from making money, or that could even cause you to lose your investment altogether. For the aspiring trader, the thought of losing hard-earned money on an investment that was meant to help secure their future is a daunting thought. Fortunately, […]
Seasoned forex traders will tell you that there are several mistakes that can keep you from making money, or that could even cause you to lose your investment altogether. For the aspiring trader, the thought of losing hard-earned money on an investment that was meant to help secure their future is a daunting thought. Fortunately, […]
Seasoned forex traders will tell you that there are several mistakes that can keep you from making money, or that could even cause you to lose your investment altogether. For the aspiring trader, the thought of losing hard-earned money on an investment that was meant to help secure their future is a daunting thought. Fortunately, many professional traders have learned about these costly mistakes the hard way – meaning that you don’t have to. Take a look at our list of big mistakes that will hurt your wallet below.
Mistake #1: Trading Without an Education
If you have a sudden whim to open a trading account, you’ll find that it can be done fairly easy so long as you have a device with an internet connection, you’re 18 years or older, and you have at least $10 or so. This is actually the most common trading mistake that beginners make, as it is quite possible to rush into opening your trading account without any real knowledge. Those that make this mistake learn fairly quickly that without knowledge of what affects the market, risk-management, different strategies and plans, trading mechanics, and other subjects, success is impossible to come by. If you want to become a trader, avoid making this number #1 mistake and spend some time educating yourself first by taking advantage of free resources online.
Mistake #2: Risking Too Much
With gambling, the idea of risk is fairly simple; the more you risk, the more you stand to gain. It’s easy to carry this mindset over to trading, but that doesn’t mean you should think this way. The truth is that risking too much (think 5% or more) on any one trade is a quick way to lose it all, especially if you don’t have much experience. Even if you feel as though you’re on a “winning streak”, experts recommend limiting the risk you take to 1% or 2% of your total account balance. Think $1 or $2 for every $100 in your trading account. Another pro tip is to actually base this percentage on the amount you’re willing to lose for each single trade, rather than basing it off your total account balance.
Mistake #3: Being Emotional
Those that haven’t read about the psychology behind trading emotions are usually blind to how much of a role emotion can actually play on trading decisions. There’s really a lot to get into when it comes to the subject, but here are a few examples to paint a general idea:
Anxiety can lead traders to spend too much time thinking before entering a trade, causing the trader to enter the trade too late or not at all.
Traders that have experienced a large loss or multiple losses in a row might become fearful of making any trading moves, even if they have information that supports the moves they want to make.
A trader that has made a lot of money or who has experienced multiple wins in a row can become overconfident, which leads to overtrading or making decisions that are based on little fact because one feels they are on a “winning streak”.
If one is trading out of revenge, they are likely to make decisions that are quick and not well-thought-out out of the urgency to make a profit.
If you aren’t familiar with trading psychology, you should really dive deeper into the above subjects. If you’re already trading, you might want to think about the emotions that you feel while trading, as this can affect the way you make decisions and lead to a loss of money.
Mistake #4: Believing in Magic Answers
When we refer to magic answers, we’re actually talking about automated trading robots or signals that are advertised to be 100% successful. To be clear, a trading robot trades on your behalf, while a signal is a short message that gives you information about a trade you should enter. Don’t take this as a sign that there aren’t working signals and robots out there, however, you should know that 100% success rates cannot be guaranteed. Spend time researching the developers behind these products and reading user reviews before spending your money on them, and always keep an eye on those results.
Mistake #5: Choosing the Wrong Broker
Choosing a broker is a task that deserves a lot of thought. After all, there’s a lot to think about. What types of fees are charged? What account types are available? Is the customer service up to par? If you choose the wrong broker, you’re going to face a plethora of problems down the road. You’ll likely pay insane fees that eat into your profits, spend a lot of time trying to get in touch with customer service if you have a problem, experience delays with your withdrawals, be stuck with a lackluster trading platform – should we go on? Any of these problems could be a nightmare, so be sure to put in the effort to ensure that you’re choosing the best broker possible.
Analysis paralysis is a common anxiety experienced by many forex traders. Traders need to act quickly, but those suffering from this condition tend to over-analyze data, which can result in missed opportunities. In some cases, traders don’t even manage to enter trades because they are too overwhelmed by data and put off the decision for […]
Analysis paralysis is a common anxiety experienced by many forex traders. Traders need to act quickly, but those suffering from this condition tend to over-analyze data, which can result in missed opportunities. In some cases, traders don’t even manage to enter trades because they are too overwhelmed by data and put off the decision for […]
Analysis paralysis is a common anxiety experienced by many forex traders. Traders need to act quickly, but those suffering from this condition tend to over-analyze data, which can result in missed opportunities. In some cases, traders don’t even manage to enter trades because they are too overwhelmed by data and put off the decision for far too long. Having too many indicators on your chart contributes to this problem because they can give off too many signals, which results in a ton of information. Traders then prolong their decision because of the overwhelming amount of information and uncertainty about which signals should be trusted. At this point, the trader either spends too much time analyzing that data, to the point that they enter the trade past a favorable point, or they don’t enter a position at all because it is so late. This problem leads many traders to give up on Forex trading for good.
If you’re suffering from this problem and looking to overcome it, we can help. First, you’ll need to understand that this problem is likely to be caused by information overload and can affect anyone. We always want to make the best decision and the thought of having more choices seems appealing since more choices should mean better decisions. This isn’t exactly the case, however. Limiting the number of indicators one uses can make it easier to analyze the data and make a quicker decision. Think quantity over quality here. Some professionals even recommend naked trading at first, which means trading without indicators.
Another thing to remember is that every trading decision shouldn’t (or can’t) be perfect. If you spend too much time looking at data and never make a trade, then you won’t ever make a profit. Try giving yourself a time limit to help yourself make a faster decision. Also, remember that not deciding is a decision itself. If you don’t enter the position, you’ve chosen not to make a trade. This might indicate that you aren’t confident enough in the position you were about to enter. Perhaps this is a sign that you need to do more research or tweak your trading plan so that you will feel more reassured.
Having a trading plan will help you to see your goals and what you need to be looking for more quickly. It can also help you to filter out which indicators you actually need to de-clutter your charts. Knowing what you’re looking for will help you avoid falling victim to the dreaded analysis paralysis that affects so many traders. A simpler plan can also help with this, as having fewer components to analyze will lead to faster decisions.
Analysis paralysis has involvement with trading psychology. Emotions affect the way that we make trading decisions, and analysis paralysis certainly branches from anxiety. This is a real problem that stops traders from making decisions in time, or altogether. However, we have hopefully outlined some helpful points that can help traders to overcome this problem. You’ll need to come up with a good, simplified trading plan that you’re confident in first. Then, try to limit the number of indicators you’re using on your charts so that you don’t have as much information to analyze. Remember that trading is risky and decisions can’t be perfect. Educating yourself and following these steps will set you up with the best chance of success and should help avoid the anxiety associated with analysis paralysis.
Once completed the optimization process of a trading system, the developer could develop an advanced strategy optimization method, the walk-forward analysis. In this educational article, we will introduce the basic concepts of this methodology.
What is Walk-Forward Analysis?
The Walk-Forward Analysis (WFA) is an advanced method for testing, validating, and optimizing a trading strategy, by measuring its performance using out-of-sample results. The WFA attempts to achieve the three objectives identified as follows.
Determine if the trading strategy continues being profitable using unseen or out-of-sample price history.
Find out the optimal values of the parameters to be used in real-time trading.
Delimit the optimization window size and the period at which the system should be reoptimized.
Measuring the Robustness of a Trading System
A robust trading system is profitable, even when the actual market conditions change. These profits tend to be consistent, with the results obtained in the historical simulation stage. In other words, a walk-forward analysis allows the system’s developer to determine if the trading strategy can produce real-time profits.
The system’s developer is able to compute the robustness of a trading strategy using a statistical criterion called Walk-Forward Efficiency (WFE) ratio, which measures the current optimization process’s quality.
The WFE ratio is computed by the out-of-sample annualized rates of return divided by the in-sample returns. A robust trading strategy should achieve reliable performance, both in-sample and out-of-sample data. A 100% ratio would indicate that the out-of-sample figures match exactly the returns obtained with the backtests. That would indicate the system is sound and reliable. Pardo, in his book The Evaluation and Optimization of Trading Strategies, comments that “robust trading strategies have WFEs greater than 50 or 60 percent and in the case of extremely robust strategies, even higher.” A WFE ratio below 50% would indicate poor performance. Finally, ratios over 100% are suspicious, and the system should be analyzed to discover the reason for this behavior.
WFA and Overfitting
Overfitting is a condition resulting from an excessive readjustment of the strategy’s parameters aimed at artificially improve its performance. An overfitted strategy is likely to lose money in real-time trading, even when a historical simulation would present terrific gains.
By its nature, a walk-forward analysis is a cure for overfitting abuse. This edge comes from the fact that the WFA evaluates the strategy’s performance using data not belonging to the optimization process.
By using WFA, the developer is certain about the robustness of a trading strategy. In other words, a not too robust trading strategy would not pass a walk-forward analysis.
Considering that a large number of samples increase the statistical validity and confidence, it is unlikely that an unprofitable trading strategy would make significant profits using a large number of samples. Consequently, a poor trading strategy delivering gains could be the product of chance.
Conclusions
The Walk-Forward Analysis (WFA) is a powerful tool for testing, validating, and measure the quality of a trading strategy, which is characterized by the use of out-of-sample data to evaluate its performance. In this educational article, we have presented the advantages of using WFA to evaluate the strategy’s robustness and how WFA can help the developer avoid overfitting, increasing confidence through an objective statistical measure.
In the next educational post, we will continue reviewing the benefits of using the walk-forward analysis and setting up the walk-forward analysis.
Suggested Readings
Jaekle, U., Tomasini, E.; Trading Systems: A New Approach to System Development and Portfolio Optimisation; Harriman House Ltd.; 1st Edition (2009).
Pardo, R.; The Evaluation and Optimization of Trading Strategies; John Wiley & Sons; 2nd Edition (2008).
Each and every Forex trader needs to not only create a trading plan and select his or her strategies but also need to prepare a money management plan, select a broker, and more. Answer these self-assessment questions to ensure that you’re on the right track. Question #1: How Much Do I Want to Risk? The […]
Each and every Forex trader needs to not only create a trading plan and select his or her strategies but also need to prepare a money management plan, select a broker, and more. Answer these self-assessment questions to ensure that you’re on the right track. Question #1: How Much Do I Want to Risk? The […]
Each and every Forex trader needs to not only create a trading plan and select his or her strategies but also need to prepare a money management plan, select a broker, and more. Answer these self-assessment questions to ensure that you’re on the right track.
Question #1: How Much Do I Want to Risk?
The amount of money that you’re willing to risk when trading might vary from one trade to the next, however, many professionals keep their risk percentage to 1-2% of their account balance per trade. Some might suggest basing how much you risk by looking at how much money is actually involved, although this comes down to personal preference. Risking too much can lead to a blown account balance, so be sure to give this one a lot of thought.
Question #2: Did I Choose the Right Broker?
You’ll probably form an opinion of your broker soon after opening an account. Once you need to chat with customer service about possible issues or with questions, test out the broker’s chosen platform, get a look at their fees in real action, and gain insight into any difficult policies you will either feel satisfied with your choice or feeling as if you could do better. If you think you’ve chosen a bad broker, you might want to withdraw your funds and go with another option. Of course, this is something you’ll need to seriously think about.
Question #3: Am I Really Ready to Start Trading?
If you haven’t been trading for long or haven’t started, you should definitely ask yourself whether you’re really ready. If you’ve already opened a trading account, you know whether you’re making or losing money. If you’re only considering opening one, you might not be sure if you’re ready. A few good ways to test this before risking any real money would be taking forex trading quizzes that test your knowledge or gaining hands-on practice through a demo account.
Question #4: What Are My Goals?
Sure, making money probably seems like the biggest goal for a forex trader, but you need to start with smaller, more defined goals. Remember that it isn’t all about getting rich. For example, a noteworthy goal would be to make more money than you lose, rather than to become rich. To grow as a trader and to bring in slightly more profits each month would be another good example. If you set goals like these, you’ll feel more accomplished as you meet them.
Question #5: Do I Have a Plan?
A trading plan is one of the first things a trader should develop because they provide a general outline of goals, risk tolerance, and a host of other things that should be taken into consideration. If you started trading without a plan, don’t worry – it’s never too late to come up with one. Still, it’s important to put this plan together as soon as possible and to actually follow it while trading, rather than forgetting about it.
The ease with which money can be obtained within a country primarily drives the business sector and consumer spending. Consumer Spending and Businesses mostly make up the GDP of a country. Hence, understanding Lending Rates and its impact on the economy can help us build our fundamental analysis better.
What is Lending Rate?
Lending Rate: The rate at which a bank or a financial institution charges its customers for lending money. It is the fee that is to be paid by the customer for the borrowed money. Bank Lending Rate, in general, is the Bank Prime Rate.
Bank Prime Rate: It is the rate of interest that banks charge their most creditworthy customers. It is the lowest interest rate at which banks generally gives out loans. On the receiving end usually are large corporations with a good track record with the concerned bank. Generally, the loans taken are also huge.
Other forms of loans like house mortgage, vehicle loans, or personal loans, are all either partly or wholly based on the prime rate. It is also important to note that the Central Bank’s interest rates set the bank lending rate. For the United States, the Federal Reserve’s, the Federal Open Market Committee (FOMC) determines the target fed funds rate. Fed funds rate will ultimately influence all the Bank lending rates on account of competition.
How can the Lending Rate numbers be used for analysis?
Banks and financial institutions are the primary source of money for businesses and consumers across the country. Hence, Bank Lending Rates can mainly drive business direction and influence consumer spending.
The Central Banks will influence the interest rates through their open-market operations in the inter-bank market by purchasing or selling bonds. When Central Banks buy bonds, they inject money into the economy, thereby effectively inducing inflation. It is popularly referred to as the “Dovish” approach. When the Central Bank sells bonds, it is effectively withdrawing money from the economy, making money scarce and costly to borrow. It is popularly referred to as the “Hawkish” approach.
When the Central Bank wants to deflate the economy, they will sell bonds, and when they decide to inflate, they will effectively buy bonds. In the private sector, Consumer Spending makes up about two-thirds of the United States’ GDP, and the rest is mostly by the business sector. The ease with which money is made available to people and business organisations affects the economy in a big way.
When lending rates are low, businesses can procure loans easily; they can run, maintain, and expand their current businesses. On the other hand, when the lending rates are high, only the high-end companies can procure loans. Meanwhile the rest of the business struggle to stay afloat in the deflationary environment. Businesses would be forced to keep their expansionary plans on halt when loan rates are high.
Consumers are also encouraged to take on loans when the rates are low. It promotes consumer spending, which, in turn, boosts local business. On the other hand, when interest rates are high, consumers would tend to save more spend less. When spending is less, businesses also slow down, especially sectors that do business with non-essentials like entertainment, luxury, or recreation.
On the international scale, the lending rates and deposit rates of banks from different countries also drive the flow of speculative money from international investors. When the lending rate in one country’s bank is lower than the deposit rate in another country’s bank, investors can generate revenue through a “carry.” Investors will borrow from the low-yielding currency bank and deposit in the high-yielding currency bank. The difference between these two rates is the margin they make.
The above plot shows the actual plot between the interest rates differential (AUS IR – USA IR) and the AUD USD exchange rate. As we can see, whenever the difference between the interest rates rises in favour of AUD, the exchange rate tends to follow. There is a strong correlation between both in the long run.
Since the Central Bank’s interest rates primarily determine all the lending rates (all types), investors generally calculate interest rate differentials by subtracting interest rates of two countries to see potential “carry” opportunities. Hence, when low-interest rates are prevalent, currencies lose value, on account of inflation and also outflow of money into other countries where deposit rates are higher.
Overall, the lending rates and deposit rates together move the currency markets in favour of the country’s currency, having higher deposit rates.
Impact on Currency
The underlying Central Bank interest rates influence lending rates. The market is more sensitive to Central Bank interest rate changes than the bank lending rates. The lending rates of banks are also not as immediate as the Central Bank’s interest rate changes. Hence, although lending rates impact the economy, its effects are only apparent after about 10-12 months.
Hence, Lending rates are a low-medium impact indicator in the currency markets, as the leading indicator Central Bank interest rates take precedence over bank lending and deposit rates.
Economic Reports
The lending rates of banks can be found from the respective banks from which we would want to borrow money. For the United States, the Federal Reserve publishes Monday to Friday the daily Interest Rates in its H.15 report at 4:15 PM on its official website. Weekly, Monthly, Semi-annual, and Annual rates of the same are also available. The average Bank Prime Rates are also available in the same report.
Sources of Lending Rate
The United States Fed Fund Rates are available here. The prim Bank Loan Rate is available in a more consolidated and illustrative way for our analysis in the St. Louis FRED website. Consolidated Bank Lending Interest Rates of different countries are available here.
How Lending Rates Affects Price Charts
The lending rates can either create expansionary or contractionary effects within an economy. Let’s now have a look at how it affects the price action in the forex market. In the US, lending rates entirely depend on the Federal Reserve’s Fund Rate. On March 4, 2020, the lending rates were cut from 4.75% to 4.25%. This cut coincided with the Federal Reserves’ interest rate cut from 1.75% to 1.25% on March 3.
On March 16, 2020, the lending rates were reduced from 4.25% to 3.25%. This cut coincided with the Federal Reserves’ interest rate cut from 1.25% to 0.25% on March 15.
For this reason, the lending rates rarely affect the price action in the forex markets.
In the US, the Bank Prime rate is published every weekday at 4.15 PM ET. Below is a screengrab from the US Federal Reserve showing the latest bank prime rates.
As can be seen, the rate has remained at 3.25% from March 16, 2020. For this analysis, we will consider if the change on March 16, 4.15 PM ET from 4.25% to 3.25% had any effect on the price action of selected currency pairs.
EUR/USD: Before Lending Rate Change on March 16, 2020,
Just Before 4.15 PM ET
Between 10.00 AM and 4.00 PM ET, the EUR/USD pair was on a neutral trend. This neutral trend is shown on the 15-minute chart above with bullish and bearish candles forming slightly above the flattening 20-period Moving Average.
EUR/USD: After Lending Rate Change on March 16,
2020, 4.15 PM ET
As shown by the chart above, the EUR/USD pair formed a slightly bullish 15-minute candle after the daily release of the lending rates. As earlier mentioned, the release of the lending rates is not expected to have any significant impact on the price action. This sentiment is further supported by the lack of change in the prevailing trend after the news release since the pair continued trading on a neutral stance.
GBP/USD: Before Lending Rate Change on March 16, 2020,
Just Before 4.15 PM ET
The GBP/USD pair showed a similar neutral trading pattern as the EUR/USD pair between 1.00 PM and 4.00 PM ET. This pattern can be seen on the above 15-minute chart with candles forming on the flat 20-period Moving Average.
GBP/USD: After Lending Rate Change on March 16,
2020, 4.15 PM ET
After the news release, the pair formed a slightly bearish 15-minute candle but continued trading in the earlier neutral trend.
NZD/USD: Before Lending Rate Change on March 16, 2020,
Just Before 4.15 PM ET
NZD/USD: After Lending Rate Change on March 16,
2020, 4.15 PM ET
Unlike the EUR/USD and the GBP/USD pairs, the NZD/USD pair had a steady downtrend between 12.15 PM and 4.00 PM ET. After the release of the daily lending rates, the pair formed a bullish 15-minute candle, but just like the other pairs, the news was not significant enough to change the prevailing market trend.
As we noticed earlier, the lending rates move in tandem with the Federal funds rate. Since the lending rates have always remained unchanged in the market and forex traders have anticipated this, hence the lack of volatility accompanying the news release.
We are going to demonstrate an example of trendline trading in today’s lesson. The price, after being bearish, produces a bullish engulfing candle and heads towards the North. It makes a bearish correction and produces another bullish candle to make a bullish breakout at the last swing high. At the second bounce, the candles have tiny lower shadows. In the end, the pair makes another bullish move at the trendline’s support without counting those lower shadows at the second bounce. Let us now have a look at what and how that happens.
We are going to demonstrate an example of trendline trading in today’s lesson. The price, after being bearish, produces a bullish engulfing candle and heads towards the North. It makes a bearish correction and produces another bullish candle to make a bullish breakout at the last swing high. At the second bounce, the candles have tiny lower shadows. In the end, the pair makes another bullish move at the trendline’s support without counting those lower shadows at the second bounce. Let us now have a look at what and how that happens.
We are going to demonstrate an example of trendline trading in today’s lesson. The price, after being bearish, produces a bullish engulfing candle and heads towards the North. It makes a bearish correction and produces another bullish candle to make a bullish breakout at the last swing high. At the second bounce, the candles have tiny lower shadows. In the end, the pair makes another bullish move at the trendline’s support without counting those lower shadows at the second bounce. Let us now have a look at what and how that happens.
The price makes a bearish move makes a bullish correction and resumes its bearish journey. Upon finding its support, it produces a bullish engulfing candle at the last bounce in this chart. The chart is slightly bearish biased. Let us see what happens next.
The chart produces another bullish candle, consolidates, and heads towards the North. Then, it makes a bearish correction. A bullish reversal candle followed by a breakout at the highest high will make the chart a hunting ground for the buyers.
The chart produces a bullish engulfing candle and makes a breakout at the last swing high. It means the buyers may draw a trendline and wait for the price to come back at the trendline’s support to go long in the pair.
This is the drawn trendline, which is drawn by using the first two spikes. However, spikes at the second bounce are not counted. After the second bounce, the price heads towards the North, but it doesn’t come at the trendline’ support to offer a long entry to the buyers. As long as the price does not breach the trendline support, it is valid, and traders may wait for the price to come back at the trendline’s support and offer them a long entry.
Here it comes. The chart produces a bullish engulfing candle right at the trendline’s support. The buyers may go long right after the last candle closes by setting stop loss below the signal candle’s lowest low and by setting take profit with 1R. Let us find out how the trade goes.
The price hits 1R in a hurry. It then produces a spinning top. However, the next candle comes out as a bullish engulfing candle, which suggests that the buyers may wait again for the price to come back at trendline’s support to take another long entry.
If we use spikes of the second bounce, the trendline’s support would have more space for the price to travel. We have used spikes of the first bounce and candle’s bodies of the second bounce. Since both spikes of the second bounce cannot be added with a line, it is better to skip it. Moreover, the price at the third bounce produces a bullish engulfing candle. Most probably, the price is going to obey the trendline. This is what happens here, and this is what usually happens with a trendline.
Households Debt to Income is another metric that is used to assess the relative wealth and standard of living of people in the nation. It can give us hints on the spending patterns and circulation of currency and liquidity of the nation overall. Hence, Households Debt to Income ratio is beneficial for economists, investors, and also to deepen our foundation in fundamental analysis.
What is Households Debt to Income?
Debt-to-Income (DTI): The DTI is an individual financial measure that is defined as the ratio of total monthly debt payments to his monthly gross income.
Gross income refers to the income received from the employer or workplace and does not include any of the tax deductions.
The DTI is calculated using the below-given formula.
Disposable Personal Income (DPI): Disposable Personal Income, also called After-Tax Income, is the remainder of an individual’s income after all federal tax deductions. Hence, It is the amount people are able to spend, save, or invest.
Household Debt Service Ratio and Financial Obligations Ratio: The household Debt Service Ratio (DSR) is the ratio of total household debt payments to Disposable Personal Income (DPI).
Mortgage DSR: It is the total quarterly required mortgage payments divided by total quarterly Disposable Personal Income.
Consumer DSR: It is the ratio of aggregate quarterly scheduled consumer debt payments to total quarterly Disposable Personal Income (DPI). The Mortgage DSR and the Consumer DSR together form the DSR.
Financial Obligations Ratio: It is a broader measure than the Debt Service Ratio (DSR) as it takes into account rent payments, auto lease deductions, house owners’ insurance, and property tax.
How can the Households Debt to Income numbers be used for analysis?
DTI is a personal financial metric that is used by banks to determine the individual’s credit eligibility. A DTI ratio should be no more than 43% to be eligible for mortgage credit, but most banks prefer 36% as a healthy DTI ratio to lend money.
The household Debt Service Ratio & Financial Obligations Ratio is more useful, and large scale public data releases for fundamental analysis. The proportion of income that goes into servicing debt payments determines Discretionary Income, Personal Savings, and Personal Consumption Expenditures. Higher the Households Debt to Income ratio, the lesser the money available for other needs.
The Households Debt to Income measures the degree of indebtedness of Households, or in other words, it measures the burden of debt on Households people. The higher the numbers, the greater the load and lesser freedom to spend on other things. As debt burden increases, Discretionary Spending (i.e., for personal enjoyment) decreases, and the income is used entirely to meet the necessities only.
An increase in DPI or decrease in debt payment (by foreclosure or servicing all installments at once) is the two ways to reduce the Debt to Income percentage.
The Households Debt to Income is an essential metric for Government and Policymakers as dangerously high levels in these figures is what led to the financial crisis of 2008 in the United States.
Impact on Currency
High Households Debt to Income figure slows down the economy as debt durations are usually serviced for years. Higher numbers also indicate decreased spending as people spend more money to save and to maintain repayments. This cut back on expenditures results in slowing down businesses, especially those based on Discretionary items (ex: Fashion, entertainment, luxury, etc.) take a severe hit. The overall effect would be a lower print of GDP, and in extreme cases, it can result in a recession.
Households Debt to Income is an inverse indicator, meaning lower figures are good for economy and currency. The numbers are released quarterly due to which the statistics are available only four times a year, and the limitations of the data set make it a low impact indicator for traders. It is a long-term indicator and shows more of a long-term trend. It is not capable of reflecting an immediate shift in trends due to which the number’s impact is low on volatility and serves as a useful indicator for long-term investors, economists, and policymakers.
Economic Reports
The Board of Governors of the Federal Reserve System in the United States releases the quarterly DSR and FOR reports on its official website. The data set goes back to 1980.
DSR & FOR Limitations: The limitations of current sources of data make the calculation of the ratio especially tricky. The ideal data set for such an estimate requires payments on every loan held by each household, which is not available, and hence the series is only the best estimate of the debt service ratio faced by households. Nonetheless, this estimate is beneficial over time, as it generates a time series that captures the critical changes in the household debt service burden. The series are revised as better data, or improved methods of estimation become available.
How Households Debt to Income Affects The Price Charts
Within an economy, the household debt to income is vital to indicate the consumption patterns. In the forex market, however, this indicator is not expected to cause any significant impact on the price action. The household debt to income data is released quarterly in the US.
The latest release was on July 17, 2020, at 7.00 AM ET. The screengrab below is from the Federal Reserve website. It shows the latest household debt service and financial obligations ratios in the US.
The debt service ratio for the first quarter of 2020 decreased from 9.7% in the fourth quarter of 2019 to 9.67%. Theoretically, this decline in the debt to income ratio is supposed to be positive for the USD.
Let’s see how this news release made an impact on the Forex price charts.
EUR/USD: Before Households Debt to Income Release on June 17,2020, Just Before 7.00 AM ET
Before the news release of the household debt to income, the EUR/USD pair was trading on a steady downtrend. This trend is evidenced by the 15-minute candles forming below the 20-period Moving Average, as shown in the chart above.
EUR/USD: After Households Debt to Income Release on June 17,2020, 7.00 AM ET
After the news release, the pair formed a bullish 15-minute candle indicating that the USD had weakened. The weakening of the USD is contrary to a bearish expectation since the households’ debt to income had reduced, the USD would be stronger. The pair later continued to trade in the previously observed downtrend.
GBP/USD: Before Households Debt to Income Release on June 17,
2020, Just Before 7.00 AM ET
Before the news release, the GBP/USD pair had been attempting to recover from a short-lived downtrend. This recovery is evidenced by the candles crossing above a flattening 20-period Moving Average.
GBP/USD: After Households Debt to Income Release on June 17,
2020, 7.00 AM ET
After the news release, the pair formed a 15-minute bullish “Doji star” candle. The pair traded within a neutral trend afterward with the 20-period Moving Average flattening. As observed with the EUR/USD pair, GBP/USD did not react accordingly, as theoretically expected, to the positive households’ debt to income data.
AUD/USD: Before Households Debt to Income Release on June 17,
2020, Just Before 7.00 AM ET
AUD/USD: After Households Debt to Income Release on June 17,
2020, 7.00 AM ET
Before the news release, the AUD/USD pair showed a similar trend as the GBP/USD pair attempting to recover from a short-lived downtrend. As can be seen, the 20-period Moving Average has already started flattening before the news release.
After the data release, the AUD/USD pair formed a 15-minute bullish candle. The pair continued trading in a neutral trend with candles forming on a flat 20-period Moving Average.
From the above analyses, the news release of the household to debt income data produced contrary effects on the USD. More so, the indicator’s impact on the currency pairs is negligible.
Fundamental analysts believe that economic, social, and political events influence the forex market. Unlike technical analysis, which involves looking at past data on charts, fundamental analysis focuses on news headlines, economic data reports, and other qualifying factors to predict price movements in the market. This is mostly relevant to stocks but can be used with other instruments. Here are some things that fundamental analysts look at:
Fundamental analysts believe that economic, social, and political events influence the forex market. Unlike technical analysis, which involves looking at past data on charts, fundamental analysis focuses on news headlines, economic data reports, and other qualifying factors to predict price movements in the market. This is mostly relevant to stocks but can be used with other instruments. Here are some things that fundamental analysts look at:
Fundamental analysts believe that economic, social, and political events influence the forex market. Unlike technical analysis, which involves looking at past data on charts, fundamental analysis focuses on news headlines, economic data reports, and other qualifying factors to predict price movements in the market. This is mostly relevant to stocks but can be used with other instruments. Here are some things that fundamental analysts look at:
Economic calendars
News headlines
Unemployment records
Interest rates
Revenues, earnings, future growth, equity return on stocks
The Overall state of the economy
Supply & demand
As you can see, fundamental analysis is based on facts about a company or the economy. These different statistics can give one an idea of how the market is going to perform and whether to invest in a particular stock. The above examples can affect the economy for a country in different ways, for example, supply & demand can tell us whether the country has more imports or exports. Having more imports is not a good sign, as that means the country could go into debt.
This data is usually used to determine a stock value so that one can determine if it is overvalued. Analysts that look at these factors often publish this data for their followers as this gives one an idea of whether the stock has a higher chance of rising in value or falling in price. Where technical analysts study past price data, fundamental analysis is more focused on how current or future events and economic data will influence prices.
It’s important to know that fundamental analysis measures things in two different ways:
-Quantitative measurements can be measured or written in accurate numerical terms.
-Qualitative measurements are based more on characters, such as the size of a company or quantity.
Quantitative fundamentals are simply numbers and revolve around financial statements, revenue, profit, and other factors that can be expressed in accurate number readings. Qualitative measurements are more subjective. These could include brand-name recognition, the performance of a company’s executives, and other factors that cannot be measured as accurately. Most analysts take both types into consideration, rather than only focusing on one because both can tell us important information.
When considering a company, fundamentalists consider their business model, competitive advantages, management principles, and important figures, and their policies. All of these factors can influence the company’s chances of success and the price of their stocks.
If you’re interested in making decisions based on fundamentals, you’ll need to understand all of the driving factors that affect the economy and what influences decisions for companies. Be sure to do further research online to get into more detailed information about the things that fundamental analysts consider so that you can determine what you need to know before investing in an asset.
Trading addiction is a real problem, not unlike alcoholism or gambling addictions. Trading strongly stimulates the reward center in one’s brain and we become addicted to that rush. Trading can cause us to feel a rollercoaster of emotions, including euphoric highs when we win big. Those with a serious problem become addicted to the highs […]
Trading addiction is a real problem, not unlike alcoholism or gambling addictions. Trading strongly stimulates the reward center in one’s brain and we become addicted to that rush. Trading can cause us to feel a rollercoaster of emotions, including euphoric highs when we win big. Those with a serious problem become addicted to the highs […]
Trading addiction is a real problem, not unlike alcoholism or gambling addictions. Trading strongly stimulates the reward center in one’s brain and we become addicted to that rush. Trading can cause us to feel a rollercoaster of emotions, including euphoric highs when we win big. Those with a serious problem become addicted to the highs and lows and find themselves unable to stop. Unfortunately, trading addiction causes some of the same issues that drug addicts or alcoholics face because it can wreck relationships, cost one their job, and it usually leads to financial ruin. The good news is that there are ways to manage this so that trading can be practiced correctly and in a healthy manner.
Are you here because you think you might already be addicted to trading? One of the most common scenarios involves a beginner winning big because they get lucky, then they lose everything and try to win it back. The amateur trader then continues to lose more and more as they try to dig themselves out of the hole they have created, rather than knowing when to walk away. Someone that is addicted goes through financial resources that aren’t meant for trading. By that, we mean that anything you invest in trading should be disposable income. If you’re using grocery or bill money to trade with, it isn’t a good sign.
Borrowing money from others, taking out loans, and selling personal items are other signs that one might be addicted to the rush of trading. People don’t always recognize trading addiction or realize how much it can affect them or their loved ones because it isn’t talked about as often as drug, alcohol, or gambling addictions. Once someone realizes that they have an addiction to trading, they might try to pull themselves out of it on their own. This can lead to disaster.
The best thing to do is to explain your problem to your friends and family so that they can understand how the addiction is affecting you. Those that don’t trade themselves might understand the way you’re feeling and why you’re spending all of your money once you explain this to them face to face. Seeking professional help is your best bet to solving the problem as a professional can help you recognize and overcome the problem.
Professional traders must have self-discipline and they need to be able to sit out when the market isn’t right for trading. Addicted traders need to feel the rush of trading and are more likely to make impulsive decisions, trade at bad times, and wipe out their trading accounts. Once a trader becomes addicted, they need to seek help to keep the problem from affecting their everyday life. This doesn’t mean that you have to give up trading for good, but a professional can help you manage your problem.
For example, you could set aside a certain amount of disposable income for trading from your weekly paycheck and never invest more than that at a time. Or you could mark out certain days of the week where you promise your significant other (or just yourself) that you won’t trade. If you run out of your weekly trading allowance or feel bored on a day where you aren’t supposed to trade, you could read articles and do research to improve your trading education. Or you could trade on a demo account to improve your skills.
Finding healthy alternatives versus investing money and trading constantly will help you to be more in control of your actions. Taking all of these steps can certainly help one to overcome the problems that result from trading addiction.
Capitalist economies achieve economic growth using inflation as the primary fuel. Low and steady inflation rates are essential for achieving target GDP each year. Not all commodities inflate steadily and proportionally. Disproportional inflation amongst different sectors leads to over and underpricing of commodities. Food and Energy are the most basic of necessities in today’s modern society. Understanding how food inflation affects the population and the overall economy will help us better understand the inflation trends and their consequences.
What is Food Inflation?
Inflation is the typical increase in prices of commodities and a decrease in the purchasing power of money over time. Inflation is required to motivate people to work better to be able to afford it. If prices were stagnant, the necessity to grow or earn more would cease, thus halting the growth of a nation on the macro level. When that happens, people will remain in their current financial state and would not progress. Hence, inflation is the “necessary evil” or the required fuel for capitalist countries to achieve economic growth.
Food Inflation refers to the general increase in prices of food commodities. As prices inflate, our current income’s purchasing power erodes. Food and Energy are the necessities for us in this modern society. Although to some extent, Energy can be cut back on to get on with life, we cannot cut back on food.
Food is the fundamental right to every human being. Accessibility and affordability to food and water is a must for every individual regardless of their country. Food inflation monitors the affordability aspect of food within the nation; the consequences associated with it are more intricate than we might anticipate.
How can the Food Inflation numbers be used for analysis?
As people can procure fewer goods for a unit of currency over time, people can either cut back on expenses or earn more to compensate for inflation. Food expenses are mandatory expenditure part of income. High food inflation will take up a more substantial chunk out of the disposable income of individuals leaving less room for discretionary spending.
As the affordability of food decreases due to high food inflation, consumer spending is negatively affected. Consumer Spending is the primary component of GDP accounting for more than two-thirds of the nation’s GDP. In the same case, more people who are working on minimum wages find it more difficult to afford food and would be below the poverty line even when their wages are not.
Political implications would also be severe. The backlash from the public over Government’s inadequacy to control inflation would be severe and, at times, have led to strikes and bans in many countries over the years. The Government at such times faces severe criticism both from the public and the opposition parties and would likely lose the next elections.
Food inflation could also occur due to adverse weather conditions destroying crops, or mismanagement of supply and demand by the authorities, or even politically manipulating supply and demand for profit by local dealers. There have been incidents where supplies of grains were withheld to boost up the prices for better profits artificially.
In developing countries, there are incidents where Government-issued rations are also sold illegally for profit by some corrupt groups. Lack of proper support to farmers in terms of resources like electricity, water, seeds, loans could also impair them to produce a good yield. All such factors add to food inflation, whose burden falls upon the ordinary people.
It is necessary to understand that all other commodities excluding Food and Energy generally have at least some alternatives (or different brands) to choose from in case price inflates. For instance, people looking to buy clothes from a brand may switch to another brand to avoid paying the new inflated price. Food inflation effect cannot be avoided as quickly as was the previous case.
Government officials closely monitor the inflation levels and are politically committed to keeping inflation in check through fiscal and monetary levers at their dispense. Food and Energy prices are given special attention, and almost all the time, the response is quick and practical from the Government during times of disruption in the food supply.
During the COVID-19 pandemic, many countries’ governments released relief packages to make sure there is no food shortage. Despite the fact many people slipped through the cracks of these protection measures, nonetheless, Governments did everything they could to avoid starvation.
Impact on Currency
Food inflation is part of overall consumer inflation. Consumer inflation is the primary macroeconomic indicator for currency traders to assess relative inflation amongst currency pairs. Hence, food inflation is overlooked by currency traders for the broader inflation measures like the Consumer Price Index (CPI) or Personal Consumption Expenditure (PCE).
Nonetheless, food inflation is beneficial for the government officials to keep it in check all the time and also for the economic analysts to report the same. Overall, food inflation is a low-impact coincident indicator in macroeconomic analysis for currency trading that is overlooked for broader inflation measuring statistics, as mentioned before.
Economic Reports
The Bureau of Labor Statistics publishes monthly inflation statistics as part of its Consumer Price Index report for the United States. This report has the food inflation statistics as the first criteria.
The St. Louis FRED also maintains the inflation statistics on its website and has many other tools to add to our analysis.
We can find the same indexes along with many others with a comprehensive summary and statistics on the St. Louis FRED website.
We can find the global food inflation statistics of most countries on Trading Economics.
How Food Inflation Data Release Affects The Price Charts
In the US, the food inflation data is released simultaneously with the overall consumer price index (CPI) data. The data is released monthly about 16 days after the month ends. The most recent release was on August 12, 2020, at 8.30 AM ET and can be accessed at Investing.com here. A more in-depth review of the monthly report can be accessed at the US Bureau of Labor Statistics website.
It is worth noting that since the food inflation numbers are released together with the over CPI, it will be challenging to determine the effect it has on price action.
The screengrab below is of the monthly CPI from Investing.com. On the right, is a legend that indicates the level of impact the Fundamental Indicator has on the USD.
As can be seen, the CPI data is expected to have a medium impact on the USD upon its release.
The screengrab below shows the most recent changes in the monthly CPI data in the US. In July 2020, the monthly CPI increased by 0.6% better than analysts’ expectations of a 0.3% change. This positive change is therefore expected to make the USD stronger compared to other currencies.
Now, let’s see how this release made an impact on the Forex price charts.
EUR/USD: Before Monthly CPI Release on August 12, 2020,
Just Before 8.30 AM ET
As can be seen from the above 15-minute chart, the EUR/USD pair was on a steady uptrend before the inflation news release. Bullish candles are forming above a steeply rising 20-period Moving Average, indicating the dollar was weakening before the release. Immediately before the news release, the uptrend can be seen to be weakening.
EUR/USD: After Monthly CPI Release on August 12,
2020, 8.30 AM ET
After the news release, the pair formed a 15-minute bullish candle. Contrary to the expectations, the USD became weaker against the EUR since the pair continued to trade in the previously observed uptrend.
AUD/USD: Before Monthly CPI Release on August 12, 2020, Just Before 8.30 AM ET
The AUD/USD pair shows a similar trading pattern as the EUR/USD before the inflation news release. The pair is on an uptrend, which heads for a neutral trend immediately before the news release.
AUD/USD: After Monthly CPI Release on August 12, 2020,
8.30 AM ET
As observed with the EUR/USD pair, the AUD/USD formed a bullish 15-minute candle after the news release. Afterward, the pair traded in a renewed uptrend with the 20-period Moving Average steeply rising.
NZD/USD: Before Monthly CPI Release on August 12, 2020,
Just Before 8.30 AM ET
NZD/USD: After Monthly CPI Release on August 12, 2020,
8.30 AM ET
Unlike the EUR/USD and the AUD/USD pairs, the NZD/USD traded within a subdued neutral trend with an observable downtrend immediately before the news release. However, after the news release, the pair formed a 15-minute bullish candle and traded in a steady uptrend, as seen with the other pairs.
Bottom Line
In theory, a positive CPI data should be followed by an appreciating USD. From the above analyses, however, the positive news release resulted in the weakening of the USD. This phenomenon can be choked to the effects of the coronavirus expectations, which have made fundamental indicators less reliable.
In today’s lesson, we are going to demonstrate an example of a double bottom, which pushes the price towards the North. The example also proves an old theory of support becomes resistance or resistance becomes support after a breakout. Let us get started.
In today’s lesson, we are going to demonstrate an example of a double bottom, which pushes the price towards the North. The example also proves an old theory of support becomes resistance or resistance becomes support after a breakout. Let us get started.
In today’s lesson, we are going to demonstrate an example of a double bottom, which pushes the price towards the North. The example also proves an old theory of support becomes resistance or resistance becomes support after a breakout. Let us get started.
The chart shows that the price makes a bearish move and finds its support. The level of support produces a bullish candle, which is followed by two more bullish candles. The buyers may wait for the price to consolidate and produce a bullish reversal candle to go long in the pair.
The price makes a long bearish correction. It comes back to the level of support again. A bearish breakout may attract the sellers to go short and drive the price towards the South. On the other hand, the buyers may wait to get a bullish reversal candle at its second bounce.
The chart produces a bullish engulfing candle. Since it is produced at the second bounce, the buyers in the chart may wait for the price to make a breakout at the neckline and go long.
The price heads towards the North with good bullish momentum. It makes a breakout at the neckline and trades above the level for one more candle. The buyers would love to see the price to consolidate or make a bearish correction at the breakout level and produce a bullish reversal candle to trigger a long entry.
The price makes a bearish correction and produces a bullish engulfing candle closing above the level of resistance. The buyers may trigger a long entry right after the last candle closes by setting Stop Loss below the candle’s lowest low and by setting Take Profit with 1R. Here we must notice that the neckline level becomes the level of support. This is one of the most reliable theories in the financial market.
The price heads towards the North with extreme bullish momentum. It hits 1R in a hurry and travels towards the North further. The last candle comes out as a hanging man, which is a bearish reversal candle. However, it is not a strong one. The price may keep traveling towards the North. Anyway, the buyers achieve their target with the entry, which is taken on two theories.
Resistance works as a level of support after the breakout.
In the case of a double bottom and neckline breakout, we may sometimes find that the price does not come at the breakout level. It consolidates well above and makes a bullish move. In some cases, the price may not hit the target. However, if the price comes and produces a bullish reversal candle at the breakout level, the price may hit the target in most of the cases.
Whenever you think of the most successful traders in the world, who comes to mind? Here are a few quick examples of noteworthy traders with a lot of experience: Carl Icahn is the richest trader in the world with a net worth of $14.3 billion. He runs an investment firm and previously advised Donald Trump […]
Whenever you think of the most successful traders in the world, who comes to mind? Here are a few quick examples of noteworthy traders with a lot of experience: Carl Icahn is the richest trader in the world with a net worth of $14.3 billion. He runs an investment firm and previously advised Donald Trump […]
Whenever you think of the most successful traders in the world, who comes to mind? Here are a few quick examples of noteworthy traders with a lot of experience:
Carl Icahn is the richest trader in the world with a net worth of $14.3 billion. He runs an investment firm and previously advised Donald Trump on regulatory overhaul.
George Soros has a net worth of $8.3 billion and is in charge of a hedge fund worth billions of dollars. He has been nicknamed “the man who broke the bank of England”.
Ray Dalio rules over the world’s biggest hedge fund firm Bridgewater Associates, worth around $140 billion in assets.
There’s a lot we can learn from these expert traders and others that have put a lot of time and effort into perfecting their trading strategies. If you want to find yourself in their place one day, then you’ll need to understand how they think and what not to do. Below, we will detail four of the best trading behaviors you should copy if you want to think like these billionaire investors.
Be Confident, but Not Overly Confident
In order to be a successful trader, you need to believe in yourself and feel confident in your strategy. It’s important to maintain one’s belief in themselves even when their trading strategy fails and they have some losing trades, rather than second-guessing everything. Unfortunately, too much confidence can lead a trader to feel arrogant or as though they are invincible. Overly confident traders take more risks and don’t always analyze all of the data that they need to. This usually leads one to lose everything that they gained in the end. This is why successful traders need to be confident in their abilities and strategy while remaining humble by remembering that they aren’t invincible.
Many traders experience anxiety and make distorted decisions after experiencing one or several losses when trading. It is important to understand that you can’t win every single time. Being a good trader is about having more winning trades than losing ones, not having a 100%-win rate. This is why professionals learn from their mistakes without beating themselves up over them. If there was something you could have done differently, remember that next time. Or maybe you made what looked like a good move and the market did something unexpected. Either way, you need to brush yourself on and move on when you make a bad trade.
Know When to Do Nothing
Have you ever anxiously watched a trade and pulled out before hitting your stop loss or take profit level, only to wish you hadn’t soon after? Good traders set their stop loss and take profit levels and then sit back and do nothing. Patience is important here. It isn’t always smart to make a trade, for example, when the market is highly volatile. Good traders sit back and only enter the market when they know they should. They aren’t addicted to trading and understand that some days they will need to sit out. If you want to be like one of the greatest traders out there, you’ll need to practice patience and self-discipline so that you don’t enter the market at bad times or allow anxiety to change your decisions.
Never Stop Learning
Traders should never stop pursuing knowledge about trading. Even if you become a professional, there’s always something new to discover. You need to be able to act logically when the pressure is on and may need to do some psychological work to improve the way you act in stressful trading situations. Or perhaps reading about an unknown strategy or another’s point of view on something could help you to improve your own strategy or be of some use. The best traders don’t assume that they know everything that there is to know about trading.
The Bottom Line
Successful traders have the right amount of confidence without being arrogant. They understand that they could lose but have invested enough effort into their trading strategies that they know most of their trades are going to be winners. In order to be like one of the greatest traders out there, you need to learn a lot about self-discipline and how to behave under pressure so that you don’t allow your emotions to cloud your judgment. Professionals don’t beat themselves up over their mistakes, they dust themselves off and move on. If you plan to be a noteworthy trader in the future, you’re going to need to learn to behave like one. Try following our list and reading about some of the greatest traders out there to master having a professional attitude.
Technical Analysis involves studying the historical price action to determine current trading conditions and potential price movements in the forex market. Traders that use this approach are known as technical analysts or chartists and believe that everything you need to know can be found in the charts, so they spend a lot of time poring […]
Technical Analysis involves studying the historical price action to determine current trading conditions and potential price movements in the forex market. Traders that use this approach are known as technical analysts or chartists and believe that everything you need to know can be found in the charts, so they spend a lot of time poring […]
Technical Analysis involves studying the historical price action to determine current trading conditions and potential price movements in the forex market. Traders that use this approach are known as technical analysts or chartists and believe that everything you need to know can be found in the charts, so they spend a lot of time poring over charts looking for data. Technical analysts look at indicators, technical studies, and other tools for patterns that have formed in the past with the idea that history tends to repeat itself. Here are a few more facts:
Traders look for major support and resistance levels that have occurred in the past so that they can base their trades around that historical price level.
Technical analysts make decisions that are based more on probability than predictions.
The process of technical analysis bases decisions on what will possibly occur based on past patterns, but nothing is ever certain in the forex market.
Technical analysts are often referred to as chartists because many of them spend a great deal of time studying charts each day.
Technical analysis can help you determine when and where to enter the market, along with when to get out.
Many other traders look at fundamental analysis, which places a great deal of importance on economic headlines and news reports.
It’s important to remember that technical analysis is subjective, meaning that one can interpret data in different ways. Those that want to practice this need to understand Bollinger Bands, Fibonacci, and other terms that relate to these studies. You’ll obviously need some experience studying and interpreting charts before you’ll be able to practice technical analysis effectively.
Technical analysts also place a great deal of importance on trading indicators. While these tools can be effective, traders should know that many indicators don’t work correctly and can cause you to lose your money, especially if they are offered by an individual or a company for a price. Always be sure to conduct research before purchasing any indicator and it’s a good idea to test these before using them on your live account. You’ll also want to avoid cluttering your charts with too many indicators – instead, focus on finding a couple of really good indicators or trade without them.
The theory is based on the fact that although the market is chaotic, it is not completely random. Even though nobody can know for sure what is going to happen next, mathematical chaos theory has proven that identifiable patterns tend to repeat despite the chaos associated with the market. While nothing is guaranteed, the technical analysis method has been proven to increase one’s probability of making favorable trading moves. If you want to practice this method, be sure that you can read charts and understand advanced concepts related to technical analysis.
In Forex, your risk tolerance refers to how much money you are willing to risk on each trade. In order to limit their losses, traders base the position sizes they take on the amount of money that they are willing to risk. Many beginners make the mistake of taking larger trades than they should, which […]
In Forex, your risk tolerance refers to how much money you are willing to risk on each trade. In order to limit their losses, traders base the position sizes they take on the amount of money that they are willing to risk. Many beginners make the mistake of taking larger trades than they should, which […]
In Forex, your risk tolerance refers to how much money you are willing to risk on each trade. In order to limit their losses, traders base the position sizes they take on the amount of money that they are willing to risk. Many beginners make the mistake of taking larger trades than they should, which can really result in a big blow to the account if they incur a loss. If you risk 15% on one trade, 20% on another, and so on, it isn’t hard to run out of money. Of course, the more you risk, the more you stand to gain. So how much should you really risk on each trade?
The answer is different for everyone. In the end, you should only risk an amount that won’t evoke an emotional response from you in the event that you lose. This amount will look different for different kinds of traders, as a billionaire is not likely to blink at the loss of $100, while a newbie/working-class trader would probably feel the sting from such a loss. Here are some tips that might help you decide how much you want to risk:
Experts recommend only risking 1-2% of your total account balance on a single trade, for example, you’d only risk a dollar or two on a trade if you had $100 sitting in your trading account. This helps to ensure that your losses remain small.
Some professionals say that you shouldn’t go with the 1-2% rule because one-size doesn’t fit all. Instead, they recommend that you determine how much you’re willing to risk to each trade individually. The idea is that you might be willing to risk more on a trade that you feel more confident about, while a smaller risk amount is more suitable for a trade you’re on the fence about. It’s still a good idea to think of smaller percentages here – no more than 5% of your account balance.
Whichever approach you choose, you should be sure that you’ll be able to accept the money loss should the market move against you. Otherwise, you might fall victim to certain trading emotions or find yourself revenge trading, which typically leads traders to lose even more money as they try to regain their losses. If you’ve already started trading, you should consider how much you’re currently risking and how you feel when you lose. If you haven’t started yet, remember that you might have an idea of how much you’re willing to risk, but you could find that it does upset you once you get started. You can always go back and adjust the amount you risk once you get a better idea of how those losses feel.
Although risking too much might make us think of greed, it’s important to note that some traders do this because they tie their feelings to their self-worth. Winning big makes these traders feel better about themselves, so they are less cautious when setting position sizes. The best way to deal with this problem is to acknowledge it, as those feel-good hormones won’t last long if you lose big. Some traders might have the opposite problem and find themselves extremely worried about risking money to the point that they barely take chances at all. It’s important to find a middle-ground here if you’re on either of the strong ends of the spectrum.
In the end, each trader has to assess their own risk tolerance and decide how they’d like to apply that. Some might risk 1% on each trade, for example, while others might compute the amount for each individual trade. If you find yourself feeling upset after taking a loss, this is a good sign that you might need to reduce the amount you’re risking, as disciplined forex traders shouldn’t feel emotional about losses. If you can define the right risk-tolerance for yourself, you’ll have completed one of several steps that leads to future success as a forex trader.
Employment is crucial for consumer spending, which makes more than two-thirds of the GDP for many countries. Understanding the employment rate and the cascading effect it has on the economy is paramount for fundamental analysis. The factors affecting the employment rate and business cycle patterns all inherently impact economic growth and currency valuation. Hence, understanding employment as an economic indicator will strengthen our analysis.
What is Employment Rate?
Employment Rate: It is defined as the ratio of employed to the total available labour force. Here the labour force is defined as the sum of employed and unemployed persons. It is also considered as a measure of the extent to which the labour force is being used.
Unemployment is a state where an individual is actively searching for employment but cannot find work.
Unemployment Rate: It is defined as the percentage of unemployed people to the available labour force. It is the other half of the employment rate. Employment and unemployment rate combined should yield results as 100% as it equals the total available labour force.
How can the Employment Rate numbers be used for analysis?
Employment and unemployment can be considered as the two sides of the same coin. We can derive our fundamental conclusions from either direction. Employment Rate is essential for our analysis because it has a direct and cascading impact on consumer spending. In the US, consumer spending accounts for about 70% of the total GDP.
A high employment rate indicates that more people in the labour force have income that they can spend on purchasing goods and services. When consumer spending is on the rise, businesses flourish, leading to better wages, or even more employment. Overall, employment in one sector has an indirect positive effect on dependent sectors and a direct positive effect on the economy.
The Government is also politically committed to ensuring a low unemployment rate; otherwise, citizens will not favour them in the next elections. By providing proper support to local businesses, the Government can increase employment in the short run.
A high unemployment rate is very damaging to the economy. As more people are unemployed, there is a direct negative effect on consumer spending. In this scenario, also the cascading effect works and makes the situation worse. It also hurts the employed people.
Increased unemployment in the economy can bring down the employed morale, making them feel guilty for being employed while their colleagues are unemployed. It can also make employed people feel less secured and discourage their spending habits, and they may end up saving for a rainy day. Employed people may feel lucky enough to have a job that inhibits them from applying for better opportunities amid high unemployment.
Employment and Unemployment rates can also help investors to keep a pulse on the health of the economy. Overall it is essential to make sure the employment rate is always high and does not take a dip. Even when the unemployment rate rises linearly, it has an exponential impact on economic growth, and hence the central authorities try to avoid it at all times.
It is also essential to understand that employment rates are sensitive to business cycles in the short run. Hence, seasonally adjusted versions of the same are more useful for analysis. In the long run, the employment rates are significantly affected by government policies on higher education and income support. Policies that focus on the employment of women and disadvantaged groups also help increase the employment rate.
Both developing and underdeveloped countries’ governments have to focus on education policies and employment opportunities for their labour force if economic growth is the primary concern. Literacy and higher education in underdeveloped and developing nations have helped the economies grow stronger year-on-year.
Employment rates are coincident indicators and can also be used to predict or confirm oncoming recessionary or recovery periods, if any. The onset of a recession is accompanied by a massive unemployment rate or decreased employment rates. Hence, despite the propaganda of the media and Government, we can use employment data actually to confirm whether the economy is growing or stagnating. Accordingly, during recovery periods, employment rates start on a recovery trajectory back to its previous normal.
Impact on Currency
As an increase in employment rate points towards a growing economy, a high employment rate is good for the GDP and the currency. Hence, the employment rate is a proportional coincident indicator. An increase or decrease in employment rate is suggestive of improving or deteriorating the economy, respectively.
The forex market watches the unemployment rate more closely than the employment rate itself. Significant changes in the employment rate or the unemployment rate tend to have a considerable impact on market volatility. Still, generally employment rate in itself is a low impact indicator compared to the unemployment rate.
Employment change, initial jobless claims also precede unemployment rates, and the desired effects are already factored into the market before the employment rates are released. Hence, overall it is a low impact indicator.
Economic Reports
In the United States, the BLS surveys and tracks monthly employment and unemployment within the country. It classifies them based on geography, sex, race, industry, etc. The Employment Situation report is also published by the BLS, and it goes as far back as the 1940s. It is released by BLS on the first Friday at 8:30 AM Eastern Standard Time every month.
Sources of Employment Rate
The US BLS publishes monthly employment and unemployment reports on its official website. We can also find the same indexes and statistics of various categories on the St. Louis FRED. We can also find employment rate statistics published by the OECD countries here. Consolidated reports of employment rates of most countries can also be found in Trading Economics.
How Employment Rate News Release Affects The Price Charts
As we have already established, an increase or decrease in the employment rate can be used to gauge whether the economy is performing well or poorly. For forex traders, it is therefore imperative to understand how the news release of this macroeconomic indicator will impact the price action on various currency pairs.
In the US, employment reports are released monthly, usually on the first Friday after the month ends. The latest, expected, and all historical figures are published on the Forex Factory website. We can find the most recent release here. Below is a screengrab of the US unemployment rate from the Forex Factory website. On the right, we can see a legend that indicates the level of impact the Fundamental Indicator has on the corresponding currency.
As shown, the unemployment rate is a high impact indicator. The snapshot below shows the change in the US unemployment rate as released on August 7, 2020, at 1230GMT. For July 2020, the unemployment rate declined from 11.1% to 10.2%, beating the 10.5% decline forecasted by analysts.
Now, let’s see how this news release made an impact on the Forex price charts.
EUR/USD: Before Employment Data Release August 7, 2020, Just Before 1230GMT
The 30-minute EUR/USD chart above shows the market is on a downtrend from 0200 to 1200 GMT with the candles forming below the 20-period Moving Average. More so, the market was trading within a narrow price channel of between 1.1850 and 1.1810, indicating a calm market with traders waiting for the latest employment data to gauge the economic recovery.
EUR/USD: After Employment Data Release August 7, 2020, 1230GMT
As can be shown on the chart above, immediately after the news release, we can observe a sudden downward spike with a retraction. This spike indicates the market is having mixed reactions to the positive employment news hence the strong USD.
After the initial spike, the market can be seen to ‘absorb’ the positive news. The pair adopted a bearish outlook with the price breaking and staying below the earlier observed 1.1810 resistance level.
Since the pair had not shown any unexpected sudden swings before and after the new release, trading the news would have been profitable. For such a high impact economic indicator, it is advisable to open positions after the news release to avoid being caught on the losing end of the trend.
GBP/USD: Before Employment Data Release August 7, 2020, Just Before 1230GMT
GBP/USD: After Employment Data Release August 7, 2020, 1230GMT
The GBP/USD pair showed a similar trend as the one observed with EUR/USD. The pair can be seen to have traded within a narrow price channel of 1.3122 and 1.3071 from 0700 to 1200 GMT. After the economic data release, the pair similarly had a sudden spike. It later adopted the same bullish stand as the EUR/USD pair, with price breaking and trading below the observed resistance level.
AUD/USD: Before Employment Data Release August 7, 2020, Just Before 1230GMT
GBP/USD: After Employment Data Release August 7, 2020, 1230GMT
Similar to the EUR/USD and the GBP/USD pairs, the AUD/USD traded within a price channel of 0.7221 and 0.7196 and no unexpected spikes before the news release. After the news release, a sudden spike can be observed with an accompanying retraction, and later the pair adopted a bullish stance breaking below the observed resistance level.
From the above analysis, the subdued market volatility before the release of the employment data and the subsequent volatility, it is evident that the employment rate is high impact indicator anticipated by forex traders.
The Dow Jones Industrial Average continues its advances toward the green side. During this year, it is still easing 1.08% (YTD). The DJIA index, which groups to the 30 largest capitalized U.S. companies, move in the extreme bullish sentiment zone unveiling the probability of new record highs in the U.S. stock market. Likely, it could find resistance at the 30,000 pts as a psychological barrier confirming the all-time highs observed both S&P 500 and NASDAQ 100.
Market Sentiment Overview
During this year, the Dow Jones Industrial Average eases 1.08% (YTD), returning from the bear market to bull market side. The recovery experienced by the Industrial Average, carried it to jump from the lowest level of the year at 18,213.5 pts to 28,287 pts gaining over 55%.
The following figure compares the advance of Dow Jones and the S&P 500 in its weekly timeframe. In these two charts, we observe that both indexes move in the extreme bullish sentiment zone. However, although surprising, the recovery observed in the U.S. stock market, the Industrial Average still doesn’t confirm the all-time high of the S&P 500, reached on the latest trading sessions.
If we look at the Dow Jones’ volatility (VXD), it is running below the 60-day moving average, which confirms that the market sentiment continues being in favor of fresh upsides on the Industrial Average.
Finally, considering that both NASDAQ 100 and S&P 500 reached fresh all-time highs in the latest sessions, the Dow Jones should follow the same path in the coming trading sessions.
Elliott Wave Outlook
The mid-term outlook for the Industrial Average provided by the Elliott Wave Analysis reveals the bullish continuation of the incomplete wave B of Minor degree labeled in green, which could push it toward new all-time highs.
The next 4-hour chart illustrates the price running in an uptrend that began on March 23rd when the U.S. Blue Chip index found fresh buyers at 18,213.5 pts, developing a corrective structural sequence that remains incomplete.
Once the Industrial Average broke upward the (b)-(d) upper-line of the triangle drawn by the wave ((b)) of Minor degree, the price activated its progression as wave ((c)), which is characterized by the inclusion of five internal waves.
Currently, Dow Jones continues its development in an incomplete wave (iii) of the Minuette degree labeled in blue. Simultaneously, the bullish trendline looks intact, which leads us to conclude that the uptrend remains sound, calling for more upsides in the following trading sessions.
Finally, considering that both the S&P 500 and NASDAQ 100 reached new record highs, we expect further upsides and record highs on Dow Jones. A potential target could be at 30,000 pts as this psychological barrier will be a natural profit-taking level.
Becoming a successful forex trader takes a lot of hard work and determination. It’s easy to get so caught up in things that we can miss signs that we should be doing things differently. This can result in bigger problems down the road and cause us to lose money or become stuck in the same […]
Becoming a successful forex trader takes a lot of hard work and determination. It’s easy to get so caught up in things that we can miss signs that we should be doing things differently. This can result in bigger problems down the road and cause us to lose money or become stuck in the same […]
Becoming a successful forex trader takes a lot of hard work and determination. It’s easy to get so caught up in things that we can miss signs that we should be doing things differently. This can result in bigger problems down the road and cause us to lose money or become stuck in the same rut with zero improvements.
If you’ve already started your forex trading career, you should use our self-evaluation checklist to see if you’re making any common mistakes. Hopefully, this checklist will help to outline problems that you may not realize are hurting you. Ask yourself these questions:
What tone does your inner voice take when you’re trading? Is it angry and frustrated, or relaxed and focused? If someone could hear your thoughts, what would they say to you?
Is your strategy based on solid facts about the market, or do you make loose decisions that are based on thin air? Could your strategy use some improvement?
Do you ever take the time to improve yourself when it comes to forex trading? Do you invest time in learning new things and perhaps practicing on a demo account, or are you stuck in your old ways?
Do you think your losses could be lowered with better risk-management precautions? Do you ever throw caution to the wind when it comes to risk-management and later regret it?
Once you incur a loss, do multiple losses tend to follow? Could it be that you allow emotion to cloud your judgment when you’re down, or do you fall victim to risky tactics like revenge trading?
Can you recognize when you need to take a break from trading? Have you ever continued to trade while feeling anxious or fearful, only to make bad decisions? Has a stressful life event ever caused you to become distracted while trading, resulting in losses?
What is your general mood when you finish trading? Are you fulfilled and happy, or overwhelmed and stressed?
Could you possibly be addicted to the rush of trading? Are you often borrowing money from others or using money that is needed for bills and necessities to trade with?
Do you make trades because they are good moves, or because you’re craving the excitement or self-esteem boost that trading can provide?
What are your short-term and long-term goals? Do you think those goals are realistic or far-fetched?
Are you investing enough time into trading? Are you focusing on trading full-time, or is this just a part-time activity? Are your expectations in tune with the amount of energy you put into trading?
Do you think you have the right attitude to be a successful forex trader? When you lose, do you beat yourself up or learn from your mistakes?
Do you keep a trading journal? Do you think that your strategy could be improved by taking the extra effort to document your decisions?
Can you find the humor in losing and move on easily, or do you become fixated on everything you lose and allow bad days to overcome you?
How focused are you when you’re trading? Are you in the zone, or are you often distracted by background noise and other thoughts? Would a quieter environment benefit you?
Answering these questions honestly can cause substantial growth in your Forex trading career. Only when one can look inward can true improvement be made.
Forex traders are no stranger to the rollercoaster ride of emotions that come along with trading, as many have experienced excitement, greed, anxiety, anger, and even fear at some point in their careers. Today, we will focus on fear and how it can affect your trading decisions, along with some ways to cope with it. […]
Forex traders are no stranger to the rollercoaster ride of emotions that come along with trading, as many have experienced excitement, greed, anxiety, anger, and even fear at some point in their careers. Today, we will focus on fear and how it can affect your trading decisions, along with some ways to cope with it. […]
Forex traders are no stranger to the rollercoaster ride of emotions that come along with trading, as many have experienced excitement, greed, anxiety, anger, and even fear at some point in their careers. Today, we will focus on fear and how it can affect your trading decisions, along with some ways to cope with it.
While trading, fear can come from the possibility of losing money, as you never know for sure if your trade is going to win. Some people feel this way at all times and are very careful about how much they risk, while others might only struggle with feeling fearful after taking one large loss or multiple small losses in a row. At this point, the trader is more likely to think of how much money that they have just lost and might even feel as though they are having bad luck. The fear then leads the trader to close their position too early, even though it was a valid trade that could have made more money. After a few hours, the price shoots up and the trader is left feeling angry with themselves for closing out the trade when they could have made more money. Sound familiar? Many of us have been there before.
So how do you deal with feelings of fear while trading and avoid closing out trades too early? Try following these steps:
Step #1: Identify Your Fear
First, you need to admit to yourself if you’re feeling uneasy and figure out why. Are you simply afraid to lose money in general, or has something made you feel this way? If you’ve been on a losing streak recently, this could be a contributing factor. A large loss could also make you feel more worrisome. Or perhaps you’re generally an anxious person that is feeling more on edge from normal trading emotions. Once you’ve confirmed that you are feeling fearful, remind yourself that this is a perfectly normal emotion in trading that can be dealt with.
Step #2: Don’t Let Fear Stop You
Once you know where your fear is coming from, you can think about the emotion more clearly. Say that you’re preparing to exit a trade. At this point, you should ask yourself if there are valid reasons to exit the trade, or if you only want to close out because you’re afraid of losing money. If it’s the latter – you need to stay in the trade until you have a reason to exit. Know that it’s ok to step away from your computer if you start feeling overly fearful or anxious in these moments, as a quick break can really help you calm down. Staying in the trade for longer is the option that is more likely to bring you in more money, as long as you have evidence that the trade will be successful.
Step #3: Start a Trading Journal
It would be nice if every forex trader kept a trading journal, as these handy little record keepers can provide deep insight into what is going right or wrong with your trades. Sadly, a lot of traders don’t use a trading journal, or they might start out with one only to abandon it down the road. For those that have been feeling fearful and closing positions too early, it’s a great idea to either start a journal or to make sure you’re logging everything in detail in the one you have. As you work to deal with overcoming the fear you’re feeling, the journal will help you to see if you’re making improvements or stuck making the same mistakes.
Revenge trading – it’s one of the many things that can stop a successful trader dead in their tracks on the path to success as if traders weren’t already dealing with enough negativity. Before you can learn to stop revenge trading and how to avoid it, you’ll need to understand what it is. Allow us […]
Revenge trading – it’s one of the many things that can stop a successful trader dead in their tracks on the path to success as if traders weren’t already dealing with enough negativity. Before you can learn to stop revenge trading and how to avoid it, you’ll need to understand what it is. Allow us […]
Revenge trading – it’s one of the many things that can stop a successful trader dead in their tracks on the path to success as if traders weren’t already dealing with enough negativity. Before you can learn to stop revenge trading and how to avoid it, you’ll need to understand what it is. Allow us to start by defining the term “revenge trading”.
The term revenge trading refers to a common problem where a trader becomes angry after losing money and attempts to take revenge trades in an attempt to recover their losses. With emotions like anger and frustration clouding the trader’s mind, they are likely to make decisions that are closer to gambling without following their trading plan. There are two reasons why this is a big problem:
First, revenge trading causes the trader to throw their discipline out the window. In the heat of the moment, trading plans and strategies are often ignored, and the trader might base their trades off nothing much at all. When your head is stuck on those losses and how badly you want to make the money back, you aren’t likely to follow your strategy or to think about risk management.
A trader that isn’t making good decisions and that makes large trades without accounting for their overall risk is likely to lose more money, thus repeating the cycle that started the revenge trading in the first place.
As you can see, revenge trading can cause issues with one’s logical thinking in the same way that many other emotions like anxiety, fear, etc. can wreak havoc on trading decisions. Below, we will provide two common scenarios that exemplify revenge trading:
In the first scenario, trader A has invested a chunk of money into a trade and wound up losing $97. This leaves trader A feeling frustrated about the fact that he was wrong and anxious to make his money back. In the same ways that someone who is having a bad day might get road rage or become snappy with a loved one, trader A begins to take out his aggression on his trades. He impulsively makes larger trades out of desperation to win that money back, but he winds up losing even more. In the end, trader A loses $200 instead of the initial $97 loss.
In the next scenario, trader B loses $40 a few hours after her stop-loss is hit. Although she would usually only risk $50, she decides to double her risk to $100 out of frustration and in an attempt to win that money back. As soon as she makes her $50 back, she cuts her winning trade out because of the fear that she will lose money again, even though she could have made more money.
Although both of the above scenarios differ, each trader has fallen guilty to revenge trading. Trader A lost more money than he would have because he was chasing his losses, while trader B doubled her risk and closed out her winning trade once she made what she had lost. Bost traders lost money they could have made, as trader A could have stuck with the initial loss and trader B could have made more money on the winning trade.
Now that we’ve covered what revenge trading is and provided a few examples, we will offer a few steps that can help traders overcome this problem:
Step 1: After a frustrating loss, you should step away and clear your head. You could try doing something that makes you feel relaxed, like listening to music, exercising, or even spending a few minutes outside. Once you’re calm, you’ll be ready to think more rationally.
Step 2: Next, it is helpful to determine the reasons why you lost the trade. Was this an error on your part, or did you make a trading move that seemed reasonable? Instead of betting yourself up over the loss, you simply want to figure out what went wrong so that you can avoid making the same mistake. Also, try to identify any triggers that you might have that signal you’re about to start revenge trading. A fast heartbeat or biting fingernails are a couple of examples.
Step 3: Always follow your trading plan, no matter what. If you have a plan and strategy, you shouldn’t deviate from it because you’ve lost money. If you usually only risk a certain percentage on a trade, don’t risk more just because you’ve lost money, as this is likely to cause more loss.
If you follow the above steps by clearing your head, determining what went wrong, and sticking to your usual self-given trading guidelines, you should be able to stop revenge trading without much effort.
Discipline is often listed as one of the most important traits that a successful forex trader should have. After all, without discipline, one is likely to make decisions based on their emotions and might not stick to a trading plan at all. This makes trading more like gambling and guarantees that success will be hard […]
Discipline is often listed as one of the most important traits that a successful forex trader should have. After all, without discipline, one is likely to make decisions based on their emotions and might not stick to a trading plan at all. This makes trading more like gambling and guarantees that success will be hard […]
Discipline is often listed as one of the most important traits that a successful forex trader should have. After all, without discipline, one is likely to make decisions based on their emotions and might not stick to a trading plan at all. This makes trading more like gambling and guarantees that success will be hard to come by. The disciplined trader has it all – they can keep their emotions in check (even after large losses or a bad day), they set a plan and follow it consistently, and they don’t spend time worrying about past mistakes. Instead, they learn from their mistakes and move on.
Of course, being a disciplined forex trader is easier said than done. Anyone who has traded before has likely felt a rush of emotions, considered deviating from their trading plan when the market was unpredictable, and they might have even thrown some of their self-imposed rules out the window. If you’ve been there before, then there are some things you can do to help yourself stay disciplined.
Tip #1: Practice
Controlling your emotions can be difficult when money is on the line. This is why you need to practice keeping your cool in the beginning until it feels more natural. It’s normal to be more on edge in the beginning of your trading career, or perhaps after changing something about your trading plan or strategy. You can always start by practicing on a demo account to make yourself feel more confident about your plan or abilities – but be aware that a demo account can’t prepare you for the rollercoaster of emotions that come with trading. This is because a demo uses fake money, so while it might show you that your plan needs some work, it isn’t the best if you’re working on managing your emotions. When practicing on a real account, try taking smaller position sizes and risking less so that the emotional fallback is less if you lose money. Then, you can slowly work your way up to larger trades once you feel that you won’t take those losses to heart.
Tip #2: Critique Yourself
Go back and take a look at your results once you’ve been trading for a while. Have you made money or lost it? The best way to do this is to keep a trading journal and write in it religiously. This means you’ll log every trade you make and include details like how much you made or lost, the reasons why you entered or exited the trade, and so on. This helps you to understand your strengths and weaknesses and shows you where your strategies do and don’t work. Once you tweak your trading plan to perfection and have data that proves it is trustworthy, it will be easier to stick to it in the long run.
Tip #3: Stop When You Need to
Sometimes, you might just need to stop trading altogether. This could be applied to two different situations; in the first, the market might just not be right for trading. They don’t say that it’s better to trade less for no reason, this saying actually has to do with the fact that traders come out better when they know when to sit out. If you force trades, you aren’t doing yourself any favors. The second scenario could come into place when your emotions are just too overwhelming and you can’t calm down. The best traders know that it’s ok to step away from your computer and take a breather if this happens, rather than to continue allowing yourself to make clouded trading decisions. Take as much time as you need to and come back once your level-headed. This will make it easier to stay true to your plans and strategies without making cost worthy mistakes like revenge trading.
In our previous articles, we presented the introductory concepts to design, create, test, optimize, and evaluate a trading system. In this section, we will be using a practical example of the development process of a trading system.
Starting to Build the Trading System
In his work, Robert Pardo exposes a seven-step methodology that must be followed to develop a trading system. These steps are as follows:
Formulate the trading strategy.
Write the rules in a precise form.
Test the trading strategy.
Optimize the trading strategy.
Trade the strategy.
Monitor the trading performance and compare it to test performance.
Improve and refine the trading strategy.
Picking a Trading Strategy
A trading system starts with an investment idea that could arise from a publication in a specialized trading site or another related source. In our case under study, we are going to develop a trading strategy based on the Turtle Traders.
Our reader must consider that the process applies to any other strategy.
The Turtle Trading System Rules
The Turtle System uses the following set of rules:
Timeframe: Daily range.
Entry:
Richard Dennis defined two systems; the first one corresponds to a short-term strategy considering the 20-day breakout. In parallel, He added a long-term system using the 55-day breakout. In our system, we will be conservative and use the long-term strategy based on the 55-day breakout.
Stop Loss: The stop loss should be placed a the distance corresponding to one time the Average True Range (ATR) of the 20 days.
Exit: The system developed by Richard Dennis doesn’t consider a specific take-profit level as it happens with some chartist patterns. Instead, Dennis defines the exit criterion after the price moves against the position for a 10-day and a 20-day breakout. For long positions, the exit will be a 20-day low, and for short positions will correspond to 20-day high. However, to simplify our system, we will consider a profit target level at one 20-day Average True Range distance (1 20-ATR).
Position Size: The size will correspond to 1% of the capital available in the trading account.
Adding Positions: For educational purposes, we will not consider increasing the positioning criterion.
Charting the Turtle Trading System
As a way to visualize what our first version of the trading system should do, we will illustrate the strategy on a chart for both long and short positions.
In the previous figure, we can observe the set of rules for the entry, stop-loss, and profit-target. The rule of position sizing will correspond to 1% of capital in the trading account.
Conclusions
In this first part, we identified a trading strategy and specified a set of rules corresponding to what the system should do. In the next educational article, we will start to transform the ideas into a set of instructions.
Suggested Readings
Jaekle, U., Tomasini, E.; Trading Systems: A New Approach to System Development and Portfolio Optimisation; Harriman House Ltd.; 1st Edition (2009).
Pardo, R.; Design,Testing, and Optimization of Trading Systems; John Wiley & Sons; 1st Edition (1992).
Faith, C. M.; Way of the Turtle. New York: McGraw-Hill; 1st Edition (2007).
Conclusions
Suggested Readings
Jaekle, U., Tomasini, E.; Trading Systems: A New Approach to System Development and Portfolio Optimisation; Harriman House Ltd.; 1st Edition (2009).
In today’s lesson, we are going to demonstrate an example of trendline trading and how the trade may be managed. We know that trading with a trendline is very rewarding since an established trendline often ends up offering several entries. However, things may not always go as smoothly as we like. Like other trading strategies, trendline trading may end up offering entries that may not hit the target or make traders have a loss. In today’s lesson, we are going to see an example of trendline trading, where things do not go according to traders’ expectations.
In today’s lesson, we are going to demonstrate an example of trendline trading and how the trade may be managed. We know that trading with a trendline is very rewarding since an established trendline often ends up offering several entries. However, things may not always go as smoothly as we like. Like other trading strategies, trendline trading may end up offering entries that may not hit the target or make traders have a loss. In today’s lesson, we are going to see an example of trendline trading, where things do not go according to traders’ expectations.
In today’s lesson, we are going to demonstrate an example of trendline trading and how the trade may be managed. We know that trading with a trendline is very rewarding since an established trendline often ends up offering several entries. However, things may not always go as smoothly as we like. Like other trading strategies, trendline trading may end up offering entries that may not hit the target or make traders have a loss. In today’s lesson, we are going to see an example of trendline trading, where things do not go according to traders’ expectations.
The chart shows that the price makes a strong bearish move. It may have found its support. It produces two bullish candles. The sellers may wait for the price to make a breakout at the lowest low to go short in the pair. Let us find out what happens next.
The price makes a long bullish move followed by a bearish correction. It produces a bearish engulfing candle and heads towards the South again. The chart is bearish biased, but the pair is trading around the level, where it had a bounce earlier.
The price makes a breakout at the level and trades below the level for several candles. It means the sellers have two higher highs from where the price makes two bearish breakouts. It means the sellers can draw a trendline here and wait for the price to go towards the trendline’s resistance to go short in the pair.
The price heads towards the South and produces a bearish engulfing candle. The sellers may trigger a short entry right after the last candle closes by setting take profit at the last swing low.
It looks fantastic for the sellers. The price heads towards the target in a hurry. It seems the sellers do not have to wait too long to reach the target. The way it has been going, the price may end up making a breakout at the last swing low too.
It does not. The price finds its support and produces a bullish engulfing candle. It heads towards the trendline’s resistance. The sellers must be disappointed with the entry. They may have to encounter a loss here.
The price finds its resistance as well. It does not go towards the trendline’s resistance, but it makes a bearish move. Look at the last candle. It comes out as a bullish engulfing candle. The entry is running with some profit, and the trendline’s resistance is still intact. What do you think the sellers do with the entry? If we follow ‘set and forget,’ we may leave it like this and wait until the price hits either the stop loss or the take profit. It is an H4 chart. Many traders look after their trades and manage their trade by taking a decision as far as price action is concerned. In this case, they may do two things.
Close the whole trade
Close 50% trade and let rest of the 50% run
We come across three types of trade management here. It is up to you which one you choose. Choose one that suits your trading style and stick with it.
Deposit Interest Rates play a crucial role in controlling the flow of money within the economy and the international market. The interest rate differentials have always directed the flow of speculative money in and out of countries, thereby affecting the currency exchange rates. Hence, it is crucial to understand Deposit rates as an economic factor in the FOREX industry.
What is Deposit Interest Rate?
Deposit Interest Rate: It is the money financial institutions pay the depositing party. The deposit account holders put some money in the bank for which the bank pays out interest. Deposit accounts can be a savings account, Certificates of Deposit (CD), and self-directed deposit retirement accounts.
Banks give loans to its customers at a higher rate than the interest they pay out on their deposit accounts. It is this spread between the lending rate and deposit rate that banks make their profit and is called Net Interest Margin.
How can the Deposit Interest Rate numbers be used for analysis?
Potentially, banks are free to set their deposit rates at whatever rate they desire, but they have to keep competition and business into account. Deposits provide financial institutions with the necessary liquidity to maintain business and give out more loans. Banks need to give out loans to make a profit, but also needs to have depositors to provide the required liquidity. Within the country, when the deposit interest rates are low, people would be more interested in investing their money in stocks or other money markets where there is a possibility of a higher return on their capital.
Conversely, banks may increase their deposit rates to attract investors to deposit their capital providing banks with the necessary liquidity to fund their loans. Investors see bank deposits as a safe bet against the risky stock or money markets where they are subjected to a potential loss. Customers are also encouraged to save more and spend less when they get a higher return on their deposits. In the international markets, investors check and compare the lending and deposit rates of major banks in different countries. When the deposit rate of a bank in one country is higher than the lending rate of a bank in another country, there is a chance of making money.
Investors, traders, or some institutions may borrow money from a low-interest rate country and deposit in another country where the rates are high. This difference in the lending and deposit rates amongst banks of different countries is called Interest Rate Differential or ‘Carry.’ For example, let us assume when the deposit rate in Australia is 5%, and the lending rate in the United States is 3.5%. The difference of 1.5% return will move the speculative or “hot” money out of the United States and into Australia. When the Australian Dollars start to flow into the country, the global FOREX market is deprived of the AUD currency, and, hence, it is appreciated.
The below plot also shows the historical difference between the interest rates differential (AUS IR – USA IR) and the AUD USD exchange rate. As we can see, whenever the difference between the interest rates rises in favour of AUD, the exchange rate tends to follow. There is a good correlation between both in the long run. Whenever the direction changes in favour of the United States, so does the exchange rate.
Hence, the “carry” essentially directs the flow of “hot” money in and out of countries whenever there is an increase in interest rates differentials. The larger the difference and consistent the direction of the differential in the plot (positive or negative) more will be the inflow of money in that direction.
When the differential is near or close to zero, then the speculative money may be forced into other options to generate revenue. The interest rate differential may be prominent when paired against small and developing countries to that of developed countries in general. As most of the developed economies are struggling to maintain their growth and have been forced to keep interest rates low, it indeed is a little tricky to find currency pairs to generate a significant carry.
Impact on Currency
Deposit rates have a definite impact on the currency markets. It is one half of the money flow equation. When the lending rates and deposit rates are checked and compared, money flow starts in favour of the higher deposit rate country that appreciates the currency value and vice-versa.
Therefore, deposit rates alone do not determine currency value fluctuations. But in general, it is safe to say that higher deposit rates tend to appreciate currency’s value as the market is deprived of that currency. Conversely, low-interest rates on deposits discourage saving and thereby go into spending, which contributes to inflation and currency depreciation.
Economic Reports
The deposit interest rates of local banks can be found on the respective banks from which we would want to borrow money. But in general, the deposit rates and lending rates due to market forces are subject to be close to the country’s Central Bank’s target rate.
For the United States, it is the Fed Funds target rate, and the actual rate is called the effective Fed Funds rate. The Federal Reserve publishes Monday to Friday the daily Interest Rates in its H.15 report at 4:15 PM on its official website. Weekly, Monthly, Semi-annual and Annual rates of the same are also available.
Sources of Deposit Interest Rate
The United States Fed Rates are available here. The monthly effective Fed Funds rates are available in a more consolidated and illustrative way for our analysis in the St. Louis FRED website. Consolidated Deposit Interest Rates of different countries are available here.
How Deposit Interest Rate Affects Price Charts
For forex traders, monitoring other economic indicators is usually meant to help them predict what interest rates are going to be in the future. However, since the deposit interest rates largely depend on the federal funds rate, they rarely have any significant impact on the forex markets by itself. It is worth noting that the US FOMC only meets eight times in a year to determine the federal funds’ target rate. This explains the lack of impact by the deposit interest rate.
In the US, the Fed Funds target rate, on which deposit interest rates are based on, are published every weekday at 4.15 PM ET. Below is a screengrab of the Fed Funds target rate from August 11 to August 17, 2020.
As can be seen, the rate has remained the same at 0.1%. The screenshot below is from Forex Factory, showing that the latest FOMC decision recommended that the Fed Funds target rate remains between 0% and 0.25%.
Now that we’ve established the impact that the deposit interest rate has on the economy and the currency valuation let’s see how it impacts the price action of some select currency pairs.
EUR/USD: Before Effective Fed Funds Rate Release August 17,
2020, Just Before 4.15 PM ET
The 15-minute EUR/USD chart above shows that the market between 10.15 AM and 4 PM ET on August 17, 2020, had no specific trend. The market has adopted an almost neutral stance with the candles forming just around the flattening 20-period Moving Average.
EUR/USD: After Effective Fed Funds Rate Release August 17,
2020, 4.15 PM ET
As can be seen on the chart above, immediately after the daily update on the Effective Fed Funds rate, there is a slightly bullish 5-minute candle forms. The news, however, is not significant enough to the market to cause any spikes or change the prevailing market trend. As can be seen, the pair continued with its neutral trend and a flattening 20-period Moving Average.
GBP/USD: Before Effective Fed Funds Rate Release August 17,
2020, Just Before 4.15 PM ET
The neutral trend observed with the EUR/USD pair before the daily release of the Effective Fed Funds Rate can be seen on the GBP/USD chart above. The candles formed just around the flattening 20-period Moving Average.
GBP/USD: After Effective Fed Funds Rate Release August 17,
2020, 4.15 PM ET
After the news release, a 15-minute bullish candle forms. However, the same neutral trends persist with the pair indicating that the news was not significant enough to move the markets and cause a change in the trend.
AUD/USD: Before Effective Fed Funds Rate Release August 17,
2020, Just Before 4.15 PM ET
AUD/USD: After Effective Fed Funds Rate Release August 17,2020, 4.15 PM ET
Unlike with the EUR/USD and the GBP/USD pairs, the AUD/USD pair had a clear uptrend before the daily release of the Effective Fed Funds Rate. This uptrend was not a steady one since the candles formed just above an almost flattening 20-period Moving Average. After the news release, a bullish 15-minute candle is formed. The news was, however, not significant enough to alter the prevailing market trend.
While the deposit interest rate is vital in determining the flow of money in an economy, it plays an almost insignificant role in moving the forex markets. Cheers.
As an invested trader or a keen observer, you probably recognize the importance of understanding and using indicators in forex trading. Thankfully, owing to a plethora of available information, you can feel relieved knowing that such an abundance of sources may actually save you from months or even years of hard work (and quite a […]
As an invested trader or a keen observer, you probably recognize the importance of understanding and using indicators in forex trading. Thankfully, owing to a plethora of available information, you can feel relieved knowing that such an abundance of sources may actually save you from months or even years of hard work (and quite a […]
As an invested trader or a keen observer, you probably recognize the importance of understanding and using indicators in forex trading. Thankfully, owing to a plethora of available information, you can feel relieved knowing that such an abundance of sources may actually save you from months or even years of hard work (and quite a few losses too). Quite naturally, to be able to start trading, you really need to see where you are standing with regard to your level of skills and knowledge.
However, rest assured that, in terms of indicators, there is a definite list of types you should focus on, as well as the right approach to interpreting charts and following trends. Note that some expert traders do not rely on secondary indicators. Their primary source of information is Price Action and only occasionally use an indicator or two to support Price Action patterns. The article assumes you know how to handle the most popular trading platform, the MetaTrader 4/5.
One of the key points where traders often misinterpret the advice they come across is that indicators always work. This is true to a certain degree, of course. Before you read or watch any material on the topic of forex, you must think about what types of information you should be looking for are. That further implies that you must be aware of what your needs and goals are as a trader. Understanding how the fiat market functions is also a vital prerequisite to being able to make use of indicators, i.e. profit from forex trading.
Another essential principle of this market of which traders should become conscious as early as possible is that trading revolves around trends, not reversals. Many studies have confirmed that trend following is the most profitable course of trading. It is each trader’s task to learn how to read into these trends because these skills will essentially bring out the lucrative side of this business. Even more importantly, indicators are useful and much-needed tools, yet the way they are combined will eventually equal the amount of financial reward. Therefore, if you learn how to combine trend indicators effectively, you can achieve some amazing results.
Although each trader will need to put a great number of hours into grasping the complexity of this market at the beginning of their career, the purpose of learning about trend indicators is to reap quite a few benefits afterward. As an experienced trader, you may not need more than 10 to 15 minutes during the day to see how your efforts lead to profitable outcomes. In the end, everything boils down to the question of whether you want to sacrifice your time or money doing any other job. If the answer is neither, then you know that learning how to trade currencies properly is a crucial step.
Every trader will work towards understanding the degree of the risk involved in their everyday trading. This step is particularly important because you will need to set the limit, which will essentially help you know what the right time to stop is. Indicators alone are thus insufficient unless you become aware of your boundaries and your goals first.
Once you decide on your priorities and preferences, you can allow yourself to start searching for the right indicators that you will use eventually to build up your own algorithm. To achieve this, you will need to check various blogs and websites, as these sources of information often complement each other. Unfortunately, the search for the right indicator rarely ends here as you still have to think of a few other key points on your path to becoming an expert trader.
Firstly, you should pay attention to indicators that offer too many signals and thus push traders into starting off too early. Some others do the opposite by not alarming you to make a trade on time, which equally defective and dissatisfactory. In addition, if your indicator provides a narrow selection of information, it does not necessarily imply that these trades will be beneficial.
An example of great indicators is the one which can give you great signals and, at the same time, prevent you from trading during unstable periods. This is extremely important for the times when a price may be going in one direction, but the big banks unexpectedly get involved and completely change the prices’ direction without any prior warning or news event. An indicator able to avoid false trends and save you from these sudden price changes is the type of indicator you should strive to find and use in your trading.
Unfortunately, a surprisingly vast number of available indicators have proved to be impractical and of no use in reality. Created by programmers who often do not do any trading themselves, such indicators fail to provide the type of information traders necessitate. Nonetheless, most of the remaining ones can actually be quite useful with some additional adjustments, which all traders learn how to make after a while.
Despite the fact that the vast majority of indicators demonstrated poor performance, all good indicators typically fall into three main groups: 1) zero-line cross, 2) mutually crossing lines, and 3) chart indicators, which will be discussed in detail. In case the indicator you are thinking of using does not belong to any of the three, you may want to avoid it to evade any money-related losses. You may, nonetheless, use the following descriptions to see how good indicators function with real charts and currencies and decide to test them yourself later.
Have you ever asked yourself what key factor has the power to substantially and irrevocably impact the trade of currencies? Many have tried to reach this answer and, at the same time, many have failed, dragging the weight of financial losses and blown accounts along. What makes a trader successful in the end? Are we […]
Have you ever asked yourself what key factor has the power to substantially and irrevocably impact the trade of currencies? Many have tried to reach this answer and, at the same time, many have failed, dragging the weight of financial losses and blown accounts along. What makes a trader successful in the end? Are we […]
Have you ever asked yourself what key factor has the power to substantially and irrevocably impact the trade of currencies? Many have tried to reach this answer and, at the same time, many have failed, dragging the weight of financial losses and blown accounts along. What makes a trader successful in the end? Are we to focus on the factors obstructing traders’ passages to growth or the ones facilitating the prospects of earning a profit? We now have access to countless sources offering volumes of educational material, but we still hurdle the same barriers that prevent us from becoming better traders. We have long learned about indicators, charts, and strategies, among other fundamental concepts introduced at the very beginning of our forex trading careers.
Unfortunately, most traders fail to grasp the one idea that has sparked so much controversy within the forex community by now that the focus on the results is often blurred and compromised by the traders’ specific sets of beliefs regarding what is right. The spot forex market enjoys a continuing influx of traders from a number of different markets, boldly attempting to tap into their previously acquired experience and knowledge and apply them onto the world of trading currencies. Combined with the less experienced traders’ rite of passage and poor choice of information sources, the overall failure rate is rather ominous. However, it appears that most losses increasingly deal with the topic of sentiment, which entails a wider set of believers and facts every trader must absolutely strive to understand. Due to the above-mentioned state of the market, it is high time that the debate over sentiment and its impact on traders’ success was dealt with once and for all.
Unlike any other market, the spot forex market is severely monitored and controlled by the big banks, such as Deutsche Bank, JP Morgan Chase, and HSBC, whose power to affect the market can turn a seemingly ideal plan into a bloodbath unless you understand how to approach this issue. While the big banks have the power to detect market activity, they cannot see your specific order. However, should you take the most popular market position, there is a high probability of undergoing some very painful financial losses. While we may not know the extent of tools the big banks’ use to maintain control and insight, every trader can also gather a vast pool of information on market activity by using the IG Client Sentiment Indicator (https://www.dailyfx.com/sentiment) or FXCM SSI (https://twitter.com/fxcm_marketdata?lang=en), which are charts showing where the focus of attention is. Moreover, owing to these two sources, we can tell whether traders are going long or short along with where the price went in the end. Interestingly enough, apart from sharing the same information regarding where the price is going, both banks and traders have a common goal – profit.
So, if you were to ask yourself what action they would take if they noticed great concentration in a specific area of the chart, what do you believe your answer would be? If you imagine that all traders decided to move net long on EUR, what would the big banks do: a) keep EUR long for an extended period of time, bestowing all traders with a nice financial reward; b) immediately take the currency’s price short, forcing the majority to exit their long trades at a loss; or, c) maintain EUR as it is, lure the traders going long even further only to “unexpectedly” take the currency short? Most traders get trapped because the banks will almost always choose the second or the third option and will do that repeatedly and consistently. The moment where most traders get confused is believing that they can outsmart the system, still not recognizing what needs to be done when the banks change the price from long to short here, so they keep dragging themselves deeper and deeper in the mud.
Now that we can see how reliance on sentiment plays out in the field, we need to address the right approach to surpassing this obstacle. First of all, whenever there is a high concentration of activity in one part of the chart, this should be a clear signal for every trader to start feeling alarmed. At this point, we need to forget the human tendency to conform and practice the contrarian approach. What this implies is that each trader should strive to recognize to which direction the majority is heading and refrain from following the mass. The basis of this attitude is neither disobedience nor rebellion, but the understanding that we have two distinctly different methods of trading in this $3—6 trillion market – the right and the wrong way. If all those traders spiraling out of control placed patience, money management, and trading psychology before relying on the wrong sources, the big banks’ impact would certainly not be as negative a factor as it is in these cases. If the big banks ever disappeared, there is a great chance that the nature of this market would entirely change, possibly even becoming similar to the stock market. It is important that traders stop feeling angry about their losses and start taking advantage of the existence of the big banks.
This further entails that concentrating on notions such as order books, expiration dates, etc. is entirely redundant for trading currencies. We may never exactly know how the big banks manage the spot forex market, but what we can do is acknowledge the phenomenon which occurs repetitively and decide what to do about it. It is high time traders stopped wondering why or how things happen and started to ponder what they can do individually to measure control in their own trading. We can accept the inevitability of outside influences, but, at the same time, we should use the information we can gather, notice similarities, and feel comfortable making difficult choices.
When we think about the core of the forex market, we cannot assume the existence of qualitative sameness, where trading currencies, stocks, or commodities are considered to be indistinguishable. In contrast to what some sources may say, terms such as supply and demand, herd mentality, buy low/sell high, and more have no impact on the quality of trading currencies and are, thus, potentially dangerous because of the increased probability of missing the point. The spot forex market essentially revolves around the need to think about the reasons why a particular price moves in a specific direction. Traders’ main task is not to apply a set list of tactics incorporated from other markets, but make sure that they stay off the banks’ radar as successfully as possible. By becoming part of the minority, you will increase wins and decrease losses – which the majority of traders running after reversals, for example, may never experience.
The majority of traders also use common and outdated tools (e.g. Japanese Candlesticks) which offer information visible to everyone, pushing large numbers of traders to react to the same signals and thus immediately drawing the attention of the big banks. What is more, even the choice of currencies can have an effect on the future of a trade. For example, USD is always in demand, making the pairs involving this currency always on the banks’ radar to a greater degree than in other cases, which is why caution is advised especially for beginners. Traders can early on also feel threatened by the news involving regulatory bodies taking action to limit traders’ freedom. Do not get frightened because you see some exorbitant amounts they charge in the media, because once broken down per trader, these amounts approximately turn out to be a day’s work. Overall, do not get distracted by methods which are inapplicable in trading currencies or news for that matter because what you never want to do is be the line moving in a completely opposite direction from where the money is going in the chart.
To become more knowledgeable about the impact of sentiment on trading in the spot market, you should consider exploring the IG Client Sentiment Index for education purposes. The tool has proved to be less useful when the price is consolidating, but the opportunity to see the overall movement will serve as an invaluable lesson. Detecting whether traders are going long or short and where the price is actually going will almost always show you that the currency will more often than not go in the opposite direction, serving as an obvious confirmation of why going with the majority is never a good idea. Unlike with the USD-based pairs where such phenomenon frequently occurs, other currencies may vary in the degree of susceptibility to the big banks’ involvement simply because the number of individuals trading these other currencies is lower.
The first image below, for example, successfully captures how the individuals trading on the EUR/USD currency pair behave, transparently documenting this common occurrence. As you can see at the beginning of the chart, each time traders are impatiently moving from net short to net long, the price will almost always start moving towards the opposite direction. The chart further shows how traders at one point changed their minds for a short while, causing the price to react. Then they decided to go long, after which the price started going short and the two lines once again crossed paths going into entirely opposite directions. The same coordinated behavior is present everywhere in the chart, which should serve as an indication of the need to take a different approach.
Example of how the price rebounds depending on where the majority of traders are going
Sentiment, as we already explained above, is not equally applicable to all currencies. If you are interested in a currency pair which does not involve USD, such as EUR/GBP, you would then need to look for the combination of information you can gather from both the EUR/USD and GBP/USD currency pairs, focusing on where most traders are in these charts. Likewise, client sentiment may be applicable to some markets, such as the spot forex market, but there are certain exceptions. For example, precious metals rarely exhibit any correlation in this regard. If you are trading spot gold against USD, for instance, you should know that the banks certainly have control over the currency, but they have practically no dominance over gold. In this case, it is the price of gold that has a say and determines what will happen to that pair. Therefore, banks cannot truly manipulate the prices the way they would normally do in each and every case.
The involvement of banks becomes even more questionable when we observe some other trades, such as the one involving silver, as shown below. In terms of the stock market, we can find no evidence of sentiment influencing individuals stocks; however, certain indices prove not to be impervious to this phenomenon. While the IG Client Sentiment is practically the most heavily traded index we know, you may still use some smaller versions such as the CAC or the XETRA DAX. Despite the fact that the information will probably not be the same quality as with the most popular sentiment index, you will still be able to find some useful data. Most importantly, even with these less versatile indices, you can generally obtain the information on where the majority of people are unless you are looking into precious metals or crypto markets where you will find no correlation, further raising the question of why such data is even provided on these platforms. Unfortunately, such terrible fundamental mistakes keep happening, but it appears that the vast number of these traders choose not to open their eyes, thus giving the big banks the opportunity to cream off the profit so easily.
Traders must become aware of another essential difference regarding their approach to sentiment. As it appears, many traders keep falling for the same trap, believing that the only important matter in getting off the big banks’ radar is knowing the direction where everyone is heading to and opting to go the opposite way. What is more, they typically wait for the lines to cross or colors to change to make their move, using the IG Client Sentiment as a trend confirmation indicator. Unfortunately, no matter which pair you may choose to trade, using the IG Client Sentiment as a trend confirmation indicator will probably not give you the result you are looking for. Even if you put effort into finding ways how to use this tool more effectively, testing out every possible option, you should know that the knowledge about where the majority of traders are at a certain point in the chart is not the type of information you should be focusing on.
What is truly relevant is the insight into where these individuals are going, and where the mass is headed is where you will see the most appalling scenarios. You could most definitely benefit even more from some other indicators, which could be of more assistance to your trades. However, be mindful of the fact that even if you get a signal to go where the majority is at a particular moment, you should not feel worried. If the majority of traders are going long and your signal is telling you to go long as well, do not give in to the fear, but rest assured knowing that the concentration of traders in one place is not truly what you should be concerned about, but the direction they are taking. If you are wearing yourself down, distrusting the indicators you chose to serve you in your trading, you will very likely miss out on some extremely good opportunities. The best solution to this challenge is building your own algorithm and learning to trust that system.
A lot of sources discuss what constitutes the very essence of trading in the spot forex market. Especially for beginners, the access to sources attaching the same value to sentiment as to technical analysis and fundamental analysis can be utterly detrimental. This, however, does not undermine the impact of sentiment nor does it strive to prove how sentiment is unimportant, being the key driver in this market with the ability to move prices towards specific directions. The biggest problem traders have in dealing with sentiments is the fact there is little we can do about it. Chasing sentiments is simply equal to trying to predict the whims of people hungry for success. We cannot control people’s emotions or use them to foresee where millions of traders are going to go because it is an attempt to control the uncontrollable.
Since the greatest portion of traders keeps chasing the sentiment, your task is to do exactly the opposite. By eliminating sentiment from the equation, you will save yourself from facing scenarios such as the one in the image below. Not all places in this chart indicate the exact phenomenon we discussed today, but from the middle towards the right end, we see several places where most traders made one big move only to see the money go in the opposite direction. Nonetheless, the belief that just because millions of traders are going long at a specific time, we should go short is also an example of a short-sighted approach. We may not have control over people’s sentiments, but we can most definitely strive to learn about indicators, testing different tools, and working towards setting up our own algorithm.
Such knowledge could have helped traders who got caught up in the situation shown in the chart below because just by refocusing on the two lines where the white pointer is, they could have caught the big move and salvaged their trade. In addition to building up knowledge on trading and indicators, traders must bear in mind that indicators are result-oriented tools which are not truly meant to predict the future. Considering the fact that news inevitably gets in the way at some point (e.g. what the past year’s flash crash did to indicators), traders need to adopt skills that can raise them above the level of sentiments and provide some stability in this seemingly unpredictable market.
If you still believe that you can yield the power of sentiments, although generally not advisable, there is one method in which you can attempt to do it. Before using IG Client Sentiment, traders relied on the SSI indicator developed by FXCM, an ex-U.S. company that, unlike now, used to have more presence on MT4. Despite the fact that it does not make its applications available for U.S. customers, FXCM does have extremely useful products showing sentiment that you include in your chart. They also have their own proprietary trading software done in a different code, which you might still be able to use if you can transpose indicators from one language to another. If this is not the case, you may still find an easier solution by following FXCM Market Data on Twitter, which will offer a window into the actual SSI Indicator even if you do not have access to it.
Some of the benefits it provides include the GBP/JPY pair which we cannot find on IG Client Sentiment. This particular twitter feed is excellent at showing you charts that are relevant at that point in time. For example, the cropped image on the left below shows a chart revealing some unexpected activity, which tells us that there is a slight chance that the sentiment is about to reverse. Quite similarly, the AUD/JPY chart next to it with the yellow pointer indicates the crucial moment where any trader trying to catch a reversal would severely endanger their trading accounts and financial stability. Therefore, we must be particularly careful with this tool, whose greatest contribution to the forex community is the ability to use it as a reflection tool. Attempting to use it for prediction purposes, hoping to discover where the price might go, would require the understanding that a set-up algorithm would tell you much better where to go and what to do.
Overall, predicting the whims and the sentiments of millions of traders around the world has never been a good idea, and you must be extremely cautious when dealing with this topic so as not to end up where the majority does. Should you ever notice any extremes with regard to sentiments on the pair you are trading at the time, you are advised to stop and exit the trade. A great example of a situation where closing up was necessary was the 2019 flash crash, when the ratio between short and long traders on the USD/CAD currency pair was 4:1 (i.e. 80% short) because of which we could safely conclude that the price could not have gone much higher. Some experts who traded on this currency pair at the time state that they relied on their experience, leaving the trade just before their indicator was about to exit the trade itself. Nonetheless, until you are certain that you have enough knowledge, the right mindset, and necessary experience, do not let yourself get carried away, potentially endangering not just one trade but your entire forex trading career.
We could not stress enough how volatile relying on sentiments is, but if you really must proceed on such a trade in that manner, make sure that you use all the available resources. Twitter, for example, is a tremendous source of information, and taking notes is an excellent way to both memorize quickly and keep important data in one place. You can explore updates about IG Client Sentiment Index on DailyFXTeam, learn about additional SSI currency pairs on FXCM_MarketData, or discover some invaluable educational materials and market comments on This_IS_VP4X. If you are intent on growing as a forex trader, aim to include technical indicators, money management, and trade psychology into trading, which will essentially help you put a system together that will bring you money in the long run. What most traders, whom you could see in the charts added in this article, did was miss out on invaluable opportunities because they never put any effort into building a proper system.
Once you develop trading skills and reach the professional level, you may not need to use your own money to trade any longer because you will surely be noticed by different companies that will want to invest in you. Before that happens, you should start acknowledging the role of the big banks in this market and, if needed, let go of all strategies used previously in some other markets. Even though the phenomenon we analyzed today does not frequently happen in the precious metals or crypto markets, making use of techniques and indicators specific for the spot forex market will alleviate the external impact and safeguard you from any market instability. Moreover, understand that with forex, there are no shortcuts and that you have set yourself up for a long road of learning and growing.
Luckily, today’s article equipped you with the knowledge some individuals who have been trading for more than five years still do not know. You should now be able to avoid areas in charts that are open to manipulation and preserve your finances, which will be further fortified by not trading reversals or using the same common tools as every other trader does. Finally remember that your only chance to succeed is by getting out of the pool of traders who focus on the sentiments, as it is key in differentiating between emotion-driven and indicator-driven individuals. Building a currency trading career based on emotions, bereft of any technical skills, is not a long-term strategy, and if you are passionate about trading in the spot forex market, eliminating sentiments and devising an algorithm will get you right from where you are to being a professional trader.
A bankruptcy on paper and in reality differ in several meaningful ways. The short and long-term implications both have to be fully taken into the picture before forming an opinion or drawing any inference from the Bankruptcy statistics. Contrary to popular belief, it is not as bad as it sounds and is more frequent for businesses to file for bankruptcy as a means to reset their business to become profitable. Correctly understanding bankruptcy, its implications, and its statistics can help us make better trade decisions in the long run.
What is Bankruptcy?
Bankruptcy is the legal state of an individual or a company that has become insolvent. When an individual or a company is unable to repay its debt, it can file a petition for bankruptcy in the federal court. When individuals lose their income source or when a business takes on continued periods of losses are likely to file bankruptcy.
The bankruptcy process starts when a petition is filed by the debtor or the creditor, although it is more common for the debtors to file for bankruptcy. Successful processing of a bankruptcy petition can benefit the debtor to be discharged of their debts, thus giving them the freedom from the overburdening debts and restart.
When a bankruptcy petition is processed, the assets of the debtor are evaluated, and an appropriate portion may be allotted to repay the creditors. Whether all of the assets are sold off to repay debt or not depends on the types of bankruptcies filed. Many a time, creditors may need to reorganize the debt to allow the debtor to pay off the debt in smaller installments over three to five years.
How can the Bankruptcies numbers be used for analysis?
On paper, all this may seem favorable to the debtor offering immediate relief from the overwhelming debts. The debtor may not be required to pay at all if the debtor does not have assets or income or at least greatly waive off their debt installments. Successful proceeding of a bankruptcy petition can partially or entirely waive off debts for a chance to save your home or business from going-under.
Such an exemption comes at a cost, though. As mentioned, on paper, it seems like a favorable option for the debtor in a tight spot, but in the long-run, it has far-reaching implications. If a debtor is filing bankruptcy, chances are, their credit score has already gone wrong due to failed payment dues in past months. When the bankruptcy is filed, it will stay on the record of that individual or company for ten years. In this process, the credit rating goes low, and a remark of bankruptcy on record prevents you from being eligible for future credits, loans, mortgages, or even credit cards.
When lending sources are all cut off, then it is challenging for both individuals and businesses to become profitable. Some may even end up borrowing from sources where interest rates are much higher than the standard rates, ending up in deeper trouble than before.
Filing bankruptcy is more frequent for businesses to reorganize their remaining assets and come up with a new strategy to be profitable. All the bankruptcy cases are handled in the federal courts by a bankruptcy judge. They are classified as per the bankruptcy code that details different chapters for different types of bankruptcy case scenarios.
From a macroeconomic perspective, bankruptcy filing gives both the debtors and creditors a fresh start by allowing debtors to be eligible for credit and creditors to recover some portion of the credit. Having such a system that can accommodate failures of individuals and companies is a sign of a fair and inclusive economy that embraces and tolerates both ups and downs of individuals and businesses.
From a purely business and growth perspective, increasing bankruptcy cases is just plain bad for the economy as it indicates businesses are shutting down, and people are losing jobs. Both of those scenarios do no good for the economic growth and contribute negatively to both growth and consumer & business sentiment within the nation. Filing of bankruptcy thrashes the equity market performance of corporations as investors lose confidence in the business.
Recessions, war-times, or times like global pandemic observe an increasing number of bankruptcy cases indicating that the economy is not faring well. Hence, from an economic standpoint, the “fewer the better” would be the goal for a prosperous economy.
Impact on Currency
Filing Bankruptcy is often the last resort for the debtor when all other options are closed. Hence, the bankruptcy statistics are backward-looking or a lagging indicator confirming an ongoing past trend which could have been deduced from the past poor performance. Bankruptcy statistics would then be useful for economic analysts for analysis but does not serve as a useful indicator either for the equity or the currency markets. Hence, bankruptcy figures could be overlooked for other leading macroeconomic indicators for the currency markets.
Economic Reports
The United States Courts provide historical data of the quarterly reports of bankruptcy filings in the country on its official website. The Organization for Economic Co-operation and Development (OECD) also maintains bankruptcy statistics for reporting members. Moody’s analytics also provide personal and corporate bankruptcy filings on their official website.
How Bankruptcies’Data Release Affects The Price Charts
Estimating the exact impact of bankruptcies on an economy is hard to quantify. Since the bankruptcies data is released quarterly, its impact on the forex market tends to be negligible because the data is backward-looking. The most recent data was released on June 30, 2020, at 8.00 AM ET and can be accessed from the United States Courts website here. The historical bankruptcies’ data in the US can be accessed at the Trading Economics website.
The screengrab below is from the quarterly bankruptcies’ data from Trading Economics.
As can be seen, the total number of bankruptcies in the United States decreased to 22,482 companies in the second quarter of 2020 from 23,114 companies in the first quarter of 2020.
Now, let’s see how this release made an impact on the Forex price charts.
EUR/USD: Before the Quarterly Bankruptcies Data Release on August 2020,
Just Before 8.00 AM ET
As can be seen in the above 15-minute EUR/USD chart, the pair was trading on a weak downtrend. This trend can be affirmed since the 20- period Moving Average is decreasing in the steepness of its decline with candles forming closer to it.
EUR/USD: After the Quarterly Bankruptcies Data Release on August 2020, 8.00 AM ET
After the release of the bankruptcies data, the pair formed a 15-minute “hammer” candle. This pattern indicates that the USD became weaker against the EUR. This trend is contrary to the expectations since the number of bankruptcies had declined from the previous quarter. The pair adopted a bullish stance with the candles crossing above a now rising 20-period Moving Average.
GBP/USD: Before the Quarterly Bankruptcies Data Release on August 2020,
Just Before 8.00 AM ET
The GBP/USD pair showed a similar weakening downtrend trend as observed with the EUR/USD pair before the release of the bankruptcies data. The 15-minute candles can be seen, forming closer to the 20- period Moving Average, whose downward steepness is decreasing.
GBP/USD: After the Quarterly Bankruptcies Data Release on August 2020, 8.00 AM ET
After the news release, the pair formed a 15-minute bearish “Doji star” candle. Similar to the EUR/USD pair, GBP/USD adopted a bullish stance with the candles crossing above a now rising 20-period Moving Average.
AUD/USD: Before the Quarterly Bankruptcies Data Release on August 2020,
Just Before 8.00 AM ET
AUD/USD: After the Quarterly Bankruptcies Data Release on August 2020, 8.00 AM ET
Unlike the downtrends observed with the EUR/USD and the GBP/USD pairs, the AUD/USD traded within a subdued neutral trend before the bankruptcies data release. The 15-minute candles were forming around an already flattened 20-period MA. After the data release, the pair formed a 15-minute bullish “Doji star” candle. It later traded in the same bullish pattern as observed in the other pairs.
Bottom Line
In the current age of the coronavirus pandemic, data on bankruptcies provide a vital indicator of the economic conditions. However, in the forex market, these data do not carry much significance, as shown by the above analyses.
Most traders already know that designing an algorithm to trade in the forex market is an essential step. We also know that any such algorithm is generally based on several indicators, with ATR, the confirmation indicator, and the exit indicator altogether partly making the algorithm’s skeleton we will disclose fully as we progress. What some […]
Most traders already know that designing an algorithm to trade in the forex market is an essential step. We also know that any such algorithm is generally based on several indicators, with ATR, the confirmation indicator, and the exit indicator altogether partly making the algorithm’s skeleton we will disclose fully as we progress. What some […]
Most traders already know that designing an algorithm to trade in the forex market is an essential step. We also know that any such algorithm is generally based on several indicators, with ATR, the confirmation indicator, and the exit indicator altogether partly making the algorithm’s skeleton we will disclose fully as we progress. What some traders are curious about, however, is the way to backtest these indicators in order for them to assess their performance. If you come across an interesting indicator that you want to give a chance and see whether it works, it is only natural that you would want to apply it in your charts and see if it rendered any success in the past. If you have already had the opportunity to do some research on the indicators that forex traders use, you probably know which ones are the most popular. However, do not give in to the popularity of some outdated tools, such as Stochastics, Japanese Candlesticks, or RSI, because you may certainly have more luck with some of the more modern indicators designed specifically to trade in the forex market.
While some sources insist that there is no such thing as a bad indicator, you may need to ask yourself what your ultimate goal is because one indicator cannot possibly serve all trading needs. On top of that, the market of trading currencies, which have no intrinsic value themselves, cannot possibly be the same as the trading stocks, commodities, or other equities that, unlike fiat currencies, actually have real values. Therefore, even the way we perceive trading can affect our choice of indicators. Nonetheless, even if you are certain that an indicator would perform well, there is no one single reason why you should not test it and compare it, if possible, to some other tools you have used for the same purpose.
What is more, as it turns out, you may find out that some indicators, such as Heiken Ashi, are generally used for entering trades, while some professional traders warn people about its shortcomings and suggest that they use it as an exit indicator and as a tool to test other exit indicators instead. Furthermore, the previously mentioned indicator is a perfect example of tools that do not let traders adjust any settings, which may be a much-needed option for many trades. Another almost equally important topic besides indicators is planning due to the fact that the right strategy and an overall plan on how to enter and exit a trade, including your risk and win limits, will inevitably have an impact on the quality of your trading. In addition, knowing how to scale out is another precondition for trading successfully, which will determine the level of safety and possibly stabilize the situation should your finances ever be at risk because of some unforeseen events.
Professional traders around the globe know that indicators alone cannot be fully functional and bring us all the profit we desire unless we put effort into learning. Therefore, in the process of looking for a good indicator, you must first be aware of the nature of the market you trade, understand its needs, and see what your own needs are. Testing at this point can be not only better because you have a vast array of information at your disposal, but it can also lead to some truly amazing discoveries such as where you can use and how you should never use a specific indicator. Consequently, testing, along with demo trading, should be a precondition to using any tool in real trading, which is why we intend to discuss the tools which can help you backtest and enter any trade with peace of mind. In today’s example, we will go through the steps of how you can backtest a confirmation indicator, which should serve as an overall useful guide and the path to discovering backtesting indicators in general.
How should we then commence this process? Firstly, after finding a confirmation indicator which you are willing to test for yourself, you should choose a specific currency pair for testing the indicator of choice, open your daily chart, and turn this indicator on in the chart. You will be using the default settings at first and, interestingly enough, these default settings often prove to be the best choice after all. By using the default settings, you also give yourself more room to compare later on with some other values after some adjustments. This is the best way to begin this process and what you will also do here is put the ATR indicator in the MT4 platform right below the confirmation indicator in question.
At this point, you will probably need to go at least 6—12 months back in time, although you can always decide to go even further in the past to get even more signals. Some professional traders choose to go back as far as two to three years because a longer time span provides them with a bigger sample size and a clearer idea of how this tool can work out long term. Going too far back, however, is not something experts would recommend just because of the vast number of market changes that have such a profound impact on trading and also because the odds of some market conditions occurring once again are quite low.
Your next question will likely be related to the number of entry signals your confirmation indicator can give you because you really need to find out what a win and what a loss was before. ATR will come in handy here since you will compare it with the number of pips you could have made with your indicator of choice. If the ATR for the USD/JPY currency pair was 80 at the time of entry, you will want to discover if your new indicator made 80 pips before losing 120 pips, because the system we are using sets out first take profit level at 1xATR value (you may want to experiment with different values but this value proves to be the best on the daily time frame according to our tests).
Naturally, if the answer is yes, then it is a winning choice and vice versa. It is of utmost importance to record this information in a clear way so that you can always go back to it and use it for future analyses (e.g. spreadsheet as suggested in the table below). As you will go backward, you will want to document every time you get the same results like these, so for your specific time frame, you can obtain very comprehensive win-loss ratio information, which can help you get a winning percentage on which you can base your decision whether you will use that particular indicator or not. Generally speaking, there are a few other questions you will need to answer before you start: what is the number of currency pairs you will be testing with this indicator, will you be changing the settings, how many times will you tweak the settings, and how far back in time will you be going?
The only rule you should be following is to maintain separate sheets or tabs for different currency pairs. The table below should successfully exemplify how you can keep the necessary data and, to calculate the percentage of wins, you can either divide the wins by the total number of trades yourself or set up a function to do it for you. For example, if the Win % is located in the E column, you may create and duplicate the following equation for all indicators you wish to test: C1/(C1+D1)=E1. The reason why we store this information so meticulously lies in the fact that you will need to go through the same process again for other indicators at least and use the data you collected to rank all of the tested indicators based on how well they did. The two to three indicators with the highest win percentage are actually the ones on which you will be focusing from that point. Although we lack the information regarding what happened with the trade afterward and we do not have any news events involved as well as other relevant data we would otherwise be using in a real-life situation, it will suffice for the time being.
Even though backtesting in this simple manner may seem devoid of some important circumstantial data, it can still help you distinguish between winning indicators and the losing ones as well as pinpoint some vitally important information you will definitely need for your day-to-day trading in this market. Simply put, if you are already witnessing the scenario where any indicator is showing poor performance at this point, imagine how poorly it will perform once you have all facts at your disposal and decide to actually invest real money.
On the other hand, if you come across an indicator which offers a greater number of wins as opposed to losses, you can assume that it may be possible to include this tool in your algorithm in the future. What you will do here is wait on it, but you will also need to and want to know which ones are worthy of hanging on to. Once you have figured this part out, you can freely use it in trading, of course initially in your demo account. Testing out whether an indicator is legitimately good will not require an unreasonable amount of time, especially if you take recording data seriously. In the greatest number of cases, the few winning indicators that you select will outperform the losing wins by far. Now, depending on the type of indicator you are looking for, you may need to consider some other pieces of information.
For example, if you are looking for a confirmation indicator, you know that it should be able to signal favorable market conditions as well as tell you when the market is not ready for any action. Unfortunately, we could not have the same process for testing exit indicators since we would need to include trailing stops that are used to compare with your exit indicator of choice. Nonetheless, no matter how crude backtesting may seem to be, the data you gather should be relevant enough for you to know what your next step should be. To sum up, you will start from today firstly go back to a specific time in the past until the moment you see your indicator telling you to buy or sell.
Secondly, you will check for the ATR at that exact point in time when you discovered the buy/sell signal. And, thirdly, attempt to discover what happened first – the price hitting the ATR value (take profit) or the value of 1.5xATR in the opposite direction (stop loss level we use in our algorithm example). Keep repeating the same process for every indicator and every setting each time the indicator gives you any signal until the time you decide to stop recording data. If you have found a really good indicator, you can use it until a better tool comes along. Whatever you do, keep searching because this market, as well as the tools used for the purpose of trading currencies, is unbelievably prone to change and you may want to be equipped with the best and most modern tools you can get.
Maintain the level of curiosity which is necessary for this line of business and keep your records neat and tidy because you will inevitably direct your finances according to what you discover while backtesting. Finally, although this backtesting method is imperfect at this moment, its power lies in its ability to tell you which the winning and the losing indicators are, saving your time and quite possibly your finances. Together with your comprehensive knowledge of the different types of indicators, the forex market, and your personal goals, this approach to backtesting will surely lead to success and these are the skills you will always be able to use to your advantage regardless of the outside factors.
In today’s lesson, we are going to demonstrate an example of a chart where the price gets caught within a horizontal channel. We’ll try to learn how we can trade and make the most of it. Let us get started.
In today’s lesson, we are going to demonstrate an example of a chart where the price gets caught within a horizontal channel. We’ll try to learn how we can trade and make the most of it. Let us get started.
In today’s lesson, we are going to demonstrate an example of a chart where the price gets caught within a horizontal channel. We’ll try to learn how we can trade and make the most of it. Let us get started.
The chart shows that, after being bearish, the price bounces at the drawn level. It produces a bullish engulfing candle and heads towards the North. The chart is bullish-biased. Thus, price-action traders are to look for long entries. Let us see what happens.
The price finds its resistance instead. It produces a bearish inside bar, but it does not make a new higher high. Thus, the buyers do not get an opportunity to go long at the top. The price heads towards the South towards the level of support. Since the level has been working as a level of support, the buyers may wait for the price to produce a bullish reversal candle to go long in the pair.
The chart shows that the price produces a bullish engulfing candle at the support zone. The buyers may trigger a long entry by setting stop loss below the candle’s lowest low and by setting take profit at the level of resistance. The risk-reward looks good.
The price heads towards the North with good bullish momentum. It hits the target in a hurry too. At the moment, the price is right at the level of resistance. Can you guess what traders should do now? Look at the next chart.
The chart shows that the price produces a bearish engulfing candle at the resistance zone. A point is to be noticed here that the chart produces a bullish spinning top. However, it cannot be considered a breakout. It rather produces a bearish engulfing candle. Thus, the traders may go short in the pair by setting take profit at the support zone and by setting stop-loss above the last candle’s highest high.
The price heads towards the South with an average pace. It consolidates for a while and resumes its bearish journey. The price has been roaming around the level of support for quite a while. It means the support gets even stronger. Look at the last candle. It comes out as a bullish engulfing candle. The buyers may trigger another long entry here. Let us find out what happens next.
The price hits the target. The price makes a long bearish correction and tests the buyers’ patience, though. However, in the end, the buyers come out with their pips. Trading is beautiful when the price moves like this, isn’t it?
In order to find out your bad trading habits, we need to have a trading journal set up and for it to be full of information. The information is stored in this journal should include things like your entries, exits, any changes to trades, the results of the trades, how long the trade was held […]
In order to find out your bad trading habits, we need to have a trading journal set up and for it to be full of information. The information is stored in this journal should include things like your entries, exits, any changes to trades, the results of the trades, how long the trade was held […]
In order to find out your bad trading habits, we need to have a trading journal set up and for it to be full of information. The information is stored in this journal should include things like your entries, exits, any changes to trades, the results of the trades, how long the trade was held for, and much more, basically as much information that you can fill it with. You can then use this information to look for habits, things that you have been doing consistently, and in the case of bad habits things that have consistently been having a negative effect on your trades.
As a side note, if you have not started to record your trades in a journal, then ensure that this is the next thing that you start to do, it is an invaluable source of information and can be used on a regular basis to improve your trading and to make you a better trader.
When looking through your journal, you may find quite a few things that have caused your trades to go bad, it may look like a lot of work, but it may not be quite as bad as you think. A lot of bad habits often stem from the same thing, there could be a single underlying habit which is then causing everything else to take effect. So take a look through to see if there are any characteristics of these trades that are similar to each other. As an example, if we think of a few different issues that can very easily arise, you close a trade early, set your stop loss a little too tight and avoid taking a good trade setup every now and then. Those seem like three completely different issues which by themselves they are, but there is a single underlying factor that links them all, a fear of losing.
We can use this and by dealing with that single underlying issue, it can help us to get over al three of those issues, there may, of course, be something else in there too, but the major factor that links all three together is the fear of losing, so dealing with that will help reduce the likelihood of all three issues recurring. It is all well and good identifying the issue, but we then need to do something about it, and that is where this article comes in. We are going to be looking at some of the things that you can do in order to help get yourself out of these bad trading habits and then become a much more confident and consistent trader.
Use a trading journal:
We touched on this earlier, but you need to be journaling your trades. You just need to. A trading journal gives you so much information, it gives you such a fantastic insight into your trading and your trading habits. You will not be able to deal with your bad habits if you do not know what they are. Just take a few minutes before and after each race to jot things down, it won’t take you a long time to do, in fact, once you have been doing it for a while it will be like second nature to you and can be done pretty quickly. When you are feeling uneasy, write it down, when you come out too early, write it down, just write everything that you do down. It isn’t hard, it does not take too long, so just do it, if you want to be a successful and profitable trader then you need to be doing this.
Talk to yourself:
You have probably been annoyed at some time in your life when you have been trying to do something but the person next to you is reading aloud or talking to themselves. They aren’t necessarily doing this because they are a little crazy, they are most likely doing this as a way of confirming the information or what they are doing with themselves as a way of being sure that they are doing the right thing. There is no harm in this and if you experience a number of bad habits, doing this yourself could help you get over them and nip them in the bud early on.
If you talk to yourself and question what you are doing, it makes you think about it more, this can help you to recognise that one of your bad habits is trying to rear its little head. At this point, you can realise this and then take action to avoid it. This is your first opportunity to tackle a habit, so do not be afraid to talk to yourself or to even question what it is that you are doing, and doing it out loud just makes it a little more real.
Talk to someone else:
Just like when talking to yourself, when you talk to someone else, they may well be able to see and recognise habits that you could not otherwise see, which can then allow you to deal with these habits. Talking to others who have experienced similar things can also help you to work out what you can do to try and avoid those habits from happening again. Getting experience first hand from other people is a fantastic way to get around them as it confirms to you that you are not alone, this habit is normal and if others have gotten over it, so can you.
List the triggers:
It is a good idea to write down the triggers for these bad habits so that you are always aware of what they are. The thing about habits is that they often happen without us knowing that we are doing it, so knowing what he triggers will allow you to work out if you are about to move into one of these habits or if you are already doing one. Just write them down and pin them up as a reminder of what you are looking out for.
Walk away:
Sometimes you need to take the more drastic measure of simply walking away, this may seem counterproductive because you are simply walking away from your bad habits rather than trying to deal with them, but it is not quite that straightforward forward and it depends on what your habit is. There are many traders that are fantastic when they start out, but after a couple of hours in front of the computer, their habits start to come out, cutting corners or getting anxious. This is a good time to take a break, simply walk away from the computer for a short period of time in order to calm yourself and to compose yourself again, this simply removes the opportunity for the habit to occur. It may seem simple, but it is an extremely effective way of avoiding bad habits.
So those are some of the things that you can do to try deal with your bad trading habits, there are of course other things that you can do, and some habits simply work themselves out, what is important is that you are able to recognise your bad habits and are then willing to try and work on them to ultimately remove them from your trading arsenal completely.


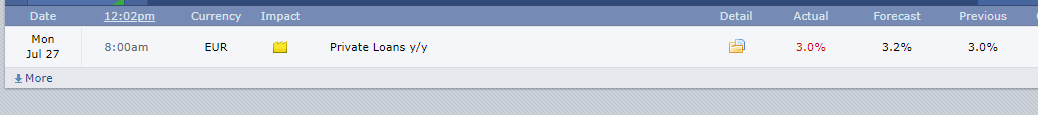


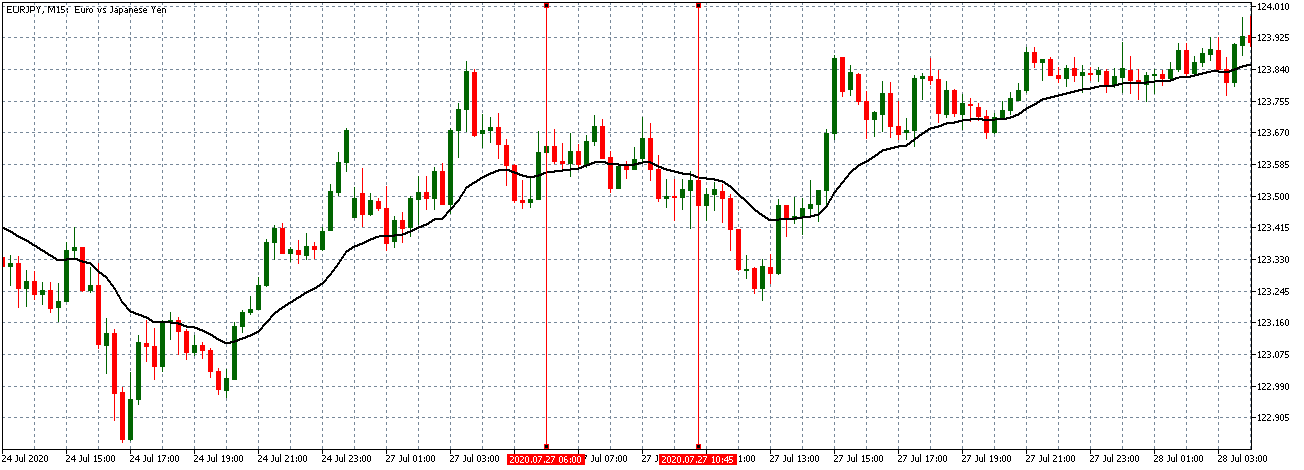
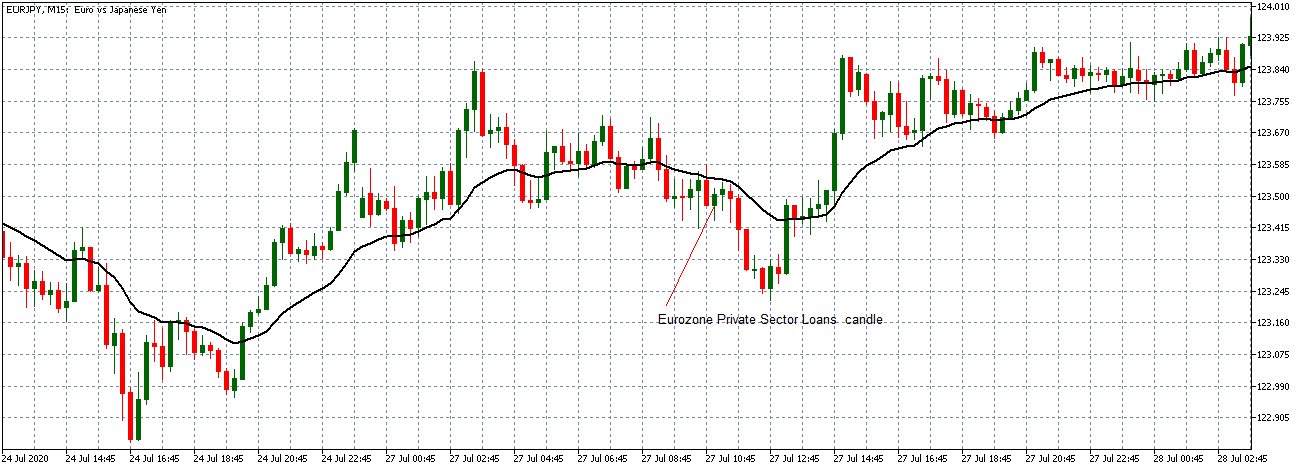
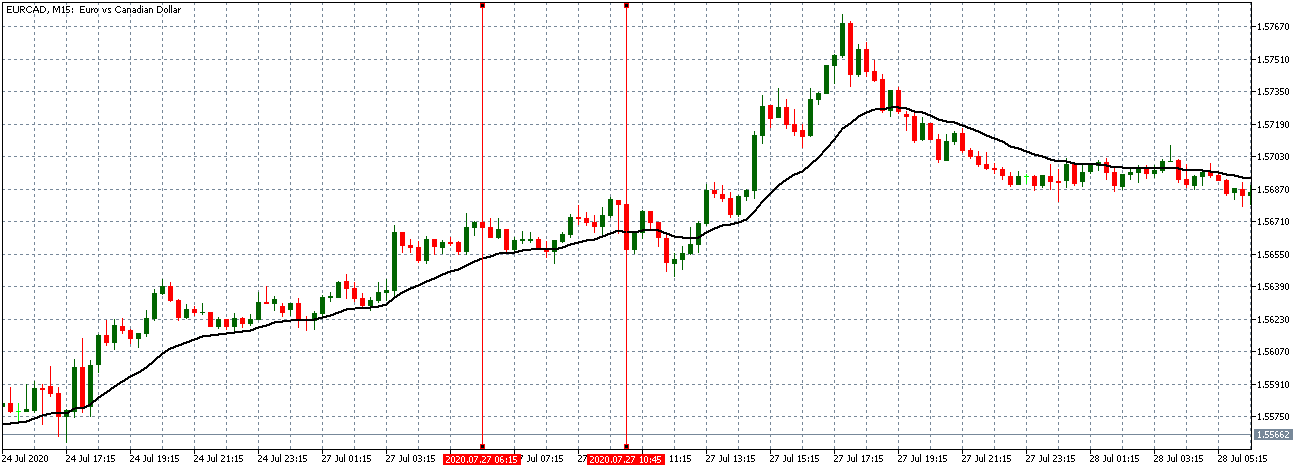
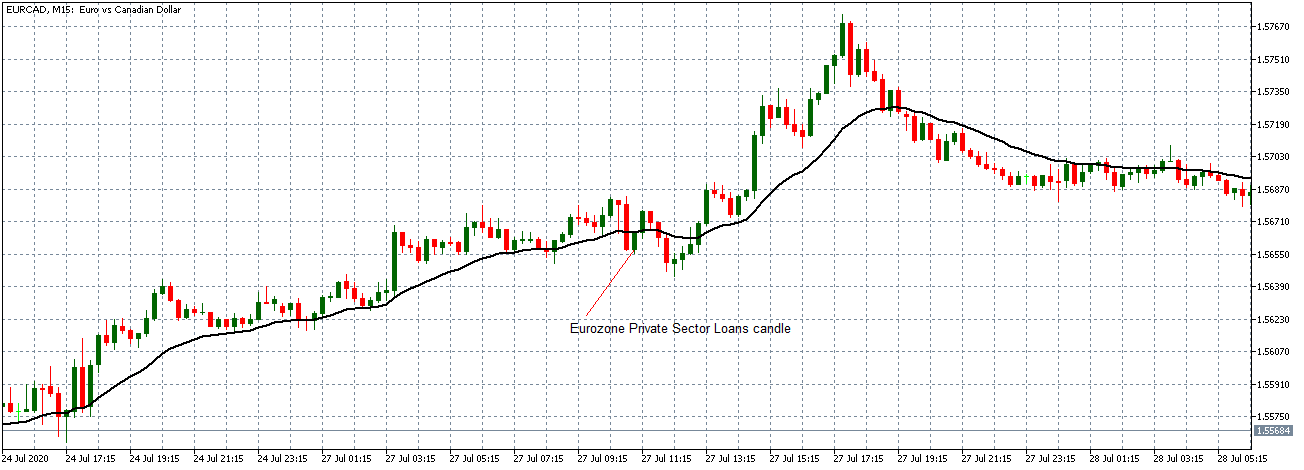

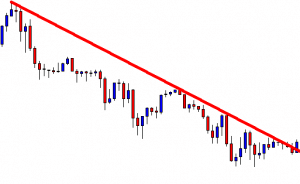
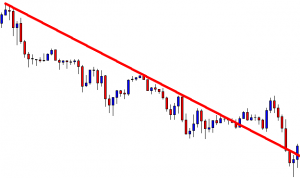
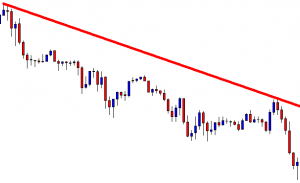
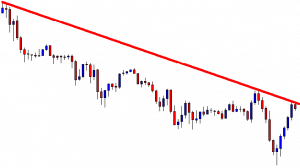
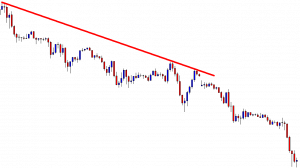


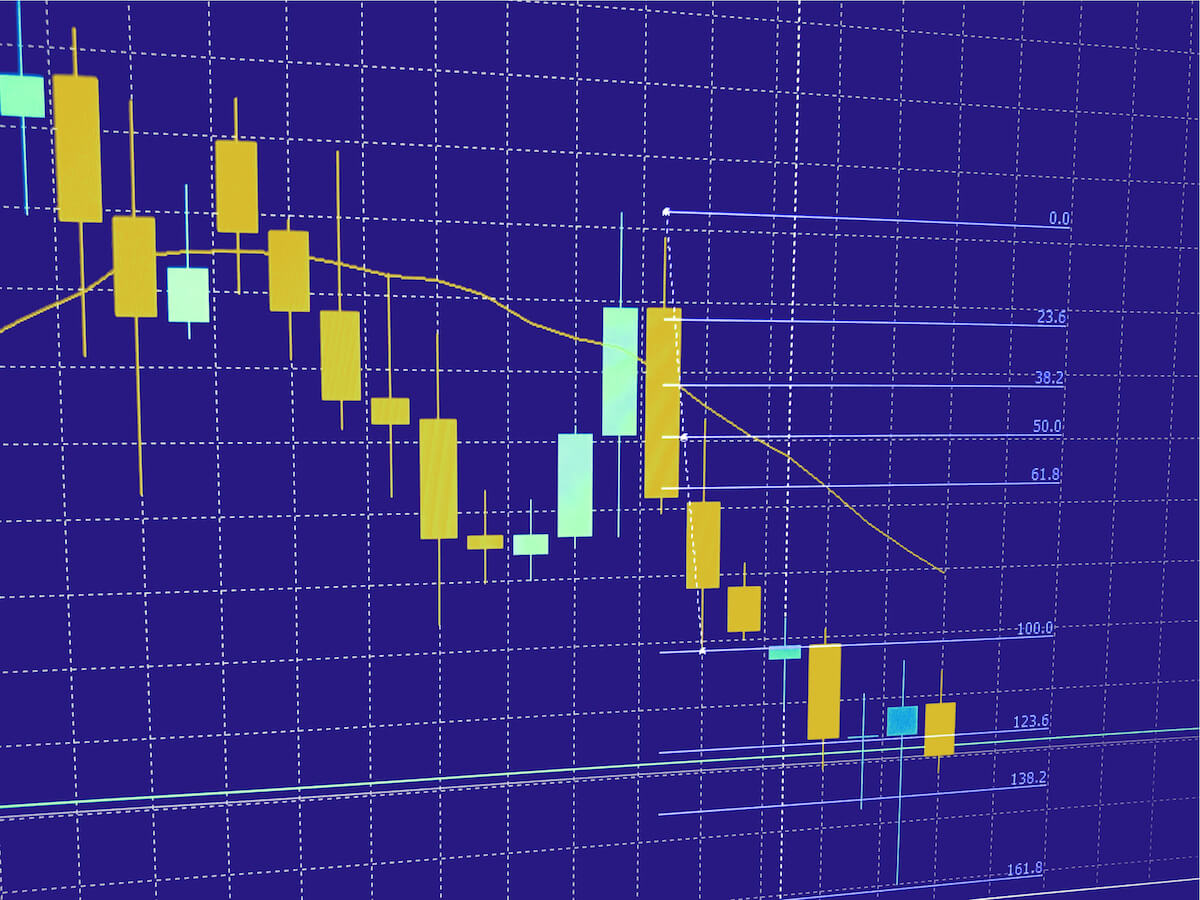
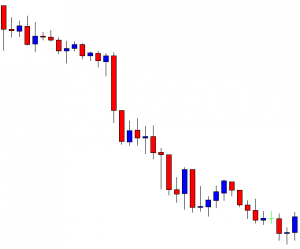
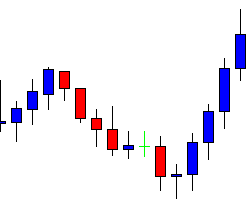
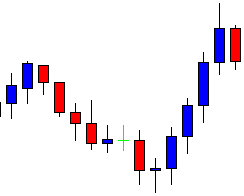
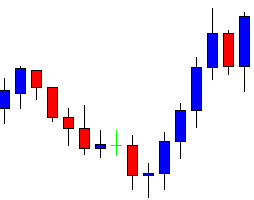
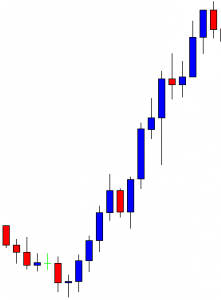
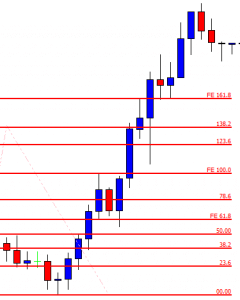

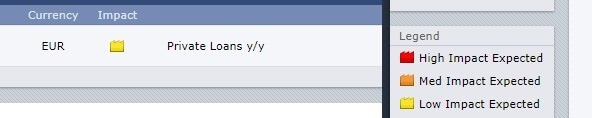

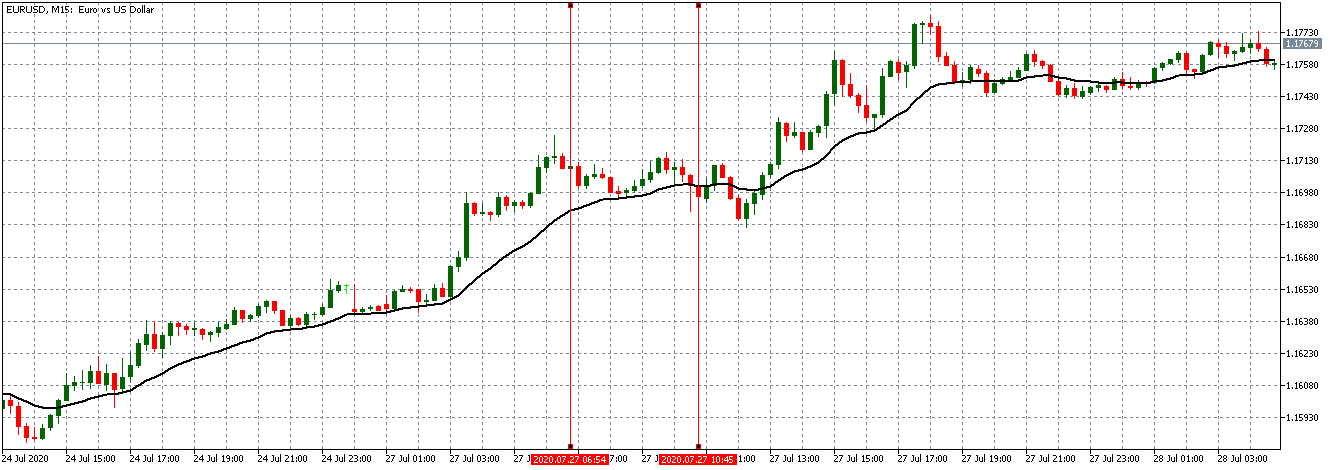
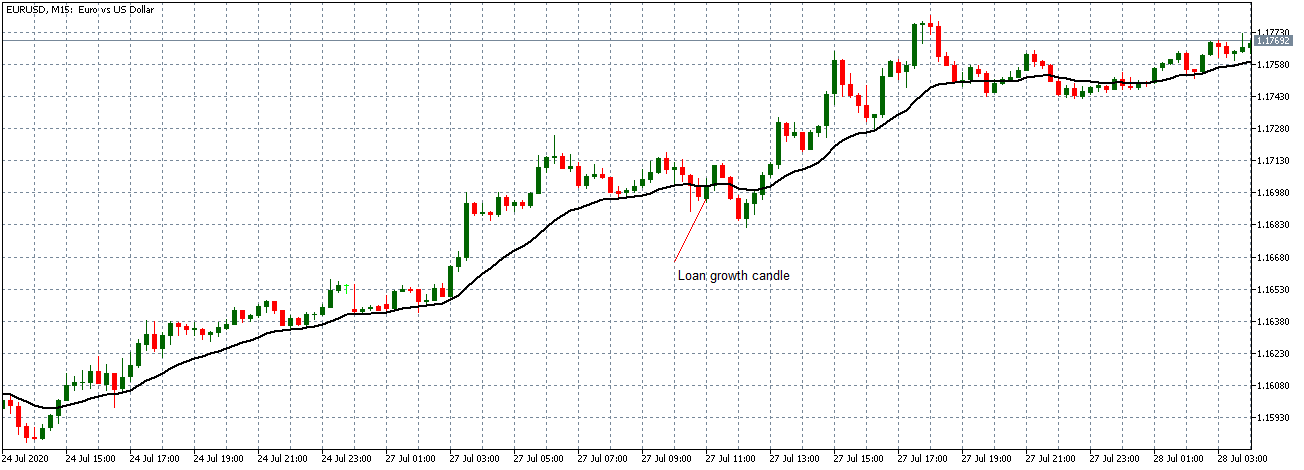


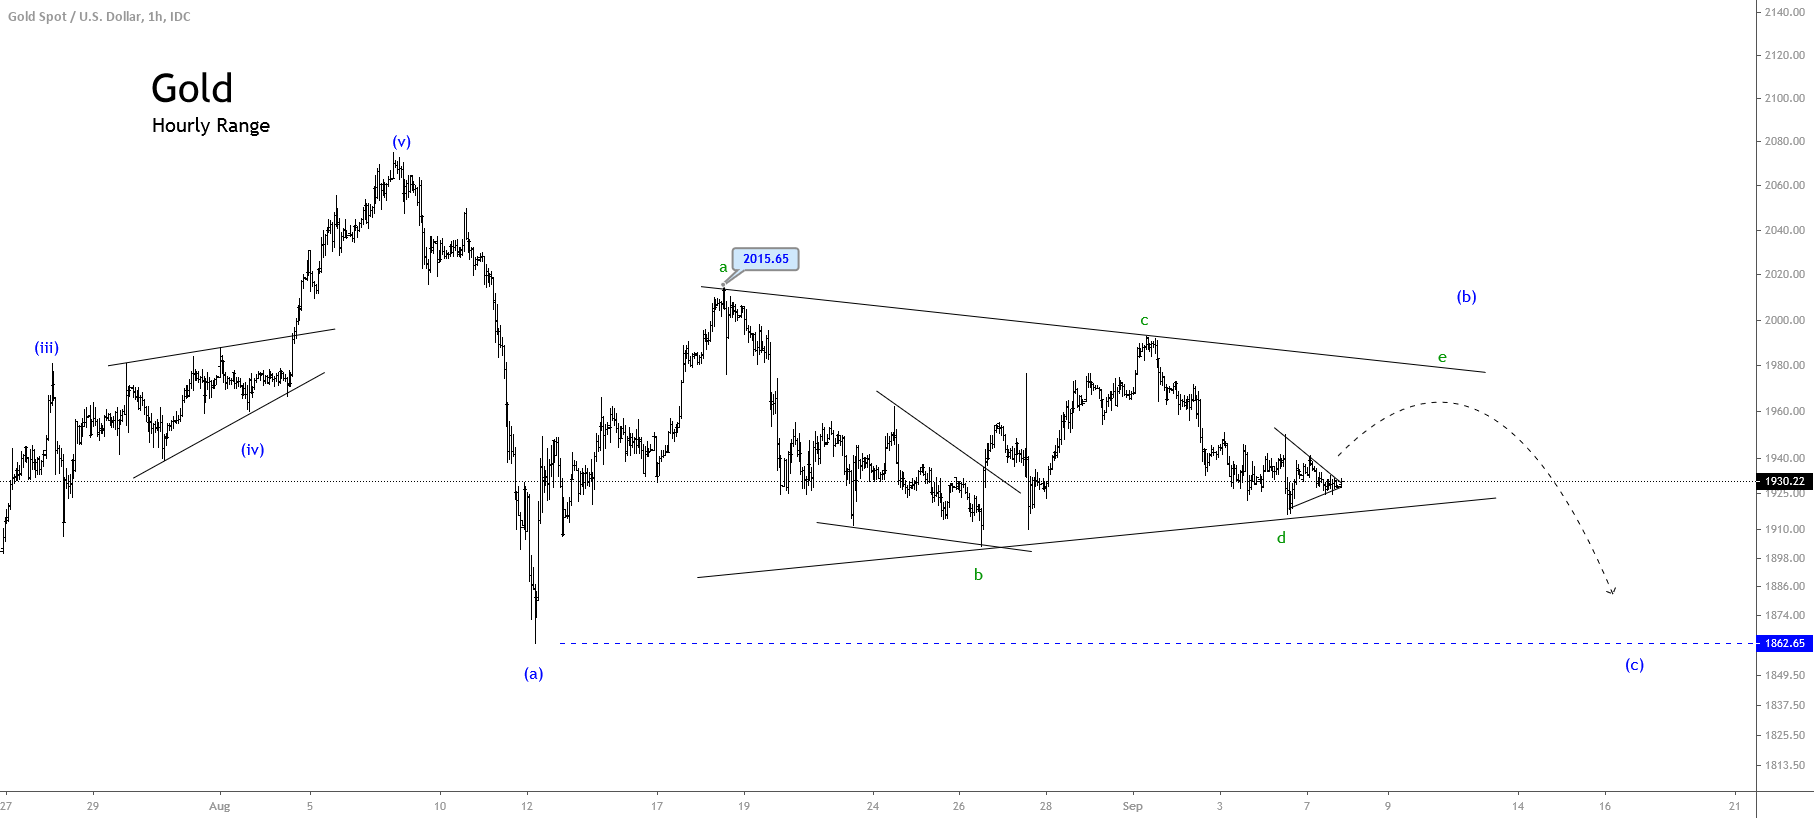
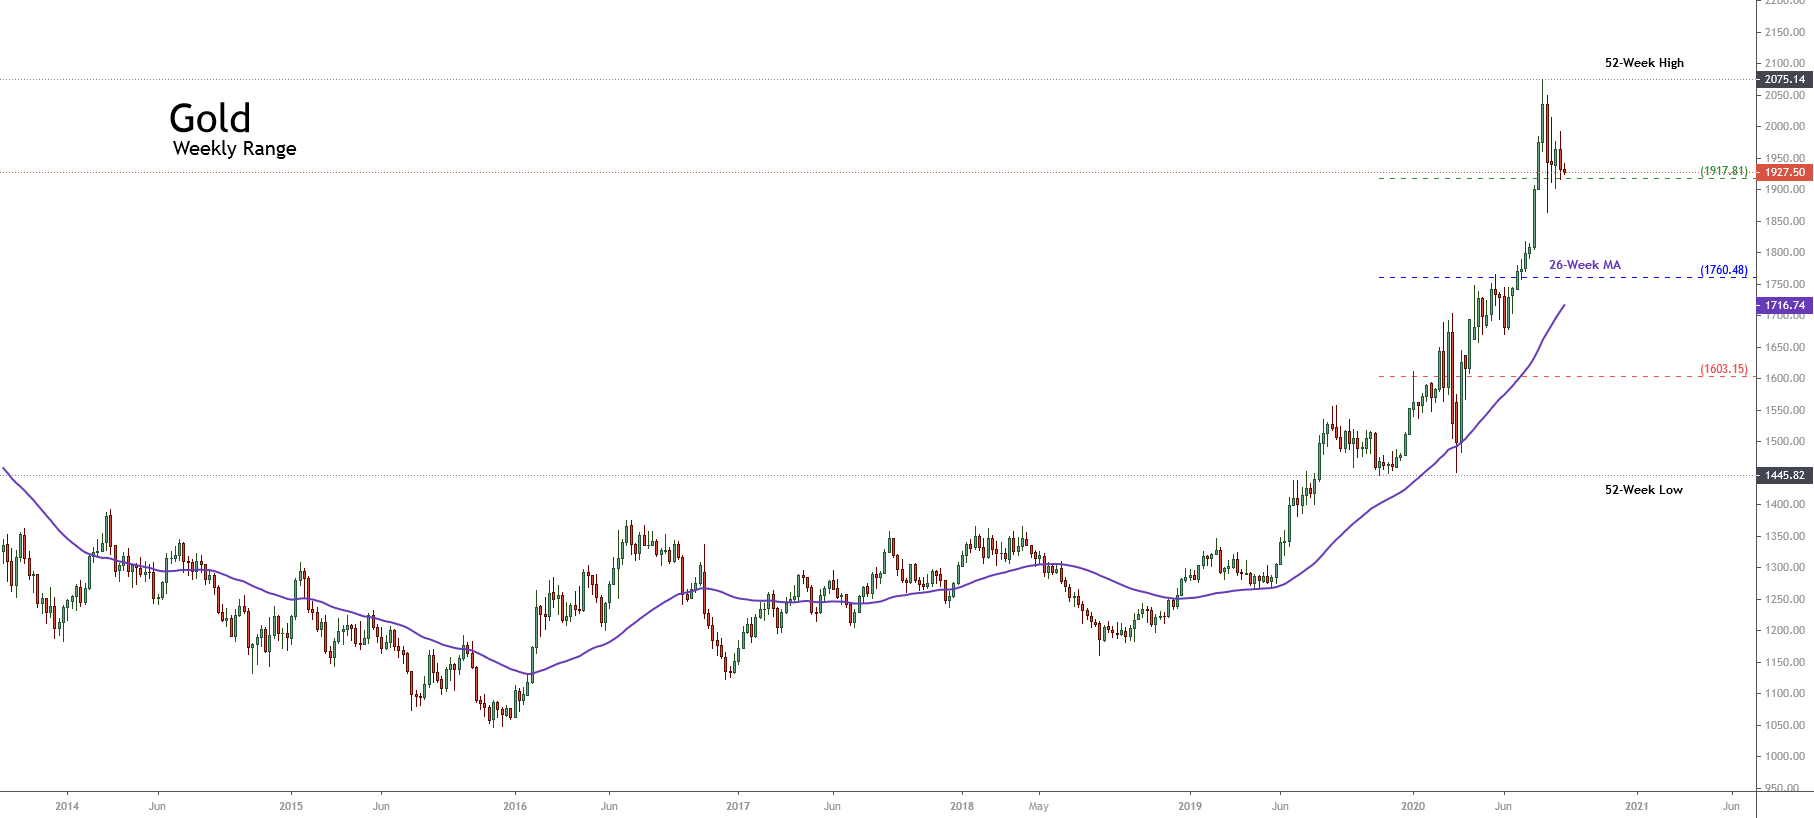
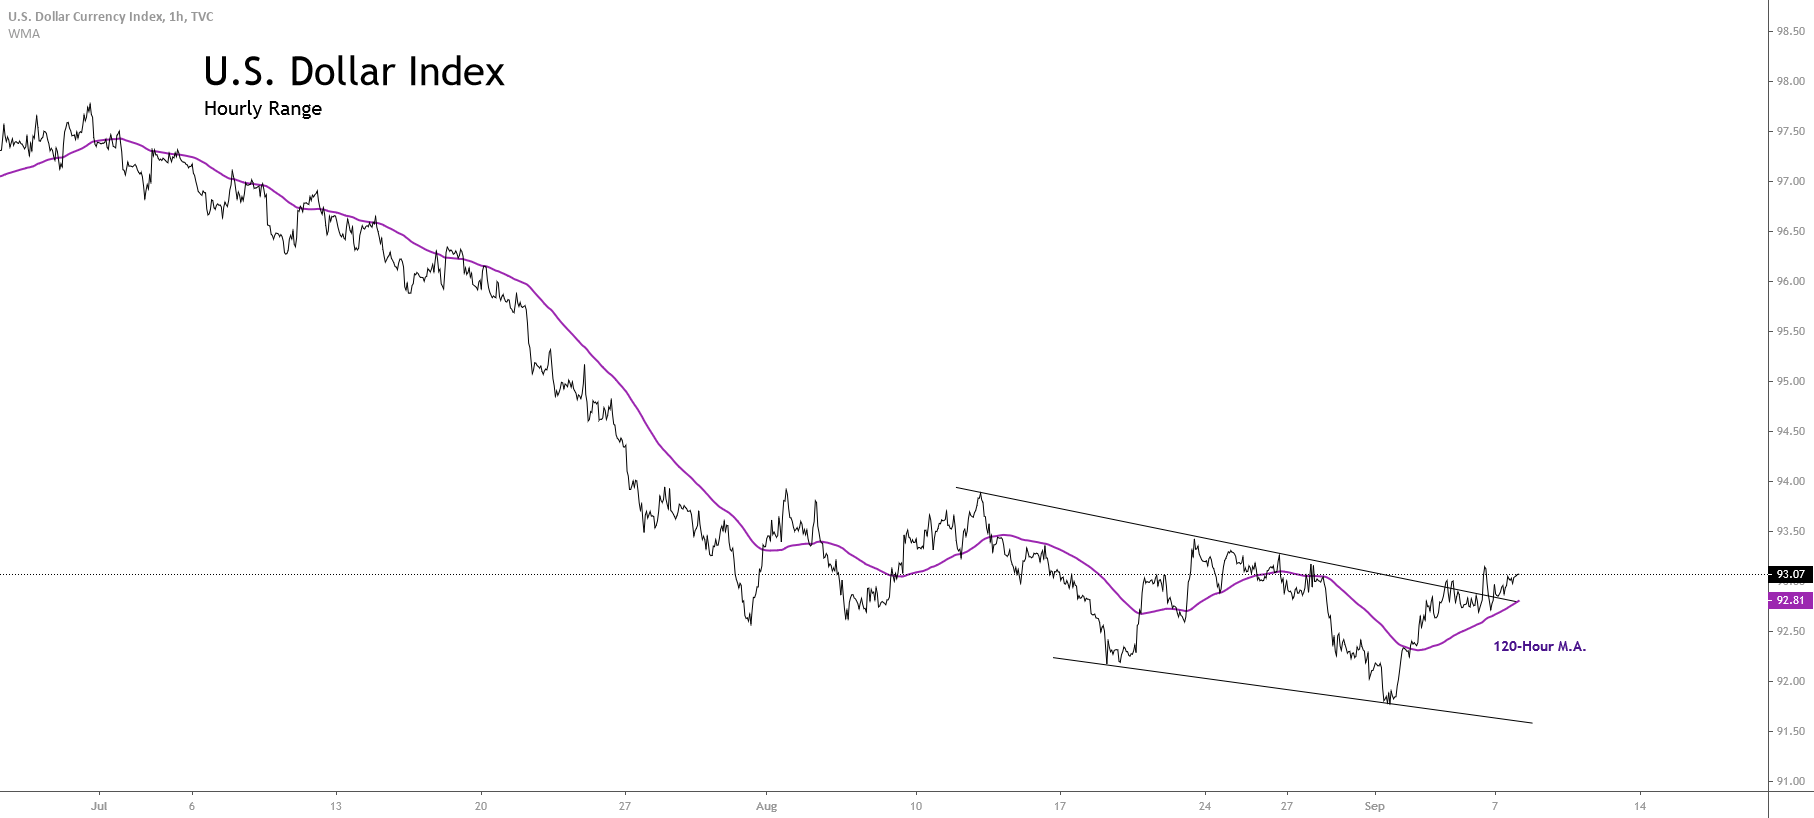
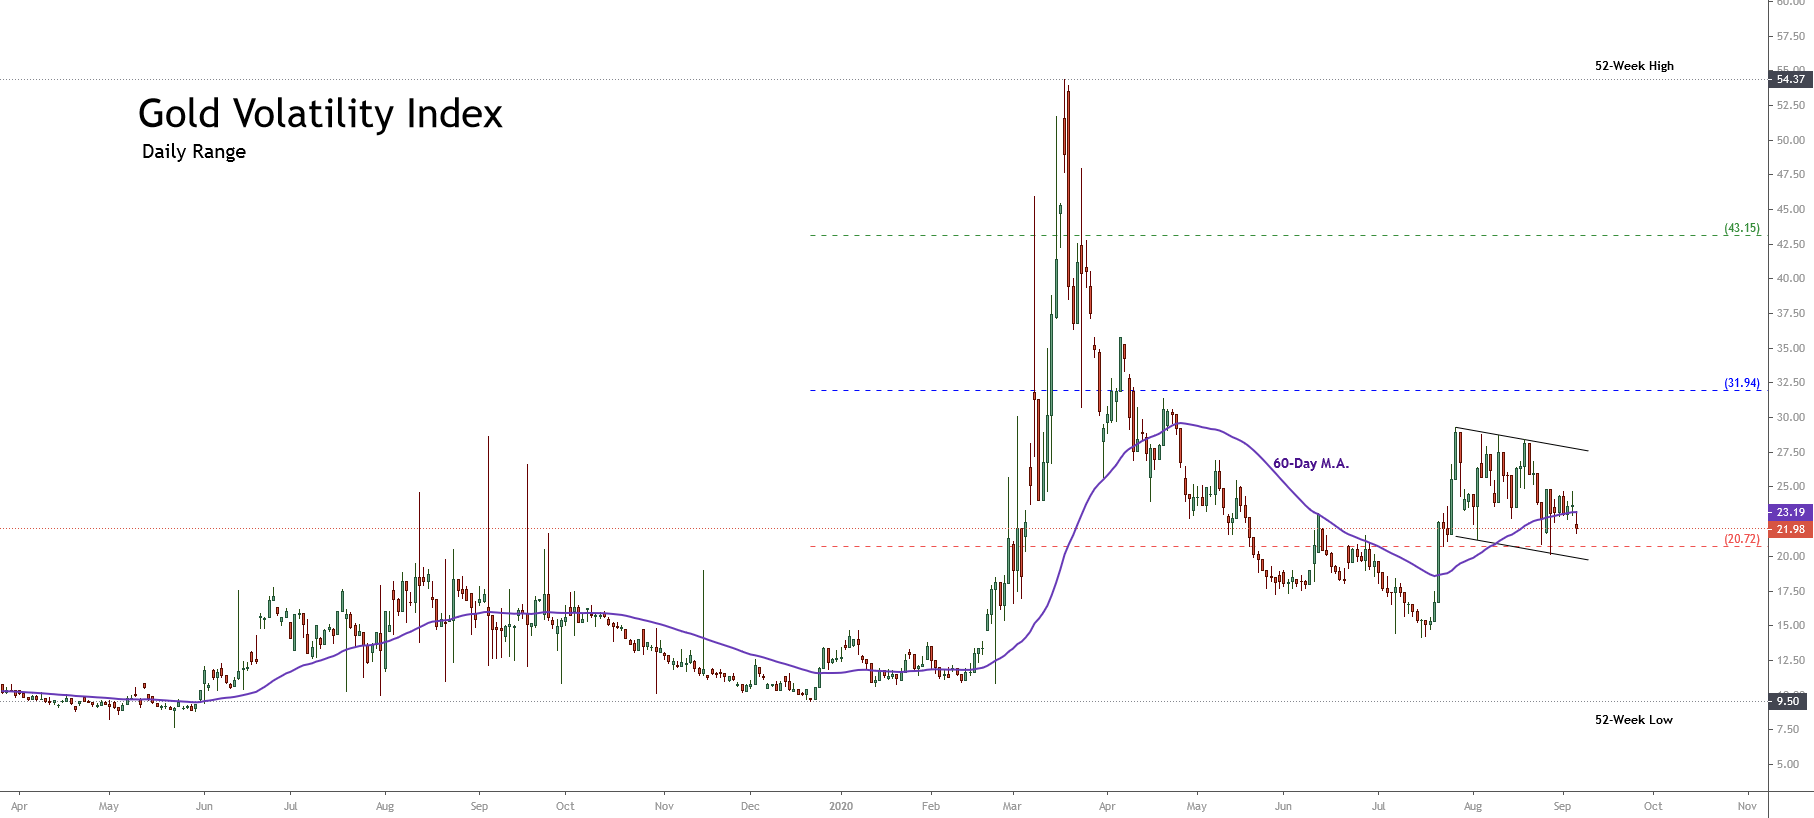

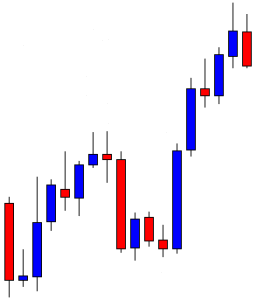
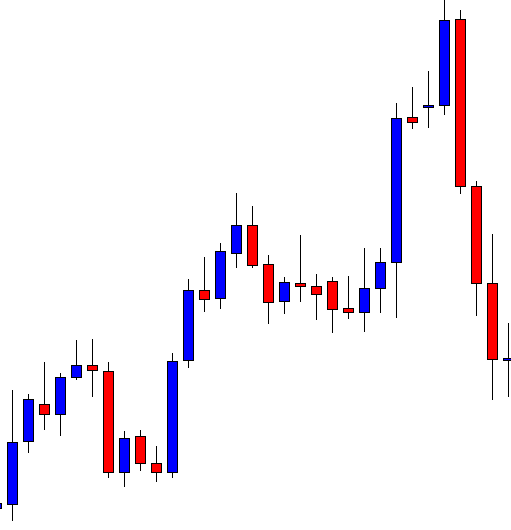
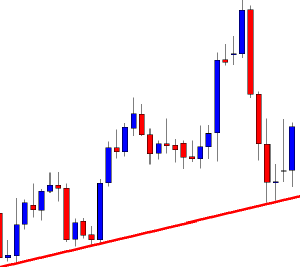
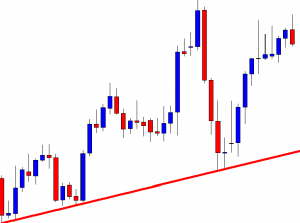
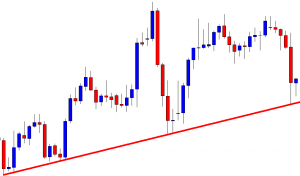

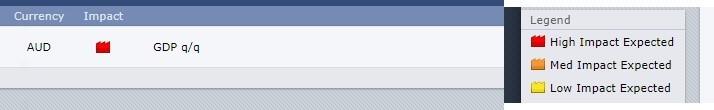

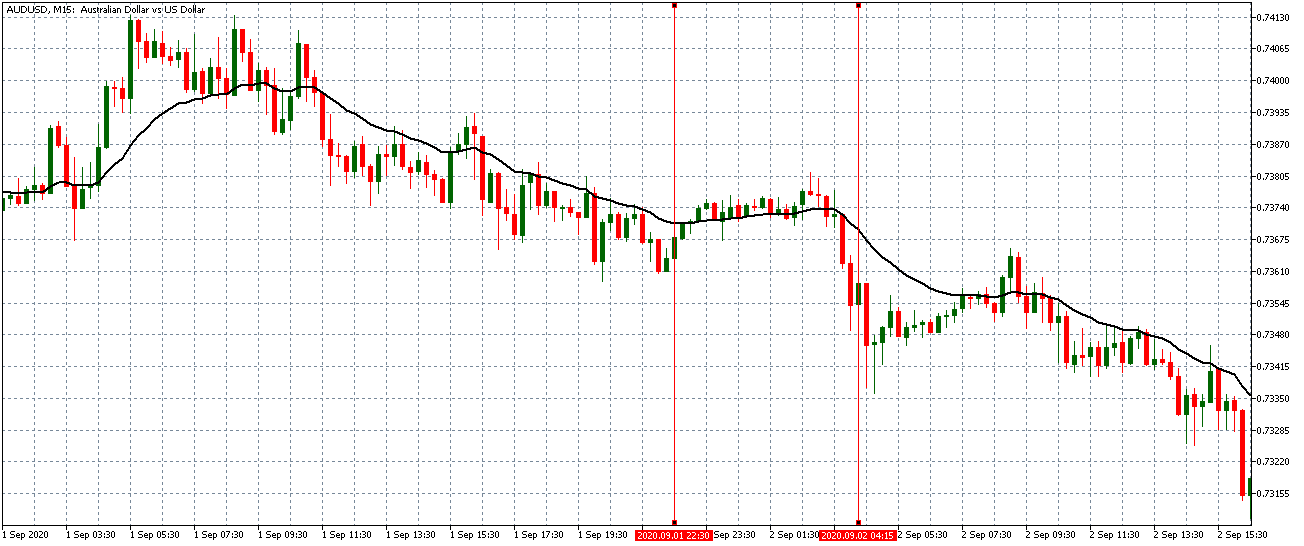
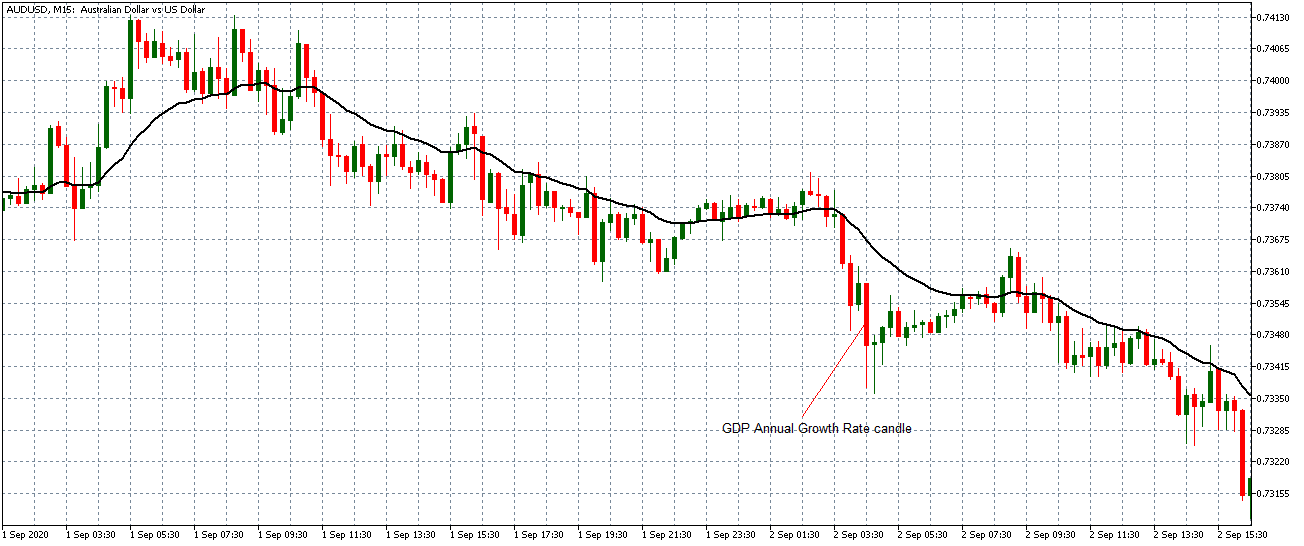
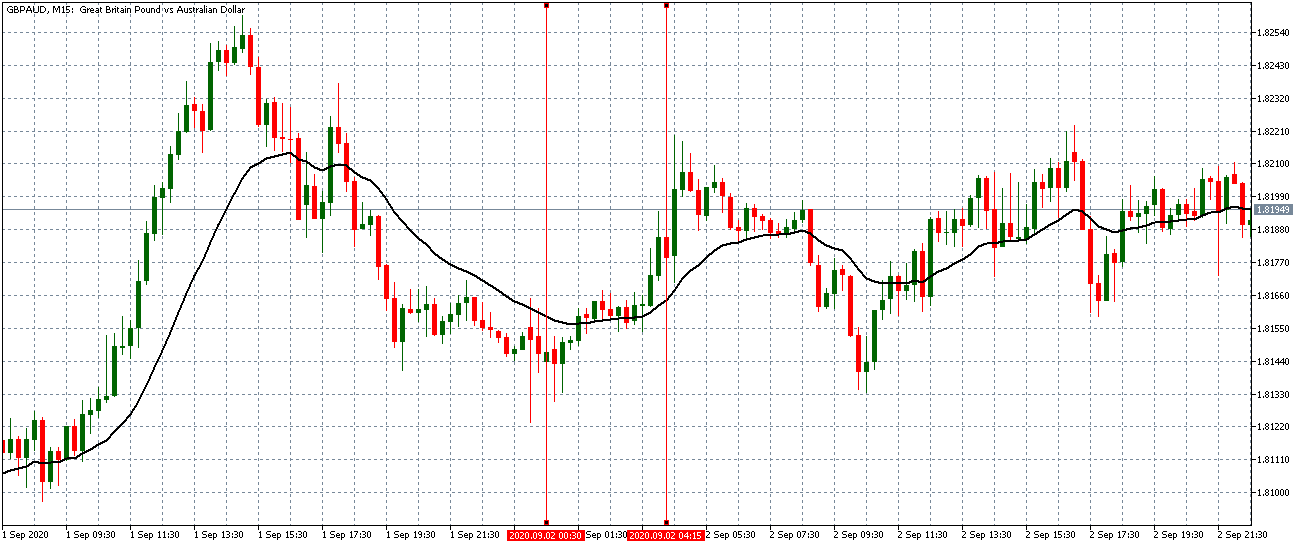
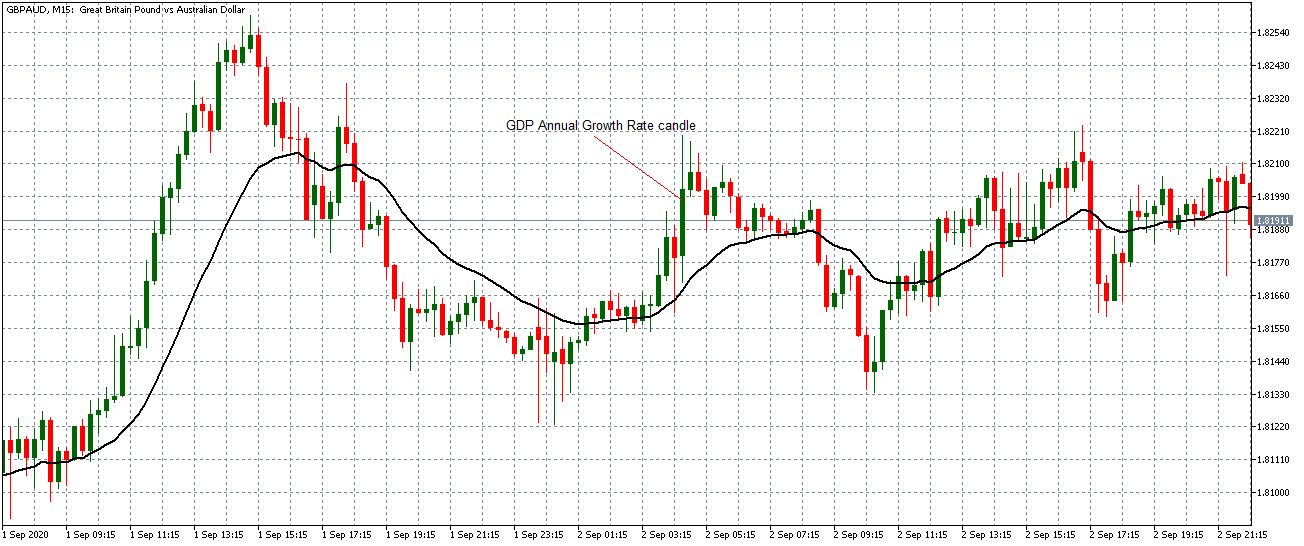

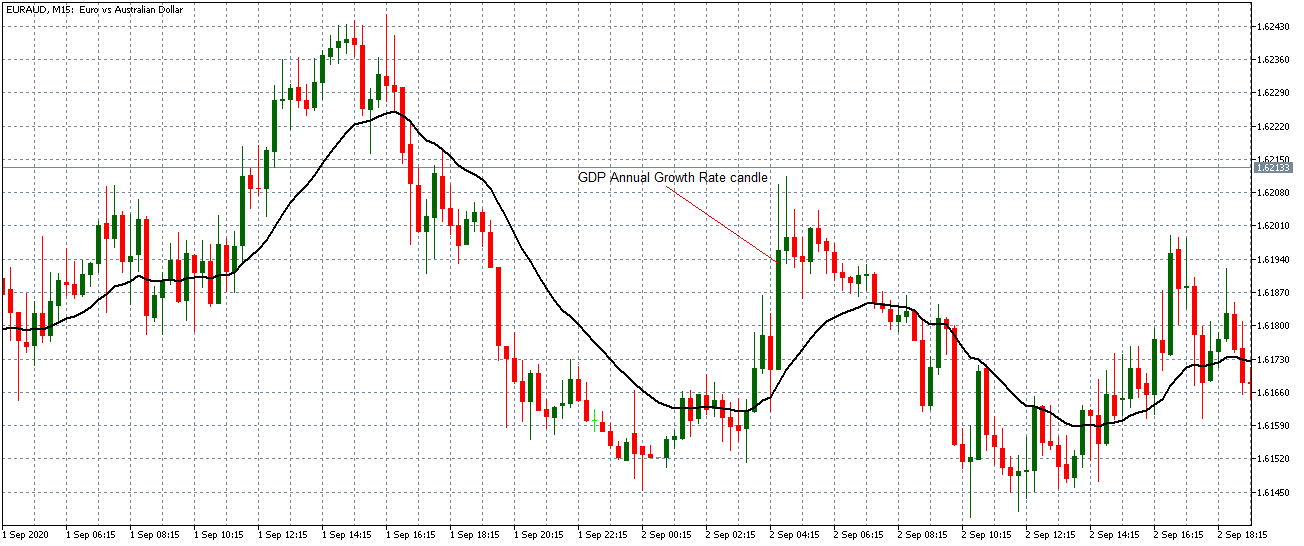

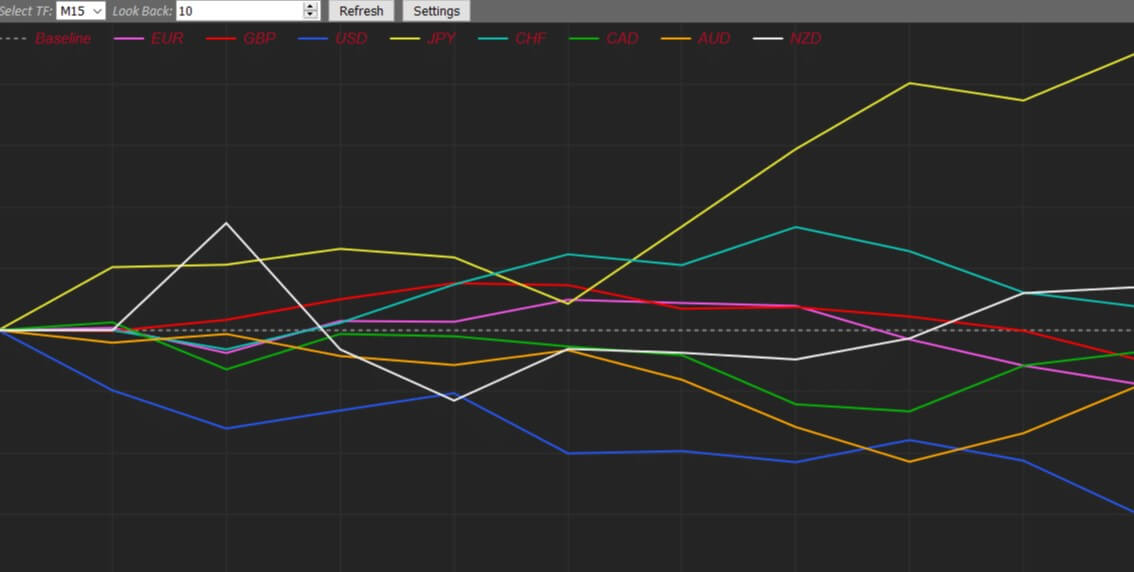
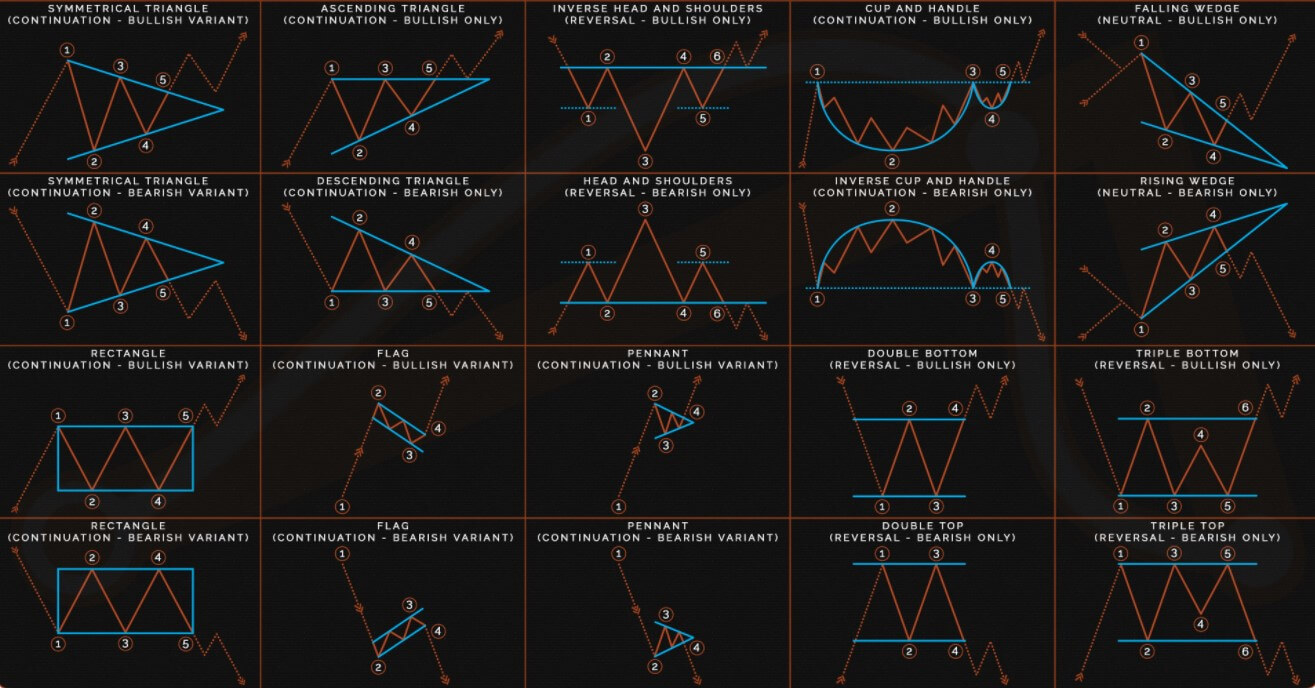

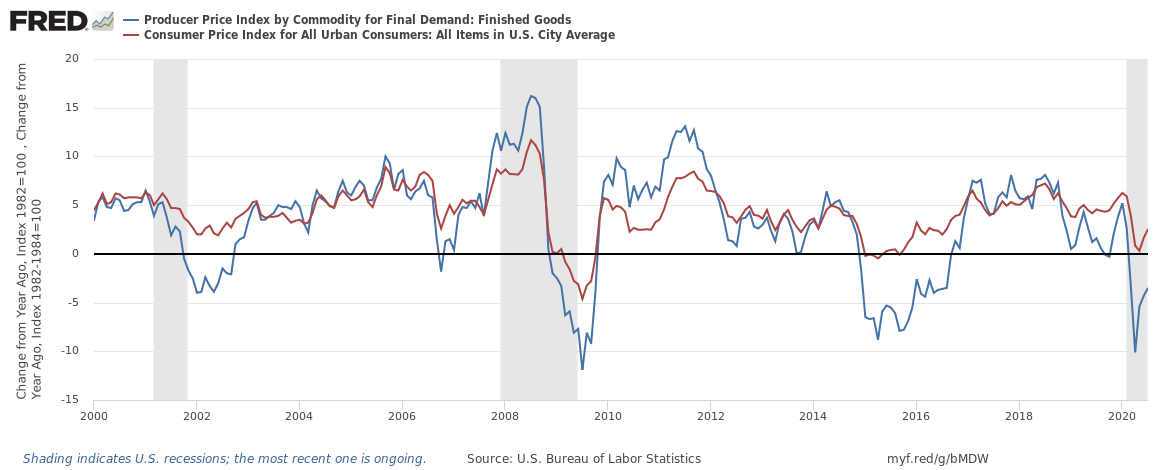
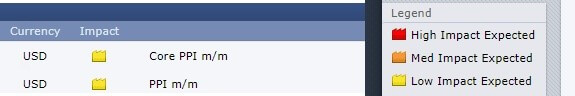
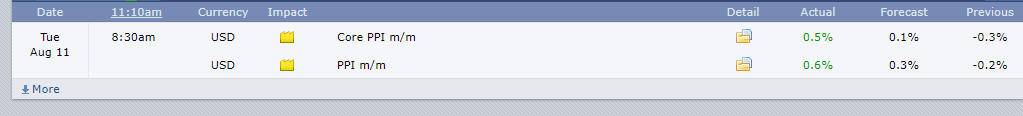
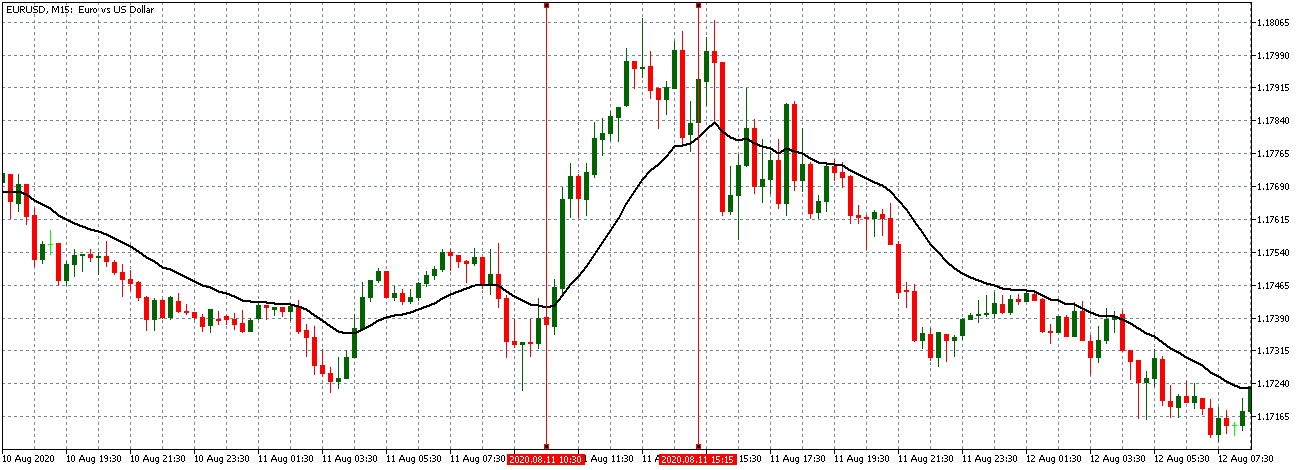
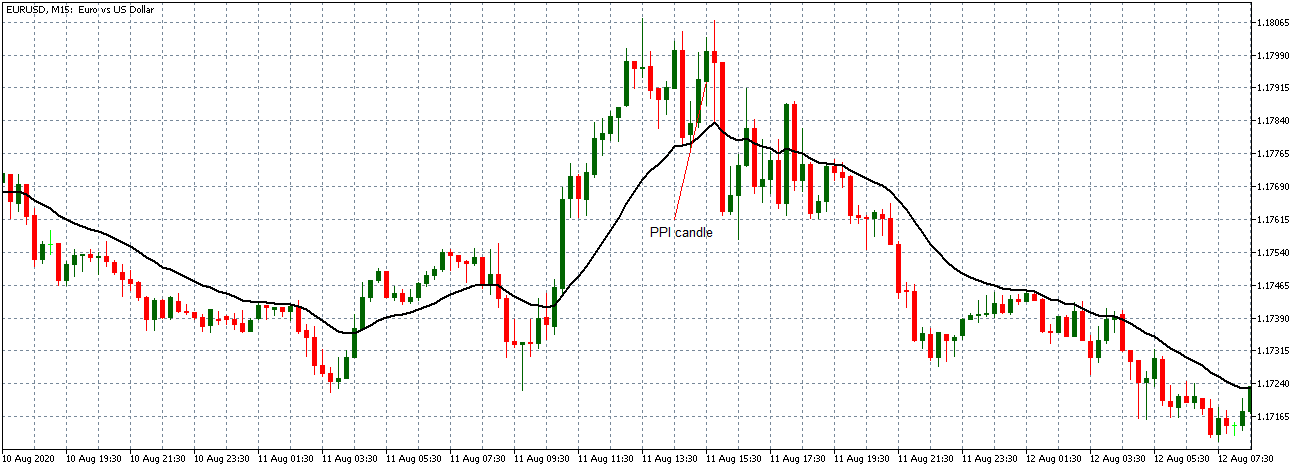
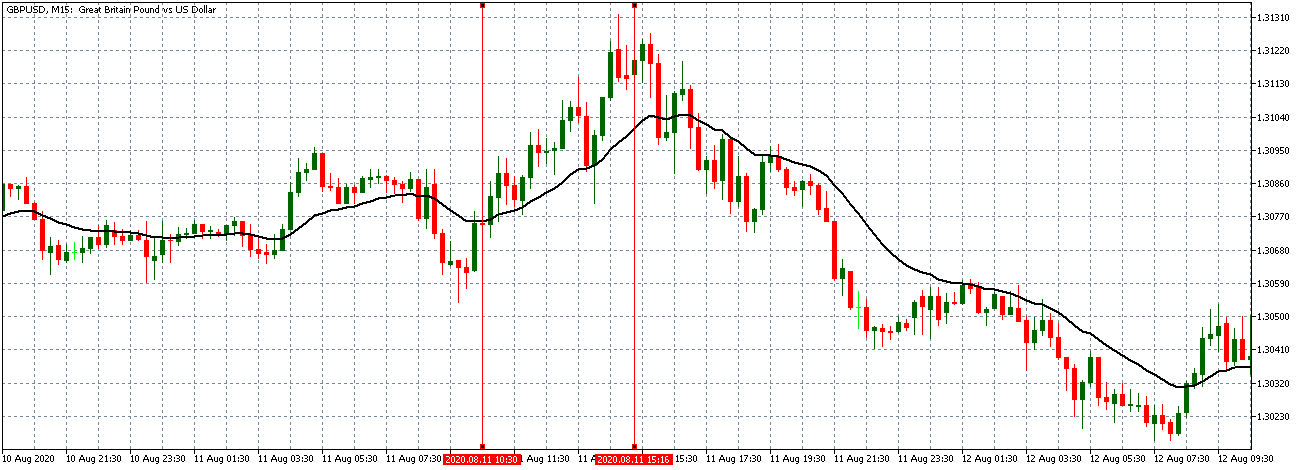
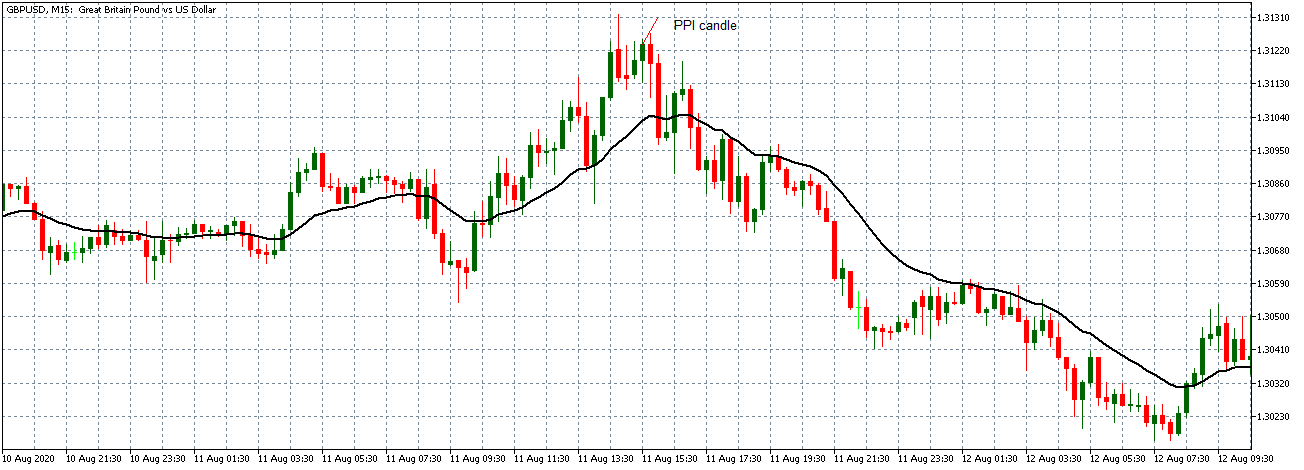

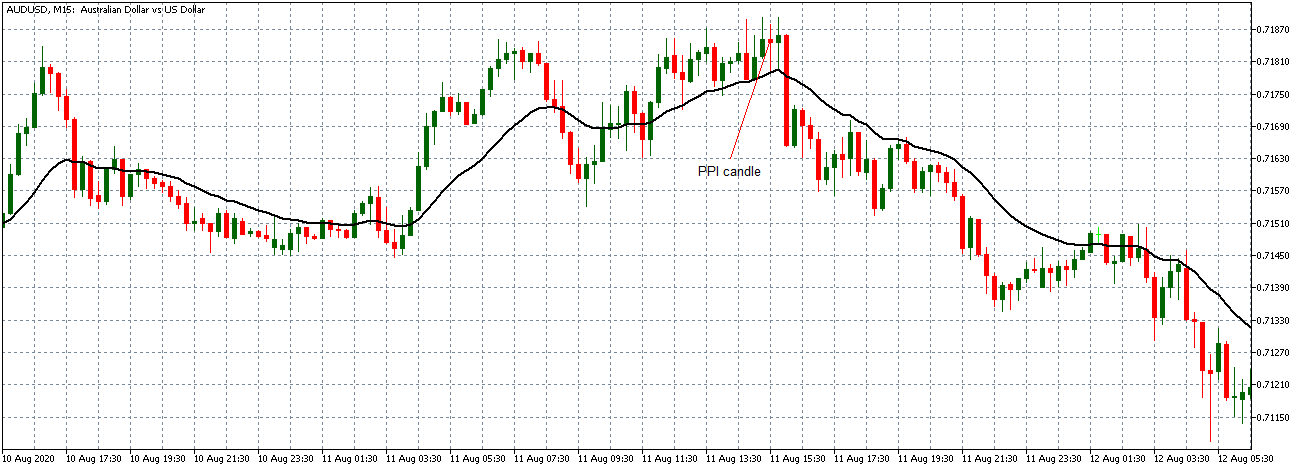
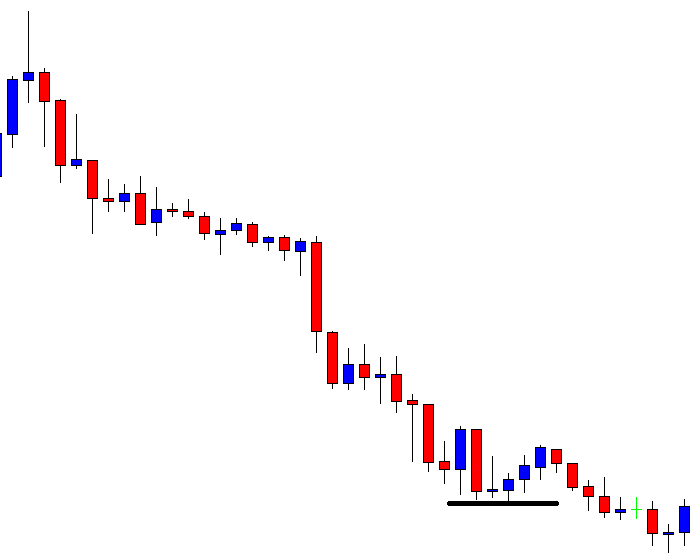
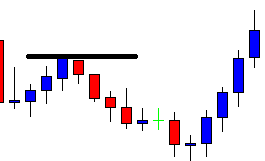
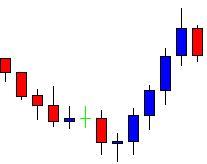
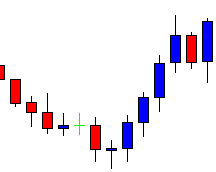
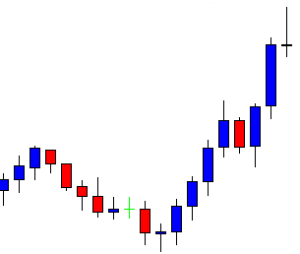
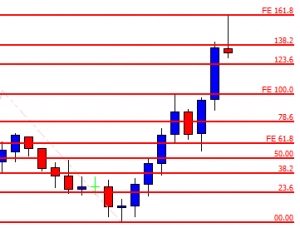
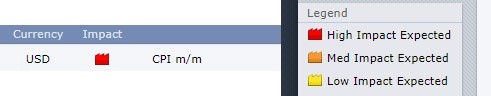
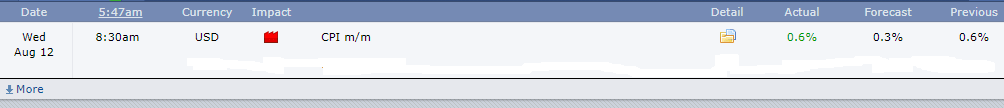

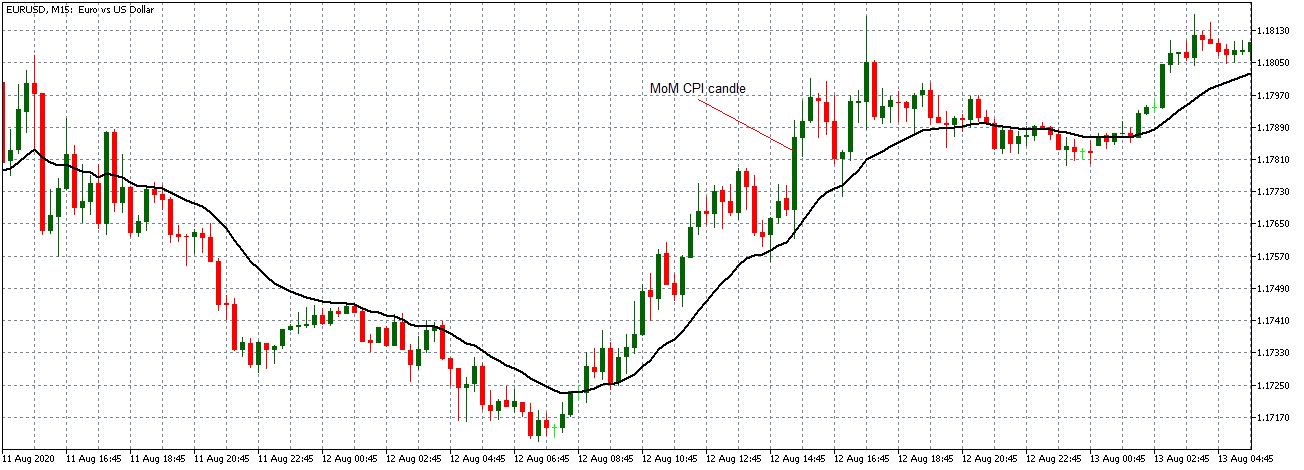
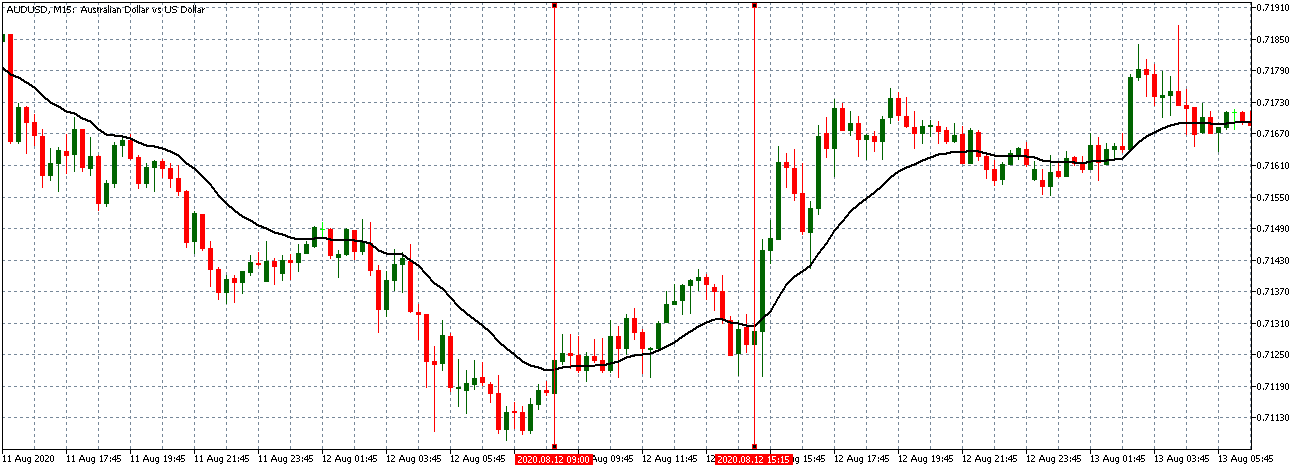
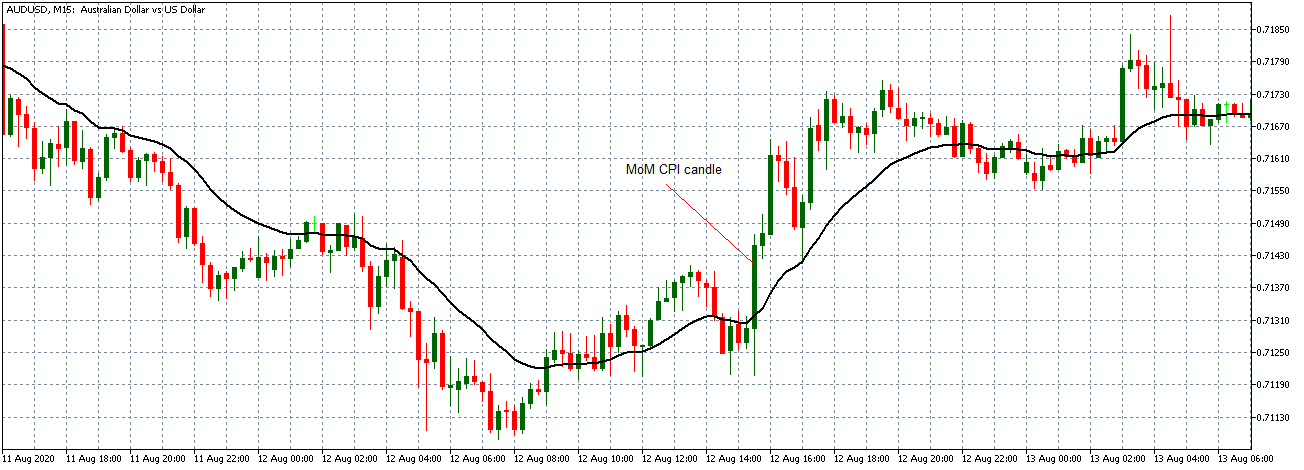


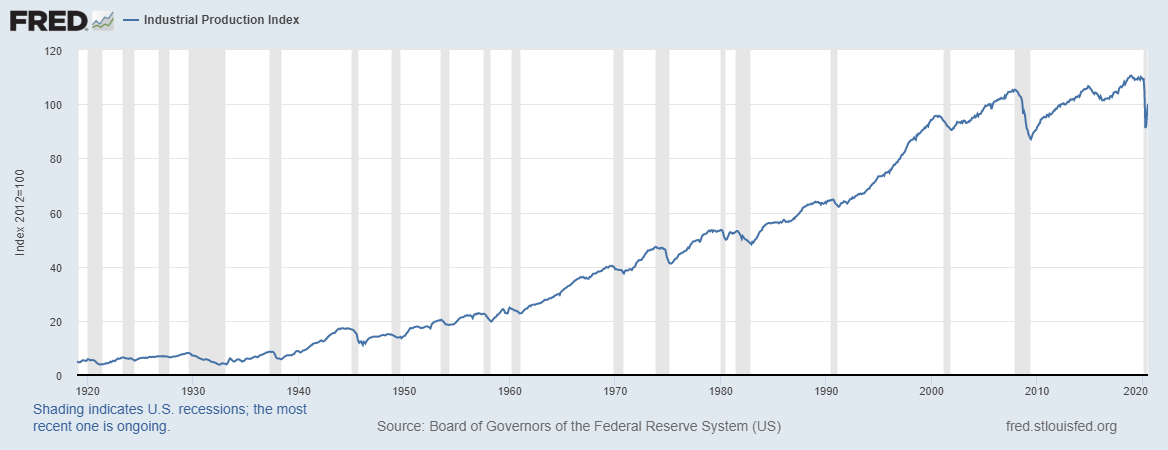
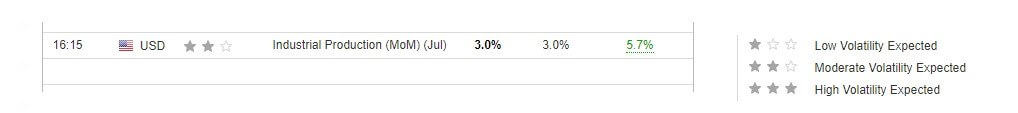
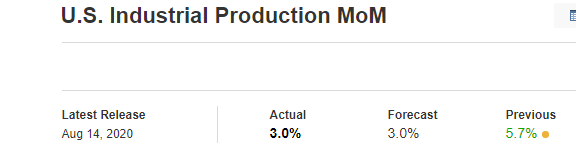
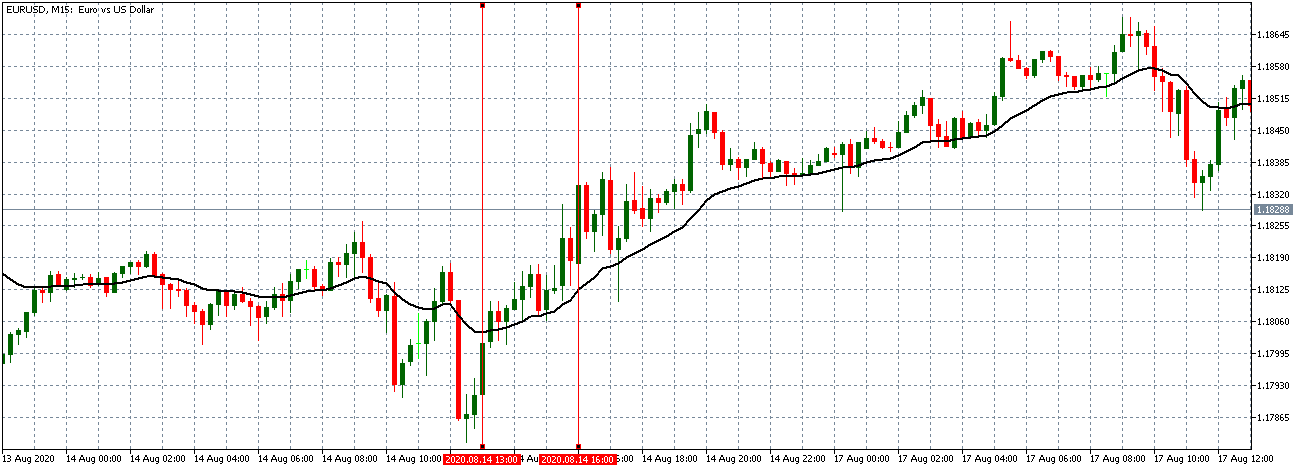

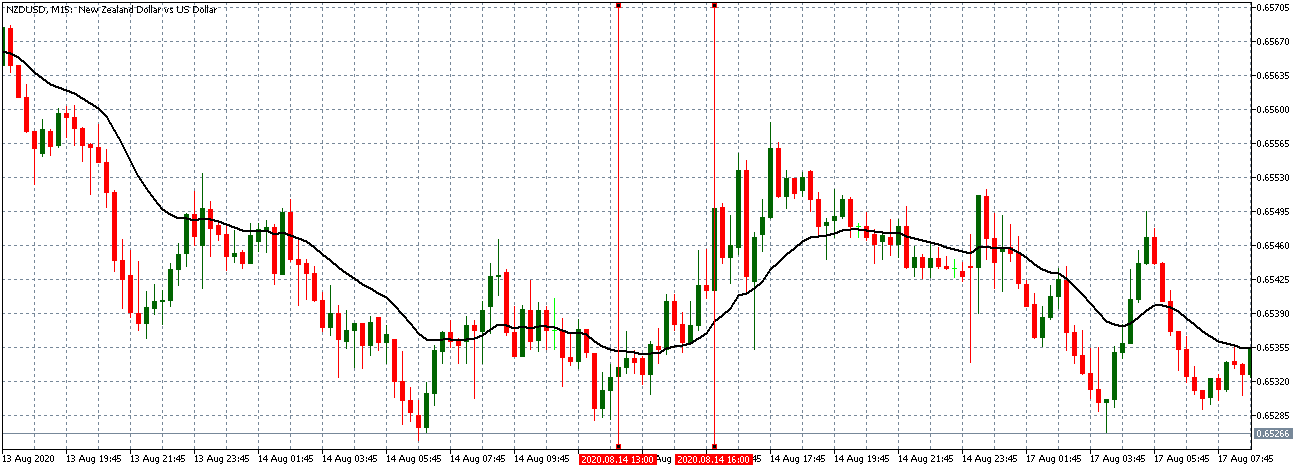
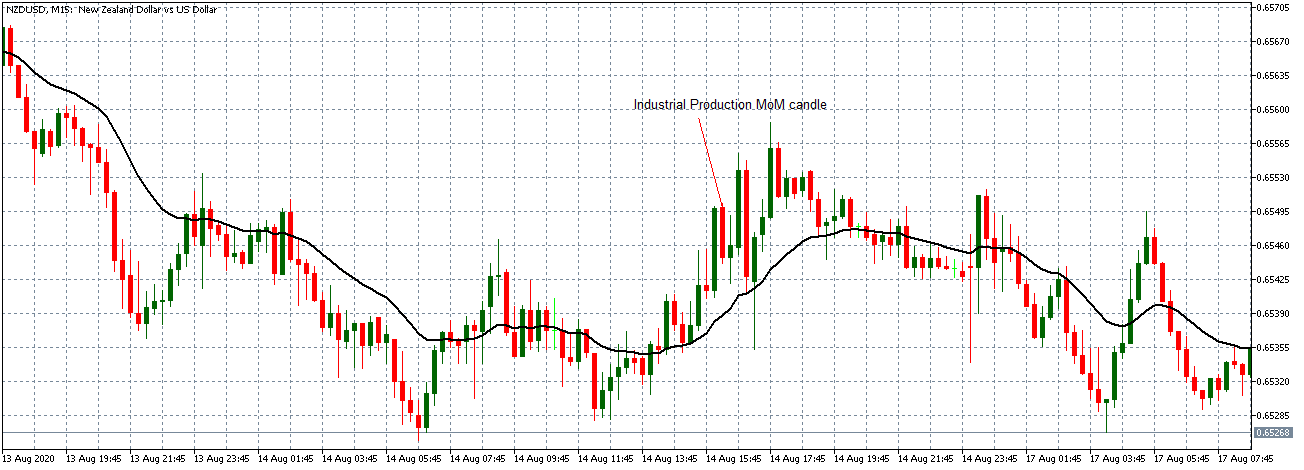

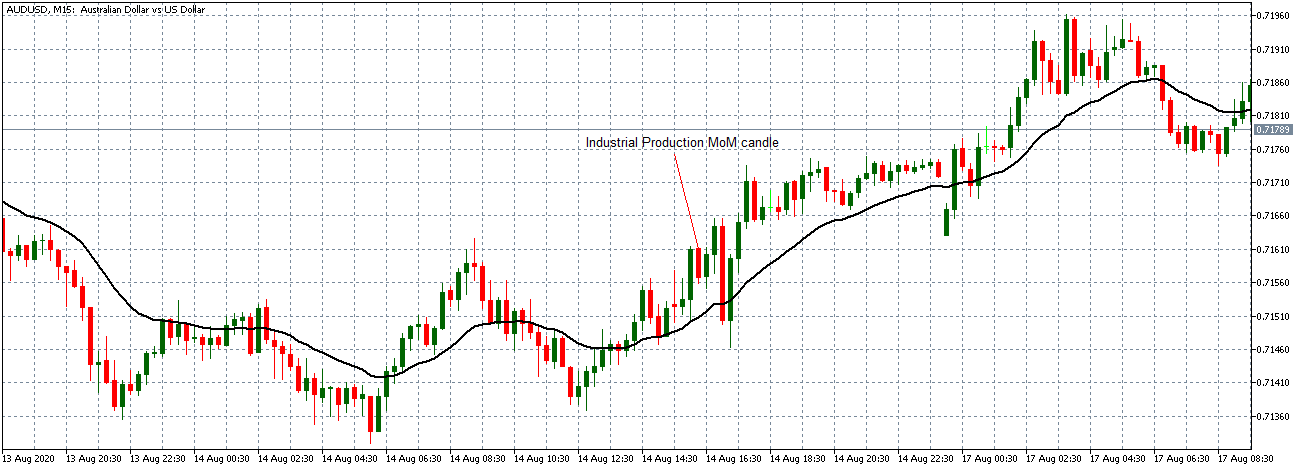
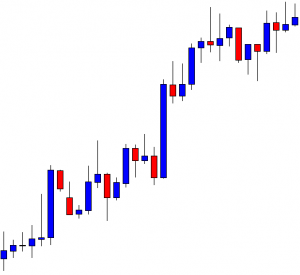
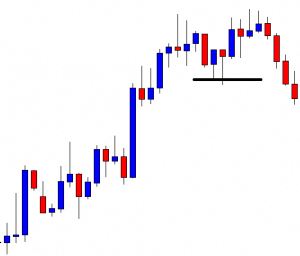
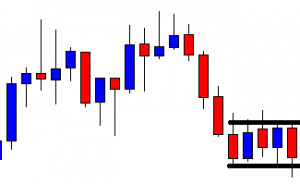
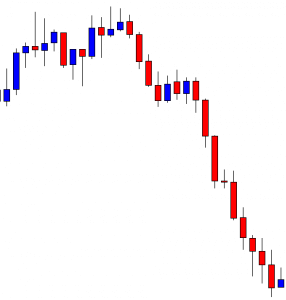


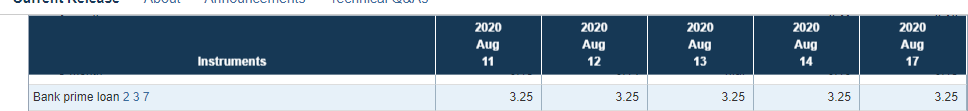
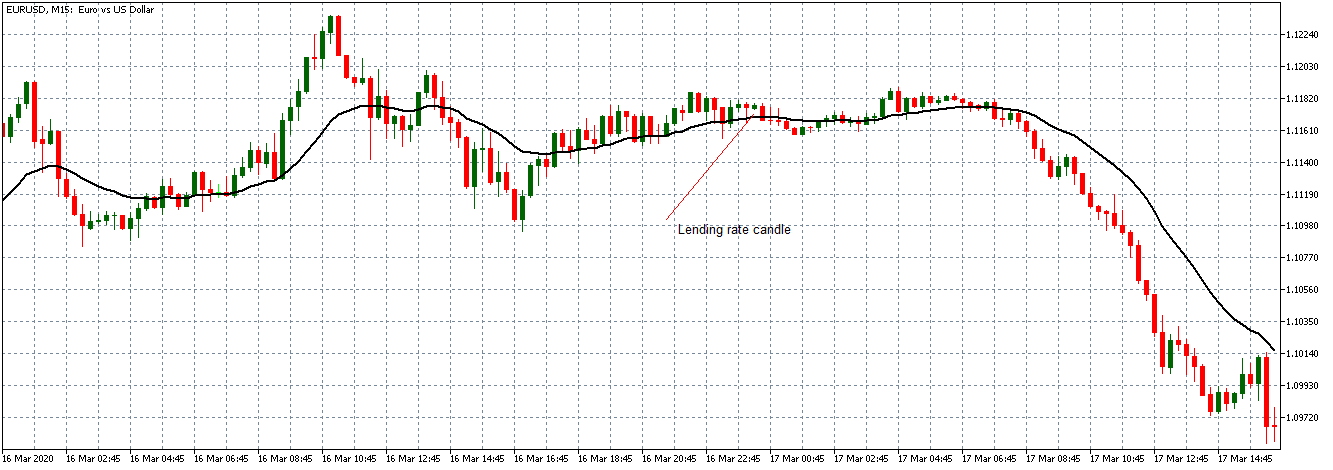
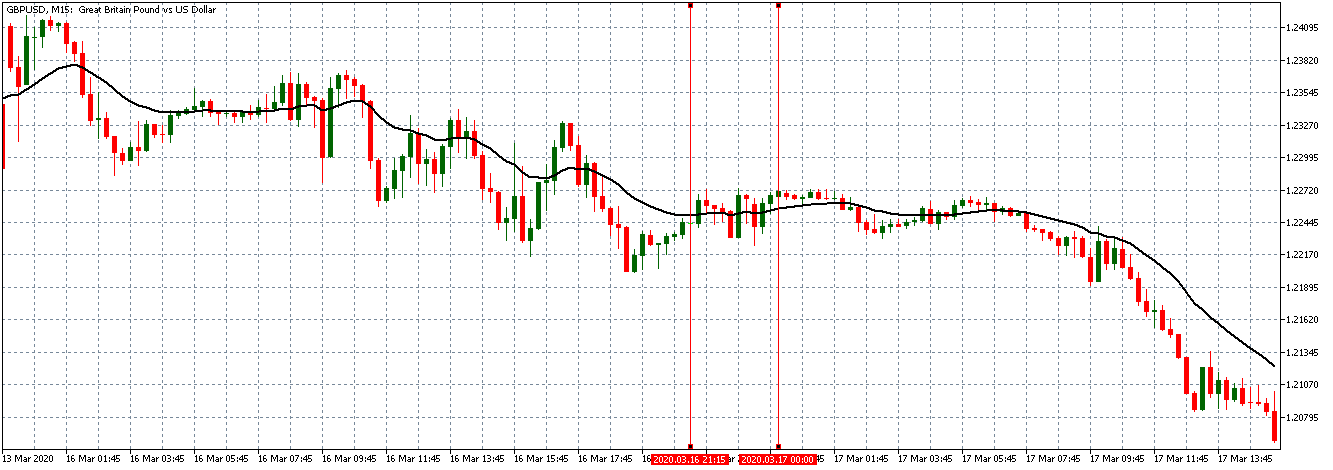

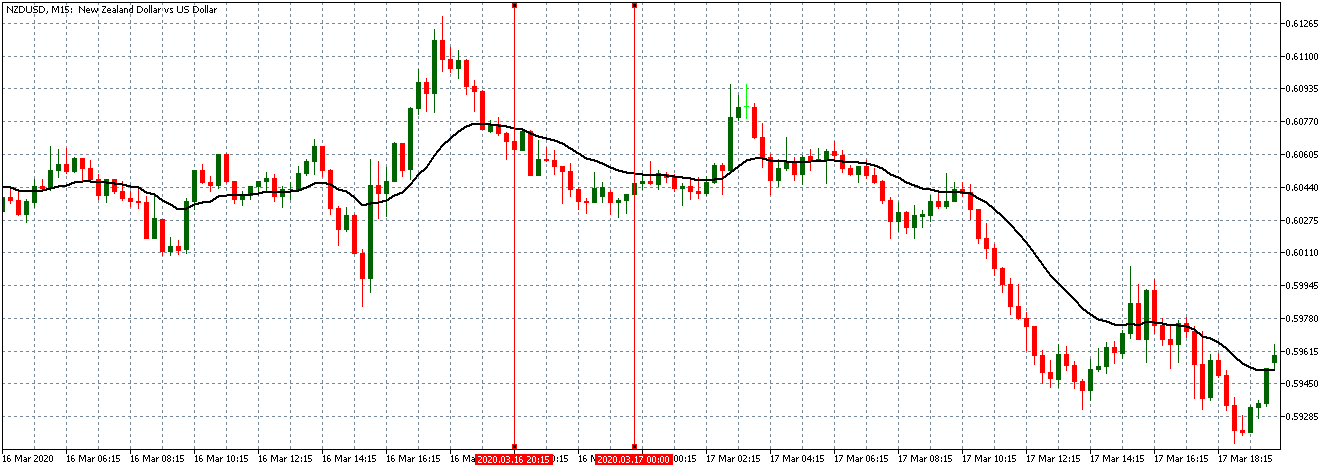
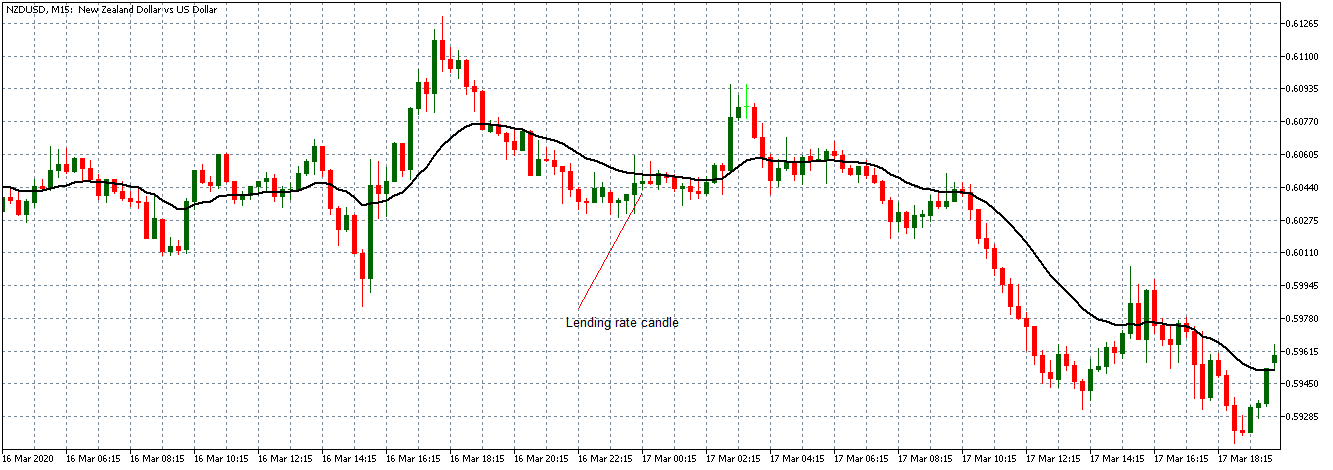

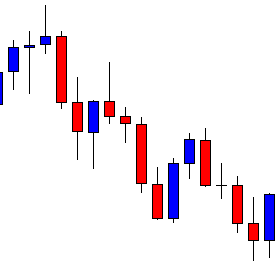
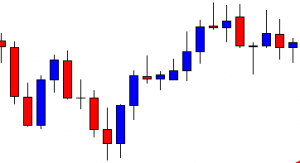
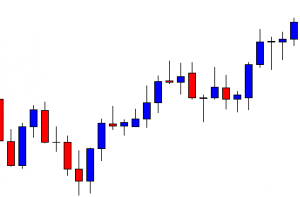
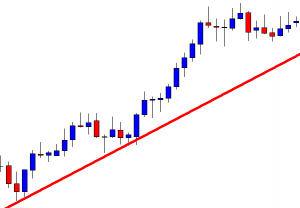
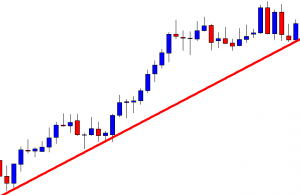
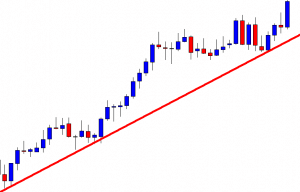

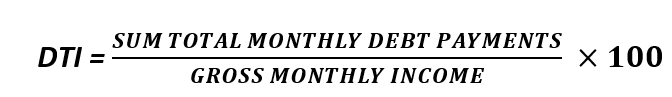
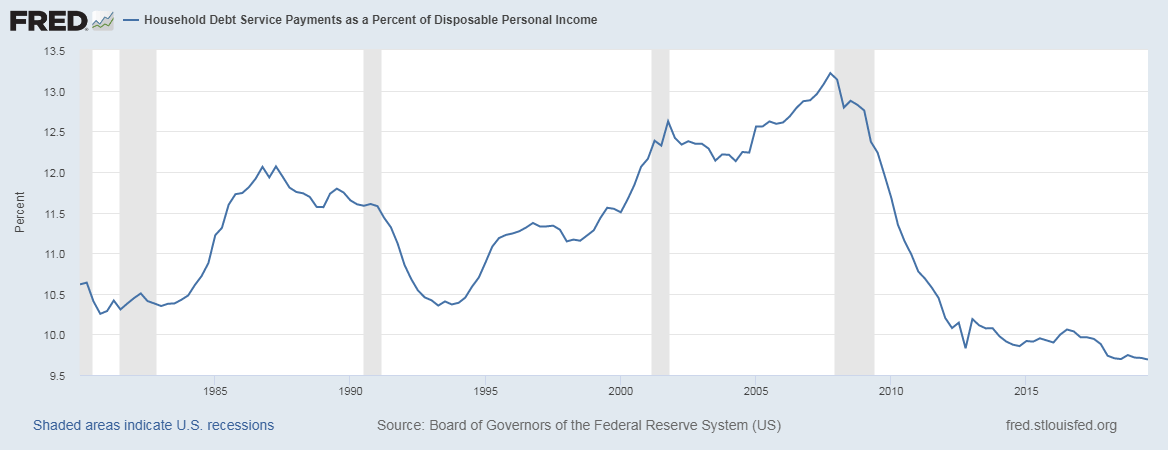
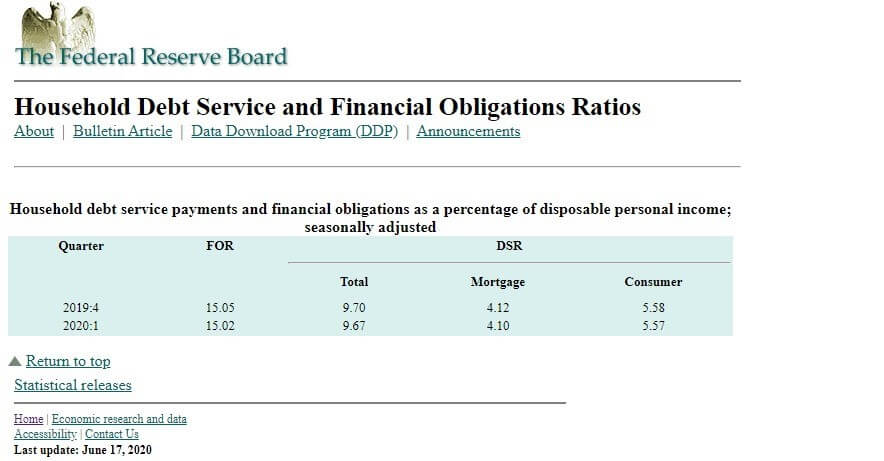
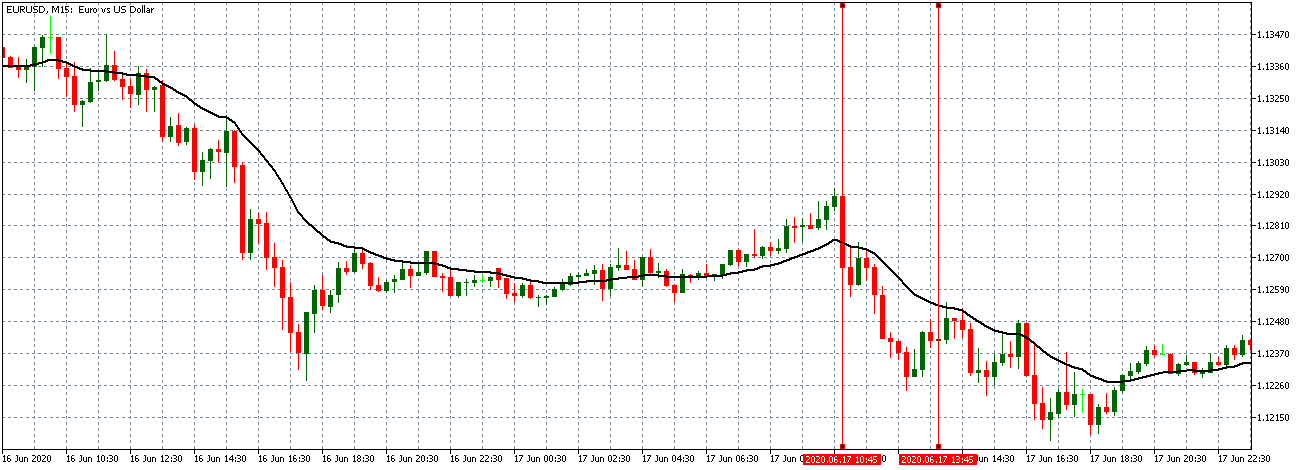
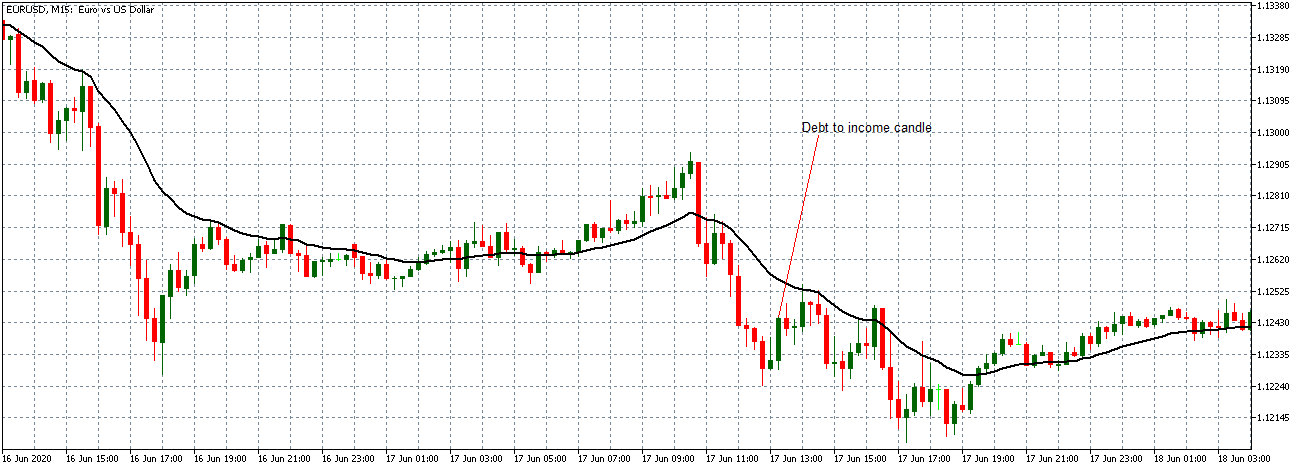
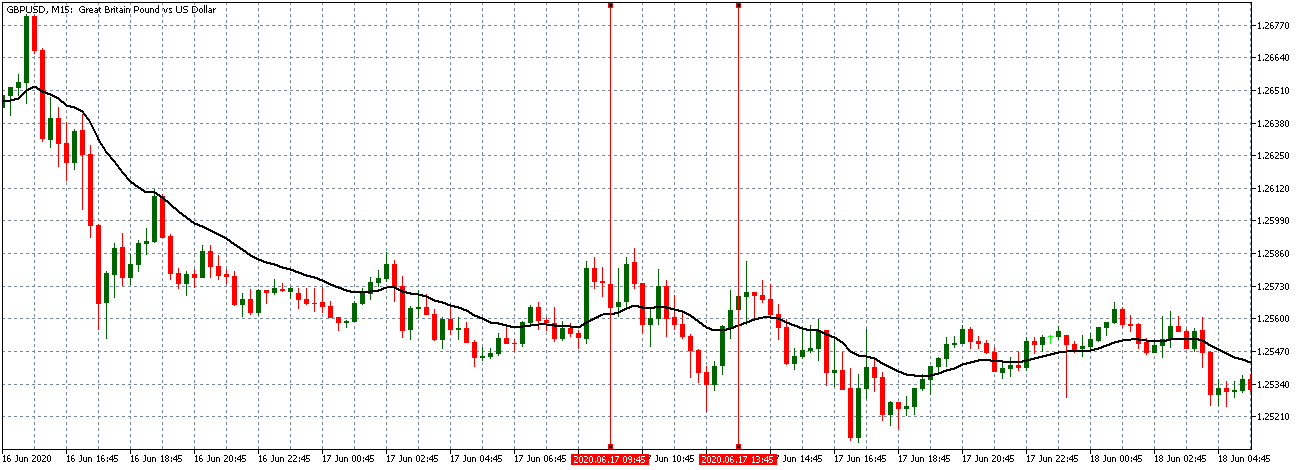
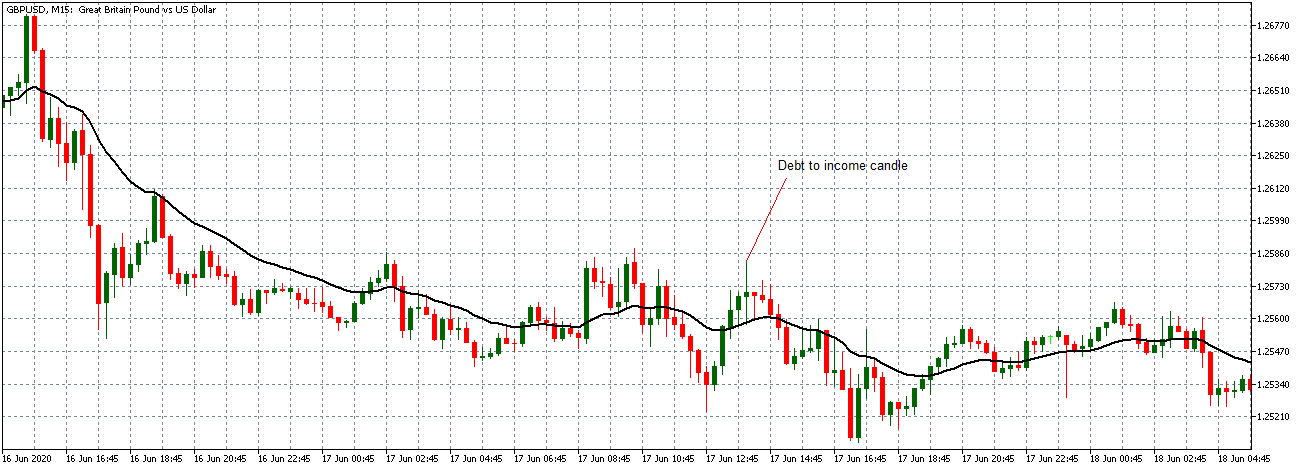
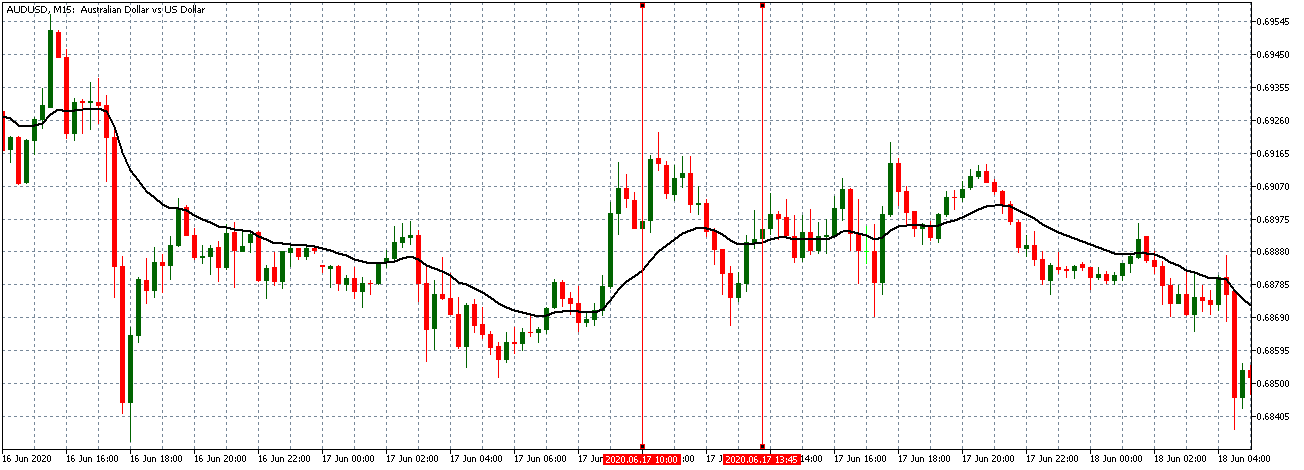
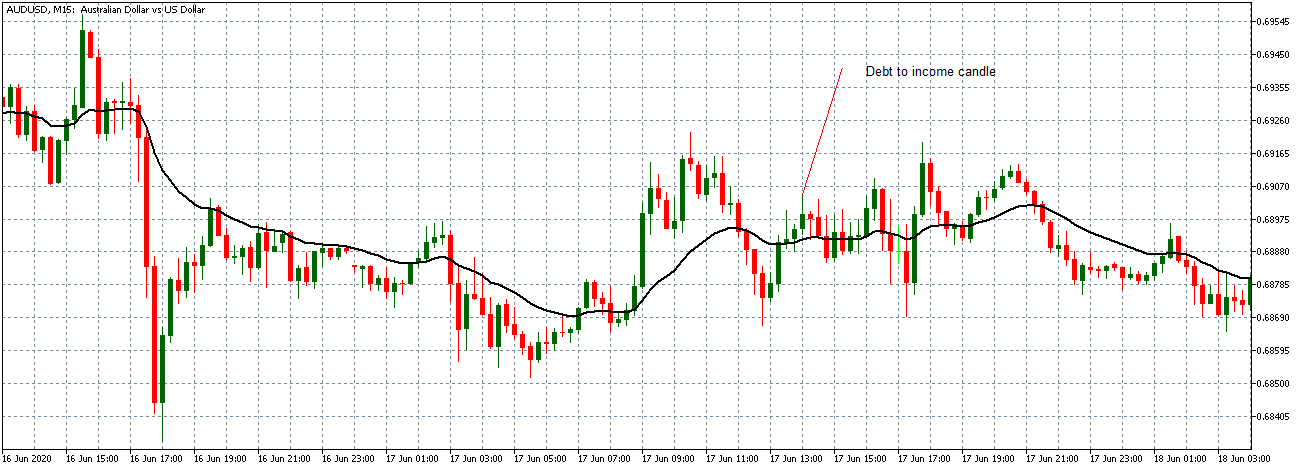


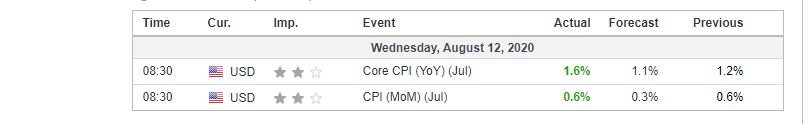
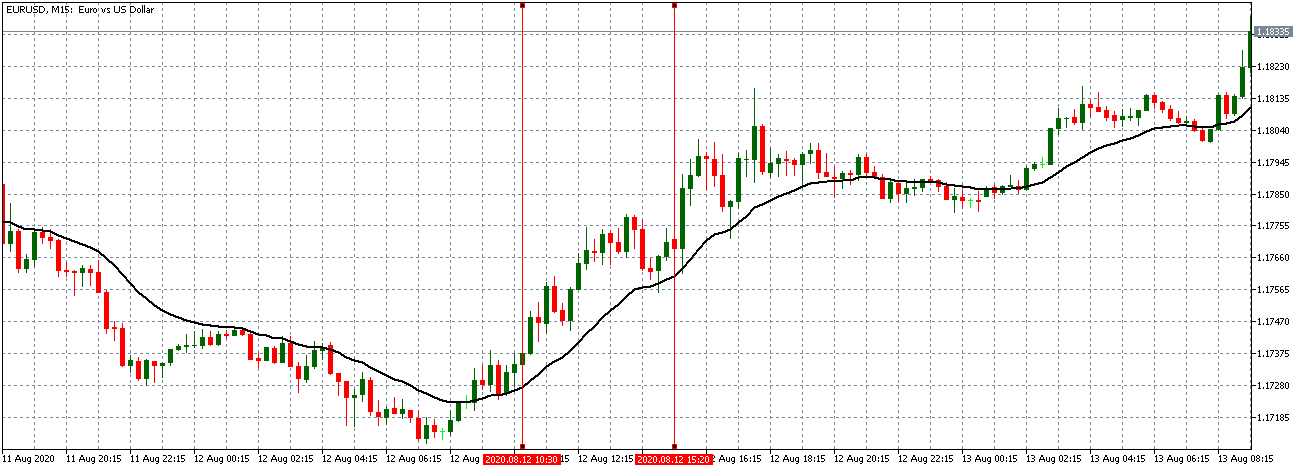

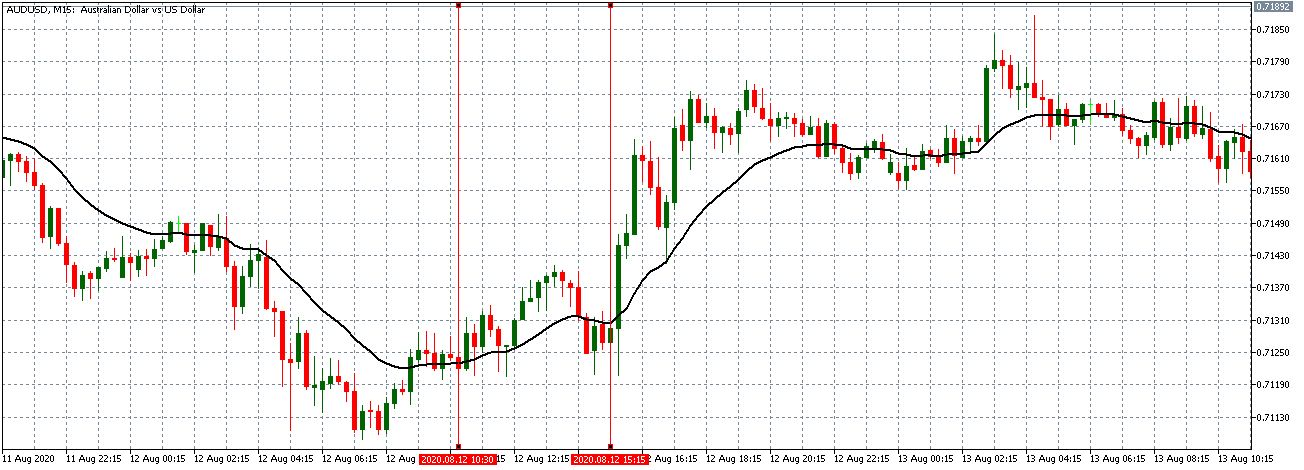

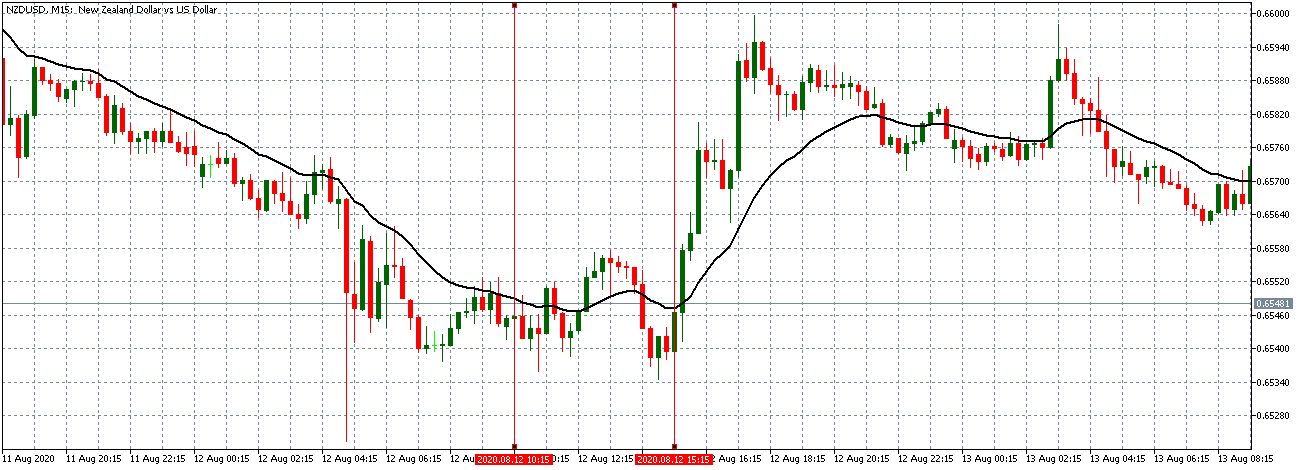


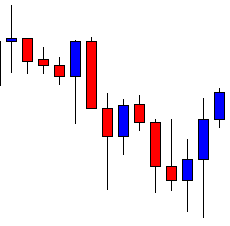
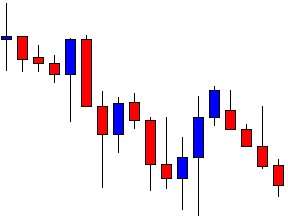
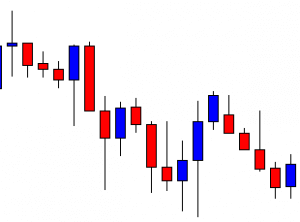
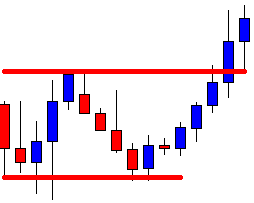
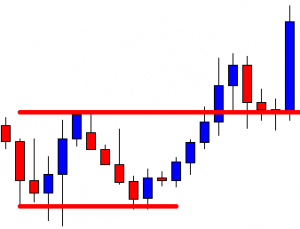
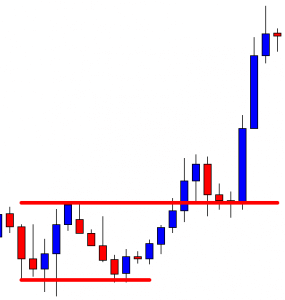

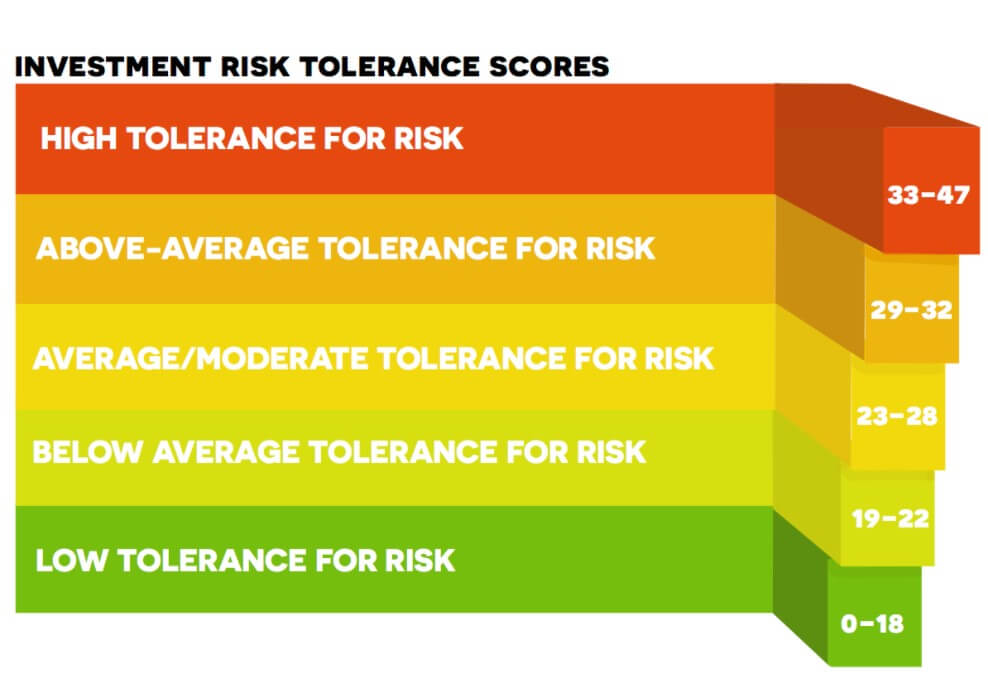
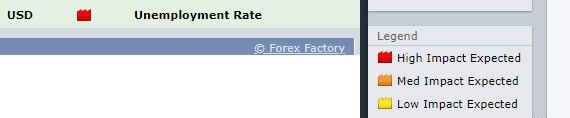


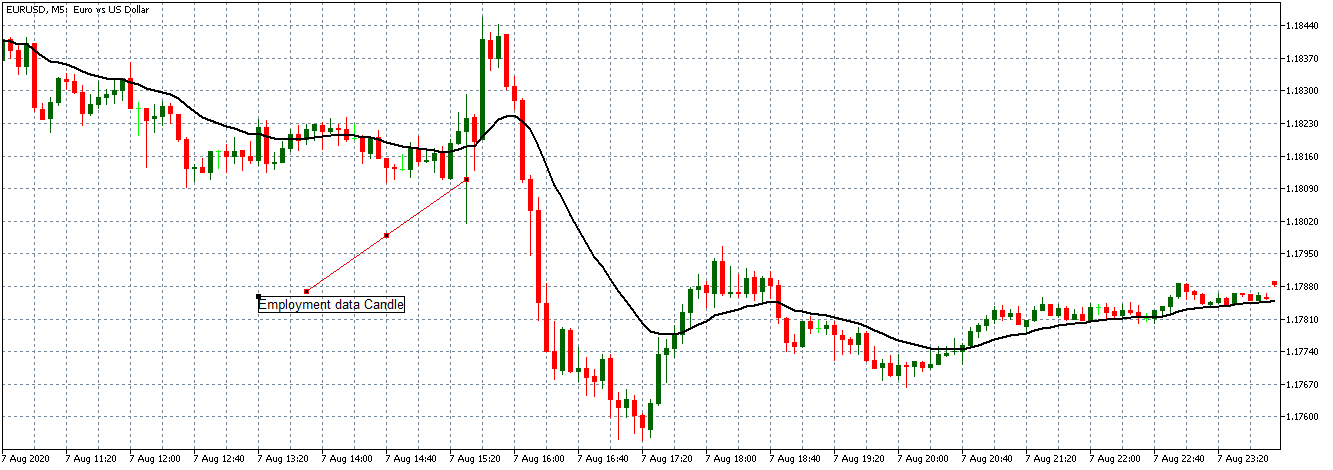
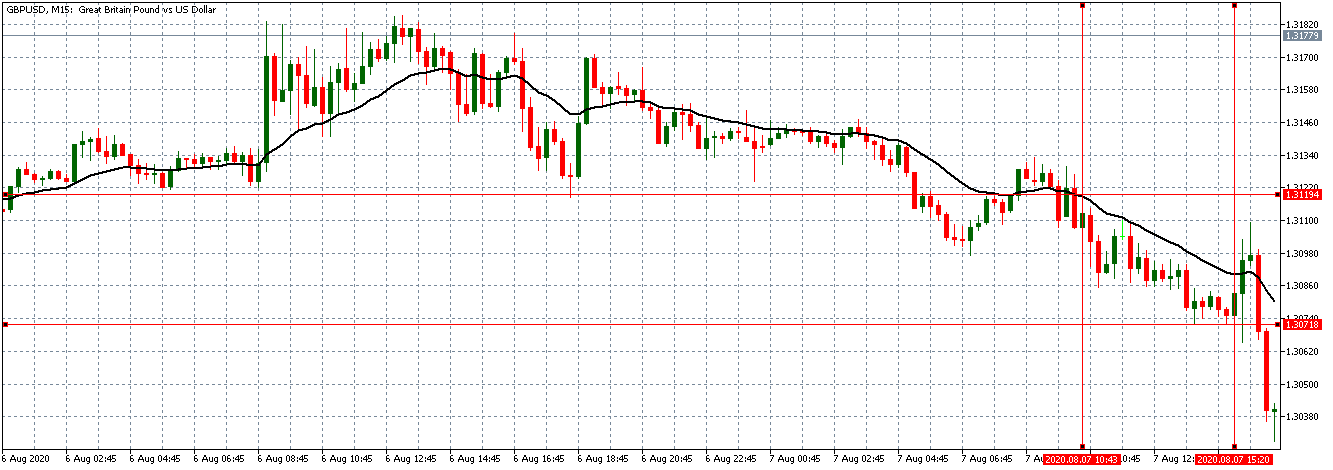

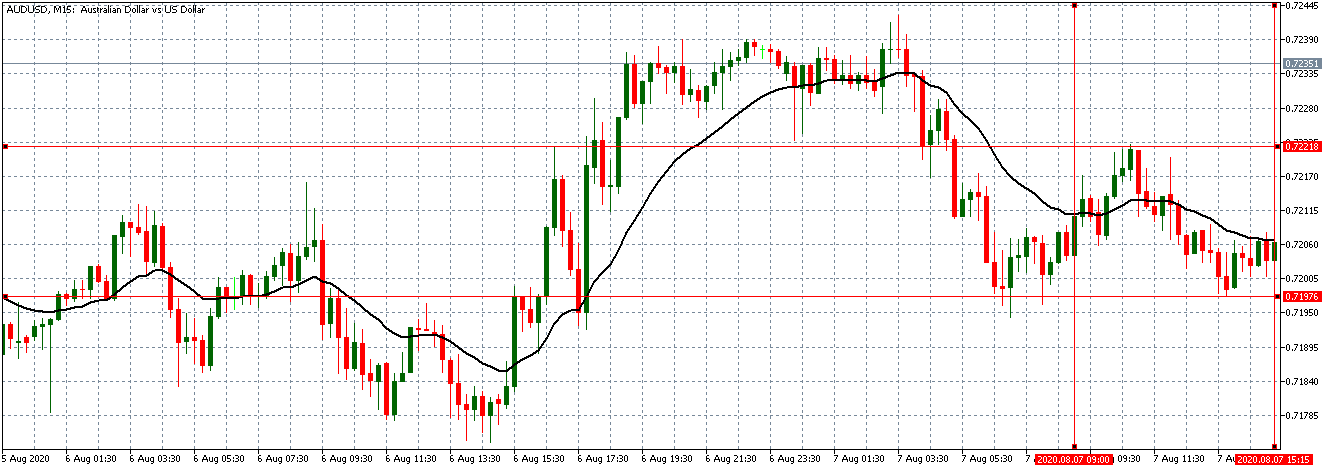
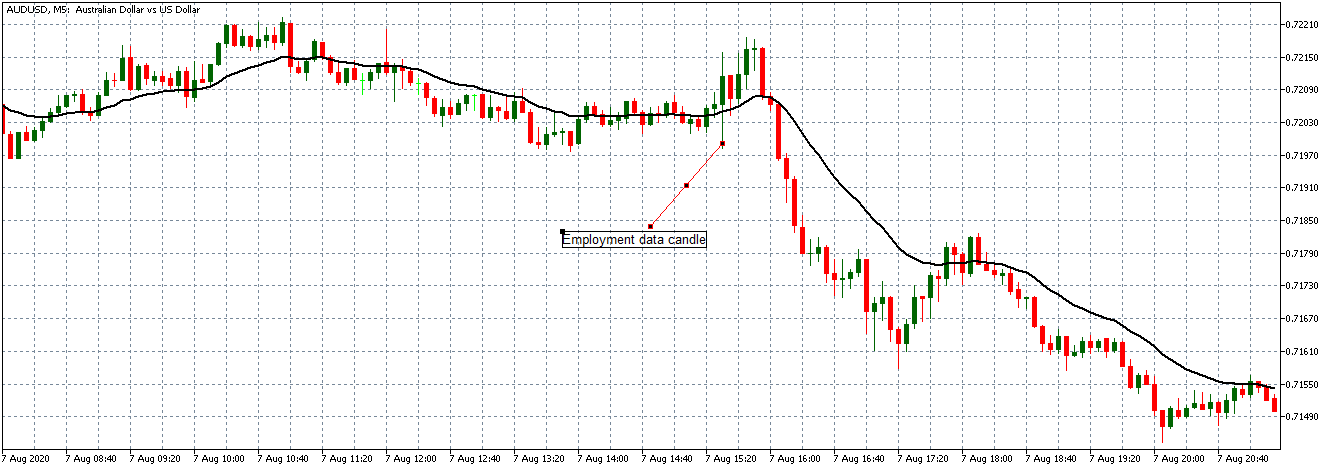
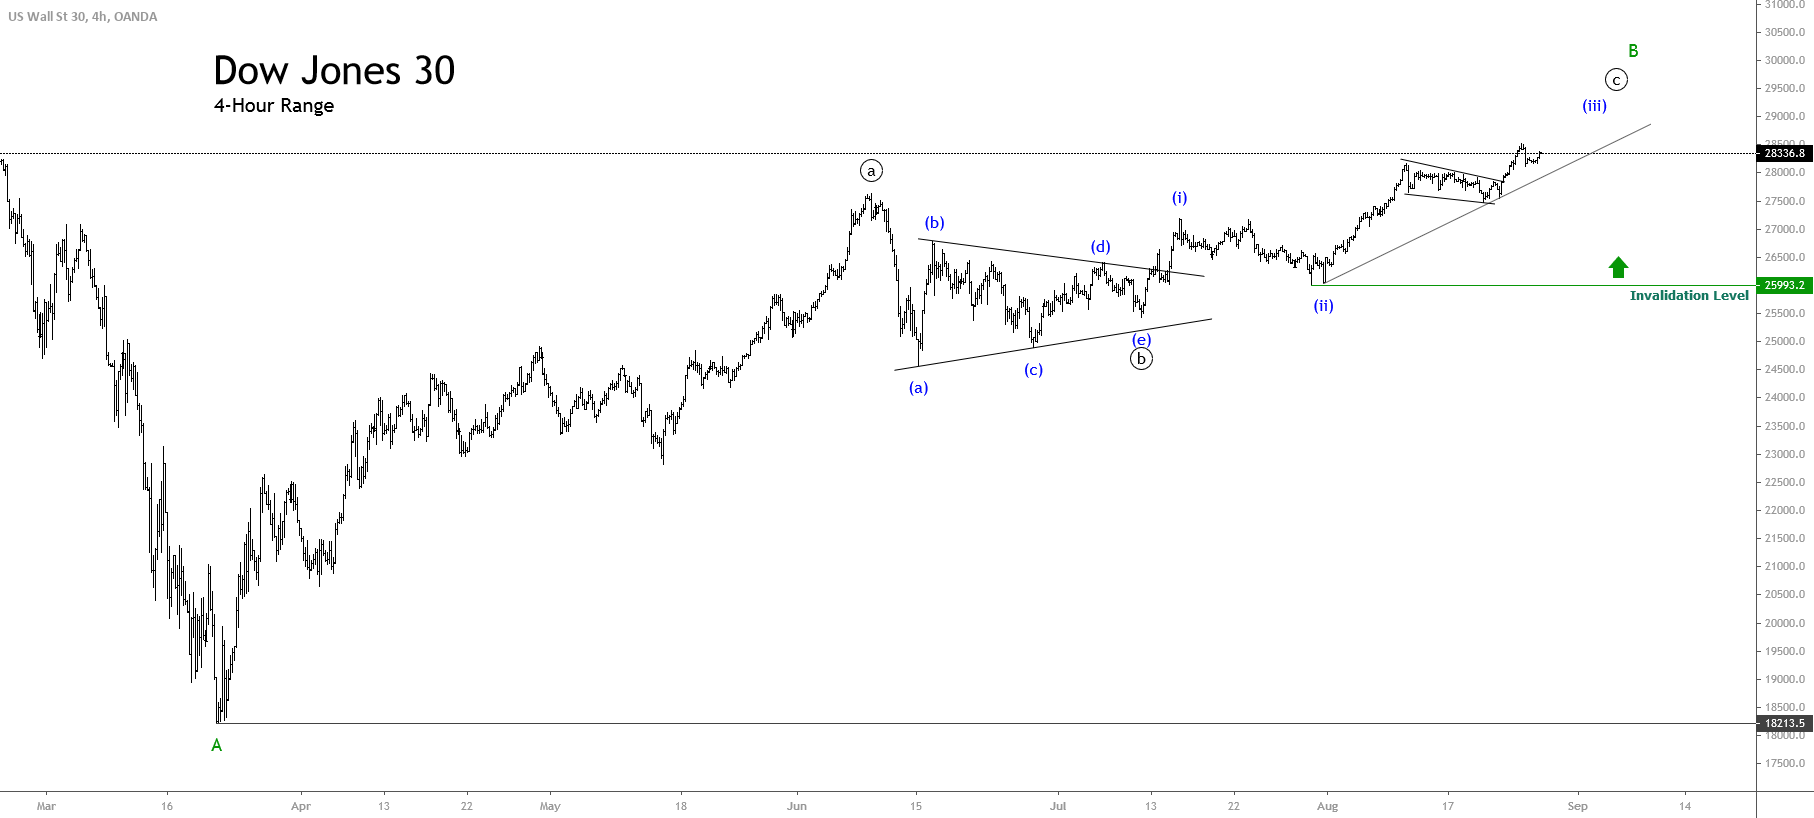
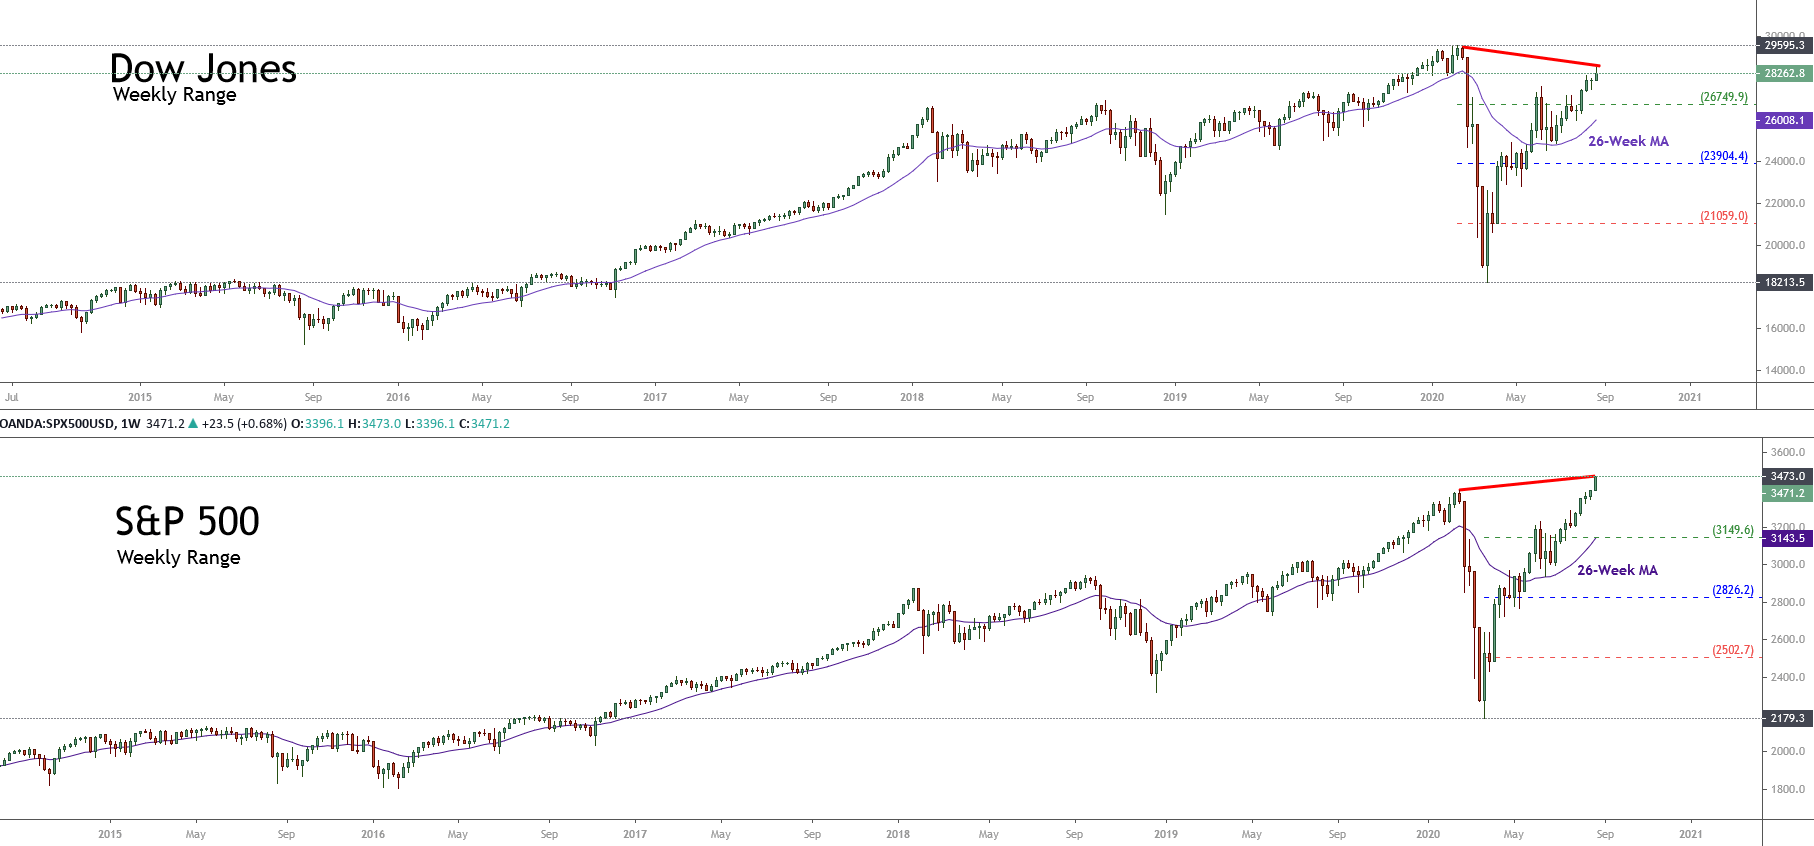
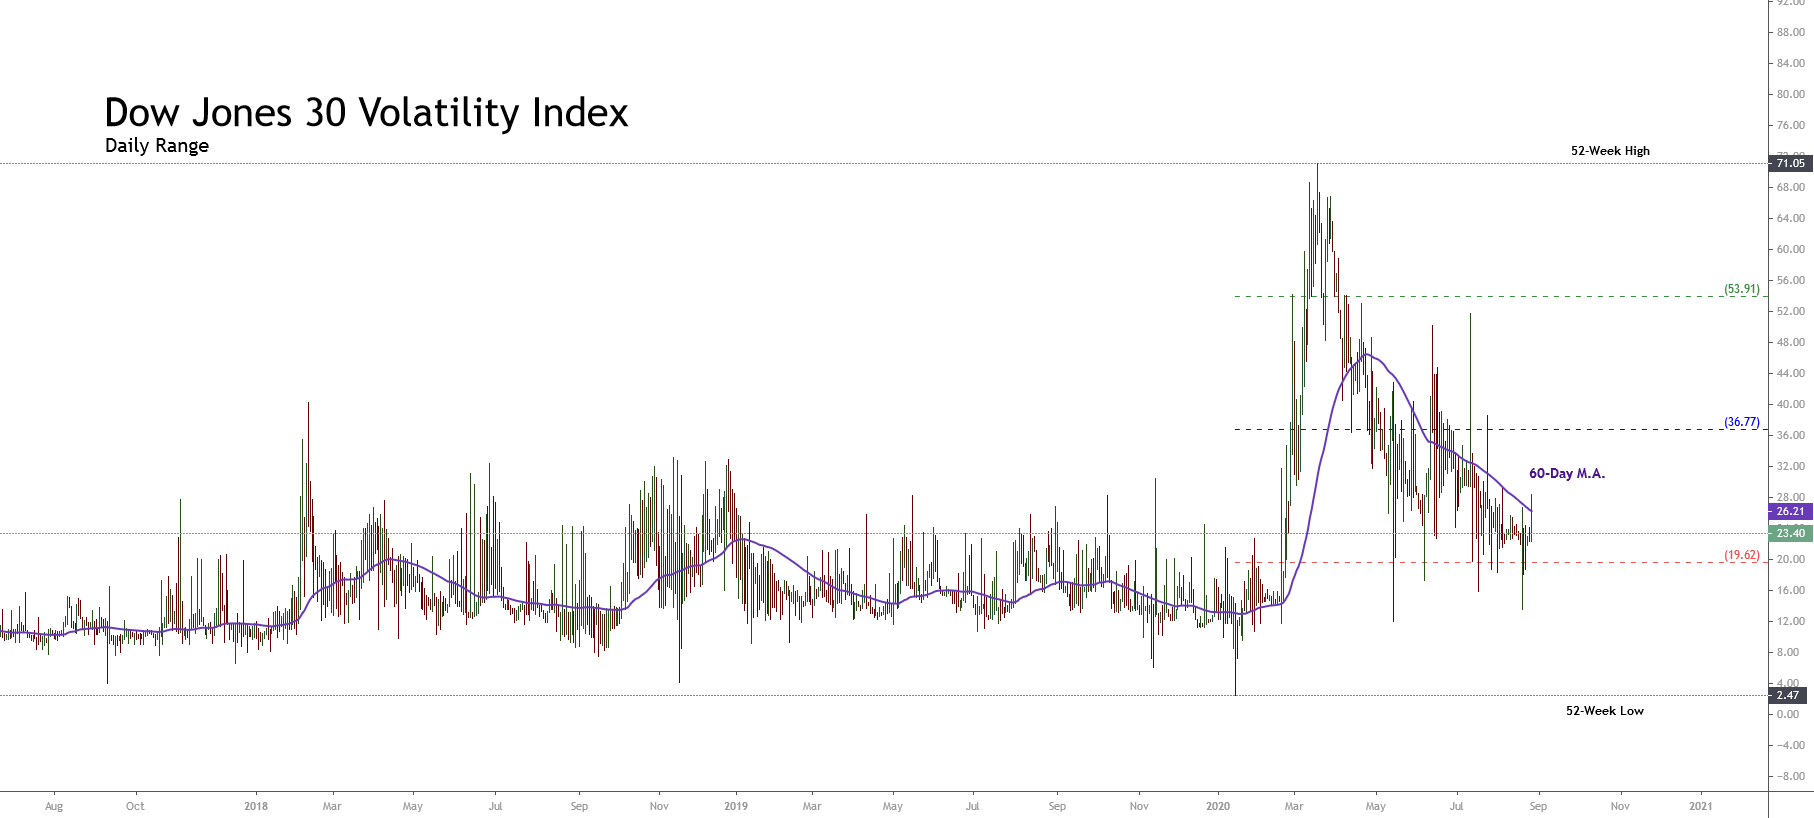


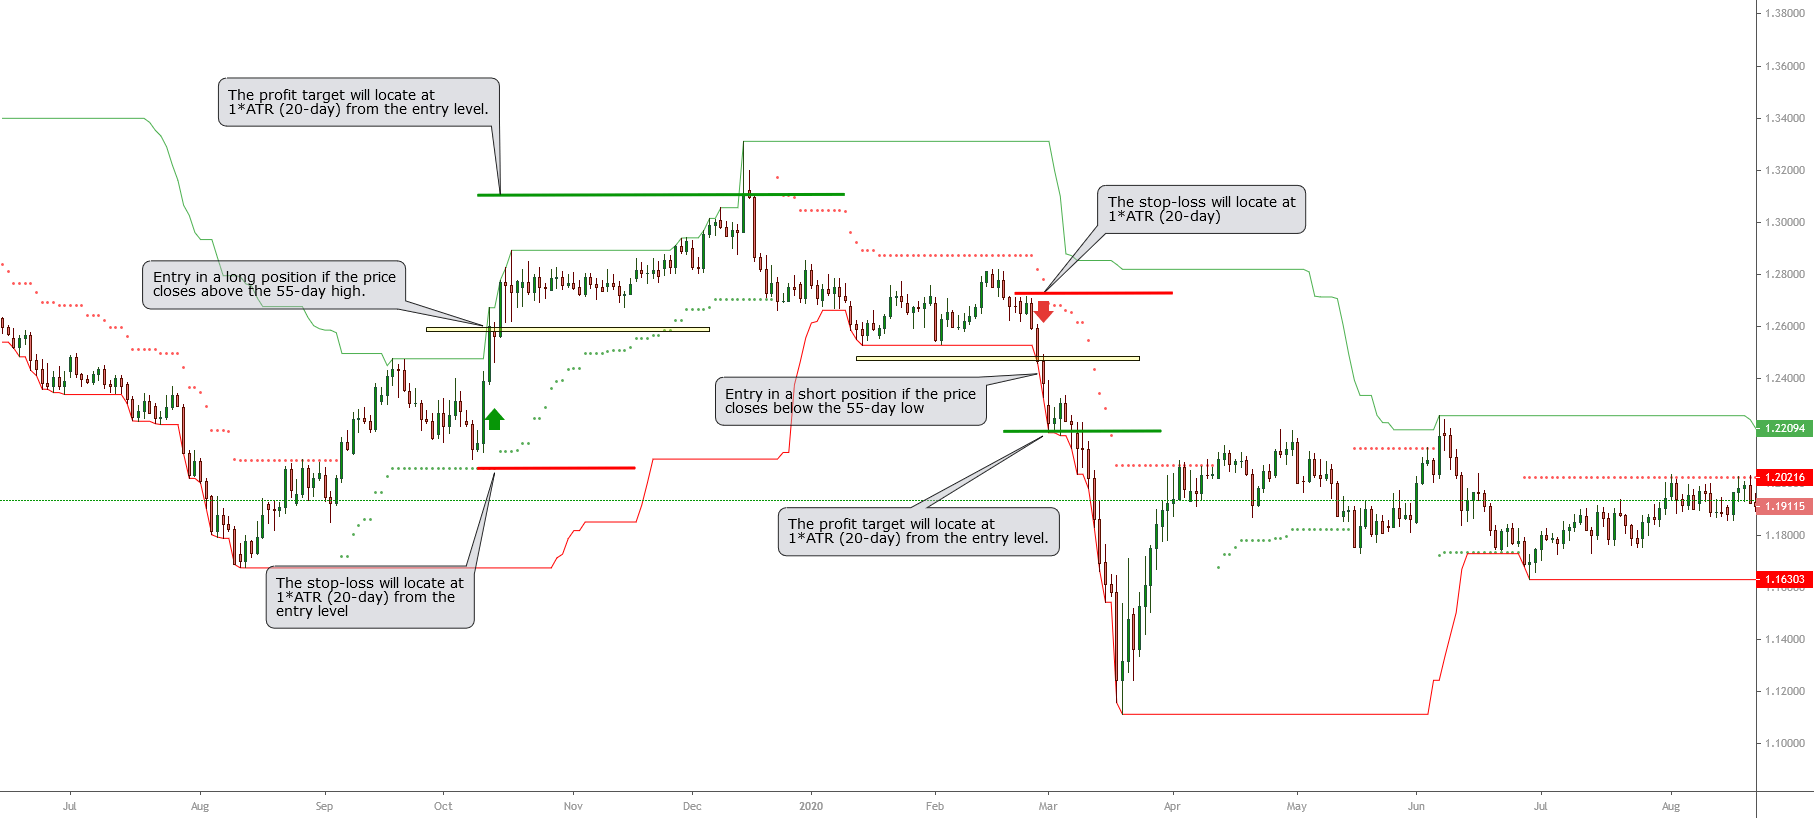
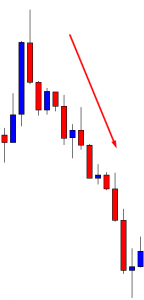
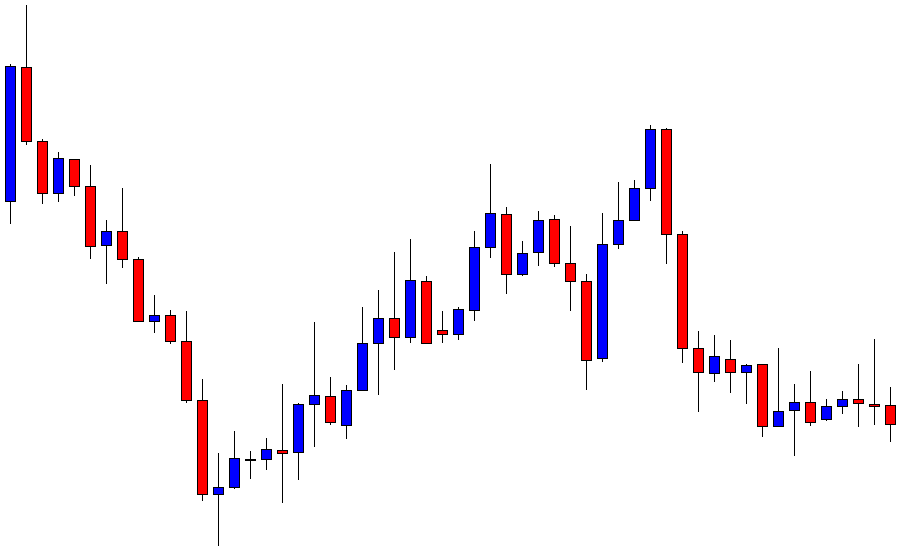
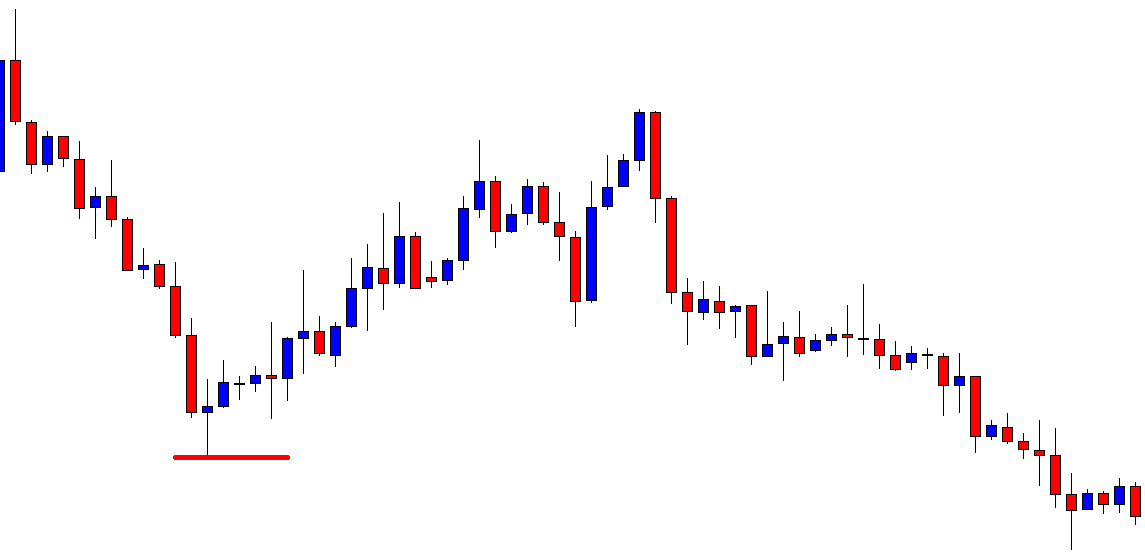
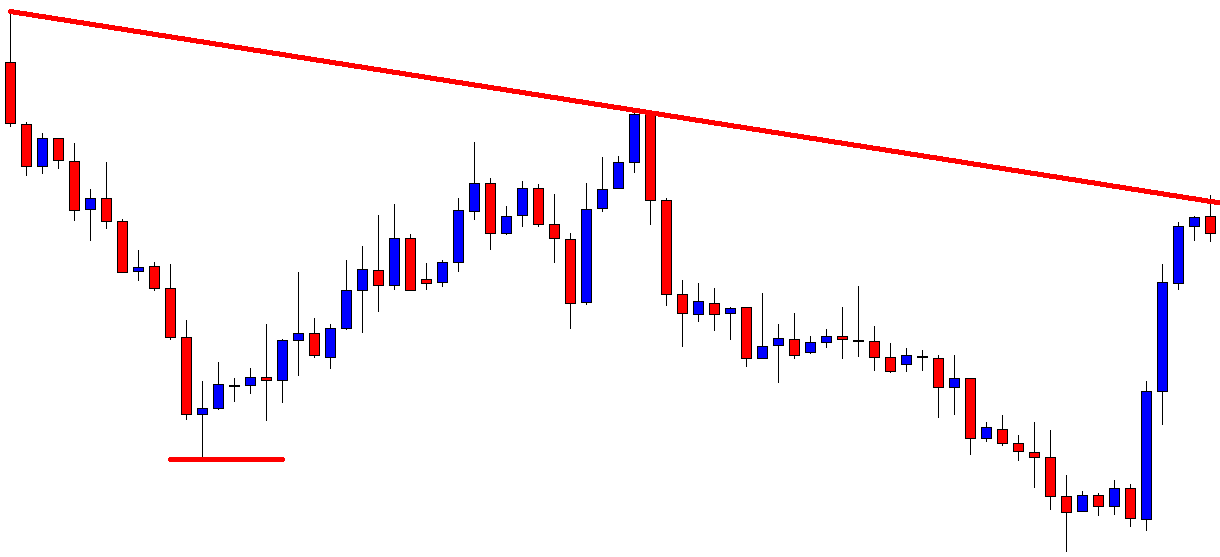
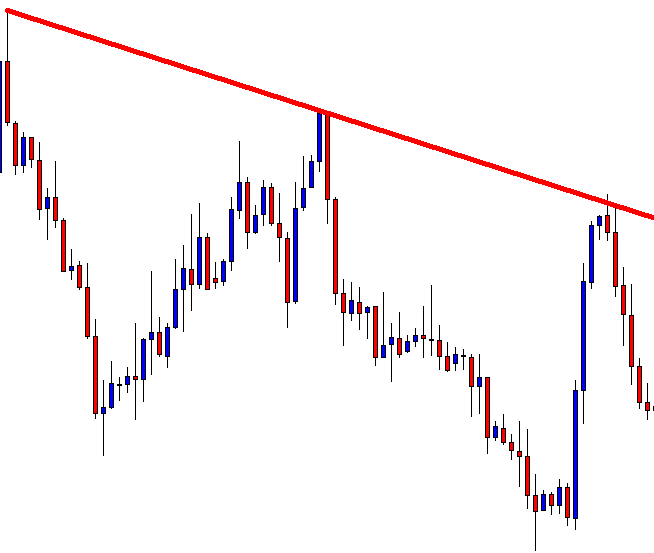
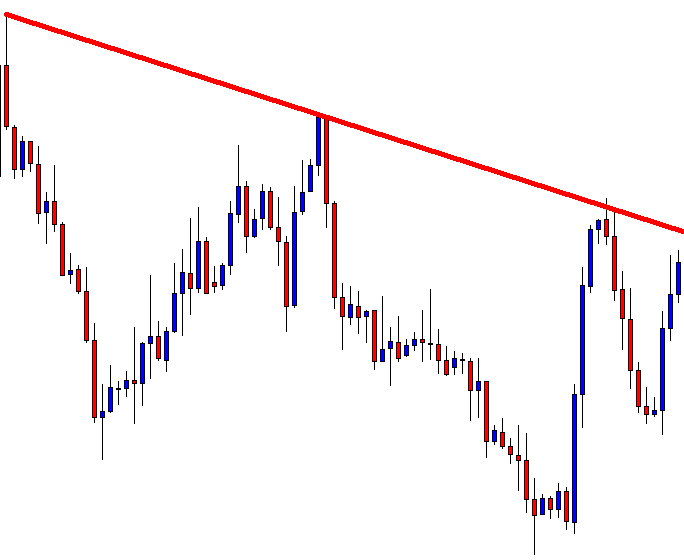
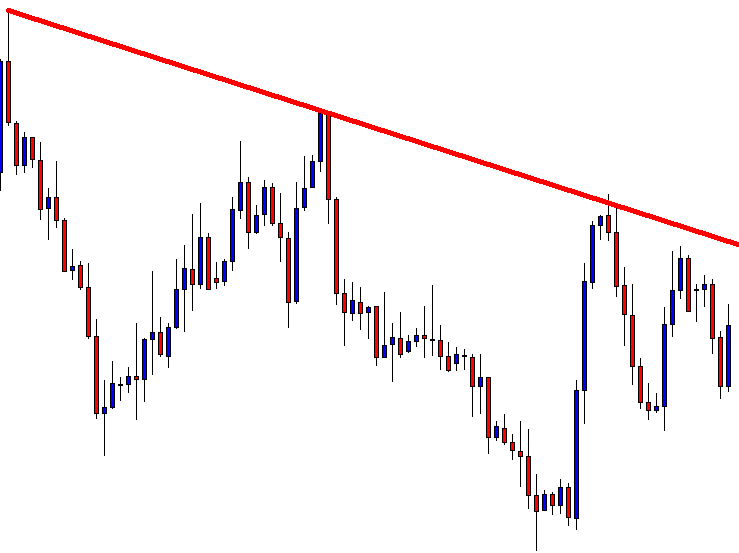
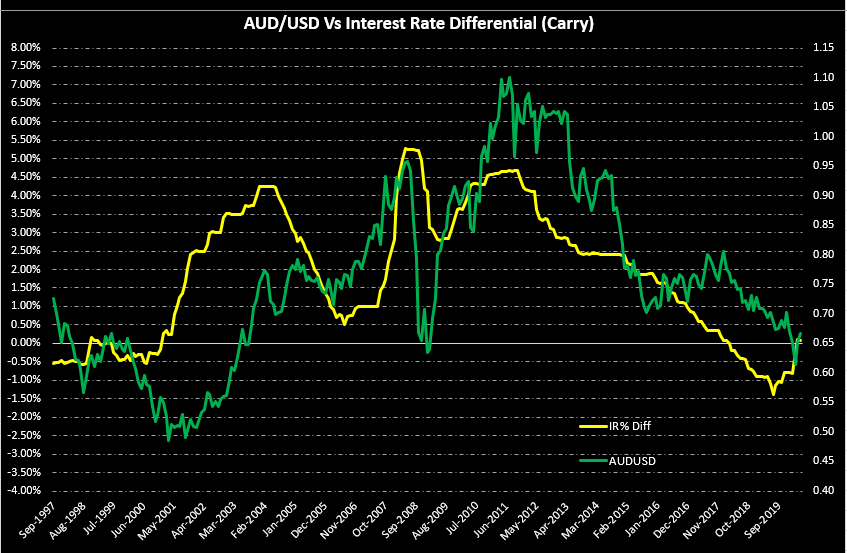
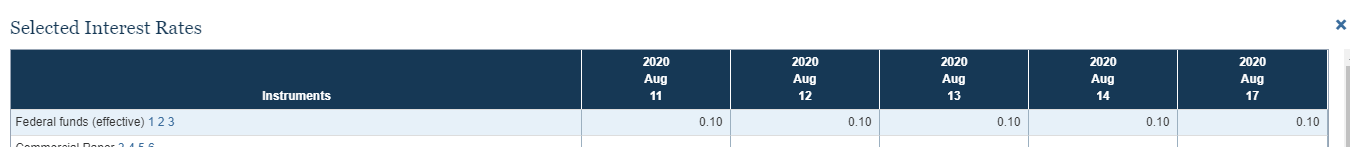
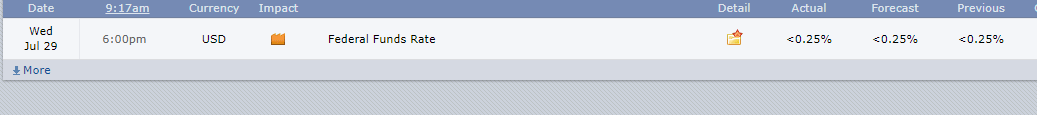
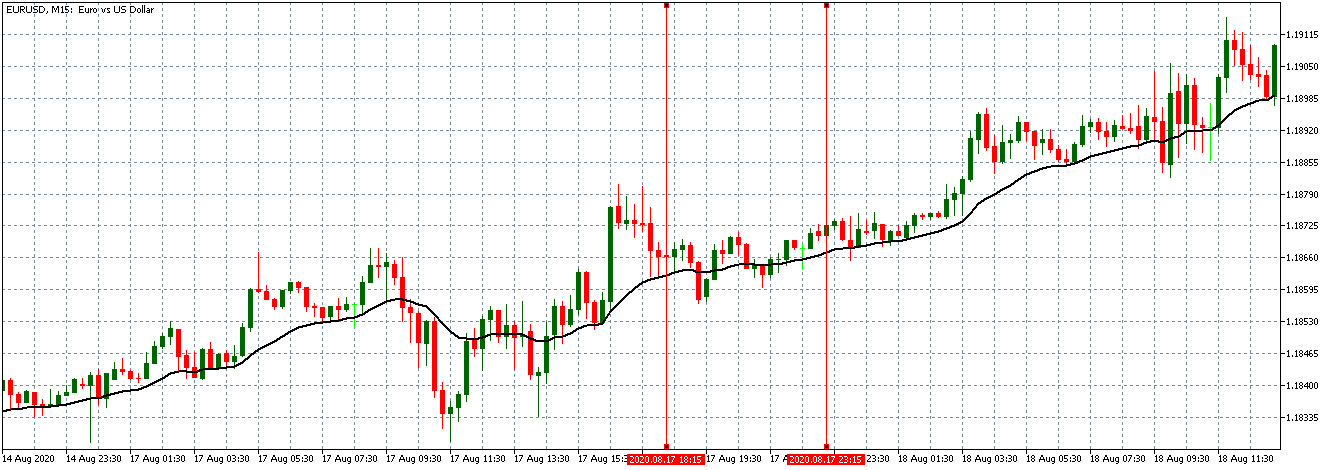
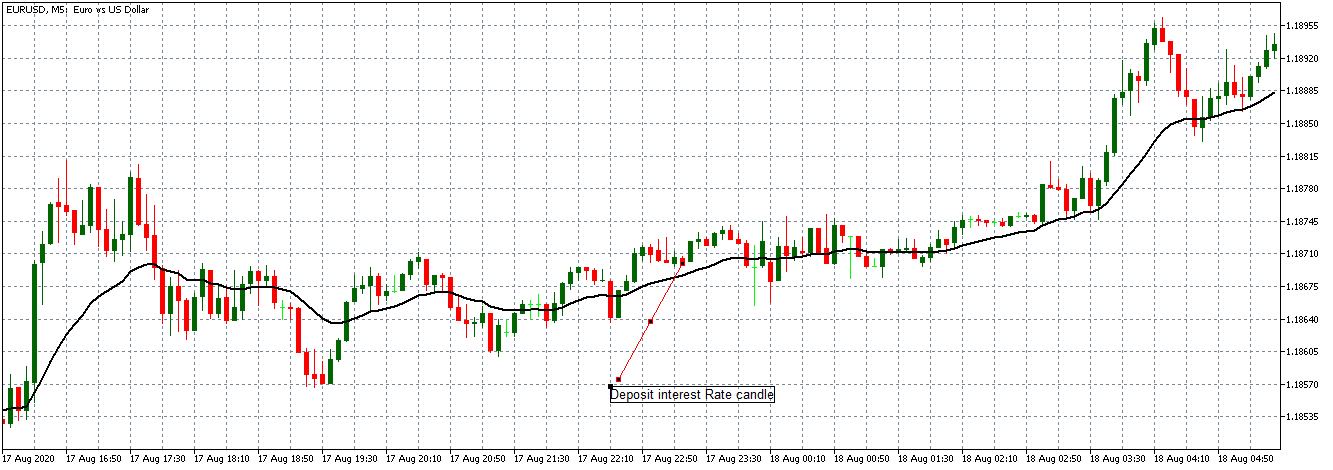
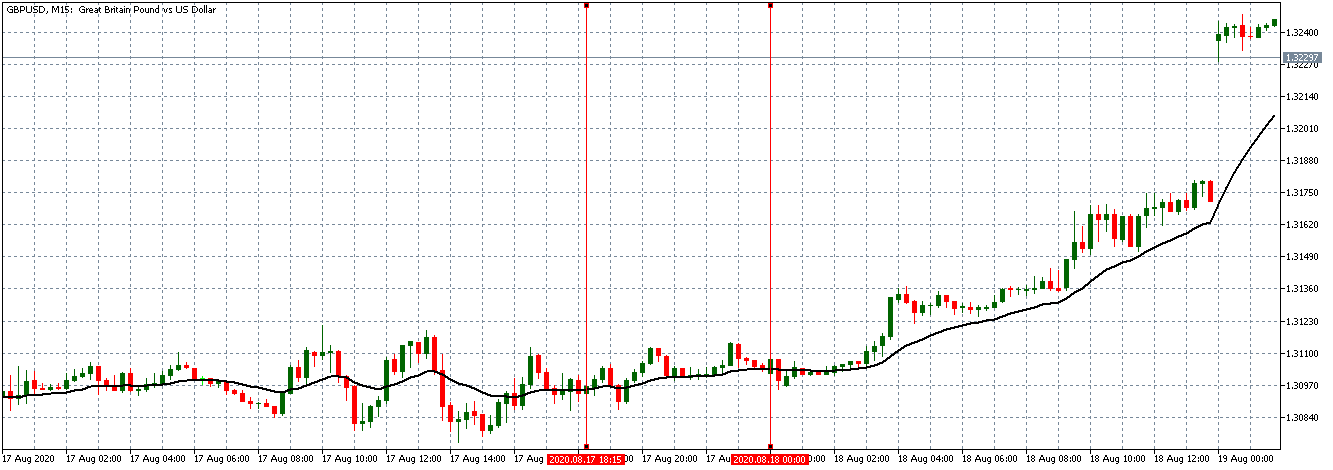
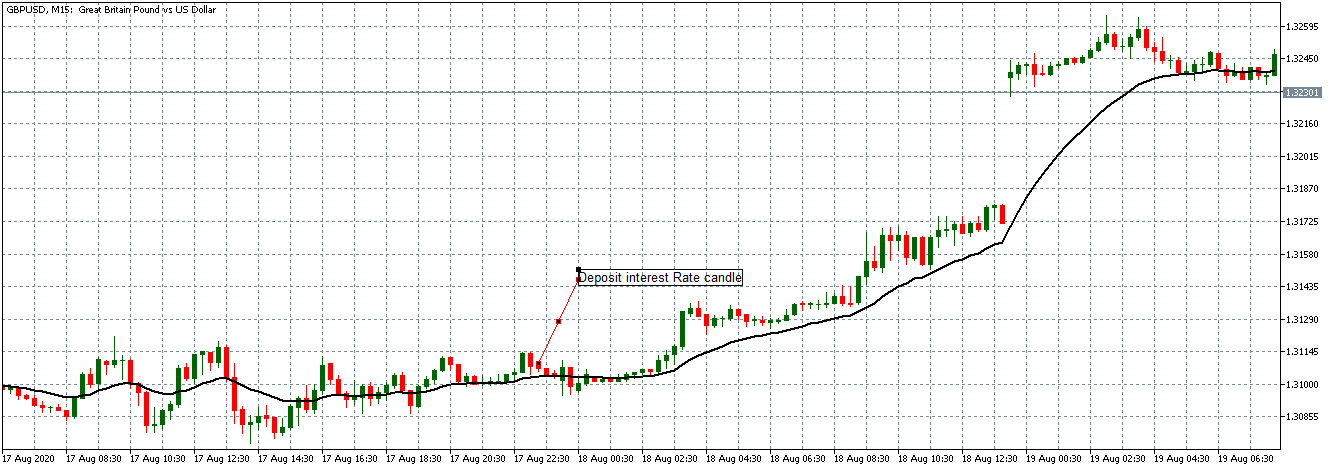
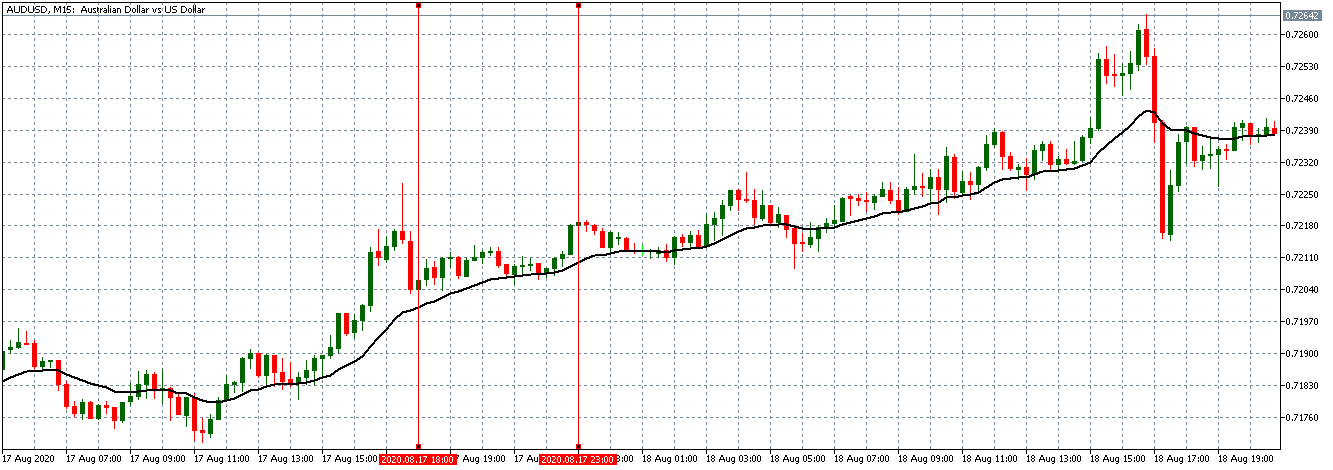

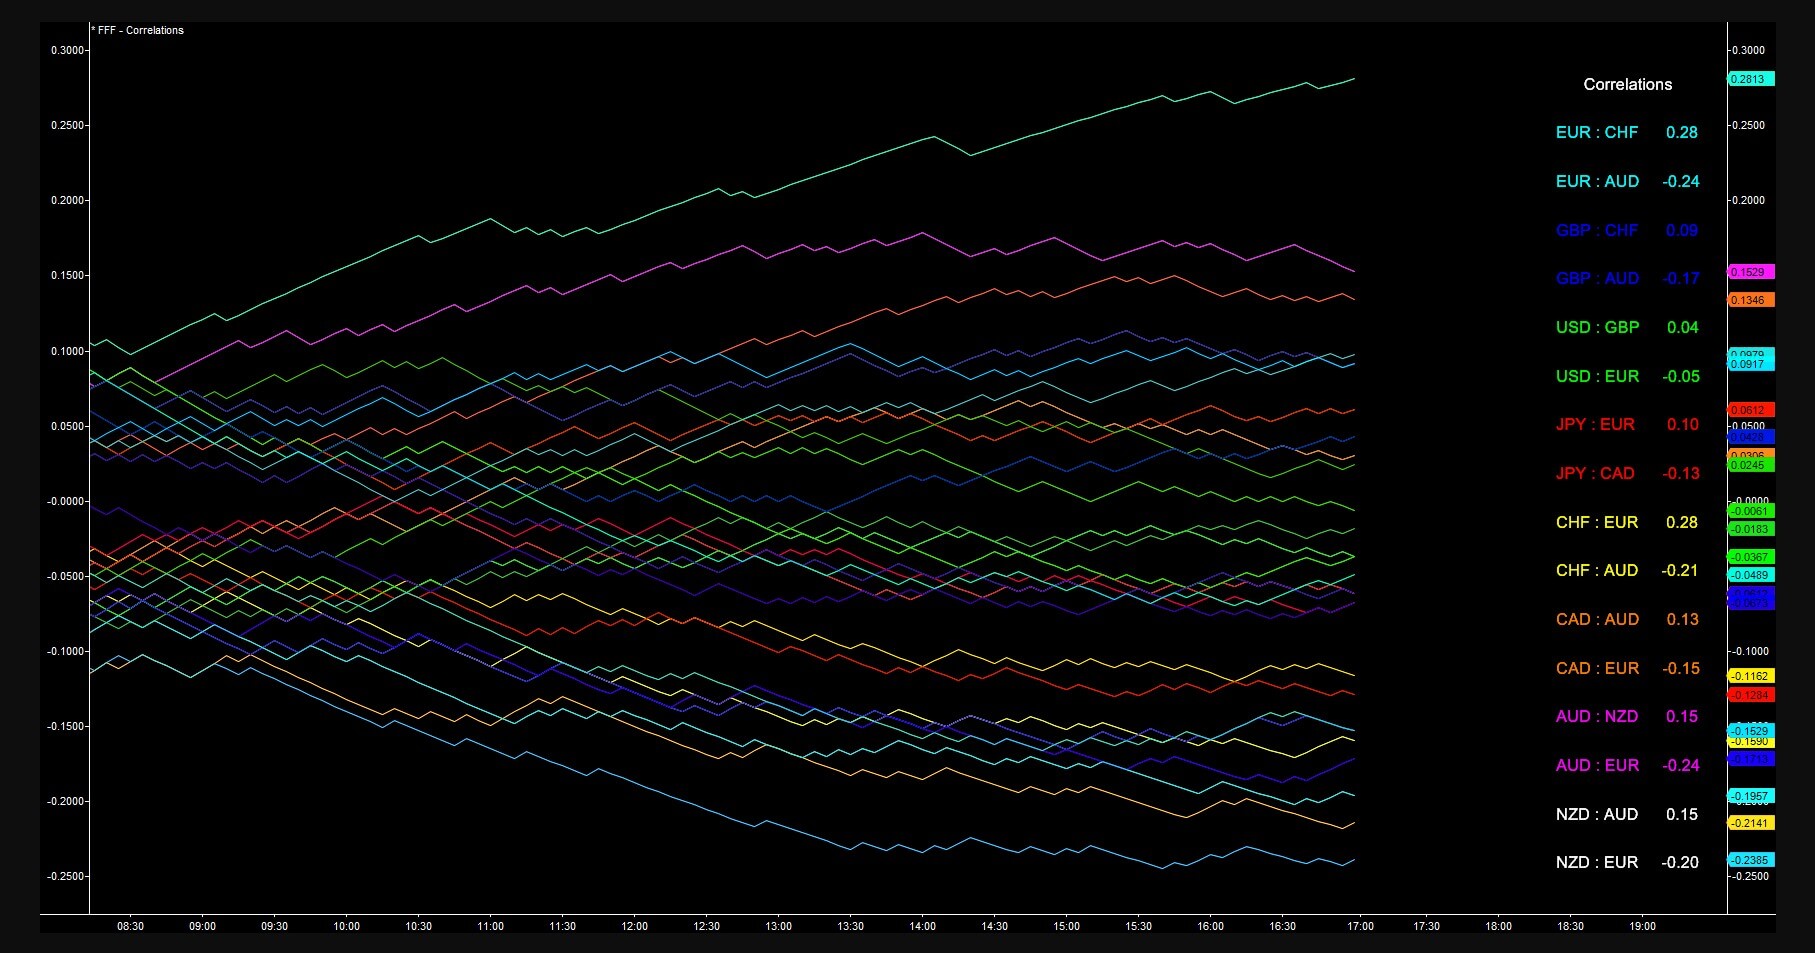
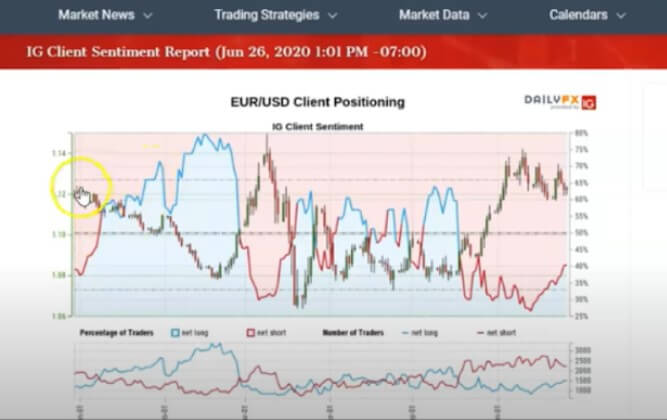
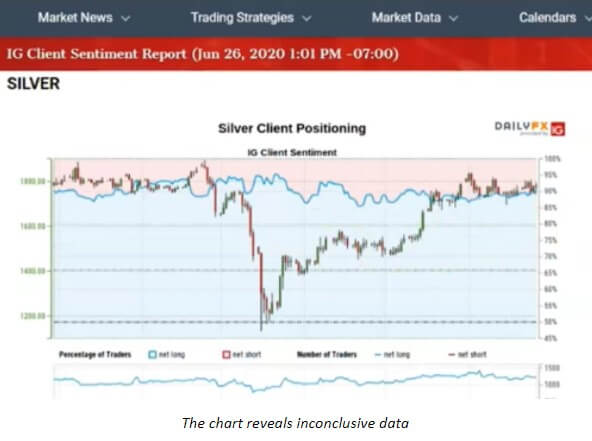
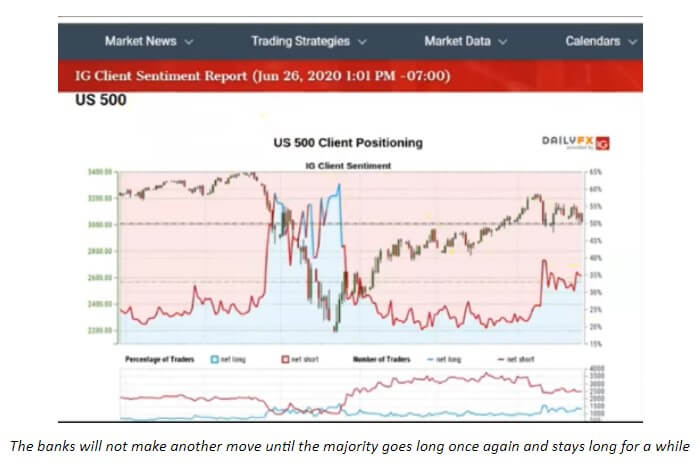
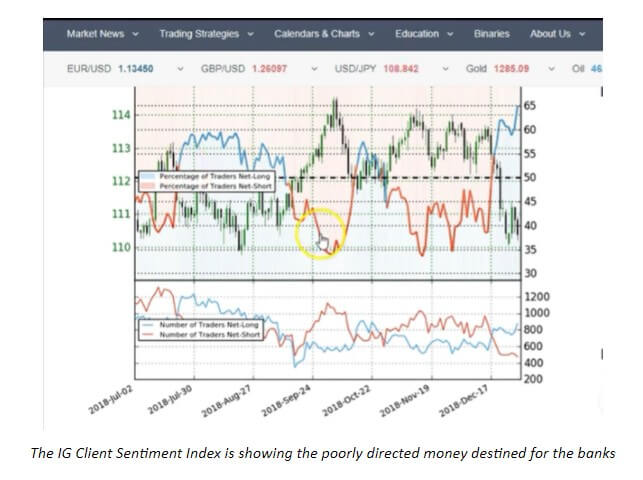
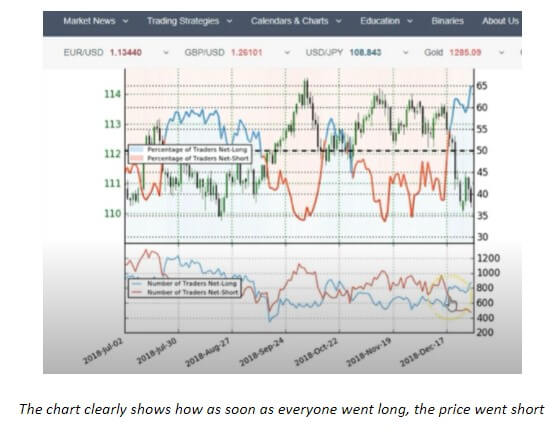
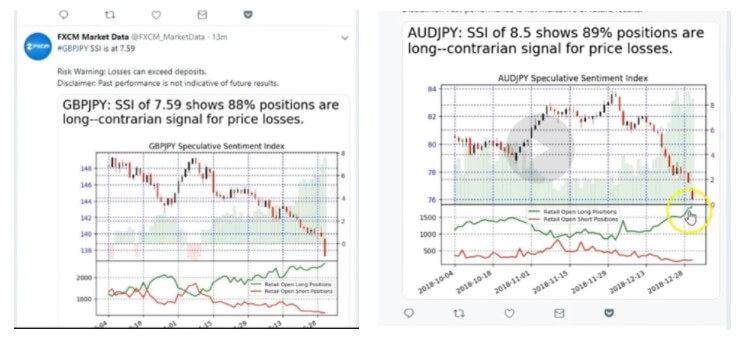

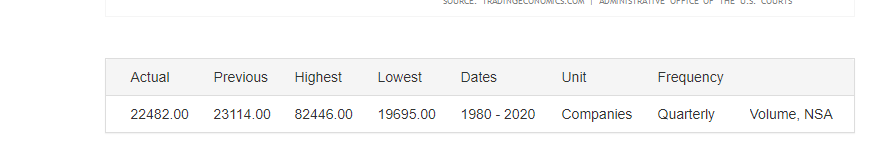
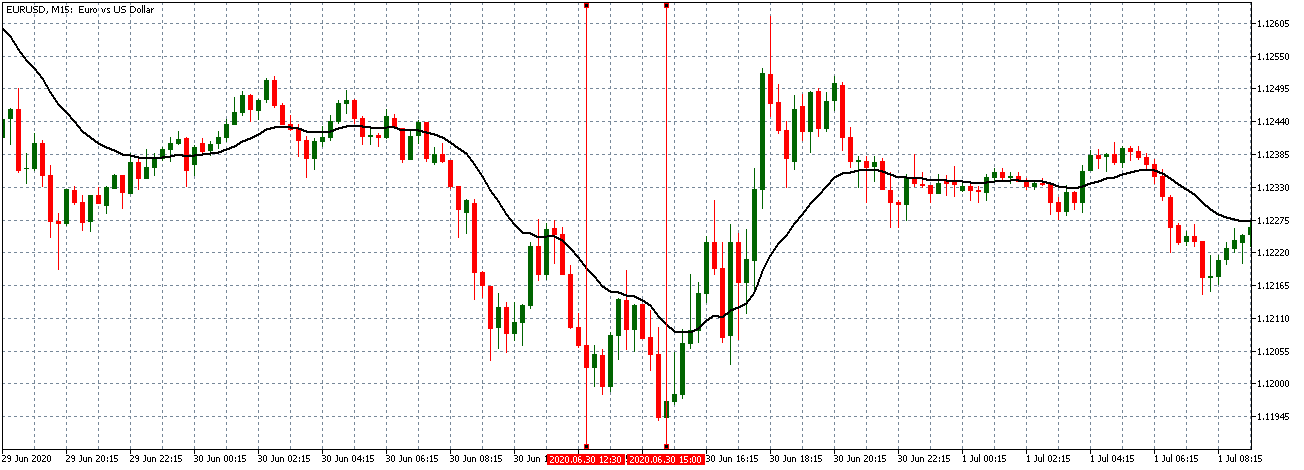
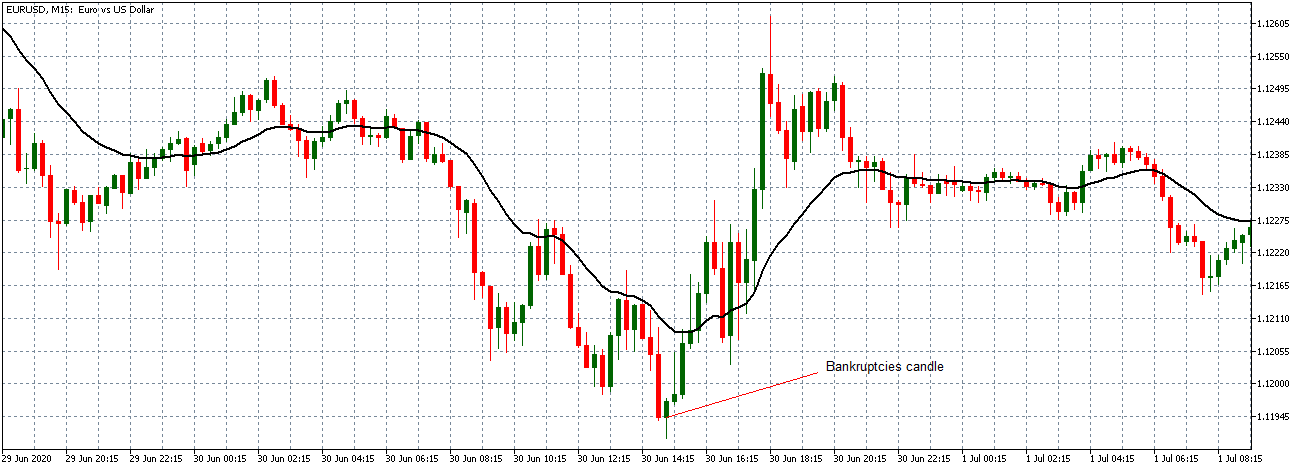
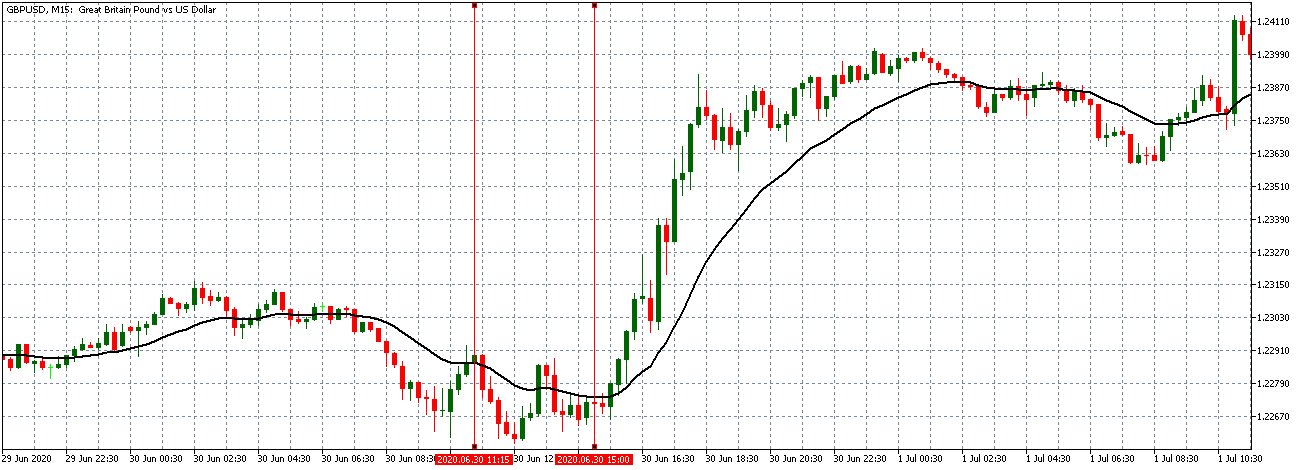
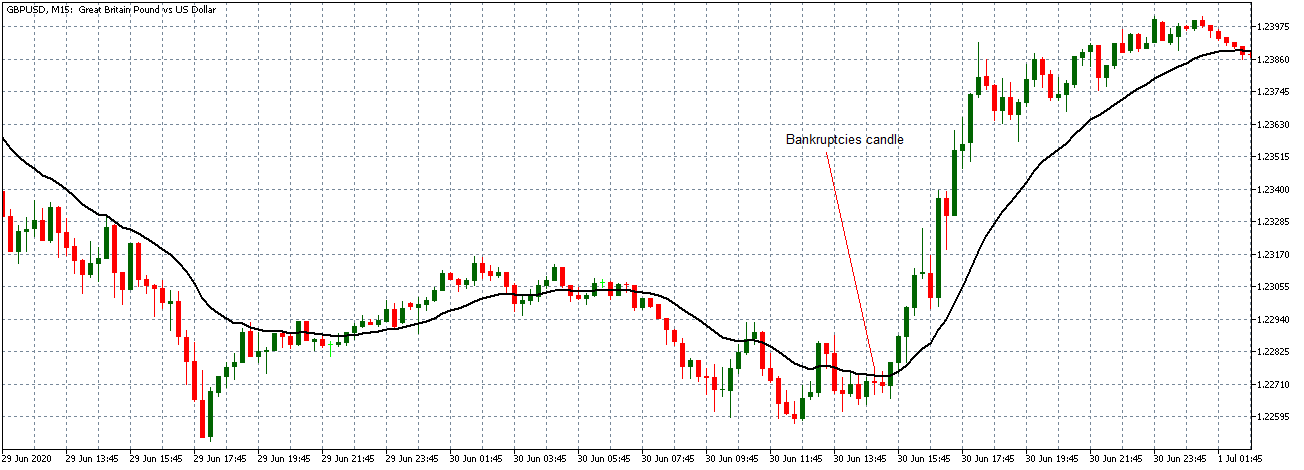
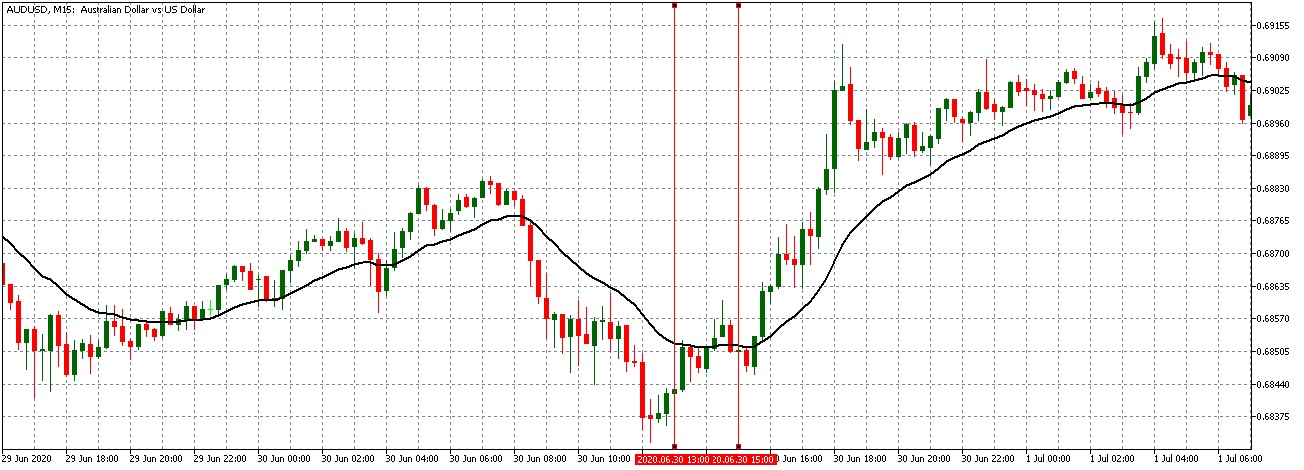

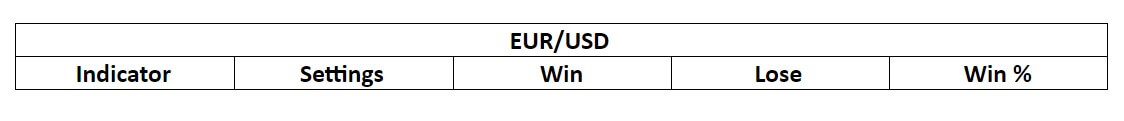
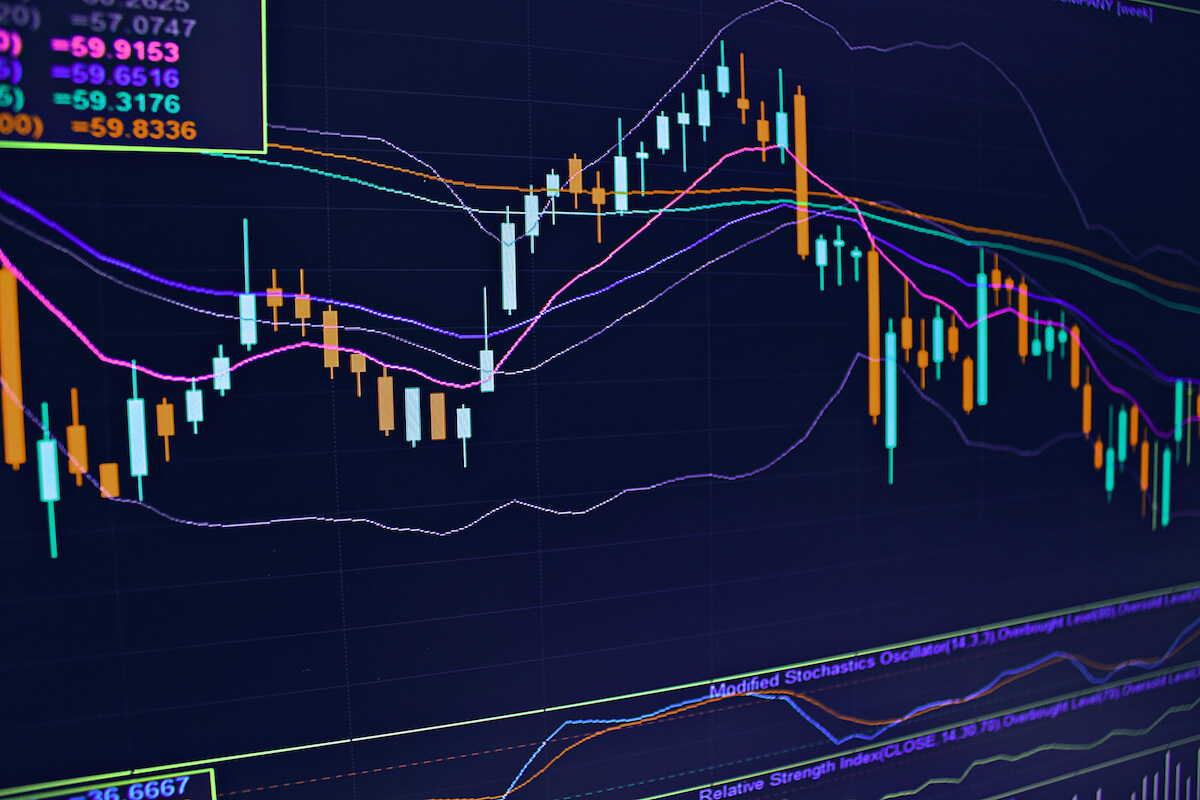
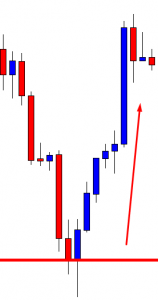
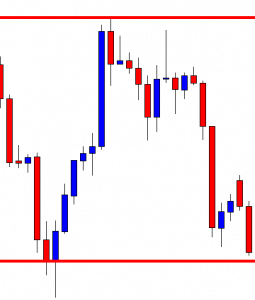
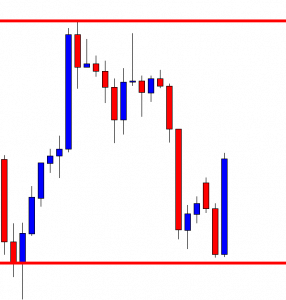
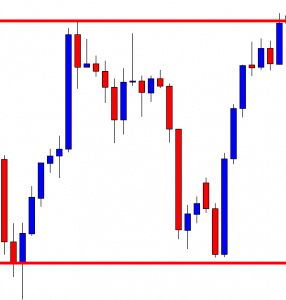
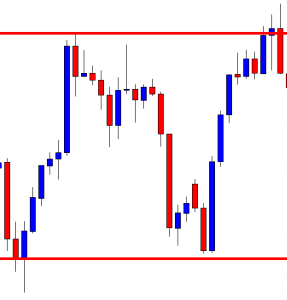
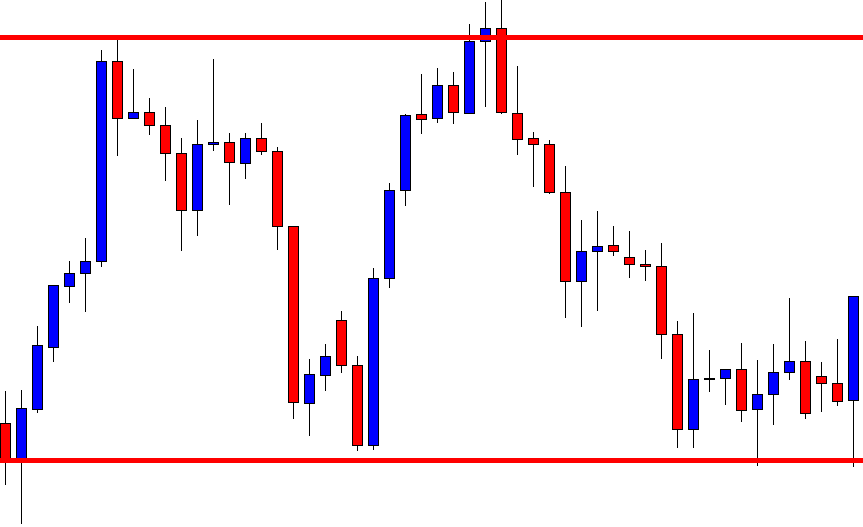
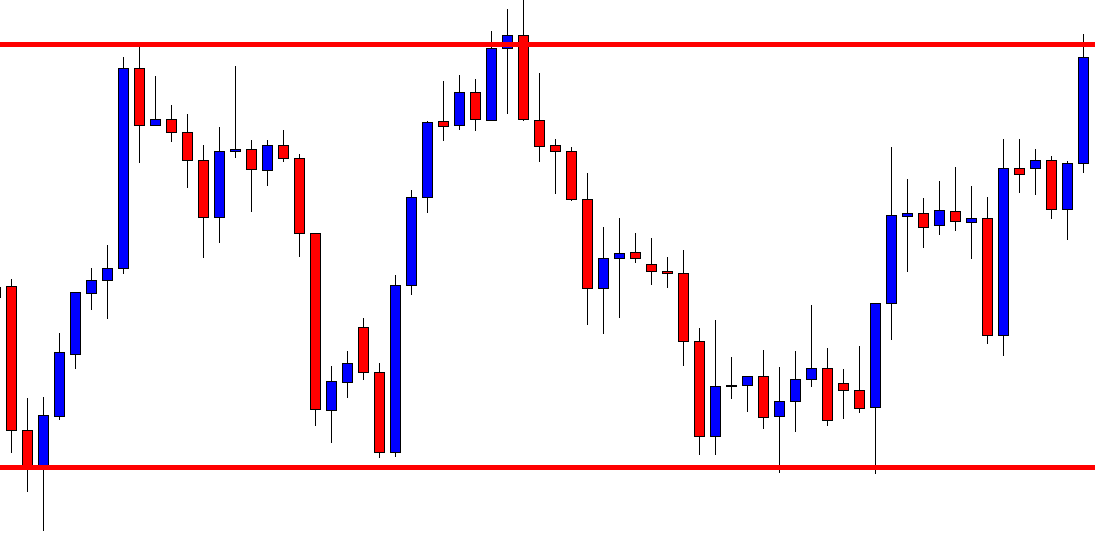
