Categories
Forex Psychology

How To Deal With The Pressures Of Trading

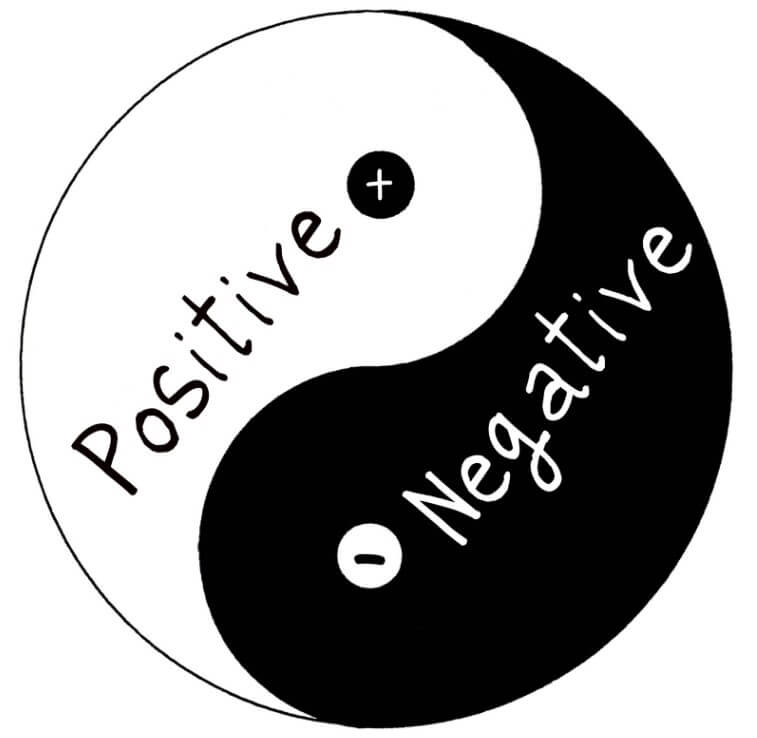
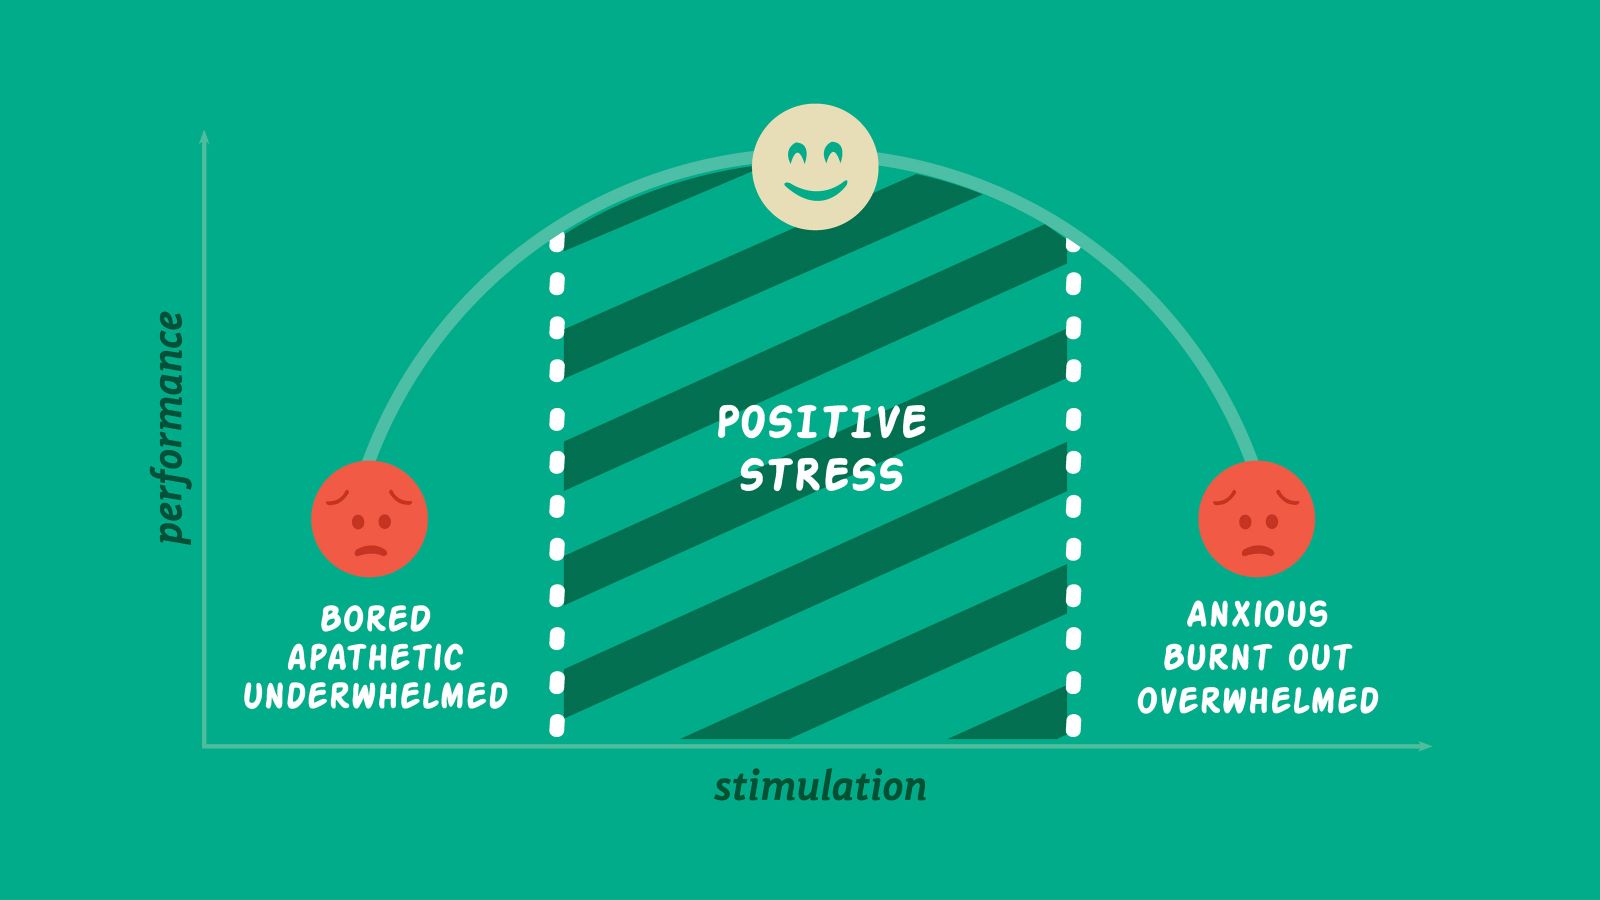
Stress and pressure is an unfortunate part of trading, and it is one of those things that is inevitable and impossible to avoid completely. It can be caused by a number of different things from your own trading decisions to things that are completely out of your control such as unannounced news conferences or natural disasters. There will always be pressures, what is important is that you develop and understand different ways that you can cope with that pressure or ways that you can help to alleviate it.

Step away: This method may seem a little obvious, but you would be surprised how many people actually struggle to do it, many people when under pressure will actually start to spend more time at the computer or trying to work out where things may have gone wrong. Instead of doing that, take a step back, close down your platform, and walk away. You need to be able to clear your mind, coming back with a clear and fresh mind will enable you to look at things from a different light and it may well make things easier for you to work through whatever was causing the stress.

Accept that you aren’t perfect: No one is perfect, so there is no point trying to be or convincing yourself that you need to be. Instead, you need to accept that you will make mistakes, and you will have losses every now and then. Being able to do this will stop yourself from being so hard on yourself and trying to push yourself too hard to be perfect and to never make mistakes, accept what you will and it will be far easier to move on from any that occur. If you feel that you may be pushing yourself too hard, or that you are doing too much, tell yourself to stop, move away, and then come back.

Create a plan: Sometimes stress can come from the unknown, if you do not have a plan set up for what you will be doing or how you will be making your trades it can be incredibly stressful. Creating a plan enables you to understand exactly what you need to do, it will also help you get a better understanding that losses will happen and may well help you get past those losses and to not blame yourself for them.

Do not compare yourself to others: Many people, especially when starting out, will have someone that they look up to and someone that they may wish to imitate, while it is great to have something to aim for, it is not healthy to constantly compare yourself to them. There are many different things that could be different when you compare their circumstances, such as account balances, experience, and so many other things, so concentrate on your own abilities and the trading plan that you have created for yourself instead of putting yourself under pressure to be like someone else.

Getting through a period of increased pressure can be a fantastic feeling, it will give you energy, it will help you push further and ultimately you will feel good about yourself, however, it would always be beneficial to try and avoid those situations entirely, so do what you can to reduce the occurrences, but if you do get into a period of stress, be sure that you are aware of the ways to get back out of it, you will feel a lot better for it.

Categories
Forex Psychology

Keeping Your Confidence Level Up During A Slump

There will be times during your trading career when you go through a trading slump, it is inevitable and will happen to every single person who has been trading for a longer period of time. These slumps occur when the market conditions change into a scenario where you are not as comfortable with it, your strategy is not as effective in these conditions and so you make more losses than usual. Again, everyone will go through this, multiple times during their career, so it is nothing to really worry about, although we do anyway.

You often hear stories where people have had tense of profitable months in a row, even years without a losing month, then things start to change, the markets shift and that person will struggle to put more than a single winning month in a row together. This happens and it will happen to you. It can be really disheartening, stressful and this makes it incredibly easy to start blaming yourself for it, to blame yourself for what is going wrong and this makes it very easy to simply overlook the things that you are doing really well. That is simply part of human nature, to concentrate on the bed.

The problem with this sort of attitude and outlook is that it will simply make things worse. When you are performing badly at something, and someone tells you how badly you are doing, what is your reaction? For many it is to simply shrink down inside themselves and to just try and get through it without putting in much more effort, for some, they completely give up and walk away. This is what your own mind will be doing to you when you are going through one of these slums. The negative thoughts and emotions will flood in, concentrating on what is going wrong will only cement these thoughts into your mind.

This is why you need to be able to focus your mind on the positives, things were fantastic before and so they will be again, you are clearly doing things right so we need to look at that. It can be very hard to keep your confidence levels up during a slump, but we have come up with some ideas that could potentially help you to remain a little more confident during one of these slumps. They may not work for everyone, but it is certainly worth knowing that they are there to try, as you never know which one will work for you, so let’s take a look at what some of the things that you can do are.

Don’t Dwell, Act!

When you are in one of these little slumps, it is easy to simply sit there thinking about the negatives and everything that is going wrong, this is natural. You need to think about how this will help you, the short answer is that it will not. Sitting there and just thinking about the bad will only make your confidence drop even more, or even make you want to give up and quit completely. What you need to do is to take action. You should have a trading journal, use that to find out what is going wrong, and then do something about it. If you do not try and change whatever it is that is going wrong, then you will find it very hard to get out of this slump any time soon. So do not simply sit there thinking, act on it, get rid of the bad habits, and whatever else could potentially be causing the slump that you are in.

Look at What Went Well

It is important that you are able to shift your focus every now and then, shift it to look at what has been going well. This is easier said than done but it is vital to getting out of that slump that you are in. You will have had some trades that worked, take a closer look at them to see why they worked well, parts of your strategy will still be valid and so should still be used. Remember that you were able to be successful in the past, so you will be able to be again, this can help to give you a little boat to your confidence levels. So remember to think of the positives, not just the negatives when you are in this sort of situation.

Change Strategies

Sometimes these slumps are no fault of your own if your strategy works in specific conditions but the markets have now moved away from those conditions, of course, it is going to struggle to remain profitable. This is where you need to step in, it is always good practice to have a good understanding of a number of different strategies, they can then be used during different market conditions. So once a single strategy stops being effective, you can simply switch over to a more appropriate strategy without having to go into a slump at all. There will still be performance slumps, but being able to switch over should make it far easier to be able to get out of it, or to at least limit the damage of it. So if you only know one strategy, get learning another one or two.

Find a Niche

A niche is basically a specialisation, it is where you focus your trading on a single or specific aspect of it. This can help to make you an expert at a certain style of trading and helps to avoid the mismatch or blur of different strategies and ideas. You need to get an understanding of what it is that you are good at and then use that as the trademark of your trading, to have that at the centre of your strategy. Once you have it, stick with it, work with it and you may find your trading to be a little more enjoyable, even during a slump.

Talk to Others

When you are going through a slump, it is more likely that someone else will be too. Being part of a trading community will allow you to communicate with others, to get an idea of how others are doing too. It may sound bad, but knowing that others are having a difficult time too can help to build your own confidence as you know that you are not alone in your experience. You can then also use these people to generate ideas of how you can get out of this situation. Find out what they have done in the past to get through it, work out if you can do similar things to them, or make adjustments to take their ideas into account. Do not let it change your style completely, you need to remain true to your overall strategy, but there is no harm in getting ideas from others. It is also a good way to vent your frustrations.

So those are some of the things that you can do to hopefully keep your confidence during a slump. It is never a good situation to be in, people have lost a lot of money in them or even quit trading completely. Try to stick with it, look for your positives and there is absolutely no reason why you cannot get out of a slump, it may take a while, but you will get through it so keep your head up and keep on trading.

Categories
Forex Psychology

Losses When Trading Are Not Personal

Let’s get this out of the way straight away, the markets do not care about you, when you take a loss, they are not doing anything against you, in fact, they do not even know that you exist. When you take the loss personally, it is only putting the rest of your balance, money and psychological well being at risk of collapsing.

It sounds a little extreme to call it a psychological collapse right? Well, the fact of the matter is that that is exactly what it is. When you take a loss and then take it personally, you are going to want to do whatever you can to get it back and to get even, but you are doing this against something that doesn’t even know you are there. If this was a football match, the opposition scored, it is perfectly normal and fine to want to get even, in fact, that would be the entire aim for the rest of the match until you do. However, for trading, this is not the case, if you make a loss, your main aim is not to simply win that money back. It is to continue with your current strategy and not to let that loss get the better of you.

You need to be able to separate the feeling of a loss and the fact that someone did it against you with the idea that it is simply part of your strategy. Losses should have been built into it and so they should not be taken personally, as soon as you look at it in a way that the markets purposely hurt you, things will only begin to go downhill.

Trading can be hard and you will make losses, a lot of them, there are no traders that do not make losses, what is important is that you do not see them as a failure, they are not personal failures and you should not treat them like they are. A single loss means very little in the long run, by following your trading plan you will be able to make back the money lost very quickly. These feelings of things being personal only really come from a loss when you win, the strategy is working and that is it, but when you lose, you must have done something wrong, which is a long way from the truth. You will feel frustrated, you will feel like it was your fault and that can lead to some very bad decisions on your next few trades, decisions that could potentially put the rest of you account in danger.

Some that knee jerk reaction is always the wrong one, but what should you be doing? Your reaction to a loss should simply be that you want to find out why it lost, there is often a logical explanation (although at times the market can be a little crazy). Review what happened, find what went wrong so you can try to avoid it in the future. As soon as you make rash decisions you will make further losses, then more and more until you are done, analyse and look at things calmly and you will be able to work out and avoid similar losses, of course, that is often easier said than done when you have just lost some of your money.

When you experience your first loss it can be hard when you experience your first consecutive loose sit can be even harder, but you need to be able to look at them as learning experiences. Someone who has the experience of losses will be able to look back at what they die after the losses, was their ration right and do they resolve anything, looking back and using past experiences can allow you to better overcome any future ones. Did you manage to recover? The fact that you are still trading tells us and you that you did, so you will be able to again. Use past experiences to help you get over current ones.

We have mentioned how regular losses will be, everything one should be helping you to improve the way that you are able to cope with them, making it easier for you to get past them. Again, losses will happen, it is important that you are able to deal with them without letting your emotions and feelings get the better of you.

If things are getting a little tense, take a step back, move away from the markets in order to clear your mind. Come back with a clear head and then do not just start trading again, instead look back to the loss and try and work out why it happened, with a clear mind you will be able to look at it without feeling that it was personal and so it will be easier for you to work out how you can deal with it in the future and how to avoid getting caught up emotionally in the losses.

Remember, the markets are not there to hurt you, they are not there to take your money, there will be wins and there will be losses, working out how to deal with the losses is a vital part of trading, just remember that the markets are not targeting you and your losses are not personal, they are just part of what trading really is.

Categories
Forex Psychology

How To Get Your Trading Mojo Back

Your trading mojo can be a brittle thing, but what exactly does it mean, we have heard it in everyday life, someone has lost their mojo. Well to put things simply, it is another way of saying that someone has lost their confidence or their abilities to do something as well as you used to, and this is definitely relevant to forex and other forms of trading.

For any trader, there have been times where your confidence has been hit, either through a number of successive losses or even from taking a break. Being away from trading for a while and then coming back you will have no doubt forgotten something, this can also have a negative effect on your confidence and your own abilities to successfully analyse and trade.

The problem with losing your mojo is that it often escalates and continues in a downward spiel So you have had a few losses in a row, you now lose confidence in your strategy and begin to make trades that are not in line with it, these then continue to lose and put your account into the red, this further compounds the lack of confidence and can lead to either giving up or even obsessive trading without any real strategy which can increase the risk of blowing an account.

So how do we get this trading mojo back, how do we get out of the rut? The first thing that you will need to do is to take a step back, you need to be able to look at the trading that you have been doing so you can try and work out a few different things. Have you been trading differently? Are you still following the same plan and strategy? Has anything happened around the world that may have influenced the markets? Are you doing anything wrong?

Asking yourself these simple questions is a good place to start. It is part of the process of mending your confidence and will also allow you to work out whether you have changed anything giving you the opportunity to potentially change it back.

So taking a look back at the trades that you have taken. Hopefully, you should have been keeping a trading journal of the trades that you have previously made. You need to be able to look at which trades won and which ones losses, the setups for each one, and any outside influences that may have caused losses. It will take a lot of time but it will be worth it. Doing so may help you to identify certain patterns, both on the markets but also from your own behaviour. Being able to identify these will enable you to stamp them out, it may also go the other way and show that nothing that you did cause them to lose, if it is from outside sources out of your control, then it can be a way of confirming that what you are doing is actually right.

Check your stops and your take profit targets, could they be the cause of your losses, many people either set them too tight or too loose which can lead to missed profits or larger losses. Many people don’t start out with the right figures, it can take a bit of time to adjust them. They also need to be adjusted per trade, different pairs and different market conditions require different stops, so sticking them all at the same levels will no doubt lead to confusing results.

When losing, the worst thing you can do is go larger, instead, look at reducing the size of your trades, this can help ease any concerns that you have about losing more money. Knowing that any further losses will be much smaller can help you to get back into trading and to be a little more confident when trading. It is important to remember that when using smaller trade sizes, stick with them, don’t suddenly put them back up after a win or two, stick to the lower sizes until you have built your account back up to an acceptable level, at this stage you can begin to slowly increase the trade size again.

So those are a few ways to bring back your mojo and confidence, there is no doubt that you will lose it at some point, it is important to be able to recognise it and work on getting it back once it does happen to you.

Categories
Forex Risk Management

Helpful Habits To Help Reduce Your Trading Risks

Risk management, risk management, risk management, one of the most used phrases in trading, and for a good reason too. This can be based on the number of trades, the trade size and the potential loss of each trade, while it is often built into certain strategies, others do not and so it is important to remember to take it into account. We have come up with a few things that you could do to help you remember to do proper risk management and to ensure that you have done it right.

Have a trading plan:

This one may seem a little obvious, and to be fair it is. Unless you have a set trading plan you should not be trading on a live account. The sad truth is, that a lot of traders still trade on their impulses and their feelings rather than following a plan. Trading on emotion and feelings with no regard for the actual markets or certain risk management techniques like take profits and stop losses is a recipe for disaster, accounts will often blow and the trader will be left frustrated and not understanding what actually went wrong. By trading with a plan, you know exactly what trades you need to make, why you need to make them, and the exact amount of your account that you are willing to risk. Always plan your positions, plan your trades and you will be able to protect your account a lot more successfully.

Take profits:

When people think of risk management, they often think about the losses, but the profits are just as important, in fact, they are equally important to the protection of your account. When a trade is going the right way, itis very tempting to want to continue to ride it upwards, this could involve removing any take profit levels or simply moving them a little higher, however, the dangers of doing this is that the markets can reverse at any moment which could either reduce your overall profit or even take you down into the negatives. Taking profits or at least some of them is vital, by some of them we mean that you can set yourself two take profit levels, at the first one you take the profits of half the trade and then allow the other half to move up, at least this way you have taken some of the profits, you could then move the stop losses to break even to guarantee some profits from the trade.

Withdraw regularly:

This goes along with the taking of profits, regular withdrawals are vital, especially when you are just starting out, the phrase of only trading what you can afford to lose is a vital one and goes along with this point nicely. Many people now aim to trade risk-free, this means withdrawing profits each month until you have withdrawn as much as you put in, so you are trading just with profits and your initial investment is protected. Of course, as the account grows, it is important to regularly take some out, you never know when disaster can strike, so getting some out guarantees you those profits even if the account was to suddenly bow (it won’t with proper risk management).

Double-check your trades:

When you have put in your trade, ready to hit go, do you just hit it or do you double-check it? You should be doing the latter, I am sure that at one stage in their career, everyone has put in a trade far bigger or smaller than they intended, even I have put in a trade of 10 lots when I only meant to put in 0.10 lots. It can happen and it is very easy to do, so for hitting buy or sell, double-check the size, the stop loss and the take profits, even check that it is the right pair that you are trading. The consequences of getting it wrong can be huge.

Take a break:

It is important to be able to notice when you are in a bit of a rut when your motivation and concentration levels have dropped, this is the perfect time to take a step back. Taking a break is a fantastic way to help clear your mind, getting what is frustrating you out of your mind will help you to get a fresher look at the markets. When taking that break, be sure to take a complete break, don’t even look at the markets, get away from it completely, this was when you come back none of the thoughts still lingering in your mind, reset from the start of your strategy and take it from there.

There are of course many other things that you can do, however, these are some of the most obvious as it. If you are feeling frustrated, or your confidence levels are down, then take some of these steps, reset your mind, and start again, this will enable you to get your mojo back and will be able to start fresh and hopefully carry on before the rut starts.

Categories
Forex Price Action

Trend Line Trading: An Incident That Often Confuses Traders

In today’s lesson, we are going to demonstrate an occurrence that often happens when the price trends with a trendline. A trendline works as a support/resistance. However, there is a little dissimilarity between horizontal support/resistance and trendline support/resistance. To draw a horizontal support/resistance, one bounce or rejection is enough. However, a trendline can be drawn only when the price makes a new higher low/lower high. This is what traders must remember, and we find this out the reason behind it.

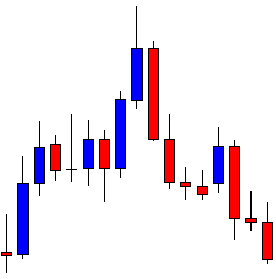
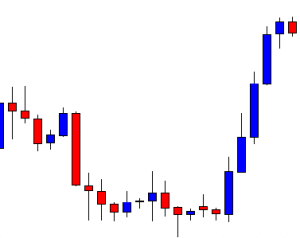
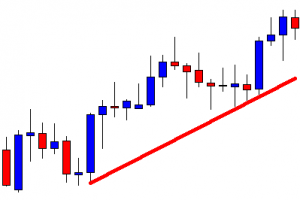
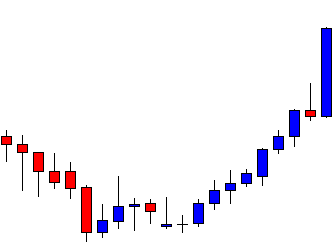
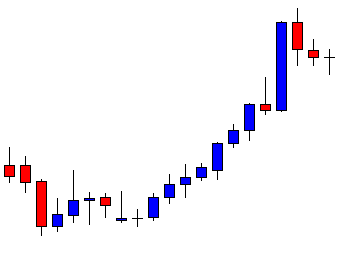
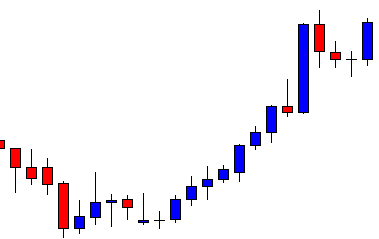
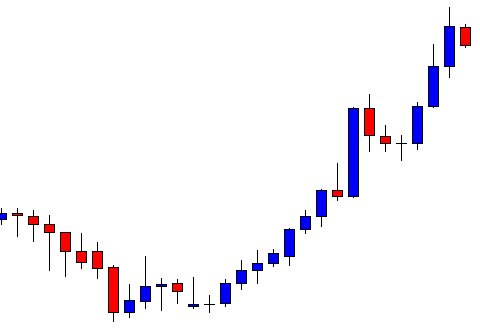
The price makes a strong bullish move, as it produces seven consecutive bullish candles. The last candle comes out as a bearish engulfing candle. Considering the trend’s length, the buyers may keep their eyes on the pair to go long upon having a bullish reversal candle at flipped support.

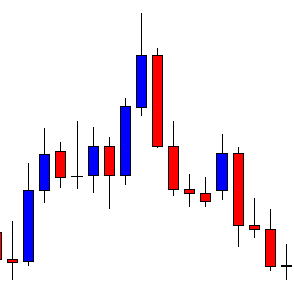
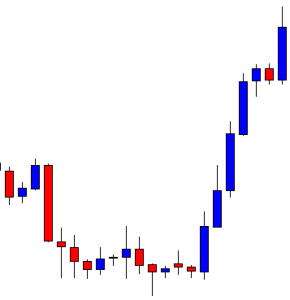
The price consolidates and bounces at the same level twice. The last candle comes out as a bullish reversal candle. The buyers on the minor chart may look to go long in the pair and push the price towards the North.

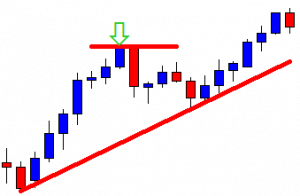
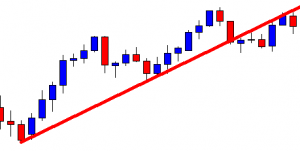
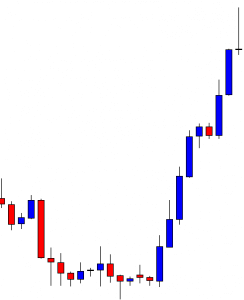
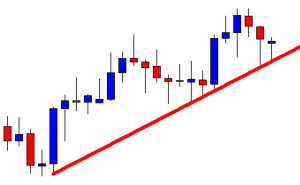
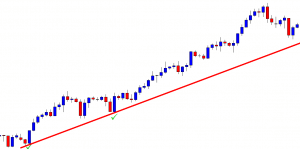
The price heads towards the North and makes a breakout at the last swing high. It means we can draw an up-trending trend line and wait for the price to come at trendline’s support and to get a bullish reversal candle to go long in the pair. Let us find out what happens next.

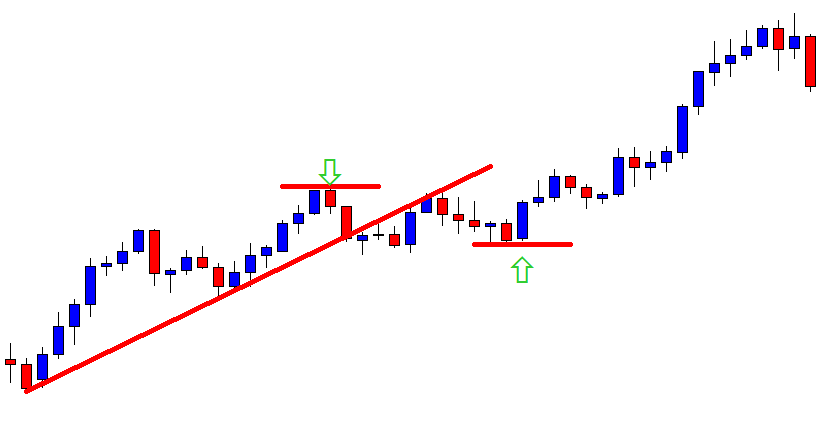
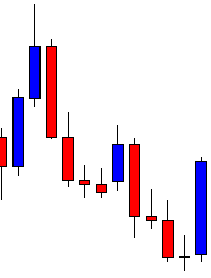
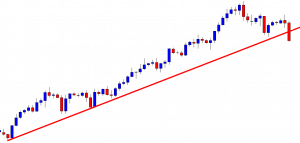
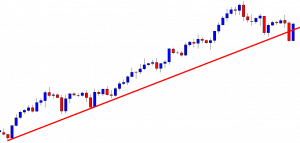
The price does not produce a bullish reversal candle. It makes a breakout at trendline’s support and trades below the level for several candles. If the price makes a breakout at the last swing low, the sellers may look to go short in the pair. Let us see what happens next.

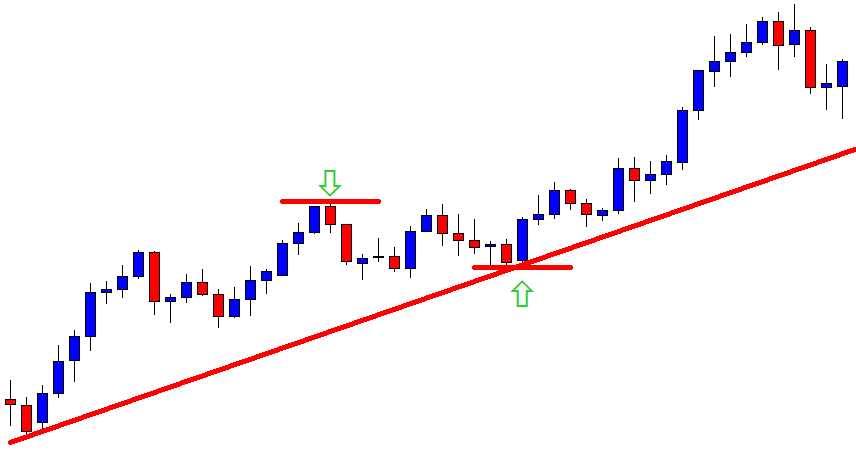
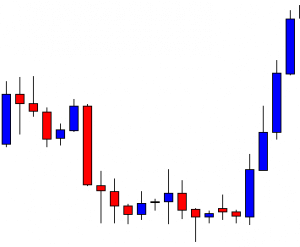
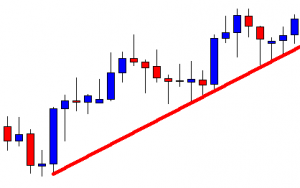
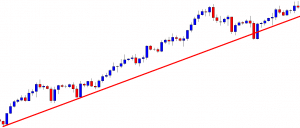
The price upon finding its horizontal support heads towards the North and makes a breakout at the last swing high. What does that mean? It means we can draw an up-trending trend line by using the last swing low from where the price makes a bullish breakout. Let us draw it and see how it looks.

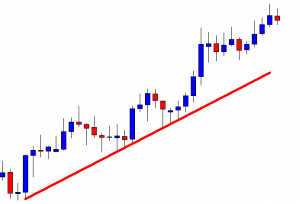
It is a new trendline. It offers price to makes more bearish correction and more space towards the North to travel. As a matter of fact, its support zone has changed, but the new trendline is valid for the same old chart. It’s an incident that happens in the Forex market so often. Thus, keep an eye on a chart closely and do not make an immediate trading decision. Be sure about the breakout. If the breakout is confirmed, change your trading direction. If the breakout is not confirmed, let the price decide its way. We just have to follow the price and trade with its direction.

Categories
Forex Fundamental Analysis

Understanding The Importance Of ‘Small Business Sentiment’ In The Forex Market

Introduction

Small Businesses and self-employed account for a large portion of the private sector. Small and medium scale businesses’ success and failure impact a large section of the country’s population. Critical economic indicators like employment rate, consumer spending, GDP are all directly affected by the performance of small scale businesses. By paying attention to small business sentiment indices, the severity of economic conditions can be assessed more accurately, helping us to form more informed investment decisions.

What is Small Business Sentiment?

Small Business

The definitions of a small business differ across corporations, regions, and countries. The Australian Bureau of Statistics (ABS) defines a small business as an independent and privately owned, managed by an individual or a small group of people, and have less than 20 employees. A business having 20-199 employees is termed a medium scale business.

Small Businesses are generally diverse, but broadly they can be segregated into a few broad categories, though. One of those sectors includes providing services to other businesses and households that can include professionals like plumbers, home doctors, electricians, etc. Another sector includes retail outlets like grocery, bars, saloons, etc. Finally, another sector that these businesses can be categorized into is the niche service and goods providers in the manufacturing, construction, and agricultural sectors.

Given the diversity, a large number of activities are taken up by these businesses. In many areas where large businesses cannot reach out due to lack of business viability, these small ones plug the gap. For instance, a remote area having a population of about 50-100 people would not be suitable for a supermarket; instead, a small private grocery shop would do the trick.

Small Business Sentiment indices try to measure the general sentiment towards the business outlook in the current and coming months. Since the sentiment is abstract, the numbers are not precisely quantifiable and differ from person to person. Still, the sentiment indices are calculated as an average of a selected sample of small businesses every month or quarter. Higher and more positive numbers indicate a positive outlook towards business prospects and indicate the economy is likely to grow and prosper. On the other hand, low and negative numbers indicate a weak business prospect, and the economy is likely to slow down.

How can the Small Business Sentiment numbers be used for analysis?

In the case of Australia, that has over two million businesses that come under the category of small businesses, which is over 95% of the entire business sector. The large and established business sectors contribute to the remaining 5%. Since the failure rate of small businesses is quite high in any economy compared to the business giants, focusing on it gives us more accurate and economy sensitive data.

While big corporations generally have their profits nearly constant with mild swings during all business cycles, the small businesses are more sensitive, and their P/L (Profit/Loss) swings quite wildly over business cycles. Small businesses are more vulnerable and take a bigger hit from economic shocks resulting in closures or filing bankruptcy. In contrast, larger businesses are more resilient and can weather economic storms.

The small businesses contribute to a large share of employment; in Australia, it accounted for 43% of total employment. Small businesses are also generally the source of innovations where the smaller size of the organization gives room for the more creative expression of employees. For instance, in the video gaming industry, some of the most innovative gameplay mechanics have come from indie studios (small remote studios) that have had humble beginnings.

Overall the small-business sentiment gives more economy-sensitive data, where the direct impact and severity of economic conditions can be easily measured. The footprint of large businesses in terms of global or nationwide presence masks the underlying weaker economic growth in particular areas. For instance, an international giant like Sony may have had poor sales in the music industry, which are not reflected in its final sales figures if they had a good sale in the electronics department.

The high failure rate of small businesses can broadly impact the employment rate, consumer spending. The large scale failure of small businesses can be in general attributed to weak economic conditions, less consumer demand, high dollar value, lack of additional or tolerant policy from the Government to support small and medium businesses.

Impact on Currency

As the currency markets deal with macroeconomic indicators, small business sentiment indicators are overlooked for the broader and more inclusive business sentiment indicators like AIG MI (Australia Industry Group Manufacturing Index). The small business sentiment is useful for a more in-depth analysis of small regional companies and is useful for equity traders focusing on small company stocks. It is also useful for the Government officials to understand and draw out any support policies to maintain employment rate, and avoid bankruptcy to small-scale businesses.

It is also worth noting that not all countries maintain sentiment indices for small businesses, which makes analysis and comparison difficult for currency traders. Currency traders generally look for economic conditions across multiple countries to decide on investing in a currency; in that case, small business indices are not useful. Overall, it is a low-impact leading economic indicator that the currency markets generally overlook due to other alternative macroeconomic leading indicators.

Economic Reports

In Australia, the National Australian Bank publishes monthly and quarterly reports on the performance of small-business and their prospects on its official website. A detailed report on how different sectors are faring during current economic conditions and probable business directions are all listed out in the reports.

The National Federation of Independent Business (NFIB) Small Business Optimism Index is famous in the United States for reporting monthly small business sentiment on its official website.

Sources of Small Business Sentiment Indices

We can find the Small Business Sentiment indices for Australia on NAB. We can find consolidated reports of Small Business Sentiment for available countries on Trading Economics along with NFIB statistics.

How Small Business Sentiment Data Release Affects The Price Charts?

As mentioned earlier, the National Australian Bank (NAB) is the primary source of business sentiment in Australia. The bank publishes monthly, and quarterly NAB Business Sentiment reports. The most recent report was released on August 11, 2020, at 1.30 AM GMT and can be accessed at Investing.com here. A more in-depth review of the monthly business survey in Australia can be accessed at the National Australian Bank website.

The screengrab below is of the NAB Business Confidence from Investing.com. On the right, is a legend that indicates the level of impact the Fundamental Indicator has on the AUD.

As can be seen, low impact is expected on the AUD upon the release of the NAB Business Confidence report. The screengrab below shows the most recent changes in business confidence in Australia. In July 2020, the index improved from -8 to 0, showing that business sentiment in Australia improved during the survey period. Therefore, it is expected that the AUD will be stronger compared to other currencies.

Now, let’s see how this release made an impact on the Forex price charts.

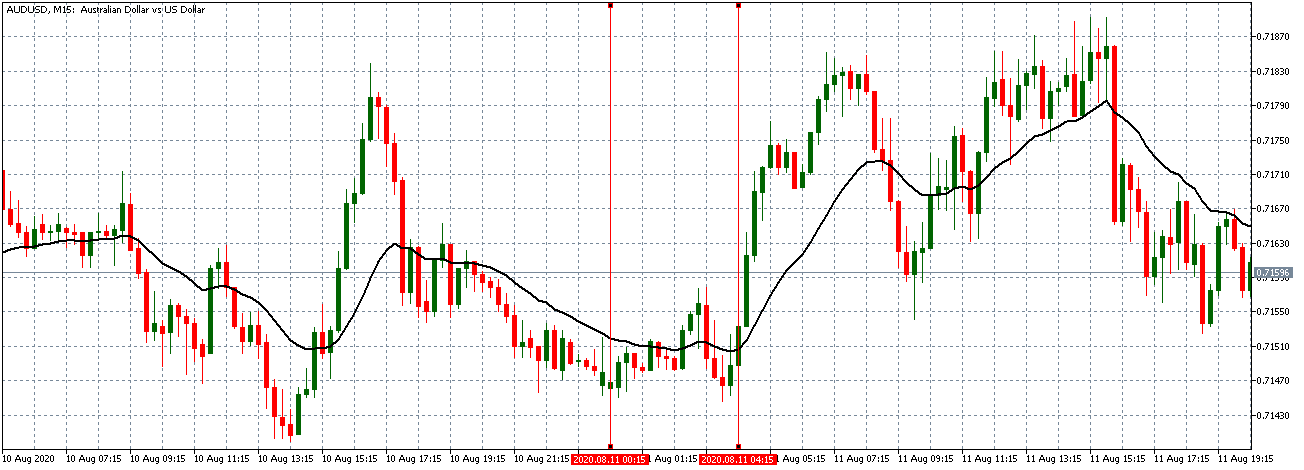
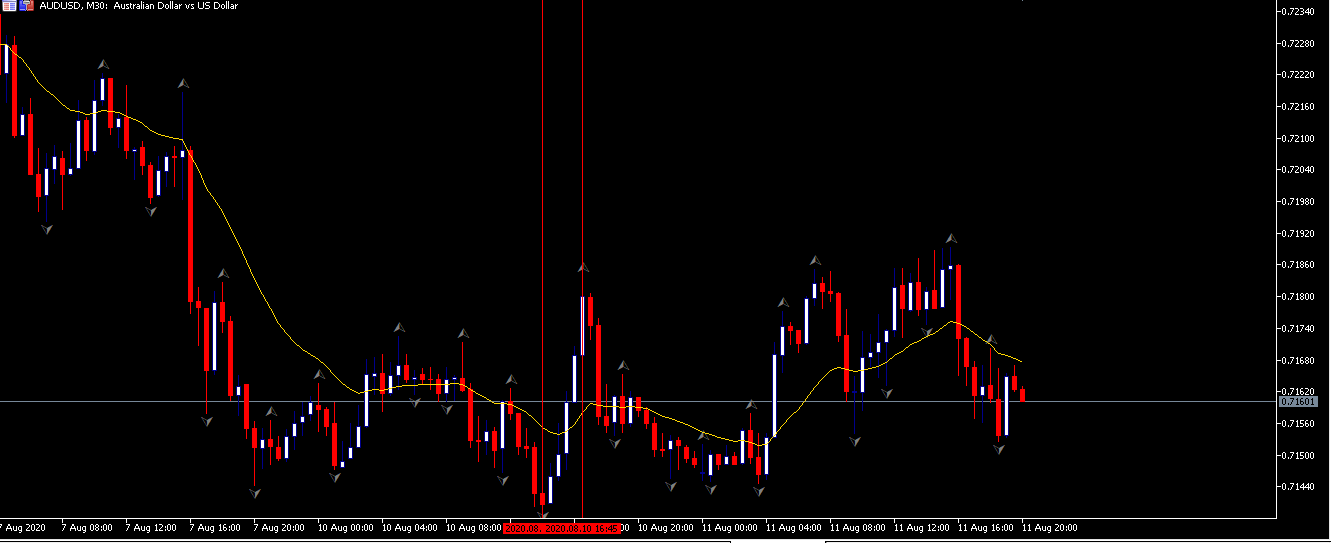
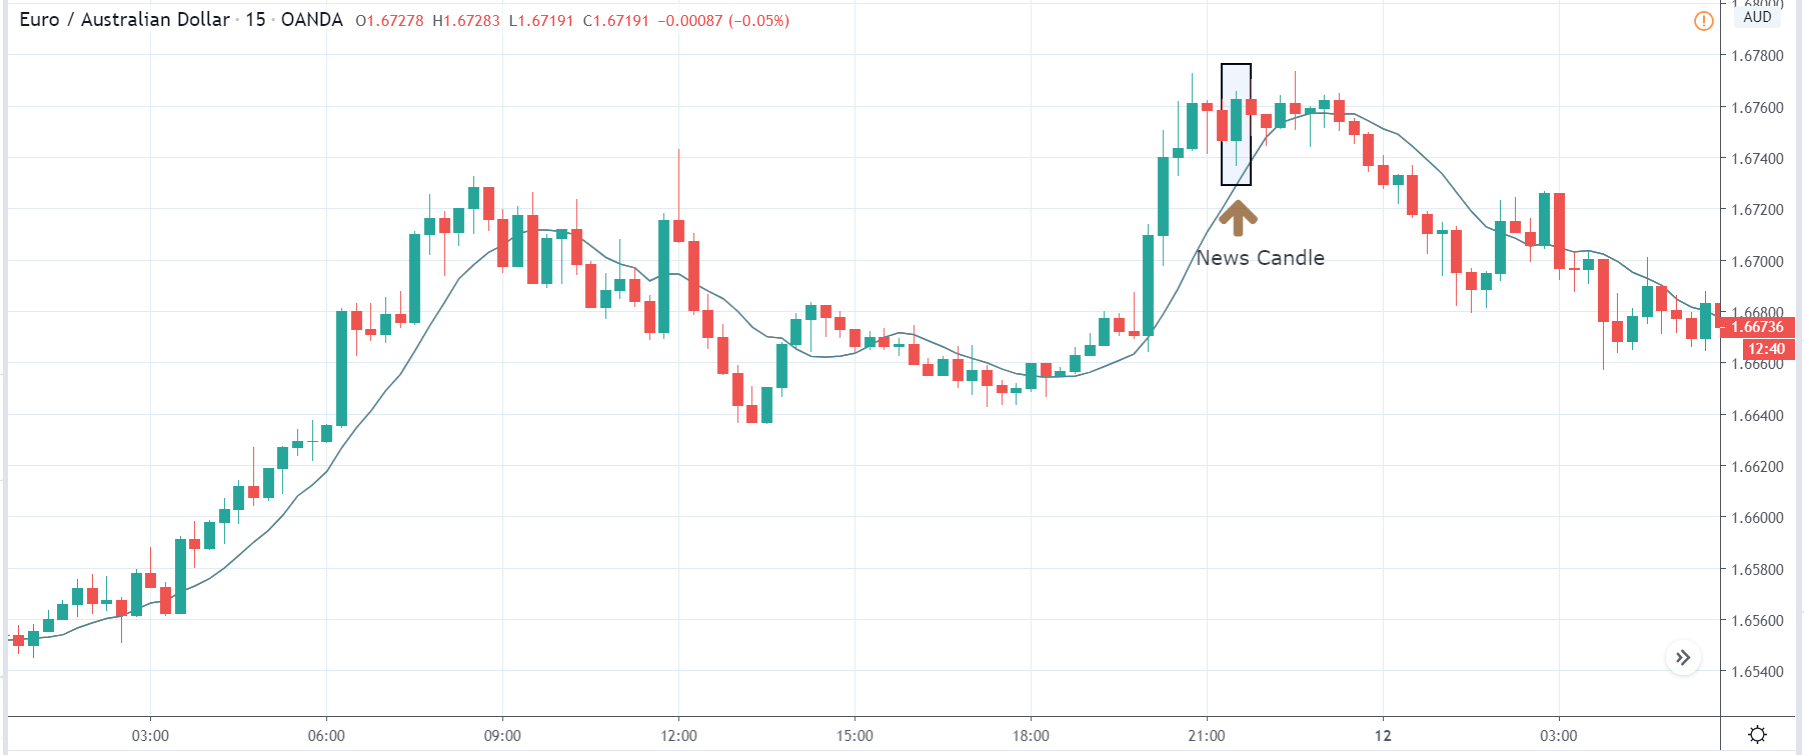
AUD/USD: Before NAB BC Release on August 11, 2020, Just Before 1.30 AM GMT

As can be seen on the above 15-minute chart, the AUD/USD pair was trading on a neutral pattern before the NAB Business Confidence report release. This trend is evidenced by candles forming on a flattening 20-period Moving Average, indicating that traders were waiting for the news release.

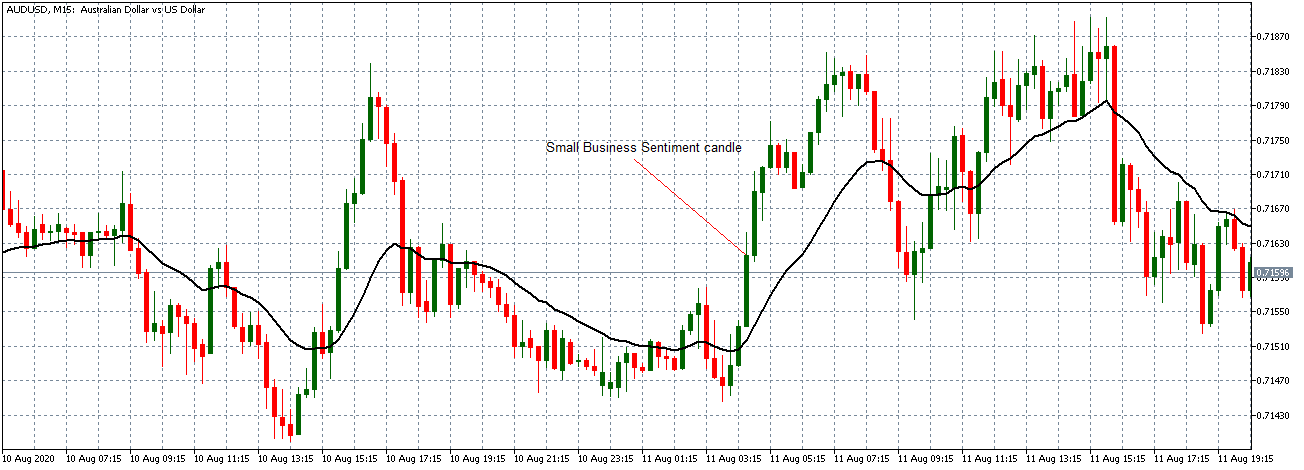
AUD/USD: After NAB BC Release on August 11, 2020, 1.30 AM GMT

After the news release, the pair formed a 15-minute bullish candle. As expected, the AUD adopted a bullish stance and continued trading in steady uptrend afterward with a sharply rising 20-period Moving Average.

Now let’s see how this news release impacted other major currency pairs.

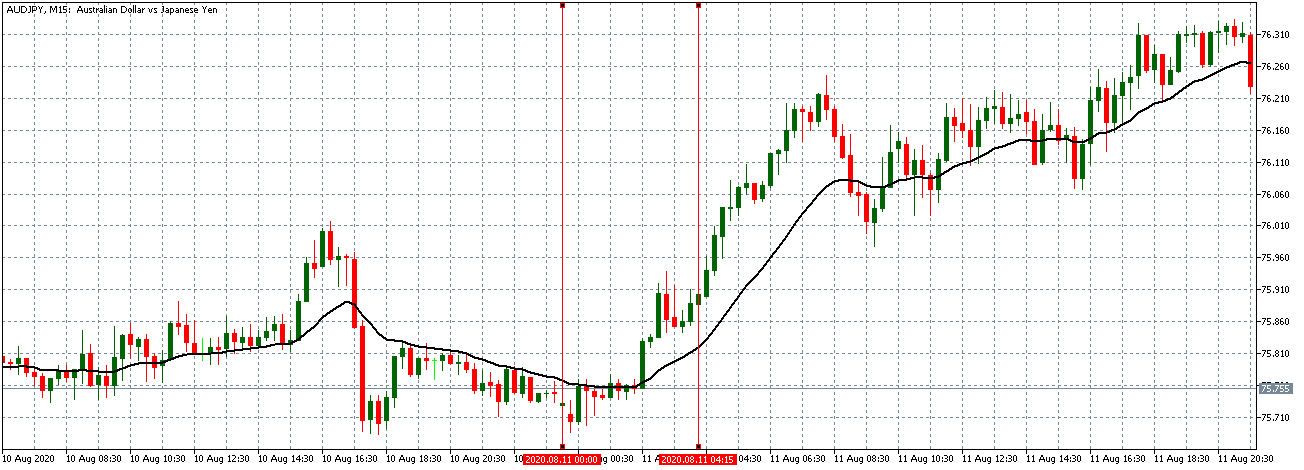
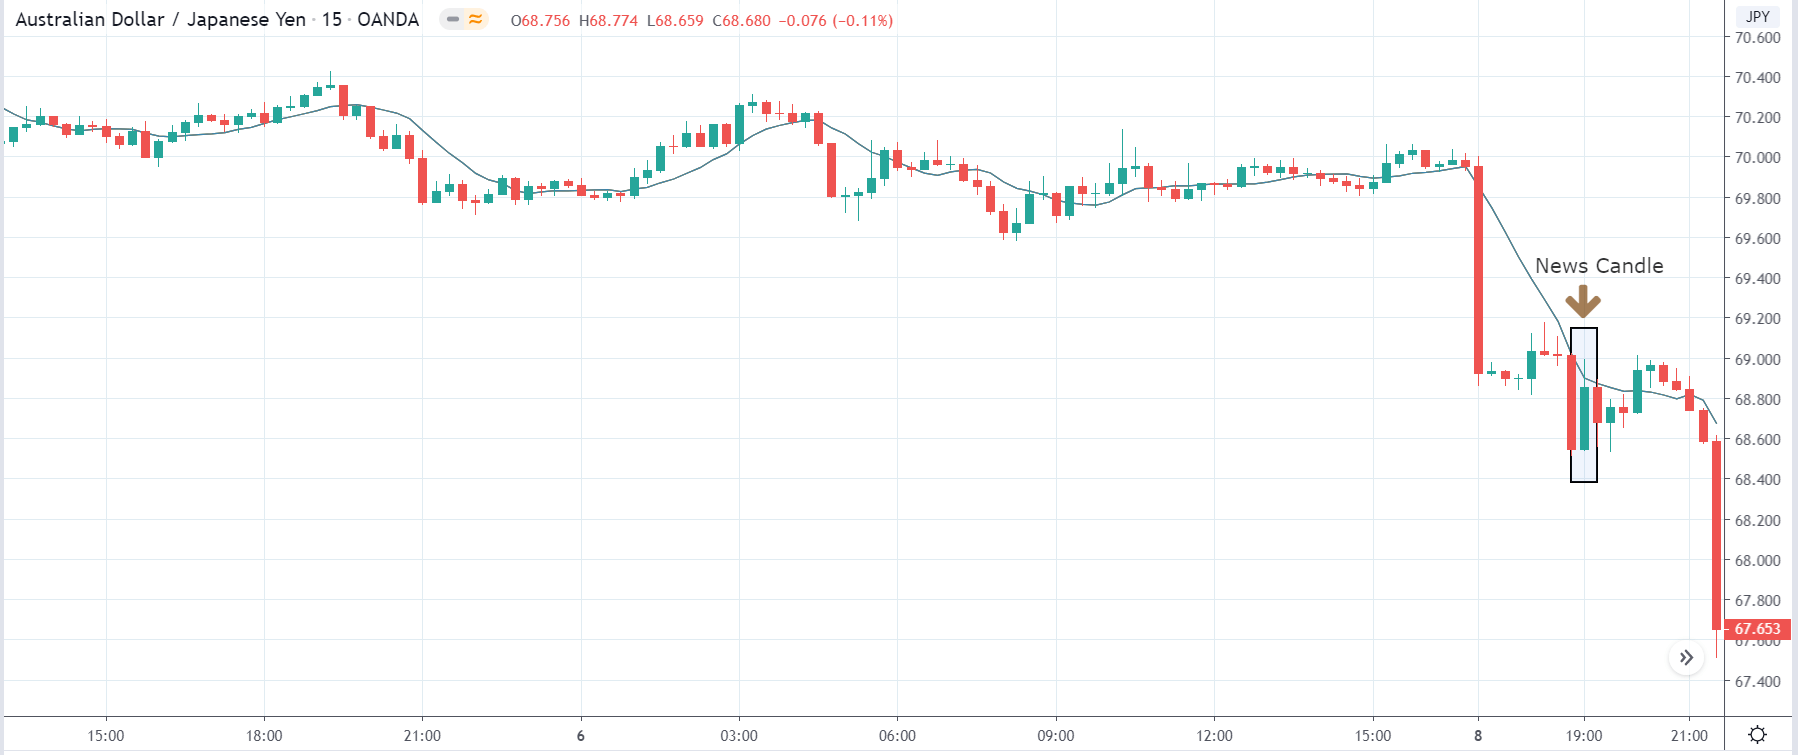
AUD/JPY: Before NAB BC Release on August 11, 2020, Just Before 1.30 AM GMT

Before the news release, the AUD/JPY pair was shifting its trading trend from neutral to an uptrend. Bullish candles are forming above the 20-period Moving Average.

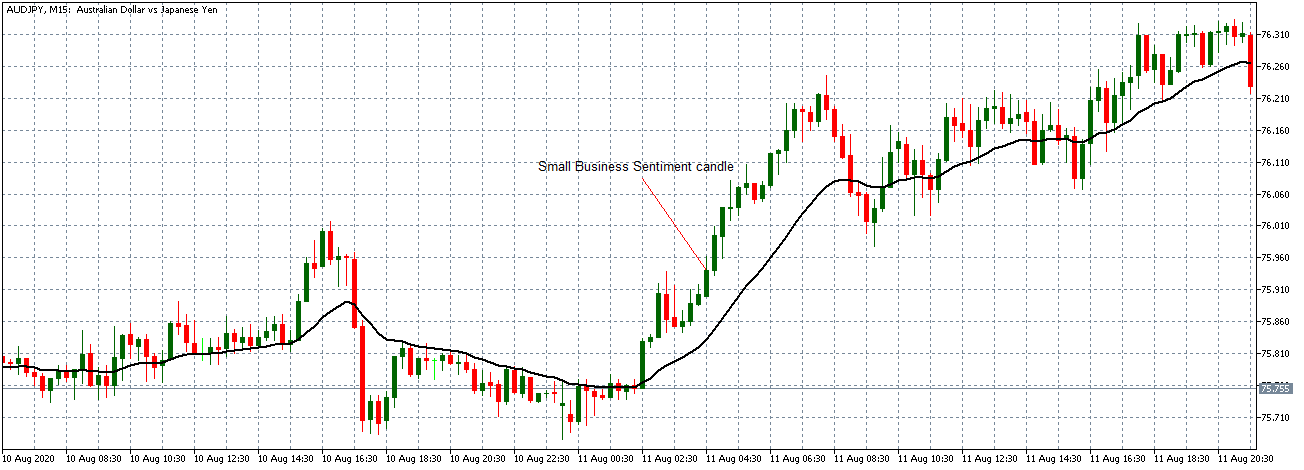
AUD/JPY: After NAB BC Release on August 11, 2020, 1.30 AM GMT

Similar to the AUD/USD pair, the AUD/JPY pair formed a bullish 15-minute candle after the news release. The pair later continued trading in a steady uptrend.

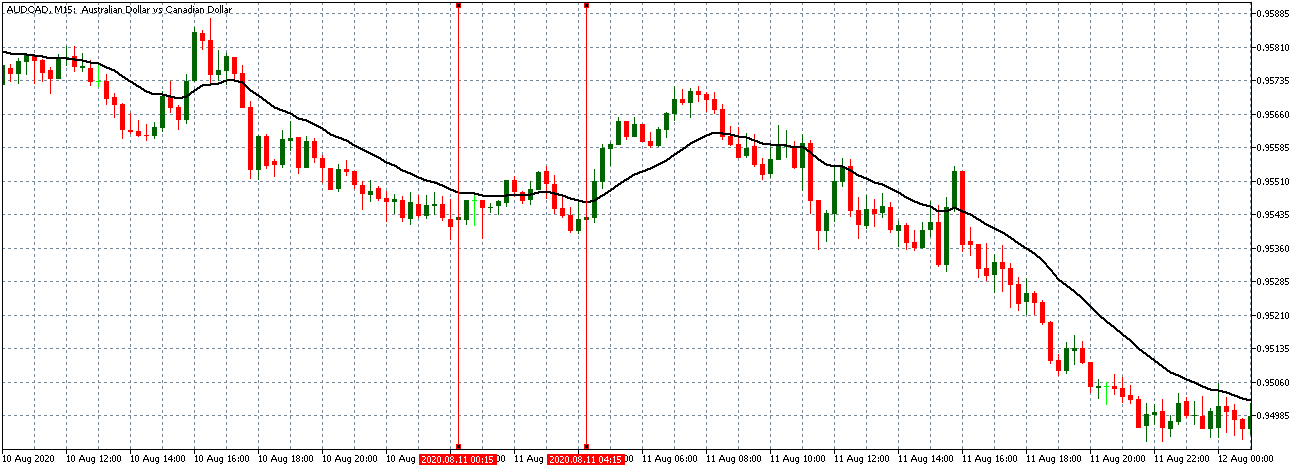
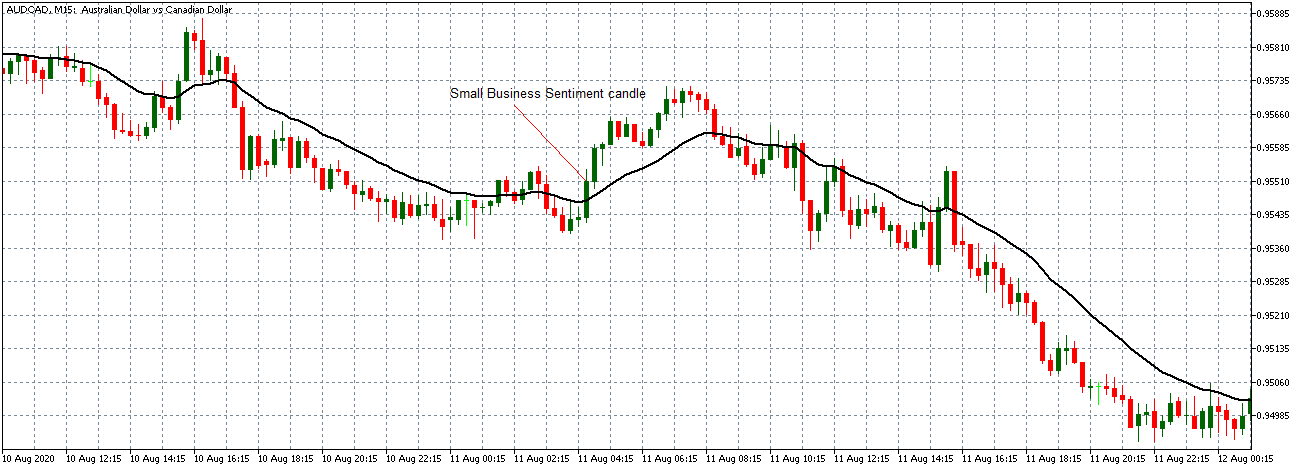
AUD/CAD: Before NAB BC Release on August 11, 2020, Just Before 1.30  AM GMT

AUD/CAD: After NAB BC Release on August 11, 2020, 1.30 AM GMT

The AUD/CAD pair was trading in a similar neutral pattern as the AUD/USD pair before the news release. This trend is shown by candles forming on and around a flat 20-period Moving Average. After the news release, the pair formed a bullish 15-minute candle and adopted a bullish uptrend, as observed in the previous pairs.

Bottom Line

Theoretically, the small business sentiment is a low-impact indicator. However, in the age of Coronavirus afflicted economies, it has become a useful leading indicator of economic health and potential recovery. This phenomenon is what propelled the NAB Business Confidence indicator to have the observed significant impact on the AUD.

Categories
Forex Daily Topic Forex System Design

Introduction to the Evaluation of Trading Systems

Introduction

Once the trading system has been tested and optimized, the developer must achieve its evaluation with a pre-defined set of criteria, which would allow him to decide if the strategy is viable to use or not. To develop this stage, the developer needs to identify which criteria he should use to perform this process.

Why Evaluate a Trading System?

The evaluation of the trading system is the step that the system developer uses to decide if the strategy performance fits the investor’s objectives or if it would be necessary to further optimize the strategy.

Criteria to Evaluate a Trading System

There is a broad range of indicators to evaluate a trading system and compared it with itself or with other strategies. However, the most common indicators are listed below.

Net Profit 

Net Profit is a widely used indicator in the finance world and plays an important place in financial analysis. It measures how much money returns the strategy during the test period. The Net Profit is the result of the sum of all trade results.

Net Profit = SUM ( res(i))

where res(i) are the individual results

The use of this parameter could drive the system developer toward making a biased decision without a risk level consideration, especially when comparing different trading systems. Net Profit is dependent on many factors, such as the frequency of trades and position size; therefore, this figure by itself says nothing about the system except that it is profitable.

Average Trade

The average trade measures the trading system goodness of how much money could return or lose per trade the strategy. Its calculation is the result of Net Profit divided by the number of trades N.

Average Trade = Net Profit/ N

Net Profit should also consider the slippage and commissions spent during the test period.

Percentage of Profitable Trades

This indicator shows the number of winning trades over the total trades. The developer should understand that a trend following system could produce a low percentage of profitable trades and still be a feasible system. However, the developer should weigh how the system is balanced with the average winning trade/average losing trade ratio.

The percentage of profitable trades is computed, as

Percent Profitable = 100 x(Nr of wins/ N) where N is the total number of trades.

Profit Factor

The profit factor is an indicator that measures the gross Profit in relation to gross loss. This ratio is ideal for comparing different systems or the same system compared with different markets. According to Jaekle and Tomasini, a good trading system should have a profit factor higher or better than 1.5.

The profit factor is computed as

Profit Factor = Gross Profit/ Gross loss

where Gross Profit is the total Profit of the profitable trades, and Gross Loss is the total loss of the losing trades.

Drawdown

This popular indicator measures the largest loss or capital decline of a trading system. In other words, the drawdown is the reduction of the equity level. Jaekle and Tomasini, in their work, exposes three types of drawdown identifies as follows:

  1. End trade drawdown measures how much of the open Profit the trader give back before the exit from a specific trade.
  2. Close trade drawdown corresponds to the difference between the entry and exit price without considering what is going on within the trade.
  3. Start trade drawdown tells how much the trade went against the position side after the entry and before it started to go in the direction of the trade.

For simplicity, Jaekle and Tomasini propose closing trade drawdown because they consider it the “most significant.” At the same time, the developer should be careful to use this measure because it is dependent on the trade size

The average drawdown accepted by professional traders and money managers vary from 20% to 30%. Although 10% is considered an ideal drawdown, looking for too small drawdowns may limit the growth of a trading system.

Time Averages

Time averages measure the average time spent in all completed trades during a specific test period of the strategy. The developer should weight the average time elapsed for each trade and the risk taken on each position.

Proposed Preliminary Step

To perform the evaluation properly, a fundamental step is to normalize the trade record, by transforming it to trade only one unit per trade, and also by computing the results in terms of Profit versus risk. Once this is done, the results of a trading system can be properly compared to other similarly normalized systems or its previous variations.

Conclusions

In this educational article, we presented a group of indicators that could allow the system developer to decide with objective evidence what could be the best configuration to apply in the trading strategy or if the system is unviable.

At the same time, the evaluation process must weigh the potential profits with the risk involved during its execution and not make decisions based on a unique criterion, such as the Net Profit or the drawdown.

Suggested Readings

  • Jaekle, U., Tomasini, E.; Trading Systems: A New Approach to System Development and Portfolio Optimisation; Harriman House Ltd.; 1st Edition (2009).
Categories
Forex Psychology

Are You Guilty of Trading Bias?

Biases can have an effect on anything in life, from the food you wat, the places you visit, and when we are looking at Forex, the trades you take, and the reasons behind them. We have looked at some of the more common biases that you find within the Forex trading world.

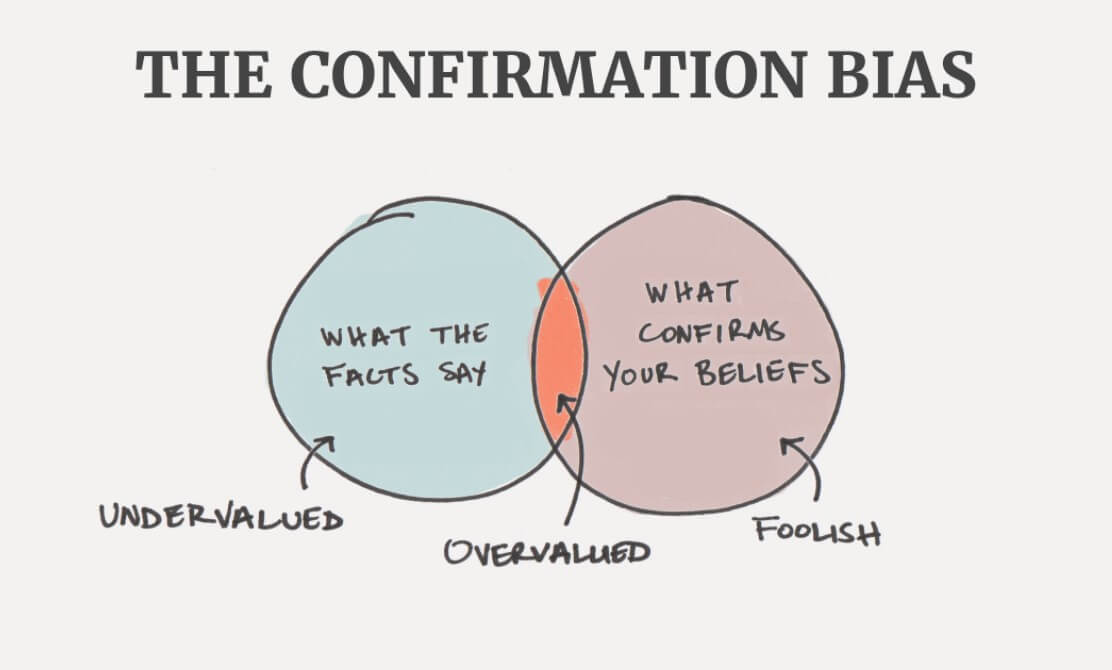
Confirmation Bias

This is something that you get in any industry, you see it most often on the internet or during an argument where someone will come up with an idea that sounds a little far fetched, they will then look over the internet to find sources of information that match what they have said while looking for evidence is good, it’s not when you skip over 10 different pieces of information that counter yours, just to find the one that confirms it.

The exact same thing can happen in trading, you have done a little bit of your own analysis and come to a conclusion, so you want to confirm it with others, when you look online for it, you will automatically be looking for analysis that is the same, so if you thought something was bearish, you will be looking for bearish information online, even your search may contain that exact word. So you may find an article that matches yours, but the 10 articles around it may state that the market is bullish, ignoring those counter-arguments can cause an increase in losses. Looking for unbiased analysis is the best way to go, although we know it can be quite difficult to find.

Herding Bias

This is often referred to as a Sheep mentality, have you ever found yourself doing something simply because other people are? If a Sheep decides t ogo somewhere, another may follow, then another and another until the entire herd is doing that action or going t that place, that is where the term sheep mentality comes from.

This behaviour can be seen in trading too, if the majority of people are going long, then it is far more likely that the next person to come along will also go long, then the next and then the next. It’s natural to think that if the majority are going one way, they must know something, but this is not the case. You have done your analysis, it all points to a short position, so take that short position, why did you waste all that time just to be persuaded by a group of people, most of which most likely did not actually research anything. Take the trade the way you analysed it, if it’s wrong, then you can learn from that mistake through your journal, but if you go long because everyone else did, you learn nothing as you do not actually know why you took the trade in that direction.

Attribution Bias

This is all about what you feel is responsible for a loss or a win, when we look at trading, when we win, we often congratulate ourselves on a great trade, we analysed things well and it paid off. When it goes wrong, who is to blame? It was what Trump said, it was a freak movement in the markets, it was anything but me that caused it.

It is very natural for humans to want to blame someone or something else for their misfortune, however, it is important to be able to look at something without this bias, being able to determine exactly where the trade went wrong, and what you did wrong is one of the best opportunities that you have agave to learn. Simply putting it down to an uncontrollable outside force does not teach you anything, it does not help you to adapt and it does not help you with becoming a more profitable trader.

Addiction Bias

This one is all based around excitement, the thrill of getting a big win, the idea of getting a big win. Our minds will always want to retain memories of those most exciting trades and the ones that made us the most money. This can often lead to something called an addiction bias, where we want to try and recreate that exciting experience. Having that huge trade in the back of your mind can make you break out of your sensible strategy in order to put on a larger trade to try and recreate that feeling, this is never a good idea, it goes against your risk management and into a territory of trade that is outside of your strategy, making it harder to predict and a lot more dangerous for your account. Use those large trades as a reminder of what you can achieve, but do not try to fast track yourself to that outcome.

Recency Bias

This is about thinking about the most recent thing that has happened and making decisions based on that one event, rather than looking at things as a whole. This can be quite prevalent with news traders, especially now Trump is the president. If there are a number of news events coming up for USD, the overall markets are bullish at the moment, the most analysis points to a bullish movement, the news comes out and it is negative (bearish). What do you do? You put on a sell because the news can move the markets down, but, nothing happens, it continues to rise, why? The reason is that the markets are still bullish, one bit of news won’t change that, you have looked at the most recent event to happen and ignored everything else. You need to maintain a view of the entire picture, not just the most recent even to happen.

So, those are some of the biases that we see both in life and in trading, are you guilty of them? I know I have been, it’s ok to have these biases, what is important is that you are able to identify them, and then work on avoiding them in the future.

Categories
Forex Psychology

How to Successfully Avoid Trader’s Regret

Have you ever made a purchase and then instantly regretted it? Wondered why you just spent that money on whatever it is that you purchased? It has happened to all of us, it is called “Buyers Regret” and it is something that everyone experiences. It is the feeling of regretting the fact that you just spent this money on something and it happens more often the more expensive than an item is.

This same feeling can happen to traders in the form of “traders Regret”, it works much the same way and can have potentially devastating effects on both a trader’s account and also the trader themself. This feeling comes simply by the fact that you are risking your own money when trading, each and every trade that you make is a potential loss and will potentially cost you that money, this can lead to a few different things.

First, let’s look at what sort of trades can often cause this, we all should have our strategy and trading plan in place if you stick to it, it is far more likely that you will not experience this very strong emotion. However, if you have been listening to others and placing trades based on something you have seen or heard then as soon as you make that trade, you may wonder why you have done it. The same feeling can happen when you decide to step out of the comfort zone of your training strategy, as soon as you place that trade, you know that you have moved away from your strategy and put your account in some additional risk.

The feeling can also come when you have done nothing wrong, this is more obvious for those that are risk-averse if you do not like risk, then placing any sort of trade which adds an element of risk will potentially cause traders regret, this feeling can actually make it far harder to place trades in the future as the feelings that you had can linger in the back of your mind for quite a while.

The problem with traders’ regret is the fear that it can cause, it can make it far harder to make additional trades, it can prevent you from wanting to have that feeling again and so you begin to miss great trading opportunities, even those that are fully in line with your strategy and trading plan. Sadly, sometimes traders’ regret can get the better of you, as soon as that trade is open, you get the feeling and close it for a small loss, the trade can then go on to win. The next trade, it’s the same feeling and so you close it again, this can continue for quite a while. Most people will look at that and think that you probably shouldn’t be trading, this is not the case, what is needed is for you to work out a way to get over this feeling.

So let’s think about ways that we can help to avoid this feeling or to at least reduce it once a trade has been opened. The first thing that you need to do is to set up a trading journal, this is something that you can use to write down every trade and every decision that you make. This is perfect for reviewing our trades, and can also be a deterrent for traders’ regret, mainly because when you are worried about something you can look back at your previous trades to see why they were taken which can give you more confidence in the ones you are now making.

Having a solid trading plan can also help, if you have done the analysis and it is fully in line with your strategy then there should not be anything to fear. Knowing that proper analysis has taken place and that it is your decision should help alleviate some of the anxiety once the trade has been opened. This is a far better way of managing your trades when compared to copying trades that others have suggested.

While it may not be a good way to reduce the anxiety, a way of avoiding the potential of closing trades early is to simply input a stop loss and a take profit, place the trade and then walk away, leave the trading terminal, let it do its thing If you are not near the platform then you cannot close it, it will allow your strategy do what it was designed to do, after a while of doing this you will come to realise that your strategy is working, using itis giving you overall good trades, so it will help to alleviate some of the anxieties around placing trades.

Traders’ regret is a big thing, it can be very damaging, doing what you want to alleviate the feeling is important, it can take time, a lot of time, but the more confident you are with your strategy and trading plan, the easier it will be to avoid this very strong feeling of regret. In the end, you need to try and ignore the feeling and just make that trade.

Categories
Forex Psychology

Forex Trading Psychology 101

A lot of trading comes down to your mind, you can have the perfect trade setup, but if you are not in the right frame of mind then you can still get it wrong. There are a lot of different psychological pulls when trading including stress, anxiety, excitement, and overconfidence. Some are good and some are not so good for you. There are hundreds of different things that we could talk about when it comes to psychology, too many for us to list in just one article, so we are going to be looking at some of the more prevalent psychological issues that could arise as well as different ways that you can mentally prepare yourself for the hardships and ecstasy that is trading and forex.

Taking the Trade

It is fantastic that you are using a number of different aspects and elements of the markets to analyse your trades, the problem is that there are hundreds and thousands of different things that you could be looking at. As soon as you start to look at too many, the trade may well have gone, sometimes you need to look at a few and then take the trade. The more that you look at the more time it will take and also there will be a much higher chance that you could start to question your initial thoughts, resulting in no trade being put on at all.

You can never look at everything and you can never prepare for all potential outcomes. As long as you have done your basics and you have some of your rules in place that you are following then the trade should be good to go. Do not fall into the habit of over-analyzing everything before you do it and even over analysing it once it is on, this can result in not trades and also the closing of trades early which is generally something that you want to avoid doing as much as you can. Do not be afraid to skip a trade or two if things don’t seem right, but if they do, do not then go out there looking for things that could be wrong, just take the trade.

Not Every Trade Must Be Perfect

This kind of goes against a lot of the advice that is often given out, in fact, we have done some articles which say differently to what we are about to say, but not every trade needs to be perfect. If you are always looking for the perfect trade then you will be putting on very few trades if any at all. A perfect trade will potentially only last a few minutes, the markets will be constantly changing and you will need to adapt with it, part of doing that will be taking trades that are not 100% perfect, it may have been at one point but not anymore, this does not mean that you do not need to take it at all, you can still take the trade and it can still be a good one.

Remember that a lot of your job is to simply manage risk, there is no way to completely remove it, this sometimes involves making trades that do not fit your strategy completely, but with proper risk management, they can still be successful and profitable trades. Do not be afraid to revisit some of the trade ideas that you made or that you have had in your head, you can always alter the take profit and stop loss levels, doing so allows you to take not so perfect trades but then make them good.

Avoid Biases

There is such a thing known as recency bias and it is one of the most common problems that traders come across. To put it simply, this is basically where traders will place a lot more weight on recent events, so making them seem more important than they actually are. They then allow these beliefs to have an effect on the future trades that they are making. This can have quite severe effects on trading, a bad trade can make you not want to place any more trades due to fear of another loss, while a win can cause someone to become overconfident which can lead to bad trades being made due to the idea that they are great at trading and that their opinion is most likely correct.

If we look at an example, Bob has a perfect trade setup but he hesitated at making the trade because his last trade with the same pair an hour ago lost. This is sitting in the back of his mind and this delay in putting the trade on has meant that the opportunity has passed and the trade is no longer valid. It can be hard to take recent results out of your mind, but it is important that you are able to treat each trade as an individual and not as part of a sequence.

Don’t Panic Over Stats

People often seem to focus on the stats which indicate the past results of a trade, while they can give some fantastic insight into your trading and your habits, they do not and should not indicate what you believe the results will be like in the future. Do not get us wrong, you should be keeping track of these stars and should certainly be recording them, however, do not rely on them and do not focus on them when you are looking for your next trades. Use them as an analysis tool when you have a bit of downtime, not when you are actively trading, it will only influence your trades which is not something that you want to do. So your stats and past results can be useful but do not use them to guide your future and current trades.

Allow for Market Volatility

You can set up your trades perfectly but then as soon as things jump about, the markets are unpredictable and so you need to take account of any potential volatility that could arise. Certain current pairs and instruments are a lot more volatile than others and so you may need to make wider stop losses for those pairs. If you keep things completely rigid and have no room for adapting then things can go wrong. Ensure that you take these potential volatility spikes into account with your trades and this will help to reduce the risk of trades being stopped out too soon and also helps you to be more relaxed with your trading.

So those are some of the basic psychological aspects of trading that you should keep in mind when trading. There Are of course a lot more, and we mean a lot more things to do with psychology, but the majority of them have probably been told to you a hundred times already, so we tried to look at some of the slightly less frequently mentioned ones. Either way, keeping yourself flexible and eager to always learn will set you off on the right foot for becoming a successful and profitable trader.

Categories
Forex Psychology

Greed: The Most Dangerous Emotion to Feel While Trading

When just starting out, one of the many warnings that people seem to get is to not be greedy, in fact, a lot of mistakes that are made from both the new and experienced can have an aspect of greed in it, but what exactly is greed?

Greed is basically a “selfish and excessive desire for more of something than is needed” as stated by the Merriam-Webster dictionary. If you think back into your life, I am sure that you will be able to see times where this definition matches your own experiences, in fact, you may have experienced it a large number of times, often it can be a subconscious thing, making decisions without us even knowing, other times it can be an aim, not a good one, but it is still an aim.

Now greed by itself is not necessarily a bad thing, it involves the desire to gain more, to achieve more which is often a good form of motivation, where things go wrong is when this want for more becomes excessive when you do not have a limit to how much you want and so you keep pushing yourself for more and more and it can eventually push you to do things that you would never have done before and that is way outside your strategies boundaries.

So what exactly are the dangers of it? Greed is a very strong emotion that can prompt you to take actions that you would never have otherwise taken when we are looking at trading, this would come in the form of creating additional trades, larger trade sizes than usual or chasing the markets in order to either make more or to win back some of your previous losses. It can cloud your judgment and take you off the path that you have been working on for so long.

So we know what it is, and we know why it is bad, so how do we get over it? How do we suppress that emotion? It can be done, but it will take effort and discipline to do, its not easy, but once done, it will make your trading far safer and far more successful.

The first thing you need to do is take a hit to your ego, you need to have an understanding that you aren’t always right, you have your strategy with its criteria for a reason, if you were always right, you would not need that at all, and you know what? That is a good thing, you won’t always catch the movement of the entire market and you may miss out setups altogether, it is important to recognise that as when it happens, you still need to move on and concentrate on the next trade and not look back in regret.

That is a part of trading, losses and missed trades are as much a part of trading as winning is, looking at your strategy, in the long run, you can make a lot, but greed will tell you to make a lot now and worry about the future tomorrow, not a good tactic if that greedy trade causes you to lose the last months profits. Being able to forget the previous trades and just look forward is a way of preventing yourself from being influenced by our greed and making unnecessary and dangerous trades.

One way that some people prevent greed from coming in is to convince themself that they are more lucky than skilled when it comes to trading, so they do not have the belief that they can just put in trades and win, instead they need to ensure that they follow their strategies and entry criteria in order to trade, something that helps prevent them from making additional unnecessary trades. So ultimately, you need to look to the future, concentrate on your strategy, and avoid those additional trades.

Categories
Forex Fundamental Analysis

What Is ‘Interbank Rate’ and What Impact Does It Have On The Forex Market?

Introduction

The Interbank rate is an essential tool used by the central authorities to control the money flow within the economy. Changes in the interbank rate can add or withdraw money from the system overall, which can stimulate growth or slow down the economy, respectively. The Interbank rate drives interest rates for bank loans, which are the significant sources of capital for businesses and the general public. The understanding of the Interbank rate is crucial for our analysis.

What is the Interbank Rate?

The interbank rate is the percentage rate at which the United States banks lend each other money. A country’s Central bank dictates the banking practices for the banks within the nation. For the United States, it is the Federal Reserve which decides the interest rates and the banking practices. The central banks, in general, demand 10% of their total deposits be held as reserves to maintain liquidity and meet withdrawal needs.

Based on the interbank rate, banks having excess cash can lend money to the banks, which are falling short of capital to meet their immediate requirements or to maintain their minimum reserves.

What is the Interbank Rate – Second Definition?

The interbank rate also refers to the rate at which banks exchange currencies in the global forex market. The forex market consists of an interbank market, which is a significant part of the forex market system overall. This interbank market consists of big players. Most of those are banks, large financial institutions, investment banks, and mutual funds corporations and do not include retail forex institutions or traders.

The interbank rate numbers are what you see when you search in Google the currency exchange rate for a particular pair, but this is not the rate at which you can trade a pair. This rate is only available for the interbank market participants who are usually big financial corporations trading in millions and billions. The price you see is a jacked-up price of the interbank rate in your platform. Your rate is the sum of interbank rate and the spread which your platform charges for trade as profit.

The minimum transaction in the interbank market is in millions; hence the retail traders will not be able to afford the interbank rate. The interbank market participants trade currencies to manage their exchange rate and control interest rate risk.

Although, you can neither control nor trade at the interbank rate, important for traders to be aware of the interbank rate to avoid getting scammed by Forex brokers who main charge way above the interbank rate. The decentralized system of Forex allows for self-regulation, and hence the interbank rates hand the actual exchange rates available to traders are competitive and self-correcting. However, novice traders who are not aware of this might lose money by paying an excessive spread to brokers.

Economic Reports

Federal Reserve determines the interbank rate, and the average of all the interbank rates in all the lending transactions between the banks in the United States is called the Fed Funds Rate.

The interbank credit system is applicable for a short period, usually ranging from overnight to a maximum of a week. Hence, the interbank rate is also called the Fed Funds Rate.

The Federal Reserve announces the Fed Funds Rate based on a variety of factors like inflation, GDP growth, recession, monetary policy, etc. On the 1st of every month, the Fed Funds Rate is released.

How can the Interbank Rate be Used for Analysis?

The Fed Funds Rate drives money in and out of the economy. The Fed Funds Rate drives the interest rate on bank loans that is available to the public and businesses.

A higher Fed Funds Rate would mean that loans are now expensive than before. To take a loan now would mean paying more interest rate. Hence the general public is discouraged from taking loans indirectly. On the other hand, now it would be more profitable to save as they receive a higher interest rate on their deposits. Both these factors can change the general public sentiment on money spending. A high-interest rate environment withdraws money from the economy, thereby slowing down economic activity as people are less willing to spend.

Conversely, a low interbank rate encourages banks to give loans at a cheaper rate, and hence more businesses and people will be able to afford loans; this will ultimately lead to the injection of money into the system overall. When more money is available to a company or an individual, the natural tendency is to increase spending, businesses may use for expansion plans. All of this will stimulate economic growth and result in printing higher levels of GDP.

Impact on Currency

Traders and investors can use the Fed Funds Rate as part of their analysis. Since Central authorities use the fed funds rate to manage the economy and money supply, a historical correlation of interest rates with GDP growth rates can help us to determine the direction of the economy and the value of its currency.  It is a proportional indicator meaning higher interbank rates relate to currency appreciating phenomenon and vice versa.

Higher Interbank rates result in banks paying out higher interest rates for deposits, which can also attract foreign investors to purchase domestic currency to make a deposit and earn better returns on their investment.  Therefore, an increase in capital flowing into the economy and decreased local currency circulation in the rest of the world, thereby increasing its demand and worth.

A low interbank rate results in increased money flow into the system, which can be inflationary, thereby depreciating the purchasing power of its currency. Conversely, a higher interbank rate results in decreased money circulation in the system, which will be deflationary for the economy, and the reduced demand for goods and services will increase the purchasing power of the currency as people would tend to save than spend.

Even though the interbank rate changes do not immediately get reflected in the macroeconomic numbers like GDP and currency value, it is a slow indicator in that sense that it takes a particular time (weeks to few months) to show its effect in actuality. It is also important to know that the authorities use the interbank rate as a response or corrective measure to the current economic situation.

It is more of a gate check for inflation or deflation. It is more of an effect to a cause and not a cause in itself. It is a passive indicator in comparison to other indicators. It reflects more the past and current economic activities than upcoming financial situations. The initial temporary volatility in the currency after the news release is typical, but the long term effect reflects after a certain number of weeks only.

Sources of Interbank Rates

We can find out the Fed Funds Rate from the official website of the Federal Reserve System of the United States: Federal Reserve SystemSelected Interest Rates. We can also find a historical graphical representation of the effective fed fund rate changes in the St. Louis FRED website. For reference – Fed Fund Rate

Impact of Interbank Rate News Announcement   

The ultimate goal of any fundamental analysis is usually to determine if there will be a hike or a cut in the interest rates. As mentioned earlier, the interbank rate can also be referred to as the Federal funds rate. In the US, the Federal Reserve releases the interbank rate is determined by the FOMC which meets eight times in a year to set this rate

Below is a screengrab of the Federal Funds Rate from Forex Factory. On the right, we can see a legend that indicates the level of impact the Fundamental Indicator has on the corresponding currency.

The snapshot below shows the latest release of the Federal Funds Rate on July 29, 2020, at 1.00 PM ET. In the latest release, the FOMC recommended that the rate remains within the target of 0% and 0.25%. This range was within the analysts’ expectations.

It is worth noting that this year, the Federal Reserve has conducted two emergency rate cuts to combat the Coronavirus inflicted economic shocks. The first emergency rate cut was on March 3, 2020, at 10.00 AM ET, as shown by the screenshot below. The Federal funds rate was reduced to a target range of 1.00% to 1.25% from the previous range of 1.50% to 1.75%.

At another unscheduled emergency meeting on March 15, 2020, at 4.00 PM ET, the FOMC cut the federal funds rate by 1.00% to a target range of 0.00% to 0.25%.

Now, let’s see how this news release made an impact on the Forex price charts.

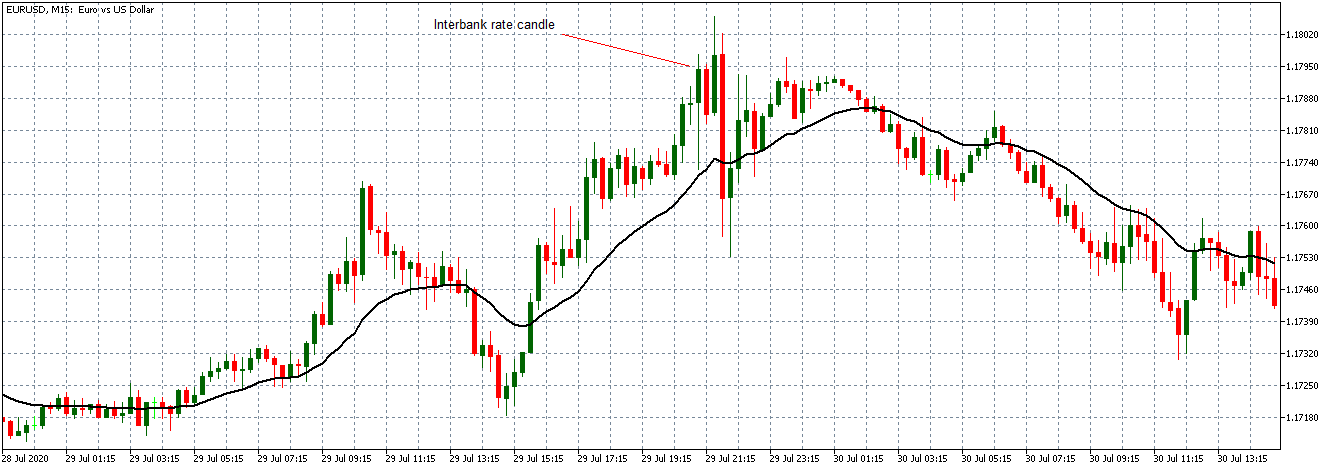
EUR/USD: Before Interbank Rate release on July 29, 2020, Just Before 1.00 PM ET

As shown on the above 15-minute chart of the EUR/USD, the pair was on a progressing uptrend between 7.45 AM and 12.45 PM ET. This uptrend as evidenced by the subsequent bullish candles forming above the 20-period Moving Average.

EUR/USD: After Interbank Rate release on July 29, 2020, 1.00 PM ET

After the FOMC release of the Federal funds rate, there is a renewed volatility in the market. The initial market reaction was negative for USD since the FOMC kept the rate unchanged. The rate release did not result in a shift in the trend since most traders anticipate it and price in their expectations in the market.

Let’s quickly see how this new release has impacted some of the other major Forex currency pairs.

GBP/USD: Before Interbank Rate release on July 29, 2020, Just Before 1.00 PM ET

GBP/USD: After Interbank Rate release on July 29, 2020, 1.00 PM ET

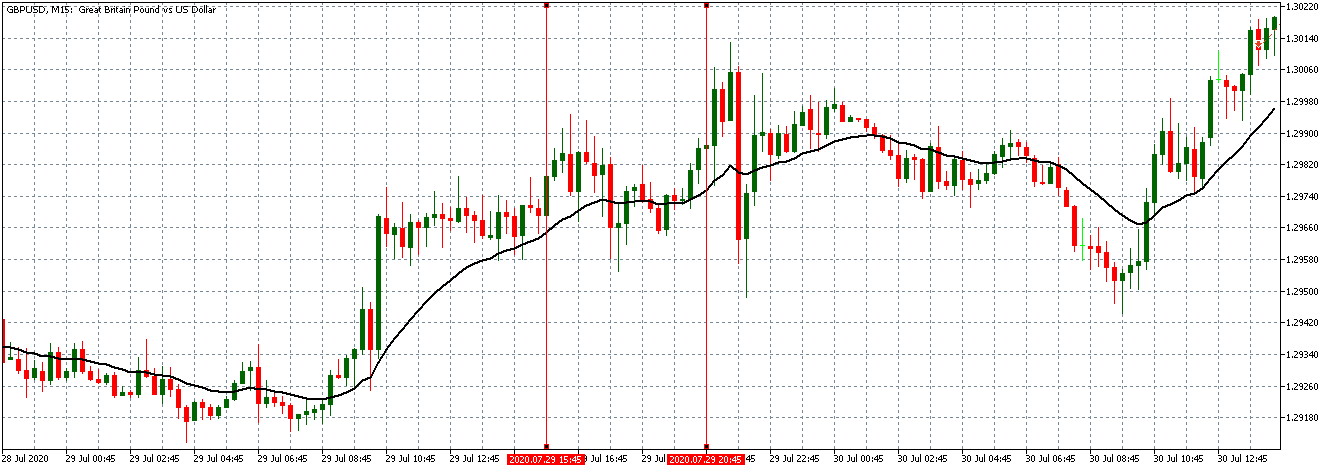
The GBP/USD pair shows similar trends, as observed with the EUR/USD. There is a steady uptrend hours before the interbank rate release. Market volatility is present after the news release but not significant enough to alter the prevailing trend.

USD/CAD: Before Interbank Rate release on July 29, 2020, Just Before 1.00 PM ET

USD/CAD: After Interbank Rate release on July 29, 2020, 1.00 PM ET

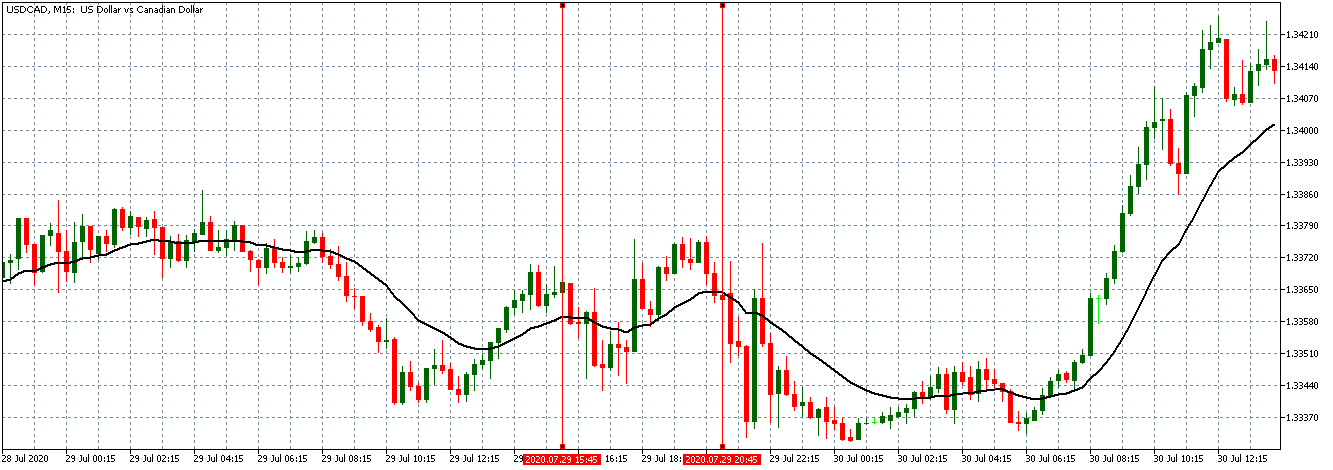
For the USD/CAD pair, a weak uptrend is observed, with candles forming just around the 20-period Moving Average. After the interbank rate release, the pair shows the same weakness for the USD as observed with the EUR/USD and the GBP/USD.

Bottom Line

The interbank rate is a high-impact fundamental indicator in the forex market. The FOMC Statement, however, dampens its impact since it is focused on the future. It is therefore advisable for traders to avoid opening significant positions before this news release. Furthermore, reading the FOMC statement will help to gauge whether the Fed is hawkish or dovish about the future.

Categories
Forex Price Action

Trendline Trading: Major Chart’s Support/Resistance and Take-Profit Target

In today’s lesson, we are going to demonstrate an example of trendline trading where the price trends towards the South by obeying a down-trending trendline. In one of our lessons, we learned the importance of choosing a chart for trendline trading. In today’s example, we find out one more point to go with that. Let us get started.

It is an H4 chart. The chart shows that the price heads towards the South by having a bullish correction. The chart shows that the price produces a double bottom. The buyers may keep their eyes on the chart to go long upon having a breakout at the neckline.

The price makes a breakout at the neckline and heads towards the North. It makes a bearish correction and resumes its bullish journey. The last wave suggests that the buyers may push the price towards the level, where the price made its bearish move earlier.

It does not. The price finds its resistance and makes a strong bearish move. It makes a breakout at the last swing low. What does that mean? It means we have two swing highs. With those, we can draw a down-trending trend line and wait for the price to go towards the trendline’s resistance to go short in the pair.

The price attempts to go towards the trendline’s resistance several times. However, it comes back to its horizontal support again. If we look at the horizontal support, the price bounces at the level three times. It becomes daily support, considering the number of H4 candles. On the other hand, the trendline’s resistance is an H4 resistance. The question is whether the H4 trendline traders should wait to go short from the trendline’s resistance or not? Let us proceed to the next chart and find more about it.

The chart produces a bearish engulfing candle. The price trends towards the South from the same trendline’s resistance. It produces another bearish reversal candle in the same chart.  Ideally, trendline traders should trigger a short entry right after the last candle closes by setting their take profit at the horizontal support. This is how the daily support is respected as well as the H4 sellers go short in the pair by using the trendline trading strategy. Let us see how the trade goes.

Wow! The price heads towards the South with good bearish momentum. It hits the target and makes a breakout at the horizontal support. It means the trendline is still active. The sellers may wait again for the price to go towards the trendline’s resistance and to get a bearish reversal candle to go short in the pair.

We must choose the right chart for trendline trading to take entry and we must remember the bigger time frame’s support/resistance to set take profit. If the risk-reward ratio is at least 1:1, we may take entry. If it is less than 1:1, we may skip taking entry and concentrate on some other charts.

Categories
Forex Psychology

Taking the Emotions Out Of Trading

Emotions can be some of the most powerful things that you can experience in life, they are what some would describe as the things that make us who we are and what makes us human. As they are a large part of us, it is often strange when people say that you need to be able to remove your emotions when trading, but they are a part of us, so that can’t be an easy thing to do.

Let’s get one thing straight to begin with, when we are talking about taking your emotions out of trading, we are not meaning that you need to sit there like a roto and to have no emotions or feelings while you trade, that is not feasible and not possible, what we are talking about is all about your decision-making process and the trades that you make, keeping your emotions out of those decisions so no rash actions are made.

There are a number of different emotions that can be very dangerous to your trading, these are things that you should be avoiding at all costs as they could potentially destroy your strategy and any risk management that you have put in place. The first of those is greed and the second is overconfidence. Greed often comes from losses, make a loss or two in a row and you want to win it back, it can also come from wins, you have a win and then want more so you decide to increase your risks and trade larger sizes. Overconfidence has a very similar effect, you have made a few good trades and so you think that you have the secret key, anything you do will win and so you increase the risk, the trade sizes and then no longer pay attention to your strategy and just trade what you think, I am sure you can work out the end results of trading in this style.

So how do we get rid of those two very powerful yet devastating emotions, the fact is that you won’t be able to, you will always have some of those feelings and you may always want to earn more, but what is important is that you are able to get around them, having your trading plan there in front of you each time that you trade will allow you to remind yourself that you need to stick to it, you need to stick to the risk management plan that you have created in order to keep your accounts safe. If you have ever gone against it and made a loss, keep that in your mind and keep a reminder of it near your trading platform, this way you can remind yourself about what can go wrong should you go against your plan.

Creating a routine for yourself can help create the idea of a system for you to follow, having these rules and requirements for the things that you do when trading will help you to be more autonomous, doing what is required and not having to think about things too much. Removing this aspect of thinking out of your trading will give you less chance to develop ideas or to develop stronger emotions towards the trading that you are doing. It also helps you to stay focused and to avoid certain distractions that would otherwise take your attention away from your trading.

One of the things that emotions can cause is a bias towards certain conditions in the markets or ideas that the market will move a certain way. While getting to these conclusions through analysis is positive, emotions can often cause you to believe that they will happen regardless of what the analysis says, sometimes even when the analysis is saying the opposite. This is where you need to ensure that any decisions and trades that you make are based on the facts and the analysis that is available, not on what you think will happen, doing it this way and getting something right can lead to overconfidence and we have already discussed why that is a bad emotion to have.

Staying committed and dedicated to your trading plan is another way to avoid letting your emotions get the better of your trading. You need to stick with it, sometimes it can be hard, especially when things are not going the right way, but you created that plan for a reason and you created it because you know it can work. So you need to be able to stick with it through the good and bad times, only this way can you be sure that you will be able to keep it profitable.

Keeping your emotions out of trading is not easy, in fact, it is one of the hardest things to do when trading, you will want to jump with joy with a win and throw your computer out the window with a loss, but if you are able to control the emotions, stick to your plan, you will be able to be far more successful at trading than if you were to et those pesky emotions get the better of you.

Categories
Forex Risk Management

The Best Ways To Keep Your Forex Account Safe

Keeping your account safe is the number one rule when it comes to trading, there are plenty of different ways that you are able to do this. Many of which you may have come across and may seem quite obvious, some others may be a little more secret.

So let’s take a look at what sorts of things you can do to help keep your account safe.

Reducing lot sizes: One of the main ways that you can dramatically reduce the risk to your account is to reduce the trade sizes that you are trading. If you are trading at 0.05 lots then reducing down to 0.03 lots or 0.02 lots will dramatically reduce the amount of risk that there is on your account. Not only does each trade now offer less risk should the markets move against you, but when a trade hits your stop loss it will be taking out a smaller chunk of your account. It could also enable you to place additional trades without increasing your overall positions and margin being used.

Making fewer trades: Sometimes we like to put on a lot of trades, especially if the current market conditions make it easy to put some trades on, the problem is that with each additional trade that you put in, you are risking more of your account and putting more of your equity into the active markets. In order to reduce the risk, you should try to place slightly fewer trades at a time, the fewer trades the less risk that there is.

Alter your strategy: If your strategy is causing you to open a lot of trades, then either it is a high-frequency strategy that can be quite risky to an account or your entry requirements are quite loose. One way to get around this is to add in some additional or tighten up the current entry requirements. This will make each trade a lot more specific and the strategy will end up owning fewer trades at a time.

Don’t copy others: It can be easy to get dragged into the idea of copying someone else as they trade, they are doing all the hard work of trading right? So why would I bother doing all of this work when I can just use theirs? It sounds great on paper, but unfortunately in the real world, it doesn’t always work out so great. When you copy their trade, do you know why they made that trade? Probably not, in fact, you have no way of knowing if even they know why they made that trade. If things go wrong, you do not know how to correct them and so you are pretty much risking your money on something that someone else has said, not really something you should be doing.

Take breaks: This won’t directly affect the risk on your account for the individual trades that you put on, but it will help reduce the risk of you making a mistake or placing too many trades. When we become tired or stressed, our decision-making skills all seem to fly out the window. So taking regular breaks in order to relax and clear your mind is important, not only is it healthy for you but having a calmer mind means that when you come back to make some decisions on what you need to trade, it will be easier to follow your trading plan and you won’t start to take shortcuts due to frustrations that were building. SO take regular breaks, they help you in more ways than one.

So those are a few of the ways that you are able to help reduce the risk to your account, of course, there are other things that you can do. Just remember that risk management is one of the most important parts of a trading plan so being able to reduce the risk is paramount to an account remaining successful.

Categories
Forex Psychology

The Pressures Of Forex Trading

Pressure, the incredibly strong feeling of dread or stress that can come over you when doing pretty much anything when there is something on the line. In regards to trading, that something is your account balance. This is even more apparent if you are currently trading as your full-time job and you are counting on it for paying things like your bills or to purchase your weekly shopping. Pressure can come from both within and from outside sources, so let’s take a little look at the sort of things that can cause pressure and the effects that this can have on both you and your trading abilities.

Have a little think about the sorts of things that cause you to feel pressure, normally it would be some sort of deadline that you need to meet, maybe you are nowhere near making it. This same pressure can come with trading, e briefly touched on the fact that you may be relying on the money that you will make in order to pay your bills or purchase your weekly shop, this sort of pressure can lead you to making rash trading decisions and making additional risky trades that are outside of your trading plan, simply so you can make enough to survive. This sort of pressure is not good at all, the desperation to make enough will make you throw out all caution and will ultimately cause you to lose, which in turn will increase the pressure further.

There is also the sort of pressure that you can put on yourself, if you consider yourself to be a perfectionist, every single loss that you take will be a little hit to your ego and will increase the amount of stress and pressure that you will be putting on yourself in order to do better. There is also the pressure of trading money that you may actually need, the old saying of not trading what you can’t afford to lose is a very honest and realistic approach, as soon as you start to trade with money you need, an incredible amount of pressure will come over you, knowing that if you lose it, you could be struggling in life for quite a while.

Pushing yourself to learn more, and to achieve more can put some unwanted pressure on yourself, there are no time limits, the markets aren’t going anywhere. Take your time to learn, don’t put these unnecessary stresses on yourself, there is no need to and it is completely self-destructive.

These pressures are often caused by some sort of decision that we made at one point in time when it comes to out trading, whether we deposited too much, our trades are using too much risk or we took the step to going full time too soon. It is important to think about each decision that you make, it is all well and good thinking that you will be able to deal with the pressure when it comes, but the best course of action that you can take is to avoid bringing the pressure down on you in the first place, if you can manage to do that, then you won’t have to deal with the crippling effects that pressure can have on someone.

Categories
Forex Psychology

Self-Motivation and Self-Discipline In Trading

Motivation and discipline, some incredibly important traits that you need to have in order to be a successful trader. You often hear that trading can be quite a demoralising experience, especially when things aren’t quite going to plan, so we are going to look at some of the reasons why you need to be able to self-motivate and self-discipline yourself and different ways that you could potentially go about doing it.

Firstly, let’s look at why motivation is so important. Motivation is defined as “a reason or reasons for acting or behaving in a particular way.”. This is all based around the way that you behave, someone with low levels of motivation will be a lot slower, less engaged, and offer much lower levels of productivity to someone who is highly motivated, putting in a lot of work, getting things done quickly and ultimately enjoying what it is that they are doing.

Motivation can be a very powerful feeling and something that can make you either successful or unsuccessful. The problem with trading is that you are all by yourself, this means that there is no one else around to motivate you. In a regular job (most not all), there will be a manager or a team leader around, one of the jobs that they have been employed to do is to help motivate those around them, to motivate their team to work hard. Without that person around, it is now down to you to do that job for yourself, and this can quite often be a lot harder to do than it is to say.

Think about the ways that you can motivate yourself, what is it that gets you going? For some, it is simply the idea that they can make some money at the end of it, but this is more of a motivational goal, rather than a way of keeping yourself motivated. When you have been at the computer for a number of hours, not much has happened or you have read over some new learning for the third time. It’s boring, you want to stop, how’d you motivate yourself to carry on?

People do this in entirely different ways and it will work differently for different people. Something that you may want to try is to set yourself little goals, these can be daily, weekly or monthly targets that you want to meet. Should you achieve them, then reward yourself with a little something extra, an extra cake, those trainers you wanted, it could be anything but it must be something that you desire, and it must be something that you are willing to go without should you not achieve those targets.

Other ways of increasing your motivational levels are to add a little bit of variety into your learning and your trading, and not to pressure yourself into always be trading. Of course, that will be boring and will cause your productivity levels to really drop, instead, try to change things up, try not to do the same thing for more than one day or two days in a row. This will keep things fresh and you will continue to learn and to be productive in your trading. It can also be important to talk to others, being by yourself lonely and this can bore even the most motivated of people. It is important that you manage to get out and talk to others, talk about anything. It doesn’t need to be just about trading, this interaction can break up the monotony of trading.

We talked about speaking to others. If we take this a ste[p further, a good way of motivating yourself can be by talking with other traders, people who are going through the same thing as you. You can talk about your plans, your results and compare how people are getting on. This can go one of two ways and it will depend on your personality as to whether this is a good idea. If you decide to compare your results with others and you are doing well, this can motivate you to keep working hard. However, if you see your results and you are not doing as well as the majority of others it can either cause you to lose a lot of your motivation as you feel that you are not doing as well, or it can motivate you to work hard to achieve the same as them. This Is entirely down to your own personality, if you are the sort of person to become disheartened then we would suggest not comparing results. If you are the sort of person where it drives you to work harder, then it can be a fantastic motivation builder

So we know a bit about motivation, but what about discipline? Discipline is defined as “the practice of training people to obey rules or a code of behaviour, using punishment to correct disobedience.”. This is often another aspect of a job that is given to a manager or a team leader, but trading by yourself, you are required to take on this role and need to have the ability to discipline yourself should you do something wrong or should your performance levels drop.

When you are working for someone they will be there monitoring your progress and the work that you are doing, trading at home, you do not have someone there to do that, so you will need to do it for yourself. This can be far harder than it seems, as many people automatically assume that they are doing better than they actually are, in fact, the majority of people feel that they are doing far better than they actually are.

The first thing that you are going to need to do is to work out how you are able to assess how well you are doing, this can be done in a number of different ways. Initially, you will need to set some targets and goals that you want to achieve, these can then be used as the overall target that you will measure your progress and performance on. They need to be realistic and achievable, as setting targets too high, will only result in you missing the and then feeling demotivated.

You will also need to think of some potential sanctions should you not be performing to the standard that you feel that you should be or if you are falling far short from your targets. This could simply be something like putting $10 into a saving pot that you can only access once you reach your goals, or that you don’t get that slice of cake that you usually have after a meal, this is all about ensuring that you keep your performance levels up. It can be very difficult to self-discipline yourself.

While what we are talking about is what you do yourself, if you are living with a family member, you could ask them to keep track of your targets and to see how you are getting on it’s not quite self-discipline but it works well for those that are not able to control and discipline themselves.

Self-motivating and self-disciplining is not an easy task and can be very difficult for a lot of people. However, getting it right can make working by yourself and trading by yourself very rewarding and can build up your abilities as an individual and as a leader. If you have what it takes then it can create a fantastic at home trading career.

Categories
Forex Price Action

Strong Reversal Pattern in the Daily Chart? Make Full Use of It

In today’s lesson, we are going to demonstrate an example of a daily chart, which ends up offering an H4 entry by producing a Morning Star in the daily chart. The Morning Star is one of the strongest bullish reversal patterns. The combination traders may make full use of it too. This is what we are going to demonstrate in today’s lesson. Let us get started.

It is a daily chart. The chart shows that the price makes a bearish move. The last candle closes within a level, where the price had a bounce earlier. The buyers may keep their eyes on the chart to get a bullish reversal to go long in the pair. Let us proceed to the next chart to find out what happens next.

The chart produces a Doji candle. It means neither the buyers nor the sellers are confident. The next candle is going to be very crucial. A bearish candle may drive the price towards the South. On the other hand, a bullish reversal candle may push the price towards the North.

The candle comes out as a bullish engulfing candle closing well above the Doji candle’s upper wick. It is a sign that the buyers may take over. Do not forget that the chart produces a Morning Star. It is one of the strongest bullish reversal patterns. The buyers on the daily chart may keep their eyes on the pair to go long with their different strategies. What do the daily-H4 combination traders do? They are to flip over to the H4 chart to find out long entry. Let us flip over to the H4 chart.

The H4 chart shows that the price heads towards the North with good bullish momentum. The price has not produced any bearish candles yet. The combination traders are to wait for the price to consolidate and produce a bullish reversal candle to go long in the pair.

The chart produces a bearish candle. The candle length suggests that the bull may show its strength in the next candle. If that happens, the buyers may find the opportunity to trigger a long entry.

The chart produces a bullish engulfing candle closing well above consolidation resistance. The buyers may trigger a long entry right after the last candle closes. Let us proceed to the next chart to find out how the entry goes.

The price heads towards the North further. Do not forget to notice the upper wick’s length. It means buyers on the minor charts have had a feast here. Most probably, it is because of the Morning Star in the daily chart. When a daily chart produces a Morning Star, it usually attracts buyers in the minor charts and vice versa. Thus, keep your eyes on the daily chart and make full use of it when it produces such a strong reversal pattern.

Categories
Forex Fundamental Analysis

How The ‘Corruption Rank’ Data Impacts A Nation’s Currency

Introduction

Corruption can very well be defined as seeking private gain through abuse of power that one has been entrusted. The biting effects of corruptions include:

  • Erosion of confidence in the monetary and economic system;
  • Hampering economic development;
  • Increase in current account deficits; and
  • Encouraging the growth of shadow economies

So, how does this affect a country’s currency valuation? Well, through GDP, of course! This correlation is explained in detail later on in this article.

Understanding Corruption Rank

Corruption rank is the ranking of countries worldwide based on how the countries’ public sector has been corrupted. It measures the extent of corruption by politicians and other public officials. Due to its nature of illegality and secrecy, there is no single indicator that directly measures the levels and extent of corruption in each country. The best measure of corruption rank is the Corruption Perceptions Index (CPI) published by Transparency International.

The CPI is used to rate the countries based on perceived levels of corruption on a sliding scale from 0 to 100. A score of 0 is considered the most corrupt. A country with a score of 100 is considered to be clean of corruption. The CPI is constructed based on the opinions of business executives, public policy experts, financial journalists, and risk analysts globally.

The CPI is a result of 13 rigorous assessments and surveys on wide-ranging issues on corruption collated by several reputable institutions around the world, including the World Bank and African Development Bank. These assessments and surveys are conducted in the two years preceding the publication. They incorporate a combination of qualitative and quantitative analysis which captures the manifestations of corruption, including:

  • Misuse of public resources;
  • Effectiveness of the prosecution of corruption cases by the judiciary;
  • The extent of bribery by firms and individuals to secure contracts, avoid taxations and payment of duties;
  • Bureaucratic loopholes that foster corruption; and
  • The effectiveness of anti-corruption measures implemented by the government

How Corruption Rank Impacts the Economy

To better understand how the corruption rank of a country influences its currency, we first must understand how corruption impacts a country’s economy.

Corruption inherently impacts the economy negatively. A specific study by the World Bank shows that the GDP per capita in countries with low CPI is about 60% less than for countries with a higher CPI. The negative effects of corruption are:

Overreliance on debt

Corruption results in a significant leakage in the budget. A country is thus forced to rely on debt, usually denominated in foreign currency. The interest payment leads to a higher share of revenue allocated to repayment in the short term instead of economic investments. This higher share of foreign borrowing also results in the local currency crisis.

Inefficiencies in the allocation of resources

Through bribery, the allocation of tenders is usually awarded to individuals and firms who are not qualified. As a result, most public projects are not completed, and the benefits to the economy foregone.

Creation of a shadow economy

Corruption facilitates the growth of several firms that avoid official registrations. As a result, the economy experiences a deficit in terms of taxation, import, and export duties payable. Consequently resulting in low GDP.

The exit of investors

Corruption leads to investors pulling their businesses out. This exit leads to reduced economic activities and accompanied by job losses.

A lower share of foreign direct investment (FDI)

Foreign investors often shun countries with rampant corruption since they seek a fair operating environment. Donor agencies such as IMF and World Bank also reduce their total outflows into such countries. Therefore, the recipient countries’ economy fails to benefit from such investments, which would have a multiplier effect within the economy. Also, because FDI is usually denominated in foreign currency, it usually boosts the recipient countries’ currency strength.

Reduced innovation

Corrupt countries offer very little protection in terms of patents and copyright protection. The lack of legal protection framework results in massive exportation of technology from such countries, thus denying the local economies the growth benefits.

Increase in current account deficits

Corruption creates a disincentive to invest in the local manufacturing and production industries. Apart from the drop in job creations, this leads to overreliance on importation to fill the local demand.

There is a direct inverse relationship between corruption levels in a country and its currency. The inverse correlation is because countries with higher perceptions of corruption have poor economic performance, while those with lower perceptions of corruption have better economic performance.

Consequently, a change in the corruption ranking is often accompanied by a corresponding change in the country’s GDP. In 2019, Sweden dropped in ranking from position 3 to position 4; this was coincided by a 6.37% drop in its annual GDP. During the same period, Malaysia ranked position 51 from 61, a period which coincided with a 1.68% annual GDP growth.

Source: ResearchGate 

How Corruption Rank Impacts a Currency

Although it is a rarely observed indicator, forex market investors should keep an eye on the annual release of the corruption rank. Because the corruption rank is based on two years’ worth of data, it is evident that the corruption rank signifies the underlying fundamental changes in a country’s economy.

High levels of corruption typically tend to be accompanied by a deteriorating economy. It is a known fact that the strength and fluctuation of a country’s currency are tied to its economic performance. Therefore, this is accompanied by a reduction in the valuation of the currency in the forex market.

Any improvements in the rank could forebode that the economy has been performing better, which will be accompanied by a significant appreciation in the country’s currency. Conversely, a drop in the corruption rankings signifies a deterioration in the economic conditions, which will result in the long-term changes in the currency’s value.

Sources of Data

The corruption perceptions index and the corruption rank are released annually by Transparency international. The corruption perceptions index can be accessed here and the corruption rank here.

How Corruption Rank Release Affects The Forex Price Charts

The corruption rank published annually by Transparency International rarely moves the forex market. It is, however vital for the forex traders to keep an eye out for CPI rank. As we have already discussed in this article, the CPI provides crucial information about the conditions of the underlying fundamentals of a country’s economy. The corruption rank is released annually following a two-year assessment and analysis. The latest CPI data for 2019 ranking 198 countries was released on January 23, 2020. A highlight of the release can be found on the Transparency International’s website.

Below is a snapshot of the top and bottom performers. The legend indicates the level of corruption in the country.

In 209, the US fell in rankings by one position, from 22 to 23 out of the 198 countries that were ranked. The screengrab below shows this position.

EUR/USD: Before Corruption Rank release on January 23, 2020

On the above chart, we have plotted a 20-period Moving Average on the EUR/USD chart. As can be seen, the pair had been on a consistent downtrend on the four-hour candlestick pattern. This downtrend is evident since the candlesticks are trending below the 20-period Moving Average. This similar downtrend on the four-hour candlestick chart can be observed on GBP/USD and NZD/USD, as shown by the charts below.

AUD/USD: Before Corruption Rank release on January 23, 2020

NZD/USD: Before Corruption Rank release January 23, 2020

For long-term traders, the pattern offers a great opportunity to go short on the above pairs, since the prevailing downtrends would favor them. Let’s now see how the price responded to the release of the corruption rank by Transparency International.

EUR/USD: After Corruption Rank release on January 23, 2020

After the release of the corruption rank, a persistent downtrend in the EUR/USD pair can still be observed. As shown on the daily chart above, the EUR/USD pair had a bullish candle on January 23, 2020. This strength is even though the US dropped in the corruption rank. Its CPI score dropped from 71 in 2018 to a score of 69 in 2019.

However, against the AUD, the USD can be observed to have weakened momentarily. The pair later regained its bullish trends. It is worth noting that the momentary strength in the AUD is because Australia performed better in the corruption ranking by climbing one position, as shown by the snapshot below.

The chart below shows the daily price action of the AUD/USD pair after the news release.

AUD/USD: After Corruption Rank release on January 23, 2020

The USD weakened against the NZD after the release of the corruption ranking. This weakness can be attributed to the fact that New Zealand ranked first with a score of 87. This ranking is shown by the screengrab below.

As can be seen on the daily chart below, USD weakened against the NZD after the news release.

NZD/USD: After Corruption Rank release on January 23, 2020

Corruption rank can be seen to have some mild effects on the price action of the selected pairs, but not enough to alter to the trend observed before its release. Although most forex traders rarely observe it due to the annual nature of its release, corruption rank provides vital information about the underlying fundamentals of an economy. All the best!

Categories
Forex Indicators

Dangers of The RSI Indicator

Relative Weakness or Relative Strength? The RSI is a popular indicator but it is not without its detractors. If you go online to learn more about technical forex trading – and who these days doesn’t? – then you will surely encounter a lot of people recommending the RSI. Indeed, most people you see on social media or YouTube who talk about the RSI will talk about it in glowing terms. This is why we think it’s important to bring you to the other side of the story. There is a growing number of technical forex traders out there who dismiss or outright criticize the RSI and this article is here to bring you their side of the story and the arguments they deploy to highlight the major problems with the RSI.

Popularity Contest

If you go online and do a search for all of the most popular indicators out there, you will likely find that you’ll get more hits for the RSI and just about any other indicator. You’ll hear about it all over social media whenever you’re trying to learn from others about forex and you’ll see video tutorials mentioning it or even promoting it. More than that, you’ll see it on your TV screens when you turn over to see the financial news and you will have heard about it from the very people you relied upon to teach you forex trading in the first place. Already here there are several serious problems to point out but we’ll come back to those further on in the article. First thing’s first, what is RSI?

Brass Tacks

The Relative Strength Index is an oscillating indicator that measures the velocity and magnitude of price movements. What you need to know though, is that it ultimately tells you if something is over-bought or over-sold. “Wait a minute, what do you mean over-bought or over-sold?”, you cry at your screen. Indeed, that’s one of the things about the RSI you should know. It was invented by a guy who is the father of a number of technical indicators, J. Welles Wilder. But the thing is, he invented it primarily for equities trading, where knowing if a stock is overbought or over-sold is pretty useful information because stocks – and commodities, where it is also heavily used – have an intrinsic value, while forex does not.

That isn’t to say that a currency pair can go as high or low as it wants, there are limits because governments or national financial institutions will eventually step in and rein things in. But that can happen thousands of pips down the line and there’s no guaranteed or even foreseeable limit where that kind of institutional intervention is going to kick in. Moreover, there is another issue with the RSI’s history, beyond it being invented for trading stocks, and that’s that it was invented back in the 1970s – literal decades before the kind of retail forex trading we are all doing was even a thing.

How Does It Work?

In its basic configuration, the RSI measures values from 0 to 100, where you will typically have lines at 30 and 70. When the reading goes below the 30 line, this indicates that a security or currency is oversold or undervalued and when the reading goes above the 70 line, this indicates that it is overbought or overvalued. As a default, the RSI will cover the previous 14-day period and is supposed to be overlaid against your chart to provide you with trade signals.

For example, if the RSI verges off into overbought territory and then drops down below 70 again, this should indicate that there is about to be a downward trend and you should go short. Conversely, if the inverse is happening with the RSI crossing into oversold territory and then rising back above the 30 line, this should indicate a reversal and the signal will be telling you to go long. That is how it’s supposed to work but – as many traders are increasingly keen to point out – there are several problems with that so let’s look at some of those.

The Problem of Popularity

As any high school prom king or queen will tell you, being popular is not always all that it’s cut out to be. In terms of the RSI, for us, it is important to understand why it’s so popular in the first place. Firstly – and this is pretty understandable actually, especially for traders who are just starting out – it is dead simple to use. Even if you’ve never encountered it before, just the short explanation above will tell you a huge chunk of what there is to know about using the RSI.

There isn’t a problem with simplicity per se – something being simple should not be a reason to avoid it. If there is a simple and easy to use indicator out there and it works, then just go ahead and use it. The problem comes from people who expect to be able to find one indicator and use it to consistently make money by trading on the back of that one indicator. But you should know by now – regardless of where you are in your trading career – that there are no silver bullets. In fact, if you think you’ve found a silver bullet that’s easy to use and is simple and everyone else is using it, you’re in big trouble.

But that isn’t the real problem with the RSI’s popularity. The real problem with the RSI’s popularity is that it is popular. If that sounds like a tautology, it is. But in forex trading there is a big problem when everybody is doing the same thing so when something’s popular, it’s time to start hearing those alarm bells. If you’re doing something in forex trading that is popular, something everyone else is doing, you’re running with the herd. And if you’re running with the herd, there are big players out there, who have way more influence in the way the market behaves, who is going to notice that the herd are all moving in a particular direction. The herd as a whole are going to be on the radar of the big players who will manipulate the mechanics of the market to take advantage of that big clump of traders who are all doing the same thing and sending their money in the same direction.

Of course, you’ll eke out a win every now and then – that is, the big players will let you have a win from time to time – because this keeps you in the game and lets them pick you off the very next time the herd gets going together. This doesn’t work the same way in the equities trade, so if you’re used to that, get ready for something different. In forex trading, you want to steer clear of the herd and stay away from what’s popular as much as possible. If that were the only problem with RSI, it would be enough to make smart traders drop it immediately. But there are other problems lurking in there and if you are still clinging on and conjuring up counterarguments in your head right now, you should be aware of the other problems some traders are keen to highlight.

The Problem of Credibility

The RSI is not only one of the most popular indices out there, but it has also been given the weight of credibility by television. You will have noticed that financial news anchors will often pull up a chart of a given currency pair and show it on your screen referenced against its RSI. Now, why do they do this and why is it a problem?

The simple answer to why they do this is that they don’t know any better. Most financial analysts on television are not traders and certainly not technical traders. They make their living by being smart and credible and being extremely good at talking about the financial markets. They do not need to spend their time trading, researching, testing, and backtesting indicators. Moreover, they know full well that their audience is also not, for the most part (like 99%), technical traders. So neither are they in a good position to properly present and explain indices more complex than the RSI nor would their audience appreciate it because they would struggle to follow along.

So why is this a problem of the RSI and not just a problem of how the financial news treat forex trading? Well because if you are just starting out trading or have been trading using the RSI (with mixed results), seeing these prestigious financial news shows flashing that very same indicator up on the screen will probably mean you will give the RSI more weight than it deserves. If it deserves any at all. You might use it and lose money or you might continue using it beyond the time when you actually become aware that it isn’t working. All because it has been lent this credibility by being on television and being discussed by smart people in suits.

The Problem of Teaching

Speaking of smart people in suits, another reason why people continue to use the RSI and why it is so popular is that it is taught to people learning how to trade in just about every forex trading course out there. When you’re just starting out and you don’t know any better – and crucially, you haven’t built up any of your own trading experience in a meaningful way – RSI looks pretty valid. It is kind of exciting because you are taught this indicator that tells you to wait for certain conditions and when you see them, it gives you a signal to trade.

It’s really easy to learn and you pick it up with no effort at all (are those alarm bells ringing yet?) – all you have to do is look at your chart and identify when the RSI is giving you a signal to trade and just take it. If you’ve learned anything about forex trading by now, you should hear how unrealistic all of that sounds. What’s more, the RSI really easy to teach, which is why it has found its way onto all those courses and video tutorials. It doesn’t take a rocket scientist to teach it and you don’t have to have a foundation course in brain surgery to learn it.

But that’s where you have to question who it is that’s teaching you to trade. Is the person you’re learning from an actual trader? Chances are they are not. If they are making their money by teaching forex trading or by making forex tutorials and courses and then selling them on, there’s a good chance they don’t have to trade for a living. They just want to teach this stuff and, if you’re starting out, you’re hungry for knowledge and just want to learn. As a result, they will show you easy-to-teach indicators, like RSI, that fit neatly into their course material and are easy to back up with simple examples that will make them look like they’re teaching you something important.

There’s a problem with those examples, however. In almost all cases, when somebody is showing you an example of how RSI works, they’re showing you a cherry-picked example. They’ll go out and find the perfect moment, on a chart of the perfect currency combination and set it to the perfect timeframe and then they’ll say, “see here where the RSI crosses back down under 70, that’s an indication that the price is about to trend downwards and here you can see that that is what’s happening”. But even in these best-case scenarios, if you look at the chart, you’ll probably be able to see a couple of cases of the RSI telling you to trade one way but the price going the other way or stagnating. You can try it now, go to YouTube or on social media and find somebody singing the RSI’s praises – there’s a 90% chance that you’ll be able to see for yourself that the example (the one that they chose) is full of holes.

Ultimately, the reason RSI gets taught so much to just about every last living soul who wants to learn about forex trading, is that the teachers themselves don’t know any better. As we said, they are almost certainly not traders themselves, and, more to the point, there are thousands of indicators out there to choose from. A great many of these are more difficult to teach than the RSI, less likely to throw up what appear to be sure-thing examples and more likely to work in conjunction with other indicators in a trading system that’s adapted to the needs and habits of the individual trader. Well, how do you teach that? Surely it’s just simpler to show people the RSI. It is and that’s why they do it.
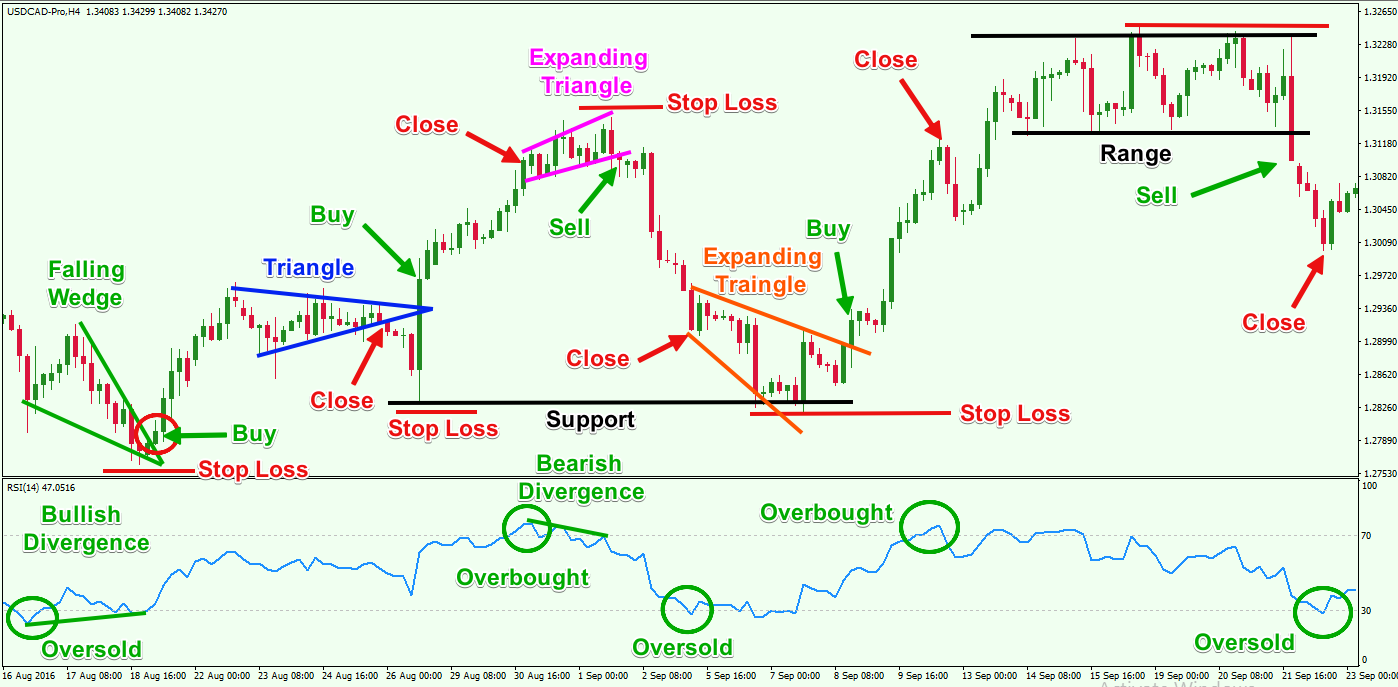
The Problem of Success

With all of its popularity and credibility and the fact that it was taught to you when you first started trading, the RSI gets used a whole lot. Now, if everyone was learning the RSI and using it and it failed every time, people would simply drop it immediately and it would be resigned to the ash heap of history. But it doesn’t work that way. In fact, it’s much more insidious and sinister than that. The main reason people continue to persevere with the RSI is that even though it is probably losing them money in the long term, they have occasional successes with it, which reinforces all those cognitive biases generated by everything we’ve already covered in this article. It’s called gambler’s ruin or casino theory.

If you went to a casino in Las Vegas and you and everybody around you was just constantly losing money – never winning, not even 0.001% of the time – nobody would ever go to a casino again. The way the house keeps you coming back for more is that you do occasionally get that blackjack or the roulette ball does sometimes land on your number. It doesn’t happen nearly as often as the house wins but it happens often enough that it gives you that kick of adrenaline and clouds your judgment so you keep gambling.

Do not underestimate the power of that rush from winning. It will keep you in a casino for ten hands beyond the one at which you should have stopped or keep you using an indicator that you have seen doesn’t work consistently but that brought you that one win a few months ago and boy didn’t that feel good. The big players in the forex market understand the power of that thrill and will use it as mercilessly as the casinos in Vegas or Macau or anywhere else in the world. They reel out a little slack and the herd lap that up and comes back for more.

The Final Nail in the Coffin

There is a counterargument to much of this and if you use and like the RSI, you’ve probably been reading through this like a coiled spring, waiting to counter with: “But the RSI does work in range-bound markets!” Well, there are a lot of seasoned technical traders out there that would respond like this: If you’re seeing a ranging market, it’s probably already over. Forex markets don’t range forever and identifying a ranging phase in the market is not as simple as textbooks will have you believe. You won’t know when it’s coming and when you see it forming it will likely be too late to take advantage of it using the RSI.

The problem is that there is a glut of reversal traders out there relying on the RSI to call out reversals for them and they outnumber the people who are trying to follow a trend when it does break out. It’s the very reason the price trends as long as it does sometimes. When it does, it sucks the life out of those reversal traders over and over again – erasing any gains they made when the price was consolidating.

Try It and See

Of course, the best way to be really sure that the RSI is flawed is not to listen to an endless to-and-fro of well-thought-out arguments. The best way to be sure is to take the thing to the testing range and see if it falls apart. One good way of doing that is to open a demo account and trade it using the RSI exclusively. Use this account to track the wins and losses over a meaningful period (anything less than a couple of months is too short) to see where it gets you. Sadly, most traders are not sufficiently disciplined to go through all of that and will not benefit from that learning experience but demo-testing an indicator like that does reveal a whole lot about it.

The alternative is to look at a historical example and analyse those moments where the RSI was giving a trade signal. Chances are you would see very few examples where the signal would actually have paid off. The way to do this is to take a popular currency pair or a pair that you actually trade and look back over a year’s worth of data. Pull up the RSI indicator, compare it against the price chart, and go through each and every time the RSI pinged a trade signal. Check forward from that point to see whether following that signal would have paid off but be honest with yourself about where you would have set your stop/loss and take profit limits.

You will find that, in most instances, following the RSI will completely kill you. That’s not to say it never throws up a win. It will give you a win from time to time but the losses will outweigh these infrequent wins over time. And not only that but the wins will more often than not be pretty mediocre and the losses will not. To sum up, there are a lot of traders out there who are very disparaging about the RSI and now you know why. If you feel like this is sound advice, don’t take their word for it, test it out for yourself in a demo account and see if it really lives up to any of its hype.

Categories
Forex Risk Management

Monthly Returns: Reviewing and Goal Setting

What is the satisfying rate of return that we can achieve during a period of one month? Do we really need to aim for any kind of speedy results? There are a lot of different types of traders out there, experts, professionals, beginners, people who trade just for fun, or people who think they are doing just great so they want to set some goals for the future. That part of pursuing the goals could be very tricky in forex trading. Naturally, we all want to be better and more successful in areas like trading psychology, money management, and trade entries. We want to acquire wealth and knowledge as well but for that, we need discipline and a killer strategy. Before all of that, we need to achieve patience, because that skill could be our most powerful weapon in most cases.
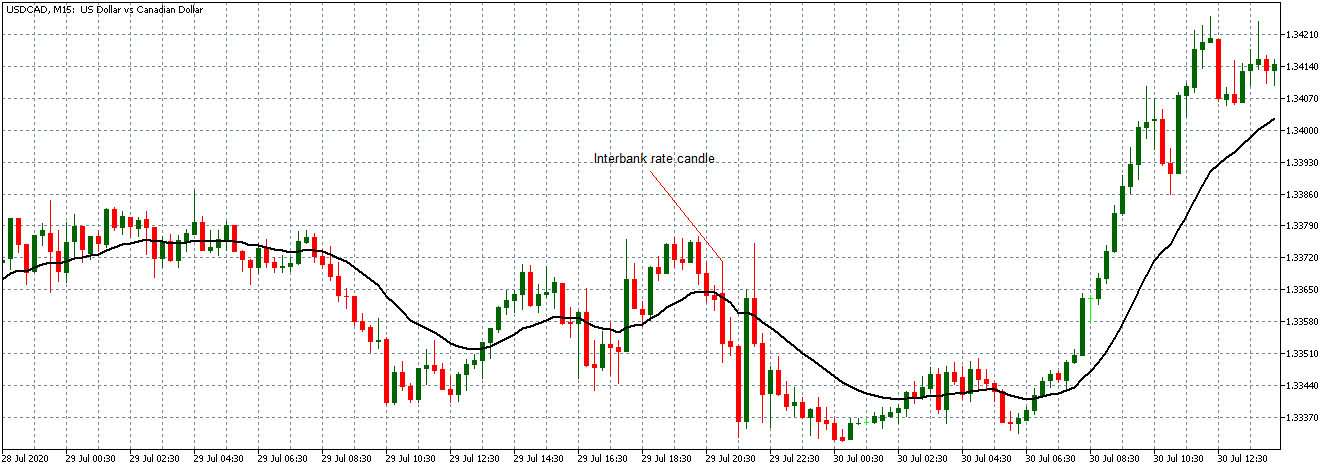
We are really glad to see people are starting to look at things in terms of percentage return and not pips when it comes to what we are able to achieve over a certain amount of time. Percentage return tells the tale pips probably not. We can hear every once in a while someone saying: “Oh, this robot gave me 350 pips a month, my trading signals generate this many pips every month”. This might be a very misleading number for a couple of reasons. One, we all know that pips have different amounts behind them which means we could make thousands of pips and on the plus side at the end of the year and still only hit 3 or 4 % of the return.

It doesn’t mean a lot. Two, if somebody is going to advertise a robot for example and say: “Hey, this thing made 10.000 pips in the month of November!” That could be true but what we didn’t know is that for example, the ATR of the pair we traded this week, the NZD/AUD was at 60 pips, the ATR for gold usually sits right around 1500 pips a day. It fluctuates up and down but on average that’s about where it sits. So to catch 10.000 pips for a month if we hit a really good trade it’s not impossible but it’s rather pretty improbable. But to tell something like this to an average forex trader might be super misleading.

People who are just getting into the forex world would probably believe anything you are willing to serve for them. Therefore percentage return could be that thing that we want to focus on. The percentage doesn’t lie, especially over a long period of time. The problem is that over a period of one year, for example, we are going to have up months and down months. That doesn’t suppose to be a huge problem. We all have those months, it is important to learn how to play the game. We are all aware of how the market is one crazy inconsistent beast. So to aim for any kind of monthly return might be a silly goal. We might drive ourselves absolutely insane because we are not going to get there consistently. Soon after we might end up frustrated and that emotion could easily lead us to take trades we should not be taken or we might go over leverage.

Traders, why we think trading the daily chart might be a good idea? Why we wait for our indicators to tell us to shoot? It’s because we have this awesome luxury of allowing the market to come to us. If it doesn’t come to us and there are no trades out there, we don’t have to take them. That is one of the biggest advantages that we have. So setting unrealistic profit targets for the month shouldn’t be the path we want to try walking along. A lot of traders and firms do things the wrong way. The traders are trading 15 hours a day on all sources of stimulus, getting very little sleep, and ending up with poor mental capacity because they have to hit these targets every day, every month. This could be short-sighted and pretty foolish because the market isn’t always on our side.

Not having something like patience could lead us to something like trying to have monthly profit targets which could potentially lead us to a lot of mistakes that we don’t want to be involved with. On the other hand, having patience allows us to do things the right way and at the end of 6 months period or even better 12 months period, we might be well-ahead of those people that were tearing their hair out trying to score their monthly profit target. If we want some real figures, if we want a real blueprint we might consider focusing on long-term results. We should never-ever force our trades, instead, we could try to give our systems a decent time of run and they might give us back a decent return. With a good money management structure, an ounce of discipline, and well-shaped trading psychology we could become unstoppable. Traders, think about that.

Categories
Forex Indicators

Which Indicator is Best for Trade Management and Risk Measurement?

Out of the thousands of indicators out there that technical forex traders add to their charts, there is one that is often overlooked. Sometimes even ignored. Indeed, though it is used relatively frequently, many traders often forget that it is part of their process. Yet, in reality, it is one of the most important indicators to have in your toolkit.

That indicator? It is, of course, the ATR.

What Is ATR?

Many of you will, of course, already know what ATR is and how it works as well as you know the back of your hand. It never hurts, however, to refresh that knowledge and take another look at it. Put as simply as possible, Average True Range is a measure of volatility. What it does is take a look at the last fourteen candles (it doesn’t have to be fourteen but that’s usually the default setting) and tells you how much movement there has been. This will be expressed in the number of pips the currency combination you have selected has moved, on average, over those last fourteen candles.

It’s a moving indicator so you need to take care when you’re measuring it and whether the most recent candle is throwing off the rating in some way. So, if you’re day trading, for example, it is best to wait to measure the ATR just as the candle you’re currently on is coming to a close. That way your measurement is of fourteen complete candles – which will give you the best reading.

And that’s it. It’s that simple.

But Why Is ATR So Important?

The thing is, ATR is simply not one of those glamorous indicators. Which is probably why it often goes so unnoticed. In fact, many traders don’t even have it up on their chart the whole time. But that doesn’t mean it isn’t a key part of their system. Perhaps even the most crucial one. That isn’t to say that it is the best indicator or some kind of silver bullet. But it needs to be part of your system because it provides you with two key pieces of information.

Firstly, by telling you how much a currency pair is moving over a given period, it can help you to make sense of your other indicators and tell you when to trade – or rather, when not to. For example, say a currency pair has already moved beyond its average range but your strategy is signaling that you should go long. Combining the ATR into your other indicators can help to show you whether what you’re dealing with is a breakout or whether it would be better to go short or simply not trade at all.

But, here’s the key thing. The ATR is not a silver bullet. No indicator on its own is. It must be just one part of your strategy and not the driving force behind it. You shouldn’t use the ATR on its own to decide whether you should pull the trigger on a trade or not. If you think any single indicator can do that, perhaps it’s time to duck out of trading altogether or, at the very least, get back to the classroom.

It is also useful to give yourself a little history lesson and use the ATR to explore how a currency pair has performed in the past under different circumstances. Crosscheck that with any significant news events you know about and it can provide a useful picture of the volatility of a currency combination – ultimately helping you to have a better understanding of what to expect.

Managing Risk

The second useful thing the ATR can give you – and according to some this should actually be its primary function – is that it can help you to manage how much you risk on a given trade. You should not make a single trade without consulting it. So, how does that work? Well, let’s say you’re doing everything right. You’re avoiding being drawn into trading with the herd. You’re ducking and diving and staying clear of the big players are – avoiding those hotspots where everyone else is trading. 0You’re using your system to identify when the optimal moment is to trade – getting all of your indicators to line up to make sure it’s the right moment and whether to go long or short.

Before you pull the trigger, you need to know how much to trade. And that’s where the ATR comes in. You need to factor it into the process you go through – make it part of your checklist – because in that sense it is probably the most useful indicator you have. It allows you to gauge risk in a measurable way so that you can improve how you manage your money and the amount that you invest per trade for any given currency pair. Now, the number one question here is how much money you put on a trade. But it doesn’t make sense to speak in terms of dollar amounts in this example. The ATR can’t tell you to put, say, USD 5,000 on a yen vs. pound trade. Neither does it make sense to talk in terms of lots, because a lot on the pound/dollar pair will be a different amount to a lot on another currency pair. Instead, it’s better to think of how much you are trading per pip.

To do that, compare the ATR for two currency pairs. For the sake of the example, let’s take a commonly traded pair like GBP/USD. Depending on what’s happening in the news cycle but assuming no dramatic news has been happening, this pair is likely to turn out a pretty low ATR. Perhaps something like 14 pips. If we compare that to the ATR of a more volatile pair, for example, GBP/AUD, here we might see an ATR of 115 pips. Some pairs will blow that out of the water and will easily generate ATRs of 200 or 300 pips regularly. And a lot of traders will look at that volatility and will steer clear of trading in those waters.

Sticking with the example of the dollar/pound and pound/Aussie dollar pairs, it doesn’t take a mathematical genius to look at the ATR and see that 115 pips is about eight times as many as 14 pips. That means the pound/Aussie is moving about eight times as fast as the dollar/pound. As we would expect given the respective volatilities of these pairs. So, armed with that knowledge, how do we trade it? It couldn’t be simpler. Let’s say that in this example you’re trading the dollar/pound at 16 dollars per pip. You can trade the pound/Aussie with full confidence, simply by trading it at eight times less. In short, when trading a faster currency pair, use the ATR to modify your per pip trading amounts to correspond to the increased volatility. In so doing, not only are you managing risk but you are also managing your overall approach to trading.

A Whole New World

Many, if not most, traders out there – particularly the less successful ones – start off by trading equal amounts per pip on different currency pairs, without taking into account the different speeds at which they move. This makes no sense. To all intents and purposes, by doing that they are saying that they have equal confidence in their trades across currency combinations of different volatilities. The danger that exposes them to could really take a chunk out of their account very quickly indeed if things go south. Traders who do that are taking on unnecessary risks because they are not mitigating the risk of greater volatility.

The ATR allows you to see that risk and modify your behaviour accordingly. It can be a tool for managing how much you trade per pip on a given pair and, consequently, it allows you to profile your trades for risk. This ability can introduce you to a whole new world of more exotic currency pairs because it enables you to broaden the spectrum of the pairs you trade. Placing the right amount of money per pip on a trade mitigates the risk of volatile pairs and means that you can add new currency combinations to your trading schedule without the fear of being towed under by fast-moving pairs.

In a Nutshell

The most important thing to take away from all of this is that managing risk and managing your money are the most important functions you have when you approach forex trading. If you can get these two right, you can separate yourself from the less successful or outright unsuccessful traders. It is the thing that will ultimately determine whether your forex trading career is going to result in more money in your bank account or less. And the primary tool you have at your disposal for mitigating risk and managing the money you invest in trades is the ATR. Even if you don’t have it on your actual chart – and many traders chose not to – you should still use it for every single trade you make.

Categories
Forex Psychology

Chicken Run – Fear of Missing Out On a Trade

Every forex trader will at some point have to face a particular set of fears that will sometimes mean they fail to pull the trigger on a trade. A lot of people talk about missing a trade as some significant moment in their trading activity. They look at the price movements of a currency pair and think it might go a certain way, they might even have an idea of the price it might reach, and they watch it and watch it and lo and behold it goes the way they thought but they didn’t enter a trade. They look at situations like that and hypothesize that they could have entered a trade at such and such a time and then if they had closed it at just the right time, they would have made x amount of profit. But the thing you have to realize is that while we all might fantasize about phantom trades like that from time to time, they are a non-event.

They are truly unimportant in the grand scheme of things because, in reality, nothing happened. You could spend your whole time dreaming up phantom trades like that. You could watch stocks and see potential trades you could have made, you could watch exotic currency pairs you’ve never traded before and see “opportunities” where you could potentially have made thousands, tens of thousands or hundreds of thousands of dollars on a single trade. It didn’t happen. It’s nothing for you to think about, much less worry about. You will miss trades like that literally while you’re sleeping. We all do. Let them go.

Mind Games

One particular reason you should let them go – apart from that way of thinking being completely useless to you – is that there are many more important psychological phenomena for you to worry about. When you ask them about forex trading, most people – and even plenty of traders – would probably tell you it’s all about understanding charts, learning tools and indicators from books, and understanding the theory. Indeed, it is all of those things. But it isn’t one of those processes where you can put in A and get out B every time.

We are, whether we like it or not, squishy ape-like animals that have evolved to be good at a lot of activities but being cold, unemotional machines is, unfortunately, not one of those things. As with anything else in life, our psychology is a big factor in how we perform. As a result, understanding your own psychological or emotional responses to different situations is a key step in being able to control them or curtail them when you need to and to stop them from inhibiting your efficacy. In fact, it often tends to be the traders who think of themselves as unemotional and unaffected by psychological ups and downs who turn out to be the ones who struggle most in certain situations.

Trading has a myriad of ways of drawing you into an emotional response – sometimes when you least expect it – so understanding those potential pitfalls and being aware of your emotional state enables you not only to learn about yourself but also to avoid making the same mistakes again and again. For example, you might be able to explain to a small child that it shouldn’t do something stupid, like touch the flame of a candle, but its only when it realizes it for itself that it will internalize that lesson.

Pulling the Trigger

The moment in a trader’s day that is most fraught with psychological turmoil is when they have to pull the trigger on a trade they’ve planned and for which they have a trade signal from the system they have built up. Not, as in the earlier example, when they think about a potential trade but make no moves towards it. For want of a better way of putting it, the really scary moment is when you have run the numbers, analyzed the price activity, found an entry point, established your target, zeroed in on your timeframe, and set up your stop/losses. Once you’ve run through your whole checklist and even gone as far as opening an order on your trading system, you’ve reached the moment of truth. Do you click the button?

Now, anyone who’s been trading for any significant amount of time will have, on occasion, been wracked by doubt and backed out at this point. Not to put too fine a point on it, they will have chickened out and missed their shot. The sheer tragedy of doing that can unfold very quickly if the price moves the way you expected it to and you watch what could have been a successful trade slip away. Quite apart from really bumming you out, a missed shot like that can have several other knock-on effects. It can slide itself into your subconscious mind and affect the way you think about future trades. Without knowing it, you might still be having lingering thoughts about that moment not just when you make your next trade, or your next couple of trades – it can persist well into your next month of trading, or even longer. The fear of missing an opportunity like that is no small thing and it really can cause issues for your future trading, which is why it is important to have some self-awareness about it and to try to understand what happened.

Being Your Own Shrink

So what are some of the psychological causes of chickening out? A side note here, if chickening out is a bit of a strong phrase and makes it a little harder for you to think clearly about the issue at hand, try thinking about it as failing to pull the trigger instead. One of the big causes, for most traders, is a fear of failure. You look at the trade you’re about to make and you just feel unsure about it. Of course, all your indicators might be screaming at you to trade right now but sometimes – and we all feel like this from time to time so it’s nothing to get too concerned about – sometimes it just doesn’t feel right for whatever reason. There are ways to overcome it and they are pretty fundamental to how you understand forex trading, so don’t worry, we’ll get to them.

In the meantime, another possible reason people don’t enter a trade, when they otherwise think they should, is over-analysis. This is a bit counter-intuitive since analyzing the technical parameters that lead to a trade is pretty much the bread and butter of most traders. That said, there is such a thing as overthinking it. Some of us love nothing more than to get deep into understanding what causes a given currency pair to move the way it does and, for the most part, that makes us stronger traders. But there’s a flip side to doing too much research because the deeper you get and the more information you try to include, the greater the likelihood that some of that information is going to start contradicting itself. Sometimes you’ll have filled your head with so much reading about news events and looked at so many indicators that some of that begins to cause you to doubt yourself. And not only will you begin to doubt yourself, but you will also – just through the sheer act of spending so much time thinking and analyzing one trade – become too invested in it emotionally.
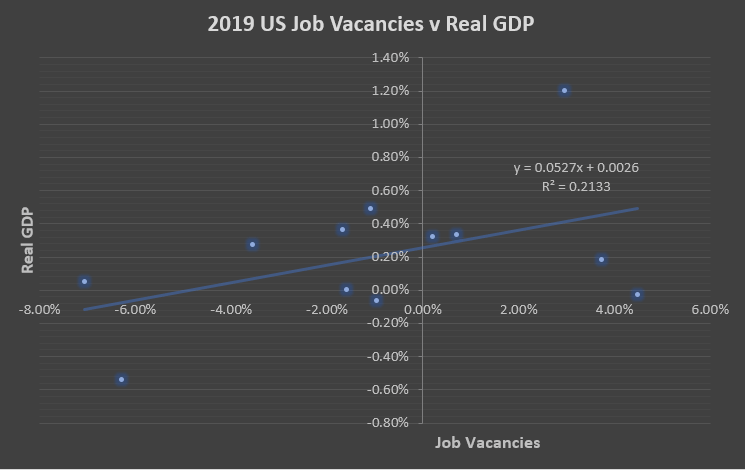
Yet another form of this is becoming unsure about your analysis in the first place. On one hand, this can lead you to try to overanalyze but also it can simply introduce doubt and put pressure on yourself. Of course, this is one of the most natural responses of any trader. In fact, it’s the traders who tell you they’re 100% sure about the outcome of a trade that you should worry about. Put simply, until you get that crystal ball working, you will never know the outcome of any trade. That inability to see the future reduces every trade to a binary outcome. It will either go your way or it won’t. Little wonder then that this is a cause of stress. But this over-focus on the individual trade is what’s holding you back and therein lies the crux of the problem.

Fighting Back

The single most important thing to understand when trying to overcome all of these hurdles is how you approach individual trades and forex trading as a craft.
If you are focusing on and sweating over each individual trade, you’re doing it wrong. The only way to trade forex and be successful at it, rather than burn out quickly or fade over time, is to establish a system and a process. When you understand trades as part of a process, rather than as individual events on who’s success everything depends, you will free yourself of many of these fears. Once you begin to see trading as something that takes place over the long term, you will become a better trader. And once you have a system in place that means you are going to be right more often than you’re wrong, that you make more money than you lose, you will cease to rely on individual trades for your sense of wellbeing.

Approach each trade afresh. Free it of any losses that came before and understand it as one of the dozens, if not hundreds, of trades you are going to make over the coming year. Judge your success not on the outcome of individual trades but on sets of trades over a longer timeframe. Of course, there are some simple, practical solutions to certain issues too. If you are suffering from a crippling fear of failure over individual trades, you are likely committing too much to each trade. It might be time to reconsider your position size and work on your money management. If you are so unsure of your analysis you regularly find yourself failing to pull the trigger on trades your system is flagging up, you might need to go back to the drawing board.

Indeed, better than that, take your system for a spin on the testing circuit. Put the work in and power up a trading simulator or your demo account and test your system, your process, your checklists, and your whole approach. The great news is that thanks to technology, you can now do this more easily than ever. Assess how your system performs over a significant period – say a hundred trades. This will not only give you a greater sense of security but will also help you to see trades not as one-off events but as part of a process. A larger set of trades will really show you whether your system is working in a way that a single trade never can. Having substantiated confidence in the system you are working with is an enormously important aspect of trading that can help you overcome the smaller, short-term psychological hiccups.

Finally, once you have fully internalized the fact that trading is a process and have gained confidence in your system, you will be ready to overcome even the most dreaded of events for any trader: a losing streak. Psychologically this can be tricky even for the most experienced of traders. But the plain fact of the matter is that the more you trade the greater the statistical chance that you will encounter, through no fault of your own, a run of bad trades. The most dangerous thing you can do is start to mess with a strategy you have taken a long time to establish on the back of three or four losses. It’s a trap many fall into. The good news is that if you have managed to free yourself from over-focusing on single trades and if you have confidence in your system, you are perfectly placed to be able to see every new trade as a fresh start.

Categories
Forex Fundamental Analysis

What Should You Know About ‘Job Vacancies’ as a Macro Economic Indicator

Introduction

Job vacancies are a fundamental macroeconomic indicator. This article defines in detail what job vacancies are and further shows how the job vacancies affect the economy of a given country, and consequently, its currency.

What are Job Vacancies

Job vacancies are the number of new gainful employment positions that are created within an economy at a given point in time. In order to establish the number of job vacancies, surveys are usually done on employers about their businesses, recruitment, and job openings.

Job vacancies are considered if: there is a specific open position with work available for it; the job could commence within 30 days of advertisement whether or not a suitable candidate is hired, and the employers are actively recruiting workers for that particular job.

Purpose of Job Vacancies Statistics

The job vacancies statistics are meant to provide information about the level and structure of labor demand. The job vacancies statistics indicate the unfulfilled demand for labor and the desirable skills that are sought by the employers within an economy. As such, the job vacancies statistics provide the central banks and governments with an opportunity to analyze the trends in the labor market. The statistics can also be used to assess the structural analysis of the economy in terms of business cycles.

Job Vacancies as an Economic Indicator

Employers within an economy are continually looking to hire new workers to fill positions in their organizations. As such, job vacancies are a leading macroeconomic indicator of unemployment and employment rates. Thus, the more the job vacancies are available, the more the number of people who stand a chance to be gainfully employed and thus, leading to a reduction in the unemployment rate.

Conversely, fewer job vacancies imply that fewer people seeking employment get to be gainfully employed hence low employment rate in the economy. Thus, higher job vacancies signify an expanding economy while a reduction in the job vacancies implies that the economy is contracting or heading for a full-employment level. In this case, higher job vacancies result in appreciating the strength of a country’s currency while lower than expected job vacancies result in a drop in the currency value.

The statistics on job vacancies can also be used in the analysis of business cycles. The number of job vacancies is expected to be on a constant increase during periods of expansion because businesses are hiring more workers due to increased economic activities. At peak periods, the number of job vacancies is marginally decreased and remain plateaued since most businesses have achieved optimal operations. During the periods of contraction, the number of job vacancies is expected to be on a constant decrease due to a rapid reduction in the economic activity within a country, hence lower GDP output.

Thus, the statistics on job vacancies can be accurately used to predict the periods of economic boom and recessions. During the global economic crisis, the number of job vacancies in the US decreased from 4.4 mn in the 1st quarter of 2008 to 2.45 million in the fourth quarter of 2019, a period of recession. In the recovery period, the number of job vacancies increased from 2.72 million in the first quarter of 2010 to 4.92 million in the fourth quarter of 2014.

How Job Vacancies Affect the Economy

By itself, job vacancies signify the level of economic activity within an economy. A higher and increasing number of job vacancies signify that the economic activities within a country are increasing hence the need for more workers. Similarly, a constant reduction in the number of job vacancies available implies that the economic activities in a country are cooling down, hence the need for fewer workers. More so, a reduction or plateauing in the number of job vacancies available could imply that the economy is heading for full employment.

Graph: 2019 January to December Scatter plot of US Job Vacancies and Real GDP.

Source: OECD Statistics and US BEA

As seen from the above scatter plot, from January 2019 to December 2019, there was a direct positive correlation between the change in the job vacancies in the US and the change in real GDP.

Job Vacancies and Impact on the Currency

As already discussed, job vacancies serve as a leading indicator for employment and unemployment levels. An increasing number of job vacancies implies that unemployment levels are bound to fall drastically. A steep fall in the unemployment rate, which is accompanied by a full rate of employment will result in higher inflation. The higher inflation is because the employers are competing to hire workers hence pushing up the wages at a faster rate. Increased rates of inflation will trigger the government and central banks to employ contractionary monetary policies aimed at keeping the inflation rate in check.
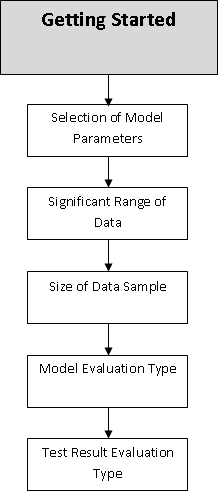
When the central banks increase the interest rate, it is aimed at reducing the rate of inflation by making borrowing expensive while encouraging the culture of savings. Thus, for forex market traders, they can anticipate a hike in the interest rate levels when there is a consistent increase in the number of job vacancies. The higher interest rate has the effect of increasing a country’s currency valuation.

Conversely, a constant reduction in the number of job vacancies, which comes after a period of a sustained increase in the total number of job vacancies, implies that an overheated economy is cooling down. An overheated economy is characterized by a prolonged period of positive economic development and higher levels of inflation brought about by increased wealth generation.

Thus, after the government has employed contractionary policies following the overheating of an economy, it can consequently be expected that this period will be accompanied by asset bubbles and an increase in the prices of assets. Higher wages means that most employers may not be able to hire more workers and let go of some of the existing employees, resulting in a sustained period of lower job vacancies.

The economy can be said to have plateaued and headed for a recession. For forex traders, a falling number of job vacancies could signify an impending dovish monetary policy meant to stimulate the economy and prevent excessive deflation. The dovish policies have a negative effect on a country’s currency.

How Job Vacancies News Release Affects The Price Charts

Although considered a low impact indicator, forex traders need to understand how job vacancies release impacts the price action. In the US, the job vacancies report is published by the Bureau of Labor Statistics by conducting Job Openings and Labor Turnover Survey (JOLTS).

JOLTS gives data on job openings, hires, and separations. The JOLTS report is released monthly about 40 days after the month ends. The latest, expected, and all historical figures are published on the Forex Factory website. The most recent release one can be found here. Job vacancies are advertised positions yet to be filled by the final business day of the month. A more in-depth review of the JOLTS numbers can be found at the Bureau of Labor Statistics website.

Below is a screengrab of the Forex Factory website. On the right, we can see a legend that indicates the level of impact the Fundamental Indicator has on the corresponding currency.

The snapshot below shows the change in the JOLTS numbers. In the latest release, the number of job openings increased on a month on month between May and June 2020 from 5.37 million to 5.89 million. The increase was more than the 5.30 million forecasted by analysts.

Now, let’s understand how this news release impacted the Forex price charts.

EUR/USD: Before JOLTS release August 10, 2020

As seen on the chart above, we have plotted a 20-period moving average on the EUR/USD chart, which shows that the pair is on a strong downtrend. The steady downtrend is also evident from the fact that the candlesticks are just below the Moving Average. On the 15 minute timeframe before the release, between 1100 and 1330 GMT, the market is on a constant uptrend. This uptrend can also be observed in AUD/USD and NZD/USD pairs, as shown by the charts below.

AUD/USD: Before JOLTS release August 10, 2020

NZD/USD: Before JOLTS release August 10, 2020

It is evident that in such a period, going “long” in the market offers the best opportunity to take advantage of this short-term uptrend. However, since the general market trend is downward, we highly recommend following this trend.

EUR/USD: After JOLTS release August 10, 2020, 1400 GMT

After the release of the better than expected JOLTS numbers, there is a consistent downtrend on the EUR/USD. The mere increase in the number of job openings triggered the USD strength against other currency pairs. It is worth noting that the release of the JOLTS numbers was strong enough to reverse the immediate uptrend seen immediately before the release.

The same reversal to a downtrend after news release can be observed for the AUD/USD and NZD/USD pairs as well. This trend is shown in the charts below.

AUD/USD: After JOLTS release August 10, 2020, 1400 GMT

NZD/USD: After JOLTS release August 10, 2020, 1400 GMT

The positive job vacancies news had a significant impact on the strength of USD against other currencies. This strength is because the better than expected job openings signify that the US economy is on a recovery path following the effects of the Coronavirus pandemic.

Categories
Forex Risk Management

Why Scaling in Might Be a Bad Idea

If you are already in a winning trade, is there anything else you can do to father navigate its course to your benefit? One of the best techniques in position management used by trading professionals, scaling out, is based on the idea that a trader should withdraw part or half of the money at a particular moment in a winning trade, move the stop loss to break-even, and keep the remainder running until the point when either the trailing stop, exit indicator, or stop loss finally closes the trade. However, what would you do if you faced retracements while going long for example and the price changed direction? Would you put more money in although you are already in the middle of a trade? The answers to all of these questions are closely related to another term – scaling in that, in contrast to scaling out, essentially entails adding another position to an already existing trade. The understanding of this topic is what will help safeguard your trades against some common challenges as well as guide you through a running trade.

If a current trade is doing well and approximately a hundred pips later a retracement occurs, is a trader advised to double down? This question is equally applicable to trades that really take off because it essentially involves doubt about whether anyone should take on more risk. Although the trade in this case is a fruitful one, is investing more money a good or a bad idea? The expert opinion generally advises against entering an additional trade after you are officially in another one. Although some traders may disagree, the facts supporting this standpoint are numerous.

Firstly, if you have developed a system, or working towards designing an algorithm, you probably understand how crucial entering a trade at the best possible time is. A trade that exhibits an unstable and unpredictable behavior 20 or so pips down the line is certainly not the one you should ponder. Traders often feel compelled to make irrational decisions because of the fear of missing out (FOMO). Entering a FOMO trade, however, reveals the psychology of traders who take actions based on emotions, rather than trusting the systems they have worked hard to develop. Such emotion-driven trades inevitably lead to numerous and often repetitive losses, which is the exact opposite of what you need to grow a forex trading account.

As we cannot assume which direction the market is going to take and for how long, we strive to create algorithms on which we can rely. Moreover, since we test out each indicator we use, there should be no fear of trusting a system which has proved to give good results more often than not. Even if you notice some mild changes a while after you entered a new trade, simply allow the system that you built to take care of the trade for you. Therefore, there seems little to no reason why anyone should consider adding on. If such a decision revolves around fear or greed, the prospects of getting far in this market are very low. A trade that appears to be bad right from the start will never render any good results and risking more money at this point would seem like a truly reckless decision leading to a gloomy outcome. Furthermore, with the option of choosing between so many currencies, opting for a pair that cannot bring about any positive results also cannot have a logical explanation.

If you are in a winning trade going long, how would you react if you got another signal from your system? Should you trust your confirmation indicator and take action accordingly? A confirmation indicator signaling you to long is actually telling you that it first went the other way. For example, a zero-cross indicator would give out a signal to go long (above zero) only if it crossed the zero line and went below first. Of course, if this happened, why would you stay in such a trade? As this confirmation indicator told you to short, you actually received a signal to exit (see picture examples below). Although this is not the best option you can find, confirmation indicator can definitely serve as an exit indicator as well, and especially if it is giving you a clear sign to exit, it is in your best interest to recognize it and act upon it. Therefore, no matter how successful a particular trade is, following a signal blindly, without proper interpretation, leads to nothing but failure.

Above, we see two long signals suggesting that we add on in the areas above while, in between, we get another short signal.

Consequently, whether you are adding onto a losing or a winning trade, the result is almost always the same. Instead of being impatient and hungry for money and success, strive to create a sustainable system that will safely operate in the back so you can let go of all the stress. As an alternative to trading fueled by emotions, learn how to base your trade on the system you have invested in creating. What is more, learn to interpret and trust your indicators because their purpose is to protect you and get in and out of trades in the most optimal point of time. As opposed to scaling out, which should become part of all traders’ plans, scaling in is an unwise strategy that leads to loss more often than not.

If you want to earn a profit continuously, you should strive to support yourself with tools that can grant you that. The idea of amassing a fortune overnight, though, will impact your trading and ability to learn and prosper. Leveraging up by adding on to a winning trade only equals more risk that will most probably get your account in a position from which you will hardly be able to get out. Not only is it a risky maneuver, but it also appears not to be a very smart one. If you have a goal you want to reach, you will accept time and effort as two preconditions to fulfilling your dreams. As it appears, there is little room, and certainly little hope, for quick solutions and related mentality.

Categories
Forex Price Action

Trend Line Trading: Establishment and Choosing the Chart Timeframe

In today’s lesson, we are going to learn how a trend line is established and how to choose the chart to trigger entry as far as trend line trading is concerned. Traders at the beginning often are carried away and select a wrong chart to trade with a trend line. The point is, we must choose the right time frame to make the best use of a trend line. Let us now find out how we can do that.

It is a daily chart. The chart shows that the price after making a bullish correction heads towards the South and makes new lower lows. We see four significant swing highs from where the price makes four swing low. If you are a trendline trader, you know from where you have to keep an eye on this chart, don’t you? Then again, let us explore it.

The price produces a spinning top followed by a bearish engulfing candle. It makes a bullish correction and finds its resistance at point B. The price makes a breakout at the last swing low and heads towards the South further. By joining two swing highs, we can draw a down-trending trend line.

The chart shows that the price is down-trending by obeying the drawn trend line with the first two points. Concentrate on the point C. This is where traders keep their eyes to get a bearish reversal candle to go short in the pair. The chart shows that the price produces an inverted hammer. The trend line sellers may go short below the last candle’s lowest low.

As expected, the price heads towards the South with good bearish momentum. The chart produces two consecutive bearish candles. Moreover, the chart makes a new lower low as well. This means the game is not over yet for the trend line sellers. They may wait to go short again from the resistance of the trendline upon getting a bearish reversal candle.

The chart produces a bearish inside bar. The sellers may go short again below the last candle’s lowest low. It seems that the sellers are having a feast here. This is the beauty of trend line trading.

The sellers again make a handful of pips. In fact, the price makes a breakout again at the last swing low. They may wait for the price to go towards the trendline and produce a bearish reversal candle at point E to go short again. Now, let’s flip over to the H4 chart and find out how it looks.

The chart shows that the price is down trending. However, it is tough to find out the signal candle. We get more than one bearish reversal candle at point B and C. At point D, it is extremely confusing were to trigger an entry. With the Daily chart, it is very explicit, though. To be able to choose the right chart that obeys a trend line, we may always concentrate on point B (2nd point) and calculate with which chart it responds more. We then keep our eyes on that particular chart to be able to take entry with precision.


Categories
Forex Fibonacci

How Not to Use Fibonacci

It may be an incredibly popular tool but not all forex traders are big fans of using Fibonacci, we’re here to take a look at why this might be the case.

What Are We Talking About Here?

This is no guide to using Fibonacci sequences in trading instead, it’s more a look at why some traders turn their noses up to this approach. That said, it doesn’t hurt to have a quick glance at how traders use this tool. Fibonacci numbers form sequences, inventively known as Fibonacci sequences, which are in turn closely related to the golden ratio. This is a phenomenon in mathematics that has been discovered throughout nature and statistical analysis and eventually made its way into different kinds of trading, including forex trading.

The most common use of Fibonacci in forex trading is to use Fibonacci retracement levels to throw up potential support and resistance lines across your chart that show places where the price might bounce back into a reversal. Put simply, the idea is to use these lines to assess where to enter a trade. In its most basic form, when the price is trending, it should retrace its steps occasionally to bounce off a Fibonacci level before it continues its trend and this is supposed to indicate an entry point.

So, What’s the Problem?

As you might have guessed, the growing anti-Fibonacci movement highlights several different problems with this approach.

The first of these is its abstraction. In other words, it is completely divorced from the realities of the market and relies entirely on an abstract pattern to try to locate trade entry points. There is no reason, the naysayers will tell you, why a mathematical sequence that has thrown up patterns in nature would have an effect or even any value for predicting the price movements of a currency pair. And, indeed, prediction is the name of the game here. Because using Fibonacci retracement levels is an attempt to predict future price movements. This is important and we’ll come back to it later in the article.

People who dismiss and reject the applicability of Fibonacci levels are likely to cite other reasons for price movement, including news events, the movements of the herd (that is the activities of the mass of traders who are often to be found trying to do the same thing at the same time), the sometimes pernicious activity of the influential players in the market, and so on. Of course, this has some weight behind – ultimately, there is no real connection between Fibonacci sequences and the movements of the market – the only connection is that Fibonacci levels and other similar approaches are supposed to guide you in analysing large statistical data sets. The price interactions of currency pairs as determined by the market are said to be such a set.

20/20 Hindsight

But there’s a problem inherent in that. This problem becomes particularly apparent when you take Fibonacci levels for a joyride through a historical chart. Choose any currency pair you like and take a look back through its price movements over a long period. Now try to find those times where Fibonacci levels would have been really useful in providing trade signals. The first thing you’ll notice is that the price regularly – and we mean regularly – just blows straight through any Fibonacci levels you care to put up. This is a problem for using it as an indicator of anything really. An indicator that doesn’t work some of the time is one thing, but one that hardly ever works is much more problematic for a trader.

More importantly than that, those times when it does appear to have worked, where the price is trending but then backtracks before bouncing off a Fibonacci line. Those times are, of course, going to be rare. But it’s not just their rarity that is problematic. It’s also the fact that they are often only noticeable when viewed retrospectively like this. In the heat of the moment, before the candles complete, it is much harder to spot a pattern emerging that could be predicted by a Fibonacci retracement. And prediction is important because that’s what this is all about. Using Fibonacci or any other tool in forex trading that fails to reliably predict where the price is going to be in the future is ultimately not just frustrating but also potentially very financially harmful. It’s just no good if somebody comes along and points out that the price of a given currency pair bounced off a Fibonacci line in the past. That’s old news and it’s no good to you. Remember, you have to make a decision while a Fibonacci-like pattern is still emerging… Or not, as the case may be.

Where Do You Draw the Line?

Another problem with using Fibonacci levels to trade is that there is no clear way of knowing when to stop using them. That is, when do Fibonacci lines stop being valid? Are you using the levels that are only relevant to the most recent swings (either high or low) or do you incorporate lines from further back? If so, how far back can you go before the lines you drew where the price simply crashed through them are no longer relevant? Or should you try to keep it as simple as possible and reduce the Fibonacci lines across your chart only to the most relevant?

The problem is, there are too many questions and too much of a danger of cluttering your chart with a haystack worth of meaningless lines. Because, if you draw enough lines across a chart, the price will definitely bounce off some of them somewhere but they will also lose all meaning. This fuzziness bothers a lot of traders and they will claim that it is for this reason that their opposite numbers – the traders who are committed to using Fibonacci – are constantly having to adapt their approach. The argument is that they have to keep modifying their approach because, at the end of the day, the Fibonacci levels lack clarity to the point that it becomes impossible to know whether they are working or whether they just look like they might be working.

A Little Success…

So why are Fibonacci levels even as popular as they are? Certainly one of the reasons lies in the forex traders’ version of that old saying, “a little knowledge is a dangerous thing” – for forex traders a little success is a deadly thing. Traders often start out by trying to use Fibonacci retracements because they’ve heard so many good things and, if they’re lucky, they might even see some early success in using them. The problem comes further down the road. Because, in the long term, using Fibonacci levels will slowly work less and less well, using them will mean an over-focus on one (potentially very flawed) tool while other tools and opportunities are missed. That early smell of success can be a powerful drug and draws traders into establishing patterns of behaviour that are ultimately harmful.

The Curse of Popularity

Of course, it isn’t always someone’s fault if they do give Fibonacci levels a go. The reason they might is that so many people out there on the forex internet are talking about them. Social media is particularly prone to promoting Fibonacci as though it’s the best thing since sliced bread. And there’s a reason for that, which is that posters can come off sounding very smart and knowledgeable indeed if they point out where price is approaching a Fibonacci level. Much rarer, to the point of being non-existent, are accounts that will come back and post an apology, where they say, “Hey, sorry, I said the price was approaching this and this line but it just crashed through as though the line wasn’t there.” Another thing you’ll almost certainly have noticed from forex-related social media accounts is that they will often point out where a Fibonacci retracement has taken place in the past. Unfortunately, this is of no use to anyone actually trying to trade like that because, once it’s happened there’s nothing to do other than appreciate its beauty – if you’re into that sort of thing. No actual use can be gleaned from pointing out historical occasions where a retracement has worked.

How to Proceed?

Whether or not you found the arguments in this article convincing is kind of irrelevant. The thing to do with any tool you encounter – whether it’s a popular one that everyone is shouting about from the rooftops or a niche tool you discovered through hard graft – is to test it yourself thoroughly. This is as true of Fibonacci retracements as it is for anything else. In that sense, it might also be useful or fun for you to wait until somebody on social media posts one of those cherry-picked examples of a Fibonacci retracement coming off perfectly and then go back and see if you can figure out what levels they were using.
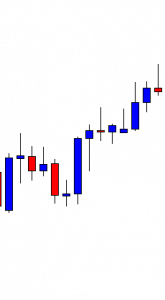
If you do remain unconvinced and intend to carry on using Fibonacci approaches to trading, there is one other very important thing to be aware of. Those traders who have committed to this discipline and have made it work to one extent or another have done so by combining Fibonacci with a carefully selected set of other technical analysis tools. So, if you do plan to use Fibonacci retracements, make sure that you are ready to do so in a coordinated approach that also relies on other indicators and tools to help you assess whether your Fibonacci-based hunch is really likely to turn into the price movement you were hoping for.

Categories
Forex Fundamental Analysis

Flash Crash Precautions for Technical Traders

After the recent publication of a book called Flash Crash, the concept of the same name once again stirred the attention of traders across different markets. This controversial literary record of Navinder Singh Sarao’s very public 2015 arrest after having previously amassed staggering $70 million buying and selling futures from his London home points to the existence of fragilities in markets. As opposed to regular pricing fluctuations, a flash crash entails an extremely volatile and sudden plunge of the pricing of a security traded on the open market before quickly recovering. With more and more instances of such swift declines, we can see the aftermath of these dramatic volatilities in the markets of stocks, futures, currencies, and cryptocurrencies as well. Whether it results from programming code errors, specifically designed algorithms, and fraudulent behavior, or some other drivers, flash crash plays an important role in assessing risk levels for traders worldwide.

The currency market underwent a major flash crash on January 3, 2019, which took place on the AUD/JPY pair. Since these two currencies are some of the world’s most important exchange rates, their 2019 dynamic was so unbelievable that it drew the attention of the media and traders across the world. With AUD becoming very weak and JPY gaining strength, the currency pair fell the unbelievable 7% in a matter of three minutes. Considering the fact that that the prices plummeting to this extent is exceptionally rare even in a week’s time, one could naturally assume that some major crisis, such as bombing or death of a president, was responsible for such violent move in the currency market. As a flash crash is rather believed to be a deliberate act of market attack to obtain profit instantaneously, the previous assumption falls short.

Some sources discussed how extensive the damage of these volatile activities in an illiquid market had on the Australian economy. With China being on holiday during the week of the event and the U.S. market closing, a drop in liquidity occurred. One of the biggest American companies, Apple, expressed concern regarding the impact which the slowdown in China could have on its fourth-quarter revenues, immediately shifting investors’ focus on the havoc these circumstances could wreak on the global economy. Along with several currency levels being extremely low against the yen at the time came burning questions concerning market liquidity, algorithms, and overall market functioning, which reasonably caused deep concern among traders around the globe and not only in the currency market but other markets as well.
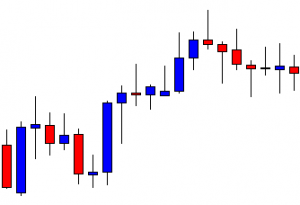
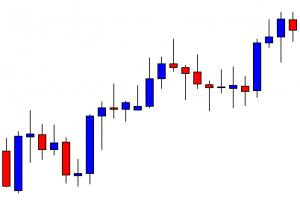
Despite the media frenzy over the global economy, some sources pointed out that liquidity had little effect on anything but the currency market. In fact, the images below portray some major discrepancies between the evidently severe states of the AUD/JPY pair and the stock market performance during the 2019 flash crash. The proportion of these differences then aroused curiosity about the reasons why the prices rebounded immediately after the decline. Some financial reports on this event reflect on the stability AUD/JPY enjoyed over the course of 2018, which may point to the possibility of some major banks and/or institutions getting involved. Interestingly enough, right about the time of the 2019 flash crash, 89% of AUD/JPY traders were going long. As this was a virtually unforeseen ratio of 9:1, it was almost a perfect opportunity for big banks to step in do what they always do – redirect the prices and cream off the profit. Even if the Japanese government decided to move JPY up or down, this process would happen gradually, as opposed to what the currency market witnessed in 2019.

As the AUD/JPY pair closed down approximately 83 pips on the day of the event only to bounce right back up to the levels at the end of 2018, we need to draw some deeper lessons. We can attribute the magnitude of this catastrophe to the media and the big banks, but essentially if you do not analyze risk, timing, and strategy, among others, you are inevitably putting yourself in much greater risk. Most traders whose accounts were completely destroyed as a result of the 2019 AUD/JPY volatility, drowned themselves with emotion-based trading, greedily going after a bounce. Although the 2019 currency market flash crash was not the first occurrence of this phenomenon, the individuals practicing the indicator-heavy approach to trading, especially the ones beginning to build their accounts, experienced a shock as well. Those traders who managed to get out understood how relevant technical analyses and understanding indicators are for surviving the market’s instability.

Brexit and the 2015 EUR/CHF crash both exemplify how such events can influence the creation of a really large candle closing at an entirely different point from where it started. The 2019 flash crash too revealed some unusual facts, where the open and close on the AUD/JPY currency pair were only 83 pips apart, yet with a noticeable high and low. While most indicators typically focus solely on the open and close, ignoring additional information regarding the highs and lows, ATR would be the only tool that could give out relevant signals. At such times, ATR would read much higher than usual, and as flash crashes rarely happen, you would know that the information you were getting was telling you to take a certain action. In case you are using a volume indicator, some of the more average versions might be able to catch the highs and the lows, in contrast to the better versions whose quality stems from its ability to filter out any such activity.

Whether you are using the ATR alone or together with the volume indicator, you should consider the settings which tell how the indicators are measuring data. For example, with the ATR, the settings typically indicate the number 14, which stands for 14 candles, which for daily traders implies that the data is recorded 14 trading days back. Due to the impact of events such as the flash crash, you will not be able to get an accurate reading for another two weeks. Nonetheless, despite the equation being susceptible to these sudden changes, you can still proceed with the trading on the affected currency pair if you take the reading from the day before the event took place. Therefore, in the following 14 days, you will not be including the indicator’s reading, but relying on the one fixed number you found on that particular day.

Even though events such as Brexit and the 2015 EUR/CHF crash are not very common, they still occur every few years, which is why every trader should know how to prepare for the unexpected. As we explained above, the out-of-the-ordinary candle created at those times will inevitably affect your indicators, regardless of how well-devised an algorithm you use. Whichever currency pair undergoes these massive influences, your only task is to stay put and refrain from taking any action. If any currency was under impact because of some external factors, such as GBP after Brexit in 2016, you would not be trading that currency until all indicators went back to normal. What this further implies is that you may need to check the settings to see how far back your indicator is going to record data and patiently sit out for that period of time. Moreover, any attempt to adjust and set up your indicators will prove to be until those big candles are filtered out of the system. Luckily enough, there are approximately seven other major currencies you can trade and keep your account active.

Apart from the 2019’s flash crash, we can trace several other such events happening in the past few years: ETH in 2017, GBP in 2016, and Singapore Exchange in 2013. Although they do not occur very often, once they do, though, no market is exempt from such an unexpected price plunge and rebound. What is so volatile about flash crashes is that, despite what sets them off, they deeply and profoundly affect the market. We may not have enough insight into the intentions of the major players, but we must take into consideration the amount of impact they can have on the direction of prices and the overall market conditions. Nevertheless, regardless of the current climate, every trader now knows the two strategies they can use at such times. If you are a trader of currencies, you will either rely on the data recorded one day before such an event to proceed with a trade on the affected currency or decide to sit out until further notice. Whatever you do decide, however, do not let yourself run after some transient highs searching for some instant gratification.

Categories
Forex Fundamental Analysis

Everything About ‘Social Security Rate’ – An Important Fundamental Forex Driver

Introduction

During the recent Coronavirus pandemic, the whole debate about social security has taken CenterStage. At a point in life, we all grow old. Since not everyone will go through life-saving for retirement, our main worry then would be; how to pay bills on time, how to provide for our families should we lose out jobs or become incapable of working.

Social security attempts to anticipate all this and offer practical solutions. So why should forex traders care about the social security rate? This article seeks to understand what impact of social security rate has on a country’s currency. To establish this, we first need to understand what it is and what it entails.

What is Social Security?

Social security has been given several definitions. In the UK, it is considered to be any form of monetary assistance from the government towards individuals who have inadequate or no income. In the US, social security is a federal program that is meant to provide retirees, the poor and the disabled with income and health insurance.

Thus, social security is the guarantee that a government gives to its vulnerable citizens that in the event they are exposed to a specific future risk, they will be looked after. The social security program, therefore, uses public resources to provide economic support for private citizens.

What is Social Security Rate?

This rate is the percentage of earnings that is charged on both the workers and their employers. It is used to fund the social security program.

How it is Calculated

Various countries have different mechanisms of arriving at the social security rate for both the employed and self-employed.

In the US, the social security rate is 15.3%. It is a combination of a 12.4% social security tax and Medicare tax of 2.9%. In 2020, the 12.4% social security tax is applied on everyone for all income up to $137,700; any amount earned beyond this threshold is exempt from the social security tax. The social security tax is deducted on an individual’s payroll through payroll withholding by the employer. This rate is split in half between the employee and the employer.

Therefore, an individual contributes 6.2% for social security and 1.45% of their earnings while the employer matches the other half. The employer then remits the withheld amount together with their contribution to the IRS. For those that are self-employed, since they are the employee and the employer at the same time, they have to pay both halves of the social security tax. In the UK, the social security rate is 14%. A comprehensive list of current and previous social security rates for every country can be found on the Trading Economics website.

Purpose of the Social Security

Conventional taxes are meant to be a revenue source for government expenditure or meant to be punitive. The social security tax is meant to a safety net for the contributors should they fall on hard times. It also functions as an economic guarantee for the most vulnerable in society. The chart below shows the dependency on social security benefits by various household income class in the US.

Source: AARP

Some of the benefits of the social security program include:

Retirement benefits

This offers workers and their dependents a replacement income for when they choose to retire. The earliest retirement age is 62 years. For one to be eligible for retirement benefits, they need to have worked for a minimum stipulated period. This period differs depending on the country. In the US, it is for ten years. The amount of money received largely depends on one’s lifetime earnings and the cost of living.

Disability benefits

Also known as disability insurance, the Social Security and Supplemental Security Income disability is meant to provide an income for the disabled. For one to be eligible, they need to have worked for a minimum number of years, depending on the age when the disability occurred.

Medical cover

This is the health insurance coverage that covers part of medical bills for ageing workers, people with permanent health conditions and those with disability.

Survivors benefits

This is meant to help those who are bereaved to cope

Social Security Rate and the Economy

The social security program differs in every country. However, in every economy, such programs are meant to provide stability to the households by providing a replacement stream of income, hence avoiding poverty. In the US alone, close to 56 million people are recipients of social security benefits.

Source: International Labour Organization

As shown in the chart above, higher expenditure in terms of social security corresponds to a higher GDP per capita. While some might argue that a higher social security rate reduces the amount of disposable income, the multiplier effect generated by the resultant social security benefits outweighs any short term loss.

It is worth noting that the families and individual who receive these benefits use the income to purchase goods and services. In 2019, it was estimated that the social security program injected over $1 trillion into the economy. Therefore, the presence of social security helps to maintain demand in the economy in times of crises and some cases, increase the demand.

The benefits of the social security program have a powerful multiplier effect within the economy. The businesses that receive this income from the consumers use it to increase production and hire more employees. These expansions, in turn, generate more revenue for the government to use in national expenditure while the earnings by the employees serve to create more consumption and increased savings.

How Social Security Rate Impacts Currency

As we have already established above, a higher social security rate creates a multiplier effect that generates more revenue within the economy. The strength of a country’s currency is a reflection of its economy. The growth in the national economy, therefore, corresponds to the appreciation in the value of the currency.

Conversely, lowering the social security rate will reduce the multiplier effect within the economy, which leads to shrinking of the national economic growth. For forex traders, lowering the social security rate could be a foreboding of a looming reduction in the national GDP growth, prompting expansionary monetary and fiscal policies. Therefore, in the long run, a low social security rate leads to the weakening of a country’s currency against other pairs.

How Social Security Rate News Release Affects The Forex Price Charts

Forex traders rarely pay any attention to the release of the new social security rates. This inattentiveness is because as an economic indicator, the social security rate is a low impact indicator. However, it is essential nonetheless to know how the news release of the social security rate affects the price action of different pairs.

In the UK, the national government through the Department for Work and Pensions sets the social security rate and is reviewed annually. A breakdown of the UK social security rate can be found HM Revue and Customs website. It should be noted that for the past 25 years, the US government has not changed the social security rate, as can be seen here. Below is a screengrab from the Trading Economics’ website on the UK and US social security rates.

UK social security rate

US social security rate

In the latest release on April 6, 2020, around 1100 GMT, the UK government revised the social security rate upwards from 12% to 14%. Now, let’s see how this news release made an impact on the Forex price charts.

GBP/USD: Before social security rate release April 6, 2020

We plotted a 20-period Moving Average on a one-hour GBP/USD chart. As can be seen on the chart above, the pair is in recovery with the candles crossing over the 20-period Moving Average and subsequently forming above it.

For the GBP/NZD and GBP/AUD pairs, the market is in a general downtrend before the announcement of the hike in the social security rate. This trend is evidenced by the subsequent candles forming below the 20-period Moving Average, as shown in the charts below.

GBP/NZD: Before social security rate release April 6, 2020,

GBP/AUD: Before social security rate release April 6, 2020

For forex traders, going long on the GBP/USD wile short on the GBP/NZD and GBP/AUD pairs would have been an excellent trading opportunity since the prevailing market trends would favour them.

Let us now see if the release of the new social security rates changed the market trend for these pairs.

GBP/USD: After social security rate release April 6, 2020

In theory, raising the social security rate should be positive for the GBP. Bust, as can be seen in the GBP/USD one-hour chart, the news release, did not have any impact on the pair to change the market trend significantly. The lack of impact can be observed for the GBP/NZD and the GBP/AUD pairs as shown by the charts below.

GBP/NZD: After social security rate release April 6, 2020

GBP/AUD: After social security rate release April 6, 2020,

Whereas the social security rate plays a significantly important role in the overall economy and the GDP, it is apparent that its impact in the forex market is negligible.

Categories
Forex System Design

Introduction to Optimization of a Trading System

Introduction

Once the system developer tested and validated the trading system, the next stage corresponds to the optimization process. The developer will estimate different values for the key model parameters.
This educational article will introduce the basic concepts in the optimization process of a trading system.

The Optimization Process

Before getting started into the optimization process, the developer must weigh and adjust the investor’s interests with the purpose of the optimization and limitations both the strategy and reality. In this regard, the optimization must align with realistic objectives. For example, the drawdown should not exceed 10% of the trading account, or to obtain a yearly net profit of 15% from the invested capital.

The optimization of a trading system is the stage that seeks the best or most effective use, which allows investors to obtain the highest performance of the trading system. In this context, the optimization could be the search of what inputs could maximize the profits or accomplish the investor’s requirements to minimize the drawdown. To achieve this, the developer must evaluate the variables that conform to the rules and formulas that define and models the system’s structure.

The system developer must consider that an incorrect optimization can drive to obtain serious errors. For this reason, the optimization process is a critical stage in trading system development.

What is the Optimization of Trading Systems?

In general terms, the optimization process is a mathematical method oriented to improve or find an “optimal” solution to a specific problem. In the trading system development, the optimization corresponds to the best parameter selection that allows the strategy to obtain the peak performance in the real market.

Getting Started

Once the system developer tested the trading strategy’s capability to catch market movements, the steps to start the optimization are as follows:

  1. Selection of the model parameters that have the most significant impact on the system’s performance; if a model’s variable is not relevant, it could be fixed.
  2. Selection of a significant range of data needed to test the parameter to be optimized. This range must generate a significative sample to study the model. For example, the amount of data required to evaluate a 20-day moving average is lower than the one needed to assess a 200-day moving average.
  3. Selecting the data sample size. It must be representative enough to ensure the statistical validity to make estimations. The size also must be representative of the market as a whole.
  4. Selection of the model evaluation type, this stage will depend on the evaluation type, objective, or test criteria; this selection will change depending on the kind of trading model.
  5. Selection of the test result evaluation type, this stage must evaluate the results of the optimization process with a statistical significance, meaning the results are not due to chanve. For example, a P-value below 5% would be statistically “significant,” and below 1% would be “highly significant.” Additionally, the average and the standard deviation of the results must be evaluated. As a final note, profit spikes should be considered as abnormal and be discarded.

The figure summarizes the five selections that the system developer must take before to start the optimization process.

Conclusions

The optimization process is a critical stage that comes after the testing process. In this stage, the system developer seeks to determine the appropriate value for the most robust trading strategy implementation. 

Nevertheless, before starting with the optimization, the developer must take a set of decisions, such as which the objective of the optimization? Is it realistic?

Once defined the target of the optimization, the developer must select which parameters to optimize, the range of data to be used in the analysis, how much data will require the sample, which will be the evaluation type of the model, and the evaluation criteria of the test results.

Finally, when all these five steps have been completed, the system developer is ready to start to perform the optimization.

Suggested Readings

  • Jaekle, U., Tomasini, E.; Trading Systems: A New Approach to System Development and Portfolio Optimisation; Harriman House Ltd.; 1st Edition (2009).
  • Pardo, R.; Design, Testing, and Optimization of Trading Systems; John Wiley & Sons; 1st Edition (1992).
Categories
Forex Daily Topic Forex Price Action

Trend Line Trading: It Takes at Least ‘two’ to Draw a Trend Line

In today’s lesson, we are going to demonstrate an example of trendline trading. We try to learn what steps traders need to take to trade using a trendline strategy. We are going to demonstrate a chart, which heads towards the North by obeying an up-trending trend line. With the trend line trading strategy, we must remember, “It takes at least ‘two’ lows to draw a trend line.” Let us proceed and find out how it works.

The chart shows that the price produces a double bottom and heads towards the North. The buyers may wait for the price to make a bearish correction and create a bullish reversal candle to go long in the pair. The last candle comes out as a bearish pin bar. The price may make a bearish correction from here.

The price makes a long bearish correction. It produces several Doji candles. However, it does not create any bullish momentum. It is an H4 chart. The correction takes more than six candles. The level of resistance becomes a daily resistance. Some buyers may skip eyeing on the chart to go long in the pair. Let us see what happens next.

The chart produces a bullish engulfing candle and heads towards the North by making a new higher high. Do you notice anything here? Yes, we can draw an up-trending trend line. Let us draw it.

Over here, we have two swing lows. At the second swing low, the price makes a breakout at the last swing high. It means as far as fundamentals of drawing a trend line is concerned, the chart offers the buyers to draw an up-trending trend line. We must remember that it takes at least two swing lows (price trending higher from those points) to draw a trend line. The buyers are to wait for the price to come at the level of support and produce a bullish reversal candle to go long in the pair.

The price comes at the level of support and produces a bullish pin bar. It is delivered right at the trendline’s support. The buyers may get ready to go long in the pair above the reversal candle’s highest high.

The next candle comes out like a spinning top, which breaks the reversal candle’s highest high. However, the price does not head towards the North according to the buyers’ expectations. Nevertheless, on the next day, the price makes bearish correction at intraday charts and heads towards the North. Let us proceed to the following chart to find out how the trade goes.

The price hits the first target in a hurry. It makes a breakout at the level and creates a new higher high as well. It means the buyers are going to keep their eyes on the chart to go long again from the trendline’s support, and this is the beauty of the trendline trading.

Categories
Forex Indicators

The 5 Best Forex Indicators

Forex indicators use mathematical calculations to measure things like volume, exchange rates, open interest, etc. about a currency pair to let traders know if they should enter or exit a trade. There are a lot of different indicators out there, such as Bollinger Bands, Stochastic oscillator, Relative Strength Index (RSI), and many more. Most people use indicators to help make more confident trading decisions without as much guesswork.

Those with programming skills can create their own software to run on the MetaTrader 4 or 5 platforms, which can make your life as a trader much easier. Of course, those that aren’t interested in developing their own software can rent or purchase indicators for a low price in most cases. If you’re looking at indicators, you’ll want to choose one that is suited for your personal trading strategy. In our opinion, the most useful indicators work with many different strategies while offering clear signals and helpful information. Below, we will go into detail about the five best indicators that are available.

Moving Averages

Moving averages gauge momentum and define areas of support & resistance in the market. These indicators are primarily used to give one an idea of the underlying direction or trend of the market. Traders can also use one or more moving averages for trading signals, for example, the point where a shorter moving average crosses above or below a longer moving average.

There are five main types of moving averages:

  • Simple moving average (SMA)
  • Exponential moving average (EMA)
  • Weighted moving average (WMA)
  • Smoothed moving average
  • Hull Moving Average (HMA)

Moving average is a lagging indicator, meaning that it reacts to events that have already happened, rather than predicting future events. The indicator focuses more on confirmation and analysis.

Relative Strength Index (RSI)

The RSI has been a favorite trading indicator for many traders since it was created by analyst J. Welles Wilder in 1978. It is a momentum-based indicator that compares the amount of a currency pair’s most recent exchange rate increases against its most recent exchange rate drops. This helps it to identify overbought or oversold conditions in the market.

The RSI is displayed as a line on a graph that moves between two extremes with a reading from 0 to 100. Traders usually interpret a reading above 70 as an indication that a security is being overbought, which will likely result in a trend reversal or corrective pullback in price. A reading of 30 or below would, therefore, indicate oversold or undervalued conditions in the market.

Bollinger Bands

John Bollinger developed the Bollinger Bands technique in the 1980s. The indicator uses a moving average with two trading bands above or below it to add and subtract a standard deviation calculation. Bollinger Bands measures volatility so that it can adjust to market conditions and provide all needed price data between the two bands.

On a chart, you’ll see a centerline, which is an exponential moving average, with two price channels (or bands) above and below it. The two price channels are the standard deviations of the asset that is being looked at. Volatile price action causes the bands to expand, or contract when the price is bound into a tight trading pattern. Looking at examples online can help one to recognize these patterns.

Moving Average Convergence Divergence (MACD)

The MACD indicator is a trend-following, momentum-based indicator that shows the relationship between the two moving averages for an instrument’s price.
The indicator comes up with its calculation by subtracting the 26 period EMA (Exponential Moving Average) from the 12 period EMA, resulting in the MACD line. It also includes a smoothed moving average (SMA) line of 9 periods to signal trades.

The Stochastic Oscillator

A Stochastic oscillator is a momentum-based indicator that compares the closing price of a security against the range of prices it experienced over a specific time period. The primary use of this indicator is identifying overbought or oversold conditions and providing trading signals.
The indicator provides traders with a number that ranges from 0 to 100. Readings over 80 are considered to fall in the overbought range, while readings of 20 or less are considered undersold. Of course, the exact line where one would consider conditions overbought or oversold can fall to personal interpretation. The indicator consists of two lines. One reflects the value of the oscillator for the session, the other reflects its simple three-day SMA.

Conclusion

Throughout this article, we have identified some of the best indicators that one can have at their disposal: moving averages, relative strength index (RSI), Bollinger Bands, moving average convergence divergence (MACD), and the stochastic oscillator. Several of these options are momentum-based and they can help to identify trends and overbought or oversold conditions, or to provide helpful trading signals. If you plan on using any of the indicators we have outlined above, be sure to check out some visual examples online first. On the contrary, if you’d prefer to trade without the use of any indicators, then you should consider naked trading.

Categories
Forex Daily Topic Forex Fundamental Analysis

Understanding The Impact of ‘Sales Tax Rate’ News Release On The Forex Market

Introduction

The sales tax rate usually comes as an afterthought to many. But for forex traders, understanding how the rarely-talked about sales tax rate could prove useful in the long-run. This article defines what sales tax rate is and further shows how they impact a country’s economic development and, by extension, its currency.

Understanding the Sales Tax Rate

A sales tax rate is the percentage of the total cost of the goods or services being sold. Sales tax is a consumption tax that is imposed by governments or local authorities on the sale of goods and services. The sales tax rate is calculated as a percentage then added on the cost. These taxes are usually collected at the retail point of sale on behalf of the imposing authority.

As structured, any business that is offering goods or services is liable for the payment of the sales tax in a given jurisdiction. Depending on the laws, this occurs is they have a physical location within the jurisdiction, an official employee, or an affiliate.

How Sales Tax Work?

The sales tax is collected at the end of the supply chain, only after resale to the consumer has occurred. Since consumers are the ones paying the tax, businesses receive a resale certificate to show that the sales tax is not yet due. The purpose of this certificate to the resellers is to ensure that no sales tax is paid on purchases of items to be resold.

The administration for the sales tax is triggered by whether or not a particular business has a presence within the tax jurisdiction. To be eligible to collect sales tax from its customers, the business has to apply for a sales tax permit from the relevant authorities.

Depending on the jurisdiction, the goods and services that are eligible for a sales tax vary. Groceries and medications are exempt from sales tax, as are goods and services purchased by nonprofit organizations.

Sales Tax Rate as an Economic Indicator

The sales tax rate can serve as a leading indicator for the shifts in demand and supply within the economy. Higher sales tax rates reduce the purchasing power and, with it, the aggregate demand and aggregate supply. The lowered demand and supply within the economy result in reduced economic activities, which could have an unintended ripple effect throughout the economy. With lowered demand and supply, unemployment as a result of job cuts in the affected sectors is another unintended consequence of a higher sales tax rate.

On the other hand, lowering sales tax increases the purchasing power of consumers, which in turn increases the aggregate demand and aggregate supply. These increases lead to job creation in various sectors and boost a flourishing economy. With a lower sales tax rate, the GDP growth within the country is guaranteed to bring about a strengthening currency as a result of improved economic conditions.

How the Sales Tax Rate Affects the Economy

In general, the sales tax rate has a negative correlation with the GDP. This negative relationship is shown in the scatterplot graph below of the US state sales tax rate against the GDP.

Source: Georgia Tech Library

At its core, sales tax is a revenue stream for the government. Thus, it can be said that a higher sales tax rate increases government revenues. The increase in government revenues increases government expenditure, hence higher GDP. In this scenario, a conflict arises. This conflicts because sales tax is an extra cost passed on to the consumer.

Thus, in general, the sales tax rate reduces the purchasing power of the consumers.  The reduced purchasing power leads to lesser sales taxes collected by the government, hence lower GDP. As a result of the diminished purchasing power, the consumers will spend less, resulting in a reduction in the aggregate demand within the economy. This reduction in demand leads to a reduction in the economic output hence lower GDP.

On the other hand, a lower sales tax rate returns some of the purchasing power to the consumers. They will spend more of their disposable income hence increasing the aggregate demand and supply within the economy. The increase in demand and supply increase the economic output. Furthermore, spending more implies that the government is bound to collect more revenue in the form of the applicable sales tax. An increase in revenue will increase the government expenditure within the economy, thus increasing the GDP.

How Sales Tax Rate Impacts Currency

The strength of any currency is usually seen as a direct reflection of its economic performance. As already discussed, the sales tax rate is considered to be leading indicators of aggregate demand and aggregate supply within an economy, and by extension, the unemployment levels. An increase in the sales tax rate will result in a drop in the aggregate demand and aggregate supply. This drop leads to increased unemployment levels and consequently reduced GDP. Long term currency traders can take their cue from an increased sales tax rate as an impending loss of strength in the country’s currency.

This loss in the currency’s strength can be brought by the expectations that, in the long run, central banks and the government will employ the use of expansionary fiscal and monetary policies to stimulate a stagnating economy. These policies harm the currency.

On the other hand, lowering the sales tax rate signifies that in the long run, the economy will be stimulated to grow. This growth is brought about by increased demand and supply. For forex traders, a country that is lowering the sales tax rate or entirely removing the sales tax can expect its currency to strengthen. The currency strength is because the traders can anticipate that in the long run, the government and the central banks may be forced to employ deflationary monetary and fiscal policies to avoid an overheating economy. These contractionary policies are good for the country’s currency.

Therefore, it can be expected that an increase in sales tax corresponds to a weakened currency against other pairs while a decrease in the sales tax rate corresponds to the strengthening of the currency.

How Sales Tax Rate News Release Affects The Forex Price Charts

The sales tax rate is not an indicator forex traders consider when placing their trades because it is a low-impact leading indicator. However, it is useful for forex traders to know just how much the impact of this low-level indicator is on the price charts.

In the US, the national government does now impose the sales tax. However, the various local governments set their own local sales tax rates. The detailed list of the US states and the sales tax rate applicable in each state can be found on the Sales Tax Institute website. The data on annual GDP growth can be accessed from the World Bank website. A forecast of the sales tax rate through to 2020 can be found on the Trading Economics website.

Below is a screengrab of the Sales Tax Institute showing the most recent changes sales tax rate in Washington.

In the latest release, Washington state lowered the sales tax rate applicable from 8.0 % to 6.5% in an attempt to alleviate the strain on consumers as a result of the Coronavirus pandemic.

Now, let’s see how this news release made an impact on the Forex price charts.

EUR/USD: Before Washington Sales tax rate release July 1, 2020

As can be seen in the chart above, we have plotted a 20-period Moving Average on a one-hour EUR/USD chart. From the chart, the pair is one a steady uptrend, represented by the candlesticks forming above the Moving Average. Before the news release at 1730GMT, the pair can be seen to be on a recovering uptrend. This uptrend can also be observed in the AUD/USD pair, as shown by the chart below.

AUD/USD: Before Washington Sales tax rate release July 1, 2020

For the NZ/USD, the pair is on a steady downtrend for hours preceding the news release. This trend is shown in the chart below.

NZD/USD: Before Washington Sales tax rate release July 1, 2020

For long-term forex traders, the pattern offers an excellent opportunity to go long on the EUR/USD and AUD/USD pairs while short on NZD/USD, since the prevailing market trends would favor them. Let us now see how the price action responded to the release of the sales tax rate in Washington State.

EUR/USD: After the sales tax rate release July 1, 2020

Lowering the sales tax rate should have a strengthening effect on the USD. However, as shown in the chart above, the news release of the sales tax rate had no impact on the EUR/USD since the uptrend continued with the same magnitude as before. The same trend can be observed on the AUD/USD and NZD/USD pairs since the previous trends were no reversed. This trend is shown in the charts below.

NZD/USD: After the sales tax rate release July 1, 2020

AUD/USD: After the sales tax rate release July 1, 2020

It is evident from the after-news charts that the release of the sales tax rate does not have any impact on the price action. Although it is has a significant impact on the GDP, it is a low-level economic indicator in the forex market. Cheers!

Categories
Forex Psychology

Three Ways to Boost Your Trading Confidence

Trading is a difficult thing to do, well it’s difficult to do well and to do it well consistently. There are a lot of things that can happen that can really put a dent on your confidence levels, losses are a part of trading, yet every single loss is going to hit your confidence levels and can make you question whether or not you are doing things right or whether or not it is the right career or hobby for you.

With so many things to hit your confidence levels, it is important that you work out ways to increase it again or to keep it high. If you are making profits, no matter how many losses you have you should be feeling confident as this is something that a lot of traders fail to do. So let’s look at a few of the different things that you could be doing that could potentially help you to increase and keep your confidence levels high.

#1 – Practice

One of the more obvious things, the more you do something, the better you will get at it and the more confident you will be at doing it. The reason people get good at things is simply through practice, you will never be able to plan for every scenario, so having p[racticed through them will give you that little bit of confidence and understanding of how you can deal with the situation at hand without having to worry too much.

#2 – Look at the Bright Side

When things go wrong, there are two things that you can do, you can take it personally or you can look at the brighter side and use that loss as a new learning opportunity. There is always a positive to every negative, it is important that you take a little look for it, this will give you a better perspective of what has gone wrong and will enable you to continue to trade without taking that loss personally or thinking that you may not quite be good enough because you are, everyone experiences these losses, everyone even the millionaires, so do not take it to heart and carry on with your confidence high and a new learning opportunity in hand.

#3 – Focus on Your Trading

Try to focus on what it is that you are doing, do not worry about the things that others are doing or what the results of others are, concentrate on you and only you. If you are not comparing yourself to others you will only have your own past experiences and results to go by, as time goes on you will notice an improvement in your results which will help build your confidence through seeing the progress that you are making. As soon as you compare yourself to others, you will find people doing a lot better and this will hit your confidence levels, so stick to comparing yourself to you and not others.

So those are some of the things that you can do to try and help keep your confidence levels high, it is vital to keep it high and to build up, this will keep you motivated and happy when trading, it will also help to keep away some of those more pesky emotions such as stress.

Categories
Forex Psychology

Excuses That (Almost) All New Traders Make

If you look around the internet, you will find a lot of excuses out there about why someone may not be trading well or why they have been losing money. The problem with these excuses is that they often show that the user has a lack of understanding about how the markets work, either that or they are in denial and do not want to admit that it may have actually been something that they did that caused the trade to lose.

We are going to be looking at some of the more common excuses that you see posted about the internet on blogs and on various trading forums, we are sure that you would have seen some of them posted before and we are sure that you will also see them posted many times again.

My broker is a scammer!

This excuse could actually have a little merit to it, depending on the broker that is. There are some very shady and dodgy brokers out there, ones that have taken part in some pretty low business operations which have left people without any of their money, or tactics which encourage people to deposit money that they cannot afford to deposit, if this was the case then the excuse would be pretty valid. The problem comes when we look at the more reputable brokers, the ones with great track records that have done pretty much nothing wrong in their entire existence. People still claim that these brokers have scammed them and stolen their money, simply due to the trader losing their money.

This can also be seen with people who claim that all regulated brokers are good and unregulated ones are bad. The regulation covers the protection of their money, it does not always dictate the behavior of the broker, so people claiming that all unregulated brokers will scam you is not the case at all. The majority of traders who use the reputable ones have simply treated badly or gambled, the brokers often do nothing wrong (unless they are an actual bad broker). So be wary when you see people claiming to have been scammed by the broker, it is not always the case.

The markets are against me.

This is something that we see a lot, people take their time to analyse what they think is a good trade, they have put the time and effort in, they then place the trade and it goes the wrong way, or it starts to go well, then suddenly turns and zooms off in another direction. What happened? The markets must be against me, they obviously saw me put on this trade and then decided to go against me so I would lose my money. Reality check, the markets do not even care who you are, they do not notice the little money that you are putting into the markets. There are trillions traded each day on the markets, you $100 trade is nothing to it, not worth anyone’s time or effort to try and trade against it.

Newer traders often don’t realise how many things there are that can affect the markets. You can never prepare for them all, in fact, you cant prepare for even half of them, news events, natural disasters, banks changing consensus, loads of things affect them, just because it went against you, doesn’t mean it was anything personal.

Trading takes too long.

Trading does not take a long time, what takes a long time is the preparation of trading. This is unfortunately the part that you need to do at the start of your career and so it is the part that newer traders see the most. The thing that many do not understand is that once you have gotten through the initial planning and preparation stages, the actual process of putting on the trades does not take time at all. It is common to see it plastered all over the internet and forums that you will not have a life when you start trading or you won’t have time to do it after work, but you can, and many people do. Many people trade part-time after or before work, it is more than possible, people just do not want to put the effort in, or simply look at the start of the process and then assume that the entire trading career will be the same.

Trading is too complicated.

Trading looks complicated, in fact, it is complicated. We will probably give them this one. It takes a lot of effort and time to learn how to trade properly, not something that a lot of people want to actually do. The problem is that from the outside it looks incredibly simple, here isn’t actually that much to it, you guess that something will go up or down and put that trade on. Unfortunately, it is not that simple and once people have started trading they have realised this, do not want to put in all the time and effort to actually learn how to trade properly and simply chalk it up as too complicated and give up.

You can’t make enough to live on.

This is normally something that people say if they have gone into trading with their expectations of what they will be able to do is set way too high. The unfortunate truth is that a lot of people are now getting the idea that trading can make you rich overnight, this view is often formed when people view some of the frequent adverts that are promising less than realistic returns. When you go into it thinking you will have the world, you will be disappointed.

People also go in with the expectation that they will be able to make enough to quit their job within a couple of months, again, this is not something that is realistic. Yes, you may be able to make enough to quit your job, but that will take a long time to happen. It takes a lot of time to learn, not something that some people want to put in, so as soon as they do not make as much as they want, they blame forex and simply state that you cannot make as much as people say that you can.

So those are some of the things that you often see posted around social media or on trading communities. They are often from people who have entered trading without a proper understanding of what is involved or even what trading actually is. If you have that knowledge then you most likely won’t be making the excuses that we went through above.

Categories
Forex Psychology

How to Cope With Trading Boredom

Trading can be an incredibly exciting thing, especially when you are first starting out and everything is brand new to you. Even for experienced traders, it can be an incredibly exciting and thrilling thing to take part in, especially when there is a lot of volatility within the markets. The problem comes when the markets are a little bit slower, in these slower conditions something called trading boredom can set in.

Trading boredom can simply be described as the period when there is nothing going on, the markets aren’t really moving and even if they are, they are not moving in a way that is suitable for your trading strategy, and so you are sat there with nothing to actually trade, not much to analyse and nothing to do at all, this is where trading boredom begins to set in.

While boredom can bring our motivation levels down, it can also lead to other problems. It can make us far more likely to be distracted, those little toys that you have in the room, or the TV in the corner will be turned on a lot more often than it will. This creates a really bad habit when it comes to trading. You want to be getting rid of these distractions, so this trading boredom leads us towards a very slippery slope because if you get into the habit of getting distracted, it will be hard to break out of it.

So we briefly mentioned that boredom can actually reduce our motivation levels which in itself is not a good thing. Without motivation, we become more easily distracted and can make us just not want to do it. In fact, a lack of motivation is one of the things that can cause people to quit trading completely, which is of course not a great thing because trading is such a fantastic opportunity and a great hobby to have.

The problem with boredom is that for some it is unbearable and so they decide to try and force some trades, this is never a good idea, neve. All that this will lead to is bad trades and the inevitable losses that come along with them, if you are feeling bored, the last thing that you want to do is force trades, so do not do it, none, not even one, it will lead you down a slippery slope which for many there is no way to return from.

For some it is easy to get through these dull moments in trading, they do not need any added stimulus and can very patiently wait out the slow moments., For many though, it is not quite this easy and these dull moments can be a real killer. We need to find ways to help reduce the feeling of boredom and so we have come up with some ideas that you could try which could help to alleviate that feeling, some may work, some may not, but it is always worth trying as you do not want to be stuck with the feeling of boredom, it will only make you want to put down your trading tools and leave.

When the markets are slow, it is the perfect opportunity to learn a little more, learn something that you do not know much about. This could be a new strategy or just something smaller than can be used to adapt your own strategy. It is also a perfect time to start learning about additional timeframes. These can be used to help you confirm your analysis, as the more timeframes that you understand, the more accurate your analysis can be.

It can also be the perfect time to teach yourself a new skill, patience. Patience is key when trading, these dull moments will always be there, some lasting minutes, others for potentially days. Having an understanding that you have your strategy set, you understand the entry requirements and now are just waiting, do not see this as a time to be bored, think of it as waiting to pounce on the perfect trade. Building up your patience will benefit you in the long run and will potentially help you trade in more strenuous market conditions down the line.

If we are used to the high pace markets, then these slower moments can be even worse, you need to be able to slow yourself down, to calm yourself from all the excitement that you are used to. Take a few minutes before sitting down to trade to relax, take some deep breaths and slow your body and mind, this will allow you to better focus on the issue at hand and to be more in sync with the markets.

There are also a lot of trading forums and communities out there, do not be afraid to join a few. Some people often think that they are a waste of time or that they will not be able to learn anything from it or that they are simply full of people wanting info but not willing to give them. This is certainly not the case, there is a wealth of information out there, you will always find answers to questions and a lot of information that could be beneficial for you, not only this, but it will give you something to do while the markets are quiet, taking away some of that boredom.

So remember, there will be some dull moments, no matter what your strategy is or how long you have been trading, there is always the opportunity for the markets to be slow and for you to struggle to find trades, it is important that you know what to do with yourself in those situations. If you have a lot of patience then it won’t be an issue, but for those that find it hard, keep looking for something for you to do, different forums, new analysis, new strategies, anything that isn’t forcing trades. So have some things planned to do for those quiet moments, that way you won’t be tempted to make those bad boredom trades.

Categories
Forex Psychology

Can Stress Be A Positive When Trading Forex?

You no doubt would have heard people tell you about how bad stress is in trading, how stress is one of the worst feelings that you can have and you should do whatever you can to try and avoid stress completely or ways to help reduce it. However, could stress actually be a positive thing, could it actually help you when trading?

Stress can cause people to break down, it can reduce your attention and can make you make some bad decisions, especially when it comes to trading, however, in life, stress can actually be a good thing, stress is what gives you your fight or flight survival instincts and if you did not have it, you would probably be dead by now, stress will literally save your life.

The problem is that different people will react to stress in completely different ways, stress is like an injection of energy and feelings into your brain, it can make you freeze in place, it can make you jump out the way and it can completely confuse you, what it does to you depends on who you are and so for some, it can be a massive positive, but for others, it can be a disaster waiting to happen.

Before we get into some of the positives of stress, stress ultimately will cause you to automatically make some decisions, which you can imagine that when you are trading, it may not be the best scenario. So when people tell you that when trading you should be trying to avoid stress, you should believe them, while it does have some positives, trading is not something that you want to be making quick and rash decisions when doing, so when you are feeling stressed, if you do not react the right way naturally, try and avoid it completely.

We mentioned above about the fight or flight reaction that people have with stress, there is also the third thing that could happen, you could freeze in place, much like a deer does when it sees the headlights of an oncoming car, the deer freezes as a defense mechanism, although in this scenario it is actually the worst thing that it can do, that is what it has trained itself to do.

Think back to the last time you were in a scary situation, how did you react? Did you try to get away from the situation (run) or did you try to overcome it (fight)? This would be your natural reaction to stress, this is not a trained reaction, this is just6 how your brain automatically reacts to it, but how is this helpful for trading? Depending on your reaction, or your ability to train your reaction, we can use stress to really focus your mind on the thing that is causing it, finding ways to overcome it, rather than avoiding it.

It is important to understand that stress is a part of trading, it will always be there and will be impossible to avoid it completely, it will most likely rear its head when you make a loss, and you will make losses as they are a major part of trading. The thing that we need to do is to train ourselves to use that stress to our advantage. We want to use that stress to focus our mind and to calmly resolve the issues rather than freezing or panicking when something happens which can lead to rash uncalculated decisions and trades.

So now that you have a basic understanding of what stress can do and that losing and stress are unavoidable parts of trading, what do you do with this information? We need to be able to train your mind to react in a certain way when you start to feel some trading stress, a way to avoid making rash decisions, and instead focusing yourself on the issue that is causing the stress.

When we mention reacting to the stress, it does not necessarily mean taking action, for many of us, the best scenario would be to avoid stress entirely, or when it does start to show its ugly head, we are able to get out the way, so being able to recognise those signs is, in fact, a reaction to it, you need to get a good understanding of exactly what stress looks and feels like to you, this will enable you to know when it is starting to approach and will give you time to react accordingly.

For many, simply getting rid of it is perfect, when you start to feel it coming, use that as your time for a break, you always need breaks, so there is no better time to take one, it will give you a break and also help to remove any causes of stress at that point in time.

For those that thrive on stress, you need to use it to focus on whatever is the source, if it is low, use that time to learn why you lost, look at your journal or your trade history, getting an understanding of why something caused you stress will enable you to better understand it and have an understanding of why something happened often enables you to better deal with it in the future should it happen again.

Stress is not an easy emotion to deal with, but it is something that you will come across a lot when trading, in fact, it will be one of the most seen emotions, it is caused by losses, by the markets not moving the way you want it to, money issues, and even a lack of trades. There are many things that can cause it, what is important is how you deal with it, if you freeze or simply begin taking trades without thinking about it, it will only lead to more losses. You need to be able to control it, remove it, or use it to your advantage and focus your mind on the task at hand. Whatever works best for you, it is just important that it is under control, and you do not let this very powerful emotion and feeling get the better of you.

Categories
Forex System Design

Testing Process of a Trading System

Introduction

Upon completion of the first steps of the process to build the trading system, the developer must validate the model with a defined confidence level. This evaluation should provide specific metrics to assess the model’s capability to generate profits and the risk of using it.
In this educational article, we will discuss the testing process of a trading system, including the evaluation and optimization process.

Testing Process

The testing process is a critical stage in the trading system development; in this phase, the developer must validate the system’s behavior in a simulated market context with real data. This process leads the developer toward deciding how much data will be needed to verify the model. 

The data size should be significant enough to provide results with a confidence level, such as in statistical terms, a 95% confidence. Considering that volatility and market dynamics changed in the last 40 years, the consideration of 40 years of data could not be adequate to evaluate the model. In this regard, 5 to 15 years of market data could be enough for the right estimation of the system’s performance.

In the first step, the system developer should realize a back-test evaluating the system’s construction logic and the performance with historical data. The results must be studied with an objective quantitative method as the statistical inference. This process’s results could drive the system’s developer to discover some optimization model based on the market’s synchronicity. 

After this optimization, the next step in the testing process is in terms of Jaekle and Tomasini, the walk-forward analysis. A walk-forward analysis is a series of multiple and successive out-of-sample test over different chunks of the data series. The data used in the walk-forward tests should be unused portions of the historical data.

Once verified the trading system capability to generate profits with an acceptable risk level, the system could be tested using real-time data and paper money to evaluate its performance in front of new market conditions. In this context, the time to run the system should be flexible and dependent on the developer’s experience.

A Question of Samples

A sample is just a portion of the whole phenomenon under study; in a trading system, the event under analysis corresponds to the results from a trading entry series. In this context, the final result corresponds to the profit/loss level generated on each trade. In other words, a sample with one trading signal could not represent the trading system’s capability to generate profits. Therefore, the trading signals generated by the system should be significatively bigger to evaluate its performance, and in consequence, the sample used should be representative of the whole series.

The result from the sample evaluation will be an average of the potential returns of the trading system. Considering the variability of the results, the trading system developer will have to analyze the degree of variation of the returns with respect to the average return. In statistical words, the developer will have to study the standard deviation of the trading system.

An example of this analysis could be the return average of the trading system is $100 per trade with a standard deviation of $15 per trade, this means that the trading system may show returns between $85 to $115 per trade 68 percent of the time. 

Is it Necessary to Optimize the System?

The optimization process is a way to adjust some variables oriented not only to maximize the profits but also to reduce the risk taken on each trade and improve the trailing stop methodology. It could also have to target the reduction of false trade signals, for example, to avoid the market entries when the price action realizes a false breakout. However, according to Jaekle and Tomasini, there exist the possibility of incurring an over-optimization, which could reduce the system’s performance.

Conclusions

The testing process is a step intended to evaluate the trading system’s ability to generate profits and identify the variability level of its results with a confidence level. In this way, the system developer must analyze the system’s performance, using both historical and real-time market data. At the same time, the period required to study the system’s performance in real-time will depend on the developer’s experience. 

The requirement of optimization will depend on the variable to need to be improved. This process could carry the trading system to reduce its efficiency in its capability to generate trading signals. 

Finally, in our next educational article, we will expand the optimization process and some metrics to evaluate the trading system performance.

Suggested Readings

– Jaekle, U., Tomasini, E.; Trading Systems: A New Approach to System Development and Portfolio Optimisation; Harriman House Ltd.; 1st Edition (2009).

Categories
Forex Daily Topic Forex Fibonacci

Fibonacci Trading: Fibonacci Levels Help Traders be Precise

Fibonacci Trading: Fibonacci Levels Help Traders be Precise

In today’s lesson, we are going to demonstrate an example of a chart where the price makes a bullish move from 78.6% Fibonacci level. The 78.6% Fibonacci level often makes the price reverse towards the trend’s direction. In today’s example, the price produces a Morning Star and heads towards the trend’s direction with good bullish momentum. Let us see how it happens.

It is an H4 chart. The price produces double bottom and heads towards the North with good bullish momentum. On its way, it produces only a single bearish candle. The buyers are to wait for the price to make a bearish correction and to get a bullish reversal candle to go long with a good risk-reward in the pair.

The chart produces a bearish inside bar. Then, it produces one more bearish candle. Look at the last candle. It comes out as a doji candle. It seems that the price may have found its support. A strong bullish reversal candle may attract the buyers to go long in the pair and push the price towards the North to make a new higher high.

The chart produces a bullish engulfing candle. The combination of the last three candles is called Morning Star. This is one of the strongest bullish reversal patterns in the Forex market. The buyers may trigger a long entry right after the last candle closes. They may set stop loss below the signal candle’s lowest low. We’ll find out the take-profit level in a minute. Let us first see how the trade goes here.

The price heads towards the trend’s direction with extreme bullish momentum. The last candle comes out as a bearish inside bar. It may make a bearish correction now. Some sellers may close their trade manually after the last candle. You may notice if they do that, they lose a few pips. How about if we knew that the price may make a bearish reversal from here before the last candle is produced. Yes, it is possible by using Fibonacci levels. Let us draw Fibonacci levels on the chart.

The chart shows that the price trends from 78.6% level. When the level of 78.6% makes the price move, it usually makes a reversal at 138.2%. Thus, if we set our take profit at 138.2%, we do not have to wait to get a bearish reversal candle to close our trade manually. It saves our time and gets us more pips too. This is why Fibonacci (extension/ retracement) is called a magic trading tool, since it helps traders in taking and exiting with precision.

Categories
Forex Psychology

Psychology That Will Blow Your Trading Account

Psychology is a major part of Forex trading, Forex comes with ups and downs and as a new trader, some of these downs can drag your trading down with it, we have looked at a number of different psychological holes that traders can fall into, ones that can potentially make you blow your account.

So out the first pitfall is for those people who want to trade forex for the simple reason, to get rich as quickly as possible. Sadly, this is the view of Forex that a lot of people have, mainly because of all those people of social media such as Instagram that are posting their fast cars and million-dollar houses, in case you didn’t know, none of it is real. They do not have this money, they do not own those cars, they have either taken pictures from other people or have rented them for the purpose of the videos, all they want to do it suck people into their affiliate programs. So the mentality that people see and gain fro these is that you can use Forex to get mega-rich, mega quick.

Forex is a long learning process, it can make you rich, but that will be years and years down the line, not within a week. Get that idea out of the mind, you need to treat it like a business, risk management, small profits, and slowly growing.

Are you afraid of losing? Much newer, especially younger traders have the idea in their mind that losing is negative, anything that makes your money go down is bad, but is it really Losses are often seen as the best way to learn, but that mentality is hard to put into someone that has been brought up being told to save their money and to avoid risks. You are going to lose, it is a part of trading, being able to understand that will help put the thoughts of a loss being bad out of your mind and will allow you to adapt rather than sitting in fear.

Do not fight the markets, you won’t always be right and the markets will try to hurt you at times, that is just the sort of asshole it is, knowing when you have been wrong is vital and so is getting out. When your strategy dictates a stop loss at a certain point leave it there, if the markets start moving against you, many newer traders will still believe that their trade was correct so they move the stop loss further down, and then further, and further again because they know the markets will turn in their favor. In the end, it continues down and the stop loss is 5 times large than it was meant to be, it triggers and most of the account has gone. Stick to your original plans, don’t alter them mid-way through as this will only lead to more losses.

A lack of discipline can cause accounts to blow and it is most likely the one that has blown the most. Having discipline means being able to stick to your trading strategy no matter what is happening within the markets or how past results have gone. Many traders when they make a loss will want to get that money back, they do this by increasing the size of the next trade, bad idea, this is known as a Martingale strategy that has blown thousands of accounts in the past. Another thing that undisciplined people do it to leave their perfectly good strategy because it has a few losses, those losses will come no matter what your strategy is, so you need to stick with it and accept some of the losses.

Are you guilty of any of these pitfalls? Take a look at tour past and see if you are or have been, getting them out of your mind is a fantastic step to becoming a successful trader.

Categories
Forex Psychology

Take Responsibility For Your Trades!

Do you take responsibility for your trading? We know that you will when it goes the right way, your analysis went well, you knew the movements of the markets on that one. What about when they go the wrong way? We know that some news events come out of nowhere and there is nothing you can do about it, but the reaction and what you do after the news events you certainly can influence. Following a trade loss, do you blame the markets? Your broker? Or the charts? Well you shouldn’t, the news is out fo your control, but everything after that was your doing.

It is easy to blame others or outside influences, but how is that going to help us improve? If we simply blame others, we won’t be looking at it as a learning opportunity, you should already be using a trading journal where you jot down everything you do, using this will help you understand where the trade went wrong and what you can do differently, a far better alternative to just blaming something else.

It is also human nature to look to others when something goes wrong when you make a mistake, you will naturally look for something to blame as this helps prevent you from the psychological strain of a failure, but again, blaming someone else won’t help you improve, you need to take responsibility for your own reading.

If we take a look at traders who copy trading signals or use a copy trading service, they are simply ignoring any form of responsibility for their trading. If a signal goes well, that trader will claim that they chose a good signal to follow if it goes wrong, they will shrug off the loss and put it down to a bad signal provider, after all, it was their trade, I just copied it. They will then go on and look for another signal provider to follow. The trader has no idea what the trades are made and no idea why they won or lost. It is all about having none of the stress and responsibility of losing.

There are others that will simply blame the markets outright, put in a trade but it then gets stopped out, it is the economic news falt, it is the whales stop loss hunting, it is everything but their fault, not a great way to trade and certainly not a great way to learn.

There are then those people that use Expert Advisors (EAs) to do their trading fro them, any losses from the EA are obviously the fault of the EA and its bad programming, nothing to do with the choice to use it or to give all responsibility to he robot instead of yourself. What are you earning fro musing the EA, how has your knowledge of trading improved?

You should never try to avoid the responsibility of a loss, by taking it onto yourself, you are giving yourself the perfect opportunity to learn and develop yourself to be a better trader. While it doesn’t always feel great to take responsibility for a loss, it is paramount that you do it, much like anything in life, a loss is a learning opportunity and the only way to improve is to fail.

Categories
Forex Fundamental Analysis

What Is Business Confidence & How Does Its News Release Impact The Forex Market?

Introduction

Business Confidence is the most important leading indicator for economic growth that is closely watched by traders, investors, economists, and even policymakers. Business Confidence survey provides the take of the business sector on their near-term prospects that helps us understand what the oncoming quarterly conditions will be.  Business Confidence Indexes are crucial for fundamental analysis.

What is Business Confidence?

The economy can be broadly categorized as the private and public sectors. The public sector involves all the government and central bank-related offices and industries. The private sector is composed of two main participants: Businesses and Consumers. In the United States, Businesses make up 34% of the private sector. The business sector is again broadly divided based on output as the Manufacturing Industry and Services Industry. The Manufacturing Sector is primarily related to industries that manufacture and sell physical goods. The Services Sector deals with the Services that are essentially non-physical and are challenging to quantify.

The Manufacturing Sector makes up 20% of the GDP, and the remainder 80% is attributed to the Services Sector. Since the business industry is the real economic wealth of the nation, it is the primary source of the Gross Domestic Product. Hence, Business Confidence Indexes can give us an excellent assessment of the upcoming economic trends in the Industry.

Business Confidence Indexes are based on surveys taken from some of the largest industries in both the manufacturing and services sector, asking them about their current business conditions and their outlook about business activity in the coming 2-3 months.

In the US, the publishing of the Manufacturing Purchasing Manager’s Index is done by the institute of supply management every month. It is a survey of about 400 largest manufacturers in the United States of America. It also publishes a Non-Manufacturing Index, which is the same index associated with the Services Industry.

Note

The approach may vary amongst the surveying companies. For example, the National Australia Bank Business Confidence Index is computed on a net balance basis.  In it, the surveyed companies are asked whether there is a positive or negative outlook. Their question would be per se, “Excluding normal seasonal changes, how do you expect business conditions of your industry to change in the next three months?”. The result is calculated as positive, less negative responses, which is the net balance.

How can Business Confidence numbers be used for analysis?

The question that is generally asked in the study is related to MOM changes in the Business Activity, New Orders, Production, Employment, Deliveries, and Inventories with equal weightage.

The Manufacturing PMI and Services NMI ratings lie within the range of 0-100. A score above 50 implies an expansion in the economic activity, and a score below 50 implies contraction. Although across the globe, different survey companies follow different metrics, like the NAB Business Confidence Index follows a zero-based scale, where a score above zero indicates positive sentiment and less than indicates a bearish sentiment.

Business Confidence or Business Sentiment is analogous to Consumer Sentiment, except that the figures are more fact-oriented, as it takes into account the business inventory count, estimates, current production levels, etc. It is asking the business owners about their outlook on the economic prospects in the short-term.

Business Confidence Surveys are very important for policymakers also. They use these statistics to intervene by fiscal and monetary policy reforms to combat deflationary threats, if any.

Impact on Currency

Historically, in the United States, PMI and NMI have predicted GDP growth with 85% accuracy 12-months ahead of time, as illustrated in the below ISM PMI plot against quarterly Real GDP growth. The correlation of business confidence with economic growth is strong, and hence, it is an important leading economic indicator.

Market volatility is sensitive to Business Confidence Indexes. Significant moves in the index cause volatility in the market. It is a high impact leading indicator. High business confidence translates to improving economic prospects, which will translate to higher GDP prints and currency appreciation.

Business Confidence Announcement – Impact due to news release

Till now, we have comprehended the Business Confidence economic indicator. It is essentially used to monitor output growth and to anticipate turning points in economic activity. Numbers above 100 suggests increased confidence in near future business performance, and numbers below 100 indicate pessimism towards future performance. Therefore, investors give a reasonable amount of importance to the data while analyzing a currency.

In today’s lesson, we will look at the NAB Business Confidence Index that is a key measure of Busines Confidence in Australia, published monthly and quarterly by National Australia Bank (NAB). The survey is that is carried out covers hundreds of Australian companies and few banks which measures business conditions in the country. A positive reading can be interpreted as good for the currency and equities, while a negative reading can be interpreted as a warning sign to the government, which leads to a build-up of bearish positions in the currency.

AUD/USD | Before the announcement

We shall start with the USD/JPY pair to observe the change in volatility due to the news release. The above price chart shows the state of the market before the news announcement, where we see the market is in a strong downtrend and the price currently is at the lowest point. We need to wait for a price retracement to the ‘resistance’ to take a ‘sell’ position in the currency pair. Until then, we will see what impact the news makes on the chart.

AUD/USD | After the announcement

After the news announcement, the price moves lower and volatility increases to the downside. The Business Confidence reading was better than last time, but it was good enough to drive the price higher. Therefore, traders sold Australian dollars soon after the release and weakened the currency. In order to take a ‘sell’ trade, as mentioned earlier, we need a price retracement before we can join the trend.

AUD/NZD | Before the announcement

AUD/NZD | After the announcement

The above images represent the AUD/NZD currency pair, where we notice a resilient move to the downside a few minutes before the news announcement. Currently, the price is at a point from where the market had reversed earlier to the upside. Thus, this could serve as a strong ‘support’ area from where we can again expect buying pressure. Depending on the change in volatility due to the news release, we will take an appropriate position.

After the news announcement, the price sharply drops, and we witness a big fall in the market. We can ascertain that the market was a much better Business Confidence reading, which is why traders went ‘short’ in the currency. However, this was immediately retracted by a bullish candle that recovered all the losses.

EUR/AUD | Before the announcement

EUR/AUD | After the announcement

The above images belong to the EUR/AUD currency pair. We can see that before the news release, the market is in a strong uptrend signifying the great amount of weakness in the Australian dollar since it is positioned at the right-hand side of the currency. Since it is an uptrend, we will look to buy the currency pair after the price retraces a ‘support’ or ‘demand’ area.

After the news release, the market continues to move higher, and the ‘news candle’ closes with some bullishness. We observe a similar impact of the Business Confidence numbers announcement on this pair as well, which initially weakens the currency but finally strengthens it. All the best!

Categories
Forex Psychology

Self-Calming Techniques for Forex Traders

Forex trading is known to cause a rollercoaster of emotions – from excitement and self-fulfillment, to anxiety and bitter disappointment, along with every other emotion in between. Sometimes, the best thing to do is to step away and take a break from trading until you can get your emotions under control. However, many traders don’t want to miss out on opportunities, so taking a break from trading might be difficult. One of the best ways to get yourself more level-headed is to figure out a self-calming technique that works for you. Some of these can be practiced while trading, others might require you to step away for a short time. Either way, these techniques can help clear your mind so that you can get back to trading. Here are some popular calming techniques:

Practice Conscious Breathing

Perhaps one of the quickest ways to calm yourself after a big loss is deep breathing. This is a simple, yet effective solution that helps you get your head back in the game without missing anything. You just need to take a few slow deep breaths to expel tension from your body. Most people recommend taking about 10 deep breaths. Then, you can get back to trading almost immediately.

Listening to Music

Music can really help to influence our emotions, so calming or happy, upbeat songs can help out when you’re feeling down. This is also something you can do while trading, so you don’t have to worry about missing a good opportunity. Just try not to turn up the music too loud, otherwise, it could become distracting. You’ll also need to pick the right kind of tune and be sure to avoid depressing songs.

Try Positive Self-Talk

When you’re trading, is your inner voice calm and relaxed? Would you want someone else to talk to you in the same way you talk to yourself? If the answer is no, then you need to be kinder to yourself. Tell yourself that everything is going to be ok and that everyone loses sometimes. Don’t beat yourself up when you make a mistake – everyone does.

Try Meditation or Yoga

Many people swear by calming exercise techniques like yoga and meditation. These practices aren’t only good for dealing with the stress of trading and might actually help with other stressful aspects affecting your life. Of course, this one does require you to step away from your device for a while. In some cases, it might be better to unplug completely for a while after all. Then, you can come back for a fresh start with a clear mindset and more focus.

Use Grounding Techniques

Grounding is an easy task that involves focusing on the physical world instead of your own inner thoughts. This is another quick solution that can help calm anxiety or fear that might be caused by forex trading. Here are a couple of examples of grounding techniques but know that there are more examples online or you can even come up with your own:

  1. Name 5 things you can see, 4 things you can hear, 3 things you can immediately touch, 2 things you can smell, and one thing you can taste at that moment.
  2. Count to 10, or say the alphabet.
  3. Clench and release your fists.
  4. Place a cool washcloth on your forehead.

As you can see, these are all simple but effective ways to calm yourself down and they can be done right from your trading station.

Categories
Forex Fundamental Analysis

GDP from Construction – Exploring The Fundamental Forex Driver

Introduction

Construction is the very first phase of an expected economic growth, which is more evident in the developing economies compared to the developed economies. New buildings, infrastructures, renovations are an indication of an expanding economy. GDP from construction is an important economic indicator to assess financial health and future economic expansion trends.

Construction

It is a part of the Secondary (Industry) Sector of an economy.  Construction refers to building and infrastructure works in all areas. The Construction Sector includes all physical making of infrastructures like bridges, transportation systems (roads, railways), dams, irrigation systems, naval ports, airports, pipelines, apartments, buildings, houses, commercial buildings, corporate structures, etc.

How can the GDP from Construction numbers be used for analysis?

The Construction Industry’s Economic Output is a significant economic indicator that is closely watched by both the private and public sectors. It is especially crucial for developing economies like China, as it is their main contributor to GDP. The GDP from Construction figures assist Central Authorities in policy reforms & economic-decisions.

Growth is essentially a process of invention of new things and discarding the old inefficient ones. Construction, in this sense, is nothing but that. It involves the erection of new buildings, renovations, expansions of the infrastructures that are currently existing. Increased GDP from Construction involves more people getting employed, better wages in the sector, and the extra demand for raw materials, etc. Hence we can say that the act of construction itself has a ripple effect on the economy.

Secondly, the GDP from the construction of corporate infrastructures or commercial structures implies that the constructed structures will be used for further economic activities. For example, a company doubling its company size is planning to double its staff and correspondingly the business that it generates. Hence, GDP from Construction figures improvement is indicative of an improvement in many other sectors.

All these improvements correlated with GDP overall also stimulate consumer confidence and encourages consumer spending, which further stimulates the economy and boosts growth. The Secondary Sector is composed of Industrial Output and Construction Output. For most countries, Industrial Output will be the dominant contributor to the GDP from the Secondary Sector.

We analyze GDP from Construction to understand the associated implications that more economic growth will be followed. For example, the construction of new power plants, or manufacturing industries, would show higher GDP from Construction this year. But the subsequent years, we will see higher GDP due to the newly added Industrial Outputs.

Hence, GDP from Construction figures can be used to assess future economic growth. Everything that is constructed is most likely to bring revenue through its usage in the future. Hence, GDP from Construction improvements can be a leading indicator for further improvements in GDP down the line.

The global Construction Industry makes up 13% of the World GDP, which is more than the Agriculture sector, which is about 7% of the World GDP. It means, overall, the global economy is improving at a rapid pace, with the Industrialization of many economies. It is forecasted to grow to 15% in 2020. China, India, and Japan are flourishing in this era with rapid Industrialization and achieving high GDP Growth Rates ranging from 5-20% in recent years.

GDP from construction can be used by investors to know which countries are transitioning from Developing Economies to Developed Economies. As GDP from Construction increases, it would be followed by GDP growth through increased Industrialization. Further down the line, the economies would transition to the services Sector as their main contributor to GDP.

Impact on Currency

The GDP from Construction is not a high impact indicator when compared to measures like GDP and GDP Growth Rates. GDP from construction does not portray the entire picture of the economy. However, it can be an essential tool for the Central Authorities to keep track of Construction Sector performance and its relative implications over the economy.

What construction is occurring can also serve as an indication of the economy type going to be built over the coming years. But, for the international currency markets, it does not serve as a useful indicator. It is a proportional and lagging indicator. Higher GDP from Construction is great for the economy and its corresponding currency, and vice-versa.

Sources of GDP from Construction

For the US, the corresponding reports are available here – GDP -BEA, GDP by Industry – BEA, and Construction – GDP. World Bank also maintains the Construction and Industrial Sector as a percentage of GDP on its official website, which can be found here – Industrial Sector (including construction) – World % of GDP. GDP from construction can also be found here – GDP Construction – World – Trading Economics.

GDP from Construction Announcement – Impact due to news release

The construction sector is one of the fastest-growing sectors today that has a great impact on the economy of any nation. Construction is one crucial sector that contributes to the economic growth of a country. The government and other regulatory authorities have always shown interest in this segment by investing significantly in various parts of the sector. Naturally, it will contribute to the GDP of a country and influence the reading released quarterly and monthly. When talking about the fundamental analysis of a currency or stock, investors make investment decisions based on the GDP and not on contributions made by individual sectors.

Now let’s analyze the impact of GDP on different pairs and witness the change in volatility due to the news release. For this purpose, we have gathered the latest GDP data of Japan, where the below image shows the fourth quarter’s GDP data released in March.

AUD/JPYBefore the announcement

We will first look at the AUD/JPY currency pair to observe the impact of GDP announcement on the Japanese Yen. In the above picture, we see the market has crashed lower due to some other news release, and currently, the price is at its lowest point. This means there is a great amount of selling pressure in the market, or sellers are dominant. In such a market situation, it is advised not to carry any position in the market before the news release.

AUD/JPY | After the announcement

After the news announcement, the price sharply moves higher and closes as a long bullish candle. This means traders sold Japanese Yen soon after the news release as it was below expectations and lower than the previous quarter. The volatility did increase to the upside for a while, but it did not sustain as the Japanese Yen was showing a lot of strength. One should trade after the market shows signs of trend continuation or reversal and not just based on the GDP data.

GBP/JPY | Before the announcement

GBP/JPY | After the announcement

The above images represent the GBP/JPY currency pair, where we see that the market has strongly moved lower as indicated by two big bearish candles before the news announcement. This means the Japanese Yen has gotten strong recently due to some other fundamental reason, and we cannot ascertain if this will continue or not. As volatility is very high, one should not take a position in the currency before the news release.

After the news announcement, volatility spikes to the upside, and the ‘news candle’ closes with a great amount of bullishness. Even though the price moves higher by a lot, it did not go above the moving average. The market has reacted adversely to the news announcement as the GDP was lower than last time and also below what was forecasted. If the price does cross moving average, this means the downtrend is still intact.

NZD/JPY | Before the announcement

NZD/JPY | After the announcement

The above pictures are that of the NZD/JPY currency pair, where we see a major crash in the market before the news announcement, which is visible in the first image. This pair also shows similar characteristics as in the above currency pairs, where the Japanese Yen has strengthened greatly. Ideally, we should be looking to sell the currency pair after a suitable price retracement.

After the news announcement, the market goes higher so much that it almost retraces the previous bearish candle, resulting in some weakness in the Japanese Yen. As the GDP data was weak, it brought disappointment in the market where traders sold the Japanese Yen and bought the base currency. Cheers!

Categories
Forex Price Action

Trend Line Trading: Keep an Eye at New Highs/Lows

In today’s lesson, we are going to demonstrate an example of trendline trading. The trendline trading is one of the most consistent trading strategies. Thus, a trader can make profits by properly dealing with how trends develop. In today’s example, we will demonstrate a chart with an up-trending trendline, where the price goes down trendline’s support. However, it produces a bullish reversal candle and ends up offering a long entry. Let us get started.

The chart shows that the price heads towards the North upon finding its support. It has several higher lows that can be used to draw trendlines. However, before drawing a trendline on a chart, we have to spot out the most significant higher lows to draw an upward trend line and, conversely, the most significant lower highs to draw a downtrend line. Over here, look at the two points with the ‘right’ marks. Let us proceed to the next chart to find out how it looks with a drawn trendline.

We have drawn the trendline by using two right marks. Ideally, traders are to wait for the price to come at the level of support (trendline’s support) and get a bullish reversal candle to go long in the pair. At the last swing low, the price approaches at the level of support. However, the chart does not produce a bullish reversal candle at the level of support. They may wait for the price to come right at the drawn trendline’s support.

The price comes down. One of the bearish reversal candles closes below the level of support. The sellers may become interested here that the price may end up making a bearish breakout. If the next candle closes below the trendline, the sellers may consider having a breakout. Let us find out what happens.

The next candle does not close below the trendline. It comes back in. It means that the price obeys the trendline’s support. The last candle comes out as a bullish Marubozu candle forming by testing the trendline support. The buyers may go long in the pair again and push the price towards the last swing high.

The price heads towards the North at a moderate pace. As far as the bullish reversal candle is concerned, it is supposed to create more buying pressure. Anyway, the price hits buyers’ first take profit target. It may continue its bullish journey if it makes a bullish breakout at the last swing high. If it does not make a new higher high but comes back at the trendline’s support, the price may get choppy. If it makes a new higher high, the trendline becomes active, and the buyers may wait to go long from the trendline’s support again.

Categories
Forex Psychology

The Dangers of Envious Trading

Have you ever seen a video, social media post, or anything else posted by someone who claims to be a successful forex trader? Often times, these posts show that those traders are living a luxurious lifestyle. You’re likely to see big beautiful homes, fast sports cars, photos from multiple vacations, expensive clothes, and other luxuries that these people are able to purchase. It’s easy to look at this and think that you want that for yourself; after all, there’s nothing wrong with being ambitious.

So, maybe you’ve already started trading, or you’re considering it. Perhaps you even know someone or have a family member that trades. Forex trading can be a profitable income source, but you aren’t going to become rich overnight from doing it. You may already be disappointed with your results, or maybe you’re setting yourself up for failure by entering with unrealistic expectations. Here are a few things to think about when it comes to being envious over the success of other traders:

Many of the people you see promoting how rich trading has made them, probably have income coming in from other sources. They might own a business or even work as a CEO at a company.

A lot of these people have been trading for quite some time. It may have taken them years or even decades to become millionaires. If you have a big deposit, you might get there quicker, but don’t buy into get rich quick promises. It takes time to make it to the top.

It takes a large deposit to make a lot of profits. It’s true that we all start from the beginning. However, some of us start with $5, while others might have $25,000 to invest.

Some of these people might get paid for attracting new traders. Or maybe they have a book to promote. This makes them more likely to exaggerate their results.
This doesn’t mean that you can’t get there someday, only that you need to have realistic expectations before you begin. Giving into envious feelings can be dangerous. It might lead you to make trading decisions that aren’t well-thought-out, to invest money that should have been used on necessities out of eagerness to turn a profit, or you might even fall for a scheme that claims it will get you rich quick.

Some traders might hear someone they know talking about their strategy and try to hastily copy it, only to lose money because they don’t know exactly what to do. Being envious of a more successful trader also might lead you to downplay your results. If you’re making a profit, then you’re off to a great start. Don’t put yourself down because you only made $5 – celebrate those small wins that will one day become much larger gains. Besides, making a small profit is better than losing money.

If you allow your emotions to affect the way you trade, you’re destined to make mistakes. Remember that it is ok to want to model another trader’s success; you just need to understand that it is going to take time and invested money to get there. Instead of feeling the urge to trade more to reach their level, spend more time learning about different strategies and concepts related to trading, and consider keeping a trading journal to monitor your progress. It’s true that trading can make you rich – eventually. If you begin with realistic expectations and keep negative emotions like envy at bay, then you’ll have the best chance of success.

Categories
Forex Risk Management

The Importance of Risk Management in Trading

While forex trading comes with several perks, like being your own boss, flexible hours, and the opportunity to become wealthy, the biggest drawback is the risk factor. There’s always a chance that you’ll lose money, no matter how well-educated you are. If you want to minimize your losses as much as possible, then it is crucial to have a good risk-management strategy working for you. Otherwise, you could quickly become one of the many beginners that walk away from trading for good.

The first mistake many beginners make is overleveraging their trades. If a broker offers a leverage of 1:1000, that means you can multiply every $1 you’ve invested times a thousand. This would allow you to make a $1,000 trade with only $1 in your trading account. Leverage is one of the biggest draws to forex trading since it allows you to increase your investment power. However, you shouldn’t use the highest leverage just because you can, otherwise, it can backfire and cause large losses. Leverage is often referred to as a double-edged sword, and beginners often find themselves on the sharp edge. Resisting the temptation to use higher leverage at first is crucial for beginners to see success later.

Monitoring the size of your positions is another important step. Many professionals recommend that you only risk 1% of your account’s balance on any one trade. This may not equal a large amount of profits, but it helps to reduce losses if things don’t go in your favor. Remember that winning even a small amount is better than losing a lot of money. Setting a stop-loss order is a precaution that causes the trade to close if a certain loss level is reached. Traders would need to figure out how many pips they want to risk and then set their orders. Beginners should also recognize the point of when to take profits. Putting a close order position in place to take profits at the appropriate level of resistance or using candlestick recognition or moving average crossover strategies can help accomplish this.

One of the best things you can do to set yourself up for success is to have a good trading strategy. The internet is filled with different kinds of strategies that suit the needs and skill levels of every different kind of trader. Having a plan to follow will help you know what to look for and you can even monitor and improve your strategy with a trading journal.

Managing your risks in forex trading will keep you afloat where others have failed. Setting a good trading plan without risking more than a small percentage of your capital sets up a firm foundation. Then, you can set stop-loss orders and take profit levels to further minimize your risk. Choosing appropriate leverage is another important factor. If you go into the market without a strategy, risking 10% or 20% per trade, then you will likely wipe out your trading account very quickly. Likewise, if you’re a beginner trading with a 1:1000 leverage, you’re more likely to lose everything. Using the above risk-management strategies (and others) will help you to avoid losing all your money as it provides a cushion against losses.

Finally, know that you shouldn’t base your risk-management plan from this article alone. Do more research online and read about the ways that other traders minimize their risks. You’ll need to read about stop-loss orders, trailing stops, and so. Don’t make the mistake of using leverage that is too high, never risk more than a small percentage on any one trade, and be sure to do more thorough research to help with your strategy and other risk-management precautions.

Categories
Forex Forex Psychology

The Problem with Overconfidence in Trading

Confidence is usually thought of as a good emotion – if we are confident in ourselves, we feel reassured that we can do anything. This is a great outlook on life, but when it comes to trading, confidence can be a negative emotion. Let us explain why.

Once traders become confident, they tend to become less receptive to criticism and less likely to spend time educating themselves. Some traders might feel that they are on a lucky streak, not unlike gambling. And just like with gambling, this often leads traders to take more risks and to lose huge amounts of money. There’s nothing worse than feeling on top of the world – and then losing it all due to your own stupid choices.

Overconfidence in trading results in something that has been labeled ‘King Kong Syndrome’. A trader suffering from this would experience a series of winning trades, which would result in them choosing to trade more. As they win more and more, those traders pay less attention to the market and convince themselves that they are riding on luck. The winning streak then comes to an end with a difficult reality check where those traders lose everything. The traders that are most likely to fall victim to this demise are beginners that don’t have a lot of trading knowledge. Using too high of a leverage or a huge lot size can contribute to the losses that these traders will experience. Many beginners have emptied their trading accounts because of this and give up on trading for good.

King Kong Syndrome is tied in with trading psychology, which involves the way that our emotions change our trading decisions. Fear and greed are major contributors to how we trade, but excitement and obvious confidence in oneself seems to be the major emotions connected to King Kong Syndrome. Remember that anyone can make this mistake, it isn’t only something that affects beginners. In fact, research shows that men – especially single men, are more likely to fall victim to overconfidence than women are. Beginners may be more prone to this phenomenon, but it can affect any trader out there.

So, how does one avoid making these mistakes and falling victim to King Kong Syndrome? First, you need to understand that confidence in your trades is important, but you shouldn’t feel overly confident. Conducting research and paying attention to fundamental and technical analysis is important, and they can help us feel confident about the trades we’re about to make. But we shouldn’t be too confident – no matter how much research you’ve done, you aren’t guaranteed to get the results you’re expecting. Always set a stop loss and watch how much you’re risking, no matter how much information you’ve gathered about the market.

Simply being aware of this problem is another way to avoid it. Having a good trading strategy also plays an important role. Without a good strategy, you’re basically just gambling with the outcome of your trades. Your plan needs to account for different market conditions and long-term outcomes. Don’t fall victim to overtrading, as most traders amass profits from making smaller, safer trades.

Never make the mistake of thinking that you’re too good to learn something new. No matter how long you’ve been trading, you can always get better and there is more information to learn. Those that give up on trading aren’t always beginners. Many of those traders once considered themselves to be experts or unstoppable, but a few big gambles and the King Kong Syndrome can change that.

Since King Kong Syndrome is tied to one’s emotions, you need to think about the emotions that you’re feeling when trading. If you feel overly anxious, excited, greedy, or anything else, take a break. It’s best to trade with a level head so that you can see the big picture without making hasty decisions. And this goes for overconfidence too – if you’re on a winning streak and you see yourself getting a big head, it may be time to clear your head and take a break. Remember that confidence is important, but too much confidence can cause one to risk too much and make bad decisions.

Being a successful trader involves doing a lot of research and having a well-thought-out trading plan with minimized risks. Good traders can control their emotions and never let them cause bad trading decisions, or they know when to walk away when their emotions are changing the way that they think. Don’t make the mistake of assuming that you’re the best trader out there and never rely on luck. Being a profitable trader comes down to strategy – luck is only an illusion and every winning streak will come to an end if those decisions aren’t made based on facts and data. Be sure to do your research and don’t allow yourself to wipe out your trading account because of King Kong Syndrome.

Categories
Forex Forex Psychology

The Psychology Behind Fear in Forex Trading

Trading psychology studies the ways that one’s emotions can affect their trading habits. From excitement and greed to fear and anxiety, emotions can wreak havoc on our results if we let them. Here are a few examples of ways that emotion can interfere with your trades:

A trader experiencing crippling anxiety, also known as analysis paralysis, enters trades too late or fails to enter a winning trade altogether, even though they knew it was a good move.

A trader that is excited might fail to exit a trade when they should because they are feeling lucky. This could cause the trader to stay in the trade for too long.

A trader that is feeling greedy might want to make every cent possible and could stay in the trade past their take profit goal. Otherwise, the trader might close out the trade after incurring a very small loss because they don’t want to lose anything more.

While all of these problems can cause serious problems, fear is probably one of the worst emotions that traders can experience. Fear causes us to doubt ourselves and our capabilities. Have you ever allowed fear to interfere with one of your trades? If not, then think of the following ways that fear may have played a role in a bad decision you’ve made:

Have you ever failed to enter a trade even though you knew it was a good move?

Have you ever experienced a series of losses that almost made you feel paralyzed to make another trade? Did you feel as though trading was riskier than normal or your luck was bad?

Has the thought of losing money ever stopped you from making a move that you knew you should make?

Have you ever exited a trade too early because you feared the market would move in the other direction, only to watch that trade go on to be a winner?

If you answered yes to any of the above, then chances are that fear has in fact affected you while trading. There are several reasons that could cause a trader to feel fearful. Losing money is perhaps the most prevalent. After all, it takes hard work to make that money and the thought of losing even some of it is scary. Some fear failure altogether and cannot stand the idea of wiping out their account and failing as a trader. Making a mistake, failure, and other personal issues can tie in with trading because of the uncertainty of it all. Then, anxious traders might also doubt their abilities and overthink their strategy even when it’s a solid one. There are many different factors that can cause fear in a trader, and all of them have to do with the way that person thinks in general and while under pressure.

The first step to solving this problem is realizing that it is affecting you. If you’re reading our article, you’re likely already aware that fear is interfering with your trades. Fear is a powerful emotion that clouds our judgment, but there are ways to stop it from hurting your trades.

If you’re experiencing both fear and anxiety, then you likely have a common problem known as analysis paralysis. Traders experiencing this are like deer caught in headlights. They can’t decide in time, so they either enter trades way too late, or they fail to enter them at all because they cannot make up their mind.

There are ways to overcome this, however. Many suffering from this problem of overanalyzed data. They might use too many indicators, for example. Simplifying the number of indicators you’re using or even trading without them are good ideas if you have a ton of indicators running at once. Having a good trading strategy is another measure you can take to overcome the fear and anxiety behind analysis paralysis. Or you can take other measures, like meditation or yoga, music, or another relaxation technique to help calm yourself. There are lots of resources online related to this problem and how to manage it.

Once you’re aware of the ways that fear is affecting you, you can figure out how to use it to your advantage. Understand that highly driven people are usually driven by fear. If you don’t want to fail, then why not put forth every effort to be the best trader you can be? Instead of being paralyzed by fear, you should let it inspire you to do better. Learn more, perfect your trading strategy, figure out the best ways to analyze data, and so on. Embracing your fear can help you to use it to your advantage.

Every trader should know that fear is an understandable emotion that can stem from several different places when one is trading. Whether you’re fearing failure, worried about losing money, or something else, the first step is identifying where this emotion is coming from. Once you’ve done that, you can work on getting better. You might not be able to get rid of your fear entirely, but there are ways that one can use it to their advantage and continue on to trading success. If you’re suffering from analysis paralysis, then there are actually several different methods that might help you overcome that. At the end of the day, every trader needs to know that fear doesn’t have to interfere with their trades or bring an end to their trading career as long as they learn how to manage it.