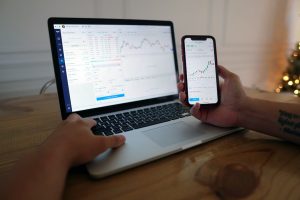
In the world of forex trading, a daily chart bar is a graphical representation of the price movement of a currency pair within a given day. This type of chart is widely used by traders to analyze the performance of a currency pair over a longer period of time. But, when does a daily trading chart bar begin and end in forex? In this article, we will delve deeper into the concept of daily chart bars and explore the factors that determine their beginning and end.
Understanding Daily Chart Bars
Before we dive into the topic, it’s important to understand what a daily chart bar is and its components. A daily chart bar, also known as a daily candlestick, is a visual representation of the price movement of a currency pair within a single day. It consists of four main components: the open price, the high price, the low price, and the close price.
The open price is the first price at which the currency pair was traded during the day. The high price is the highest price that the pair reached during the day, while the low price is the lowest price that the pair reached. Finally, the close price is the last price at which the pair was traded during the day.
Each of these components is represented by a vertical line, which is known as the bar. The open price is represented by a horizontal line on the left of the bar, while the close price is represented by a horizontal line on the right of the bar. The high and low prices are represented by the top and bottom of the bar, respectively.
Factors That Determine the Beginning and End of a Daily Chart Bar
The beginning and end of a daily chart bar are determined by several factors, including the time zone, the trading platform, and the broker. Let’s take a closer look at each of these factors.
Time Zone
The time zone is one of the most important factors that determine the beginning and end of a daily chart bar. The forex market operates 24 hours a day, five days a week, across different time zones. As a result, different brokers and trading platforms may use different time zones to calculate their daily chart bars.
For example, a broker based in New York may use the Eastern Standard Time (EST) to calculate its daily chart bars, while a broker based in London may use the Greenwich Mean Time (GMT) to calculate its daily chart bars. This means that the beginning and end of the daily chart bar may differ depending on the time zone used.
Trading Platform
The trading platform used by a trader is also a factor that determines the beginning and end of a daily chart bar. Different trading platforms may have different settings for daily chart bars, which can affect the way they are displayed.
For example, some trading platforms may display daily chart bars that begin and end at midnight, while others may display daily chart bars that begin and end at the close of the New York trading session. It’s important for traders to check the settings of their trading platform to ensure that they are using the correct settings for daily chart bars.
Broker
The broker used by a trader is also a factor that determines the beginning and end of a daily chart bar. Different brokers may have different trading hours and time zones, which can affect the way the daily chart bars are displayed.
For example, a broker based in Australia may have different trading hours and time zones compared to a broker based in the United States. This means that the beginning and end of the daily chart bar may differ depending on the broker used.
Conclusion
In conclusion, the beginning and end of a daily chart bar in forex are determined by several factors, including the time zone, the trading platform, and the broker used. Traders should be aware of these factors and ensure that they are using the correct settings for daily chart bars to effectively analyze the performance of a currency pair over a longer period of time. By understanding these factors, traders can make informed decisions and improve their chances of success in the forex market.


