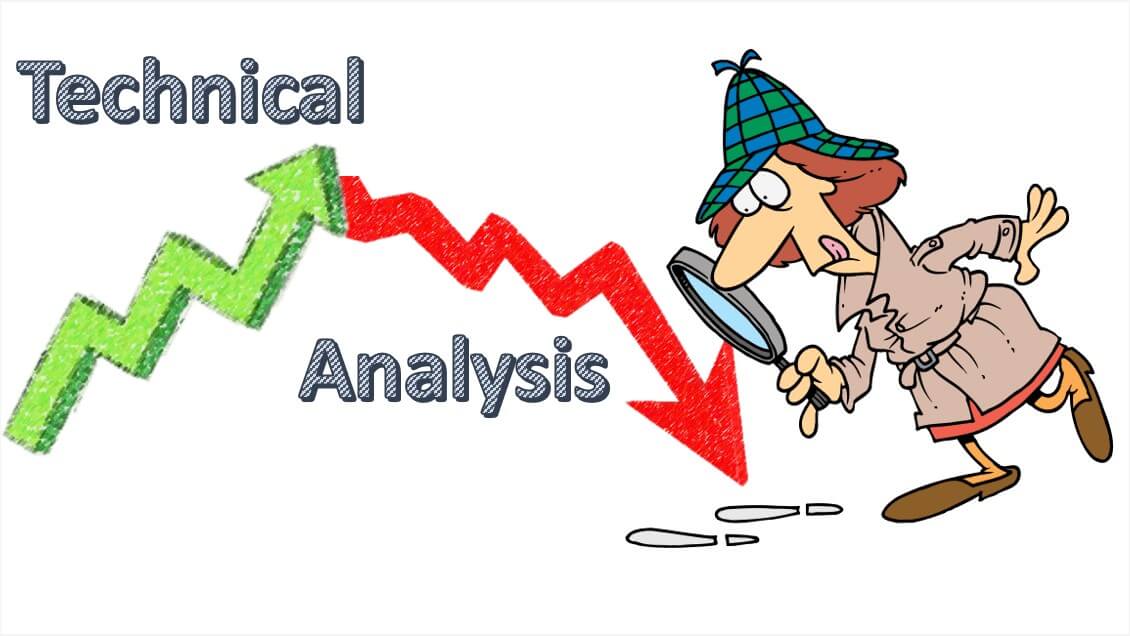
Technical Analysis involves studying the historical price action to determine current trading conditions and potential price movements in the forex market. Traders that use this approach are known as technical analysts or chartists and believe that everything you need to know can be found in the charts, so they spend a lot of time poring over charts looking for data. Technical analysts look at indicators, technical studies, and other tools for patterns that have formed in the past with the idea that history tends to repeat itself. Here are a few more facts:
- Traders look for major support and resistance levels that have occurred in the past so that they can base their trades around that historical price level.
- Technical analysts make decisions that are based more on probability than predictions.
- The process of technical analysis bases decisions on what will possibly occur based on past patterns, but nothing is ever certain in the forex market.
- Technical analysts are often referred to as chartists because many of them spend a great deal of time studying charts each day.
- Technical analysis can help you determine when and where to enter the market, along with when to get out.
- Many other traders look at fundamental analysis, which places a great deal of importance on economic headlines and news reports.
It’s important to remember that technical analysis is subjective, meaning that one can interpret data in different ways. Those that want to practice this need to understand Bollinger Bands, Fibonacci, and other terms that relate to these studies. You’ll obviously need some experience studying and interpreting charts before you’ll be able to practice technical analysis effectively.
Technical analysts also place a great deal of importance on trading indicators. While these tools can be effective, traders should know that many indicators don’t work correctly and can cause you to lose your money, especially if they are offered by an individual or a company for a price. Always be sure to conduct research before purchasing any indicator and it’s a good idea to test these before using them on your live account. You’ll also want to avoid cluttering your charts with too many indicators – instead, focus on finding a couple of really good indicators or trade without them.
The theory is based on the fact that although the market is chaotic, it is not completely random. Even though nobody can know for sure what is going to happen next, mathematical chaos theory has proven that identifiable patterns tend to repeat despite the chaos associated with the market. While nothing is guaranteed, the technical analysis method has been proven to increase one’s probability of making favorable trading moves. If you want to practice this method, be sure that you can read charts and understand advanced concepts related to technical analysis.


