Japanese candlestick patterns are a popular forex trading tool but are they really useful or can they be more of a burden than an asset? Read on to hear both sides of the story and get insights you won’t find elsewhere.
Storytelling Candlesticks?
The first thing to say here is that this is a look at how forex traders use candlestick patterns as a technical tool and not about the use of Japanese candlesticks as an alternative to bar charts. Compared with the more traditional bar charts – that were used more heavily in the past – Japanese candlestick charts have only a slight advantage. Overall, both types display the exact same information, with the candlesticks perhaps making it a little easier to identify patterns and some people will also tell you that they are just easier to read and neater.
The other thing to remember about candlestick charts (though this does also apply to bar charts) is that – unlike, say, a line chart – Japanese candlesticks are telling you a story about how the price moved over a given time period. Let’s say you are trading using the one-day chart. Well, with a candlestick chart, for any given day you will know where the price was when trading opened, where the price peaked, where it bottomed out, and where it closed – all just by looking at a single candle for a second or two! All on its own, that’s magic. But the real story behind Japanese candlesticks isn’t about how they display price movements. It’s a little more involved than that.
History Lesson?
Japanese candlesticks go back a long way. Now, it is really not very interesting to most traders to read long histories of where their trading tools come from – most people just want to know how they work or if they even work at all. That’s pretty easy to understand and, in most cases, the history of an indicator or any other tool isn’t particularly fascinating and is generally pretty irrelevant. With Japanese candlesticks, it is actually pretty useful to know where the technique originates from, so as to better understand the role it plays today.
So, the story behind Japanese candlesticks is that they were originally developed in Japan a couple of hundred years ago to help traders track the price of rice on their own internal markets. They were popularised in the rest of the world in the early 90s when a guy called Steve Nison who wrote a hefty book about them and how recognizing patterns in the candlesticks can be used to analyze patterns in the prices of equity, commodities, and forex. The key part of the book’s success back when it was originally published is that it detailed how these patterns can help traders to discern, if not always predict, possible future price movements.
Supply and Demand
Some traders say that being able to use candlesticks to predict what’s coming down the road in terms of price movements is more of an art than a science. That may or may not be true but, if it is, it is definitely an art that you can learn. As we said before, each candlestick on your chart is telling you a story but put together they are telling you a larger piece of that story. Learning to recognize these patterns and being able to understand the story your candlesticks are telling you is where the art comes in. But one thing is for certain, the main characters in the story are always supply and demand. The story arc is always about the balance between sellers and buyers.
When it comes to trading, it is easy to forget the fundamentals that underpin how the market works. We all get lost in indicators, tools, charts, news events, and a plethora of other distractions and we just forget that the fundamental elements that drive price in one direction or the other is the balance between buyers and sellers. In short, supply and demand. Now, of course, there are a million factors that drive supply and demand – some big news story, government intervention in the market, the machinations of big players, and so on – but these factors are all expressed by how they affect the relationship between buyers and sellers. Say the UK government decides to curb government borrowing and the Bank of England decides to do nothing in response – well, this might undermine confidence in GBP and the price drops relative to the dollar and the euro. That’s all very well but the real driving force bringing the price down is that people who were worried about the breaking news and decided to sell their GBP outnumbered people who were looking to buy GBP at that time. Sellers outnumbered buyers and the price dropped.
All the other indicators we use ultimately derive all of their data from this one simple fact. From whether there were more buyers or more sellers over a given period. Now, the beauty of Japanese candlesticks is that they give you a much more stripped-down view of the true nature of things. The stories they tell have all the noise stripped away and just show you the relationship between buyers and sellers.
The best way to show you how they do that is to take a look at a couple of examples. Now, this is nowhere near being an exhaustive list of Japanese candlestick patterns – there are literally hundreds of these things out there and very few people know more than a few. This is more of an opportunity to give you a sense of how they work so, before you take these and start applying them to your trading, be aware that any real use of these patterns will require your own research and testing (as well as making sure you use them in conjunction with other indicators as part of a broader trading system that includes risk analysis and money management). You just don’t get anything handed to you in this game, you have to put the work in.
Another thing to bear in mind is that these patterns work better on the longer timeframes. On shorter timeframes like the one-minute chart, you will still have these patterns emerging but their accuracy will be so low as to make them unusable. This is because the price is shifting around so fast it generates a lot of noise and makes the patterns unreliable. At the longer timeframes, the patterns will make more sense but the trade-off is that they will also be less timely, which will delay your entry and exit signals. This is a trade-off between accuracy and timeliness that you’re making with every indicator out there so you have to be aware of it and compensate for it with the way you manage your trades.
Examples – The Hammer
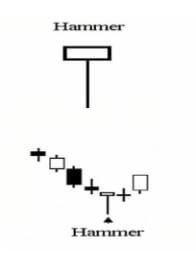 A hammer is a candlestick with a short body, a long lower shadow, and a small or no upper shadow. The story the candlestick is telling you is that the price dropped after opening but rallied during the time period and ended up close to the opening price (sometimes over and sometimes under).
Typically, you’ll see hammers close to the bottom of a clear downward price movement and they indicate that sellers predominated but that, eventually, enough buyers came into the market to sway the price the other way. Of course, you might also see hammers when the market is ranging or moving sideways where they are more likely to deceive you about where the price is going to go. After a strong short trend, however, they often signal a change in the price direction.
As with all of these patterns, they are a signal – there is no guarantee about the direction of the price after a given candlestick pattern. You might see a hammer come in and think it represents a reversal but the price can easily just turn around and burn you afterward. Smart traders who suspect that a downward trend has concluded once they see a hammer will wait for one or even two confirmation candles to form before pulling the trigger on a trade.
Examples – The Shooting Star
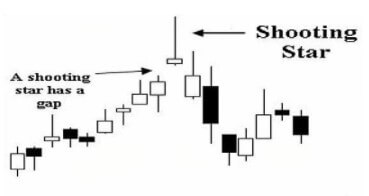
Just as a hammer signals a possible change of direction in the price movement after a downward trend, so its mirror image, the shooting star, signals a possible change of direction when it appears at the peak of an upward trend.
Since it is fully a mirror image of the hammer, the shooting star has a long upper shadow, it is also possible to glean a sense of the strength of the turnaround from the length of this shadow – a short shadow likely signals a dampened change of direction while a long upper shadow (sometimes many times longer than the body) is a sign of a more bearish pullback. The best examples of a shooting star will form above the previous candle – that is, its open, lows and close should all be above the shadow of the previous candle.
It is important to be aware that a shooting star pattern and an inverted hammer pattern both look exactly the same but that they differ in one crucial detail. A shooting star will appear at the top of an upward trend and signals a coming downturn, while an inverted hammer will appear at the bottom of a downward trend and, much like its sibling, the hammer signals a change of direction for the price movement.
Examples – The Doji Star
A doji star or just plain ol’ doji is a candlestick that forms when the open and close price is so close that the candle looks like a cross. The name doji comes from the Japanese word for error or mistake, which is apt given what this candlestick is signaling. There are several types of doji but they are all telling you more or less the same thing – the price has reached a balance point and there is no strong trend in either direction.
You’ll see them in all sorts of contexts, so no matter what the market is doing at any given time, you could have a doji forming. That said, they are still giving traders a signal to be aware of and think about. Though they often crop up when the price is moving sideways – that is not the doji you are looking for. They are much more useful to you when they form after a strong move in either direction. Dojis represent indecision at the best of times but after a healthy trend, they are telling you that equilibrium is being reached between buyers and sellers and that could be a sign that the trend is losing strength.
Of course, a doji doesn’t always mean there is going to be a turning point and you should watch out for those moments when a trend wavers a bit for a time and then simply carries on going because that could easily kick up a doji.
Examples – The Hanging Man
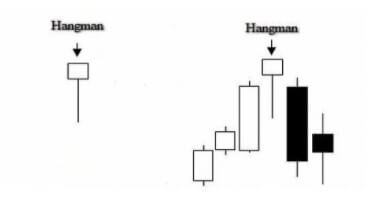
The hanging man or hangman is, in many ways, a similar candlestick pattern to a shooting star – in the sense that it represents a possible reversal of sentiment at the top of an upward price movement. Don’t be fooled, however, because there are differences.
A typical hanging man will look much like a hammer or an inverted shooting star – with a relatively small real body, a long lower shadow, and little or no upper shadow. The longer the lower shadow, the stronger the candlestick is as a signal. But the context is important because, unlike a hammer, a hanging man appears at the peak of an upward trend. Also important is the story the candlestick is telling us. From the shape of the candle, we can tell that buyers managed to rein in a sell-off that occurred between the open and close. Though you could read this to mean that the buying sentiment prevailed in the end, most traders will see this deep sell-off as a sign that the trend is losing strength.
There are many traders out there who think of the hanging man as being more useful for short-term changes in direction and that, as such, it should be used more as an exit signal than as an entry into a short trade. In that sense, it could be a useful addition to your toolkit as a way of maximizing wins by preventing the price from dropping through your stops.
Examples – The Bullish Engulfment
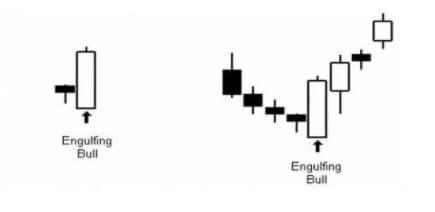
The bullish engulfing pattern or engulfing bull is a Japanese candlestick formation made up of two candles rather than one. It forms when a smaller bearish candle is followed immediately by a larger bullish candle whose body is bigger than the real body of the smaller candle. You don’t need to worry too much about the shadows of the smaller candle – the main aspect is the second candle’s large body being bigger than that of its little predecessor. The story that this tells us of the first candle representing a slowing downward price movement, the price opening lower still on the second candle but then closing near the period’s highs (which is why the second engulfing bull candle will often have small upper and lower shadows). This is important, especially for the upper shadow because it then indicates that the price was still heading upwards when the candle closed.
Since the bullish engulfment is telling you that buyers clearly won out during the second candle’s formation, it is usually taken to mean that the downward sentiment is losing strength and that a reversal could be imminent. This is why it is important for the open price of the second candle to be lower than the close of the first – this means that the downward trend continued but was eventually reversed by bulls winning out over bears.
The Other Side of Japanese Candlesticks
Understanding the patterns of Japanese candlesticks and using that knowledge to assist your trading (in conjunction with other indicators and tools) is hugely popular in forex. But although it is true to say that it is popular, that doesn’t mean that there are not those out there who think that Japanese candlesticks are either ineffective to the point of being meaningless or that they could actually be hurting your trading.
Supply and Demand?
The first of these criticisms of candlestick patterns as a tool in trading goes to the very heart of the power of what Japanese candlesticks are all about and it goes a little like this: Japanese candlesticks were originally developed and also later adapted as a tool for trading commodities (rice, in the original iteration) and stocks – both of which conform to the rules of supply and demand much more closely than forex. And there are elements of truth to that criticism. In forex trading, demand is certainly a factor but the supply side of the equation works rather differently than in commodities and stocks because the supply of a currency isn’t as limited – in theory, it is completely unlimited.
However, though there is some truth in there, that doesn’t mean that the story Japanese candlesticks tell traders about the relationship between sellers and buyers during a given time period is completely invalidated. Forex is still subject to the principle that price increases when buyers outnumber sellers and decreases when the reverse is true. But, and here’s the clincher, while it doesn’t invalidate the candlesticks approach, it is still something to bear in mind. You will see times when a candlestick pattern that unfolds just perfectly on your screen still doesn’t go on to give you the price movement you were expecting.
Well, as a trader, what does that tell you and where does that leave you? Ultimately, if you’re a smart trader, it leaves you pretty much where you started. It means that you cannot rely solely on following Japanese candlestick patterns without combining them with a well-worked out trading system that includes other indicators and a host of highly honed risk and money management techniques that you have adapted over time to suit your trading style.
The Big Players
Another – and very closely related – criticism of Japanese candlesticks comes from those that see the actions of big, powerful market players lurking behind every price move and directing the ups and downs of the market in the short term but also, and especially, in the longer term. That may initially sound like conspiracy theory hogwash to some readers but there is more to it than that. In forex, just as in most markets (but perhaps, at the end of the day, more so in forex), there certainly are huge and powerful financial institutions, funds, and so forth that influence the prices on forex markets. Traders need to be aware of that and the fact that this undermines to some extent the purity of a simple supply and demand equation.
There’s another side to this to also be aware of. Japanese candlesticks have become so popular now among retail forex traders that their huge popularity is also one of the main things that hold them back. They are so widespread now as a technique that they have been analyzed to death by the big players in the market and the algorithms and software they use that their reliability has been seriously degraded. The big players will happily use software that recognizes a pattern in the blink of an eye – a million times faster than any human trader would – and uses this advanced knowledge to analyze how the vast majority of traders will react to the emergence of this pattern relying on popular patterns. This essentially traps you – the slow human – in a computer-laid trap where you following the received wisdom in responding to a given pattern will be your ultimate undoing.
Pattern Blindness
A third major criticism of using Japanese candlesticks – and perhaps the most valid – is based on how our brains work. Humans evolved over millions of years to be able to pick out patterns. Back when we were hunter-gatherers, this helped us to survive, to spot the tiger among the bushes, to find food, and generally to get by. Over time we became masters at it – second to none. But the thing is, being able to see patterns in the modern world isn’t quite the question of life or death that it once was. In fact, it’s of limited application. And then, along comes forex trading and Japanese candlesticks and suddenly we’re back in our element again. So, sure, our innate ability to spot patterns comes in handy sometimes but there’s also a downside.
The drawback of being such fine-tuned pattern identifiers is that we also tend to see them even when we shouldn’t. Sometimes that might mean seeing the savior of your choice in a piece of toast or getting creeped out by random shapes in the dark, but at other times it could be seeing an inverse hammer or a bullish engulfment on a chart. But there’s another couple of elements to the pattern recognition that could also really get in your way when using Japanese candlesticks in trading.
One of these is that you start looking at charts and seeing the candlestick patterns on it but because you’ve become so convinced by all of the hype around Japanese candlesticks, you start only seeing the wins and allowing your eyes to simply skate over the losses. This happens partly because Japanese candlesticks are so popular and so talked about on the forex internet and people become kind of indoctrinated to seeing their successes. You spend so much time watching videos or reading blogs that tell you over and again that these things work that it gradually becomes harder and harder for you to see the times when they don’t.
This generates a kind of belief because, well, wouldn’t it be great if this worked as advertised? You could just look at a chart, see a pattern emerging and you’d know what the market was going to do next – just in time to enter a trade and make a handy little profit from what you know. Once that sense of belief and hope is ingrained, you lose your objectivity and your ability to see things for what they are. And once you’re in that territory, you forget that belief and hope cannot replace a well-tested and well-thought-through strategy. Moreover, once you’ve gone deep enough and trained your brain to see these patterns, you can become blind to all of the other approaches to forex trading there are out there.
A final piece of the pattern-seeing puzzle is that when you’ve trained your brain to pick out patterns of Japanese candlesticks, it becomes very difficult to untrain your brain again. Even if you stop using them actively as a tool, you’re still going to be seeing them everywhere while you’re trading. In a sense, using this approach to trading lures your brain into a trap from which it can become difficult to escape. Even when you think you’re free because you’ve stopped using candlestick patterns, you go on seeing them and they introduce doubt at a subconscious level, affecting your trading decisions.
Testing Yourself and Your System
Ultimately, whether there is any value to scanning the charts for patterns of Japanese candlesticks is something you will have to decide for yourself. The one thing that’s for sure is that you can’t fully trust your own brain to be objective about it. The only way to be truly and, above all, objectively sure whether any given approach or tool is valid and performs the way you need it to is to test it.
Believing and hoping that something is going to work – even believing other people’s judgment about it – leads to all kinds of problems. Not least of which is the fact that when it almost inevitably fails to work in the long term, the first person you’re going to blame is yourself because your instinct will tell you that you must be doing something wrong: “How can all these people be having success with this tool but it isn’t working for me – there must be something I’m not doing right”. The only way to combat that doubt is to make sure the tools and approaches you’re using have been tested by you and that you are comfortable with how they work.
Now, that doesn’t mean backtesting an approach once on a single currency pair and then clunking it into your system right away. No, if you want to test to remove the fallibility of your subjective and imperfect human brain, you have to put the work in. That means backtesting each tool you plan to use, comparing them with one another, and testing them in conjunction with each other. Then, when you feel like you’ve backtested thoroughly enough, it’s time to take your tools and your trading system out on the road – but in a demo account. Because forward testing is just as important as backtesting and can be even better at highlighting the weaknesses in a tool or indicator.
All of this is just as true with Japanese candlesticks as it is with any other tool that you’re thinking of using. The advantage of backtesting Japanese candlestick patterns, however, is that any individual pattern actually doesn’t crop up all that often. Not only does this make it quicker to backtest them but also you can backtest a whole slew of patterns all at once, just by picking them out of a chart going back a significant amount of time. Conversely, however, they will take longer to forward test than signals that crop up with greater frequency.
At the end of the day, it’s important to have a good overview of how a particular trading tool works but you should take nobody’s word for anything. Believe neither the proponents of a tool nor the detractors – ultimately, be careful about how much you believe your own subjective thought processes – because nobody is going to tell you as much info as you can learn by putting a tool through a robust testing regimen.

