On the forex front, the U.S. dollar continued to see safe-haven buying. The ICE U.S. Dollar Index rose 0.4% on the day to 100.58, extending its rally to a third straight session. Later today, the Research firm Markit will publish March U.K. Construction PMI (44.0 expected). The eurozone Sentix Investor Confidence Index for April will be released (-37.5 expected). The German Federal Statistical Office will report February factory orders (-2.5% on month expected).
Economic Events to Watch Today
EUR/USD – Daily Analysis
The EUR/USD slid 0.5% to 1.0809, posting a five-day losing streak. Official data revealed that the eurozone’s retail sales surged 0.9% on month in February (+0.1% expected). Later today, the eurozone Sentix Investor Confidence Index for April will be released (-37.5 expected).
Speaking about the Germans Factory orders data, this data release by the Deutsche Bundesbank, which indicates the shipments, inventories, and new orders. A surged in the factory order total may show progress in the German economic growth, and it could also be a factor to boost inflation.
It is worth noting that the German Factory influences by two-ways either positively or negatively, the total Eurozone GDP. A high figure is considered as a positive or bullish for the EUR, while a low reading is negative.
Therefore, the pair could drop to 1.0773 previously low on mixed Ferman data. Moreover, if the greenback catches fresh bids on the turnaround in the risk sentiment, the EUR/USD currency pair could suffer in a more profound drop below 107.00 ahead.
As per the coronavirus latest report, the cases rose by 3,677 in Germany when compared with Sunday’s 5,936 new infections, showing the 4th-straight drop in the daily rate. The death toll rose by 92. Consequently, the EUR/USD is suffering badly and may trade sideways as the dollar also suffers alongside.
Daily Support and Resistance
- S1 1.0653
- S2 1.0732
- S3 1.0769
Pivot Point 1.081
- R1 1.0847
- R2 1.0889
- R3 1.0967
EUR/USD– Trading Tips
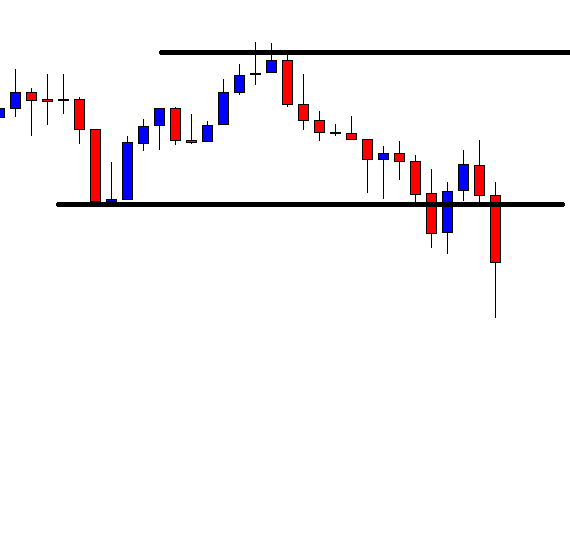
The EUR/USD is trading bearish at 1.080, having an immediate support level of around 1.07990. On the 4-hour chart, the EUR/USD has violated the support level of 1.085, which is now working as a resistance. As of now, a bearish breakout of 1.07990 level may extend selling bias until the next support level of 1.0650. While the MACD is staying below 0, supporting the odds selling movements in the market.
At the same time, the 50 periods exponential moving average is also keeping the EUR/USD in a bearish mode. Bearish crossover of 1.081 area can open further room for selling until 1.065 level. So, let’s consider taking selling trades below 1.081today.
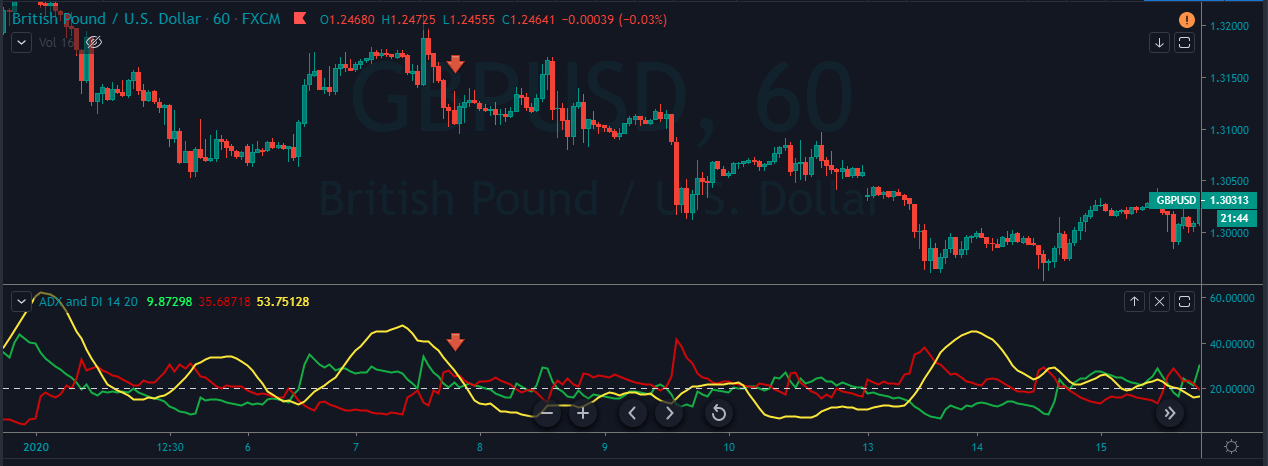
GBP/USD– Daily Analysis
The GBP/USD sank 1.1% to 1.2262. The Markit U.K. Construction PMI for March will be released later in the day (44.0 expected). As per the latest report, the coronavirus cases rose to 33,718 as of 08:00 GMT on April 02, whereas there was a 24% rise in the death toll to 2,921 at the same time.
Meanwhile, the Washington Governor extended the stay-at-home order, whereas S&P declared its U.S. rating at AA+ with expectations of a recovery in 2021. As in result, the market’s risk-tone remains moderately heavy with the U.S. 10-year treasury yields dropped below 0.60%, and most Asian stocks are also flashing red.
As per the latest report, the death toll from the coronavirus increased by 621 to 4,934. The total number of confirmed infections rose to 47,806. Apart from the coronavirus intensifying concerns, the GBP currency could remain bearish in the European trading hours mainly due to the sluggish data, which is released early Monday and showed the British consumer confidence declined to the weakest since February 2009.
On the flip side, the USD has ignored 7 million drops in the U.S. jobs for March, because the upbeat US ISM Non-Manufacturing PMI boded well for the greenback. However, the U.K. Services PMI data for March was revised down to 34.5 points, which will likely push the GBP lower.
Looking forward, the headlines related to the PM Johnson’s condition will remain driver seats. The U.S. dollar dynamics also will be critical to watch for fresh directions. Meanwhile, traders, all eyes will be on the U.K. government COVID-19 meeting, which is scheduled to happen at 0815GMT for new trading impetus. The meeting will be chaired by the U.K. Foreign Secretary Raab and include the advisers and officials.
Daily Support and Resistance
- S1 1.1909
- S2 1.21
- S3 1.2184
Pivot Point 1.229
- R1 1.2375
- R2 1.248
- R3 1.267
GBP/USD– Trading Tip
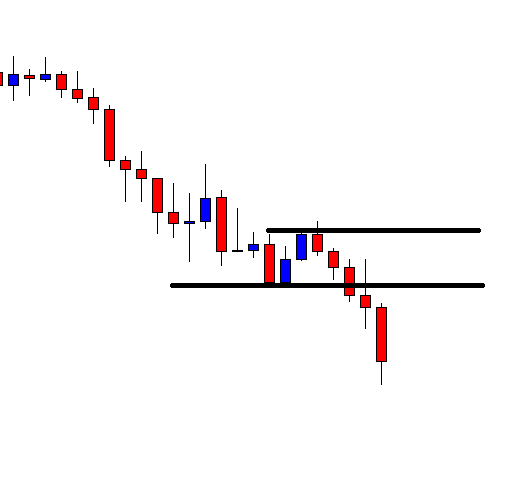
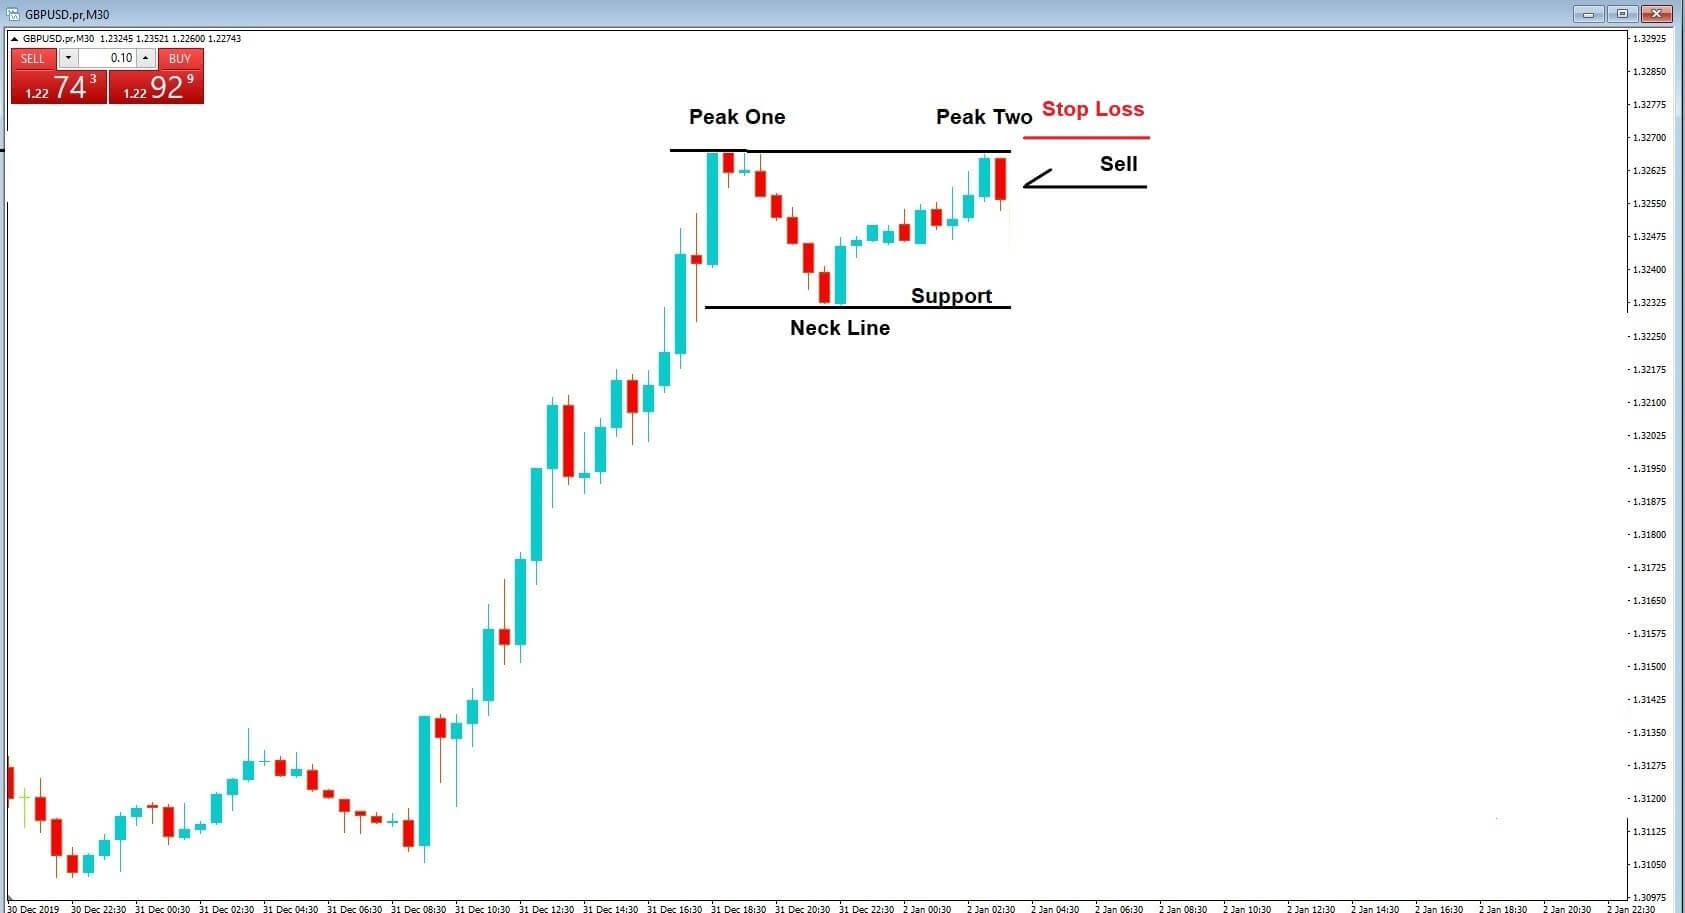
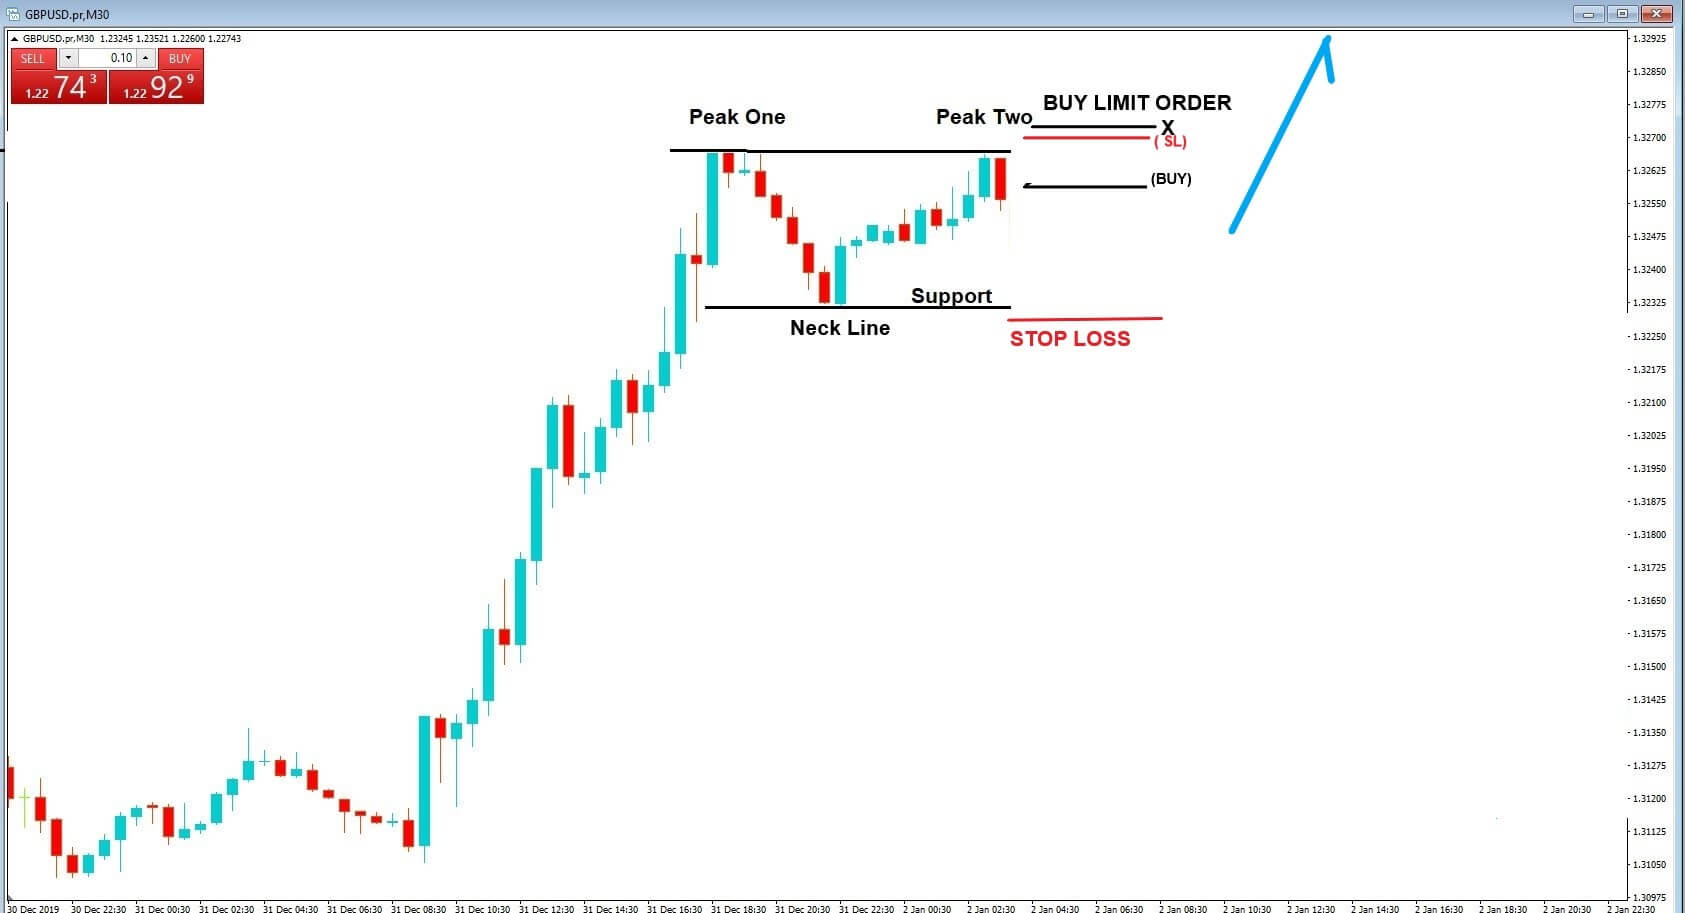
The technical side of the GBP/USD hasn’t changed much as it continues trading sideways in between the same trading range of 1.2275 – 1.2425. On the 4 hour timeframe, the GBP/USD is forming neutral candles despite worse than expected NFP figures from the U.S. Hence, the pair has gained slight support and recovered over 1.2265 resistance level, which is now working as a support.
On the 4-hour timeframe, the GBP/USD pair may find resistance around 1.2470, along with support around 1.2278. In the case of market breaks bellow 1.2278, we may see GBP/USD prices heading into the selling zone until 1.2100 and 1.2005. Whereas, the chances of buying remains solid over 1.2275 until 1.2520.
USD/JPY – Daily Analysis
During Monday’s Asian session, the USD/JPY currency pair flashing green and continue to gaining its traction for the 3rd-consecutive session mainly due to fresh risk recovery in the market.
The U.S. bond yields exhibited an uptick, which is providing support to the greenback and also kept the USD/JPY pair higher. Right now, the USD/JPY is trading at 109.25 and consolidates in the range between the 108.37 – 109.38.
However, the USD/JPY pair added to its intraday gains and rose further beyond the 109.00 round-figure marks, hitting fresh one-week tops in the last hour. A fresh drop in the death and cases of coronavirus gave a high relief to the trader. Whereas, the strong gain in the U.S. equity futures weakened the Japanese yen’s safe-haven demand.
On the other hand, the reason behind the Japanese bearish bias could also be TBS News report that the Japanese government is considering 6-months for a state of emergency declaration to control the coronavirus outbreak in Tokyo.
Daily Support and Resistance
- S1 105.37
- S2 106.64
- S3 107.08
Pivot Point 107.91
- R1 108.35
- R2 109.17
- R3 110.44
USD/JPY – Trading Tips
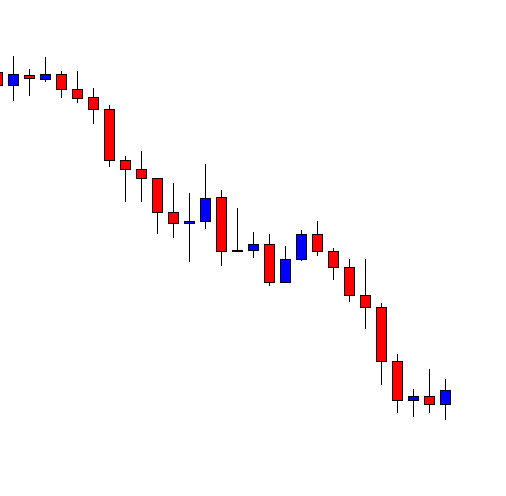
Technically, the USD/JPY pair is trading bullish a 109.177, having violated the choppy trading range of 108.650 – 107.250. With this, the USD/JPY’s best immediate support is likely to be found around 108.700. On the 4 hour timeframe, the Japanese pair has closed a bullish engulfing candle over 50 EMA, which is suggesting odds of more buying in the USD/JPY currency pair.
With this, the USD/JPY may exhibit further room for buying until 109.680, and violation of this can open more room for buying until 110.500 and 111.450. On the lower side, support continues to hold around 108.750. Let’s look for buying traders over 108.850 today.
All the best for today!