
Market pattern trading in cryptocurrencies (Head and Shoulders, Triangles, Wedges) – part 1/2
Finding ways to predict the future price movement of an asset has always been incredibly hard, no matter what asset you are trading. Cryptocurrency trading differs slightly from trading other assets, as it is more volatile, much younger, and susceptible to fear of missing out as well as fear, uncertainty, and doubt.
Although the number of factors that influence the price of a cryptocurrency is almost immeasurable (reaching milestones, partnerships, security breaches, new regulations, etc.), combining this knowledge with the usage of other methods, such as trend detection can be quite profitable.
No matter how volatile the prices of cryptocurrencies may be, at times, experienced traders can spot distinct movement patterns that allow them to predict the direction of the price movement. This guide will explain the fundamentals of three patterns that traders look for when trading crypto on various exchanges.
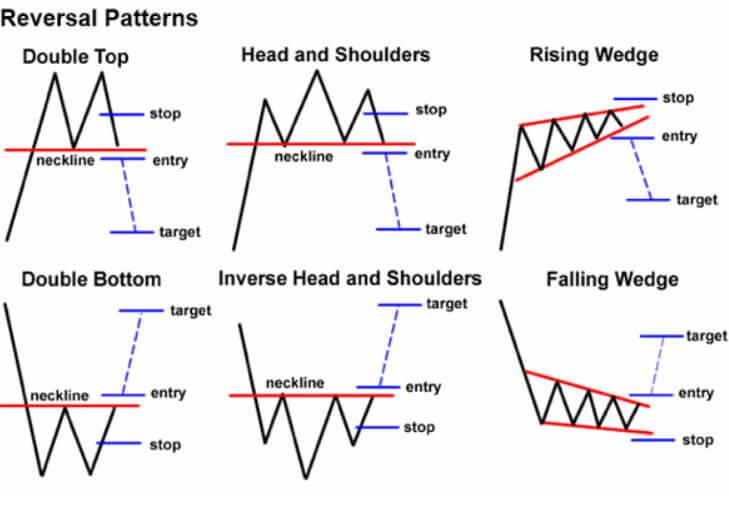
The head and shoulders pattern is a price formation that, to an inexperienced trader, look like a baseline with three peaks and nothing more.
However, if we spot that the middle peak is higher than the other two, which are similar in size, we can deduce that it is, in fact, the head and shoulders pattern.
In technical analysis, a head and shoulders pattern is a sign of bullish-to-bearish trend reversal. It is regarded as one of the most reliable, if not the most reliable trend reversal patterns.
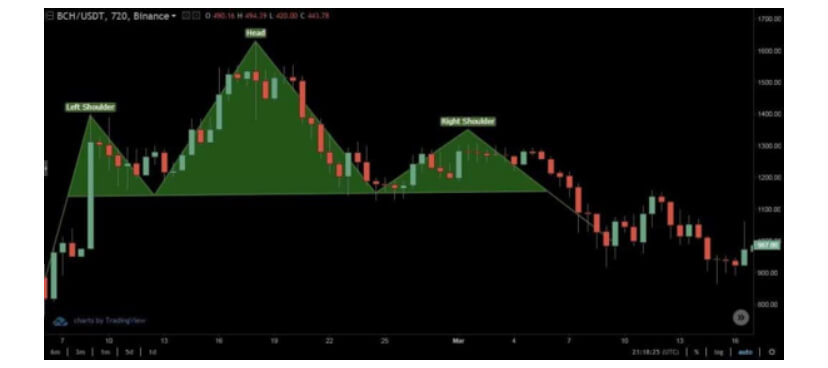
As the cryptocurrency market is extremely volatile and bulls and bears constantly switch in terms of market dominance, the head and shoulders pattern would appear after the market has been dominated by bulls.
After the first price stagnation (which is the Shoulder 1), and the price reaches a new high (which is the head), it still may be possible that the pattern will not form and that the bulls will push the price even higher. However, after the price goes down for the second time, bulls often try to push it up again (which is the Shoulder 2). If they don’t succeed and the price stops at the price level similar to the one of Shoulder 1, it becomes evident that bears are taking over the market.
The target price in this reversal is equal to the distance from the neckline to the peak of the head but in the opposite direction.
When deciding whether to trade the head and shoulders pattern, traders should not just assume that the pattern is going to play out. Instead, they should be patient and wait for the decline after the right peak to reach the neckline. Only then can they think of taking a position.
Reversed head and shoulders
Traders should also look for the reversed head and shoulders pattern, which plays out the same way a regular one does, but in the opposite direction. This pattern marks the end of the bear season.
Check out part 2 of our pattern trading guide, where we will cover various triangle formations as well as wedges.