Categories
Crypto Market Analysis

Daily Crypto Review, Apr 28 – Ethereum up 50% in 2020; Crypto market a safe haven?

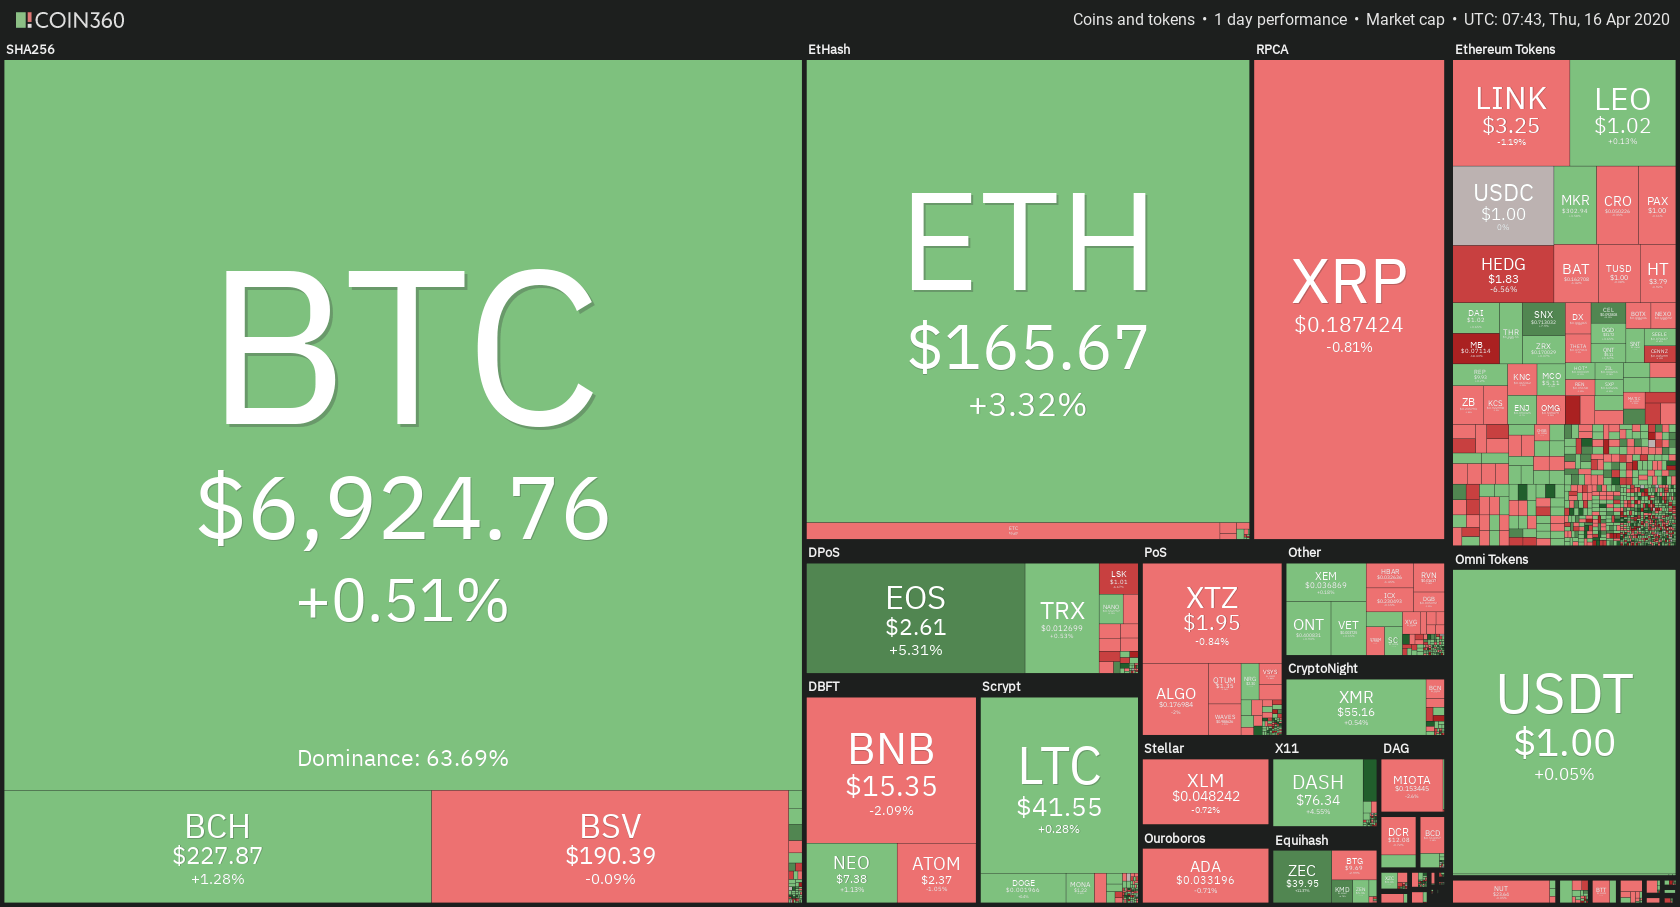
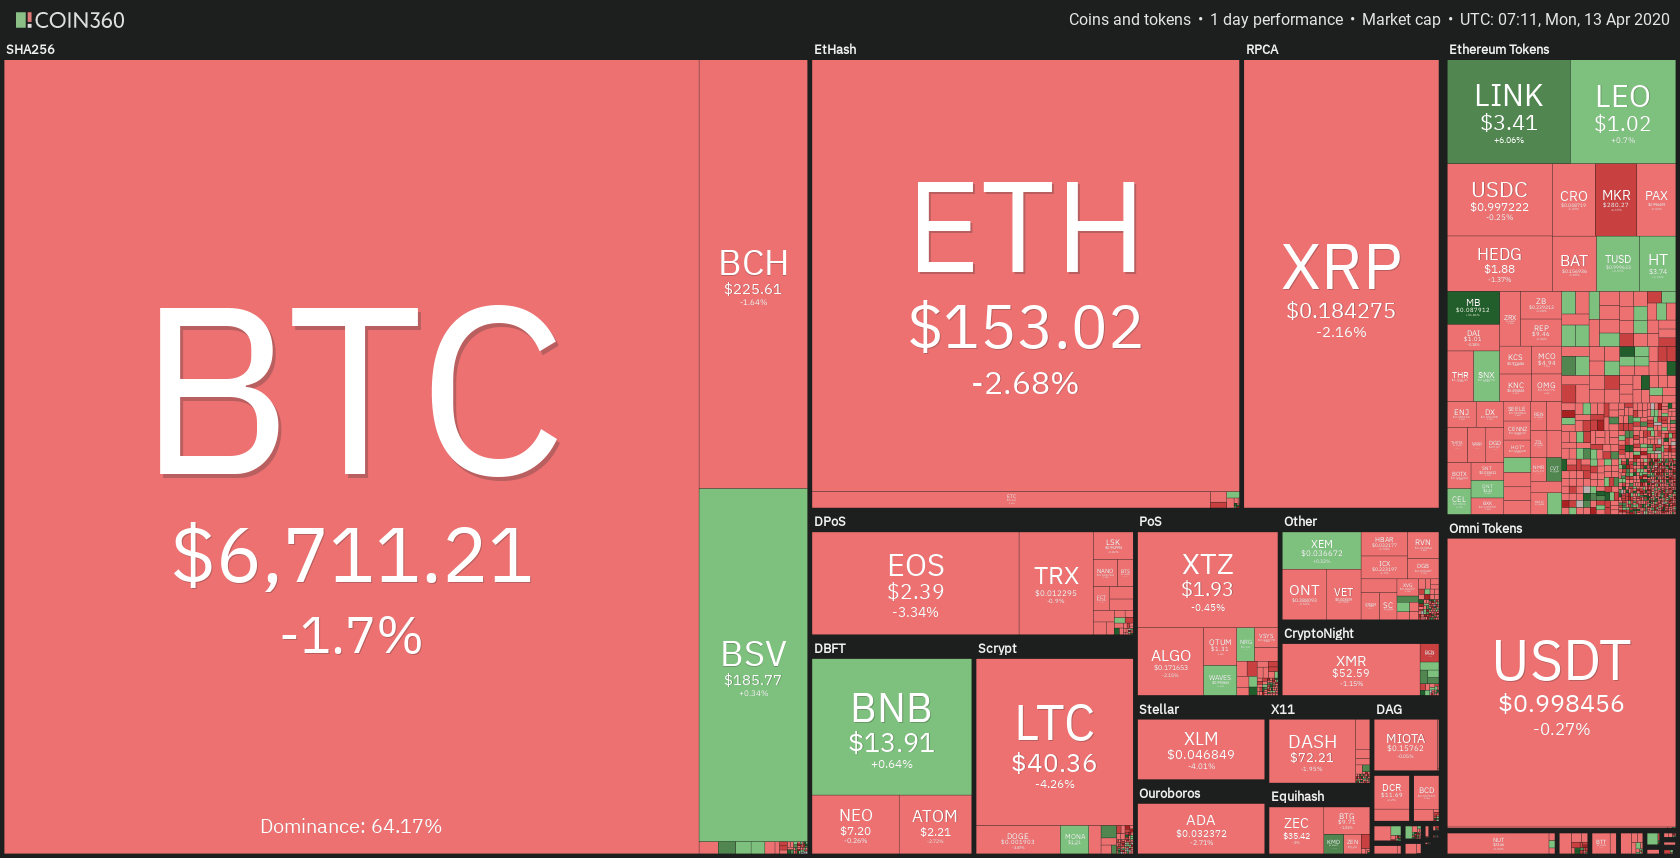
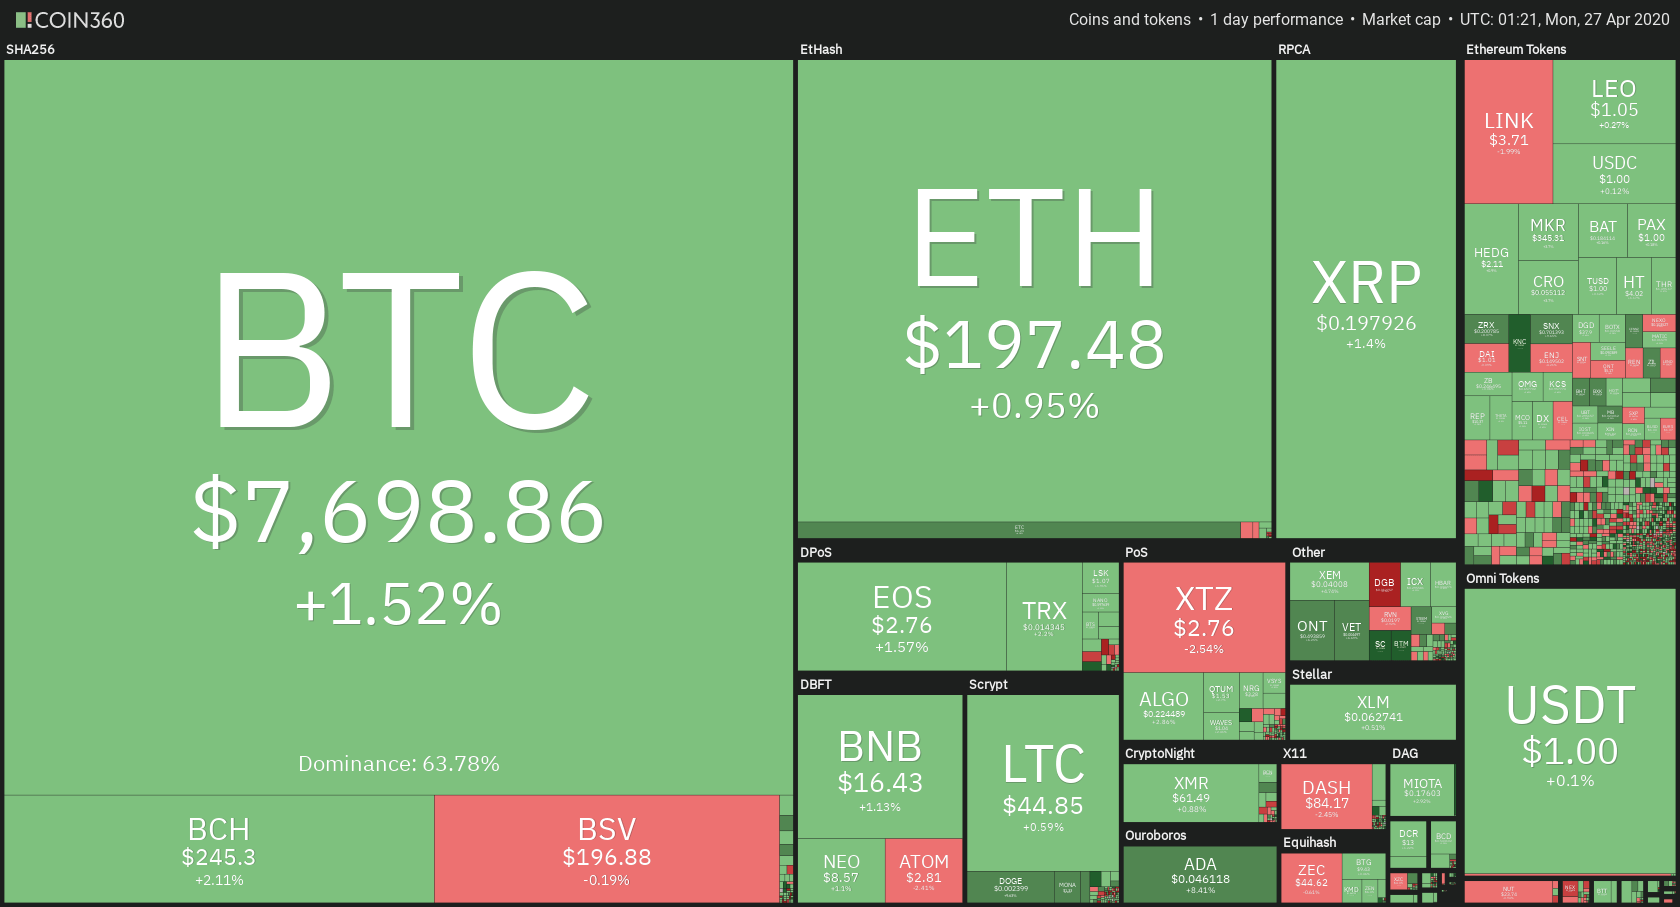
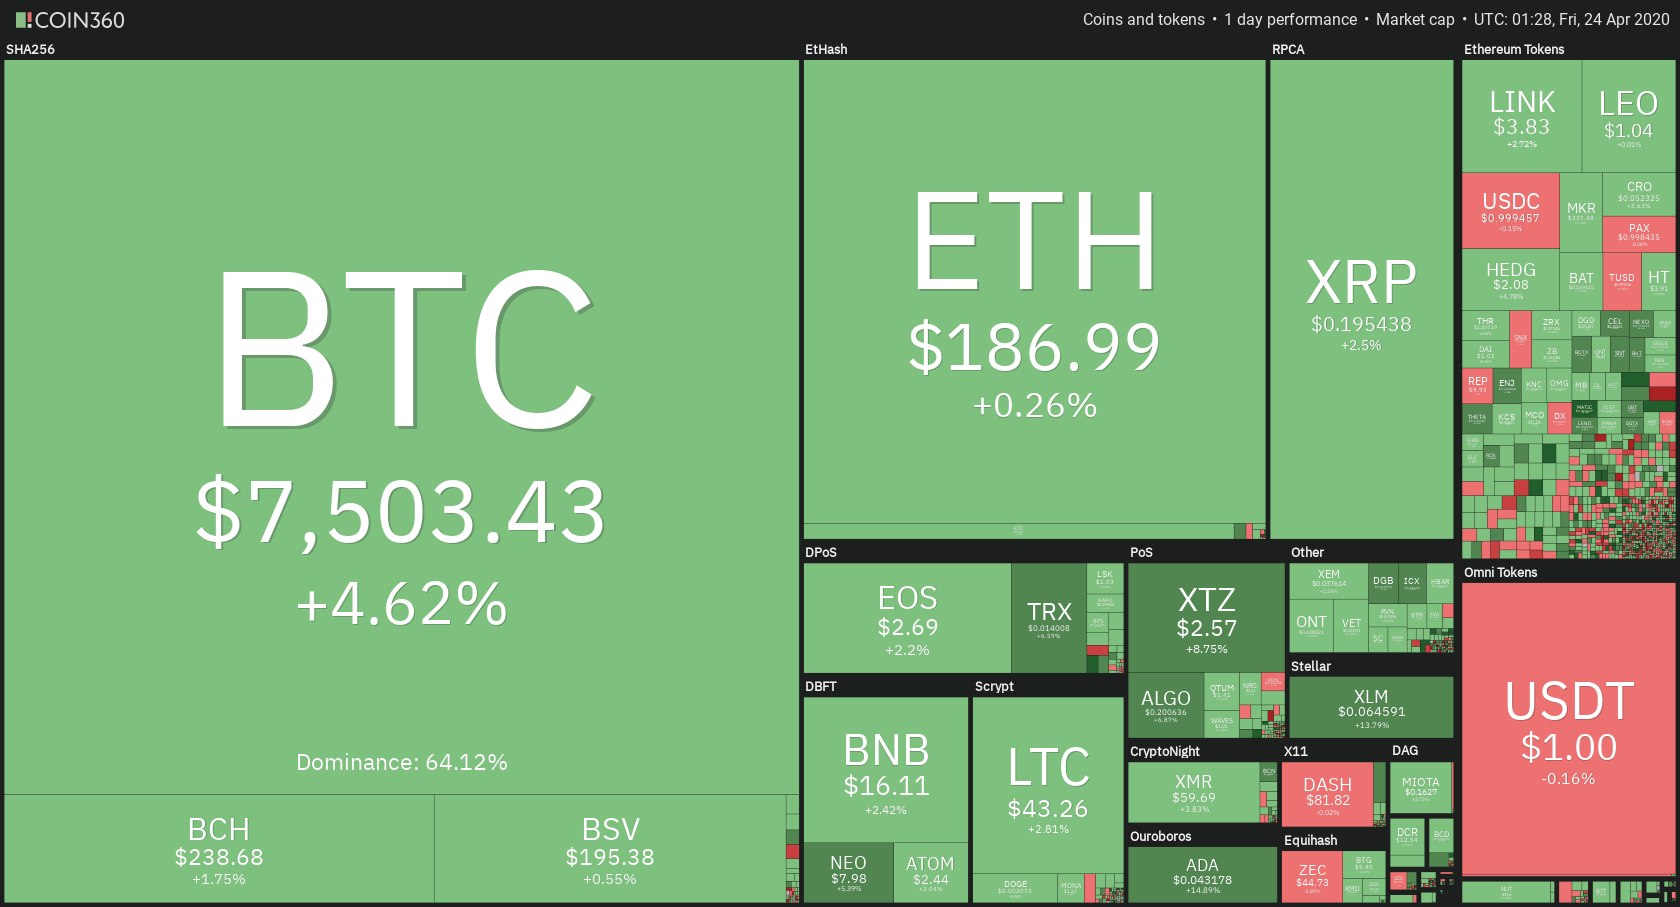
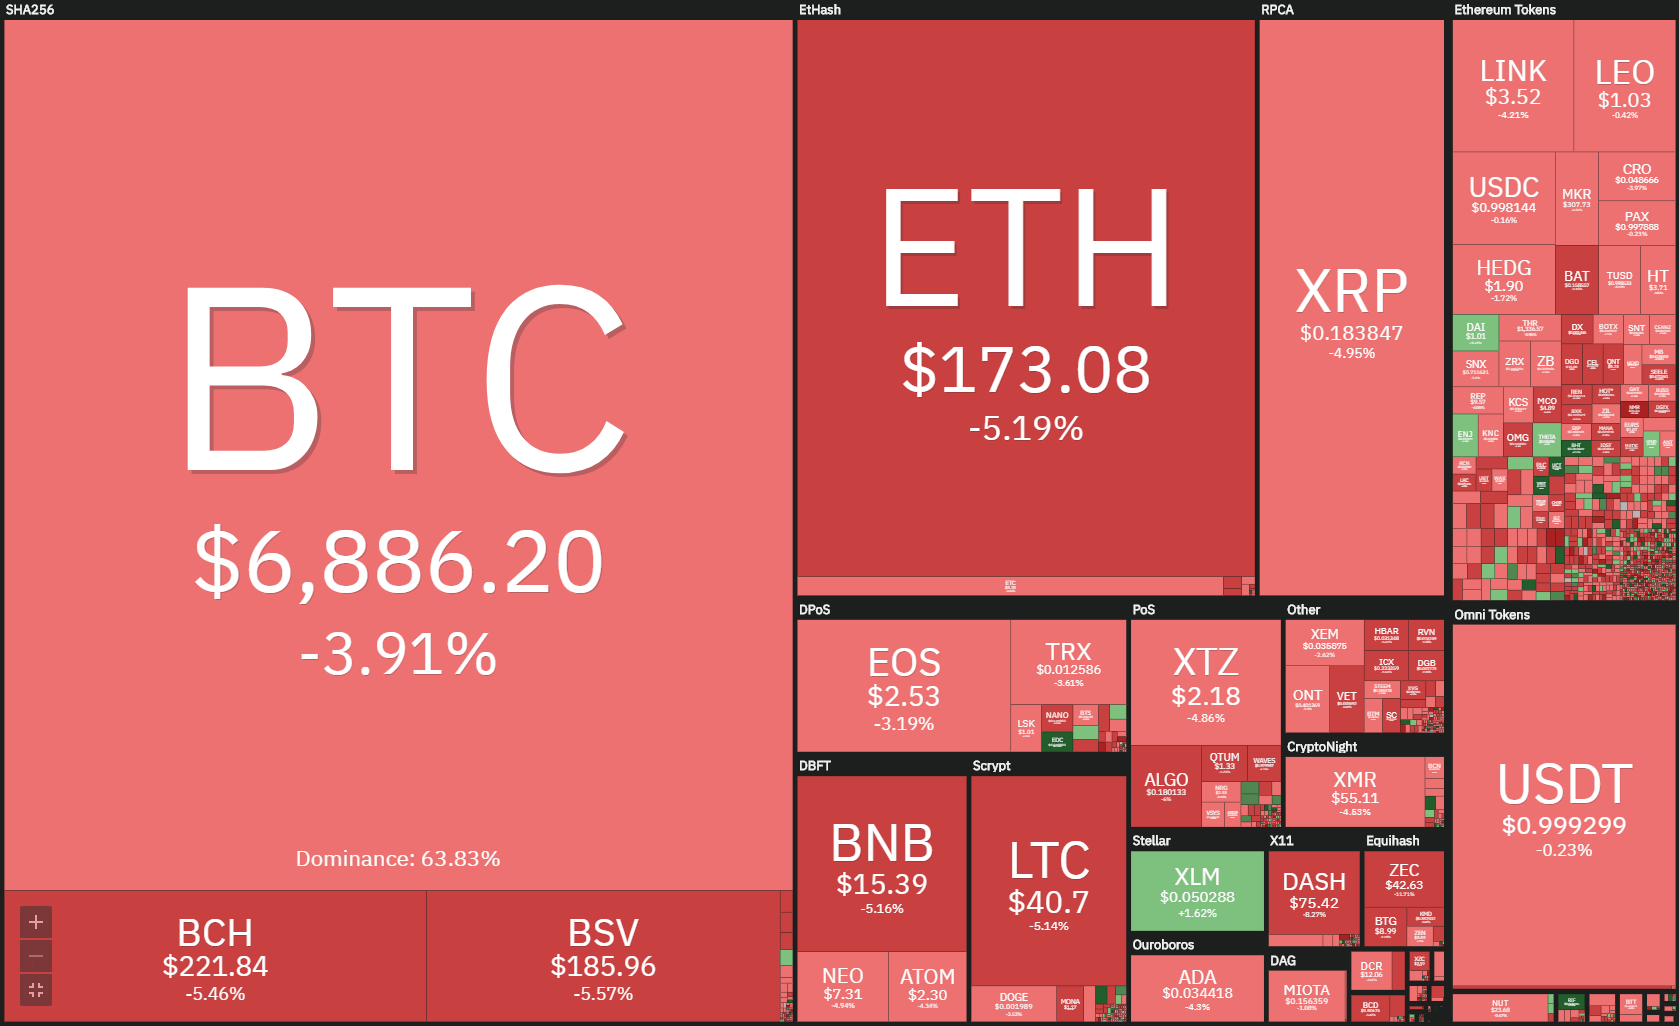
The cryptocurrency market has spent the past 24 hours mostly consolidating and preparing for the next move. Bitcoin is currently trading for $7,713, which represents an increase of 0.01% on the day. Meanwhile, Ethereum lost 1.08% on the day, while XRP lost 0.75%.

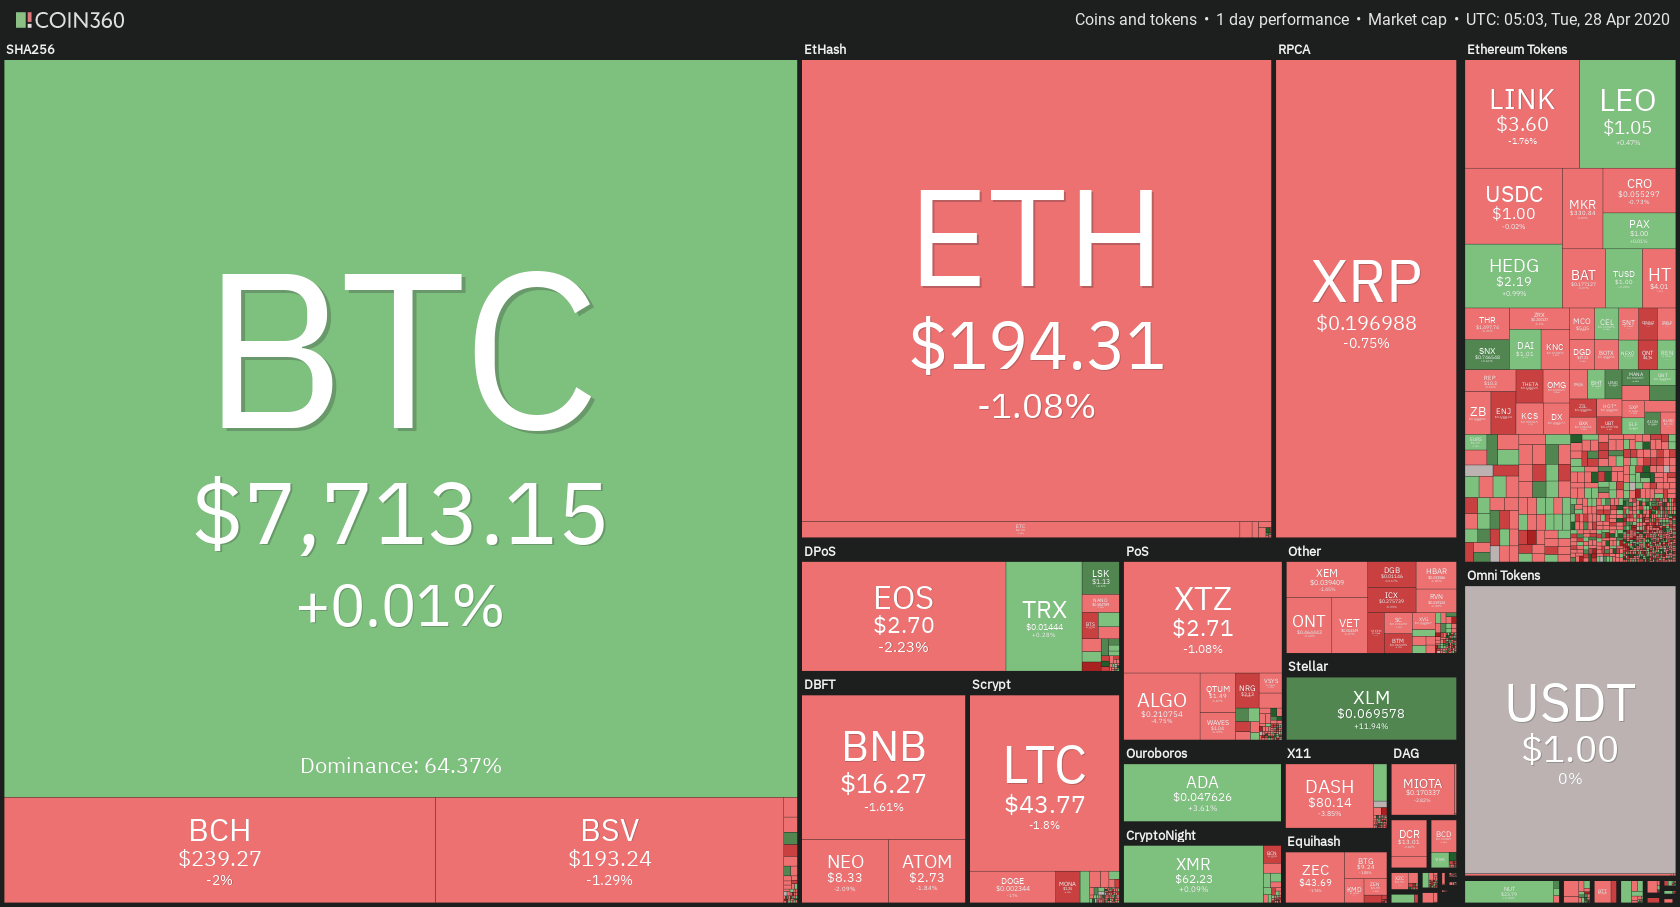
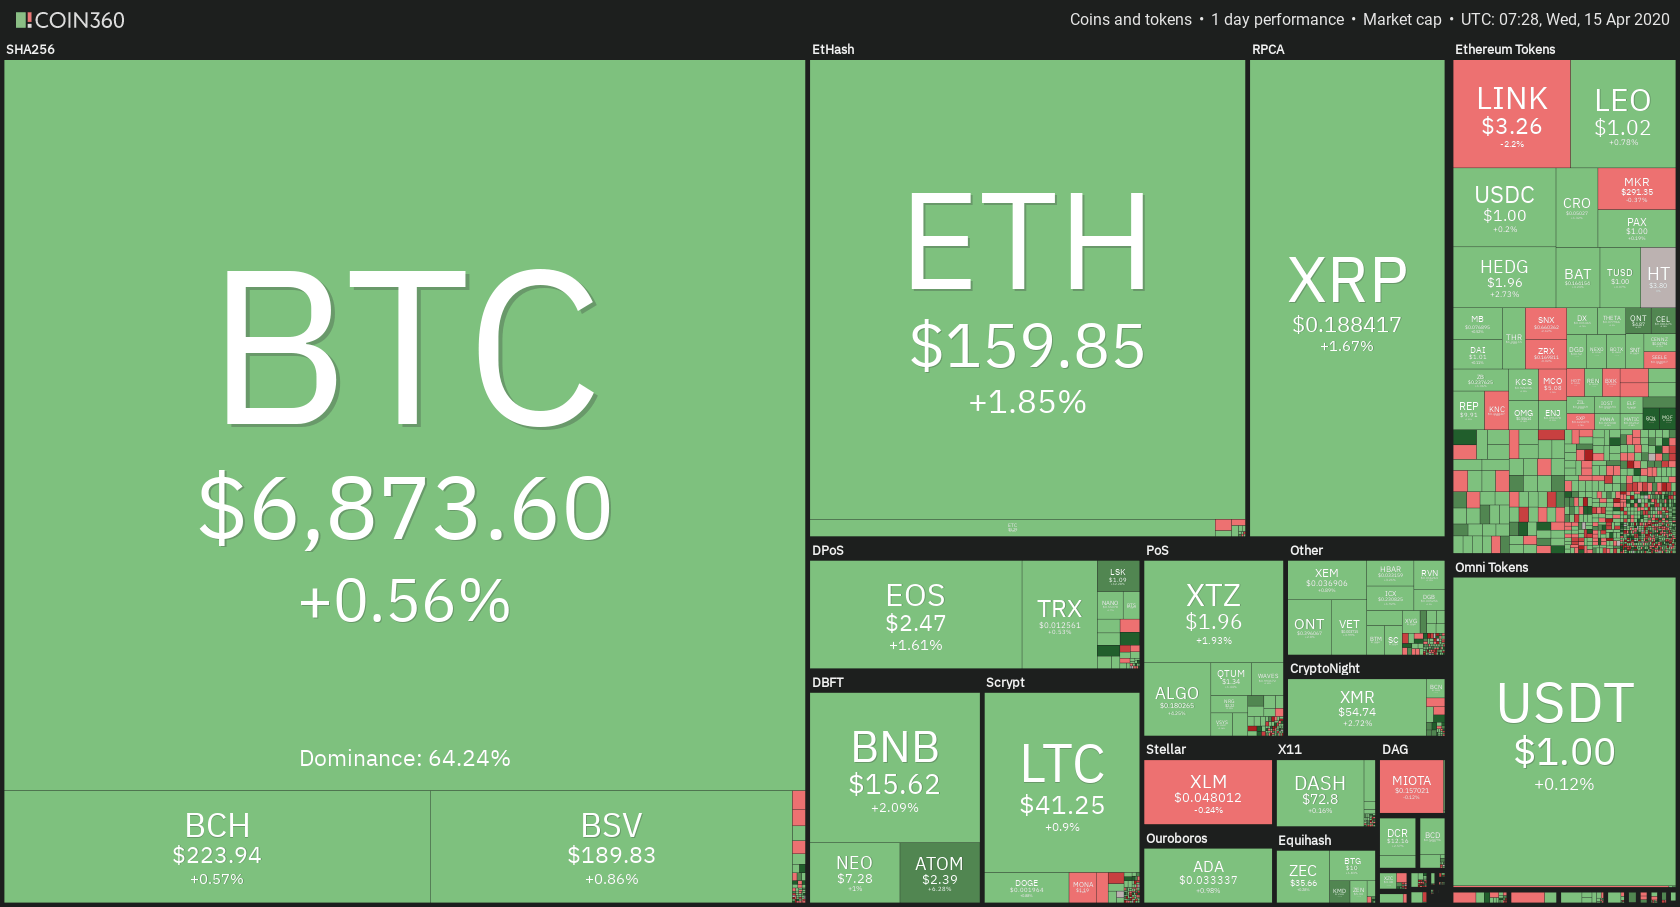
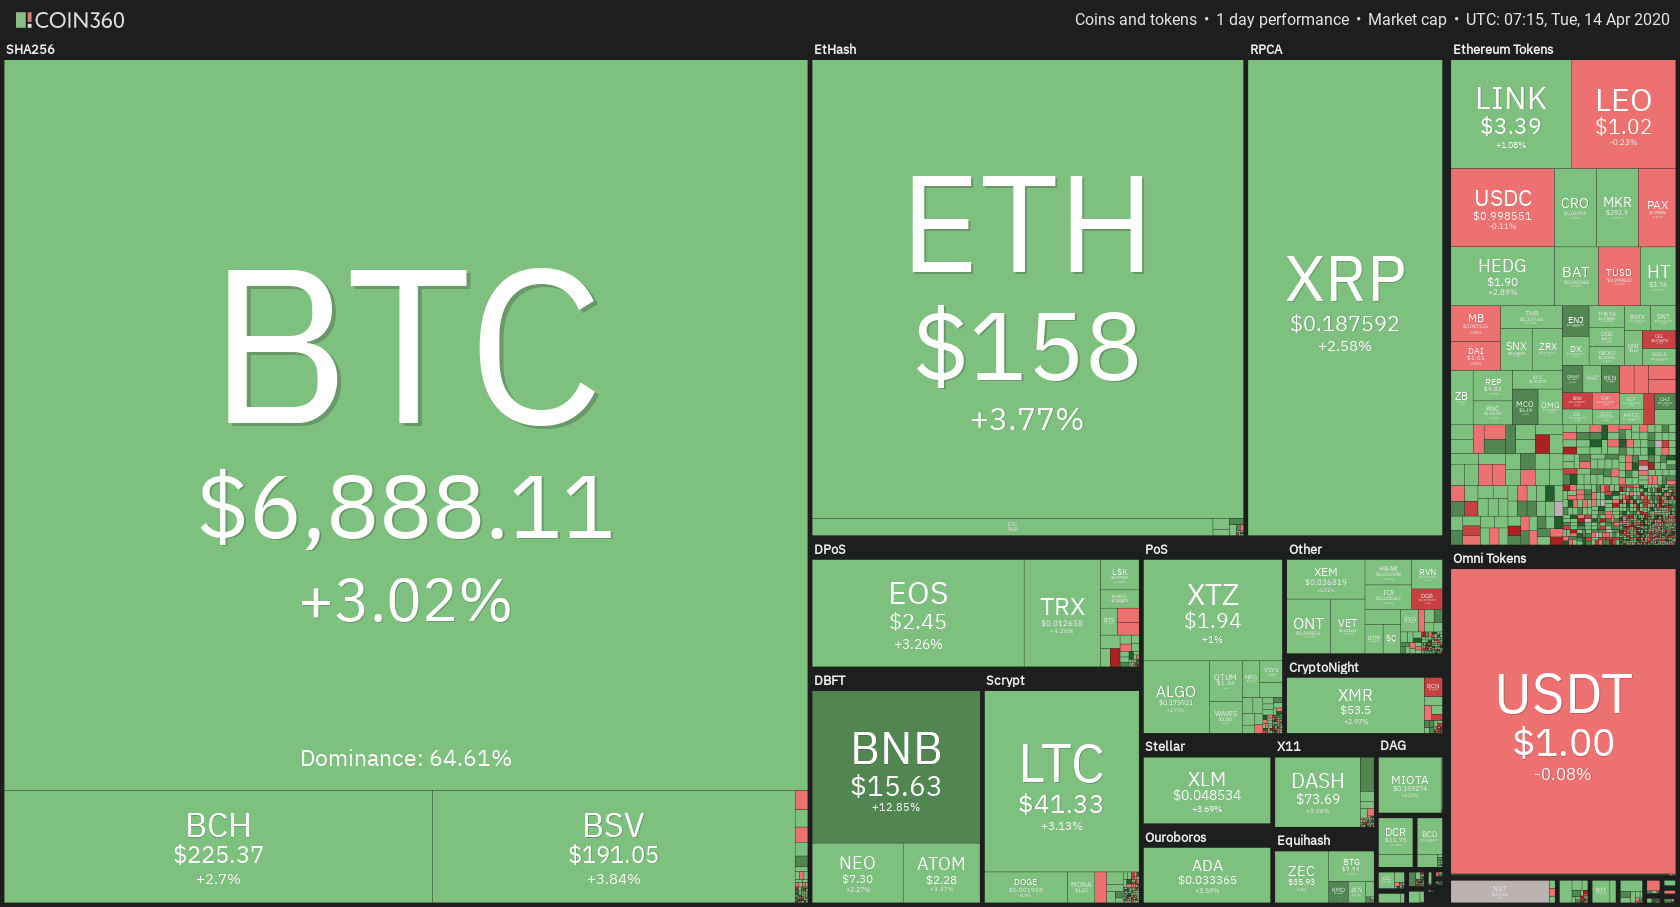
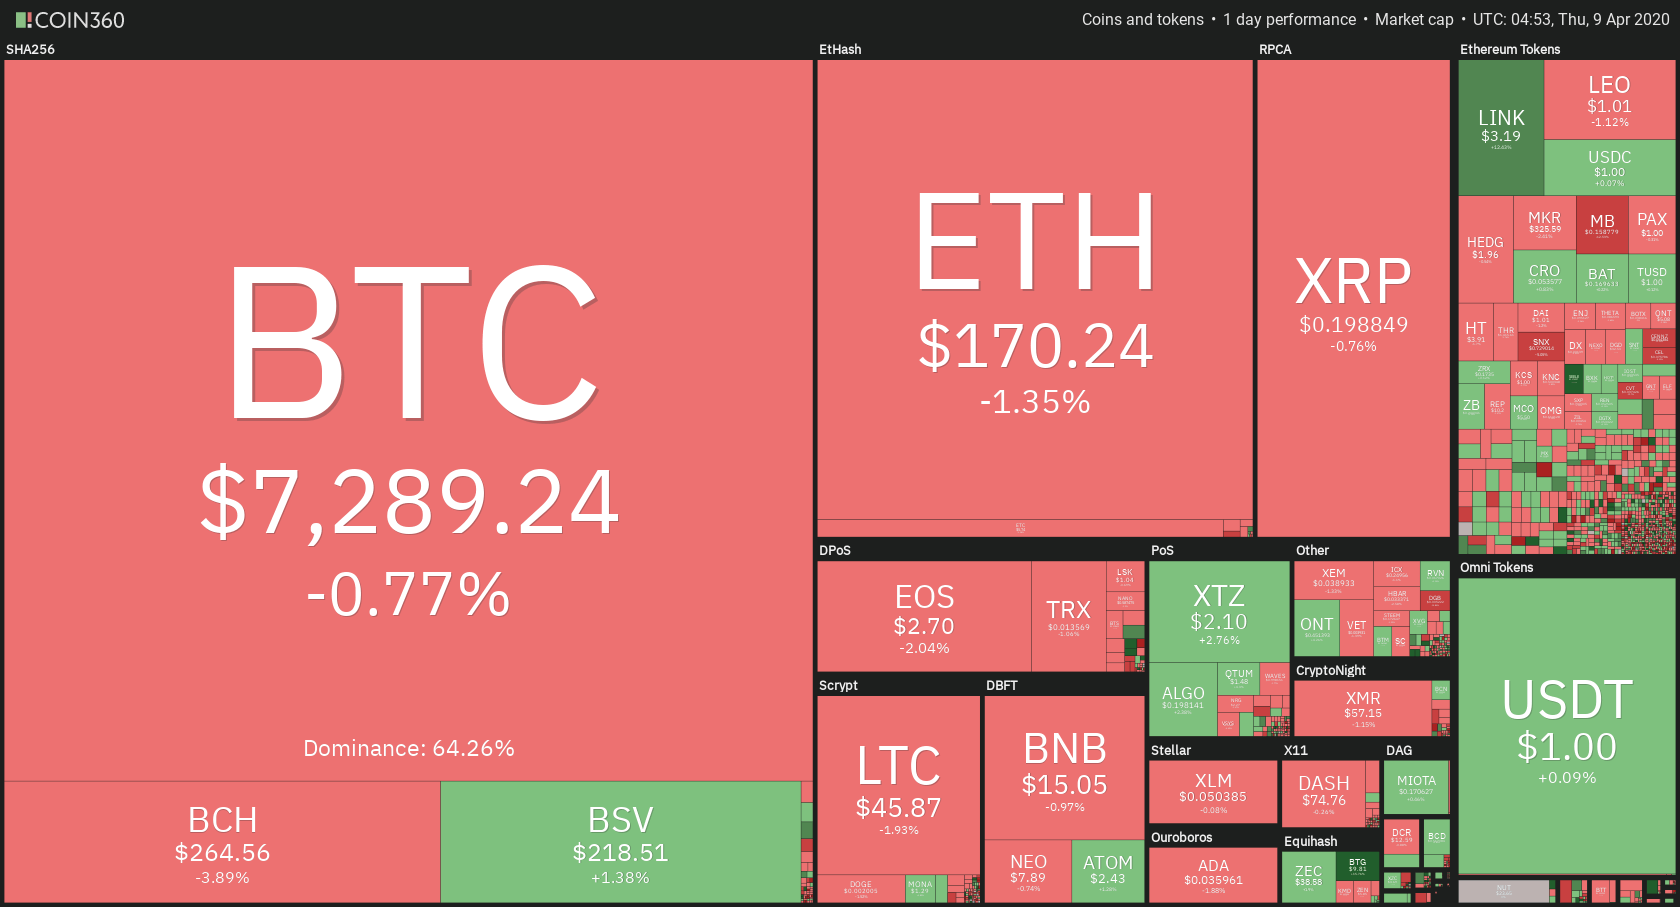
Stellar took the position of today’s most prominent daily gainer, with gains of 11.24%. Hive lost 33.46% on the day, making it the most prominent daily loser.

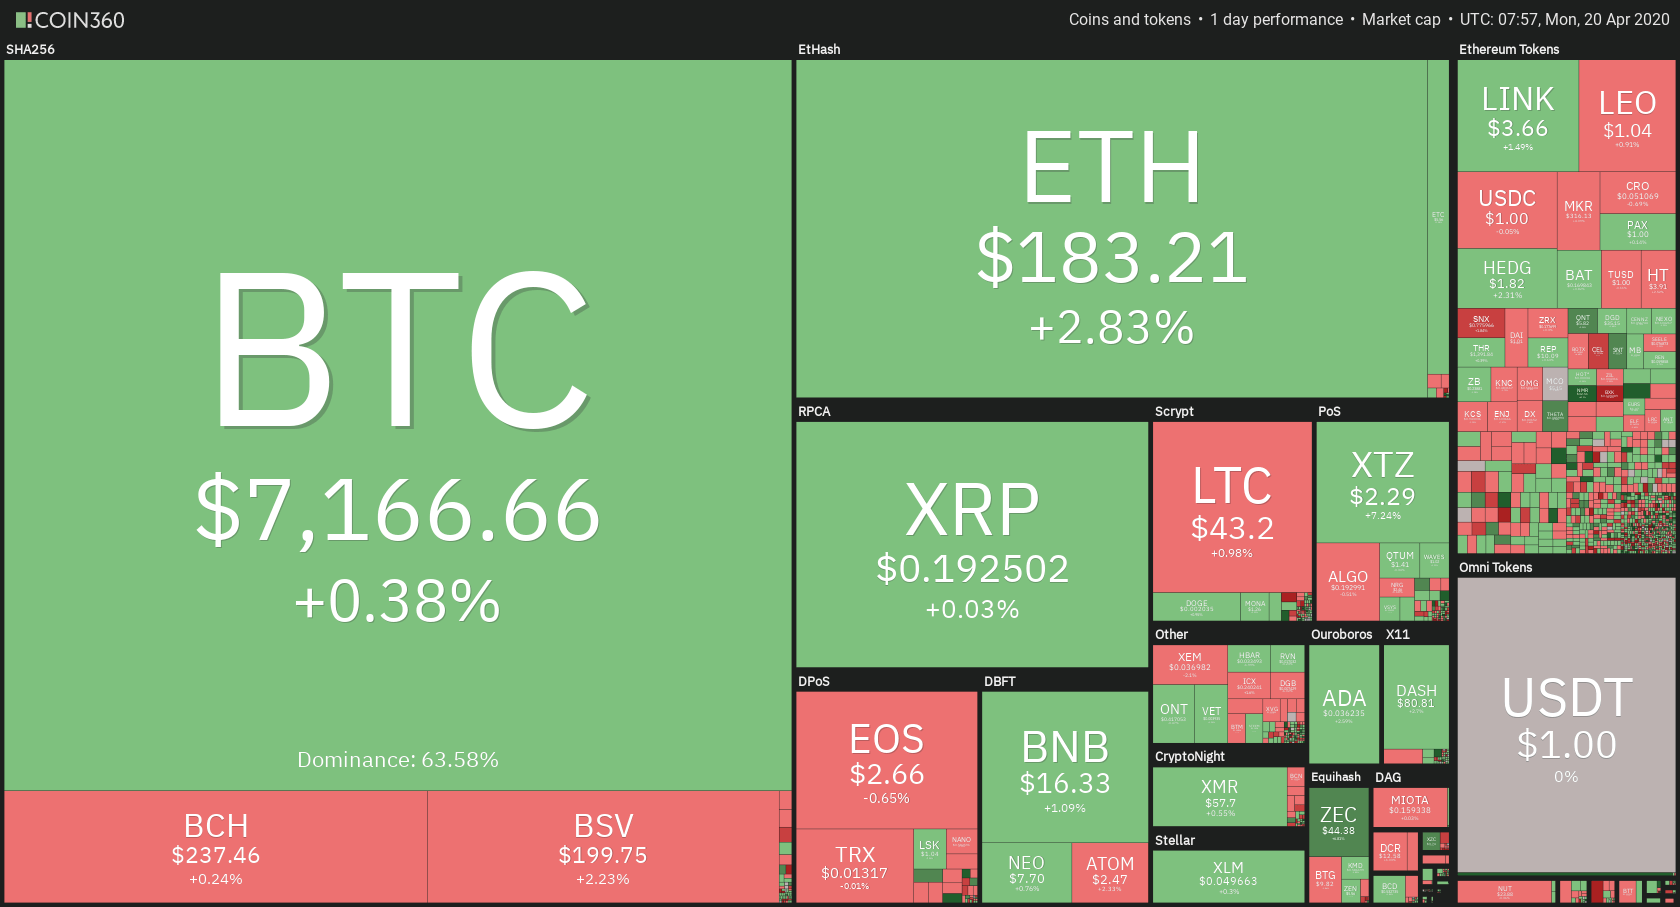
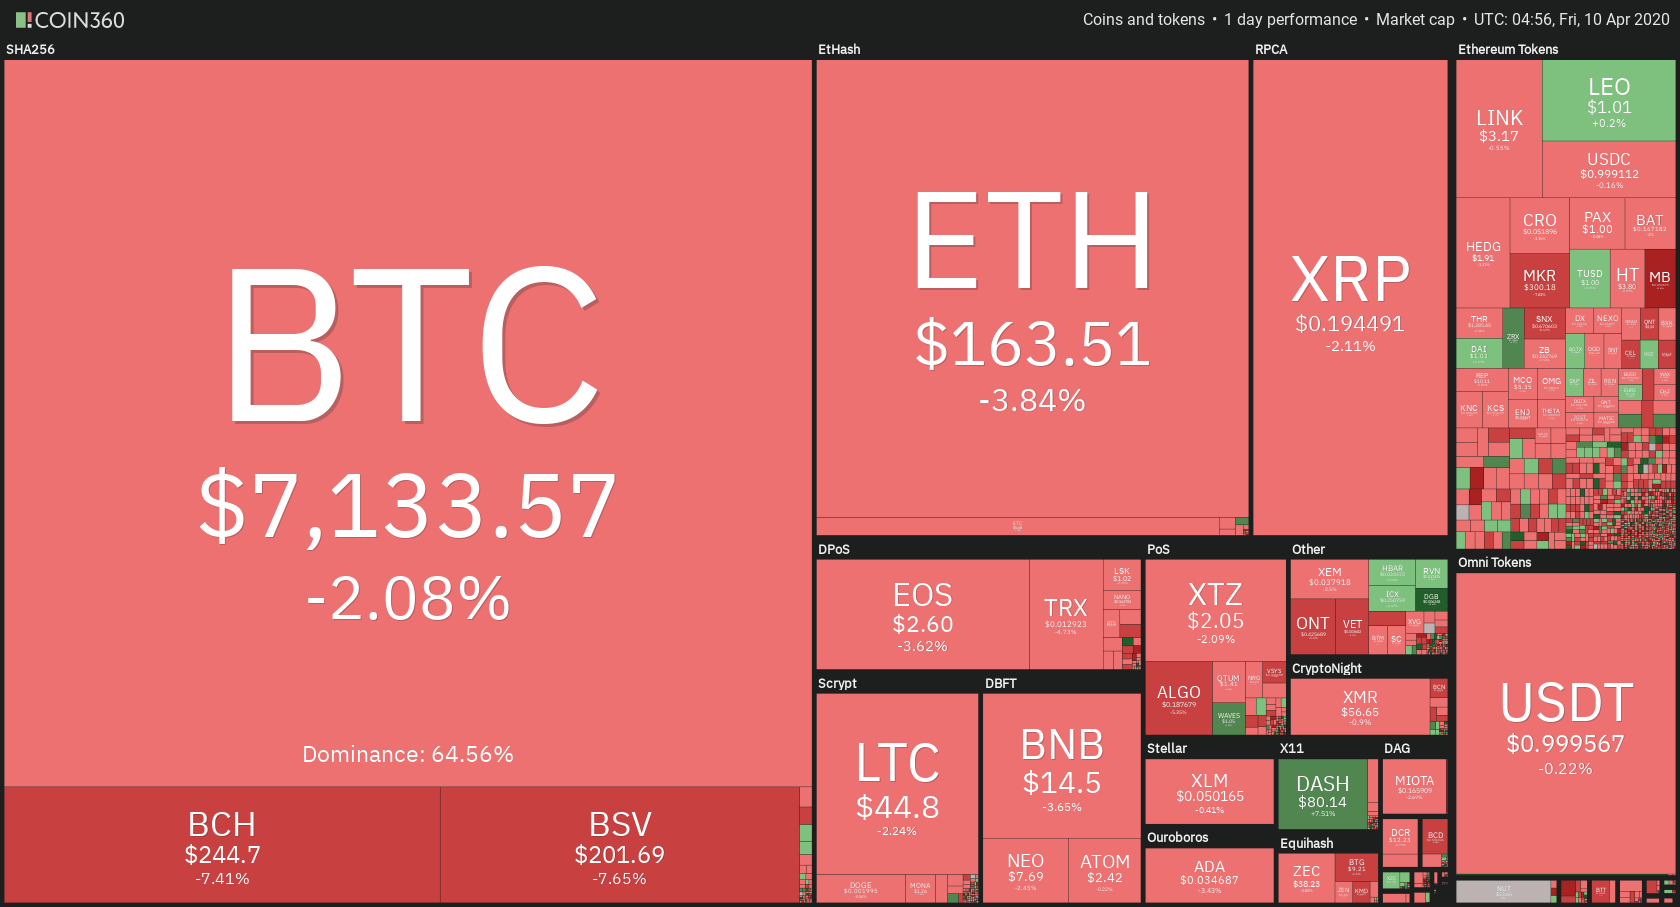
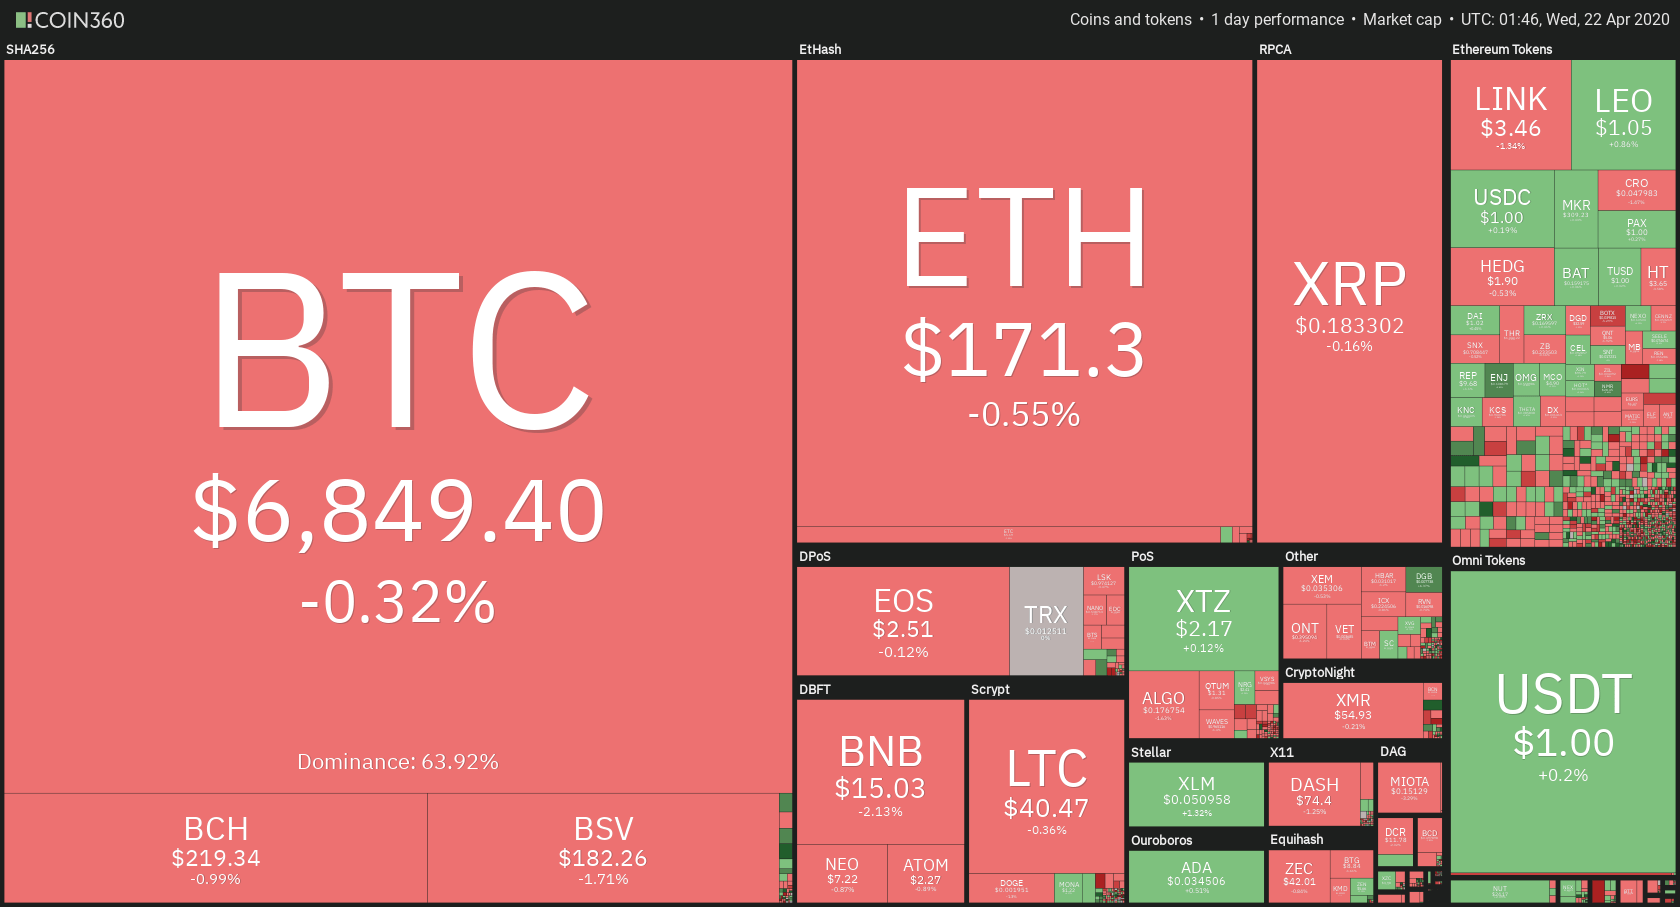
Bitcoin’s dominance decreased slightly compared to yesterday’s dominance levels. Its value is now 63.37%, which represents a 0.41% difference to the downside.

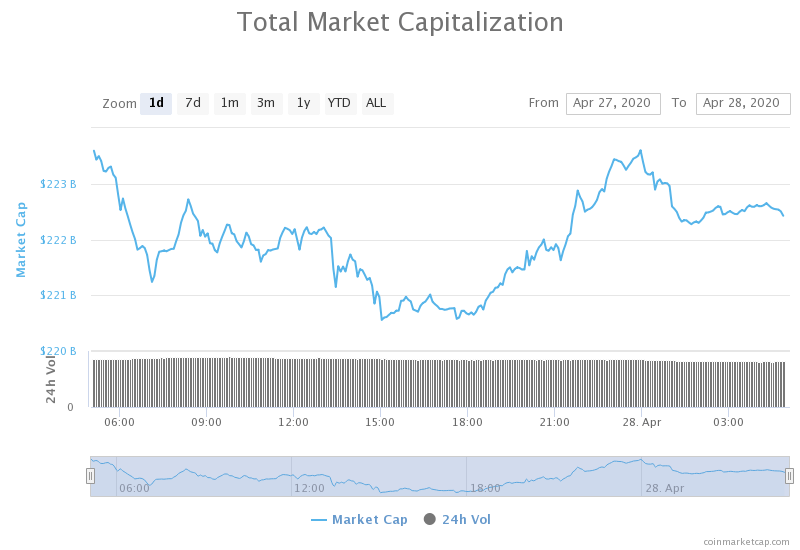
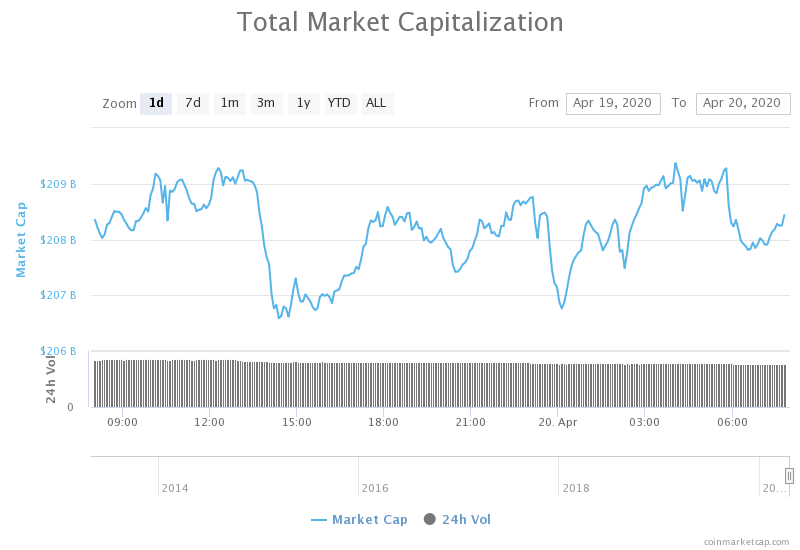
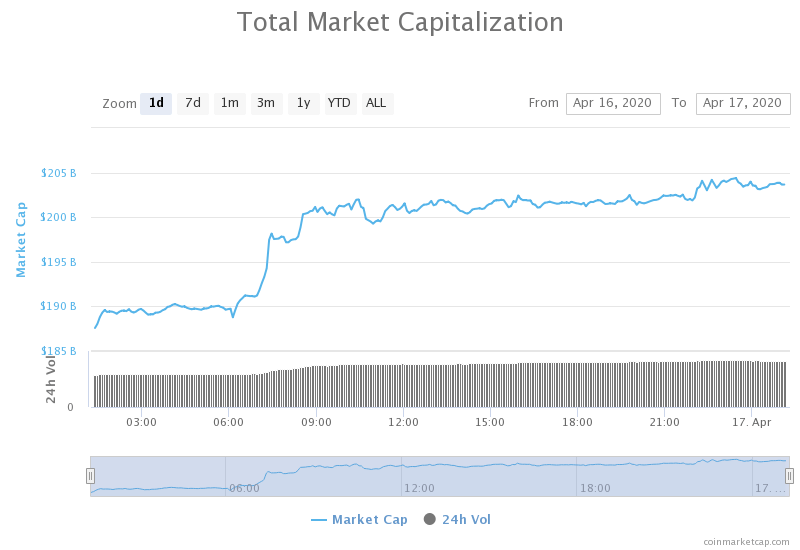
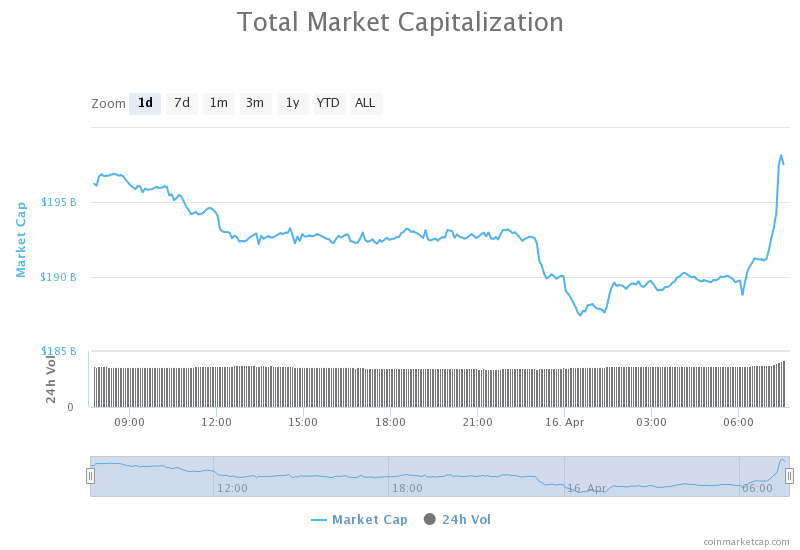
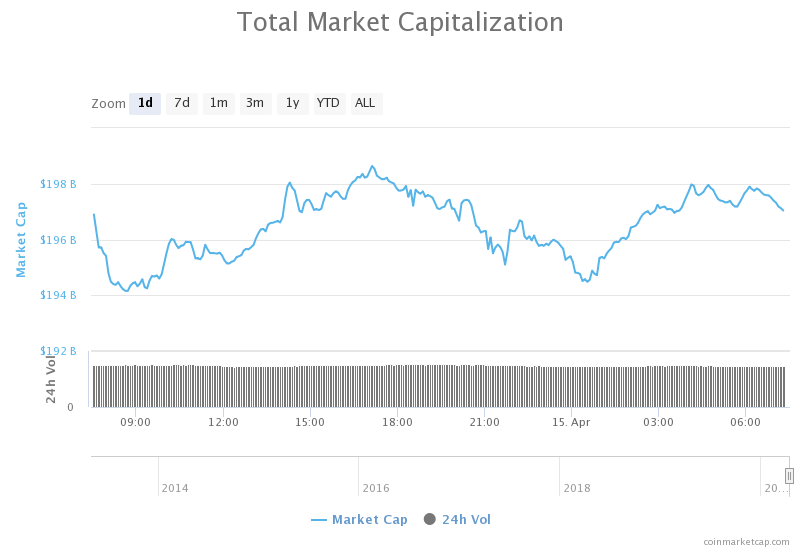
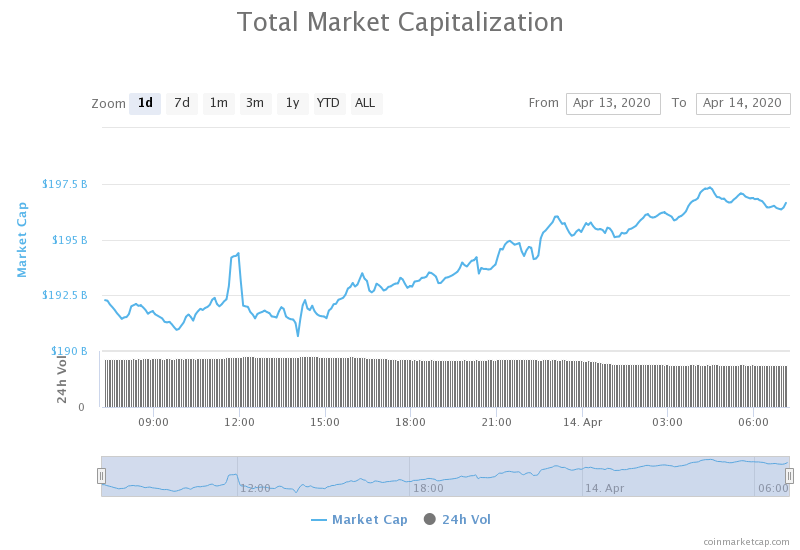
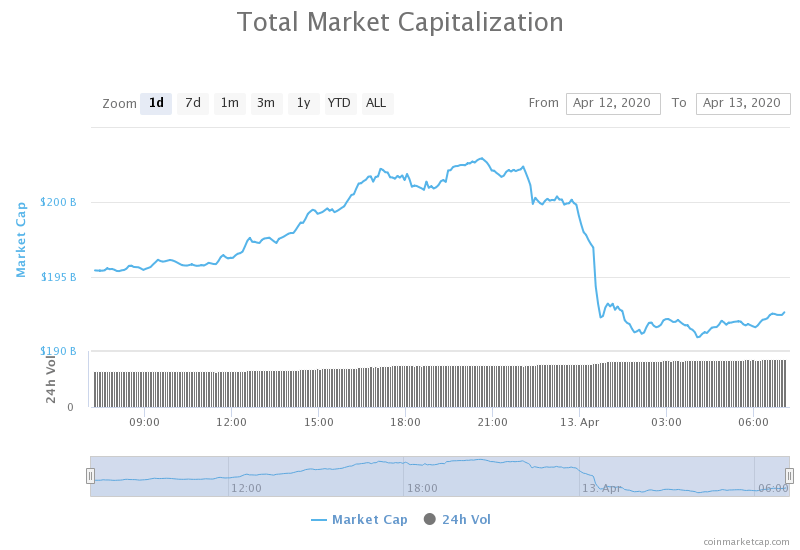
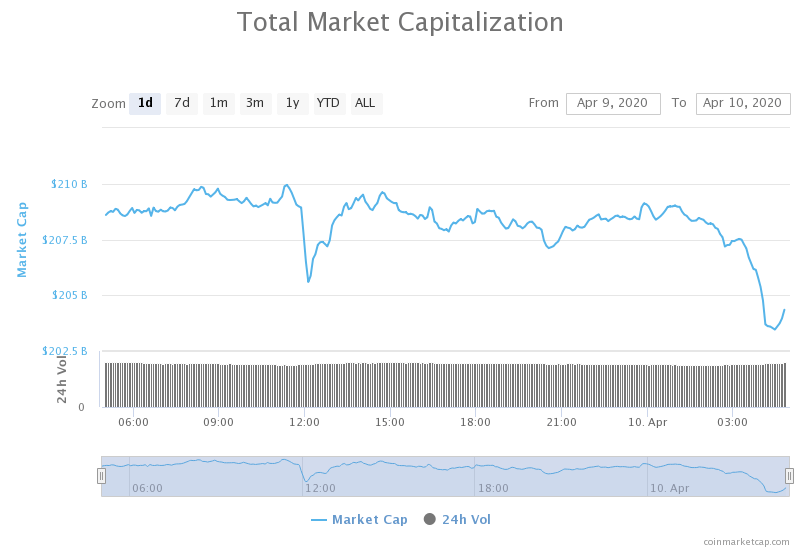
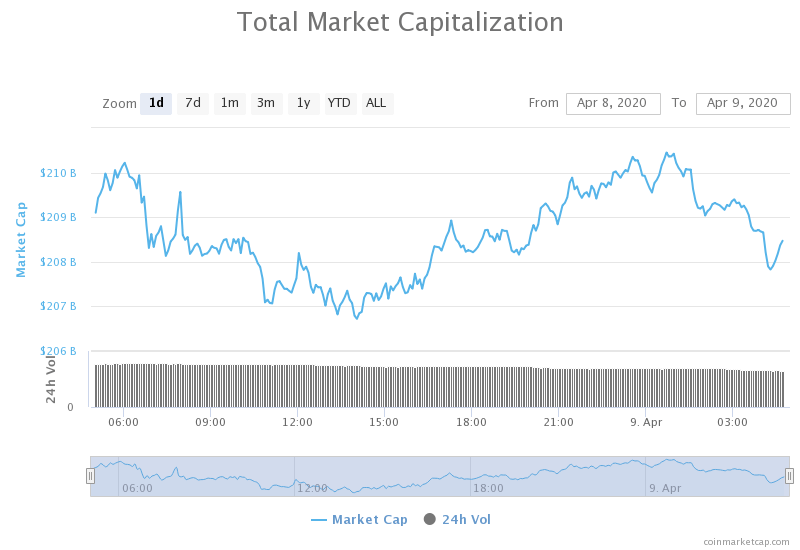
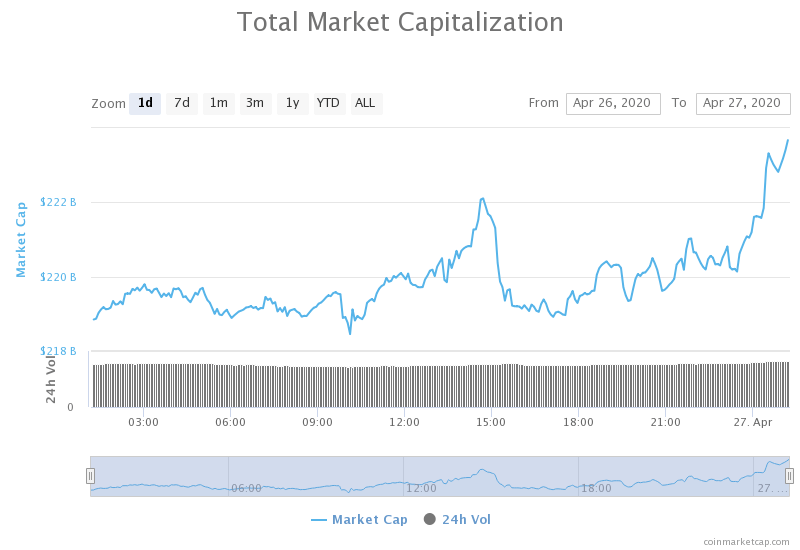
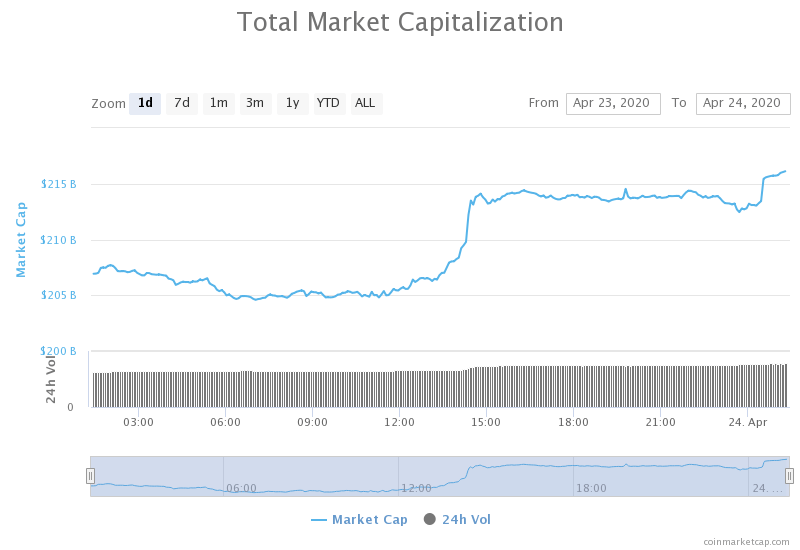
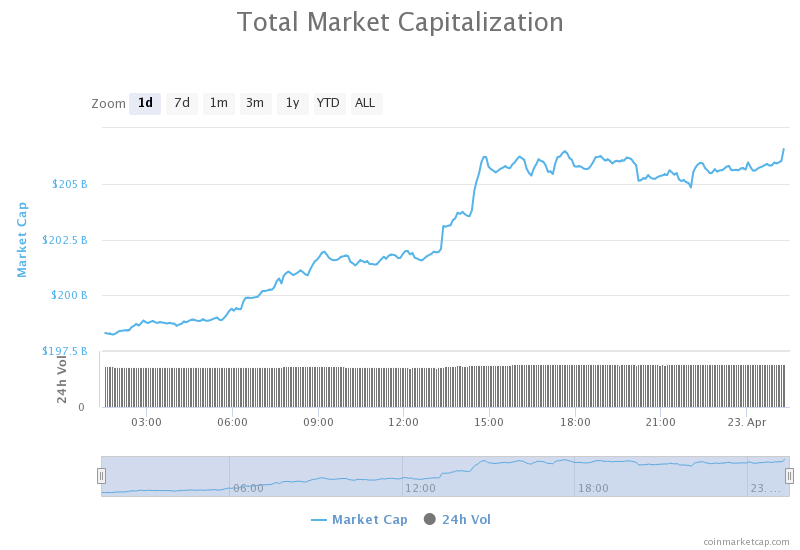
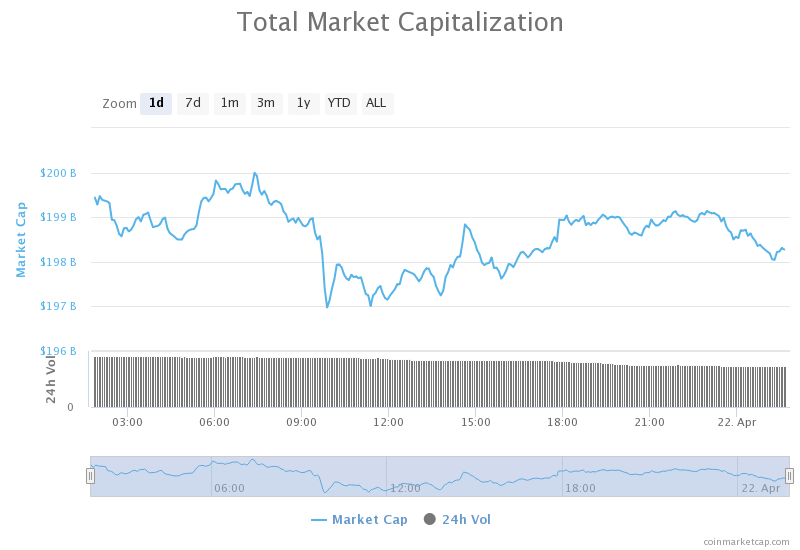
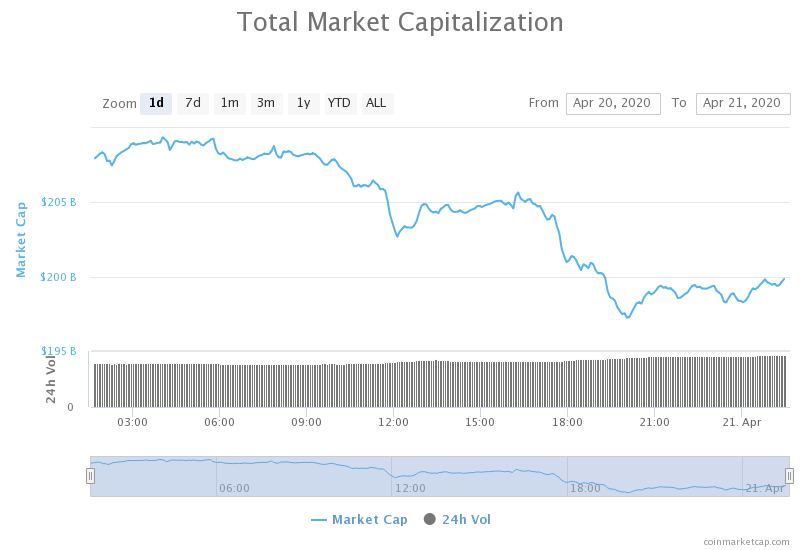
The cryptocurrency market capitalization pretty much stayed at the same place when compared to yesterday, with its current value being $222.50. This value represents a decrease of $0.52 billion when compared to the value it had yesterday.

Honorable mention

Ethereum

This year has not been good for financial markets. However, cryptocurrencies seem to be surviving the current situation a lot better. While not much has been made about Bitcoin’s gains of 7$ since the start of 2020, Ether has been performing amazingly. Its year-to-date price increase is roughly 50%. Ether’s price was trading for $129.89 on January 1st, 2020.

Many call the cryptocurrency market a safe haven. However, while it is true that it was less affected than the traditional markets, cryptos showed some degree of correlation with the other markets.

_______________________________________________________________________

Technical analysis

_______________________________________________________________________

Bitcoin

The largest cryptocurrency by market cap had a day of consolidating, with one attempt of breaking the $7,750 resistance level. While the price did break the level, it was short-lived, and BTC went below the level soon after. As it failed to break the $7,750 level, BTC started gaining momentum to the downside.


BTC’s volume stayed steady over the course of the day, while its RSI level went down from the near-overbought levels to just under 60.

Key levels to the upside                    Key levels to the downside

1: $7,750                                           1: $7,420

2: $8,000                                           2: $7,085

3: $8,650                                            3: $6,850


Ethereum

Ethereum spent the day consolidating as well. Unlike Bitcoin, the pressure was not just towards the upside. Ether had a couple of small pushes towards the upside and a couple of stronger ones to the downside. The $198 resistance level and $193.6 support level held up quite nicely, and the price remained within a range bound by these two levels. However, this narrow of a range will not last long, and Ethereum will have to break out to either side.


Key levels to the upside                    Key levels to the downside

1: $198                                                1: $193.6

2: $217                                              2: $185

                                                           3: $178.6


Ripple

XRP did not differ in its movements much from the other two top cryptocurrencies. After one shy attempt to break the $0.2 resistance level, which did not even reach the resistance line, XRP started moving towards the middle of the range-bound by $0.2 to the upside and $0.19 to the downside. There are no current indications of the short-term direction of XRP.


XRP’s volume remained at the same levels over the past couple of days, while its RSI level started dropping, currently being at 53.5.

Key levels to the upside                    Key levels to the downside

1: $0.2                                                1: $0.19

2: $0.205                                            2: $0.178

3: $0.227                                             3: $0.165

LAST HOUR NOTICE: Ripple just has made a large movement that broke the 0.2 resistance and made a new top above the one made on April 07. This 5 percent impulse has put it directly in an overbought condition but signaled a clear bullish move for this digital asset. It is expected a consolidation after the candle, but buyers may enter on the breakout of the 0.21 level.

Categories
Forex Market Analysis

Daily F.X. Analysis, April 28 – Top Trade Setups In Forex – Get Ready for C.B. Consumer Confidence

On Tuesday, the eyes will be on the U.S. Commerce Department, which will release March wholesale inventories (-0.5% on month expected) and advance goods trade balance (55.0 billion dollars deficit expected). The Conference Board will publish April Consumer Confidence Index (87.9 expected)S.P.SP/Case-Shiller will report 20-City Composite Home Price Index for February (+0.4% on month expected). Let’s look at today’s trade setups.

Economic Events to Watch Today     


EUR/USD – Daily Analysis

Today in the early Asian session, the EUR/USD currency pair is flashing red, and, having faced rejection at 1.0860, it pulled back mainly because the European leaders failed to reach on the agreement and left the ECB alone for the fight against coronavirus recession. That keeps the shared currency under pressure.

The broad-baseU.S.S. dollar latest recovery sentiment also pushes the currency pair lower. However, the pair’s sentiment will remain neutral while the pair is confined within the trading range of 1.0727-1.0860. A breakout could pave the way for at least a 100-pip rally, while a range breakdown would show the 2020 low of 1.0636. As of writing, the EUR/USD currency pair is currently trading at 1.0820 and consolidates in the range between the 1.0817 – 1.0837.

The direction in the currency pair would depend on Fed & ECB actions. It remains to see what the Federal Reserve and the European Central Banks Deliver during this week. Although, there is an option of increased bond purchases for both Central Banks but having eased aggressively between meetings.

The United States is struggling over the past two months in the fight against the coronavirus and having used multiple ways to tame this outbreak. So, as in result, the Federal Reserve can be quiet and measure the situation about the virus front, and the impact of the multiple easing measures announced over the past two months. 

In the meantime, the European leaders did not succeed in reaching an agreement on spending last week, left the European Central Bank alone during its tough time in a fight against the coronavirus-induced recession. Most of the observers think the ECB could hint that it will be ready to provide additional easing during the month of June. As a result, EUR/USD is more likely to suffer a range breakdown. 

Daily Support and Resistance

  • S1 1.0748
  • S2 1.0792
  • S3 1.0811

Pivot Point 1.0836

  • R1 1.0855
  • R2 1.0879
  • R3 1.0923

EUR/USD– Trading Tips

On Tuesday, the EUR/USD is trading sideways around 1.0828, despite the stronger Spanish Spanish Unemployment Rate from the Eurozone. The overall trading bias continues to be bearish as the EUR/USD prices are holding below 50 EMA, which is extending resistance around 1.0837 level. On the 4-hour chart, the EUR/USD may find resistance around 1.0837 level, and bullish breakout of this level can continue buying until 1.0889 level. Conversely, the bearish breakout of 1.0765 level can drive selling until 1.0649 level today, let’s look for selling trades below 1.0770 level today.  

GBP/USD – Daily Analysis

During Tuesday’s early Asian session, the GBP/USD currency pair failed to extend its four-day winning streak and dropped from the weekly high to 1.2415 while representing 0.13% losses on the day, as the broad-baseU.S.S. dollar regains the bids on optimism about reopening thU.S.S. economy. In the meantime, the intensifying fears and uncertainty abouU.K.K. lockdowns extension in the wake of coronavirus (COVID-19) also keeps the currency pair under pressure. The GBP/USD pair is trading at 1.2442 and consolidates in the range between the 1.2407 – 1.2450.

News oU.K.K. Prime Minister Boris Johnson returning back to the office helped the currency pair to register a 3-day winning streak on Monday after the Tory leader gave a cautious statement regarding the pandemic fears and showed some willingness to ease the lockdown despite coming coronavirus cases.

As per the latest report, the virus figures from thU.K.K. registered further 360 people died due to the virus in hospitals, reaching the total number of deaths to 21,092. Whereas, the death toll fell to the lowest in a month as compared to previous months.

Apart from this, the on-going criticism on Tory government’s about the handling of coronavirus crisis, and shortage of medical supplies also keeps the UK PM worried about lifting the lockdowns restrictions.

On the other hand, the Tory government’s struggles for further tests in order to achieve 100,000 a day target as well as calling for public questions to be discussed in the daily briefings also showing the UK PM Johnson and Tory party’s interest for the country while the chancellor’s struggles to keep small companies comfortable are also favorable for Tory’s despite recent criticism about the cracks in the mechanism.

Daily Support and Resistance

  • S1 1.2315
  • S2 1.2371
  • S3 1.24

Pivot Point 1.2427

  • R1 1.2456
  • R2 1.2483
  • R3 1.2539

GBP/USD– Trading Tip

The GBP/USD is exhibiting bullish bias as it’s trading at 1.2459 area, having violated the sideways trading range of 1.2450 – 1.2396. Closing of candles outside this range will determine further trends in the market. The Cable has closed candles above 50 EMA, which are extending support to the GBP/USD pair. 

On the upper side, the GBP/USD may find resistance around 1.2523, and violation of this can lead Sterling further higher until 1.2626 area. While immediate support holds around 1.2396 level, let’s look for buying trades above 1.2399 and bearish trades below 1.2520 level today. 

USD/JPY – Daily Analysis

The USD/JPY lost 0.2% to 107.28. The Bank of Japan announced that it would purchase the required amount of Japanese government bonds with no border, compared with a previous target of Y80 trillion, while keeping its benchmark rate at -0.1% unchanged. This morning, official data showed that Japan’s jobless rate edged up to 2.5% in March (as expected) from 2.4% in February.

ThU.S.S. Dollar Index, which dropped below the 100 marks earlier in the day, is up 0.12% on the day at 100.47 and stays on track to close the 4th-straight day in the positive area. The latest pullback of the U.S. dollar kept a lid on bullish moves in the pair. Currently, the USD/JPY is trading at 107.27 and consolidates in the range between the 106.98 – 107.86. However, investors are cautious and waiting for a fresh catalyst before placing any position.

Looking forward, the virus headlines will be the key catalyst, while thU.S.S. data about the Consumer Confidence and Richmond Fed Manufacturing could offer intermediate moves. ThU.S.S. Commerce Department will release March wholesale inventories (-0.5% on month expected) and advance goods trade balance (55.0 billion dollars deficit expected). 

The Conference Board will publish April Consumer Confidence Index (87.9 expected). S.P./Case-Shiller will report the 20-City Composite Home Price Index for February (+0.4% on month expected).

Daily Support and Resistance    

  • R3 108.25
  • R2 107.94
  • R1 107.59

Pivot Point 107.29

  • S1 106.94
  • S2 106.64
  • S3 106.29

USD/JPY – Trading Tips

The USD/JPY is trading with a bearish bias on Tuesday, as its prices are holding above the triple bottom support level of 107. Since Japanese yen is gaining bullish momentum, driving USD/JPY down, the violation of the 107 level can lead the pair towards the next support area of 106.550. The resistance today stays around 107.400, and above this, the next resistance may be found around 107.640. 

The 50 EMA is left around 107.570, which is far away around from current market prices of 107.045. While the MACD is suggesting selling bias among USD/JPY traders, so let’s keep an eye on the 107 level as we may see selling below this, and buying above this level today. 

All the best for today! 

Categories
Forex Elliott Wave

Understanding the Complexity in Wave Analysis – Advanced Level

Introduction

Financial markets are the result of human interactions where one party buys and the other sells. The results of these actions are reflected in a price chart. 

R.N. Elliott studied the interactions between these two forces that move the market. In his study, Elliott detected that specific patterns repeat themselves over time. He also identified that the price tended to move in impulsive and corrective movements.

Elliott recognized that as time progresses, the price develops movements that, in its basic unit, correspond to segments, those that have a low level of complexity. 

The complexity increases at an additional level as these segments complete a series of three or five movements, giving origin to the wave. 

Later, as a wave is completed, another movement emerges, giving course to a new wave. As this ordered sequence advances in time, the price forms structures that we could call as “poli-waves,” which Elliott defined in the form of patterns corresponding to a structure or wave of higher degree.

The interaction between different sequences of “poli-waves” or basic wave patterns, give origin to a more complex structure, which we can define as “multi-wave.” In turn, when a succession of 3 or 5 multi-waves completes, the price action creates a structure of a higher degree whose complexity level is higher. We can call this complex structure as “macro-wave.”

Multi-wave Construction

Multi-waves are complex structural series that is characterized by having at least one poly-wave in their internal structure. The type of waves can be impulsive or corrective.

Impulsive Multi-waves. They are structures in which one or several of their impulsive waves are poly-waves. Its training requirements are as follows:

  1. Of the three impulsive forward waves, only one must be a poly-wave; the other two can be simple movements.
  2. At least one of the two corrective waves can be a poly-wave, the other can be a poly-wave or a simple wave.
  3. The longer-lasting corrective wave 2 or 4 will occur just before or after the extended wave.

The following figure shows the different patterns of multi-waves of impulsive nature, being the second case, which corresponds to the third extended wave the most common.

Corrective Multi-wave. In the same way as multi-impulsive waves, the corrective multi-waves must contain specific requirements, which are described below.

  1. One or two of the waves that are divided into five waves in the longer pattern should be able to be subdivided as a poly-wave. If it has only one structure subdivided into five, it will be a Flat, while if it has two structures divided into five, it will be a zigzag pattern.
  2. The multi-wave B wave is likely a corrective poly-wave.

The following figure shows two types of corrective multi-waves.


Complex Multi-waves Construction

The complex multi-wave analysis does not differ from complex wave analysis composed of poly-waves. The difference is that complex multi-waves are composed of multi-wave groups and not poly-waves.

Macro-waves Construction

As the market develops, the structural series can be grouped as multi-waves and thus form a macro-wave

Impulsive Macro-waves. This type of structure is composed of a multi-wave in one of its three impulsive waves, while the other two will be a poly-wave. 

Corrective Macro-waves. Must contain at least one multi-wave, and another wave must be a poly-wave. If the structural series has two multi-wave, the complex structure will be a zigzag, and its formation has only one multi-wave, the corrective structure will be a flat pattern.

Conclusions

In this educational article, we have seen how, as time advances, the complexity of the waves also increases. 

However, the wave analysis whose level of complexity is higher, being it a multi-wave or macro-wave, must be realized in the same way to that studied in the wave analysis section corresponding to the intermediate level wave analysis. 

This situation leads us to conclude that the market behaves in a fractal way over time, and wave analysis does not change regardless of the proportion of time studied.

In the next educational article, we will expand on the concepts of alternation and extensions.

Suggested Readings

  • Neely, G.; Mastering Elliott Wave: Presenting the Neely Method; Windsor Books; 2nd Edition (1990).
Categories
Forex Course

106. Introduction to Elliot Wave Theory

Introduction

Elliot Wave Theory is one of the most popular strategies applied by traders. This theory works exceptionally well if read correctly. In the early 1930s, there was this professional accountant named Ralph Nelson Elliot. He was a stock market expert who analyzed the data of stocks closely for 75 years’ timeframe. He thought that markets move in random chaotic directions but later realized that they don’t. After years of analysis and research, he published a book titled The Wave Principle. This book explained in detail about the theory he had proposed.

Elliot Wave Theory

According to Elliot, the market moves in repetitive cycles. The cause for these cycles is the emotions of mass retail investors, primarily due to psychological factors. It was seen that the upward and downward swings in prices caused by the collective psychology of traders always showed a repetition in the same manner. These swings were referred to as ‘waves.’

So, if traders have a clear understanding of these repetitive cycles, one can predict future price movements. In fact, traders can identify points precisely where the market is going to reverse.

Basic Terminologies

There quite a lot of terms involved in the Elliot Wave Theory. For now, we shall the two most fundamental terms and understand others in the later lessons.

Wave

Elliot proposed that trends are formed as a result of the psychology of investors. He proved that swings formed by this mass psychology were a recurring pattern. And these swings were termed as waves. Elliot’s theory, to an extent, resembles the Dow theory, which also mentions that prices move in ‘waves.’

Fractals

Generally speaking, fractals are structuring whose split parts are like a similar copy of the whole. These structures repeat themselves even on an infinite scale. Apart from individual stocks, Elliot discovered that stock indices showed the same recurring structures. So, he moved to the futures market to analyze if the theory worked there as well.

Predicting the Market with Elliot Waves

Elliot studied the stocks in detail and concluded that predictions could be made using the characteristics of wave patterns. It is known that for a trending market, there is a pullback or correction for it. It is usually said that “what goes up, must come down.” That is, price action is divided into trends and corrections. Trends represent the main direction of the market, while corrections are against the trend.

The Elliot wave theory also uses a similar principle. There is an Impulsive wave that moves in the same directions as the larger/main trend. It always shows five waves in its pattern. Then there is a corrective wave that travels in the opposite direction of the larger trend. On a smaller scale, under each impulsive wave, five other waves can be found again. And such a pattern repeats by going into smaller and smaller scales.

Wondering what the above figure represents? To interpret it, stay tuned for the next lesson.

[wp_quiz id=”71282″]
Categories
Forex Market Analysis

Daily F.X. Analysis, April 27 – Top Trade Setups In Forex – COVID19 Continues to Play! 

On the forex front, the U.S. dollar eased against other major currencies, with the Dollar Index slipping 0.2% on the day to 100.29. In the U.S., the Federal Reserve Bank of Dallas will release its Manufacturing Activity Index for April (-75.0 expected).

Economic Events to Watch Today     


EUR/USD – Daily Analysis

The EUR/USD currency pair continues to taking bids and rose above 1.0840 regions, mainly due to the positive German virus stats report. The broad-based U.S. dollar draw offers and reporting losses on the day in the wake of risk-on market sentiment, which eventually supports the currency pair. 

The bullish trend in the currency pair could be short-lived because the European leaders failed to agree on a comprehensive coronavirus stimulus package last week. The EUR/USD pair is currently trading at 1.0841 and consolidates in the range between the 1.0812 – 1.0843.

On the other hand, the German Chancellor Merkel showed some willingness to offer almost EUR 1 trillion as financial support for a coronavirus recovery package. The leaders failed to reach an agreement on the size of the fund, and it should share the burden of financing with those countries that run fiscal and trade surpluses.

As per the German disease and epidemic control center, Robert Koch Institute (RKI) showed the number of confirmed coronavirus cases increased to 155,193, with a total of 5,750 deaths registered so far. Moreover, the institute surveyed that a total of 114,500 people has recovered from the virus. 

Daily Support and Resistance

  • R3 1.0847
  • R2 1.0836
  • R1 1.0829

Pivot Point 1.0819

  • S1 1.0812
  • S2 1.0802
  • S3 1.0795

EUR/USD– Trading Tips

The EUR/USD pair continues trading in a buying mode around 1.0858, despite weaker manufacturing and services PMI figures from the Eurozone. The overall trading bias continues to be bearish as the EUR/USD prices are holding below 50 EMA, which is extending resistance around 1.08500 level. On the 4-hour chart, the EUR/USD is likely to find resistance below the symmetric triangle pattern, which may drive the selling bias in the pair. Currently, it’s holding the pair over 1.08580, which is the triple yop level. Above this, a slight bullish recovery can be seen until 1.0889 level. While bearish breakout of 1.0765 level can drive selling until 1.0649 level today, let’s look for selling trades below 1.0770 level today.  

GBP/USD – Daily Analysis

The GBP/USD currency pair succeeded in extending its 4th consecutive day winning streak and rose above mid-1.2400 while representing 0.60% gains on the day mainly due to the broad-based U.S. dollar weakness in the wake of better mood in the market. Apart from this, the on-going criticism about the U.K.’s handling of the coronavirus (COVID-19) crisis and Tory government’s stand on Brexit keeps the currency pair’s gain limited for the time being. A

The GBP/USD pair is currently training at 1.2452 and consolidates in the range between the 1.2360 – 1.2455. However, the UK PM Boris Johnson came back from the pandemic infection, which satisfied the buyers. The Uk PM Boris Johnson will likely take its seat back from the acting chief Dominic Raab after getting permission from the doctors at the Chequers. Although, Boris Johnson said that he is looking forward to going to Downing Street on Monday.

The U.k. PM Boris Johnson was absent since early April due to the coronavirus decease. Whereas, the UK Tory government getting an inadequate response from the entire nation about the handling of the coronavirus (COVID-19) crisis despite the hard efforts from the Chancellor Rishi Sunak and Health Secretary Matt Hancock, and the Deputy PM Dominic Raab.

Although, the shortage of medical supplies and the surge in the death toll have forced the United Nations (U.N.) poverty expert Philip Alston to attack the U.K.’s coronavirus response as “utterly hypocritical.

Moreover, the Health Secretary’s optimistic target of 100,000 tests a day got a surprise on Saturday after the government needed to avail the military helps to overcome the 29,000 marks.

Daily Support and Resistance

  • R3 1.2379
  • R2 1.2375
  • R1 1.2371

  Pivot Point 1.2367

  • S1 1.2363
  • S2 1.2359
  • S3 1.2356

GBP/USD– Trading Tip

The GBP/USD showed a slight bullish reversal to place a high around 1.2434, although the bullish trend wasn’t long enough as prices recorded soon. At the moment, the Cable is trading at 1.2437 area, after violating the resistance level of 1.2420 level and now this level is working as a support. A bullish breakout of 1.2368 level can extend the buying trend until 1.2420 level today. Elsewhere, the support continues to hold around 1.2258 level. The 50 EMA and MACD are both are suggesting selling bias in the Cable. So let’s look for selling trades below 1.2399 and bullish above 1.2420 level today. 

USD/JPY – Daily Analysis

The USD/JPY is consolidating in a tight trading range of 107.675 level to 106.950 level, mainly due to the risk-on market sentiment keeps the safe-haven Japanse lower and providing support to the currency pair. The U.S. announced 4.427 million initial jobless claims for the preceding week overnight, with an unparalleled 26 million people dropping their jobs since late March.

At the USD front, the U.S. dollar took bids due to mixed risk sentiment, which is starting to dominate the markets and caused the bearish pressure to remain intact. The U.S. Dollar Index, which dropped below the 100 marks earlier in the day, is up 0.12% on the day at 100.47 and stays on track to close the 4th-straight day in the positive area.

The latest pullback of the U.S. dollar kept a lid on bullish moves in the pair. Currently, the USD/JPY is trading at 107.27 and consolidates in the range between the 106.98 – 107.86. However, investors are cautious and waiting for a fresh catalyst before placing any position.

Whereas, the multiple diverging factors failed to provide any meaningful direction or assist the pair in breaking through a narrow trading band held since the beginning of this week. The reason behind the risk-on market sentiment is the report regarding the passage of another $484 billion U.S. economic support package by the U.S. Senate. 

While the latest modest recovery in crude oil prices also keeps the market sentiment calm. Looking ahead, the eyes will remain on the Core Durable Goods Orders m/mas that’s due during the U.S. session in order to forecast further trends in the USD related pairs. 

Daily Support and Resistance    

  • R3 107.84
  • R2 107.73
  • R1 107.62

Pivot Point 107.51

  • S1 107.4
  • S2 107.29
  • S3 107.17

USD/JPY – Trading Tips

The USD/JPY is mostly trading bearish within a narrow trading range of 107.720 – 107 zones. At the moment, the USD/JPY is holding at 107.197, and the triangle pattern that is formed during the previous week still lasts.  

The triangle pattern is prolonging resistance around 107.550, along with support around 106.980. If USD/JPY manages to violate the descending triangle pattern, we may see pair dropping towards 106.200. While on the upper side, a bullish breakout of 108 can lead USD/JPY prices towards 109.100. The leading indicator, such as MACD and 50 EMA, are supporting bearish bias in the market today. 

All the best for today! 

Categories
Crypto Market Analysis

Daily Crypto Review, Apr 27 – Bitcoin stopped by the $7,750 resistance – What’s to come next?

The cryptocurrency market continued its bullish momentum and went after new highs over the weekend. Bitcoin is currently trading for $7,698, which represents an increase of 1.52% on the day. Meanwhile, Ethereum gained 0.95% on the day, while XRP gained 1.4%.

Kyber Network took the position of today’s most prominent daily gainer, with gains of 28.05%. DigiByte lost 12.59% on the day, making it the most prominent daily loser.

Bitcoin’s dominance decreased slightly compared to Friday’s dominance levels. Its value is now 63.78%, which represents a 0.34% difference to the downside.

The cryptocurrency market capitalization increased over the weekend, with its current value being $223.02. This value represents an increase of $12.77 billion when compared to the value it had on Friday.

Honorable mention

StorJ

Storj, a decentralized storage network, has launched a program that provides free storage to COVID-19 research participant organizations on April 22.

Storj’s storage program is set to provide each of the qualifying organizations with 1 (one) terabyte of cloud storage completely free of charge. Storj has decided to commit up to 5 (five) petabytes of storage toward COVID-19 research in total. It will also consider requests for additional resources exceeding 1 (one) terabyte.

_______________________________________________________________________

Technical analysis

_______________________________________________________________________

Bitcoin

The largest cryptocurrency by market cap had a weekend of consolidation and indecisiveness. While the most recent spike brought BTC to higher levels and reach $7,811, the fact of the matter is that the $7,750 level held up quite nicely and that the Bitcoin bears did not let the price to stay above this level.


If Bitcoin goes over $7,750 support level, we can expect a sharp increase in price. However, if that does not happen, we are more likely to expect a heavy selloff at below $7,420.

Key levels to the upside                    Key levels to the downside

1: $7,750                                           1: $7,420

2: $8,000                                           2: $7,085

3: $8,650                                            3: $6,850


Ethereum

Ethereum followed Bitcoin to the upside and ended up in a narrow range between $193.6 and $198. However, Ethereum’s move towards the upside was much more stable than Bitcoin’s move. The second-largest cryptocurrency by market cap will not be staying in this range for long as it is too narrow. Its fair will most likely be decided by Bitcoin’s movement in the near future.


Ethereum’s volume held its level throughout the weekend, while its RSI is at 65.

Key levels to the upside                    Key levels to the downside

1: $198                                                1: $193.6

2: $217                                              2: $185

                                                           3: $178.6


Ripple

XRP made a slight increase in value over the weekend as well but had the same fate as Bitcoin. While its price increase is not insignificant, the fact that it got stopped by the $0.2 resistance level says a lot in regards to the bull vs. bear presence. XRP might be forming a double top at the $0.2 level, which may trigger a selloff in the short term.


XRP’s volume stayed at the same level throughout the weekend, while its RSI level shot up to 62.

Key levels to the upside                    Key levels to the downside

1: $0.2                                                1: $0.19

2: $0.205                                            2: $0.178

3: $0.227                                             3: $0.165

Categories
Forex Videos

When Is It TimeTo Get Out Of A Forex Trend?

When is a trend likely to end?

The one common thing that all traders have is the desire to enter a trade that turns into an extended rally and bags an awful lot of pips. In reality, it doesn’t often turn out like that. Trends run out of momentum, price action turns abruptly, sometimes without any clear indication as to why it happened. And Traders become frustrated with the number of stop-outs they have to endure while waiting for the profitable trades to materialize.

So what are the main reasons that trends end?


This is a screenshot of the GBPUSD pair on a 1-hour time frame. Firstly we note the extended rally of 483 pips to the upside. The rally ends at the end of the US trading session, Where us Traders will have no doubt taken their profits before the end of the session. And we’re at the start of the Asian session price action begins to fall lower. In fact, it falls 200 pips and where this trend finishes due to the US retail sales economic data figure which was released at 1:30 GMT on the 15th of April and which was – 8.7% month-on-month, and where this very poor number was seen as a fallout from the coronavirus pandemic.

Price action then turns north, where we have another rally to the upside of 138 pips and which runs out of steam at the end of the European session and part way into the US session.

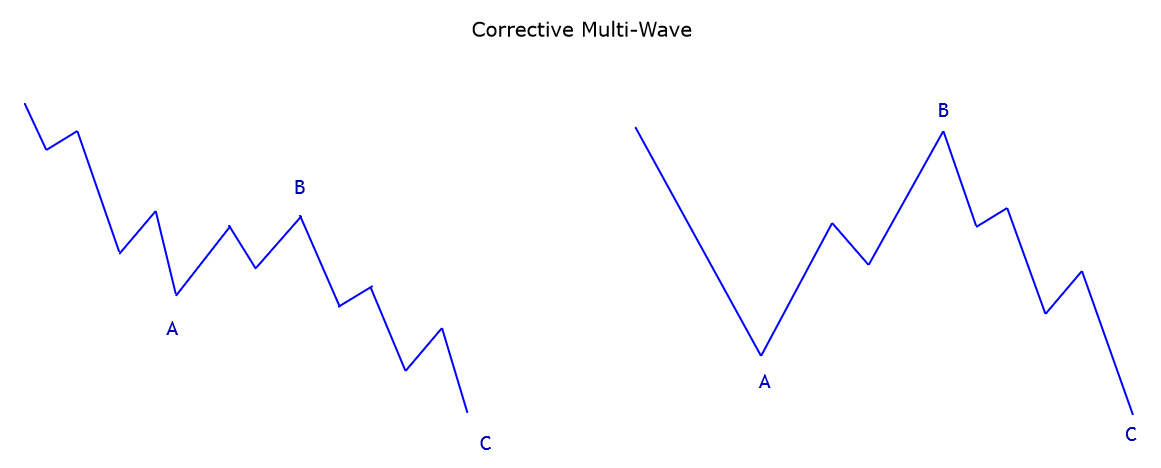
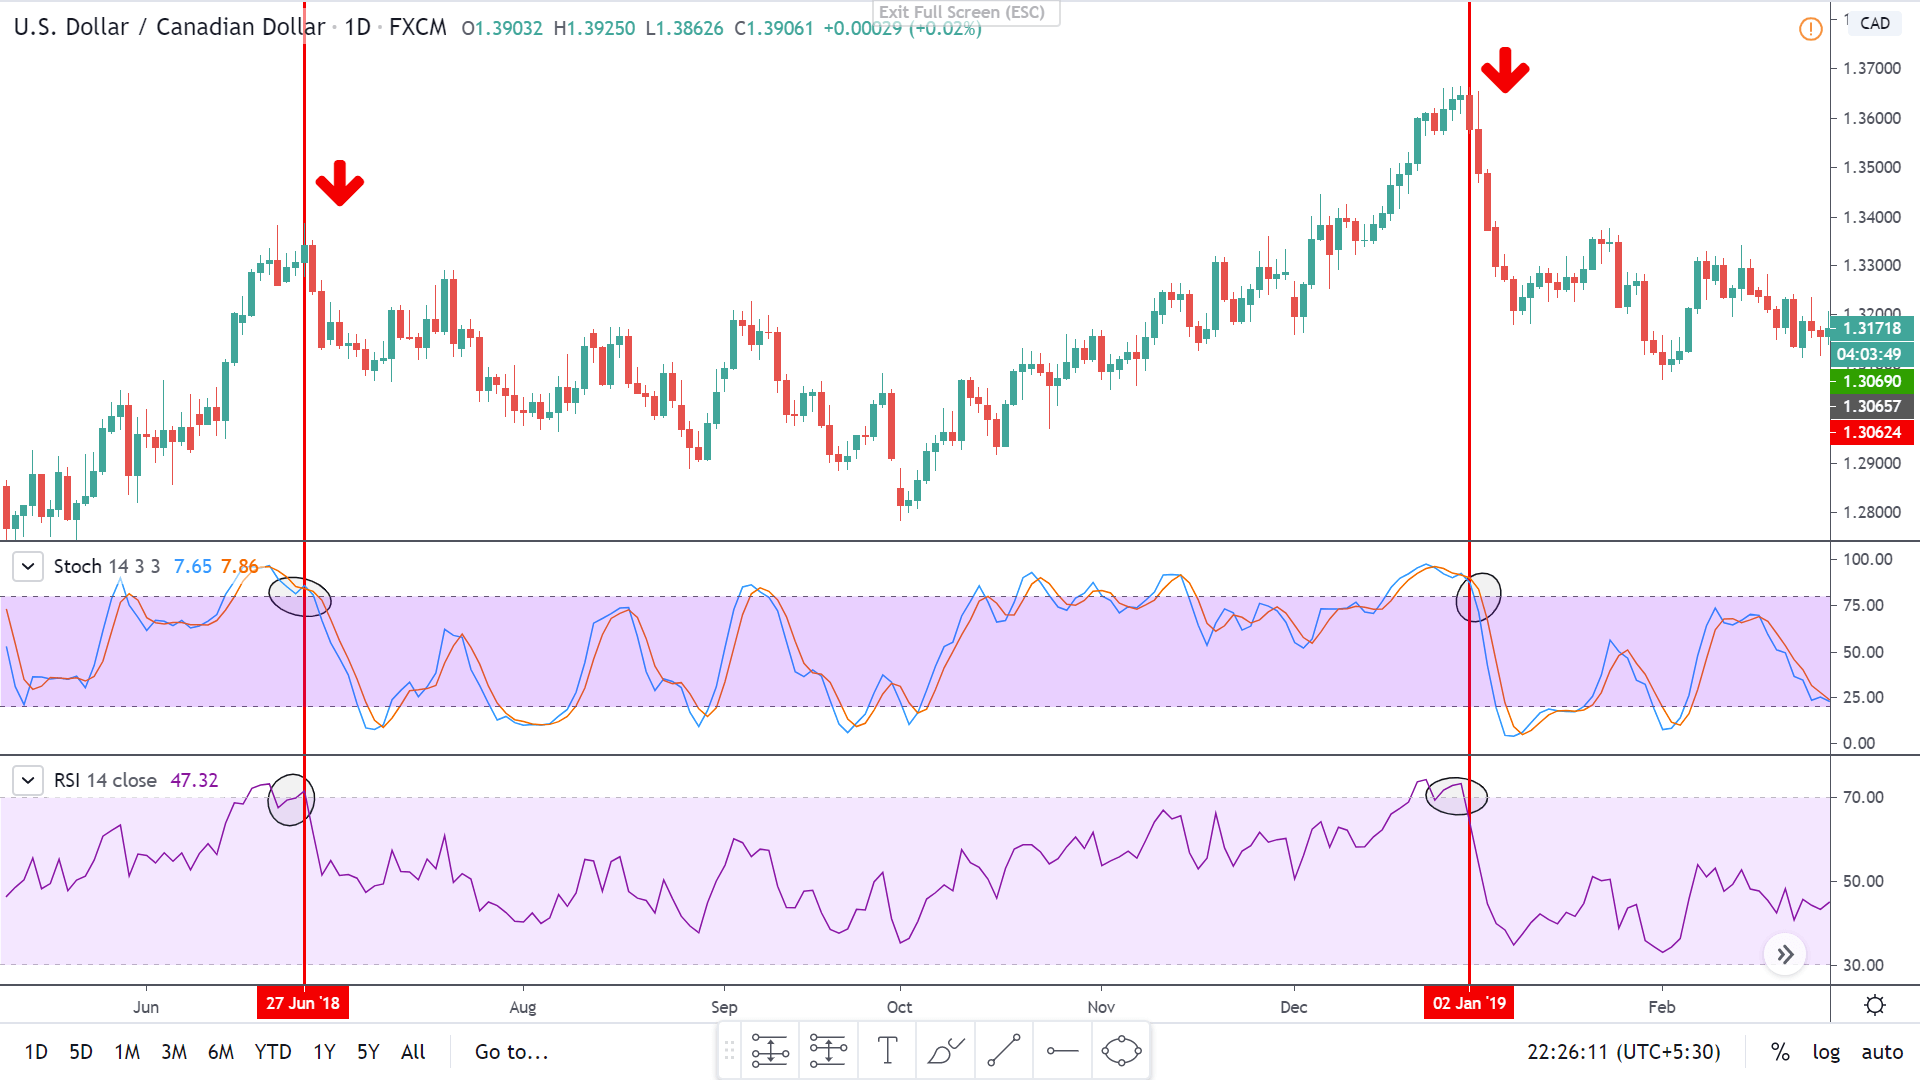
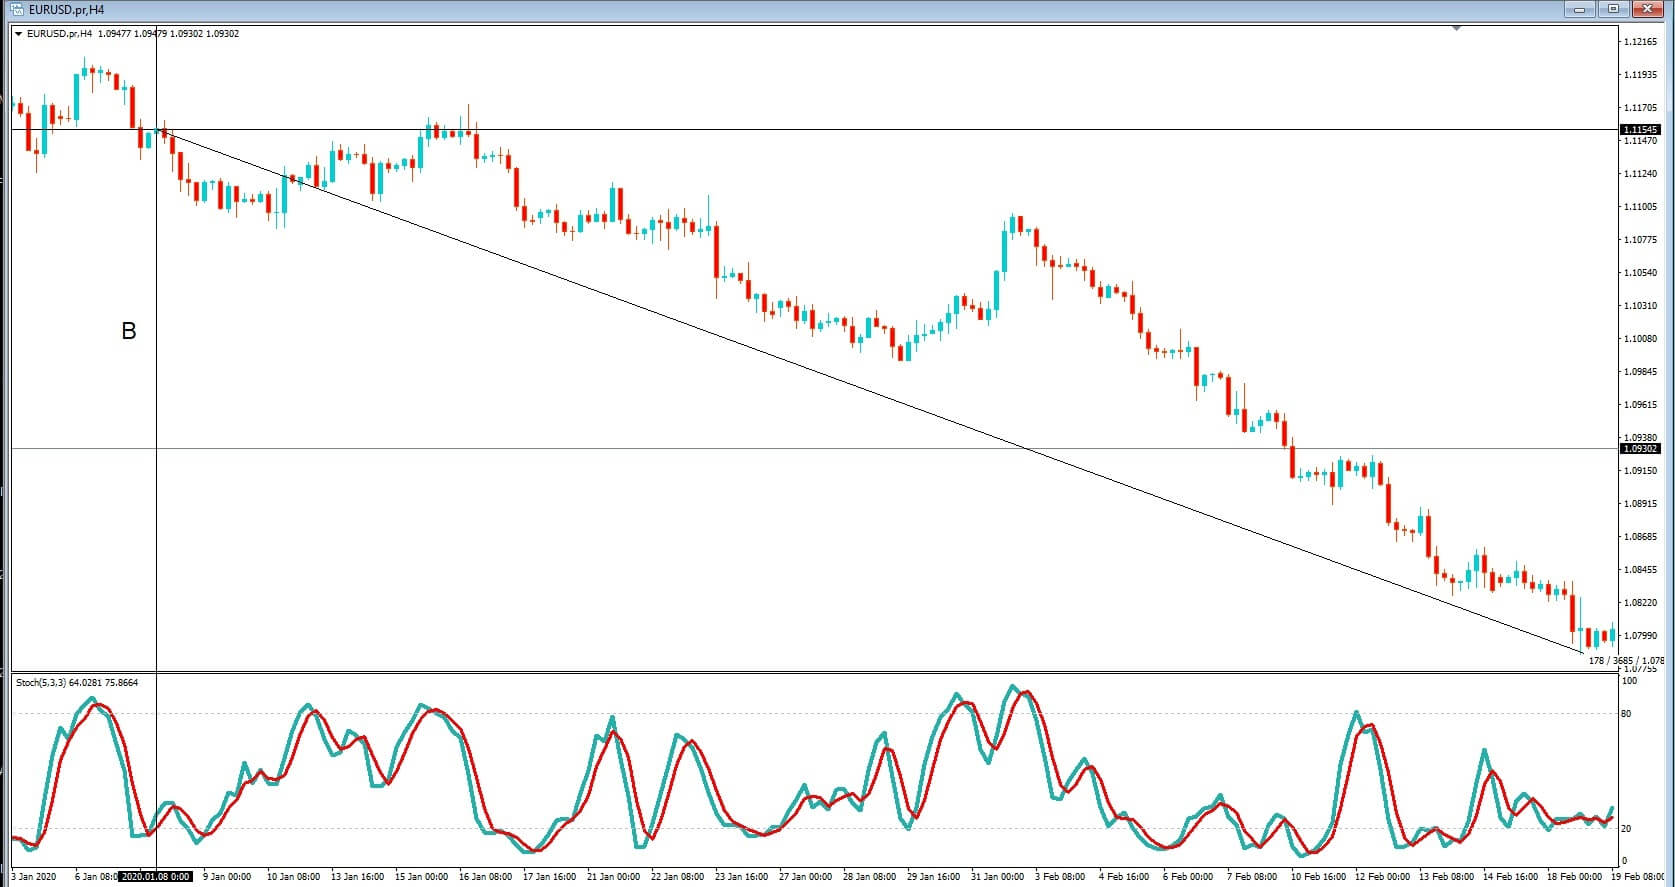
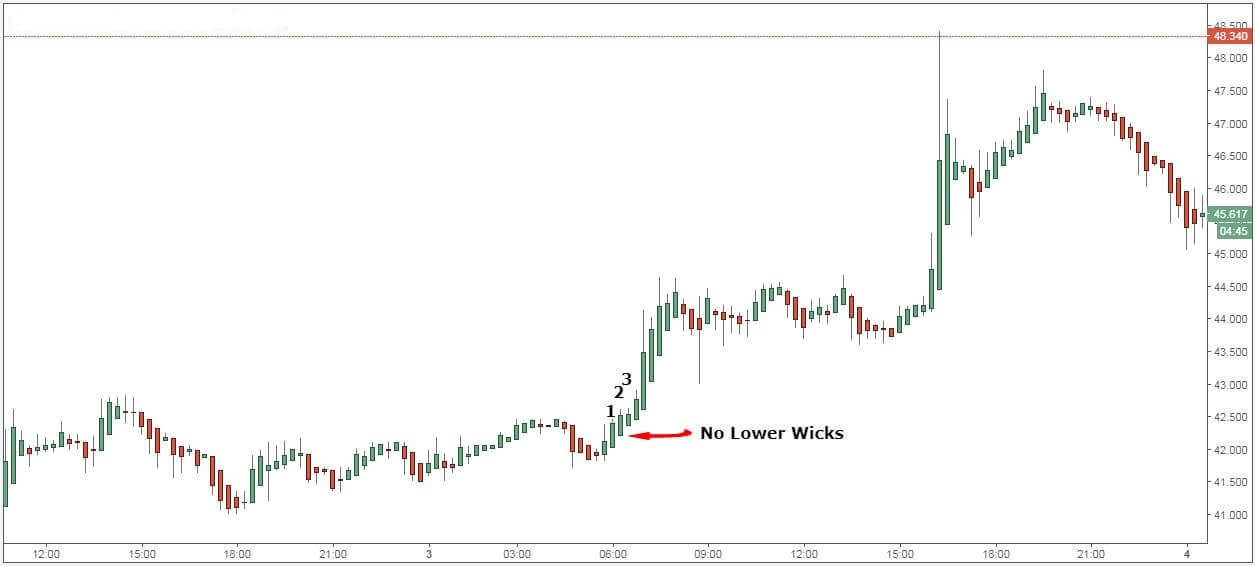
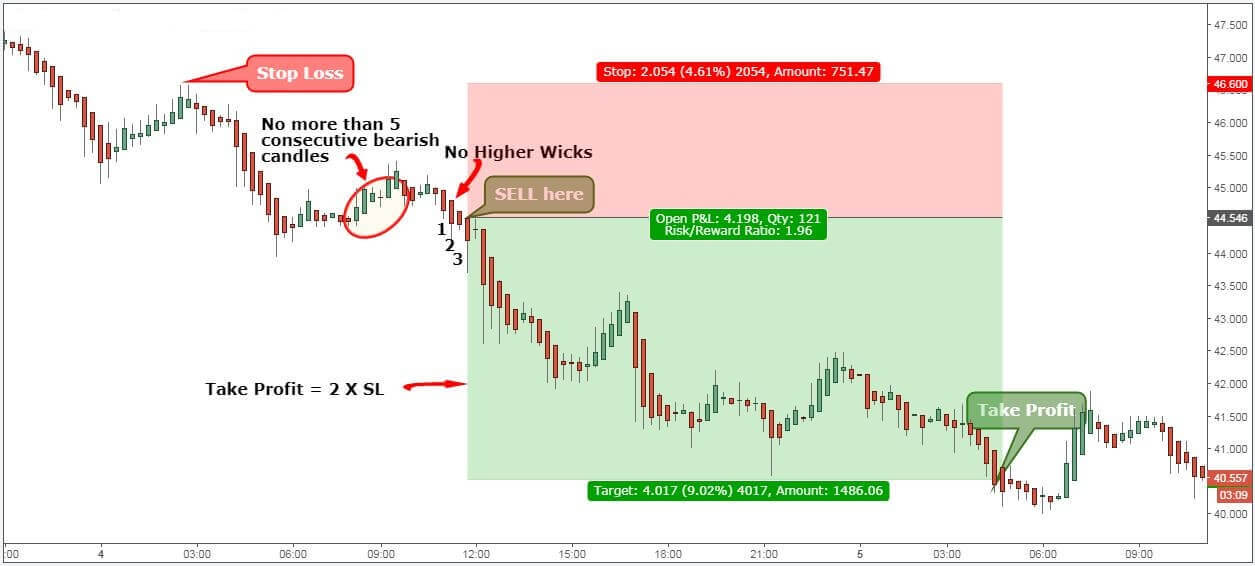
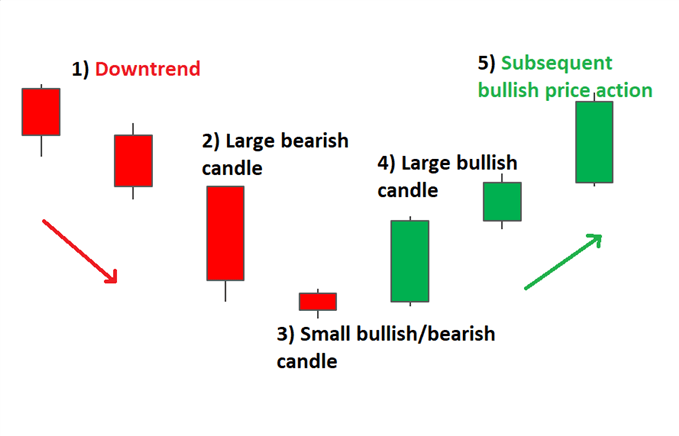
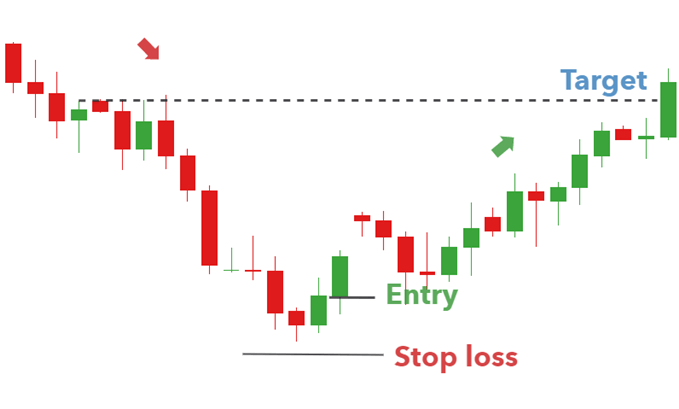
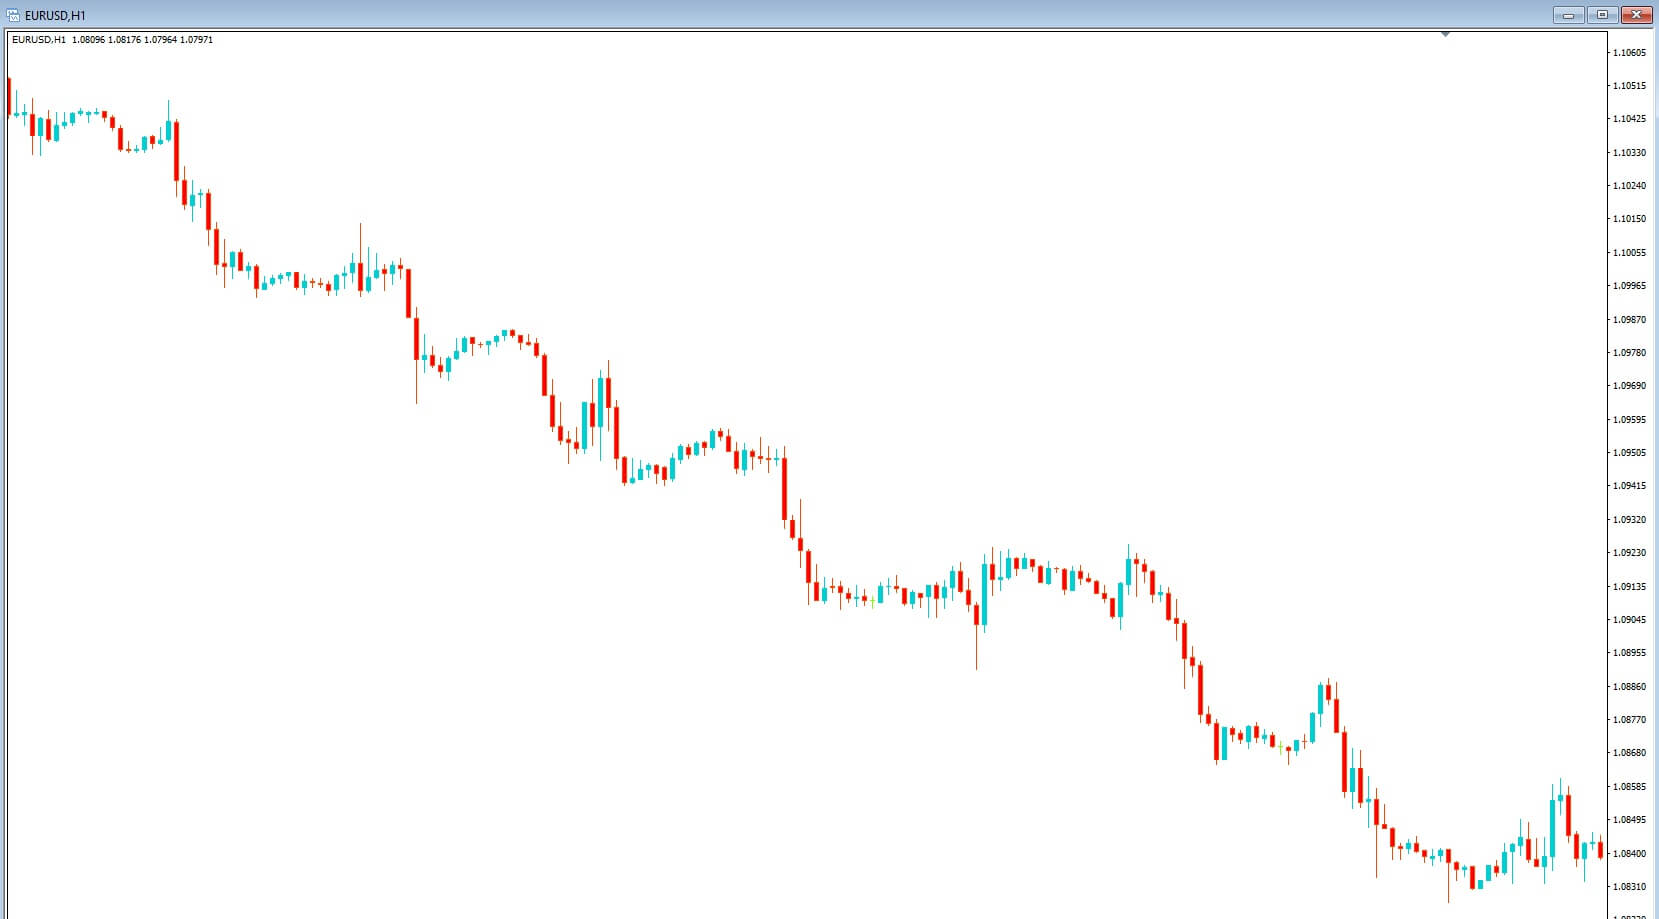
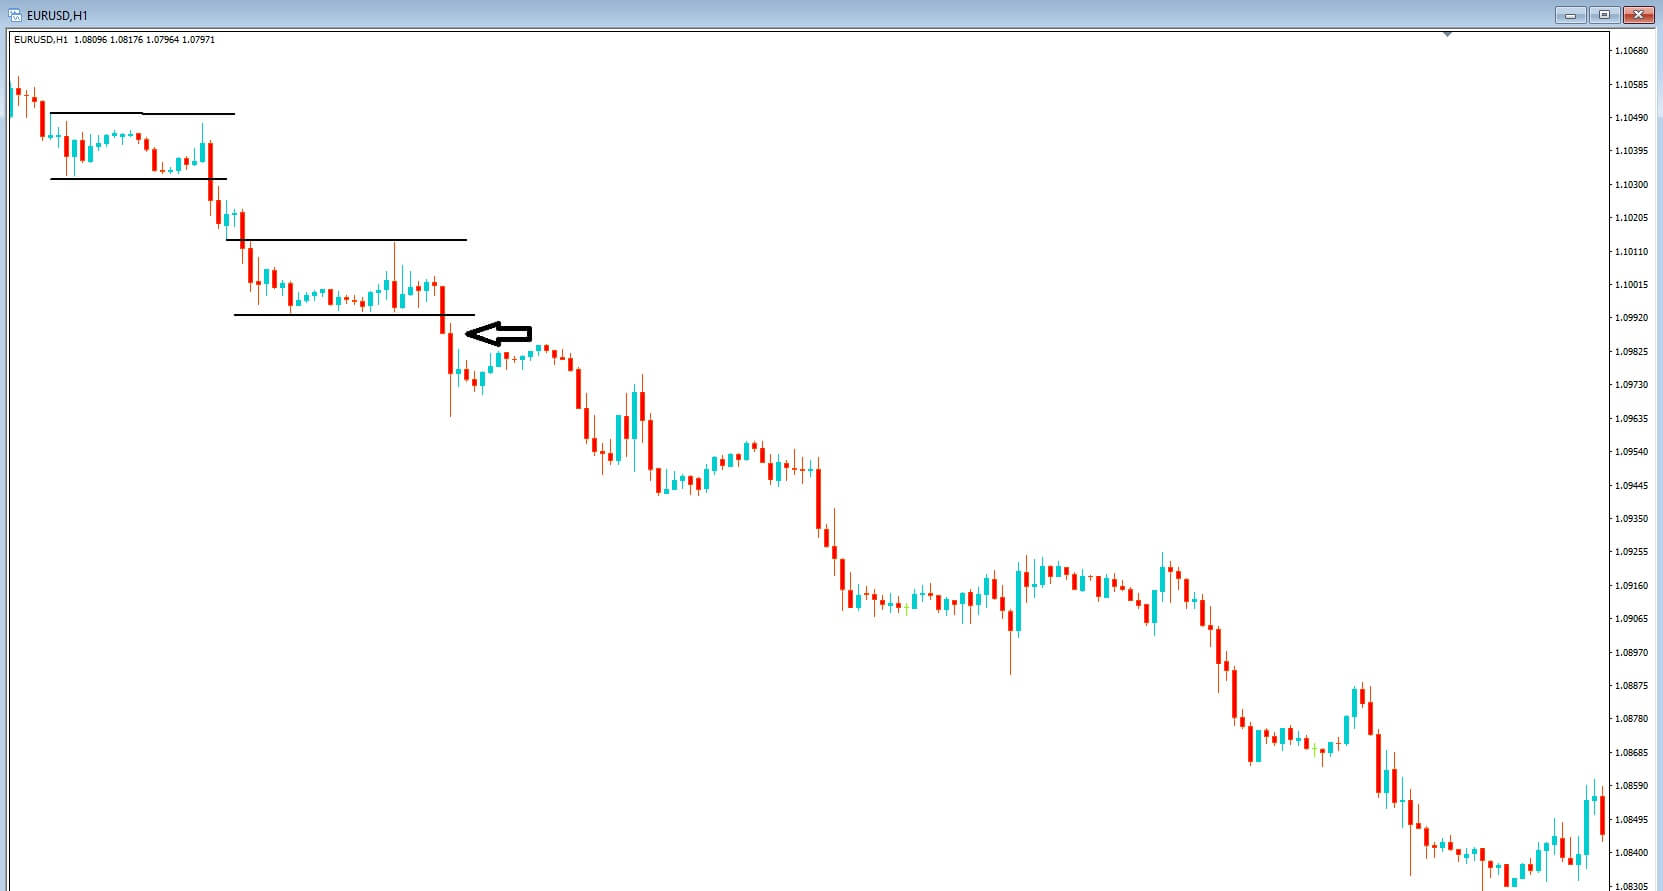
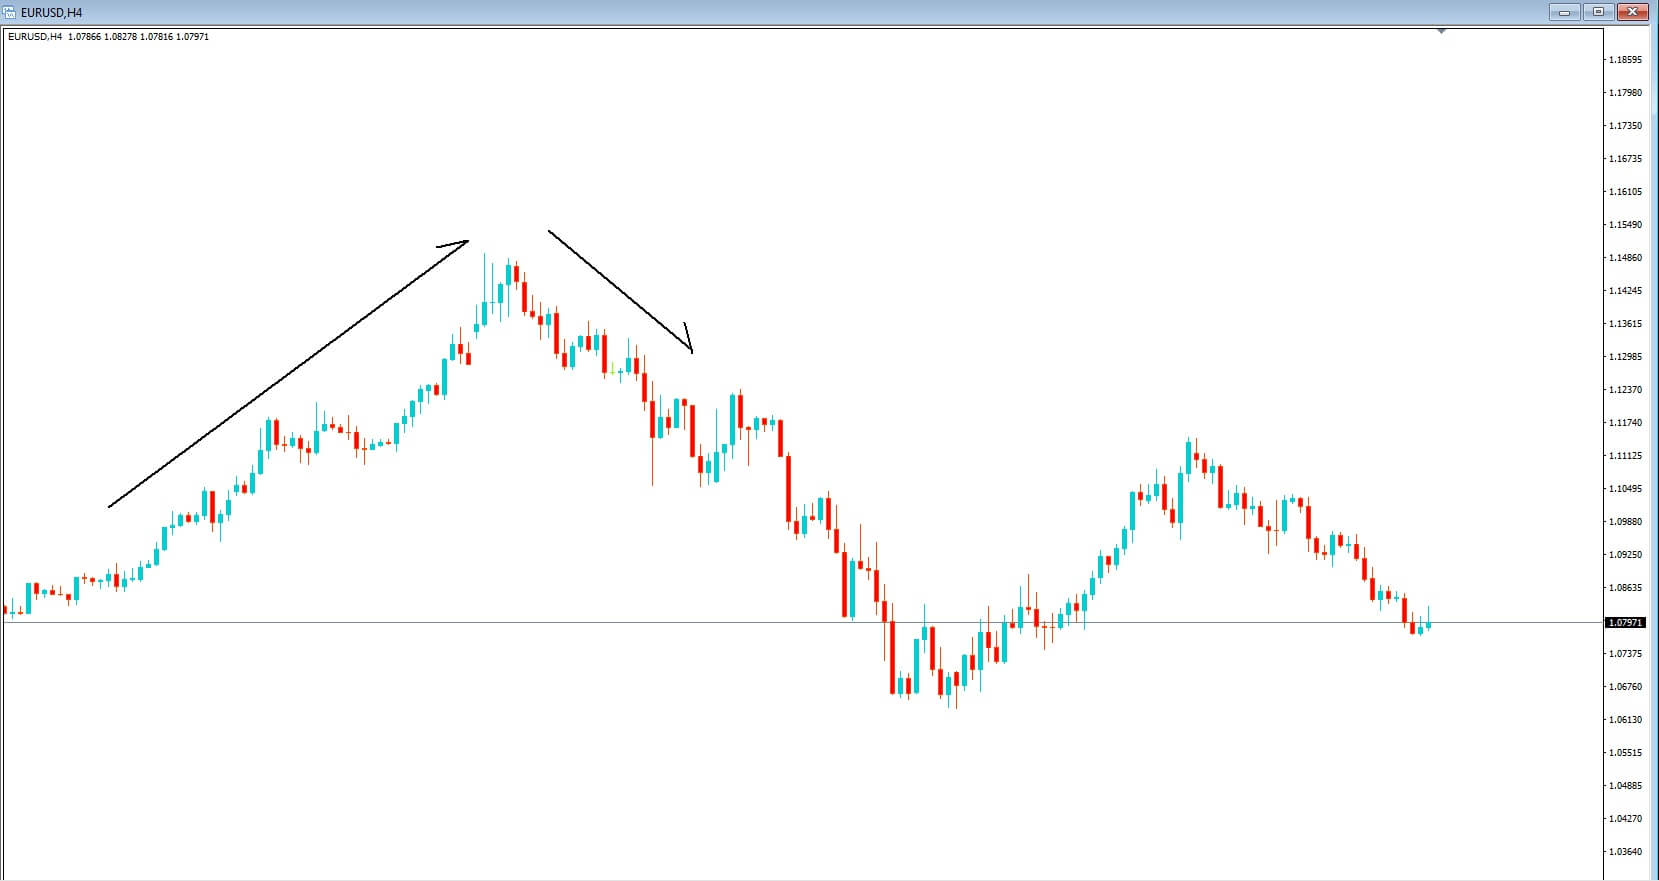
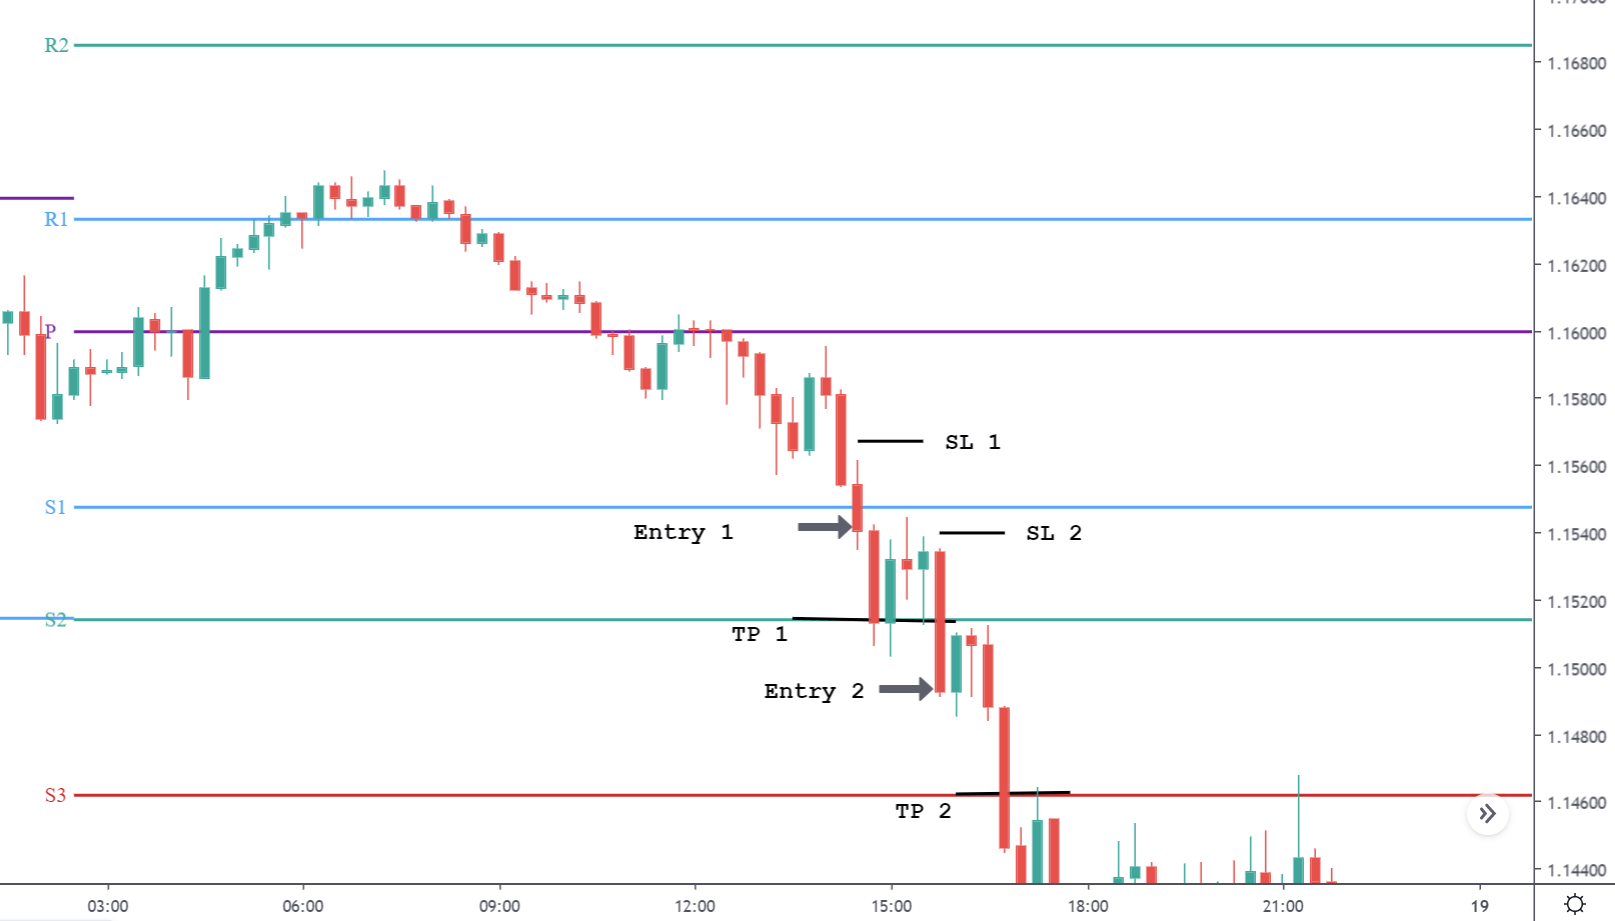
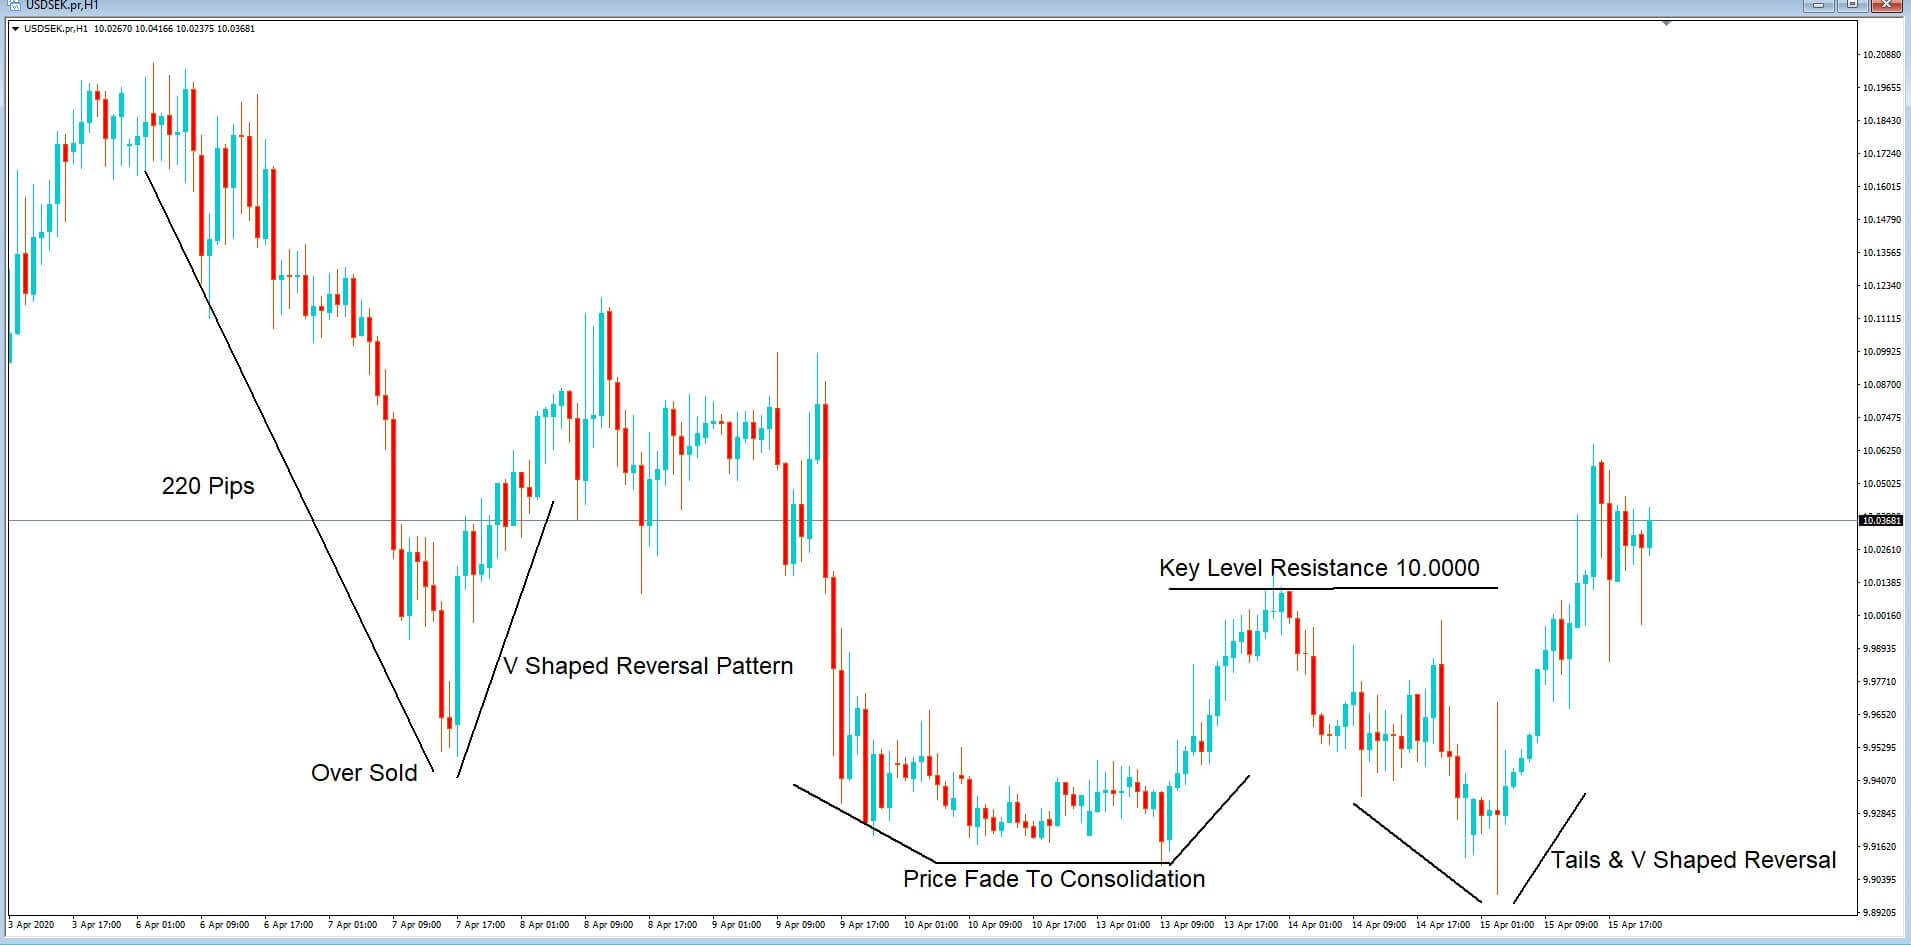
Here we have a 1-hour chart of the US dollar to Swedish Krona, or USDSEK, The first trend we see is a 220 pip move to the downside, which would have been considered as oversold and where price action is reversed in a classic v-shape reversal pattern.
Price action consolidates before falling again and fading into a consolidation phase before we see a bullish trend up to a key level of resistance and where that key level is 10.000.
The next trend is lower, where we can see a lot of tails, both of the bullish and bearish candlesticks, which usually means that there is uncertainty in the market. And eventually, price action moves higher up to and above the previous key level of resistance and where this reversal is a classic v-shape reversal pattern.

Another common reason for trends to end is areas where price action stalled and reversed previously, such as this low, and previous low, which is also known as a double bottom, or an area of support.


Or areas such as double tops, where traders see that price has previously been an area of resistance and where the price will be rejected multiple times as the area is seen as a barrier.


In this example, we can see that the trend is reversed on three occasions at very similar areas of resistance and where after the third move, higher price action aggressively gets sold.
These are the types of trend fade-outs and reversals that you will regularly see on charts. But where else might you expect to see trends end? Well, there are many different reasons that trends end, but the most common reasons are time zone change over, because of technical analysis such as signs the pair is overbought or oversold or just prior to or just after an economic data release, or perhaps because of profit-taking after price action begins to fade. It might be due to the run-up to a key policymaker speech, or in the aftermath of a key policy maker’s speech. Or a reversal in price subsequent to an economic data release, an emergency or unplanned data release, or even because of rumors circulating in the market.

It might also be because of unexpected events in another financial sector, including oil or the stock market, or perhaps there are not enough buyers or sellers to maintain the momentum.
A classic sign of the end of a trend is when price action begins to consolidate into a sideways motion, and you might see this during lulls in the market or at the end of the Asian, European, or US sessions.

Traders buy and sell a pair based on their trading portfolio requirements, if they trade for large institutions, or perhaps as speculators or because their balance sheet requirements have a need to add or sell off a particular currency. Maybe they have import and export requirements. They may have just seen a good trend and jumped on it, but when their session came to an end, they closed out their interest and took their profits. The bottom line is that we never know when the balance of buyers or sellers is dominating the price action, which in turn results in price action shifting one way to the other. But technical analysis is usually a very good tool to be able to determine when price action trends are coming to an end. So keep an eye out for long tails, the possible reversal in price action, small candlesticks, consolidation, sharp v-shaped reversal patterns, time zone sessions coming to an end, or beginning. And be very careful with regard to entering a trend that has gone on for a considerable number of pips, especially in the hundreds, because if you are not correct, you could see a sharp price action reversal leaving you looking at a financial loss making the trade.

Categories
Crypto Market Analysis

Daily Crypto Review, Apr 24 – Bitcoin transaction fees jumping up by 50% in the past 24 hours; Cryptos making new gains

The cryptocurrency market continued its bullish momentum and tried reaching new highs, but got stopped by the resistance levels. While most cryptocurrencies ended up in the green, the gains they ended up making were far lower due to the price consolidating at lower levels. Bitcoin is currently trading for $7,503, which represents an increase of 4.62% on the day. Meanwhile, Ethereum gained 0.26% on the day, while XRP gained 2.5%.

DigiByte took the position of today’s most prominent daily gainer, with gains of 22.01%. Synthetix Network lost 3.97% on the day, making it the most prominent daily loser.

Bitcoin’s dominance increased slightly compared to yesterday’s dominance levels. Its value is now 64.12%, which represents a 0.4% difference to the upside.

The cryptocurrency market capitalization increased over the past 24 hours, with its current value being $213.26. This value represents an increase of $6.94 billion when compared to the value it had yesterday.

What happened in the past 24 hours

Bitcoin – Transaction Fee Increase

The total fees that were paid for on-chain Bitcoin transactions over the past 24 hours increased over 50% when compared to yesterday’s transactions paid.

Glassnode (an on-chain data analytics service) reported that total Bitcoin fees paid over the past 24 hours increased by 50.7%, amounting to over $9,500. On top of that, the Bitcoin fees paid by users increased by 58.8%, reaching the amount of $0.78 per transaction (on average).

Meni Rosenfeld (currently the Chairman of the Israeli Bitcoin Association), however, stated that he believes 24-hour fees are too short of a timeframe to be considered particularly significant. He also stated that the historical data suggests that the Bitcoin transaction fee is far more volatile than Bitcoin’s price itself.

_______________________________________________________________________

Technical analysis

_______________________________________________________________________

Bitcoin

The largest cryptocurrency by market cap had quite a volatile day. BTC managed to spike up and reach the price of $7,750, where it was stopped by the resistance level. The failure to break this level stopped Bitcoin’s momentum, then triggering a pullback. While Bitcoin made some gains on the day, they are nowhere as significant as they would be if it broke the $7,750 resistance level.


Bitcoin is now consolidating at the $7,500 level, with the possibility to test the $7,420 level.

Key levels to the upside                    Key levels to the downside

1: $7,750                                           1: $7,420

2: $8,000                                           2: $7,085

3: $8,650                                            3: $6,850


Ethereum

Ethereum ended up making a slight gain in the past 24 hours, mainly as a result of increased bullish momentum, which broke the $185 resistance level. The second-largest cryptocurrency by market cap was, however, stopped in the move by the resistance at $193.6. The pullback brought the price near the $185, which now acts as a support level.


Ethereum’s RSI level is hovering around and under the overbought territory.

Key levels to the upside                    Key levels to the downside

1: $193.6                                             1: $185

2: $198                                              2: $178.6

3: $217                                               3: $175.5


Ripple

XRP broke its steady gain phase and entered a “speedrun” to the upside. The third-largest cryptocurrency managed to reach the resistance at $0.2 before being brought back to consolidating levels. XRP is now trading in the middle of the range, bound by $0.19 to the downside and $0.2 to the upside.


Key levels to the upside                    Key levels to the downside

1: $0.2                                                1: $0.19

2: $0.205                                            2: $0.178

3: $0.227                                             3: $0.165

Categories
Forex Market Analysis

Daily F.X. Analysis, April 24 – Top Trade Setups In Forex – Retail Sales & Business Climate Ahead! 

The U.S. dollar soared versus major currencies despite bounce off in the crude oil prices, at the same time, the U.K. Brent also made some bullish recovery. The U.S. House of Representatives assumes to establish a nearly $500 billion coronavirus relief bill, which once again can trigger safe-haven demand of the U.S. dollar. 

During the Asian session, the U.S. dollar is headed for its best week since early April, as plunging oil prices pressures on commodity currencies and division over Europe’s emergency fund dragged on the euro. The market will mostly move based upon U.K. retail sales and German business climate figures today. 

Economic Events to Watch Today     


EUR/USD – Daily Analysis

The EUR/USD has traded bearishly at 1.0771 level after having violated the symmetric triangle pattern, which was supporting it around 1.0850. A daily close under 1.0783 level is likely to drive more sell-off below this level. Traders seem worries about potential recession since the release of worse than expected PMI figures. 

The drop in business activity not only in Germany but also in overall Europe has expanded in April, with both services and manufacturing witnessing a historic dip in output as a consequence of the COVID-19 pandemic and subsequent lockdown.

The headline Flash Germany Composite PMI recorded 17.1 in April, down distinctly from 35.0 in March, and by far, it’s the lowest reading since comparable figures were first collected more than 22 years ago. The preliminary figures were based on replies received between April 7-22. Shutdowns caused by the COVID-19 did not influence the survey response rate.

There remains some uncertainty that Europe is still not ready to deepen fiscal integration, and the finance ministers will likely be unable to give an appropriate fiscal stimulus. As in result, the peripheral bond spreads may widen, which may booster further losses in the EUR/USD currency pair.

The eurozone economy experienced the sheerest declines in business activity and employment ever registered during April as a consequence of actions taken to restrain the coronavirus break, according to provisional PMI survey figures. Later today, the focus will remain on the German Ifo Business Climate figures to determine further trends in the EUR/USD pair.

Daily Support and Resistance

  • R3 1.0917
  • R2 1.0881
  • R1 1.0828

Pivot Point 1.0792

  • S1 1.0739
  • S2 1.0703
  • S3 1.065

EUR/USD– Trading Tips

On Friday, the EUR/USD pair continues trading in a selling mode around 1.0773, perhaps due to weaker manufacturing and services PMI figures. The overall trading bias continues to be bearish as the EUR/USD prices are holding below 50 EMA, which is extending resistance around 1.0837 level.

On the 4-hour chart, the EUR/USD has violated the symmetric triangle pattern, which is driving the selling trend in the pair. Currently, it’s holding the pair over 1.077, which is the triple bottom level. Above this, a slight bullish recovery can be seen until 1.0850 level. While bearish breakout of 1.0765 level can drive selling until 1.0649 level today, let’s look for selling trades below 1.0770 level today.  

GBP/USD – Daily Analysis

The GBP/USD price is consolidating in a narrow trading range of 1.2424 – 1.2300. Sterling’s overall bias remains bearish since the release of manufacturing data. General business shutdowns at local and international levels in reply to the coronavirus infection 2019 (COVID-19) pandemic unsurprisingly ended in a speedy decline in U.K. private-sector production during April. 

The latest Markit report on Flash U.K. manufacturing PMI signaled by far the most robust drop in business activity since comparable figures were first collected over two decades ago. The latest Markit Flash U.K. Manufacturing PMI was recorded between 7-21 April 2020, and shutdowns did not influence the survey response rate in place due to the COVID-19 break.

The United States President Donald Trump continues to push for the economic re-start, whereas giving worse warnings to Iran. He indicated a decrease in the further coronavirus outbreak. The GBP/USD currency pair flashing buy and sell, now holding at 1.2345 while reporting 0.07% losses on the day, probably due to the Tory government growing criticism about the mishandling coronavirus crisis.  

Daily Support and Resistance

  • R3 1.0917
  • R2 1.0881
  • R1 1.0828

Pivot Point 1.0792

  • S1 1.0739
  • S2 1.0703
  • S3 1.065

GBP/USD– Trading Tip

The GBP/USD showed a slight bullish reversal to place a high around 1.2414, but the bullish trend wasn’t long enough as prices recorded soon. At the moment, the Cable is trading at 1.2347 area, which is also a resistance level extended by the downward channel. The 50 periods EMA also extend resistance at the same level 1.2368. A bullish breakout of 1.2368 level can extend the buying trend until 1.2420 level today. Elsewhere, the support continues to hold around 1.2258 level. The 50 EMA and MACD are both are suggesting selling bias in the Cable. So let’s look for selling trades below 1.2399 and bullish above 1.2420 level today. 

USD/JPY – Daily Analysis

On Friday, the USD/JPY is consolidating in a narrow trading range of 108.00 level to 107.500 level, mainly due to the risk-on market sentiment keeps the safe-haven Japanse lower and providing support to the currency pair. The U.S. announced 4.427 million initial jobless claims for the preceding week overnight, with an unparalleled 26 million people dropping their jobs since late March.

At the USD front, the U.S. dollar took bids due to mixed risk sentiment, which is starting to dominate the markets and caused the bearish pressure to remain intact. The U.S. Dollar Index, which dropped below the 100 marks earlier in the day, is up 0.12% on the day at 100.47 and stays on track to close the 4th-straight day in the positive area.

The latest pullback of the U.S. dollar kept a lid on bullish moves in the pair. Currently, the USD/JPY is trading at 107.67 and consolidates in the range between the 107.66 – 107.86. However, investors are cautious and waiting for a fresh catalyst before placing any position.

Whereas, the multiple diverging factors failed to provide any meaningful direction or assist the pair in breaking through a narrow trading band held since the beginning of this week. The reason behind the risk-on market sentiment is the report regarding the passage of another $484 billion U.S. economic support package by the U.S. Senate. While the latest modest recovery in crude oil prices also keeps the market sentiment calm. 

Looking ahead, the eyes will remain on the Core Durable Goods Orders m/mas that’s due during the U.S. session in order to forecast further trends in the USD related pairs. 

Daily Support and Resistance    

  • S1 105.92
  • S2 106.84
  • S3 107.44

Pivot Point 107.76

  • R1 108.36
  • R2 108.69
  • R3 109.61

USD/JPY – Trading Tips

The USD/JPY is mostly trading sideways within a narrow trading range of 108.020 – 107.300 zones. At the moment, it’s holding at 107.597, having formed a descending triangle pattern on the 4-hour timeframe. The triangle pattern is extending resistance around 107.850, along with support around 106.980. If USD/JPY manages to violate the descending triangle pattern, we may see pair dropping towards 106.200. While on the upper side, a bullish breakout of 108 can lead USD/JPY prices towards 109.100. The leading indicator, such as MACD and 50 EMA, are supporting bearish bias in the market today. 

All the best for today! 

Categories
Forex Market Analysis

Daily F.X. Analysis, April 23 – Top Trade Setups In Forex -U.S. Unemployment Figures Ahead! 

On the forex front, the U.S. Dollar Index surged 0.1% on the day to 100.35, surging for a third consistent session. The U.K. Office for National Statistics will release March public sector net borrowing, excluding banking groups (1.8 billion pounds expected).

The U.S. Labor Department will release initial jobless claims in the week ended April 18 (4.5 million expected). The Commerce Department will report March new home sales (640,000 units expected).

Economic Events to Watch Today     


EUR/USD – Daily Analysis

The EUR/USD fell to trade below 1.0800, the lowest level in nearly two weeks. The official figures revealed that the eurozone’s Consumer Confidence Index slips to -22.7 in April (-20.0 expected) from -11.6 in March. At the coronavirus front, as per the latest report, the number of confirmed coronavirus cases grew to 145,694, with 4,879 deaths reported in Germany so far. As the incidents increased by 2,237 in Germany, a 1.6% rise picking-up pace from Tuesday’s 1.3% increment, the death toll moved sharply up by 281 vs. 194 a day before.

There remains some uncertainty that Europe is still not ready to deepen fiscal integration, and the finance ministers will likely be unable to give an appropriate fiscal stimulus. As in result, the peripheral bond spreads may widen, which may booster further losses in the EUR/USD currency pair.

The eurozone economy experienced the sheerest declines in business activity and employment ever registered during April as a consequence of actions taken to restrain the coronavirus break, according to provisional PMI survey figures. 

The flash IHS Markit Eurozone Composite PMI plunged to an all-time low of 13.5 in the month of April, falling from a previous historic low of 29.7 in March. It registers by far the most significant monthly breakdown in production recorded in over two decades of survey data collection.

Daily Support and Resistance

  • S1 1.0673
  • S2 1.0755
  • S3 1.0789
  • Pivot Point 1.0837
  • R1 1.0871
  • R2 1.0919
  • R3 1.1001

EUR/USD– Trading Tips

The EUR/USD is trading bearish at 1.0793, as traders are selling euro on the back of weaker than anticipated manufacturing and services PMI figures. The overall bias prevails bearish as the EUR/USD prices are holding below 50 EMA, which is extending resistance around 1.0837 level. Continuation of a selling trend below 1.0837 level may lead EUR/USD pair until the next support area of 1.0772, whereas below this, the next support prevails around 1.0652 level. The pair may find an immediate resistance level of around 1.0837, while the bullish breakout of this level can extend buying until the next resistance level of 1.0922. Conversely, we should look for selling trades below 1.0830 level today.  

GBP/USD – Daily Analysis

The GBP/USD surged 0.3% to 1.2325. Government economic figures reported that U.K. CPI soared 1.5% on year in March (as expected). On the other hand, the Markit U.K. Manufacturing PMI (42.0 estimated) and Services PMI (27.8 expected) for April will be published later today.

The latest and modest recovery in the U.S. dollar keeps the currency pair under pressure. The GBP/USD currency pair is currently trading at 1.2363 and consolidates in the range between the 1.2313 – 1.2369. However, the traders are keenly waiting for the key UK PMI, and U.S. Jobless Claims data. They are cautious about placing any strong bids.

The members of the cabinet got the chance for the first time to criticize Prime Minister Boris Johnson and Company’s poor performance about managing the coronavirus crisis in the U.K. However, the members did not only criticized for the lack of medical supplies, but they also indicated the shortage of nurses.

In return, the deputized PM indicated the nearness to the peak of the outbreak. The Health Secretary Matt Hancock is suggesting the start of the human trials over 300,000 people in a year.

On the positive side, the report came that the Prime Minister johnson will attend his conversation with the Queen through telephone after this week, although his deputy Dominic Raab is officially leading the country due to his absence.

On the other hand, the United States President Donald Trump continues to push for the economic re-start, whereas giving worse warnings to Iran. He indicated a decrease in the further coronavirus outbreak. The GBP/USD currency pair flashing red and dropped to 1.2325 while representing 0.07% losses on the day, possibly due to the Tory government getting criticism about the mishandling coronavirus crisis.  

Daily Support and Resistance

  • S1 1.1974
  • S2 1.2148
  • S3 1.2223

Pivot Point 1.2322

  • R1 1.2397
  • R2 1.2496
  • R3 1.2671

GBP/USD– Trading Tip

The GBP/USD showed a slight bullish reversal after testing the target level of 1.2254 area. At the moment, the Cable is trading at 1.2347 area, which is also a resistance level extended by the downward channel. The 50 periods EMA also extend resistance at the same level 1.2368. 

A bullish breakout of 1.2368 level can extend the buying trend until 1.2420 level today. Elsewhere, the support continues to hold around 1.2258 level. The 50 EMA and MACD are both are suggesting selling bias in the Cable. So let’s look for selling trades below 1.2399 and bullish above 1.2420 level today. 

USD/JPY – Daily Analysis

During the Thursday’s European session, the USD/JPY currency pair flashing green but remained confined between the range between 108.00 Handles mainly due to the risk-on market sentiment keeps the safe-haven Japanse lower and providing support to the currency pair. 

The latest pullback of the U.S. dollar kept a lid on bullish moves in the pair. Currently, the USD/JPY is trading at 107.67 and consolidates in the range between the 107.66 – 107.86. However, investors are cautious and waiting for a fresh catalyst before placing any position.

Whereas, the multiple diverging factors failed to provide any meaningful direction or assist the pair in breaking through a narrow trading band held since the beginning of this week. The reason behind the risk-on market sentiment is the report regarding the passage of another $484 billion U.S. economic support package by the U.S. Senate. While the latest modest recovery in crude oil prices also keeps the market sentiment calm. 

The U.S. dollar drew offer and erased its previous session gains and turned out to be one of the key factors that kept a lid on any additional gains in the pair, at least for now. At the same time, the risk recovery in the global risk sentiment weakens the Japanese yen’s safe-haven demand and collaborates in the pairs gains. The risk-on sentiment was bolstered by a modest rise in the U.S. Treasury bond yields, which extend some support to the U.S. Dollar.

Daily Support and Resistance    

  • S1 105.92
  • S2 106.84
  • S3 107.44

Pivot Point 107.76

  • R1 108.36
  • R2 108.69
  • R3 109.61

USD/JPY – Trading Tips

On Thursday, the USD/JPY is trading mostly sideways within a narrow trading range of 108.020 – 107.300 zones. At the moment, it’s holding at 107.597, having formed a descending triangle pattern on the 4-hour timeframe. The triangle pattern is extending resistance around 107.850, along with support around 106.980. If USD/JPY manages to violate the descending triangle pattern, we may see pair dropping towards 106.200. While on the upper side, a bullish breakout of 108 can lead USD/JPY prices towards 109.100. The leading indicator, such as MACD and 50 EMA, are supporting bearish bias in the market today. Let’s wait for a breakout before taking more trades today.

All the best for today! 

Categories
Crypto Market Analysis

Daily Crypto Review, Apr 23 – Binance confirms – Facebook’s Libra back in play; Bitcoin above $7,000

The cryptocurrency market gathered bullish momentum as Bitcoin passed $7,000 to the upside once again. Most cryptocurrencies ended up in the green, some even recording double-digit gains. Bitcoin is currently trading for $7,142, which represents an increase of 4.3% on the day. Meanwhile, Ethereum gained 6.94% on the day, while XRP gained 3.77%.

DigiByte took the position of today’s most prominent daily gainer, with gains of 22.37%. Quant lost 3.4% on the day, making it the most prominent daily loser.

Bitcoin’s dominance stayed at the same place when compared to yesterday. Its value is now 63.72%, which represents a 0.2% difference to the downside.

The cryptocurrency market capitalization increased over the past 24 hours, with its current value being $206.32. This value represents an increase of $8.06 billion when compared to the value it had yesterday.

What happened in the past 24 hours

Libra

Binance Research looked into Libra’s most recent whitepaper, which was updated as the regulators were not particularly happy with the previous iteration of the whitepaper. A lengthy report came from their research team, in part claiming that Facebook’s Libra could alter the payments world in a major way.

They mentioned that Libra’s global payment system could possibly do to the payment industry what Elon Musk’s SpaceX did to the space industry.

_______________________________________________________________________

Technical analysis

_______________________________________________________________________

Bitcoin

The largest cryptocurrency by market cap managed to gather bullish momentum and push for $7,000 once again. Bitcoin managed to break through $7,000 as well as the $7,085 resistance levels. On top of that, the $7,085 level got tested and held up quite nicely. We can expect a move towards the upside from Bitcoin, but we have to look for any cueues when it comes to price reversal, as Bitcoin is possibly on its way of creating a double top formation. However, the current outlook is slightly bullish.


Key levels to the upside                    Key levels to the downside

1: $7,420                                           1: $7,085

2: $7,750                                           2: $6,850

3: $8,000                                            3: $6,640


Ethereum

Ethereum also ended up being in the green on the daily, even more so than Bitcoin. ETH bulls pushed its price above the $175.5 as well as $178.6 resistance levels, which were overcome pretty easily. Ethereum’s move towards the upside was stopped by the $185 level for a short while, and the level is currently being tested.


Ethereum’s RSI level is approaching overbought territory while its volume is fading, which is a strong indicator of an end of the move. However, Ethereum still has a chance to approach $193.6 if the volume returns.

Key levels to the upside                    Key levels to the downside

1: $185                                                1: $175.5

2: $193.6                                            2: $178.6

3: $198                                                3: $168


Ripple

XRP had a good day as well, with its price steadily rising towards the $0.19 level, and breaking it as well. The main difference between XRP’s price gain and the one of Bitcoin and Ethereum was the intensity of the move. XRP performed steadily, while BTC and ETH were quite explosive. While XRP managed to break the $0.19 resistance level, it is still undecided where the price will consolidate at, as the level was not tested out.


For this reason, the $0.19 level will not be moved to the downside key levels yet.

Key levels to the upside                    Key levels to the downside

1: $0.19                                              1: $0.178

2: $0.2                                                2: $0.165

3: $0.205                                             3: $0.147

Categories
Forex Elliott Wave

Complex Corrective Waves Analysis – Advanced Level – Part 2 of 2

Introduction

In the first part of the complex corrective wave analysis article, we presented two conditions that suggest the development of a wave x. 

The first condition considers whether the second compacted corrective wave retraces less than 61.8% from the first correction. The second condition occurs if the second corrective structure retraces more than 161.8% from the first correction.

Glenn Neely, in his work “Mastering Elliott Wave,” indicates that if the first condition occurs, then the market performs a complex correction with a small wave x. While for the second case, the price action develops a complex correction with a large wave X.

Condition 1 – Complex Correction with Small Wave x.

When the wave analyst identifies a non-standard wave, there is a high probability that the wave x is smaller than 61.8% of the previous corrective phase. This type of wave tends to take the form of an impulsive sequence. However, its internal details rule out this possibility.

The non-standard structural sequence or series may have various combinations, which are detailed below:

  1. Double zigzag (5-3-5-wave x-5-3-5)
  2. Double three (5-3-5-wave x-3-3-3-3-3)
  3. Double three (5-3-5-wave x-3-3-5)
  4. Double flat (3-3-5-wave x-3-3-5)
  5. Double three (3-3-5-wave x-3-3-3-3-3)
  6. Triple zigzag (5-3-5-wave x-5-3-5-wave x-5-3-5)
  7. Triple three (5-3-5-wave x-5-3-5-wave x-3-3-3-3-3)
  8. Triple three (5-3-5-wave x-3-3-5-wave x-3-3-3-3-3)

From the above list, the triangular formation likely corresponds to a contractive triangle. On the other hand, waves x can be other corrective waves without altering the entire structure. 

The wave analyst must take into account the application of the alternation principle. In particular, the x-wave will alternate with its preceding wave. For example, if the first compact wave corresponds to a zigzag, the x-wave will be a plane or a triangle.

The following figure shows two examples of complex corrective waves that accomplish thew first condition. In particular, the case corresponds to a double zigzag, and a double three consisting of a zigzag pattern and a triangle structure.

Condition 2 – Complex Correction with Large Wave X 

When the wave analyst detects a complex correction in which the wave X is larger than the previous correction in terms of price, the entire formation will be classified as double or triple three patterns.

This structural series can have various combinations, which are detailed below:

  1. Double three (3-3-5-wave X-3-3-3-3-3)
  2. Double three (3-3-5-wave X-3-3-5)
  3. Triple three (3-3-5-wave X-3-3-5-wave X-3-3-3-3-3)
  4. Triple three (3-3-5-wave X-3-3-5-wave X-3-3-5) 

In summary, the structural series of both conditions have been listed in the most likely order of occurrence.

As in the first condition, the following figure shows two cases of double three patterns.

Conclusions

So far, we have seen the different construction characteristics of complex corrective waves and how to differentiate each type of complex wave.

In particular, we saw the two main conditions that characterize complex corrective waves.

In the following educational article, we will present the conditions associated with each particular formation.

Suggested Readings

  • Neely, G.; Mastering Elliott Wave: Presenting the Neely Method; Windsor Books; 2nd Edition (1990).
Categories
Forex Market Analysis

Daily F.X. Analysis, April 22 – Top Trade Setups In Forex -U.K. Inflation Stabilises! 

On the forex front, the U.S. dollar gained traction against other major currencies, with the Dollar Index climbing 0.3% on the day to 100.20. The U.S. official data showed that Existing Homes Sales fell to an annualized rate of 5.27 million units in March (5.25 million units expected).

The British Consumer Prices Index (CPI), including owner-occupiers’ housing inflation rate, came out at 1.5% in March 2020. Although it’s down from 1.7% in February 2020, it’s not as bad as investors were expecting considering the lockdown in global markets. 

Economic Events to Watch Today     


 EUR/USD – Daily Analysis

The EUR/USD fell by nearly 0.1% to trade at 1.0865. While Spain’s central bank announced, the country’s GDP could fall by 6.8% to 12.4% this year. Later in the today, the major focus will stay on the German ZEW Current Situation Index for April will be released (-75.0 estimated).  

After the Eurozone divided on community debt, most of the analytes are worried that the finance ministers’ may unable to provide a suitable fiscal stimulus to support growth. So, the shared currency could remain under pressure ahead of the Thursday summit.

At the coronavirus front, as per the latest report, the number of confirmed coronavirus cases grew to 145,694, with 4,879 deaths reported in Germany so far. As the cases increased by 2,237 in Germany, a 1.6% rise picking-up pace from Tuesday’s 1.3% increment, the death toll moved sharply up by 281 vs. 194 a day before.

Looking forward, the upbeat Eurozone Consumer Confidence, which is scheduled to release at 14:00 GMT, may put a bid under EUR/USD currency pair. However, the pair trend will remain sluggish until the pair break the trading range of 1.0897 to 1.08616. 

Daily Support and Resistance

  • S1 1.0724
  • S2 1.0788
  • S3 1.0823

Pivot Point 1.0852

  • R1 1.0887
  • R2 1.0916
  • R3 1.098

EUR/USD– Trading Tips

On Wednesday, the EUR/USD is trading sideways at 1.0825, as investors seem to wait for a solid reason to enter the market. The overall bias remains bearish as the EUR/USD prices are holding below 50 EMA, which is extending resistance around 1.08945 level. Continuation of a selling trend below 1.08945 level can continue selling until the next support area of 1.0772, but on the way, the pair may find support around 1.0815 level. 

The EUR/USD is likely to find support around 1.0772, but below this, the next support prevails around 1.0652 level. The pair may find an immediate resistance level of around 1.09230, where the bullish breakout of this level can extend buying until the next resistance level of 1.1036. Conversely, we should look for selling trades below 1.0894.  


GBP/USD – Daily Analysis

The GBP/USD soared 0.3% to trade at 1.2318 as the British Consumer Prices Index (CPI), including owner-occupiers’ housing inflation rate, came out at 1.5% in March 2020. Although it’s down from 1.7% in February 2020, it’s not as bad as investors were expecting considering the lockdown in global markets. 

 At the USD front, investors prefer to choose the U.S. dollar because of its safe-haven-demand in the market due to the fears of economic fallout, which is caused by the coronavirus outbreak. The dollar index, which measures the worth of the greenback against majors, rose 0.20% to levels above 100.00.

The reason behind the decline in GBP/USD pair could also be the immediate rise in COVID-19 cases, with the curve still not notably peaking. It indicates that there is still a high chance that lockdowns could last longer than expected, while the Bankruptcy and bad loans will likely boost the risk-off sentiment in the market and provide further support to the U.S. dollar again.

Apart from the U.K., U.S. President Donald Trump suggested that approximately 20 states ready for re-open while also showing a willingness to sign the bill that stops immigration into the U.S. for 60 days. As in result, the risk sentiment remains under pressure.

The reason behind the risk-off market sentiment could also be the early Asian news surrounding the U.S. Senate’s passage of $484 billion COVID-19 relief package and BOJ’s likely decline of economic and price forecasts. Moreover, statements from the BOE’s Bailey were also necessary to remark during the early Asian session.

As in result, the U.S. 10-year Treasury yields declined by 2-basis points (bps) to 0.55%, after dropping 4-bps on Tuesday, while the most stocks in Asia-Pacific flashing losses by the pres time.


Daily Support and Resistance

  • S1 1.1974
  • S2 1.2148
  • S3 1.2223

Pivot Point 1.2322

  • R1 1.2397
  • R2 1.2496
  • R3 1.2671

GBP/USD– Trading Tip

Yesterday, the GBP/USD fell sharply to trade at 1.2250 after violating the horizontal support level of 1.2424. On the 4 hour chart, the Cable has closed Doji candle above 1.2250 level can drive bullish bias until 1.2350. On the upper side, the Sterling may find next resistance around 1.2426, it’s the same level that supported the pair previously, and now it’s likely to drive selling bias in the GBP/USD pair. On the lower side, the violation of the 1.2265 level can lead the GBP/USD prices towards 1.2175. The 50 EMA and MACD are both are suggesting selling bias in the Cable. So let’s look for selling trades below 1.2322 and bullish above the same level today. 

USD/JPY – Daily Analysis

On Wednesday, the USD/JPY is trading around 107.500 level, mostly exhibiting sideways trading due to a lack of major economic events in the market. The U.S. dollar index slipped to the fresh lows of 100.07 ahead of recovering some ground, still bearish by 0.15% on the day.

The Japanese yen seems to suffer due to a lack of confidence when the state of emergency is being lifted in Japan. While drop-in, the domestic macroeconomic indicators are expected to keep the Japanese yen’s in a bearish mode while maintaining the USD/JPY bullish. Lately, the uptrend in the JPY could be limited due to the forecast of the Bank of Japan (BOJ) support measures to boost funding for the companies due to be announced next week. 

The U.S. Treasury prices advanced as investors continued to seek safe-haven assets. The benchmark 10-year U.S. Treasury yield declined to 0.571% from 0.625% Monday.

On the negative side, the greenback gained ground due to the oil price crash triggered a dash for cash. The high uncertainty in the market also boosted the greenback demand. So, if that trend continues during the ay ahead, the yellow metal could come under pressure.

Daily Support and Resistance    

  • S1 105.92
  • S2 106.84
  • S3 107.44

Pivot Point 107.76

  • R1 108.36
  • R2 108.69
  • R3 109.61

USD/JPY – Trading Tips

The USD/JPY is trading mostly sideways within a narrow trading range of 108.020 – 107.300 zones. At the moment, it’s holding at 107.597, having formed a descending triangle pattern on the 4-hour timeframe. The triangle pattern is extending resistance around 107.850, along with support around 106.980.  

In case, the USD/JPY violates the descending triangle pattern; we may see pair dropping towards 106.200. While on the upper side, a bullish breakout of 108 can lead USD/JPY prices towards 109.100. The leading indicator, such as MACD and 50 EMA, are supporting bearish bias in the market today. Let’s wait for a breakout before taking more trades today.

All the best for today! 

Categories
Crypto Market Analysis

Daily Crypto Review, Apr 22 – The Netherlands testing grounds for EU digital currency; Ripple Labs suing YouTube

The cryptocurrency market didn’t move much in the past 24 hours, but rather took the time to consolidate and establish support and resistance levels. Bitcoin is currently trading for $6,849, which represents a decrease of 0.32% on the day. Meanwhile, Ethereum lost 0.55% on the day, while XRP dropped 0.19% from yesterday’s price.

DigiByte took the position of today’s most prominent daily gainer, with gains of 7.96%. MaidSafeCoin lost 5.02% on the day, making it the most prominent daily loser.

Bitcoin’s dominance stayed at the same place when compared to yesterday. Its value is now 63.92%, which represents a 0.09% difference to the upside.

The cryptocurrency market capitalization decreased as most cryptos were in the red. Its current value is $198.26. This value represents a decrease of $1.13 billion when compared to the value it had yesterday.

What happened in the past 24 hours

The 45-page CBDC report is that the Netherlands’ Dutch Central Bank (DNB) wants to become a digital currency “test subject” for the Eurosystem.

The DNB said that the development of a euro-based digital currency could contribute to diversity as well as innovation in the payment market. They believe that the Netherlands provides a suitable place for such an experiment.

Honorable mention

Ripple

Ripple Labs (ran by its CEO Brad Garlinghouse) filed a lawsuit against Youtube LLC in California’s Northern District on Apr 21. Ripple seeks damages for Youtube’s inability to stop XRP scammers as well as impersonators.

The plaintiffs are taking action against Youtube to, as they said, change the expectation of accountability in the current industry that Youtube is in.

_______________________________________________________________________

Technical analysis

_______________________________________________________________________

Bitcoin

The largest cryptocurrency by market cap had a slow day and kept to the price it was at yesterday. Bitcoin seems to be fighting for the $6,850 level and whether it will end up above or below it is highly debatable. However, once the price establishes, we can expect a further move to that side. The probabilities are slightly in favor of the downside.


Bitcoin’s volume was on the levels it was at over the weekend, while its RSI level stayed around the value of 43.

Key levels to the upside                    Key levels to the downside

1: $7,085                                           1: $6,850

2: $7,420                                           2: $6,640

3: $7,750                                            3: $5,960


Ethereum

Ethereum spent the past 24 hours consolidating and establishing its position above the $168 support level. The attempt to do that was so far successful, and there is no reason for expecting ETH to go below it unless strong selling BTC pressure appears (due to the correlation these two cryptocurrencies have).


Ethereum’s volume stayed at the same level as the previous day, while its RSI level is in the middle of the value range.

Key levels to the upside                    Key levels to the downside

1: $175.5                                             1: $168

2: $178.6                                            2: $158 

3: $185                                                3: $147.5


Ripple

After confirming its position above the descending trend, XRP continued moving sideways and consolidating. The low volume and indecisiveness translated into the chart, which we can prove by seeing large wicks and small candlestick bodies in the past 24 hours.


XRP’s volume was descending throughout the day, while its RSI level kept its position around the value of 43.

Key levels to the upside                    Key levels to the downside

1: $0.19                                              1: $0.178

2: $0.2                                                2: $0.165

3: $0.205                                             3: $0.147

Categories
Forex Market Analysis

Daily F.X. Analysis, April 21 – Top Trade Setups In Forex – Economic Sentiment in Highlights! 

On the forex front, the U.S. dollar firmed against its major peers, with the Dollar Index gaining 0.2% on the day to 99.95. The ZEW survey results of April will be released for Germany (current situation at -75.0, expectations at -42.0 expected) and the Eurozone.

The U.K. Office for National Statistics will report a jobless rate for the three months to February (steady at 3.9% expected). While in the U.S., the National Association of Realtors will report March existing home sales (5.30 million units expected).

Economic Events to Watch Today     


EUR/USD – Daily Analysis

The EUR/USD fell by nearly 0.1% to trade at 1.0865. While Spain’s central bank announced, the country’s GDP could fall by 6.8% to 12.4% this year. Later in the today, the major focus will stay on the German ZEW Current Situation Index for April will be released (-75.0 estimated).  

European stocks were mostly trading higher, with the Stoxx Europe 600 Index surging 0.7%. Both Germany’s DAX and the U.K.’s FTSE 100 added 0.5%, and France’s CAC was up 0.7%, which are somehow supporting the Euro, the single currency. 

As of now, the market participants seem very concerned about the negative impact of the oil prices Monday’s declines and keeps their eyes on it. As in result, the U.S. dollar could continue to gain ground during the Europan trading hours ahead while the S&P 500 futures are now reporting a 0.65% drop. 

The additional bearish pressure could arise from President Trump’s decision to delay immigration to the U.S. to control the coronavirus outbreak. Let’s brace to trade ZEW survey results of April will be released for Germany (current situation at -75.0, expectations at -42.0 expected) and the Eurozone. 

Daily Support and Resistance

  • S1 1.0758
  • S2 1.0813
  • S3 1.084

Pivot Point 1.0869

  • R1 1.0896
  • R2 1.0924
  • R3 1.098

EUR/USD– Trading Tips

Technically, the EUR/USD is trading with a slightly bearish bias at 1.0825, exhibiting a bearish crossover below 50 EMA, which is now extending resistance around 1.0903 level. Continuation of a selling trend below 1.0903 level can extend selling until the next support area of 1.0772, but on the way, the pair may find support around 1.0815 level. The EUR/USD is likely to find support around 1.0772, but below this, the next support prevails around 1.0652 level. The pair may find an immediate resistance level of around 1.09230, where the bullish breakout of this level can extend buying until the next resistance level of 1.1036. Conversely, we should look for selling trades below 1.0870.

GBP/USD– Daily Analysis

The GBP/USD slid 0.5% to 1.2442. Investors will focus on the U.K. jobless rate for the three months to February due later in the day (steady at 3.9% expected). The United Kingdom and European Union Brexit drama keep moving while the latest news recommending to keep a check of Britain’s £39 billion has also been underlined by the cost of dealing with coronavirus, especially the economic £250 billion rescue package announced by Chancellor Rishi Sunak to protect jobs and businesses.

At the USD front, investors prefer to choose the U.S. dollar because of its safe-haven-demand in the market due to the fears of economic fallout, which is caused by the coronavirus outbreak. The dollar index, which measures the worth of the greenback against majors, rose 0.20% to levels above 100.00.

Later today, the U.S. dollar could continue to gain ground during the Europan trading hours ahead due to high safe-haven demand in the market in the wake of intensifying coronavirus fears while the S&P 500 futures are now reporting a 0.65% drop. 

On the other hand, the reason behind the cable’s pair declines could also be the immediate rise in COVID-19 cases, with the curve still not notably peaking. It indicates that there is still a high chance that lockdowns could last longer than expected, while the Bankruptcy and bad loans will likely boost the risk-off sentiment in the market and provide further support to the U.S. dollar again.

Looking forward, traders are keenly waiting for the key U.K. data which is scheduled to release during this day ahead As well as, the coronavirus related headlines also will be key to watch for taking fresh directions in the U.S. dollar.


Daily Support and Resistance

  • S1 1.2298
  • S2 1.2374
  • S3 1.2407

Pivot Point 1.245

  • R1 1.2483
  • R2 1.2526
  • R3 1.2601

GBP/USD– Trading Tip

Taking a look at the 4-hour timeframe, the GBP/USD is trading at 1.2394 level, violating the support level of 1.2400 level. A bearish breakout of 1.2400 support area is expected to trigger a sell-off until 1.2310. The 50 periods EMA is also keeping the GBP/USD pair under pressure while extending resistance around 1.2430. Thus, the bounce off above this level can lead the GBP/USD pair towards the next resistance level of 1.2657. While bearish breakout of 1.2460 can open up further room for selling until the next support area of 1.2220. 

USD/JPY – Daily Analysis

On Tuesday, the USD/JPY is trading with a selling bias around 107.350, due to intensifying coronavirus fears as increased risk sentiment is driving the demand for the safe-haven currency. The slump in the Japanese exports for March keeps Japanese yen down, which also supports the currency pair to stay at the upside. 

The U.S. dollar extends taking bids mostly due to its safe-haven demand in the wake of intensified coronavirus fears. Considering the fresh report that the United States death toll surged over 40,000, whereas SkyNews mentions the U.K. has a bit over 16,000 people who died from the virus.

Looking forward, the North Korean leader’s health and oil moves will be key to watch, and coronavirus updates could be the driver seat for taking fresh directions. Alongside, the trader will keep their eyes on the U.S. dollar dynamics.

Daily Support and Resistance    

  • S1 105.92
  • S2 106.84
  • S3 107.44

Pivot Point 107.76

  • R1 108.36
  • R2 108.69
  • R3 109.61

USD/JPY – Trading Tips

The USD/JPY is trading slightly bearish at 107.339, having formed a descending triangle pattern on the 4-hour timeframe. The triangle pattern is extending resistance around 107.850 along with resistance around 106.980. As we know, the descending triangle pattern usually breakout on the lower side, and if this happens, the violation of 106.980 level may send the USD/JPY currency pair towards 105.850 level. 

All the best for today! 

Categories
Crypto Market Analysis

Daily Crypto Review, Apr 21 – BTC Under $7,000 as WTI Crude Futures reach negative value

The cryptocurrency market had a slight price decline in the past 24 hours. Most people connect this price drop with the WTI crude Futures market plummeting yesterday. Bitcoin is currently trading for $6,886, which represents a decrease of 3.91% on the day. Meanwhile, Ethereum lost 5.19% on the day, while XRP dropped 4.95%.

Stellar took the position of today’s most prominent daily gainer, with gains of 2.01%. Numeraire lost 11.21% on the day, making it the most prominent daily loser.

Bitcoin’s dominance stayed at the same place when compared to yesterday. Its value is now 63.83%, which represents a 0.25% difference to the upside.

The cryptocurrency market capitalization decreased as most cryptos were in the red. Its current value is $199.39. This value represents a decrease of $9.39 billion when compared to the value it had yesterday.

What happened in the past 24 hours

Bitcoin vs. WTI Crude

The Futures contract for West Texas Intermediate Crude for the month of May dropped more than 100% on Monday. Its worst the price managed to reach negative $37.63. This phenomenon has never happened before.

Bitcoin’s price also corrected on Monday as WTI futures imploded. However, the decline that Bitcoin had was relatively small.

_______________________________________________________________________

Technical analysis

_______________________________________________________________________

Bitcoin

The largest cryptocurrency by market cap did not manage to keep its price above $7,000 on Monday. Therefore, its price fell under and reached the low of $6,750 before springing back. Its price is currently above the $6,850 level, but there are no indications about what the price will do next at the time of writing.


Bitcoin’s volume almost doubled during the downswing, while its current volume is on the lower side of the scale. Its RSI level is bouncing from the 40’s levels.

Key levels to the upside                    Key levels to the downside

1: $7,085                                           1: $6,850

2: $7,420                                           2: $6,640

3: $7,750                                            3: $5,960


Ethereum

Ethereum followed Bitcoin to the downside, and, as it usually goes with all altcoins, dropped more in price than Bitcoin did. The second-largest cryptocurrency by market cap fell from its highs of $190 slowly to $186 over many hours, until an influx of sellers came to the market. Ethereum’s price then fell to $166.5, but acknowledged the $168 support level and stayed above it. Ethereum looks safe above this level (for the time being).


Ethereum’s volume (on average) increased in the past 24 hours, while its RSI level bounced back from the value of 40 to around 47.

Key levels to the upside                    Key levels to the downside

1: $175.5                                             1: $168

2: $178.6                                            2: $158 

3: $185                                                3: $147.5


Ripple

Even though XRP followed the market down, an extremely bullish thing emerged from the price drop. The third-largest cryptocurrency by market cap fell from its most recent highs all the way down to $0.178. However, the price sprang back up and recovered to the price of $0.185. The highest level of the price recovery isn’t the thing we should pay attention to, though, but rather the descending trend which XRP entered during its price drop. With its price going up, XRP managed to escape this trend and then confirm its price above it, which is huge for the XRP bulls.


Key levels to the upside                    Key levels to the downside

1: $0.19                                              1: $0.178

2: $0.2                                                2: $0.165

3: $0.205                                             3: $0.147

Categories
Forex Market Analysis

Gold Bullish Correction – Is It Good Time to Go Long?

On Monday, the precious metal gold edged higher from a more than one-week low hit earlier, helped by dwindling share markets as U.S. crude prices plunged and concerns about coronavirus-linked economic damage persisted.

The reason behind the fresh risk-off market sentiment is the rise in the coronavirus (COVID-19) driven death numbers from the U.S. and the U.K. The U.S. President Donald Trump’s indirect attack on China’s struggles to stop the coronavirus outbreak also pushes the risk-off.

On the flip side, U.S. President Donald Trump showed some willingness to deliver another relief plan while also pushing for an economic re-open program but failed to extend the Friday’s risk-on market sentiment. The yellow-metal got mild support earlier by the People’s Bank of China’s (PBOC) rate cut.

The U.S. 10-year Treasury yields drop more than 2-basis points (bps) to 0.634%, whereas Asian stocks also struggle. Looking forward, the traders will keep their eyes on the virus-related headlines for taking fresh directions.

Daily Support and Resistance

  • S1 1629.37
  • S2 1660.04
  • S3 1672.4
    Pivot Point 1690.72
  • R1 1703.07
  • R2 1721.39
  • R3 1752.07

Technically, gold is bouncing off above a strong support area of 1,672 to trade around 1,695 level. Closing of candles below 1,701 levels may drive some bearish correction in the market while the major resistance stays around 1,712. Below this, we may see some selling bias in gold today. The 50 EMA is suggesting buying while the MACD is suggesting selling trend, but histograms are becoming smaller suggestings chances of a bullish reversal. Let’s look for buying trades over 1,686 and selling trades below 1,712 today. Good lucK!

Categories
Crypto Videos

How To Profit Trading Crypto With Elliot Wave Part 2


Elliot waves Crypto trading guide – part 2/2

The second part of the Elliot waves guide will talk about the use of Heikin Ashi candles, wave degrees as well as how to trade the Elliot wave in general.

Heikin Ashi and Elliot wave trading

If you seem to get confusing results from the chart, it’s most likely a miscalculation as far as following the rules of the Elliot wave go.

However, there is a way to track and read the chart better.

Heikin Ashi candles pair up extremely well with the Elliot wave pattern reading as they help recognize red or green candles that create a trend. This makes you respond to the market movement and distinguish trends easier.

Wave Degrees: The Waves Within Waves – explained


Each wave of the five Wave Elliott Principle consists of one larger timeframe wave. Each wave can consist of larger market cycles that even take decades to complete.

The degrees of the wave patterns have different names:
Subminuette: lasts minutes
Minuette: lasts hours
Minute: lasts days
Minor: lasts weeks
Intermediate: takes weeks to months
Primary: takes several months to a few years
Cycle: takes one to several years
Supercycle: takes multiple decades (40–70 years)


Grand Supercycle: takes multiple centuries
When it comes to cryptocurrencies, and knowing that it is a young market, large wave degrees do not exist yet. However, we have seen a pattern as big as Primary during the rise and fall of Bitcoin’s price in 2017 and 2018.
Trading the Elliot wave

Entries and Exit points

The best entry point would ideally be the start of the first wave. However, that is quite unrealistic as it can be hard to spot and recognize a wave so early. Most traders start at the bottom of the second or the start of the fourth wave. These waves are much easier to spot. As a word of caution, try not to ever buy near the top of the third wave or fifth wave.
The best exit point would be the end of the third corrective wave. However, timing this can be quite hard as these final waves might retrace to 100% of the initial pattern. For this reason, most traders choose a safer exit position, which is the place where consolidation breaks outside of the final corrective wave.

Conclusion

The Elliott Wave Principle is a highly useful chart pattern that is used by many veteran traders. It is mostly used to recognize the beginning and end of a certain trend.
Do your own research before attempting to buy and sell anything. Happy trading.

Categories
Forex Videos

Forex Chart Hopping! How To Be More Consistent

The Danger Of Chart Hopping

One of the biggest areas where new traders fall down is chart hopping.
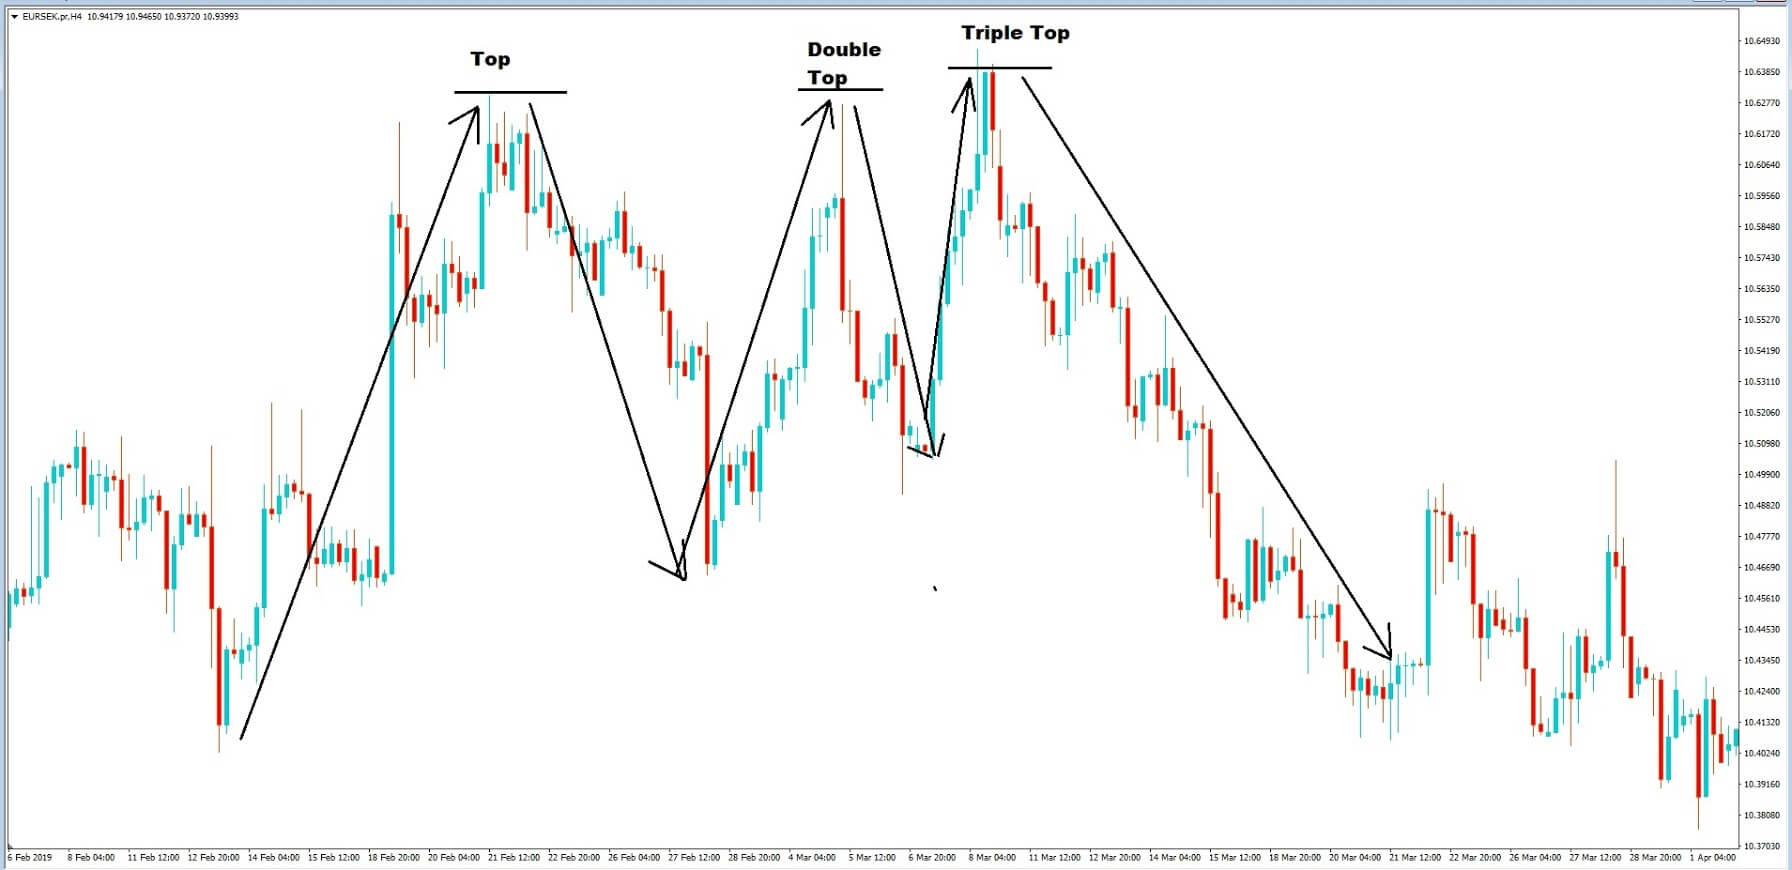
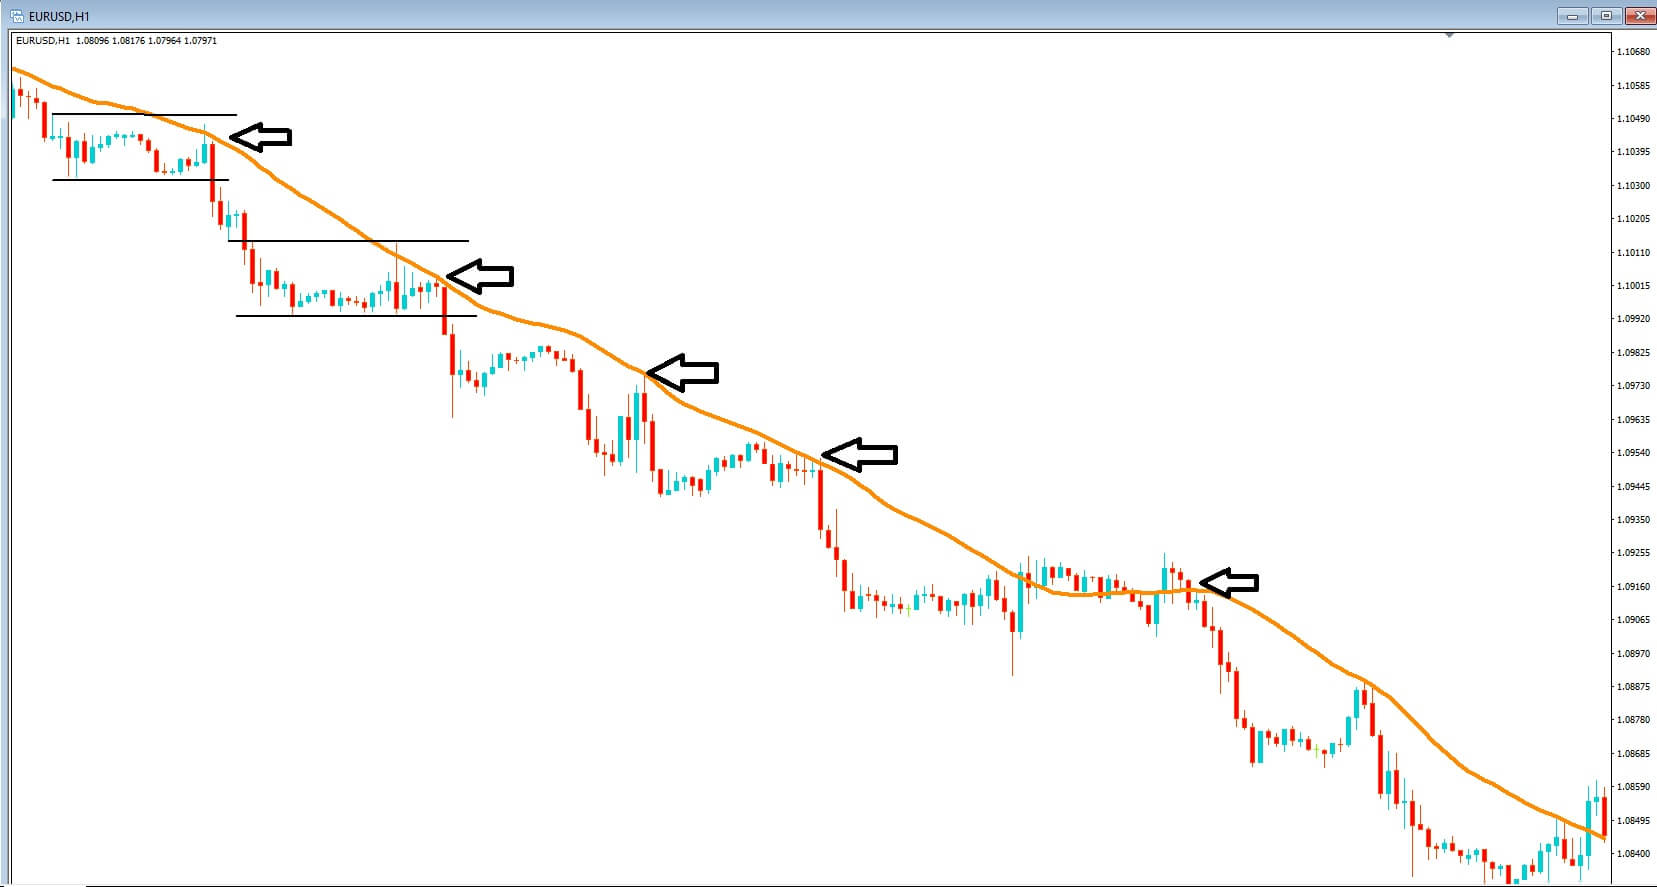
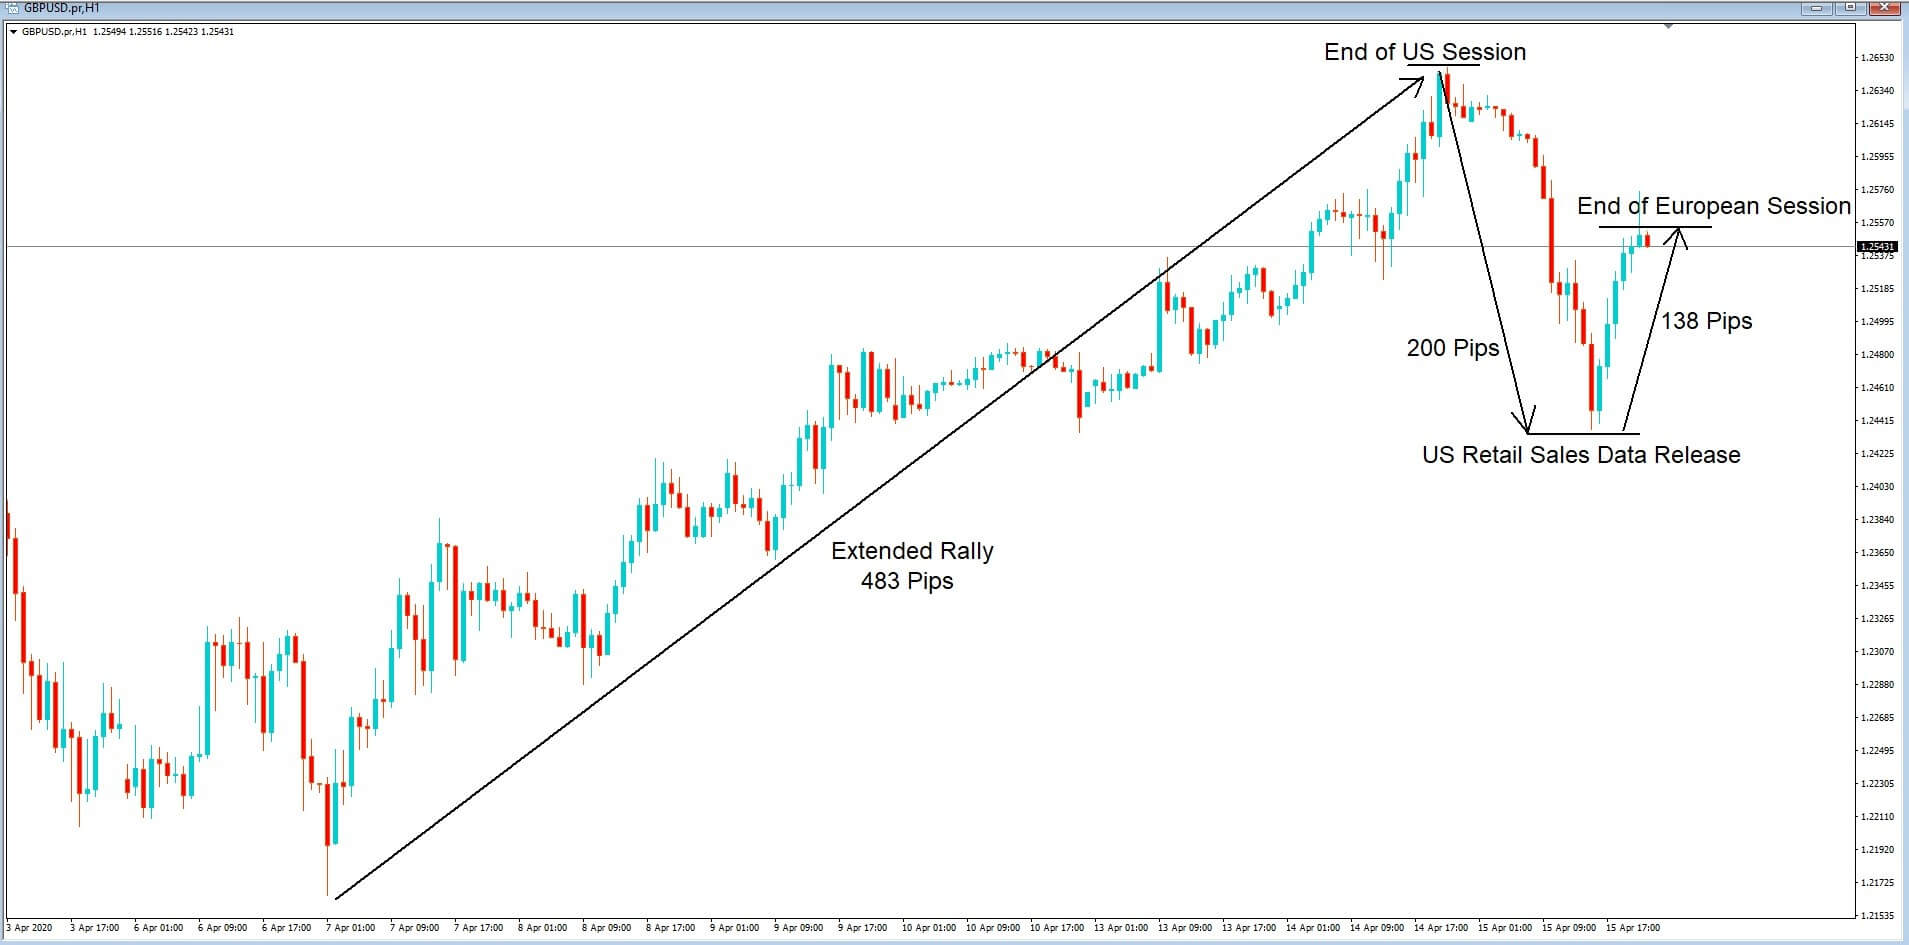
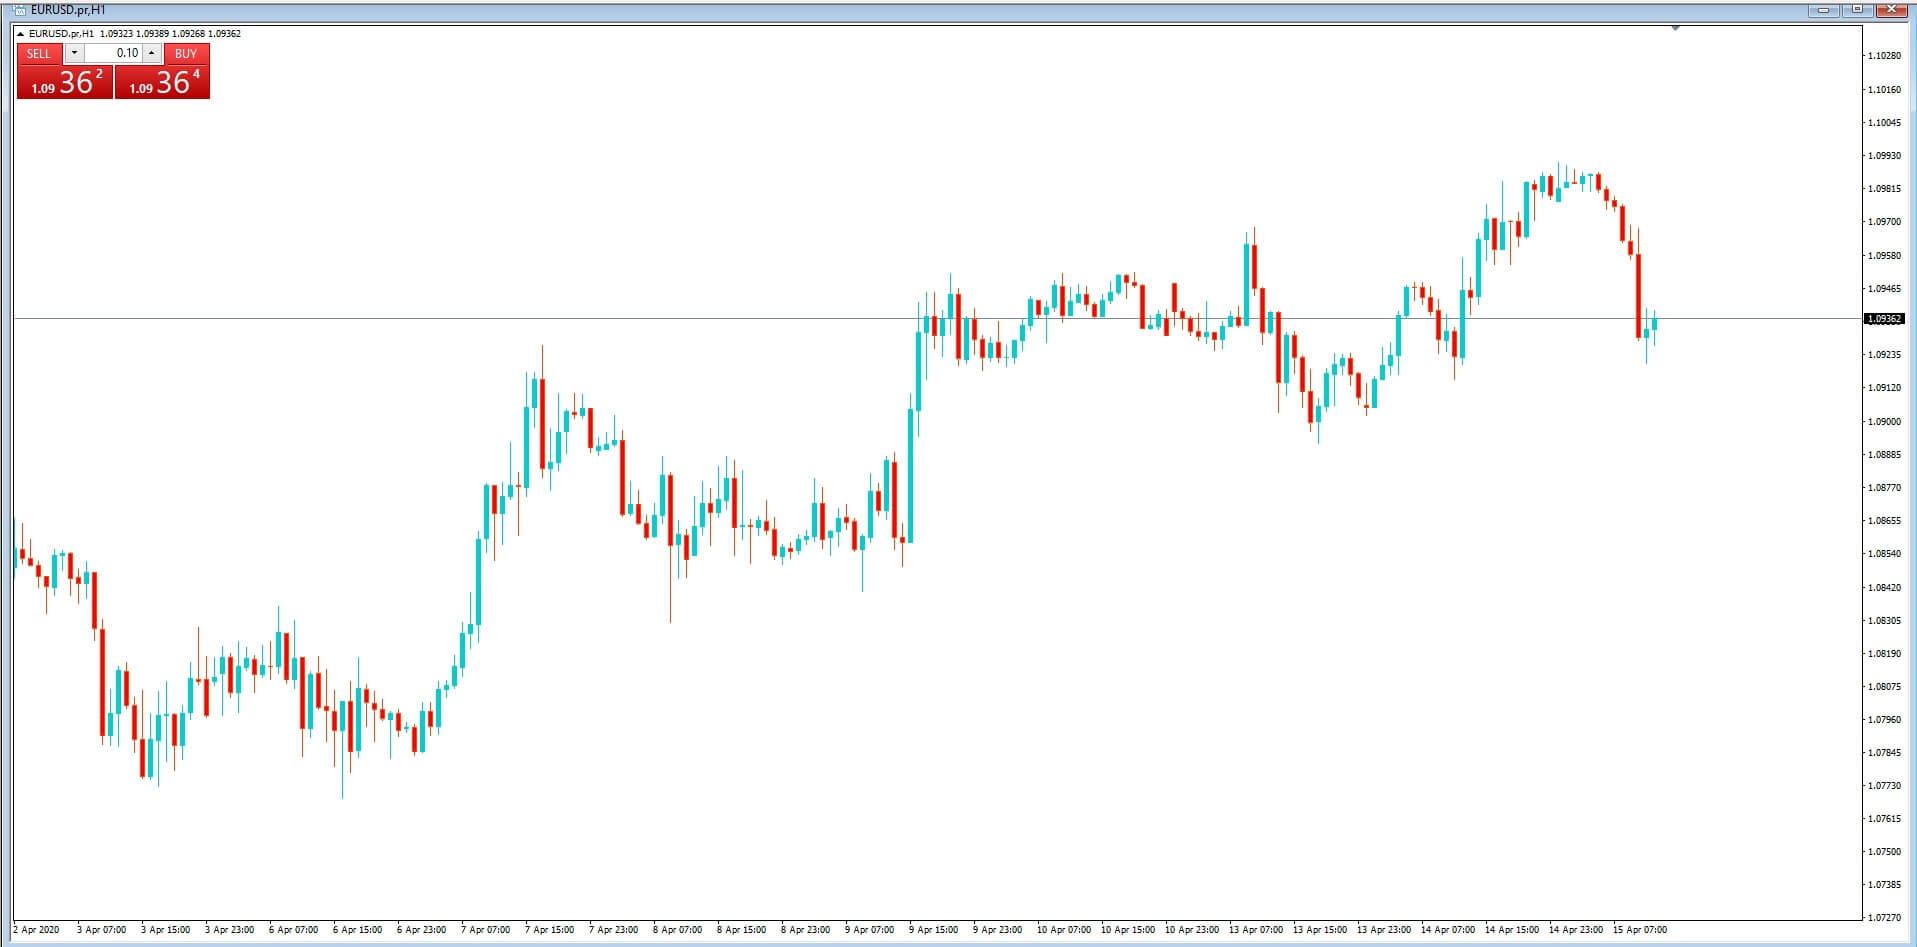
They flip flop from one chart to another looking for the opportunity which will give them a chance to bag a couple of hundred pips

without fully appreciating all of the dynamics involved in technical analysis.
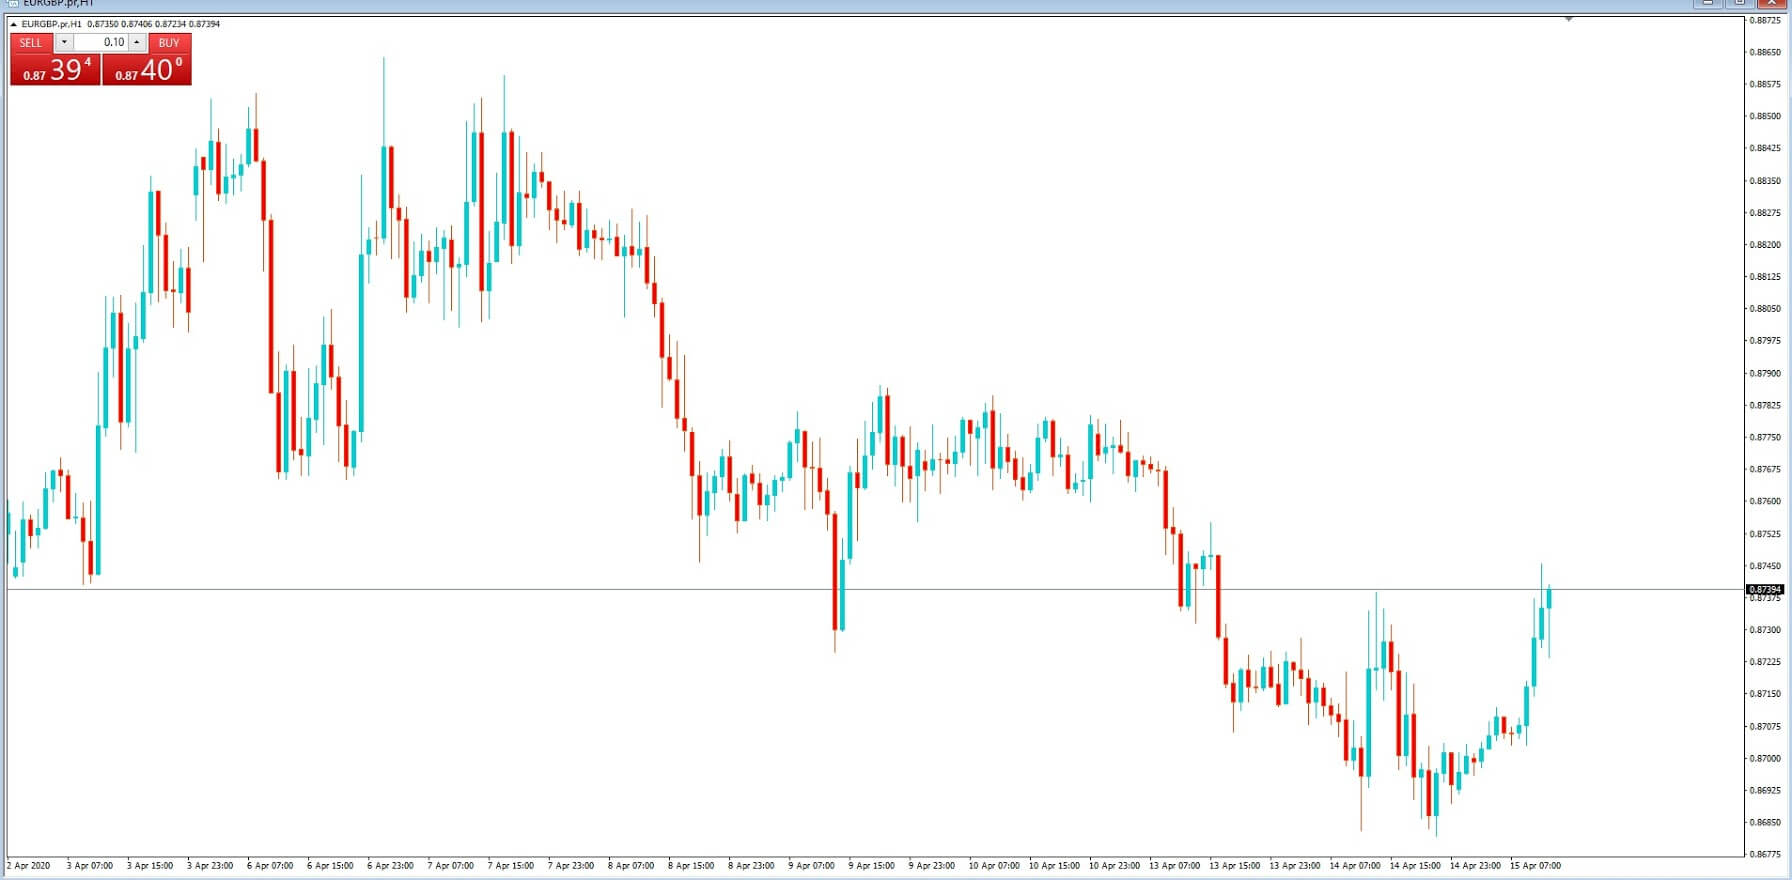
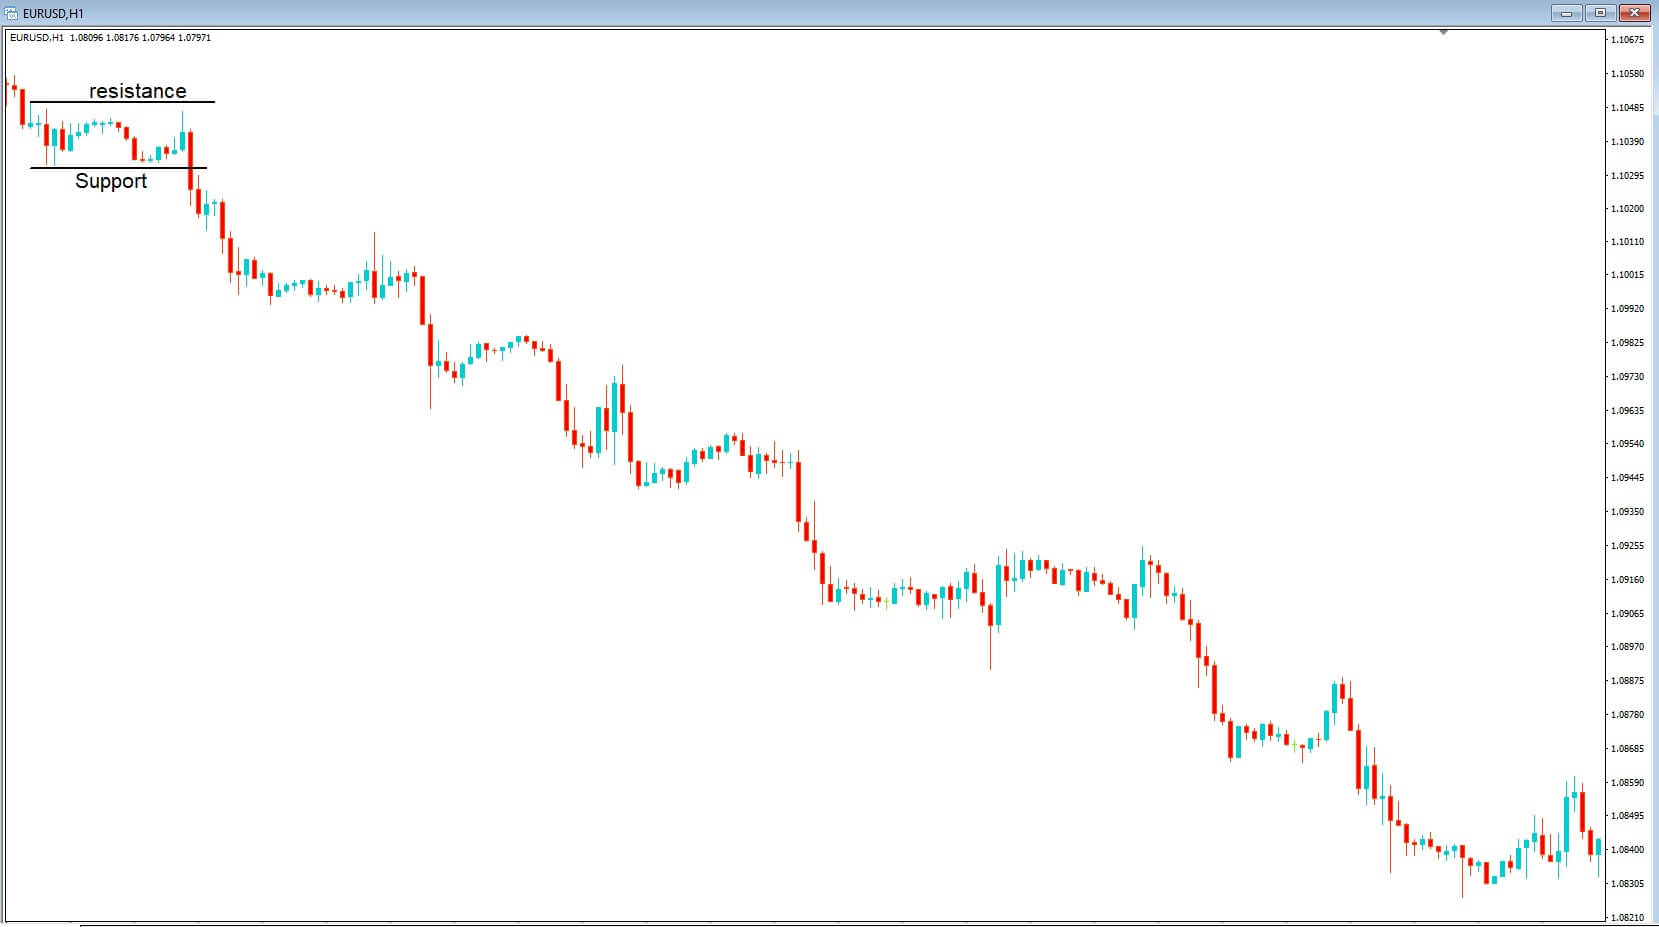
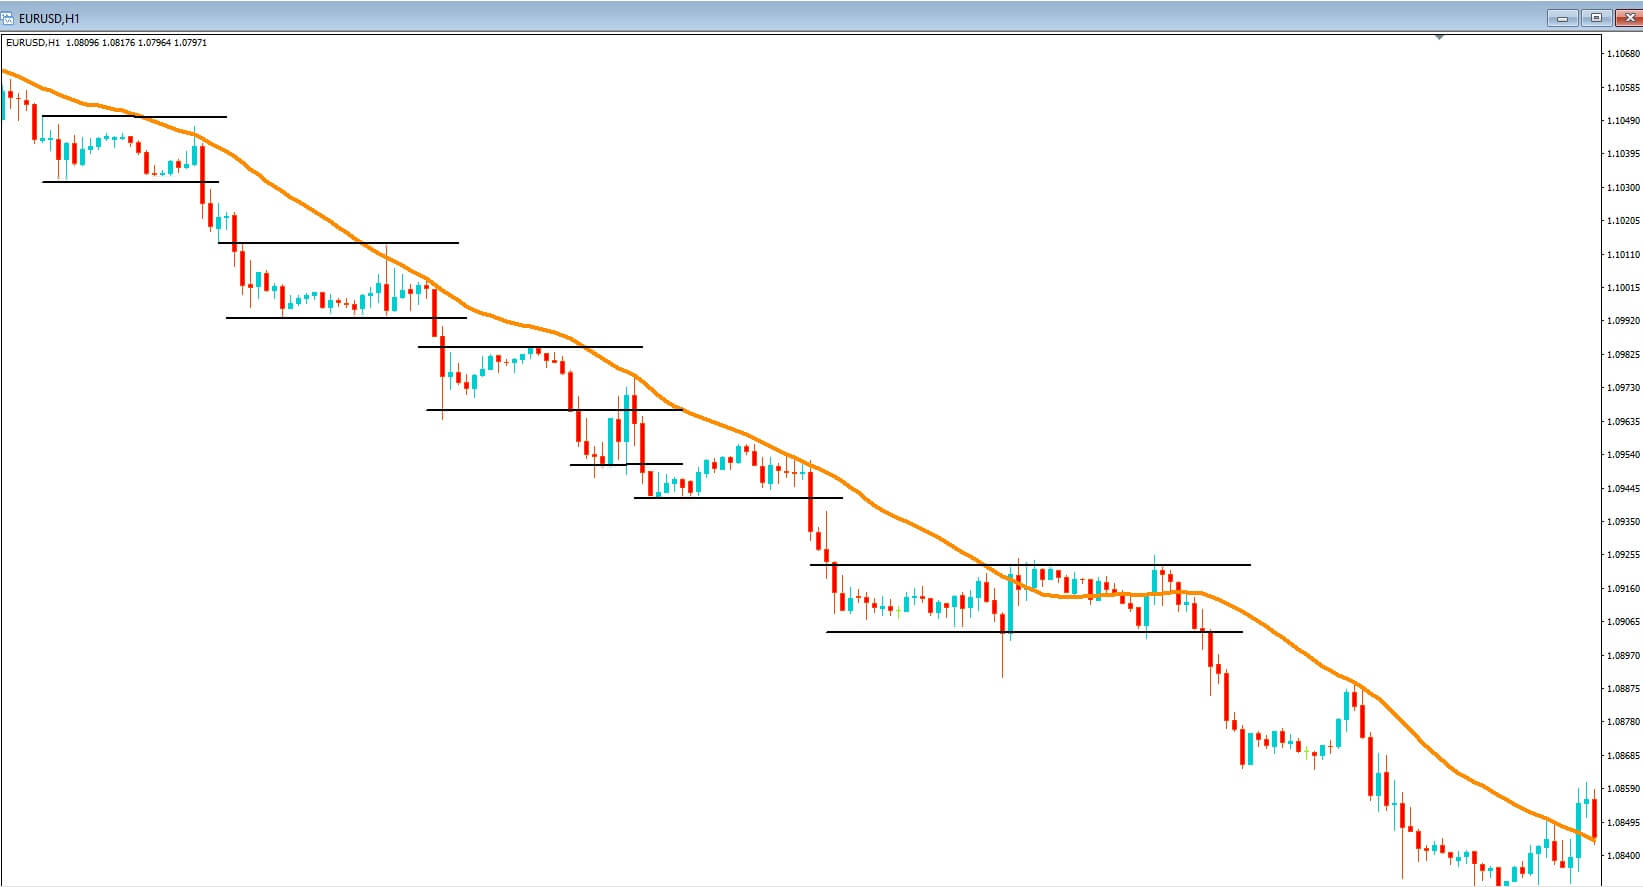
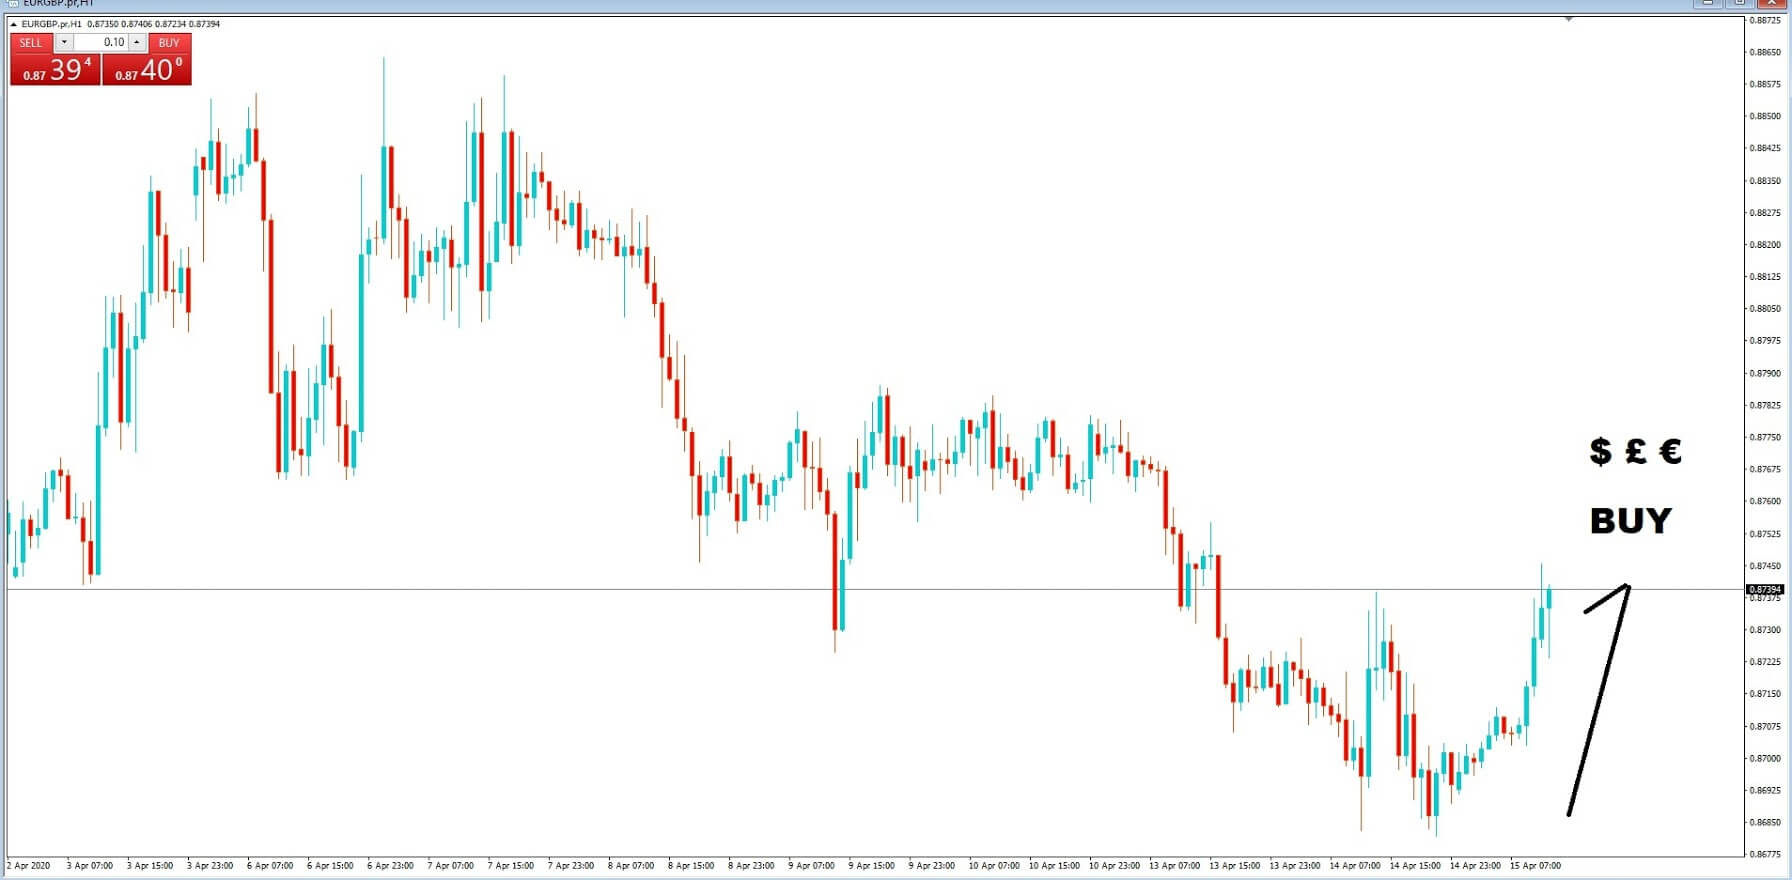
They think they spot a trend and jump right in and execute a trade, thinking only of the money they could make. They often make the mistake of buying at the top of the market or selling at the bottom. Think they may have spotted a trend, and perhaps they have, or it might be that some news has just come out, and they make a split second impulsive decision to buy or sell a currency pair simply based on what they’ve seen or heard.
And although they may indeed have spotted a nice trend, it could be that that trend is about to stop dead in its tracks and about to turn.
Such traders will not even bother to implement the most basic of technical analysis. It’s trading on a wing and a prayer and is tantamount to gambling.
No matter how much you think or believe that a currency pair may or may be trending, in any given direction, do not execute a trade until you have backed up your theory with tried and tested technical analysis methodology.

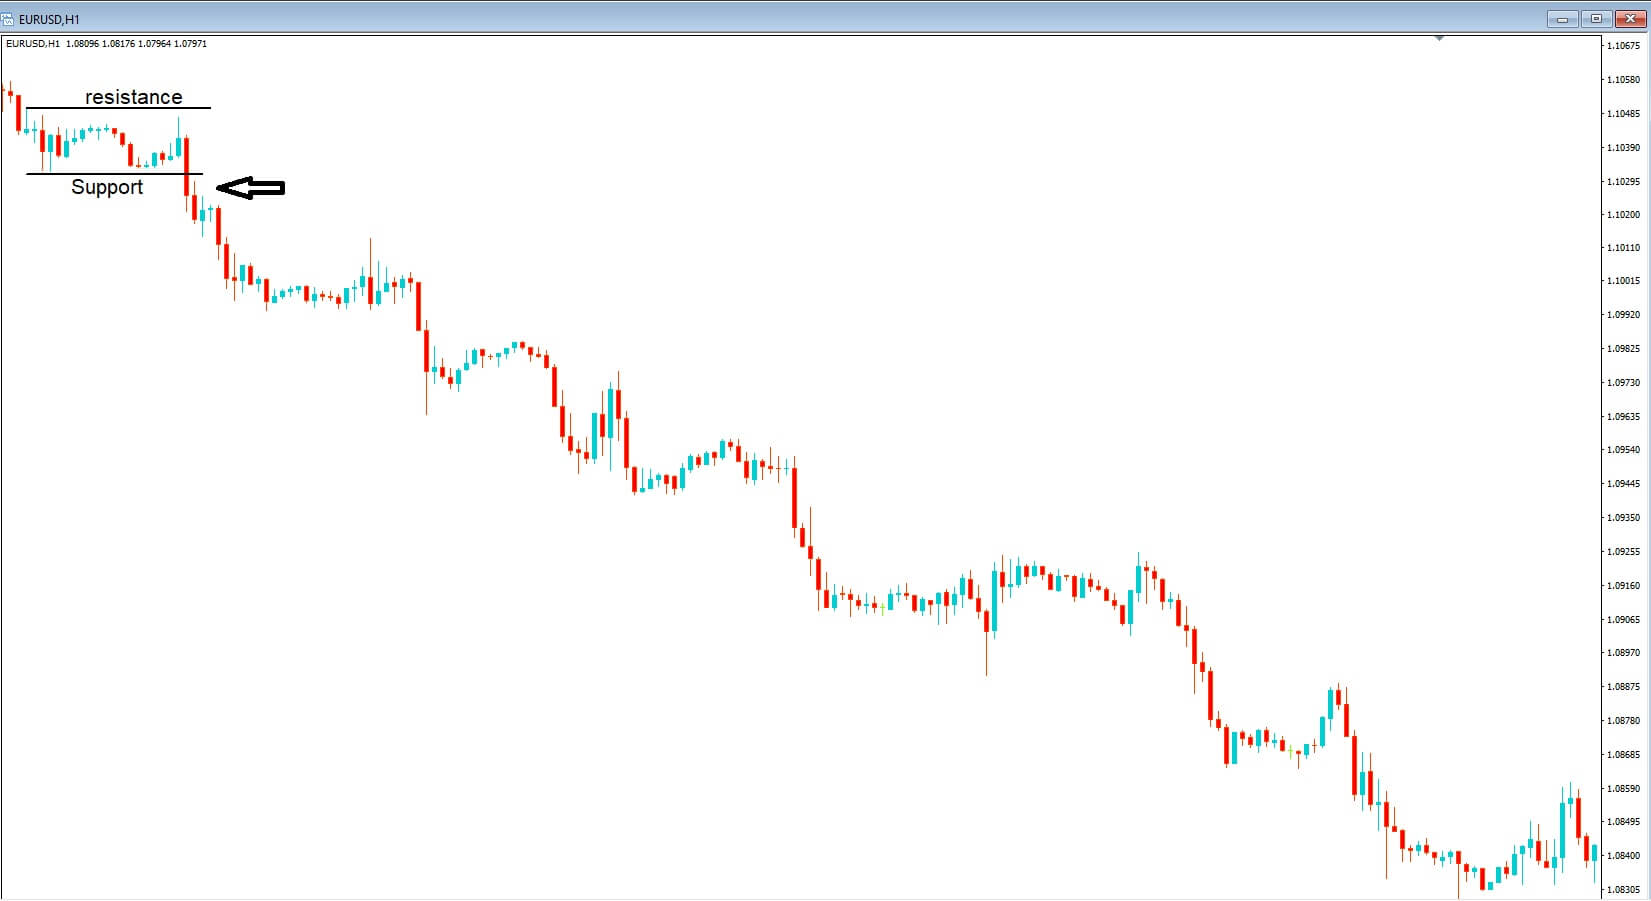
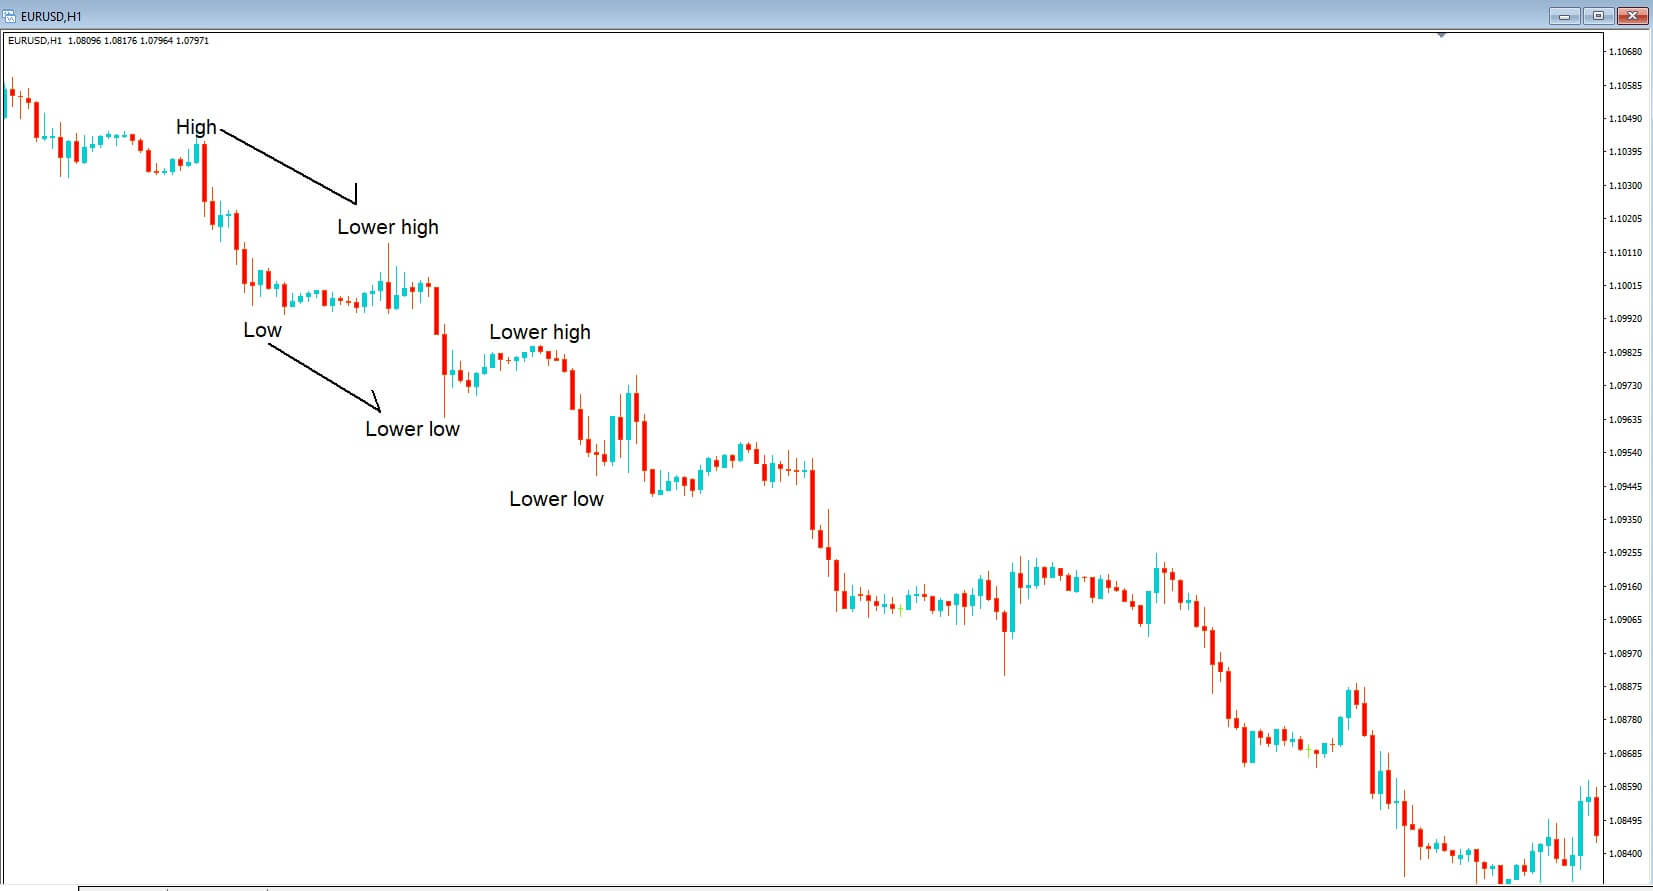
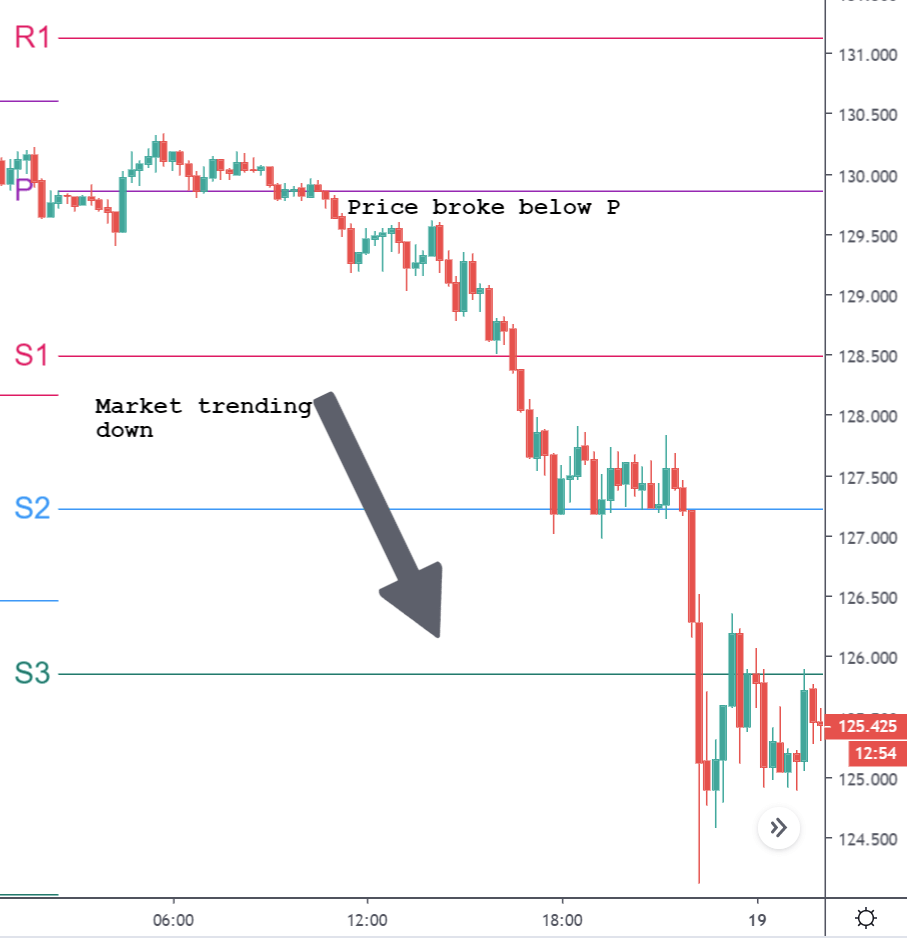
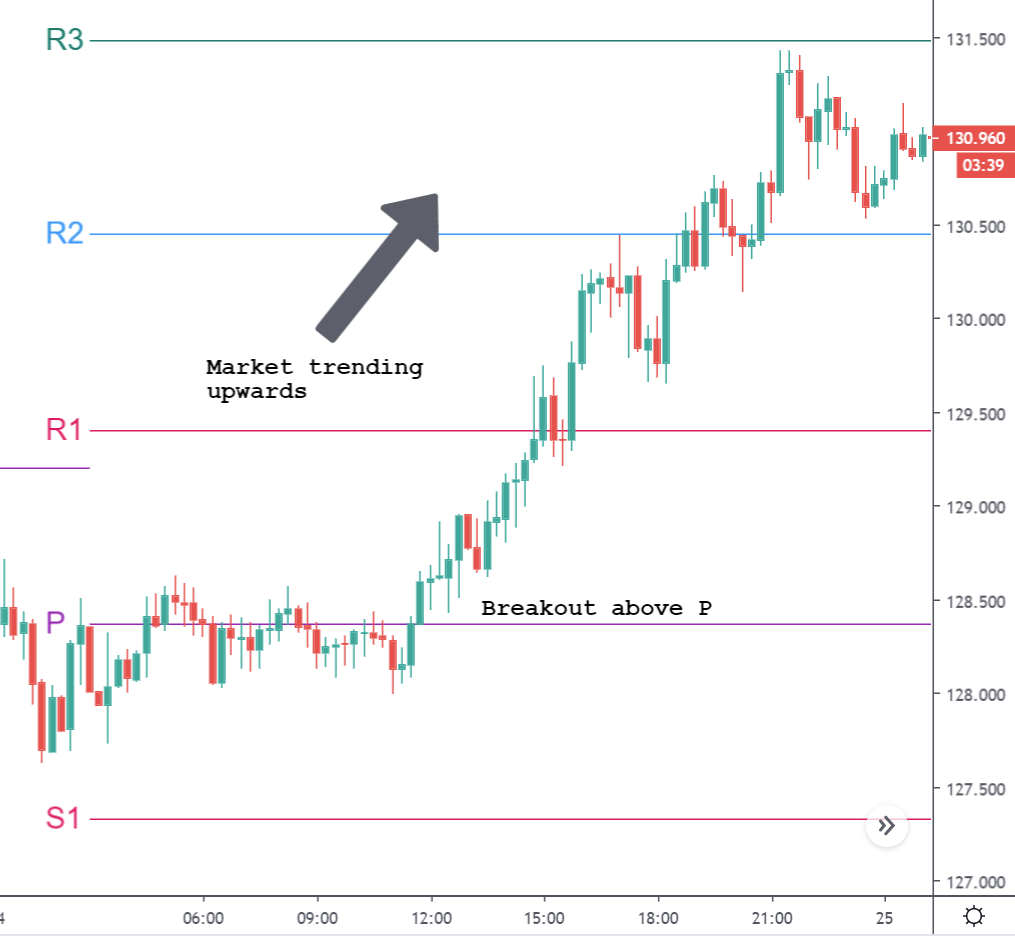
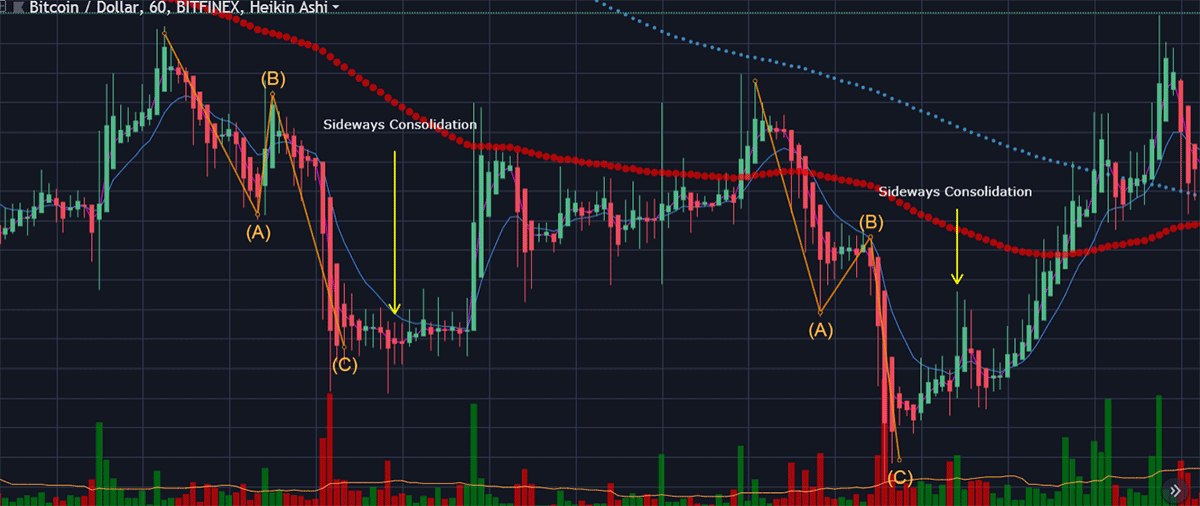
So when are trends likely to end? Why do trends finish reverse or go into periods of consolidation? Typically trends will start to fade and finish at the end of trading sessions, such at the end of the Asian, European or US sessions, where those traders had been buying or selling a pair based on their trading needs or beliefs pertaining to market conditions or possibly due to their balance sheet requirements or even because they are influenced due to their own country’s import and export requirements. They may have just seen a good trend and jumped on it, but when their session came to the end, they closed out their interest and took their profits.
Or it might be that they are rebalancing their portfolios by getting in and out of positions to cover market volatility in Risk on and Risk off scenarios. And where the sentiments of one session, which is ending may be completely different to the sentiment of those traders coming into a new session in a new country where they have their own various sets of requirements and beliefs about where currencies should be in relation to one another.
Of course, it could just be that trends fade for no apparent reason. It might come at the end of a 15- minute candlestick or an hourly or daily candle, which is enough to tip the balance and reverse a trend. Or it might be that a currency pair is deemed to be overbought or oversold due to technical analysis. Impending economic data releases is also another time when trains can stop for no apparent reason, or around the times when key policymakers are due to make policy statements or speeches.

One critical mistake is where traders will hop on a trend, which is absolutely great if they have done their homework and all the above mitigating circumstances are taken into consideration, but may not have factored in that perhaps a currency pair has already moved a couple of hundred pips in which case it is

quite dangerous to jump on and expect that trend to continue without some kind of pullback.
So our advice is: do not make impulsive trades based on hopping from one chart to the next. Always do your technical analysis research and make sure your timing is correct and that you have considered all of the above before you execute each trade.

Categories
Forex Elliott Wave

Complex Corrective Waves Analysis – Advanced Level – Part 1 of 2

Introduction

Complex corrective waves are groups of waves that do not have an internal structure subdivided into three or five waves. In general, complex corrections tend to appear in waves fourth or B. Moreover, these formations are divided into two categories standard and non-standard.

Standard Type

An impulsive or corrective Standard wave formation does not imply that it is formed by a series of three or five adjacent segments. Usually, one of its corrective waves will possess a greater number of internal subdivisions creating a more extensive structure in terms of time. This condition will create a context in which can verify the alternation principle.

If the standard complex wave is in an impulsive sequence, it may be in wave 2 or 4. Otherwise, if this complex wave appears in a corrective phase, it will be between waves A and B.

The following figure shows a simplification of standard complex waves in an impulsive sequence and a corrective structure.

Non-Standard Type

Complex corrections only occur if there are at least two corrective sequences compacted in their three-wave structure and separated by a corrective formation that acts as a connector between the two corrective patterns. This type of waves must be given under certain conditions; likewise, they must meet specific rules that occur only once the waves have been compacted.

Retracement Rules

If the wave analyst found a compact corrective pattern that confirms a retrace less than 61.8%, or greater than 161.8% by the next corrective wave, and then produces another corrective wave, then the wave analyst should analyze the corrective structure as says the specifications section.

If the grouping conditions commented previously don’t meet, then the corrective structure shall be standard. In this case, the wave analyst should work the corrective sequence in the same way as discussed in the section “Corrective wave analysis – Intermediate level.”

On the other hand, the extension or duration in the time of the corrective wave doesn’t affect its analysis. A complex corrective structure can last for days and even years without this changing its structure. In this context, the wave analyst must maintain order in the use of the labels of each formation.

Non-standard Complex Wave Specifications

The first principle of a complex corrective wave implies the existence of a wave X, which acts as a connector for two standard Elliott corrective wave formations. The wave analyst should keep in mind that this point is the key to understanding non-standard patterns.

There exist two conditions to recognize the behavior of waves x.

  1. The first condition indicating the development of a wave x occurs when two compact corrective waves of a higher degree are separated by an intermediate corrective wave, which may be standard or non-standard. The first corrective wave must experience a retrace of less than 61.8% from the intermediate wave. In general, the wave x (or intermediate wave) will have a lower level of complexity than the other two corrective structures.
  2. If the price action reveals three corrective waves compacted consecutively, so that the second correction is at least 161.8% higher than the first, then it is highly likely that the second corrective structure will be a wave x. In general, the three complex waves will have the same complexity level.

If the market develops one of the two conditions commented previously, the market has likely developed a non-standard corrective formation.

Conclusions

In this educational article, we discussed the fundamental principles of a complex corrective structure and the importance of wave compaction in identifying and analyzing wave structures. 

In previous chapters, we have seen how to recognize the principle of alternation in the analysis of both impulsive and corrective waves. In this sense, the wave analyst must take into account this concept, which will allow him to identify what will be the next most likely movement.

In particular, R.N. Elliott, in his work “The Wave Principle,” defines the alternation of corrective waves and their complexity as follows “if a corrective wave is simple, the following will be complex, and vice versa.” Within a complex corrective structure, the compacted corrective patterns that compose it will also alternate with each other.

In the next article, we will look at the construction of complex corrective waves according to each condition. 

Suggested Readings

  • Neely, G.; Mastering Elliott Wave: Presenting the Neely Method; Windsor Books; 2nd Edition (1990).
  • Prechter, R.; The Major Works of R. N. Elliott; New Classics Library; 2nd Edition (1990).
Categories
Forex Course

103. Analyzing The Power Of Oscillators

Introduction

In the previous lesson, we had an introduction to oscillator indicators and understood how they work. In this lesson, we shall put that into action by analyzing some of the most used oscillators.

Quick Revision

In general, Oscillator is any object that moves back and forth between two points. In simple terms, anything that moves between two points, 1&2, is said to be an oscillator.

The concept remains the same for trading as well. An oscillator is an indicator which moves within two bounds in a range. When trading using oscillators, our eye catches interest when it is around the peaks and troughs. These areas generate buy and sell signals. Precisely, it indicates the end of a trend or the beginning of a new trend.

Trading Oscillators

Stochastic, Relative Strength Index, and Parabolic SAR are the extensively used oscillators by traders.

All these indicators work under the premise that the rate of price change begins to slow; that is, the number of buyers or sellers have reduced at the current trading price. And this change in the momentum indicates a possible trend reversal because the other party is losing its gas. Such indications are given when the oscillators are at the overbought or oversold regions.

Stochastic Indicator

The stochastic indicator is an oscillator whose upper and lower bounds are 80 and 20, respectively. So, if the line moves 80, it enters into the overbought region, and if it drops below 20, it is said to be in the oversold region.

Calculating stochastic variables

There are two line on the stochastic oscillator, namely, %K and %D. Both the values are calculated as follows:

%K = 100 x (Price – L) / (H – L)

%D = (K1 + K2 + K3) / 3

Where, in %K, H and L represent the Low and High for the specified period. And %D represents the average of the most three recent values of the %K.

Note: In the given example, the period is chosen as 14 (last 14 days/candles).

RSI Indicator

The Relative Strength Index (RSI) is a momentum oscillator that measures the rate of change of price and the magnitude of directional price movements. The RSI calculates the momentum as the ratio of higher close values and lower close values for a specified period. As it is an oscillator, it oscillates between the bounds 30 and 70. The interpretation for it is the same as that of other oscillators.

Interpretation Example

To illustrate the use of the oscillators, consider the given chart of USD/CAD on the 1D timeframe. To the price chart, the stochastic and the RSI oscillator has been applied.

At the vertical red lines, it can be seen that the market was overbought according to both the oscillators. This is an indication that the market which was in an uptrend priorly is not losing strength. Hence, in hindsight, the market falls as the oscillators start to make their way back into the range.

Bottom Line

Oscillators are great leading indicators that help in determining oversold and overbought conditions. It also gives traders an indication of the possibility of a market reversal. From the above example, it is seen that these indicators work like a charm. However, one must note that oscillators work in your favor, but not always. Sometimes, one oscillator indicates a buy while the other does not. These are the times when traders must avoid trading such instruments. As shown, oscillators must be used with other oscillators or technical tools to achieve the best out of it.

[wp_quiz id=”70760″]
Categories
Crypto Market Analysis

Daily Crypto Review, Apr 20 – Blockchain Jobs Booming; Lightning Network Unsafe?

The cryptocurrency market spent the weekend consolidating. Bitcoin is currently trading for $7,166, which represents an increase of 0.38% on the day. Meanwhile, Ethereum gained 2.83% on the day, while XRP gained 0.03%.

MaidSafeCoin took the position of today’s most prominent daily gainer, with gains of 112.34%. Synthetix Network lost 4.92% on the day, making it the most prominent daily loser.

Bitcoin’s dominance dropped almost a whole percent during the weekend. Its value is now 63.58%, which represents a 0.75% difference to the downside.

The cryptocurrency market capitalization increased slightly over the weekend. Its current value is $208.78. This value represents an increase of $5.42 billion when compared to the value it had on Friday.

What happened in the past 24 hours

Blockchain is becoming one of the most demanded business skills for 2020. Blockchain technology is (as the research shows) the most sought-after hard skill in 2020.

While the coronavirus pandemic is continuing to “take” jobs from people, blockchain-related jobs have been on a constant rise.

Honorable mention

Bitcoin

Researchers from the Norwegian University, as well as the University of Luxembourg, have published an interesting research paper that detailed a network attack that tries to deanonymize the transactions broadcast across the Bitcoin’s Lightning Network.

The paper describes this ‘probe attack’ as possible and doable in “under a minute per channel.” On top of that, they said they required moderate capital commitment and no expenditures to perform the attack.

_______________________________________________________________________

Technical analysis

_______________________________________________________________________

Bitcoin

The largest cryptocurrency by market cap spent a slow weekend (from a price perspective). After the price broke the $7,085 level, it established itself above and confirmed $7,085 as its support. The volume over the weekend decreased when compared to the previous week but stayed at the same level throughout the days.

One thing to note is that Bitcoin rarely “stops” its movement like this, and whenever this happens Bitcoin is likely to have a volatile move to either upside or downside.


Key levels to the upside                    Key levels to the downside

1: $7,420                                           1: $7,085

2: $7,750                                           2: $6,850

3: $8,000                                            3: $6,640


Ethereum

Unlike Bitcoin, Ethereum spent the weekend attempting to reach new highs. The second-largest cryptocurrency by market cap managed to break out and surpass $168 resistance level as well as $175.5 and $178.6 resistance levels. The cryptocurrency reached a price of $190, but quickly rebounded and fell in a tight range between $178.6 and $185.


Ethereum’s volume decreased over the weekend (if we exclude the volume increase during the few hours of the price spike), while its RSI level is at 61.

Key levels to the upside                    Key levels to the downside

1: $185                                                1: $178.6

2: $193.6                                            2: $175.5 

3: $198                                                3: $168


Ripple

XRP went through the weekend without much price movement. The third-largest cryptocurrency by market cap retested the previously passed $0.19 support line, which received enough support and confirmed itself as a support level. However, XRP is looking towards the downside again, and it is likely that it will retest this support level once again.


XRP’s volume was descending during the whole weekend, while its RSI reached the value of 52.

Key levels to the upside                    Key levels to the downside

1: $0.2                                                1: $0.19

2: $0.205                                            2: $0.165

3: $0.221                                             3: $0.147

Categories
Forex Market Analysis

Daily F.X. Analysis, April 20 – Top Trade Setups In Forex – Eurozone Events in Focus! 

On the forex front, the U.S. Dollar Index eased 0.2% on the day to 99.72. On the economic data front, the Conference Board U.S. Leading Index dropped 6.7% on month in March (-7.2% expected). Today, the focus will be on the Eurozone’s economic events, which include the Trade balance, PPI, and current account, and these are due during the European session.

Economic Events to Watch Today     


EUR/USD – Daily Analysis

The EUR/USD gained 0.4% to 1.0878 and GBP/USD rebounded 0.3% to 1.2501. The markets are now concerned about extended lockdowns indicating a deeper economic recession than previously forecasted. Moving on, the market sentiment is expected to stay pro-risk during the day ahead. 

European stocks rebounded further, with the Stoxx Europe 600 Index gaining 2.6%. Germany’s DAX climbed 3.2%, the U.K.’s FTSE 100 increased by 2.8%, and France’s CAC jumped 3.4%.

The coronavirus outbreak has brought the deep divides among the member states on fiscal spending. Italy and Spain have blamed northern nations led by Germany and the Netherlands – of not doing enough.

Whereas Italy, Spain, France, and some other countries need debt mutualization through corona bonds, Germany and the Netherlands are still not buying the idea of community debt needed to control the economic fallout from the virus outbreak. 

Looking forward, as the data calendar is light with no first-tier releases scheduled for release in the Eurozone and the U.S. The traders keep their eyes on the coronavirus related updates for meaningful direction.

Daily Support and Resistance

  • S1 1.0698
  • S2 1.0779
  • S3 1.0826

Pivot Point 1.0859

  • R1 1.0907
  • R2 1.094
  • R3 1.1021

EUR/USD– Trading Tips

On Monday, the EUR/USD is trading sideways at 1.0835, exhibiting a bearish crossover below 50 EMA, which is now extending resistance around 1.0903 level. Continuation of a selling trend below 1.0903 level can extend selling until the next support area of 1.0772, but on the way, the pair may find support around 1.0815 level. The EUR/USD is likely to find support around 1.0772, but below this, the next support prevails around 1.0652 level. 

At this moment, the EUR/USD is holding at 1.0835, having an immediate resistance level of around 1.09230, where the bullish breakout of this level can extend buying until the next resistance level of 1.1036. Conversely, we should look for selling trades below 1.0870.

GBP/USD– Daily Analysis

The GBP/USD rebounded 0.3% to 1.2501 and consolidated in the range between the 1.2604 – 1.2450. However, the currency pair traders did not give any major attention to the coronavirus (COVID-19) crisis at home because the cases are comparatively more significant in the U.S. 

Moreover, the United Kingdom and European Union Brexit drama keep moving while the latest news recommending to keep a check of Britain’s £39 billion has also been underlined by the cost of dealing with coronavirus especially the economic £250 billion rescue package announced by Chancellor Rishi Sunak to protect jobs and businesses.

On the other hand, U.S. President Donald Trump showed some willingness for another relief plan while also supporting an economic re-open plan.

Looking forward, all traders will keep their eyes on the coronavirus headlines due to a light economic calendar. However, any surprise announcement of stimulus might grab the spotlight.

Daily Support and Resistance

  • S1 1.2254
  • S2 1.2365
  • S3 1.2433

Pivot Point 1.2475

  • R1 1.2544
  • R2 1.2586
  • R3 1.2697

GBP/USD– Trading Tip

The GBP/USD is trading with a neutral bias over 1.2420 support areas to trade around 1.2446. The GBP/USD pair is likely to find support around 1.2420, which is extended by the triple bottom level that we can see on the 4-hour timeframe. A bearish breakout of 1.2425 support area is expected to trigger a sell-off until 1.2210. The 50 periods EMA is also keeping the GBP/USD pair supported around 1.2430. Thus, the bounce off above this level can lead the GBP/USD pair towards the next resistance level of 1.2657. While bearish breakout of 1.2460 can open up further room for selling until the next support area of 1.2220. 

USD/JPY – Daily Analysis

The USD/JPY is flashing green and registered fresh gains near the 107.94, mainly due to the broad-based U.S. dollar strength in the wake of intensifying coronavirus fears, keeps the market tone heavy on the day. The slump in the Japanese exports for March keeps Japanese yen down, which also supports the currency pair to stay at the upside. The USD/JPY is trading at 107.84 and consolidates in the range between the 107.50 – 107.94.

At the USD front, the U.S. dollar continues to take bids mainly due to its safe-haven demand in the wake of intensified coronavirus fears. As per the latest report that the United States death toll rose above 40,000, whereas SkyNews mentions the U.K. has a bit over 16,000 people who died from the virus.

On the other hand, the reason behind the fresh risk-off market sentiment is the rise in the coronavirus (COVID-19) related death figures from the U.S. and the U.K. Whereas, the lack of clarity on the easing lockdown keeps the investors confused, as the new infections continue to rise globally.

Daily Support and Resistance    

  • S1 105.92
  • S2 106.84
  • S3 107.44

Pivot Point 107.76

  • R1 108.36
  • R2 108.69
  • R3 109.61

USD/JPY – Trading Tips

The technical side of the USD/JPY has not changed much as it’s price continues to hold above the triple bottom area of 107.039. The MACD and 50 periods of EMA are suggesting bearish bias. Therefore, a downward breakout of this level can extend selling until 105.300, while the resistance holds around 108.640. We should look for selling trades below 107 to target 106.630, and buying can be seen above the same 107.360 level today.  

All the best for today! 

Categories
Forex Videos

Is The Stochastic Oscillator The Key To Making Money In Forex Or Is It Loosing You Money?

-Stochastic Oscillator, Friend or Foe ?


Insert A, The stochastic oscillator is used in technical analysis and was invented by George Lane in the late 1950s. The indicator measures the opening price of a financially traded asset and compares it to the closing price over a predetermined period of time. Because the data uses historical calculations and plots them in the form of two moving averages, the k-line, and the D-line, this is considered to be a lagging momentum indicator. The actual mathematical complications for the tool are very complex, and we will not be going into them in this session. The basic and generally widely used settings for the stochastic oscillator will automatically be set by your broker at 5 3 3. More experienced Traders are able to adjust the settings to their preference. However, we will be leaving them at the standard settings, and that way, we will be very much going with the crowd as it were in this example.


Insert B, The stochastic oscillator is widely used by professional traders and will be offered on almost every trading platform. It can simply be dragged straight onto your trading chart and will sit at the bottom, as in our example.


Insert C: The basic principle is that the Kline which is calculated over a slightly longer time period than the D line and when both of these lines are above the 80% Overbought line, the currency pair is considered to be overbought, and when the K and D lines are below the 20 % oversold line, the pair is said to be oversold.


Insert D, traders look for the ‘k’ and D lines to have been above the 80% line in the overbought area and then dipped below the 80% line where the K-line has crossed over the d line, at which point they will go short on the currency pair.


Insert E, Conversely, traders look for the K and D lines to have been below the 20% oversold line, and where the K-line has crossed above the D-line, they use this as a signal to buy a currency pair.
One of the biggest areas that new Traders falling into a trap is that they take the stochastic signal has been gospel and trade it accordingly and then wonder why they are losing money.
And so, is the stochastic indicator a friend or foe? First, we have to remember that all indicators, and especially lagging indicators, are just that: indicators. They are an indication that the market, in this example, might be overbought and ready to turn lower, or that the market is oversold and it might be ready to move higher.
Let’s drill down a little bit more by going back to our 4-hour chart of the EURUSD pair. The longer the time frame, the more likely, the longer trend will become apparent, and that’s where the more pips will be realized, and of course, that translates into more money-making opportunities.


Insert F: By drawing a vertical line at position A, we can follow that down and see that the stochastic k and D lines have both moved above the 80% overbought area, and that’s the k-line has crossed below the d line, and both lines have moved below the 80% overbought line. This is represented by the price action which has been falling.


Insert G: Traders who sold the pair on this signal and stayed in the trade would have seen an overall pip movement in their favor of 390 pips, which is huge. The stochastic was a true friend at this point.


Insert H, However traders who abandoned the trade as soon as the stochastic became oversold, as per the example on your screen now at position B, because the K & D lines in the oversold area under the 20% line and where the k-line has crossed above the d line, they would have been extremely disappointed as the market continued to trend lower. While they would have made around 40 pips, they would have lost out on 350.
But one of the biggest problems we find with new traders is that they will buy a currency pair in a situation like this, where their trade goes immediately against them and falls
hitting them with losses of over 350 pics on this occasion because they have not supported their trade with a stop loss, due to poor risk management. In this example, the stochastic indicator would have been a foe.


Insert I, Let’s return to our chart at position C, we can see that the stochastic is oversold, and more importantly, it is staying or remaining very close to the oversold 20% line as the market trends for lower.
And so the lesson here is that if the market is overbought, it does not necessarily mean that it will automatically fall, and which is clear from how example today if a pear is oversold, it does not necessarily mean that they will turn around and move higher.
So remember indicators are simply an indication that something might happen and not that it definitely will happen. Incorporate good risk management and money protecting tools such as stop losses in your trading plan. Learn to use price action as the definitive trendsetter, while incorporating other technical indicators to more reliably established entry points for your trades. And what is most important, which I’m sure you’ve heard many times, is to let the trend be your friend and I never trade against it.

Categories
Forex Course

102. Brief Introduction To Momentum Indicators

Introduction

Leading and lagging indicators are not the only categorizations of technical indicators. If we dig deeper, we can find more classifications and momentum indicators are one such classification in leading indicators. Before getting into momentum indicators, let’s first define the term momentum. Momentum, in general (physics), is the product of mass and velocity. The meaning of momentum is not different in trading too.

What are the Momentum Indicators?

Momentum indicators are a type of indicator that determines the velocity or the rate at which the price changes in security. Unlike moving averages, they don’t depict the direction of the market, only the rate of price change in any timeframe.

Calculating Momentum

The formula for the momentum indicators compares the most recent close price with the close price of a user-specified time frame. These indicators are displayed as a separate line and not on the price line or bar. Calculating momentum is simple. There are two variations to it but are quite similar. In both, momentum is obtained by the comparison between the latest closing price and a closing price ‘n’ periods from the past. The ‘n’ value must be set by the user.

1) Momentum = Current close price – ‘n’ period close price

2) Momentum = (Current close price / ‘n’ period close price) x 100

The first formula simply takes the difference between the closing prices while the second version calculates the rate of change in price and is expressed as a percentage.

When the market is moving upside or downside, the momentum indicator determines how strongly the move is happening. A positive number in the first version determines strength in the market towards the upside, while a negative number signifies bearish strength.

How are Momentum Indicators useful?

As mentioned, momentum indicators show/predict the strength of the movement in prices, regardless of the direction, be it up or down. Reversals are trades where one can make a massive killing with it. And momentum indicators help traders find spots where there is a possibility of the market to reverse. This is determined using a concept called divergence, which is discussed in the subsequent section.

Momentum indicators are specifically designed to show the relative strength of the buyers and sellers. If these indicators are combined with indicators that determine the direction of the market, it could turn out to be a complete strategy.

Concept of Divergence

Consider the chart of EUR/USD given below. The MACD indicator (momentum indicator) is plotted as well. From the price chart, the market was in a downtrend, but the divergence was moving upward. It means that the indicator has diverged from the price chart and is indicating that the sellers are losing strength.

In hindsight, the market reversed its direction and started to move upwards. Hence, the MACD predicted the reversal in the market. Moving forward, when the market laid its first higher low, the MACD too was inclined upwards, indicating that the buyers are strong, and the uptrend is real. And yet again, the MACD proved itself right.

This concludes the lesson on momentum indicators. In the coming lessons, let’s get more insights over this topic. Don’t forget to take the below quiz before you go.

[wp_quiz id=”70612″]
Categories
Forex Market Analysis

Daily F.X. Analysis, April 17 – Top Trade Setups In Forex – Risk-on Sentiment In Play! 

On the forex front, the U.S. dollar strengthened against its major peers for a second straight session, with the ICE Dollar Index gaining 0.3% on the day to 99.93. Today, eyes will remain on the European Commission as it will post final readings of March CPI (+1.0% on-year expected). In the U.S., the Conference Board will release its Leading Index for March (-7.1% on month expected).

Economic Events to Watch Today     


EUR/USD – Daily Analysis

The EUR/USD fell 0.4% to a week-low of 1.0862. Official data reported that the Euro zone’s industrial production slipped 0.1% on month in February as expected). The European Commission will post final readings of March CPI (+1.0% on-year expected).

The official data which is scheduled to release at 09:00 GMT is expected to show that Eurozone’s industrial production decreased by 0.2% month-on-month in February. 

European stocks stabilized after a 3% loss in the prior session, with the Stoxx Europe 600 Index rising 0.6%. Germany’s DAX increased by 0.2%, the U.K.’s FTSE 100 climbed 0.6% while France’s CAC was little changed.

Markets are now concerned about extended lockdowns indicating a deeper economic recession than previously forecasted. Moving on, the market sentiment is expected to stay pro-risk during the day ahead. 

As in result, the EUR/USD currency pair could continue to gain altitude. At the data front, the Eurozone Consumer Price Index (CPI) is scheduled for release, while the U.S. data calendar is thin with just Baker Hughes US Oil Rig Count number expected to release at 17:00 GMT. 

Daily Support and Resistance  

  • S1 1.0684
  • S2 1.0772
  • S3 1.0815

Pivot Point 1.086

  • R1 1.0904
  • R2 1.0949
  • R3 1.1037

EUR/USD– Trading Tips

The EUR/USD is trading bearish at 1.0835, exhibiting a bearish crossover below 50 EMA, which is now extending resistance around 1.0903 level. Continuation of a selling trend below 1.0903 level can extend selling until the next support area of 1.0772. 

On Friday, the EUR/USD is likely to find support around 1.0772, but below this, the next support prevails around 1.0652 level. At this moment, the EUR/USD is holding at 1.0835, having an immediate resistance level of around 1.09230, where the bullish breakout of this level can extend buying until the next resistance level of 1.1036. Conversely, we should look for selling trades below 1.0870.

GBP/USD– Daily Analysis

GBP/USD dropped 0.8% to 1.2523 and consolidated in the range between the 1.2604 – 1.2450. However, the currency pair traders did not give any major attention to the coronavirus (COVID-19) crisis at home because the cases are comparatively more significant in the U.S. 

At the U.K. Crisis front, the United Kingdoms’ coronavirus death toll rose above 11,000. Still, the buyers are ignoring this probably because the death toll is comparatively larger in the U.S. almost 20,000 deaths have been registered so far. The GBP/USD is exhibiting selling bias in the wake of a stronger dollar. 

The U.S. official data showed that Initial Jobless Claims declined to 5.245 million for the week ended April 11 (5.500 million expected), and Housing Starts fell to an annualized rate of 1.216 million units in March (1.300 million units expected). Later today, the Conference Board U.S. Leading Index will be reported (-7.2% on month in March expected).

Later today, eyes will be on the U.S., the Conference Board will release its Leading Index for March (-7.1% on month expected) to determine further bias in the pair.

Daily Support and Resistance

  • S1 1.2181
  • S2 1.2353
  • S3 1.244

Pivot Point 1.2525

  • R1 1.2612
  • R2 1.2697
  • R3 1.2869

GBP/USD– Trading Tip

On Friday, GBP/USD is trading with a neutral bias over 1.2450 support areas to trade around 1.2486. The GBP/USD pair is likely to find support around 1.2450, which is extended by the triple top level, which got violated on the previous Friday.

On the 4-hour chart, the GBP/USD has formed a small bullish channel, which is likely to extend bullish bias for the pair. The 50 periods EMA is also keeping the GBP/USD pair supported around 1.2450. Thus, the bounce off above this level can lead the GBP/USD pair towards the next resistance level of 1.2657. While bearish breakout of 1.2460 can open up further room for selling until the next support area of 1.2220. 

USD/JPY – Daily Analysis

The USD/JPY pair is flashing red and struggling towards above 108.00 level, mainly due to the broad-based U.S. dollar weakness in the wake of risk-on market sentiment. In the meantime, the weaker safe-haven Japanese yen keeps the pair supportive and turned out to be one of the key data that placed a lid on any additional losses in the currency pair, at least for now. 

Currently, the USD/JPY pair is trading at 107.81 and consolidates in the range between the 107.64 – 108.08. At the USD front, the U.S. dollar continues to lose its buying momentum across the board, as the U.S. stocks futures and the Asian equities are flashing green mainly after the renewed hopes for coronavirus treatment. 

The greenback that tracks the greenback against a basket of other currencies dropped 0.25% to 99.862. It should be noted that the investors failed to prefer the greenback, which is traditionally viewed as a safe-haven, mainly because of the United States President Donald Trump’s step to reopening the economy, which could continue to add bullish pressure around the equities during the day ahead. 

Daily Support and Resistance    

  • S1 105.92
  • S2 106.84
  • S3 107.44

Pivot Point 107.76

  • R1 108.36
  • R2 108.69
  • R3 109.61

USD/JPY – Trading Tips

The technical side of the USD/JPY has not changed much as it’s price continues to hold above the triple bottom area of 107.039. The MACD and 50 periods of EMA are suggesting bearish bias. Therefore, a downward breakout of this level can extend selling until 105.300, while the resistance holds around 108.640. We should look for selling trades below 107 to target 106.630, and buying can be seen above the same 107.360 level today.  

All the best for today! 

Categories
Crypto Market Analysis

Daily Crypto Review, Apr 17 – Bitcoin above $7,000; The US expanding on the idea of the Digital Dollar

The cryptocurrency market spent the past 24 hours reaching new highs. Bitcoin is currently trading for $7,094, which represents an increase of 6.98% on the day. Meanwhile, Ethereum gained 12.66% on the day, while XRP gained 6.71%.

DigiByte took the position of today’s most prominent daily gainer, with gains of 56.51%. Swipe lost 2.38% on the day, making it the most prominent daily loser.

Bitcoin’s dominance stayed at pretty much the same place when compared to yesterday’s value. Its value is now 64.33%, which represents a 0.09% difference to the upside.

The cryptocurrency market capitalization increased in the past 24 hours. Its current value is $203.36 billion. This value represents an increase of $6.36 billion when compared to the value it had yesterday.

What happened in the past 24 hours

Chicago Mercantile Exchange (CME) has seen a great increase in Bitcoin futures. The increase is as high as 70% from the March lows. This spike is indicating a comeback of institutions to the market.

The number of futures contracts outstanding on CME on Wednesday was $181 million, a 70% increase from $106 million contracts that were recorded on Mar 22.

Honorable mention

Digital Dollar

Congresswomen Rashida Tlaib and Pramila Jayapal introduced a new proposal regarding the federal government issuing $2,000 per month to the US residents. The US would do this by minting a pair of $1 trillion coins, which would be used to back the payments.

Under the ABC Act, the US Congress would authorize the Federal Reserve for the creation of “FedAccounts,” which are nothing else than digital wallets.

_______________________________________________________________________

Technical analysis

_______________________________________________________________________

Bitcoin

After a red day of bears retesting the $6,640 lows, Bitcoin surged above $7,000 and seemingly stabilized there. The largest cryptocurrency by market cap went as low as $6,460 before suddenly spiking and reaching $7,220. BTC is now trading at slightly above $7,000, right above the $7,085 support level. This level was quickly retested and confirmed.


Bitcoin’s volume (surprisingly) did not increase much during the price spike. Its RSI level, however, did. Its current value is 61.

Key levels to the upside                    Key levels to the downside

1: $7,420                                           1: $7,085

2: $7,750                                           2: $6,850

3: $8,000                                            3: $6,640


Ethereum

Ethereum was the best performing crypto asset out of the top3 cryptocurrencies by market cap. Its gains happened during the same time as Bitcoin’s did. After testing the $147.5 lows, the price spiked and reached $175.5, where it stopped. It seems that a new resistance level might be exactly at that level, as this level stopped ETH from going up several times now.


Unlike Bitcoin, Ethereum’s volume increased severalfold during the spike, while its RSI reached a value of 67.5.

Key levels to the upside                    Key levels to the downside

1: $175.5                                             1: $168

2: $178.6                                            2: $158 

3: $185                                                3: $147.5


Ripple

XRP was the most stable crypto asset out of the top3, but also the one with the least gains. The third-largest cryptocurrency by market cap was heading down towards testing the descending trend line, but quickly bounced back and reached above $0.19 as well as the top line of the descending trend. This is a huge move for XRP, even though the gains have been overshadowed by the aforementioned Bitcoin and Ethereum.


XRP’s volume was descending during the price surge, while its RSI reached the value of 58.

Key levels to the upside                    Key levels to the downside

1: $0.2                                                1: $0.19

2: $0.205                                            2: $0.165

3: $0.221                                             3: $0.147

Categories
Crypto Videos

Make Huge Crypto Profits With The Heiken Ashi Strategy! Part 2

Heikin Ashi Technique – Crypto trading (part 2/2)

We will take a look at a Heikin Ashi cryptocurrency high-low breakout trading strategy. We will need to go through several steps in order to fully execute the strategy.
Identifying three consecutive bullish candles without any lower wicks.

After switching to the Heikin Ashi candlestick chart on your preferred trading platform, you will need to identify three consecutive bullish candles. It is mandatory that all three candlesticks have no lower wicks.
This is because bullish candlesticks with no wicks indicate a strong trend to the upside and a further increase in price. Once that is done, we need to check the location of the candles.


There have to be less than five consecutive bearish candles before the three consecutive bullish candles.

Trading Heikin Ashi candlesticks are very trend-oriented, so each of the little bits of info the chart gives, we have to take.
We need the location of the pattern, meaning that we can’t count more than five consecutive bearish candles prior to the three bullish candles spotted in the first step.
Now that we established the trend direction as well as the position of the pattern, we can look for buy opportunities.

Making an entry position at the 4th candle opening

To initiate a position, make an entry at the 4th candle opening, right after the three consecutive bullish candles have finished forming.
Get ready to pull the trigger near the finish of the 3rd candle, so you can be ready for the 4th candle opening.

Placing your Stop-Loss below the most recent swing low 

As with every trade you will take, there is a chance of it going the opposite direction to what you predicted. That’s why setting stop-losses is extremely important. The strategy behind setting stop-loss with Heikin-Ashi is quite simple.
The protective stop-loss should be placed just below the most recent swing low, or ultimately below the three bullish candlestick pattern. However, placing it below the three bullish candlestick patter might be risky as you can be taken out of the trade prematurely.

Taking Profit 

Depending on how strong the trend is, you would want your take profit to be two or three times more than you stop-loss. By doing so, you are trying to maximize your reward to risk ration.

Conclusion

Using the Heikin Ashi candles to determine the trend direction and set up trades can be extremely lucrative. It is important to make sure the position of the pattern is correct before entering trades, so that should not be compromised. This guide has hopefully taught you a trading strategy you can add to your toolset and possibly use.

Categories
Forex Market Analysis

Daily F.X. Analysis, April 16 – Top Trade Setups In Forex – U.S. Jobless Claims Under Spotlight! 

On the forex front, the U.S. Dollar Index recouped losses seen in the prior session, rising 0.7% on the day the to 99.57. Later today, the European Commission will report February industrial production (-0.1% on month expected). The German Federal Statistical Office will report final readings of March CPI (+1.4% on-year expected). 

Economic Events to Watch Today     


EUR/USD – Daily Analysis

The EUR/USD dipped 0.7% to 1.0905. Later today, the Euro zone’s industrial production for February will be reported (-0.1% on month expected).

Lately, the European stocks were broadly lower, with the Stoxx Europe 600 Index sinking 3.3%. Germany’s DAX shed 3.9%, France’s CAC dropped 3.8%, and the U.K.’s FTSE 100 was down 3.3%. A sell-off in the stock market seems to weight on the EUR/USD currency pair. 

The official data which is scheduled to release at 09:00 GMT is expected to show that Eurozone’s industrial production decreased by 0.2% month-on-month in February. Markets are now concerned about extended lockdowns indicating a deeper economic recession than previously forecasted. The U.S. Labor Department will release initial jobless claims in the week ended April 11 (5.5 million expected). 

The Commerce Department will report March housing starts (1.3 million units expected) and building permits (1.3 million units expected). The Philadelphia Federal Reserve will post its Business Outlook Index for April (-32.0 expected).

Daily Support and Resistance

  • S1 1.067
  • S2 1.0792
  • S3 1.0851

Pivot Point 1.0915

  • R1 1.0973
  • R2 1.1037
  • R3 1.116

EUR/USD– Trading Tips

The EUR/USD is trading bearish at 1.0885, exhibiting a bearish crossover below 50 EMA, which is now extending resistance around 1.0923 level. Continuation of a selling trend below 1.09230 level can extend selling until the next support area of 1.0772. The EUR/USD is likely to find support around 1.0850, but below this, the next support prevails around 1.0772 level.

At this moment, the EUR/USD is holding at 1.08820, having an immediate resistance level of around 1.09230, where the bullish breakout of this level can extend buying until the next resistance level of 1.1036. Conversely, we should look for selling trades below 1.09230 today.


GBP/USD– Daily Analysis

GBP/USD dropped 0.8% to 1.2523 and consolidated in the range between the 1.2604 – 1.2450. However, the currency pair traders did not give any major attention to the coronavirus (COVID-19) crisis at home because the cases are comparatively more significant in the U.S. 

At the U.K. Crisis front, the United Kingdoms’ coronavirus death toll rose above 11,000, but the buyers are ignoring this probably because the death toll is comparatively larger in the U.S. almost 20,000 deaths have been registered so far.

The Brexit talks, which will be video conferencing between the European Union and the United Kingdom, are expected to happen and will likely entertain the cable traders as both sides have been stuck on the deadlines while the U.K. recently gave warning the bloc to change tactics or face serious ‘problems.

The market’s risk-tone remains heavy with shares in Asia and the U.S. stocks registering losses on the day. At the USD front, the greenback continues to gain support as a safe-haven asset. Although, the deadly virus recession fears are forcing investors to save cash, preferably in the form of the greenback. 

Looking forward, the U.S. Jobless Claims, housing market data, and Philadelphia Fed Manufacturing Survey, as well as the BOE’s first quarter (Q1) Credit Conditions Survey, will be key to watch. Moreover, the traders are keenly awaited for the speech by the BOE policymaker Silvana Tenreyro for taking fresh clues.

Daily Support and Resistance

  • S1 1.2181
  • S2 1.2353
  • S3 1.244

Pivot Point 1.2525

  • R1 1.2612
  • R2 1.2697
  • R3 1.2869

GBP/USD– Trading Tip

The GBP/USD is trading with a bearish bias over 1.2450 support areas to trade around 1.2486. The GBP/USD pair is likely to find support around 1.2450, which is extended by the triple top level, which got violated on April 10. On the 4-hour chart, the GBP/USD has formed a small bullish channel, which is likely to extend bullish bias for the pair. 

The 50 periods EMA is also keeping the GBP/USD pair supported around 1.2450. Thus, the bounce off above this level can lead the GBP/USD pair towards the next resistance level of 1.2657. While bearish breakout of 1.2460 can open up further room for selling until the next support area of 1.2220. 


USD/JPY – Daily Analysis

Today in the early Asian session, the USD/JPY currency pair failed to maintain its early uptick above 108.00 level and has now reversed almost 30 pips from the daily high. Although, the currency pair continues to taking bids as the U.S. dollar is getting strong and catch a safe-haven bid mainly due to on-going fears of global recession from the coronavirus outbreak. Currently, the USD/JPY pair is trading at 107.78 and consolidates in the range between the 107.36 – 108.08. 

At the greenback front, the U.S. dollar continues to gain support from its safe-haven status as continuing worries over the economic fallout from the coronavirus pandemic is keeping the global financial markets on their knees. The continued strong movement of the U.S. dollar lifted the pair to fresh high over the 108.00 level from the sub-107.00 level, while the bullish trend remains intact for the second consecutive session on Thursday.

At the coronavirus front, the U.K.’s death losses have recently decreased by 761 against 778 the previous day. On the other hand, the highest single-day rise by 2,371 to 30,817 in the death toll in the United States keeps the risk-off sentiment in the market.

Daily Support and Resistance    

  • S1 105.75
  • S2 106.52
  • S3 106.84

Pivot Point 107.3

  • R1 107.62
  • R2 108.08
  • R3 108.85

USD/JPY – Trading Tips

The USD/JPY is trading with a bullish bias, and it is pretty much likely to find support around the triple bottom area of 107.039. A downward breakout of this level can extend selling until 105.300, while the resistance holds around 108.640. The MACD and 50 periods of EMA are suggesting bearish bias, while the fundamentals side is also in favor of selling. Since we the U.S. Jobless Claims, which are due during the U.S. session, traders will focus on the news to drive the next movement in the market. Hence, we should look for selling trades below 107 to target 106.630, and buying can be seen above the same 107.360 level today.  

All the best for today! 

Categories
Crypto Market Analysis

Daily Crypto Review, Apr 16 – China launched Digital Yuan; Cryptos pushing up after retesting lows

The cryptocurrency market spent the past 24 hours mostly consolidating and staying at the same price levels. Bitcoin is currently trading for $6,924, which represents an increase of 0.51% on the day. Meanwhile, Ethereum gained 3.32% on the day, while XRP lost 0.81%.

ABBC Coin took the position of today’s most prominent daily gainer, with gains of 22.93%. Insolar lost 8.47% on the day, making it the most prominent daily loser.

Bitcoin’s dominance decreased when compared to yesterday’s value. Its value is now 63.69%, which represents a 0.55% difference to the downside.

The cryptocurrency market capitalization stayed almost at exactly the same place for the past 24 hours. Its current value is $197.50 billion. This value represents an increase of $0.5 billion when compared to the value it had yesterday.

What happened in the past 24 hours

International agriculture magnates, Agrocorp and Cargill, traded $12 million worth of wheat. The cargo was traveling from North America to Indonesia. The interesting part is that the trade was settled via the blockchain.

The transaction was made possible by the Singapore-based blockchain platform called dltledgers, which is based on Hyperledger Fabric.

Honorable mention

Digital Yuan

Screenshots of the pilot version wallet app of the Chinese digital yuan are currently circling all over on social media.

Ling Zhang, Binance’s executive director of M&A and Global Fiat, shared the images first. The images were then retweeted by Changpeng Zhao, the exchange’s CEO. According to what Zhang said, the app is already available for download in four Chinese cities selected for the trial. Those cities are Shenzhen, Chengdu, Suzhou, and Xiongan.

______________________________________________________________

Technical analysis

_______________________________________________________________________

Bitcoin

Bitcoin bears have dominated in the past 24 hours, dropping the price below $6,850 and retesting the $6,640 lows. The price even fell all the way down to $6,470 at one point, but quickly recovered. The support level of $6,640 held up well and Bitcoin stayed above it. On top of that, it gathered the strength to push back up and retake the $6,850 level.


Bitcoin’s volume is on the same level as yesterday, while its RSI level is at 52.5.

Key levels to the upside Key levels to the downside

1: $7,085 1: $6,850

2: $7,420 2: $6,640

3: $7,750 3: $5,960


Ethereum

Ethereum mirrored Bitcoin’s movements, even though it performed slightly better than Bitcoin. The ETH bears took its price below the $158 support level and then all the way down to the $147.5 level. This support, however, held up well, and Ethereum stabilized and gathered the strength to push back up. The second-largest cryptocurrency pushed above $158 and even reached $168, but failed to pass this resistance level due to the lack of bull pressure.


Ethereum’s volume increased greatly over the past 24 hours, while its RSI level is just above 60.

Key levels to the upside Key levels to the downside

1: $168 1: $158

2: $178.6 2: $147.5

3: $185 3: $139


Ripple

XRP is in a pretty rough spot in the short term at the moment. It is constantly creating lower lows and lower highs. Once again, the third-largest cryptocurrency bumped into $0.19 without being able to cross it. This happened right after the bears gave up on taking the price down as they couldn’t pass the $0.174 level.


XRP’s volume almost doubled in the past 8 hours, while its RSI level is at 52.5.

Key levels to the upside Key levels to the downside

1: $0.19 1: $0.165

2: $0.2 2: $0.147

3: $0.205 3: $0.1

Categories
Forex Course

101. What Are Oscillators & How To Interpret Them?

Introduction

Technical Indicators are primarily used to confirm a price movement and the quality of a candlestick pattern, and also to create trading signals with them. Indicators are a great source of strength to confirm an existing analysis. Moreover, some indicators solely help in analyzing the trend, momentum, and volatility of the market.

As discussed previously discussed, there are two types of indicators, leading and lagging. And oscillators fall under the leading indicators. That is, they determine the trend of the market before-hand.

Indicator construction

There are two ways through which indicators are designed:

  1. Non-bounded
  2. Oscillators

Non-bounded, as the name suggests, they are the indicators that are not bound in a specific range. They usually display the strength and weaknesses, and to an extent, generates buy and sell signals.

Oscillators, on the other hand, are indicators that are bound within a range. For example, 0-100 is the range they oscillate between. However, based on the type of oscillator, the range varies.

Oscillators

Oscillators are technical indicators that are mainly used to determine the oversold and overbought conditions. These non-trending indicators are used when the market is not showing any certain trend in either direction. They are unlike the moving averages (MA), which determine the trend and overall direction of the market.

When security is under an overbought or oversold situation, the oscillators show its real value. It indicates that one of the parties is losing its strength, and the other is slowly starting to gain together.

Interpreting Oscillators

Oscillators are constructed with lower and upper bounds. And these bounds form a range. In the below oscillator, the purple region represents range-bound, where 30 is the lower bound, and 70 is the upper bound. The upper and lower bounds are also referred to as peaks and troughs. Typically, the peaks and troughs in the oscillator correspond to the peaks and troughs in the market as well.

Extreme Regions

The oversold and overbought regions are the extreme regions. That is, when the oscillator line shoots above the upper bound, the market is considered to be overbought. On the contrary, if the oscillator falls beneath the lower bound, the market is said to be overbought.

An overbought market means that the buying volume has diminished over a few trading days. So, there could be a possibility for investors to sell their positions. However, note that this interpretation holds true when the market was in a predominant uptrend and is currently consolidating.

An oversold market indicates that the selling volume, which was high in the past days, has now diminished. This could mean that the sellers are done selling with the security and might begin closing their positions. Hence, indicating a turn-around in the market.

Midpoint Line

A crossover at midpoint region of the range depicts the gain in strength of the buyer or sellers. From the oscillator given, 50 is the midpoint line. So, if the oscillators cross above the 50 mark, it indicates bullishness in the market. And if cuts below 50, it could indicate bearishness in the market.

This concludes the lesson oscillators. In the coming lessons, we shall discuss some strategies using a few oscillators. Stay tuned. Happy trading!

[wp_quiz id=”70529″]
Categories
Forex Basic Strategies

Pairing The ‘Gravestone Doji’ Pattern With Significant Resistance Levels

Introduction

Gravestone Doji is a bearish reversal candlestick pattern that occurs at the top of an uptrend. This pattern helps the traders to visually see where the significant resistance level is located on the price chart. The most important aspect of the Gravestone Doji pattern is its long upper shadow. The candlestick’s open, close, and low are all the same in this pattern.

The psychology behind the long upper shadow is this – In an ongoing uptrend, when the price action hits the significant resistance line, buyers exit their positions, and the price action is smacked down by the sellers. In short, the appearance of this pattern represents the losing momentum of the buyers and essentially indicates a bearish reversal in the market.

Most of the traders place their trades as soon as this pattern appears on the price chart. But that’s definitely not the right approach. Instead, we must wait for the next candle to close for the confirmation and only then take the trades. The opposite of the Gravestone Doji is the Dragonfly Doji, which appears at the bottom of a downtrend or the major support area. The below image represents the Gravestone Doji Pattern.

Trading Strategies – Gravestone Doji Pattern   

The Gravestone Doji pattern indicates that the buying trend is ending, and the market is reversing to the selling side. However, this doesn’t hold true all the time. We will be finding this pattern quite often in all the types of market conditions, and if we start trading every time we find them, we will end up on the losing side. We always need to ask our self the reason why this pattern appears in certain conditions. Is it going to reverse the market or not?

Pairing the pattern with a significant resistance level

If you find this pattern at the bottom of the range, do not trade it. But if the price action prints this pattern at the top of a range, it can be considered a sign for us to go short. Similarly, find the trending markets and look for a major resistance level where the price could possibly react. So when the price action prints a Gravestone Doji at the major resistance level, it’s a strong sign for us to go short.

In the below USD/CHF Forex chart, we can see that the price action has printed the Gravestone Doji pattern at the significant resistance level. We should be going short as soon as the Doji candle closes.

In the below image, we can see that we took a sell entry when the market printed the Gravestone Doji pattern. We have placed the stop-loss just above the resistance level. It is safer to put the stop-loss above the pattern or at the resistance line because if the price goes above the pattern, the pattern gets invalidated. We know that the Gravestone pattern indicates a market reversal, and most of the time, these reversals travel quite far. That is the reason why we go for deeper Take Profits.

In the above chart, we can see that we had exited our full positions when strong buyers showed up. This indicates that the sellers are losing their momentum, and there is no logic to continue holding our positions.

Gravestone Doji + Stochastic Oscillator

The strategy that we shared above is for aggressive traders who like to take risks. However, if you are A type of trader who needs more confirmation to pull the trigger, we suggest you follow this strategy to trade this pattern. Most of the conservative traders do have a fear in their minds that one single candle does not have the potential to reverse the market. And it is completely okay to think like that. The truth is that sometimes even a single candle can move the market, and sometimes it doesn’t. Ultimately it is your money management system that makes all the difference.

But to filter out some poor signals and to get an additional confirmation, it is advisable to use the Stochastic oscillator to confirm the probability of our trading signal. Stochastic is a range-bound indicator that oscillates between the 0 & 100 levels. When the Stochastic goes above the 70 level, it means that the market is in an overbought condition, and we can expect a change in the trend. Likewise, when it goes below the 30 levels, it means that the market is oversold are we can expect a reversal anytime soon.

The Stochastic indicator also shows the bearish and bullish divergence, which helps the traders in trading the upcoming reversals. The divergence is when the market moves in one direction, but the indicator is signaling a different direction. Now we believe that you understand the basics of trading with the Stochastic indicator. Now let’s dive into the strategy.

The strategy here we are using is simple and straight forward. First of all, identify the Gravestone Doji pattern at a significant resistance level in an uptrend. Then, apply the Stochastic indicator to the price chart and check if the indicator is at the overbought area, indicating a downside reversal. If yes, go short and place the Stop-Loss just above the pattern.

The GBP/CAD chart below indicates the appearance of the Gravestone Doji pattern in an uptrend. When the price is approaching the upper resistance level, it got smacked down immediately, and the market ended up printing the pattern. The next six candles tried very hard to break the pattern & resistance line, but nothing worked, and the price ended up rolling down. We can also observe the Stochastic indicator was at the overbought area, which is a confirmation sign for us to go short.

We have entered for a sell when both the conditions are met, and placed the Stop-Loss just above the pattern. For the Take-Profit, we choose to go for deeper targets. When the selling trend started to struggle, the Stochastic indicator was at the oversold selling conditions. At that point, we have closed our full positions for obvious reasons.

Conclusion

The trades taken based on the Gravestone Doji pattern are pretty reliable. But do not make the mistake of identifying the pattern everywhere on the price chart. The psychology behind this pattern says that the bulls drove the price to a peak point, and the sellers are comfortable in reversing the market. For booking profits, you can expect an equal move to that of a previous trend. If you are an intraday trader, make sure to exit your positions at any significant level. Although this pattern appears on all the timeframes, the reliability is higher on higher timeframes to that of lower timeframes.

We hope you find this article informative. Try trading this pattern on a demo account and master it before applying the above-mentioned strategies on the live market. Cheers.

Categories
Forex Videos

Mastery Of Forex Candlesticks In 5 Minutes


Become An Expert On Candlesticks In 3 Minutes

This video is the beginner’s guide to candlesticks,
where we will teach you what a candlestick is, and identify its basic properties.

Insert B:

Candlesticks are one of the more preferred methods of showing the price of a currency pair in technical analysis.

Insert C Bar charts

Insert D

line charts are also used by traders but are somewhat more simplified versions of expressing price action as a visual representation on a screen.

See Insert B! Each candlestick tells a story of where price has been and where it is likely to go during the particular time frame that it is viewed upon. It is, therefore, essential that new Forex
traders learn how to read them because they are applicable in every currency pair that you may wish to trade.

The shape and size of a candlestick, and the color, will help you to determine if a trend in either direction is in play, or if a trend has stalled and is about to reverse, or the amount of volume being traded, which will tell you you the interest from participants at any given time, and this, of course, will help you chose your entry into a trade and of course your exit, either with a profit or as defined by a stop loss.


Insert E, Candlesticks can be the color of your preferred choice. In this example, we are using a blue candlestick to denote price ascending and a red candlestick to denote price falling. There are three parts that make up a candlestick.

Insert F, the open price.

Insert G, the closing price.

Insert H and the wicks, which are also known as shadows, and which will appear on the majority of candlesticks.


Insert I

candlesticks will turn blue if the price of a currency pair moves above the exchange rate price when the candlestick first opened.

Insert J

and the candlestick will turn red if the exchange rate moves lower after the candlestick form opens.

Insert K

A blue candlestick is also known as a bullish candlestick, and a red one is known as a bearish candlestick. As mentioned previously, your broker may give you the option to change the candlestick’s colors, and this isn’t important, as long as you know which color represents the bullish or bearish direction.
Re-insert B, No matter which time frame you chose to trade on, be it a 5 minute, 15-minute, 1-hour, or daily, the candlestick will remain open for the duration of that specific time period.

Insert L

the candlestick will provide you with information on the first price traded on opening and then price direction during the particular time frame for which it is currently open. In this example, we have chosen the 5 minute time frame. And so, each candlestick will remain open for 5 minutes each. When closed it can also provide a host of information regarding the historical price action, including the last price traded for that candle, and which then can be used in conjunction with previous candlesticks to determine price direction and specifically trend formations, the end of a trend and possible reversals in price action. This is the key information that traders require to successfully utilize candlesticks in their technical analysis.

Insert M

In the context of a real chart, we have two examples, one of a bullish or blue candlestick where we can see where the price opened during the five-minute period and where it eventually closed. And also the second bearish red candlestick, showing where that opened and eventually closed.

Insert N

Initially, the price of a candlestick may change colors several times during the time frame, but the key information is left after the time frame has ended. However, the wicks or shadows, tells the trader that at some time during the time frame price may have gone above all below the initial open. Therefore, the wicks tell the trader the complete range of price action during any given time frame.

Insert O

As a general rule of thumb, a new candlestick will open at the exchange rate, where the previous candlestick closed. Gaps can appear in volatile sessions and also sometimes when there has been a break in trading, such as after the weekend break.

The beauty about candlesticks is that forex market professionals all rely on certain formations which are well recognized and offer reliable entry points into the forex market because of the high probability that certain shapes or groups of patterns of candlesticks, which repeat themselves time after time and tells traders about the state of a particular currency pair and how it is performing and whether or not there will be a reversal in price action or if a trend is forming.

So how do we use candlesticks to trade Forex? Well, we are always looking for high probability setups because it is this which differentiates traders from gamblers, and if we know that certain candlestick formations offer a high probability of future directional bias, it will be in our favor to incorporate them into our training methodology.

Insert Q

Here are just a few candlesticks that traders look out for, the spinning top, the Doji, the Hanging Man, the hammer, and the shooting star. All of these are firm favorites and offer reliable information to traders about future potential price direction.


Reading candlesticks is like reading a story, and they should always be read from left to right on your chart in order to tell you where price has been, and whether it is faltering in any particular direction. It can tell you if the market is flat or if the market is extremely volatile, and it can predict with a high degree of accuracy future price direction. Understand your candlesticks and use them like a detective, by analyzing them in great detail and using them to tell you what is happening currently with regard to price action and where to enter and exit your trades.

Categories
Forex Market Analysis

Daily F.X. Analysis, April 15 – Top Trade Setups In Forex – Brace for Retail Sales & BOC Policy!  

On the forex front, the U.S. Dollar Index was seldom changed at 99.5 amid thin holiday trading. The economic calendar is muted a bit. The only focus today will be on the U.S. Labor Department, which will release March’s import price index (-3.2% on month expected). 

Later in the day, the U.S. Commerce Department will post March retail sales (-8.0% on month expected) and February business inventories (-0.4% on month expected). The New York Federal Reserve will publish April Empire Manufacturing Index (-35.0 expected). The Federal Reserve will release March industrial production (-4.0% on month expected), capacity utilization (74.0% expected), and its latest Beige Book.

Economic Events to Watch Today     


EUR/USD – Daily Analysis

The EUR/USD climbed 0.7% to 1.0987, French Finance Minister Bruno Le Maire said his government sees 2020 GDP contracting 8%, compared with a decline of 6% previously estimated.

The fresh uptick in the oil prices and above-forecast China trade data also helping restore the risk-sentiment. At the moment, the EUR/USD is trading at 1.0941 and consolidates in the range between the 1.0893 – 1.0967. At the coronavirus front, Australia has shown very sharp declines in the virus cases as compared to other countries and also registered declines in the death toll as per the latest report. 

On the other hand, the macro-environment also supported the EUR/USD, and so do technical charts, especially Tuesday’s marubozu candle, which is indicative of strong bullish sentiment. 

Looking forward, Spain and Italy are ready to release the report of inflation numbers for the month of March and will be essential to watch. Apart from this, the traders will also keep their eyes on U.S. Retail Sales and Industrial Production numbers for March. 


Daily Support and Resistance

  • S1 1.0811
  • S2 1.0887
  • S3 1.0936

Pivot Point 1.0964

  • R1 1.1012
  • R2 1.104
  • R3 1.1116

EUR/USD– Trading Tips

The EUR/USD prices fell after testing 1.09885 resistance level, and the pair now seems to reverse back to the long-held trading range of 1.0922 – 1.0765. The EUR/USD is likely to find support around 1.0922 level. At this moment, the EUR/USD is holding at 1.09320, having an immediate support level of around 1.09060, where the bearish breakout of this level can extend selling until the next support level of 1.0846 and 1.07990. Conversely, the resistance stays at 1.0970 and 1.1035. The MACD is tossing above and below 0, converting the bearish sentiment into bullish and vice versa. Let’s consider staying bullish over 1.0960 today. 

GBP/USD– Daily Analysis

The GBP/USD rose 0.9% to 1.2629. The GBP/USD is currently trading at 1.2508 and consolidates in the range between the 1.2604 – 1.2494. However, the currency pair traders did not give any major attention to the coronavirus (COVID-19) crisis at home because the cases are comparatively more significant in the U.S.

At the U.K. Crisis front, the United Kingdoms’ coronavirus death toll rose above 11,000, but the buyers are ignoring this probably because the death toll is comparatively larger in the U.S. almost 20,000 deaths have been registered so far.

The Brexit talks, which will be video conferencing between the European Union and the United Kingdom, are expected to happen and will likely entertain the cable traders as both sides have been stuck on the deadlines while the U.K. recently gave warning the bloc to change tactics or face serious ‘problems.

On the flip side, the headlines related to the expected British lockdown extension will likely keep the traders busy during the day ahead. Looking forward, the U.S. data, including the Retail Sales, activity numbers, and the Fed’s Beige Book, will be key to watch. The virus updates could keep the driver’s seat.


Daily Support and Resistance

  • S1 1.2352
  • S2 1.2475
  • S3 1.255

Pivot Point 1.2599

  • R1 1.2674
  • R2 1.2723
  • R3 1.2846

GBP/USD– Trading Tip

The GBP/USD is trading with a bearish bias over 1.2500 support areas to trade around 1.2516. The cable is likely to find support around 1.2490, which is extended by the triple top level, which got violated on Monday. As we can see on the 4-hour chart, the GBP/USD sideways channel has already been violated, and now it’s likely to keep the pair bullish outside this range of 1.2479 – 1.2185. 

Ahead of the U.S. retail sales, the U.S. dollar is gaining bullish momentum, driving the bearish trend in the GBP/USD pair. However, the overall bias remains bullish as the prices are holding above 50 periods EMA. Conversely, the MACD is crossing into the bearish zone, opposing the EMA signal. So let’s consider taking buying trades over 1.2472 with a target of 1.2560. 

USD/JPY – Daily Analysis

During Wednesday’s European session, the USD/JPY currency pair has succeded to recover almost 50 pips from the previous session lows and rose to a fresh session high near the 107.35 level in the last hour mainly due to the fresh upticks in the U.S. dollar. The USD/JPY is currently trading at 107.36 and consolidates in the range between the 106.94 – 107.46.

The pair for the second straight session on Wednesday showed some resilience below the 107.00 round-figure marks and attracted some dip-buying near monthly lows set on April 1.

Despite the latest positive news about decreasing the new coronavirus cases and deaths across the world, investors still worried about the economic fallout from the deadly coronavirus. This eventually supported the USD’s status as the global reserve currency and started some fresh selling around the major.

On the other hand, the risk-off market sentiment and declines in the global equity markets keep supporting the Japanese yen’s safe-haven status, which eventually keeps the currency pair limited.

Daily Support and Resistance    

  • S1 105.75
  • S2 106.52
  • S3 106.84

Pivot Point 107.3

    • R1 107.62
    • R2 108.08
    • R3 108.85

USD/JPY – Trading Tips

The USD/JPY is trading with a bearish bias, and it is pretty much likely to find support around the triple bottom area of 107.039. A downward breakout of this level can extend selling until 105.300, while the resistance holds around 108.640. The MACD and 50 periods of EMA are suggesting bearish bias, while the fundamentals side is also in favor of selling. Since we the U.S. retail sales due during the U.S. session, traders will focus on the news to drive the next movement in the market. Hence, we should look for selling trades below 107 to target 106.630, and buying can be seen above the same 107 level today.  

All the best for today! 

Categories
Crypto Market Analysis

Daily Crypto Review, Apr 15 – Libra vs Bitcoin again? Cryptos preparing for a move

The cryptocurrency market spent the past 24 hours in the slight green. Bitcoin is currently trading for $6,873, which represents an increase of 0.56% on the day. Meanwhile, Ethereum gained 1.85% on the day, while XRP gained 1.67%.

Lisk took the position of today’s most prominent daily gainer, with gains of 12.33%. Nervos Network lost 4.24% on the day, making it the most prominent daily loser.

Bitcoin’s dominance decreased slightly when compared to yesterday’s value. Its value is now 64.24%, which represents a 0.37% difference to the upside.

The cryptocurrency market capitalization stayed at exactly the same place for the past 24 hours. Its current value is $197 billion. This value represents an increase of $0.35 billion when compared to the value it had yesterday.

What happened in the past 24 hours

Bitfinex’s Bitcoin holdings have reduced by 66,000 BTC in the past four weeks. The exchange counted 200,140 BTC on Mar 17. However, the data from Apr 13 shows that this amount went down to 134,091.

The massive decrease is not related just to this one exchange. We can also see the data on BitMEX, which had a 38% percent decline in its Bitcoin holdings.

Honorable mention

Libra

Economist and academic John Vaz said he believes Bitcoin still faces competition from Facebook’s Libra project.

He explained that Bitcoin has scaling challenges as far as payments go. On top of that it was used as a speculation vehicle. In contrast, he said, Libra has been with its only purpose to be a scalable payment network.

_______________________________________________________________________

Technical analysis

_______________________________________________________________________

Bitcoin

Bitcoin had a pretty slow day after the upswing which brought its price above $6,850. The largest cryptocurrency by market cap managed to stay above this support level, but did not go far from it. BTC is actually “hugging” this level and testing it every few hours. However, $6,850 is holding well and showing no signs of breaking.


Bitcoin’s volume is quite low, while its RSI level is at 49.

Key levels to the upside                    Key levels to the downside

1: $7,085                                           1: $6,850

2: $7,420                                           2: $6,640

3: $7,750                                            3: $5,960


Ethereum

Ethereum had a slightly better day than Bitcoin and outperformed it in terms of price gain. The second-largest cryptocurrency by market cap managed to push its price above $158 and establish its level above it. ETH’s chart looks almost identical to Bitcoin’s, with the exception that BTC crossed its resistance level earlier, while ETH did that in the past 24 hours. However, they both seem to “hug” the now-support level and keep retesting it.


Ethereum’s volume is descending and on comparatively low levels, while its RSI is at 52.

Key levels to the upside                    Key levels to the downside

1: $168                                                1: $158

2: $178.6                                            2: $147.5 

3: $185                                                3: $139


Ripple

XRP ended up in the green over the past 24 hours even though it found a level it can’t pass. The third-largest cryptocurrency by market cap tried to break the $19 resistance level for a day and a half now, without success. Low volume alongside overall stagnation in the crypto market makes the situation for XRP to break $0.19 almost impossible. However, the current price position can be quite responsive to both sides (up or down) and the next movement will most likely be preceded by Bitcoin’s move.


XRP’s volume is descending when compared to the past week, while its RSI level is currently at 61.

Key levels to the upside                    Key levels to the downside

1: $0.19                                              1: $0.165

2: $0.2                                                2: $0.147

3: $0.205                                             3: $0.1

Categories
Elliott Wave Guide Forex Elliott Wave

Intermediate Level Elliott Wave Analysis Guide

We have finished the section that covers the Intermediate Level of the Elliott Wave Analysis based on the work of Glenn Neely. These concepts are described and include the following aspects.

1.- Introduction to Intermediate Wave Analysis. In this section, we present the concept of grouping waves and how to apply them in the real market.
2.- Motive Waves Analysis. This section, divided into three parts covers the following aspects:
– The first part presents the extension concept and its application in the real market.
– The second part extends the concepts of Alternation, Equality, and Superposition, and we identified how the price action follows these rules.
– The third part presents the canalization process.
3.- Corrective Waves Analysis. This part unfolded in five parts, includes the following concepts:
– The first part reviews the rules of construction of corrective formations and the flat pattern, including its variations.
– The second part presents how to analyze the zigzag pattern and its variations.
– The third part exposes the characteristics and rules of the triangle pattern.
– The fourth part discusses the contracting triangle, including its variations, rules, and target zones.
– The fifth part dedicated to expanding triangles presents its variations and rules.
4.- Validation Rules. This two-part section exposes the next principles:
– In the first part, we learn how to validate impulsive waves.
– The second part shows how to validate corrective waves.
5.- Simplification of Wave Analysis. This last section illustrates how the compaction process can help the wave analyst to ease its analysis.

Categories
Crypto Videos

Mastering Crypto Using The Morning Star


Trading Crypto using the Morning Star Pattern

The Morning Star pattern is a three-candle candlestick pattern that signals a bullish reversal and appears at the bottom of a downtrend. It signals a trend slowing down and a large bullish move laying the foundation for a new uptrend.
Identifying the Morning Star Pattern
Identifying the Morning Star on cryptocurrency charts requires more than just identifying the three main candles. It also requires knowledge of the previous price movement. The pattern should be identifiable if these five things occur:

The market should be posting lower highs and lower lows prior to the Morning Star formation.
The large bearish candle shows up as a result of large selling pressure as well as a continuation of the existing downtrend. Traders should be looking to take only short positions as there are no signs of a reversal yet.
The second candle is a small-bodied candle (sometimes even a Doji candle) is the first sign of market showing downtrend fatigue. This candle often gaps lower and makes a lower low. It does not matter whether the candle ends up being bearish or bullish, as it is only supposed to represent market uncertainty.
The first real sign of bullish pressure is this exact candle. It should be a big green candle followed by an increase in volume.
After a successful reversal, traders will start to enter long positions as the market posts higher highs and higher lows. However, make sure to manage the risk through the use of well-placed stops-losses.

Trading the Morning Star Pattern

The chart on the screen shows us the formation of a Morning Star pattern, where an established downtrend is leading up to the formation of the Morning Star reversal pattern.
Once the formation has completed, traders are looking for an entry point at the open of the next candle. If a trader is more conservative, they could delay their entry point until they are satisfied with how the pattern plays out.
Targets should be placed at previous resistance levels or previous areas of consolidation. Stops-losses should be placed right below the recent swing low. As there are no guarantees of this pattern playing out correctly, traders should always maintain a positive risk to reward ratio to avoid taking any substantial risk of ruining their portfolio.

Morning Star Pattern reliability

The Morning Star pattern, just like any other candlestick pattern, should be used alongside other trading tools available to the traders. Even though this pattern occurs frequently and has a fairly high chance of playing out correctly, one has to take all precautionary measures to protect oneself from the risk.

Categories
Crypto Market Analysis

Daily Crypto Review, Apr 14 – Blockchain Immunity Passport for COVID-19?

The cryptocurrency market recovered from the price drop it experienced during the weekend and made its move towards the upside. Bitcoin is currently trading for $6,888, which represents an increase of 3.02% on the day. Meanwhile, Ethereum gained 3.77% on the day, while XRP gained 2.58%.

MaidSafeCoin took the position of today’s most prominent daily gainer, with gains of 25.25%. Digibyte lost 8.89% on the day, making it the most prominent daily loser.

Bitcoin’s dominance increased slightly when compared to yesterday’s value. Its value is now 64.61%, which represents a 0.44% difference to the upside.

The cryptocurrency market capitalization increased slightly over the past 24 hours. Its current value is $196.65 billion. This value represents an increase of $4.11 billion when compared to the value it had yesterday.

What happened in the past 24 hours

The COVID-19 Credentials Initiative (also known as CCI) is working on a digital certificate that will enable users to show proof that they have recovered from the COVID-19 virus. The certificate will work by using the W3C verifiable credentials standard. The certificate will show whether a person has antibodies for coronavirus or if it got a vaccine.

This form of certificate would act as an immunity passport, which could help stop the spreading of COVID-19 as well as helping individuals return to their lives prior to the pandemics.

Honorable mention

Bitcoin

One of the biggest and most well-known exchanges, Binance, has officially launched Bitcoin options on the Binance futures trading platform.

Binance has hinted that this might be the case earlier in April, but the main announcement came on April 13. The options are currently limited to the mobile app.

_______________________________________________________________________

Technical analysis

_______________________________________________________________________

Bitcoin

Bitcoin started recovering from the fall below some of its key support levels and made an attempt to reach its previous levels. The largest cryptocurrency by market capitalization has been moving up steadily over the past 24 hours, making its way above $6,850 and establishing its price there. Low volume might indicate that a move will end soon unless some form of new money comes to the market.


Bitcoin’s volume was descending in the past 24 hours, while its RSI level went to a value of 50.

Key levels to the upside                    Key levels to the downside

1: $7,085                                           1: $6,850

2: $7,420                                           2: $6,640

3: $7,750                                            3: $5,960


Ethereum

Ethereum established its position above $147.5  and started moving above the key level over the past 24 hours. The second-largest cryptocurrency is currently trading around the price of $158, with volume a bit low to progress further. However, the support level of $147.5 will hold (at least in the short-term) as there is no bear pressure at the moment.


Ethereum’s volume is on low levels, preventing any unstable movement. Its RSI level is currently at 48.

Key levels to the upside                    Key levels to the downside

1: $158                                                1: $147.5

2: $168                                               2: $139 

3: $178.6                                             3: $128


Ripple

XRP increased as well over the past 24 hours but had a pretty rough day. If we take a look at the chart, we can see its price increasing and trying to follow the ascending trend line. However, the uptick was stopped by the $0.19 key resistance level. As the price stopped rising, XRP started making moves towards the downside. There is a possibility that XRP might lose today’s gains very soon.


XRP’s volume decreased when compared to yesterday, while its RSI level is at 44.

Key levels to the upside                    Key levels to the downside

1: $0.19                                              1: $0.165

2: $0.2                                                2: $0.147

3: $0.205                                             3: $0.1

Categories
Forex Market Analysis

Daily F.X. Analysis, April 14 – Top Trade Setups In Forex – Eyes on G7 Meeting via Satellite! 

On the forex front, the U.S. Dollar Index was little changed at 99.49 amid thin holiday trading. The economic calendar is a bit muted, but the only focus today will be on the U.S. Labor Department will release the March import price index (-3.2% on month expected). 

Economic Events to Watch Today     


EUR/USD – Daily Analysis

The EUR/USD found bids and crossed above 1.09 level while representing 0.37% gains, mainly due to the recent broad-based U.S. dollar weakness after risk recovery in the market sentiment in the wake of fresh measured optimism about coronavirus outbreak. 

The fresh uptick in the oil prices and above-forecast China trade data also helping restore the risk-sentiment. At the moment, the EUR/USD is trading at 1.0941 and consolidates in the range between the 1.0893 – 1.0967.

At the coronavirus front, Australia has shown very sharp declines in the virus cases as compared to other countries and also registered declines in the death toll as per the latest report. Meanwhile, India’s flow is starting to drop, as the growth rate of new cases has consecutively declined after April 6. Moreover, the discussion of easing restrictions on activity is taking attention in the U.S. and other parts of the world. 

On the other hand, the above-forecast China trade data, especially imports, which registered a growth of 2.4%, contradicting expectations for a 2.4% decline, and the uptick in the crude oil prices, is helping improve the risk sentiment. 

The EUR currency got supported by multiple factors, the figures of newly infected peoples and death toll showing a sign slowing down across the hotspots in Europe and boosted the sentient around the shared currency. The Eurogroup has reached a half a trillion euros virus rescue package gave further support to the common currency bulls.

Looking forward, the USD moves and virus updates will continue to play an important role. Traders will keep their eyes on the G7 meeting for the fresh trading sentiment.

Daily Support and Resistance

  • S1 1.0772
  • S2 1.0847
  • S3 1.0877
  • Pivot Point 1.0923
  • R1 1.0953
  • R2 1.0998
  • R3 1.1073

EUR/USD– Trading Tips

Last week, the EUR/USD violated the asymmetric triangle pattern, which has lead the EUR/USD prices further higher towards the next resistance level of 1.09299 area. The long-held trading range of 1.0922 – 1.0765 as it’s been already violated, and now the pair is holding above this level. 

At this moment, the EUR/USD is holding at 1.09320, having an immediate support level of around 1.09060, where the bearish breakout of this level can extend selling until the next support level of 1.0846 and 1.07990. Conversely, the resistance stays at 1.0970 and 1.1035. The MACD is tossing above and below 0, converting the bearish sentiment into bullish and vice versa. Let’s consider staying bullish over 1.0960 today. 

GBP/USD– Daily Analysis

Today in the Asian trading hours, the GBP/USD currency pair found bids and hit the monthly high near above 1.2550, mainly due to fresh declines in the broad-based U.S. dollar in the wake of risk-on market sentiment. As well as, the latest statement that the UK PM Boris Johnson has discharged from the hospital and still recovering from coronavirus, this news also helped the pairs quote. The GBP/USD currency pair is currently trading at 1.2568 and consolidates in the range between the 1.2504 – 1.2574. However, the currency pair traders did not give any major attention to the coronavirus (COVID-19) crisis at home because the cases are comparatively larger in the U.S.

At the U.K. Crisis front, the United Kingdoms’ coronavirus death toll rose above 11,000, but the buyers are ignoring this probably because the death toll is comparatively larger in the U.S. almost 20,000 deaths have been registered so far.

On the other hand, the reason behind the pair’s bullish moves could also be the UK PM Boris Johnson’s health recovery as Johnson left the hospital. Though, The Guardian relied on his spokesman to say that He is “focusing on recovery.”

On the negative side, there are many chances to extend the U.K. lockdown for another month. Sir Patrick Vallance, Government Chief Scientific Adviser, said that the deaths toll from coronavirus could continue to rise this week or that could last for up to 3-weeks. It is worth mentioning that Chris Hopson, chief executive of NHS (National Health Services) Providers, indicates the lack of medical supplies.

Daily Support and Resistance    

  • S1 1.2366
  • S2 1.2436
  • S3 1.2474
  • Pivot Point 1.2505
  • R1 1.2544
  • R2 1.2575
  • R3 1.2645

GBP/USD– Trading Tip

The GBP/USD is trading with a bullish bias over 1.2500 to trade around 1.2496 but still holds within a sideways channel. The GBP/USD sideways channel has already been violated as the GBP/USD is holding around 1.2520 and along with resistance around 1.2770. Considering the weakness in the U.S. dollar, the chances of selling remains low, but the bullish bias remains solid over 1.2500 level. 

Since the resistance level of 1.2500 has already been violated, we may see GBP/USD prices going towards the next resistance level of 1.2720. The MACD and 50 EMA are also supporting the bullish bias, so let’s consider taking buying trades over 1.2432 with a target of 1.2500 first and then buying over 1.2500 to target 1.2610. 

USD/JPY – Daily Analysis

 the USD/JPY currency pair failed to continue its winning moves and dropped to 2-weeks low near the 107.53, mainly due to the fresh losses in the broad-based U.S. dollar in the wake of risk-on market sentiment. On the flip side, the risk-on market sentiment also weakened the Japanese yen and helped limit the downside in the currency pair, at least for the time being. 

The USD/JPY is trading at 107.69 and consolidates in the range between the 107.53 – 107.81. The reason behind the global risk-on market sentiment could also be better-than-expected Chinse trade data, which keeps the U.S. dollar U.S.wer and provided the goodish boost to the riskier currencies.

At the data front, the data showed China’s exports improved in March and fell 6-6% YoY as compared to a 17.2% slide in the previous month. Moreover, imports reversed the previous month’s decline and rose 2.4% during the reported month.

While the futures on the S&P 500 are representing a 1.27% gain at press time and the U.S. dollar U.S.ntinues to lose its momentum across the board. The dollar index, which measures the worth of the greenback against majors, is reporting a 0.30% drop. 

Daily Support and Resistance    

  • S1 106.59
  • S2 107.18
  • S3 107.46
  • Pivot Point 107.77
  • R1 108.05
  • R2 108.36
  • R3 108.95

USD/JPY – Trading Tips

The USD/JPY is trading with a bearish bias, and it is pretty much likely to find support around the triple bottom area of 107.039. A bearish breakout of this level can extend selling until 105.300. While the resistance holds around 108.640. The MACD and 50 periods of EMA are suggesting bearish bias, while the fundamentals side is also in favor of selling. Since we don’t have any major fundamental coming out shortly, traders will focus on the technical side and levels. Hence, we should look for selling trades below 108 to target 107.030 today.  

All the best for today! 

Categories
Forex Elliott Wave

How to Simplify Wave Analysis – Intermediate Level

Introduction

How to simplify wave analysis can seem a confusing task. However, if we consider the concepts we have previously studied, the process may be more straightforward. 

Until now, we have studied concepts and principles such as types of waves, internal characteristics of each kind of pattern, wave channeling rules, price and time alternation, and wave validation criteria, among other aspects.

In this section, we will see procedures in which we will transform the complexity into a basic market structure.

Waves Compaction

Compaction is the analysis process in which a sequence of adjacent segments that make up an impulse or correction structure (5 or 3) is grouped. Given the dynamic nature of price action, any Elliott wave pattern, once completed, can be labeled as impulsive or corrective. Therefore, this technique cannot be applied, while Elliott’s formation is in progress.

Once an Elliott wave pattern has been completed, the structure of the series can be compacted, which will make as a basic structure. Then, the formation we will use as a base in the following process for the analysis and compaction can be repeated.

Regrouping

Regrouping is the process you perform after compacting waves. At this stage, the wave analyst will use the compacted wave as the base structure of the following wave group and thus construct a series of larger waves, which may be standard or non-standard.

Integration

Integration is the process in which the wave analyst uses short-term compacted waves to form larger wave structures to be included in long-term charts. For example, once a short-term wave pattern is completed, this structure can be transferred with its labels to the long-term (or higher degree) chart. 

This process can be useful for information references when comparing short-term and long-term graphs to obtain a more logical and accurate idea of the next market movement.

The Principle of Complexity

This principle is useful for the classification of subdivisions of an Elliott pattern. Its usefulness lies in the possibility of combining large scale patterns and determining the relative name of the degree of each segment.

In other words, when a wave advances in the short term, it is straightforward to identify each segment and thus identify and label wave pattern. As time progresses, this wave increases its complexity, and the process of compacting waves is required. Once the wave is compacted, another wave is completed on a higher degree. 

Consequently, the complexity tends to grow as the waves increase, and they combine to give way to new waves.

The principle of complexity may not be relevant in the short-term analysis. However, as the horizon of analysis increases, the usefulness of this principle becomes essential. In this respect, the Elliott guidelines identified at the same consecutive level, have the same degree.

The Concept of Degree

Until now, we have used the term Degree superficially referring to an ambiguous time horizon as short, mid, or long term. 

In Elliott wave theory, the degree is not related to a specific timeframe, for example, 15 minutes, an hour, 5-day, etc. It is related to the order in which the different wave patterns are completed. 

R.N. Elliott, in his Treatise “The Wave Principle,” states that both labeling and degrees are not the ultimate purpose of wave analysis, but are an instrument that allows keeping an order to be maintained within the analysis process.

A wave degree is determined by the wave compacting process from the short to the long-term. Once the short term wave has been completed, it will be a segment in a higher time range or greater degree.

R.N. Elliott defined the following degrees to classify the order of market movements.

  • Subminuette
  • Minuette
  • Minute
  • Minor
  • Intermediate
  • Primary
  • Cycle
  • Supercycle
  • Grand Supercycle

The different degrees are represented in increasing order in terms of temporal magnitude. 

On the other hand, Prechter & Frost, in their work “Elliott Wave Principle,” incorporated six additional degrees, as shown in the following table.

In practical terms, to have a reference to the temporality to be used in the analysis process, when Elliott developed wave theory, the smallest data time range available corresponded to the hourly graph. Consequently, the wave analyst can begin by assigning the Subminuette degree to the wave structures that are completed in this temporality and thus advance successively from there.

Conclusions

In this article, we have seen how a systematic process can simplify the process of wave analysis.

The wave analyst can simplify the market analysis helped by the use of the compaction process, which should be realized once completed a wave pattern. Later, by using grades and labels, the wave analyst will be able to maintain a simplified order in the study and, in turn, make a forecast of the next most likely market movement.

In the following article, we’ll start the advanced level of the wave analysis with the study of complex corrective waves.

Suggested Readings

  • Neely, G.; Mastering Elliott Wave: Presenting the Neely Method; Windsor Books; 2nd Edition (1990).
  • Prechter, R.; The Major Works of R. N. Elliott; New Classics Library; 2nd Edition (1990).
  • Prechter, R., Frost.A.J.; Elliott Wave Principle: Key to Market Behavior; New Classic Library; 10th Edition (2005).


Categories
Crypto Market Analysis

Daily Crypto Review, Apr 13 – Bitfinex confirmed: $1.1 billion in Bitcoin for $0.68!

The cryptocurrency market saw most coins drop in price slightly over the weekend. Bitcoin is currently trading for $6,711, which represents a decrease of 1.7% on the day. Meanwhile, Ethereum lost 2.68% on the day, while XRP lost 2.16%.

Komodo took the position of today’s most prominent daily gainer, with gains of 11.13%. Maker lost 7.80% on the day, making it the most prominent daily loser.

Bitcoin’s dominance stayed at almost exactly the same place from where it was on Friday. Its value is now 64.17%, which represents a 0.39% difference to the upside when compared to Friday.

The cryptocurrency market capitalization went down slightly over the weekend. Its current value is $192.51 billion. This value represents a decrease of $11.78 billion when compared to the value it had on Friday.

What happened in the past 24 hours

Blockchain software and tax services company called Lukka is chosen to provide a crypto taxation software to the fifth-largest accounting company in the US, RSM.

Lukka CCO Jeremy Drane, as well as RSM senior manager of international tax and blockchain Jamison Sites, spoke about the partnership and how it could benefit both companies.

Honorable mention

Bitcoin

Someone transferred 161,500 Bitcoin for a fee of only 0.00010019 BTC on April 10. When translated into dollars, this is $0.68 for a $1.1 billion transaction.

Of that amount, 15,000 Bitcoin was sent to a certain wallet, while the remainder of the transaction (146,500 BTC) was returned to the original address.

_______________________________________________________________________

Technical analysis

_______________________________________________________________________

Bitcoin

Bitcoin fell under $7,000 again, after failing to reach above $7,420 many times. With bulls showing such sign of weakness, bears took over and pushed the price down a few times until the $7,000 level was broken. Bitcoin has now fell under the $6,850 support as well, but found its stability at the $6,640 key level. Traders should most definitely look at the volume when trading, as that may be the best indicator of when the move is coming at the moment.


Bitcoin’s volume is rose over the weekend but is pretty low at the moment. Its RSI level is currently at 39.

Key levels to the upside                    Key levels to the downside

1: $6,850                                           1: $6,640

2: $7,085                                           2: $5,960

3: $7,420                                            3: $5,000


Ethereum

Ethereum’s chart looks more or less the same as Bitcoin’s. Once the bulls couldn’t handle the resistance levels, bears took over and brought Ether’s price down. The wall of $158 fell, and ETH had do find another support level, which it did. The $147.5 line responded well to the pressure, and Ethereum is consolidating above it.


Ethereum’s volume increased slightly over the weekend while it is back to normal at the moment. The RSI level is currently at 40.

Key levels to the upside                    Key levels to the downside

1: $158                                                1: $147.5

2: $168                                               2: $139 

3: $178.6                                             3: $128


Ripple

XRP was following the ascending trend line until the drop of April 10. The third-largest cryptocurrency crashed and fell under this line and then retesting it only to fail to break it to the upside. Over the weekend, this like got tested once again as XRP pushed to $0.1965. However, the resistance level held up, and XRP bears responded by bringing the price down to $0.183.


XRP’s volume increased greatly during the most recent drop, while its RSI level is at 39.

Key levels to the upside                    Key levels to the downside

1: $0.19                                              1: $0.165

2: $0.2                                                2: $0.147

3: $0.205                                             3: $0.1

Categories
Forex Market Analysis

Bullish Bias in Gold Fades – Is It Going to Retrace Back? 

On Friday, the yellow metal gold as showing sideways trading around 1,683 level after mounting to the highest level since March 9. Yesterday, most of the bullish bias was seen in the wake of another stimulus plan announced by the Federal Reserve. 

The U.S. President Donald Trump is showing willingness to support the USA fight against the coronavirus (COVID-19), which eventually seems to help the risk-tone. This time, the Fed will elevate about $2.3 trillion to promote small and medium-sized companies, districts and workers harmed by the coronavirus break.

Increased volatility driven by COVID 19 has driven gold prices higher towards the forecasted resistance level of 1,689 and has closed a candle below this level. 

The consumer price index declined 0.4% from the previous month and grew 1.5% year, which is extremely lower than 2.3% gain in February. The pair got major as energy prices sank by the most in five years, exhibiting one of the stronger-ever breakdowns in oil prices.

XAU/USD – Daily Technical Levels

Support Resistance 

1656.59 1700.91

1629.83 1718.47

1585.51 1762.79

Pivot Point 1674.15

On the four timeframes, precious metal gold has formed three white soldiers, which suggest odds of further buying in the pair. Continuation of the upward trend may lead to gold prices towards the next resistance level of 1,702. At the moment, there are odds that gold prices may show correction until 1,676 and 1,669 marks ahead for extending further buying trends today. Good luck! 

Categories
Forex Videos

Dominating Price Action! Making You A Better Trader

Dominate Price Action To Amplify Your Trading Arsenal

In this video presentation, we will be looking at price action. If you want to be a successful forex trader, you need to understand what price action is. If we had to strip forex training down to 1 single most important feature, then price action would be it. Today we are going to show you how it is applied in forex trading.
All areas of the financial markets capture the movements of any specific asset, including Forex, on a chart and where this is recorded historically. These movements can be represented as candlesticks, line charts, or bar graphs, And can be observed over varying time periods from 1-minute or 5-minute time frames, all the way up to monthly charts. This data reflects the beliefs of market participants at any given time, whether they are human or algorithm-based traders, which is shown on the charts in the form of price action.

Price action is the methodology of applying all your decisions from a price chart while adhering to some basic trading principles. Price action is often called naked trading because traders rely on the price itself in order to denote when to enter and exit trades. However, by adding a couple of moving averages and some support and resistance lines, it becomes much more easy to identify key levels of support and resistance to trade around. Ideally, as a trader, we want to try and identify tops, bottoms, and trends. And this methodology is an extremely important feature in identifying these key areas.

A couple of old adages come to mind which lends themselves very nicely to forex trading: the first one is that sometimes you can’t see the wood for the trees, and where that can be applied to Forex in so far as sometimes traders overload their screens with technical tools and they cannot really clearly identify what is happening with the price action because they are too focused on too many technical tools. And the other adage is sometimes less is more, and that applies for the same reason: by stripping away technical tools, we can only rely on price action itself, which is a key leading indicator in its own right. While in this example of the EURUSD pair, we can quite safely say that during this period of the 1-hour chart, the general trend was to the downside, but how can we pick this out by utilizing price action itself?


Example B, the Price action of a pair is in continuous motion apart from interruptions during the weekends. Otherwise, price is consolidating or moving in a sidewards direction, or it is trending higher or lower. As traders, we should be looking at what is happening with price action at any given time and then try to establish if the price is trending, or if it is in a period of consolidation, or even a pullback before a trend continuation.
Price action alone can help us determine these areas, but by adding a couple of visual supports such as some trend Lines, it just makes it more easily identifiable. For this example, we have just added two very simple lines that help us to more clearly identify levels of support and resistance. Here we can see a period of consolidation, which is qualified by price action touching, or is very close to touching at least two areas of support and resistance, which are clearly identifiable such as drawn onto our chart.
One thing is for sure that price action will breach this area at some future point. This is a key area of interest for traders.


Example C, Here we can see that the support line has been breached by a strong bearish candlestick. Traders will jump on this opportunity to go short on the pair at this point.

Example D, We subsequently see another area of consolidation and a further breach to the downside, and where traders would expect that a downtrend is in process, and they would be looking for opportunities to go short.
Whilst stochastics, MACD, and moving averages are widely used throughout the trading community, many traders feel that price alone can be relied on for identifying trade opportunities, and certainly, these couple of examples would support that.
But of course, as cautious traders, we like to stack the odds in our favor, and if that means adding a couple of extra visual technical tools that will help us well, what’s the harm in that?

Example E, Here, for example, we have added a simple 30 period moving average. Notice how the price action tends to bounce lower off of this line, while price action continues in its trend lower.

Example F, I know the world price continues to consolidate and punches lower through support lines and where support lines become lines of resistance, but all the while price is bouncing lower from the 30-period ma.


Example G, Price action also throws up another favorite for traders: highs with lower highs and lows with lower lows which identify a downtrend, and where the opposite would apply for an uptrend, where they would be looking for highs with subsequently higher highs and lows with subsequent higher lows. But again, these key areas are clearly evident on the screen, even with price action alone.

Example H, Price action Traders will also observe higher time frames, in this example, we are looking at a 4-hour chart of the EURUSD pair, traders try and establish what is going on with price action on the longer time frames because this will filter through to the lower time frames and where they will look for opportunities to jump on the overall trend should there be one.
Price action becomes repetitive, and this is because human nature in trading tells us that certain things are likely to happen at certain levels, typically key levels or round numbers, and if these things are recurring on a regular basis, human emotion would suggest that they are likely to continue to recur and therefore trading sometimes becomes a self-fulfilling prophecy where certain price action events, in the absence of fundamental reasons, is likely to continue in this vein. Price action levels become significant because market participants give significance to them.

In summarising price action who is the most significant aspect of Forex trading, and where by just using the minimum amount of technical tools you can more easily see areas of price consolidation, within resistance and support levels, and when these areas are breached we may see a continuation in price action in the direction of the breach, and by incorporating a simple moving average it can more easily help us to identify a trend. And that these very basic mechanisms are highly favored by professional and institutional traders.

Categories
Forex Course

98. Do You Know There Are Four Types of Pivot Points?

Introduction

In all the previous lessons of pivot points, we considered the traditional pivot points. But this is not the only type of pivot points that are existing. There are three other types to it as well. In this lesson, we shall cover the four different types of pivot points that exist.

Types of Pivot Points

The four types of pivot point are mentioned as follows:

  • Traditional Pivot point
  • Woodie Pivot point
  • Camarilla Pivot point
  • Fibonacci Pivot point

Since we’ve already discussed the traditional pivot point in detail, we shall be concentrating on the rest of the types. Note that, in all the different types of pivot points we will be studying, the only difference is the calculation of the pivot point levels. As far as the concept to trade using these pivot points is concerned, it remains the same as the traditional approach.

Woodie Pivot Point

The Formulae

Pivot point (P) = (High + Low + 2Close) / 4

First Resistance (R1) = (2 x P) – Low

Second Resistance (R2) = P + High – Low

First Support (S1) = (2 x P) – High

Second Support (S1) = P – High + Low

From the above formulas, we can notice that the way of calculations is pretty different from that of the traditional type. In the traditional, we considered the difference between High and Low to calculate support and resistance levels. But, in this case, consider the range as well as the close of the previous day. Some traders prefer this over the traditional pivots because it gives more weightage to the close price of the previous day.

Camarilla Pivot Points

The Formulae

P = (High + Close + Low) / 3

S1 = Close – ((High – Low) x 1.0833)

S2 = Close – ((High – Low) x 1.1666)

S3 = Close – ((High – Low) x 1.2500)

S4 = Close – ((High – Low) x 1.5000)

R4 = Close + ((High – Low) x 1.5000)

R3 = Close + ((High – Low) x 1.2500)

R2 = Close + ((High – Low) x 1.1666)

R1 = Close + ((High – Low) x 1.0833)

If we look closely, we can infer that the support and resistance levels are calculated using the range and the close price similar to the Woodie calculation. The only major difference being, in Camarilla, four levels of Support and Resistance is calculated and is multiplied by a multiplier.

The theory with which Camarilla was created is based on the concept that the price has a natural tendency to return to the mean (here, close of the previous day). So, the simple strategy here is to sell when the price reaches the R3 or R4 level and buy when the price bottoms to S3 or S4 level. However, if the price breaches the S4 or R4 level, it indicates a strong trend in the market.

Fibonacci Pivot Points

The Formulae

P = (High + Low + Close) / 3

S1 = P – ((High – Low) x 0.382)

S2 = P – ((High – Low) x 0.618)

S3 = P – ((High – Low) x 1.000)

R3 = P + ((High – Low) x 1.000)

R2 = P + ((High – Low) x 0.618)

R1 = P + ((High – Low) x 0.382)

For calculating Fibonacci level, the pivot point level is calculated using the traditional method. Then the Support and Resistance levels are obtained by finding the product of the previous day’s range and the corresponding Fib level. The most used Fib levels are 38.2%, 61.8%, and 100%. Finally, adding/subtracting this value with the pivot point yields the Support and Resistance levels.

All of these indicators will be available with most of the brokers and charting tool software. Consider trying all of these pivot points on a demo account and use the ones that work the best for you. This hence brings us to the end of this lesson as well as the concepts involved in the pivot points. In the next lesson, we’ll summarize this topic and move ahead with another interesting technical analysis tool. Cheers!

[wp_quiz id=”70131″]
Categories
Forex Market Analysis

Daily F.X. Analysis, April 10 – Top Trade Setups In Forex – U.S. CPI Under the Spotlight! 

The greenback dropped broadly due to the downbeat U.S. Initial Jobless Claims data release, which showed that the weekly new claims exceeded 6 million for the second straight time last week. The fresh fears of economic difficulty, indicated by the Fed Chair Powell, also keeps the USD lower, which leads a 0.06% drop in the U.S. dollar to trade at 99.46, having hit a daily high at 99.63 in early Asia. Today, the major focus of traders will be on the U.S. inflation report as most of the market is off due to good Friday. Let’s take a look at the technical and fundamental’s outlook.

Economic Events to Watch Today     


EUR/USD – Daily Analysis

The single currency EUR gained a slight bullish momentum against the U.S. dollar on reports that the U.S. jobless claims performed worst than expected. A day before, the European Union finance ministers failed to agree on a coronavirus relief package. Meanwhile, the Bank of France sees the first-quarter GDP shrinking 6% from the previous quarter, the most significant decline since World War II, amid nationwide lockdown due to the coronavirus outbreak.

On the other hand, the EUR currency got supported by multiple factors, the figures of newly infected peoples and death toll showing a sign slowing down across the hotspots in Europe and boosted the sentient around the shared currency. In the meantime, the Eurogroup finally reached a half a trillion euros virus rescue package gave further support to the common currency bulls.

Looking forward, the USD moves and virus updates will continue to play an important role. Traders will keep their eyes on the Fed’s Mester’s speech, the U.S. Consumer Price Index (CPI), and the G20 energy ministers meeting for the fresh trading sentiment.

Daily Support and Resistance

  • S1 1.0685
  • S2 1.0796
  • S3 1.0862

Pivot Point 1.0907

  • R1 1.0973
  • R2 1.1018
  • R3 1.1129

EUR/USD– Trading Tips

The EUR/USD has violated the asymmetric triangle pattern, which is leading; it’s price further higher towards the next resistance level of 1.0960. The pair was following 1.0922 – 1.0765 trading, which is now likely to give support to the EUR/USD pair. At this moment, the EUR/USD is holding at 1.0940, having an immediate support level of around 1.09110, where the bearish breakout of this level can extend selling until the next support level of 1.0846 and 1.07990.

The MACD has crossed over 0, converting the bearish sentiment into bullish. At the same time, the 50 periods exponential moving average is also keeping the EUR/USD in a bullish mode, extending an immediate resistance around 1.08996. So, let’s consider taking buying trades above 1.0907 to target 1.0970 today. 


GBP/USD– Daily Analysis

The GBP/USD rebounded for a second straight session, gaining 0.4% to 1.2392. U.K. government spokesman James Slack said Prime Minister Boris Johnson is in a stable condition and responding to coronavirus treatment in hospital. 

The reason behind the GBP strength could also be the fresh pessimism surrounding Brexit date because the new Labour Party shadow Chancellor Anneliese Dodds asked ministers to beware putting “ideology over the national interest. Whereas, the U.K. Express conveyed the headlines indicating the Transition period delay could cost U.K. taxpayer £26 billion a year.

On the other hand, the U.S. Federal Reserve (Fed) Chair Jerome Powell expecting downbeat economics during the 2nd-quarter (Q2) of 2020 before expecting the recovery in the second half of the year.

As in result, Japan’s TOPIX recently rose to 1,424, up 0.56%, while stocks in China remain mixed by the reporting time. Looking ahead, traders will keep their focus on the coronavirus updates for intermediate direction. However, the expectedly downbeat U.S. inflation figures for March will likely keep the pair strong.

Daily Support and Resistance    

  • S1 1.2187
  • S2 1.231
  • S3 1.2381

Pivot Point 1.2432

  • R1 1.2504
  • R2 1.2555
  • R3 1.2678

GBP/USD– Trading Tip

The GBP/USD soars to trade around 1.2496 but still holds within a sideways channel. The GBP/USD sideways channel is supporting the GBP/USD pair around 1.220 and along with resistance around 1.2490.

Considering the weakness in the U.S. dollar, the chances of selling remains low, but the bullish bias remains solid over 1.2500 level. Violation of this can lead the GBP/USD prices until 1.2720. The MACD and 50 EMA are also supporting the bullish bias, so let’s consider taking buying trades over 1.2432 with a target of 1.2500 first and then buying over 1.2500 to target 1.2610. 


USD/JPY – Daily Analysis

Today in the early Asian session, the USD/JPY currency pair dropped to 108.33, mainly due to the risk-off market sentiment in the wake of intensified concerns about coronavirus (COVID-19). The fresh declines in the U.S. dollar, which are based on downbeat data and depressed signals from the Fed Chair, keeps the pair lower.

The USD/JPY is currently trading at 108.39 and consolidates in the range between the 108.33 – 108.61. At the USD front, the greenback dropped broadly due to the downbeat U.S. Initial Jobless Claims data release, which showed that the weekly new claims exceeded 6 million for the second straight time last week.

The fresh fears of economic difficulty, indicated by the Fed Chair Powell, also keeps the USD lower; as in result, the U.S. dollar index drops 0.06% to 99.46, having hit a daily high at 99.63 in early Asia.

At the coronavirus front, as per the latest report, the 427,460 cases of coronavirus registered an increase of 32,449 cases from its previous count and said the number of deaths also rose 1,942 to 14,696. It should also be noted that the Centers for Disease Control and Prevention (CDC) earlier announced ‘no sail’ order to all cruise ships. As in result, the U.S. continues marked as the world’s second-worst affected nation due to the virus after Italy.

Daily Support and Resistance    

  • S1 107.84
  • S2 108.34
  • S3 108.59

Pivot Point 108.85

  • R1 109.09
  • R2 109.35
  • R3 109.86

USD/JPY – Trading Tips

The USD/JPY’s symmetric triangle pattern has already been violated, which was supporting the pair around 108.570. Closing of candles below this level is suggesting bearish bias among traders, which can lead the USD/JPY, the safe-haven currency pair, towards the next support level of 107.850. The 50 EMA is also suggesting a bearish bias for the USD/JPY pair. 

On the higher side, the support level 108.500, which got violated earlier, is going to work as resistance now, and it may offer us selling traders in the USD/JPY today.  The USD/JPY may exhibit buying until 108.580, and violation of this can open more room for buying until 108.8500. On the lower side, support continues to hold around 107.850. Let’s look for selling traders below 108.550 today.  

All the best for today! 

Categories
Crypto Market Analysis

Daily Crypto Review, Apr 10 – Canada launching a BTC fund; Cryptos retesting support levels

The cryptocurrency market had a slightly red day as it consolidated and tested slightly lower prices overall. Bitcoin is currently trading for $7,133, which represents a decrease of 2.08% on the day. Meanwhile, Ethereum lost 3.84% on the day, while XRP lost 2.11%.

Dash took the position of today’s most prominent daily gainer, with gains of 7.03%. Seele lost 11.05% on the day, making it the most prominent daily loser.

Bitcoin’s dominance increased a tiny bit. Its value is now 64.56%, which represents a 0.31% difference to the upside when compared to yesterday.

The cryptocurrency market capitalization went down slightly in the past 24 hours. Its current value is $204.27 billion. This value represents a decrease of $4.22 billion when compared to the value it had yesterday.

What happened in the past 24 hours

Canadian asset manager 3iQ announced that they would finally launch a fund tied to Bitcoin on the Toronto Stock Exchange. This news came after three years of legal issues.

‘The Bitcoin Fund’ started trading yesterday. It listed almost 1.5 million Class A ‘QBTC.U’ shares the exchange on April 9. The fund’s company shares are currently trading for somewhere around $11 each.

Honorable mention

Ethereum

Investors seem to be liking Ethereum, as some of them are ready to pay five times more than its price. Grayscale Ethereum Trusts offers Ether at a 515% premium, and people still like it.

It costs $90.55 to buy one share in the Grayscale Investments’ Ethereum Trust. However, this share currently only holds $16.10 worth of Ether.

_______________________________________________________________________

Technical analysis

_______________________________________________________________________

Bitcoin

Bitcoin has spent the day consolidating and dropping in price slightly. However, things do not look well as Bitcoin is taking a retest of the lows with slightly increased volume. While it is currently trying to breach $7,000 and trade under it, nothing is settled yet.


Bitcoin’s volume is slowly increasing, while its RSI is currently at the value of 40.

Key levels to the upside                    Key levels to the downside

1: $7,420                                           1: $7,085

2: $7,750                                           2: $6,850

3: $8,000                                            3: $6,640


Ethereum

Ethereum spent the past 24 hours trying to establish a price above the $168 support level. However, the latest push down broke the level, and ETH went below $168. It looks like the second-largest crypto will retest at least the $158 level, if not more.


Ethereum’s volume skyrocketed during the price drop, while its RSI level is at 46.

Key levels to the upside                    Key levels to the downside

1: $168                                                1: $158

2: $178.6                                            2: $147.5 

3: $185                                                3: $139


Ripple

XRP spent the past couple of days fighting to stay above $0.2. However, the tight range between $0.2 and $0.205 was not enough for XRP, so the price had to move somewhere. A slight increase in bearish presence brought the price down to rested the $0.19 levels and solidified XRP’s position below $0.2. The level seems to be holding up nicely so far, which means that $0.19 will not fall unless the volume increases dramatically.


XRP’s RSI level has been dropping for the past couple of days, now being at 45.

Key levels to the upside                    Key levels to the downside

1: $0.2                                                1: $0.19

2: $0.205                                            2: $0.165

3: $0.227                                             3: $0.147

Categories
Forex Course

97. Where Are The Pivot Point Levels Put To Use?

Introduction

In our previous two discussions, we enlightened you with different strategies for using the pivot points. If you noticed, there we focused only on the pivot support and resistance levels. We didn’t really touch base on the Pivot Point (P) level. So, in this chapter of pivot points, we shall understand how the pivot point level is useful.

The usefulness of Pivot Point

The pivot point is used to measure market sentiment. Yes, with pivot points, we can even gauge the sentiment of the market. In other words, the pivot point helps us determine the direction of the market. It tells us in which direction is the money flowing in the market. So, basically, it indicates the trend of the market. Now, let’s take a few examples to understand the use of pivot points.

What does a Pivot Point tell us?

We know that the pivot point determines the type of market we are in. Inferences are made when the price falls below or above the pivot point.

  • When the market breaks below the pivot point (P), it indicates a bearish market or a market where the sellers are under control.
  • When the market breaches above the pivot point (P), it indicates a bullish/buyer’s market.

Bearish Example

Consider the chart below representing the GBP/JPY on the 15min timeframe. The pivot points are indicated as shown. Initially, we can see that the market was holding above the Pivot Point (P). Later in the day, it broke below the pivot point and then continued to move south. Also, it didn’t even respect the support levels. From this, we can conclude that the support levels do not work every single time. It perfectly fine when it is combined with other tools of analysis. However, a breakout trader would’ve profited the most from it.

Most importantly, one must not use this pivot point level as a tool to enter a trade. It is only an indicator that determines the sentiment of the market. It only tells us if the buyers are showing interest in the currency pair or the sellers. And with information in hand, we use other trading techniques to time the market.

Bullish Example

In the below chart, we can see that the market was trading below the pivot point level. Then it shot up and broke the pivot level as shown. This marks the start of an uptrend. And it is clearly visible that the market headed north by breaking through R1 as well as R2. But at R3, it found resistance. Now since the market is trending up, one can look at the price drop from R2 as a discount and anticipate buying at the R2 level, which is ‘resistance turned support.’

Similarly, traders can determine the direction of the market using the pivot point level and time their entry based on other technical tools and ideas. We hope you found this lesson informative and interesting. Cheers!

[wp_quiz id=”69915″]
Categories
Forex Market Analysis

Daily F.X. Analysis, April 09 – Top Trade Setups In Forex – Brace for High Impact Events! 

On the forex front, the U.S. dollar stabilized against its major peers on Wednesday, as the ICE Dollar Index gained 0.2% on the day to 100.16. Eyes will remain on the German Federal Statistical Office, which is due to report February trade balance (16.5 billion euros surplus expected) and current account balance (17.0 billion euros surplus expected).

The U.K. Office for National Statistics will post February monthly GDP (+0.1% on month expected), industrial production (+0.1% on month expected), manufacturing production (+0.1% on month expected) and trade balance (1 billion pounds surplus expected).

Economic Events to Watch Today     


 EUR/USD – Daily Analysis

The EUR weakened against the U.S. dollar on reports that European Union finance ministers failed to agree on a coronavirus relief package. EUR/USD slid 0.3% to 1.0862.

German leading institutes expect the country’s GDP to slump 9.8% in the second quarter compared with the prior quarter and drop 4.2% for the whole year, citing the coronavirus pandemic. Meanwhile, the Bank of France sees the first-quarter GDP shrinking 6% from the previous quarter, the largest decline since World War II, amid nationwide lockdown due to the coronavirus outbreak.

Moving on, the shared currency may face deeper losses if a discussion about the stimulus package again fails to happen on the day or end on a sour note. It’s worth noting that the ECB is already running a negative interest rate policy and a massive asset purchase program. As a result, markets are increasingly expecting governments to do their bit by providing fiscal stimulus. 

Looking forward, the ECB minutes, which are scheduled to happen at 11:30 GMT, are expected to repeat downside risks to the economy and willingness to do more if required. On the data front, Germany is set to report trade figures for the month of February at 07:00 GMT. 

Daily Support and Resistance

  • S1 1.0742
  • S2 1.08
  • S3 1.0829

Pivot Point 1.0858

  • R1 1.0887
  • R2 1.0917
  • R3 1.0975

EUR/USD– Trading Tips

The EUR/USD continues trading within a symmetric triangle pattern, which is keeping the pair within 1.0922 – 1.0765 trading zone. At this moment, the EUR/USD is holding at 1.0866, having an immediate support level of around 1.0835, where the bearish breakout of this level can extend selling until the next support level of 1.07990 and 1.0765.

The MACD has still tossing above and below 0, converting the bearish sentiment into bullish. At the same time, the 50 periods exponential moving average is also keeping the EUR/USD in a neutral mode, extending an immediate resistance around 1.08856. So, let’s consider taking selling trades below 1.0835 to target 1.0775 and bullish above the same to target 1.0910 and 1.0970 today.

GBP/USD– Daily Analysis

The GBP/USD rebounded for a second straight session, gaining 0.4% to 1.2392. U.K. government spokesman James Slack said Prime Minister Boris Johnson is in a stable condition and responding to coronavirus treatment in hospital. 

Later today, U.K. monthly GDP data and manufacturing production for February will be released (both +0.1% on month expected). Whereas, the market risk sentiment getting heavy due to the rise in the U.S. cases, marked as a second highly infected nation, after Italy, in the world. 

As in result, early Asia risk-on sentiment, mainly due to U.S. President Donald Trump’s push for restarting the economy, failed to extend while the U.S. 10-year treasury yields dropped 2-basis points to 0.746% with stocks in Asia flashing mixed results.  

Looking ahead, the traders may not give any major attention to the U.K.’s data-dump comprising Manufacturing Production, Industrial Production, and monthly GDP due to being before the virus outbreak period. 

However, the weekly release of U.S. Jobless Claims and speech from the Federal Reserve Chairman Jerome Powell will be essential to watch. Apart from this, virus updates will not lose its importance and will be essential to watch for new directions.

Daily Support and Resistance

  • S1 1.2104
  • S2 1.2236
  • S3 1.2315

Pivot Point 1.2368

  • R1 1.2447
  • R2 1.25
  • R3 1.2632

GBP/USD– Trading Tip

On Thursday, the GBP/USD soars to trade around 1.2398 within a sideways channel. The channel is supporting the Cable at 1.220 and along with resistance around 1.2490. The release of GDP figures from the U.K. can help drive a breakout in the market. In the case market breaks bellow 1.2278, we may see GBP/USD prices heading into the selling zone until 1.2100 and 1.2005. 

Whereas, the chances of buying remains solid over 1.2275 until 1.2520. The MACD and 50 EMA are also supporting the neutral bias, so let’s consider taking buying trades over 1.2368 with a target of 1.2470 and sell trades below 1.2368  

USD/JPY – Daily Analysis

During Thursday’s Asian session, the USD/JPY currency pair flashing green and continued its previous session recovery rally toward above the 109.00 level. The currency pair rose from 108.60 to 109.06, mainly due to the recent risk reset market sentiment. 

Currently, the USD/JPY is currently trading at 108.94 and consolidates in the range between the 108.80 – 109.06. However, the Japanese yen earlier weakened caused by risk-on market sentiment in the wake of expectation of further stimulus and an easy run for the favorite candidate for the U.S. President’s post.

During the Newyork trading session, the attention was on the Federal Reserve Open Market Committee’s minutes of the unscheduled meeting on March 15. The minutes indicated anxiety about the virus and the extremely large degree of uncertainty. There was a muted reaction to the minutes because they didn’t show anything that hasn’t already been priced in by market traders. They just decided to cut the benchmark rate to nearly zero and restart bond-buying programs.

Moreover, Japan’s Prime Minister Abe has announced a state of emergency in Tokyo and 6-other provinces. He plans to control the economic fallout of COVID-19 as well as a substantial fiscal stimulus package. The package, worth ¥16.5trn, equates to 20% of GDP. Consequently, the USD/JPY currency pair is moving nowhere as investors seem confused about whether to buy USD/JPY over a stronger dollar or sell over the increased safe-haven appeal. 

As per the latest comments from the U.S. and Japanese policymakers also indicated that more stimulus to control the coronavirus (COVID-19) is on their way. On the flip side, Bernie Sanders turned from the U.S. Presidential Candidate’s race, giving an edge to the market favorite Joe Biden and helping to improve the trading sentiment.

Daily Support and Resistance    

  • S1 107.84
  • S2 108.34
  • S3 108.59

Pivot Point 108.85

  • R1 109.09
  • R2 109.35
  • R3 109.86

USD/JPY – Trading Tips

On Thursday, the USD/JPY’s symmetric triangle pattern continues to play due to a lack of high impact economic events. Choppy sessions continue to trade around 108.884, and it’s strictly following a narrow trading range of 108.650 – 107.250. The technical side of USD/JPY is mostly the same as the USD/JPY’s pair continues to find support around 108.700. On the 4 hour timeframe, the Japanese pair has closed a bullish engulfing candle over 50 EMA, which is suggesting odds of more buying in the USD/JPY currency pair. The USD/JPY may exhibit further room for buying until 109.680, and violation of this can open more room for buying until 110.500 and 111.450. On the lower side, support continues to hold around 108.750. Let’s look for buying traders over 108.850 today.  

All the best for today! 

Categories
Crypto Market Analysis

Daily Crypto Review, Apr 9 – BCH surges after halving, BSV outperforming

The cryptocurrency market had a slow day, losing a bit of its value while it consolidated. Bitcoin is currently trading for $7,289, which represents a decrease of 0.77% on the day. Meanwhile, Ethereum lost 1.35% on the day, while XRP lost 0.76%.

Seele took the position of today’s most prominent daily gainer, with gains of 20.9%. CyberVein lost 12.12% on the day, making it the most prominent daily loser.

Bitcoin’s stayed at the same place dominance-wise. Its value is now 64.25%, which represents a 0.01% difference to the upside when compared to yesterday.

The cryptocurrency market capitalization did not change much in the past 24 hours. Its current value is $208.49 billion. This value represents a decrease of $0.85 billion when compared to the value it had yesterday.

What happened in the past 24 hours

The Cardano Foundation made an announcement that they will be partnering with the South African National Blockchain Alliance. This partnership aims to explore further ways to strengthen (mostly blockchain) technology’s adoption all throughout South Africa.

According to the official announcement, Cardano will be using blockchain technology to boost socio-economic growth throughout South Africa.

Honorable mention

BCH/BSV

Bitcoin Cash completed its first block reward halving on Wednesday, Apr 9. The halving created a price surge, with the coin gaining 11.2% on the day.

Bitcoin SV made a bit of a stronger move, with its block halving on schedule for Friday, Apr 10. However, the cryptocurrency gained 19.4% in the same time period as Bitcoin Cash and outperformed it despite not completing the block reward halving yet.

_______________________________________________________________________

Technical analysis

_______________________________________________________________________

Bitcoin

Bitcoin has spent the day consolidating. The volume was low and the price action was almost non-existent. The largest cryptocurrency by market cap is showing that it will take a lot of work to get past $7,420, as it endured every attempt of breaking it so far (and there were many). This is a perfect time for traders to use their ranging market strategies.


Bitcoin’s volume is significantly lower than yesterday, while its RSI dropped to 60

Key levels to the upside                    Key levels to the downside

1: $7,420                                           1: $7,085

2: $7,750                                           2: $6,850

3: $8,000                                            3: $6,640


Ethereum

Ethereum spent the past 24 hours retesting the $168 support level that it went above during the most recent price surge. The support level held up well, and ETH is currently secure above it. As the retesting is still in play, we can’t rule out the option of price falling below the $168 level and retesting $158. However, there probably won’t be any chance of the price going down further due to the lack of volume.


Ethereum’s volume gradually reduced to extremely low levels, while its RSI went back down to 64.

Key levels to the upside                    Key levels to the downside

1: $178.6                                             1: $168

2: $185                                              2: $158 

3: $193.6                                            3: $147.5


Ripple

XRP fought to stay between a tight range of $0.2 and $0.205. However, while the $0.2 level did get recognized, it did not pose a big threat to the price. After a while, bulls and bears moved almost freely throughout the 0.2 zone. The price is currently just below $0.2. There are no indications of the direction of the movement yet. Still, with the volume at this low level, the chance of going above $0.205 or below $0.19 is almost non-existent.


XRP’s RSI level dropped from the oversold territory and is currently at 61.

Key levels to the upside                    Key levels to the downside

1: $0.2                                                1: $0.19

2: $0.205                                            2: $0.165

3: $0.227                                             3: $0.147

Categories
Forex Course

96. Trading Breakouts using Pivot Points

-Introduction

We know that pivot points are no different from the typical support and resistance levels. We also saw how these levels were respected when trading a ranging market. But, could it used to trade breakouts? Let’s find out in this lesson.

Just like your normal Support and Resistance, the pivot levels don’t hold forever. At one point or the other, the price breaks out from these levels. In our range strategy, we always hit buy at the support and sell at the resistance. But there are times the market breaks from these levels and stops us out. When such things happen, we can develop another plan ready for the same and take advantage of it.

In the trading community, there are two types of traders: aggressive traders and conservative traders. And the approach to trade breakouts is different for both. So, we made two strategies to benefit the aggressive as well as the conservative traders.

The Pivot Points Breakout Strategy

Doing it the Aggressive way

The aggressive approach to trade breakouts is very simple. The strategy for such traders is to trigger the trade when the price breaks above resistance or below the support. The logic to this is that the resistance/support which was supposed to hold is now not being respected. It means that the opposite party is showing more strength. Hence, we will also be following the stronger side.

Aggressive traders are the ones to catch the initial move of the breakout. But there is high risk involved in these types of entries.

Trade Example

Below is the chart of GBP/CHF on the 15min timeframe. The pivot points are marked as shown. Initially, we can see that the price broke below S1 support. Here, aggressive traders can get in for a sell after the close of the candle. Later, the price continued to fall down and ended up breaking the S2 support as well. This could be another entry for the aggressive breakout traders.

Placements

As aggressive traders, it is important to have good risk management on the trades. The most basic necessity is the placement of stop-loss and take-profit orders. For the above trades, traders can keep the stop-loss just above the level they entered the trade. However, it would be better to place the stop-loss much higher than that level because we can stay safe from spikes. And a typical TP would be the next Support level. Refer to the above chart to get better clarity on it.

Doing it the Conservative way

The conservative approach is more of a safe approach to trade breakouts. According to this strategy, look to enter the trade when the price retests the level after breaking through that level. In trading terms, this is called the ‘role reversal’ concept. This concept simply means the turning of ‘support into resistance’ and ‘resistance into support.’ For example, when the price breaks below the support level, it is not a ‘support’ anymore; but is now ‘resistance.’ Now, let’s put this into action.

Consider the same chart shown above. We shall be looking if there are opportunities for conservative traders in the same market. In the below chart, we can see that the market broke below the S1. So, now we treat S1 as the resistance and prepare to sell when the price retraces to the S1 level. Similarly, we can enter for a sell when the price breaks below S2 and retests back to S2.

When it comes to the placement of stop-loss and take-profit, one can follow the same approach, as explained in the aggressive traders’ placement.

This brings us to the end of this lesson. Note that the above strategy is only to get an understanding of how to trade breakouts using pivot points. It is highly recommended to apply other technical tools to have more odds in your favor. Cheers.

[wp_quiz id=”69720″]