-Stochastic Oscillator, Friend or Foe ?
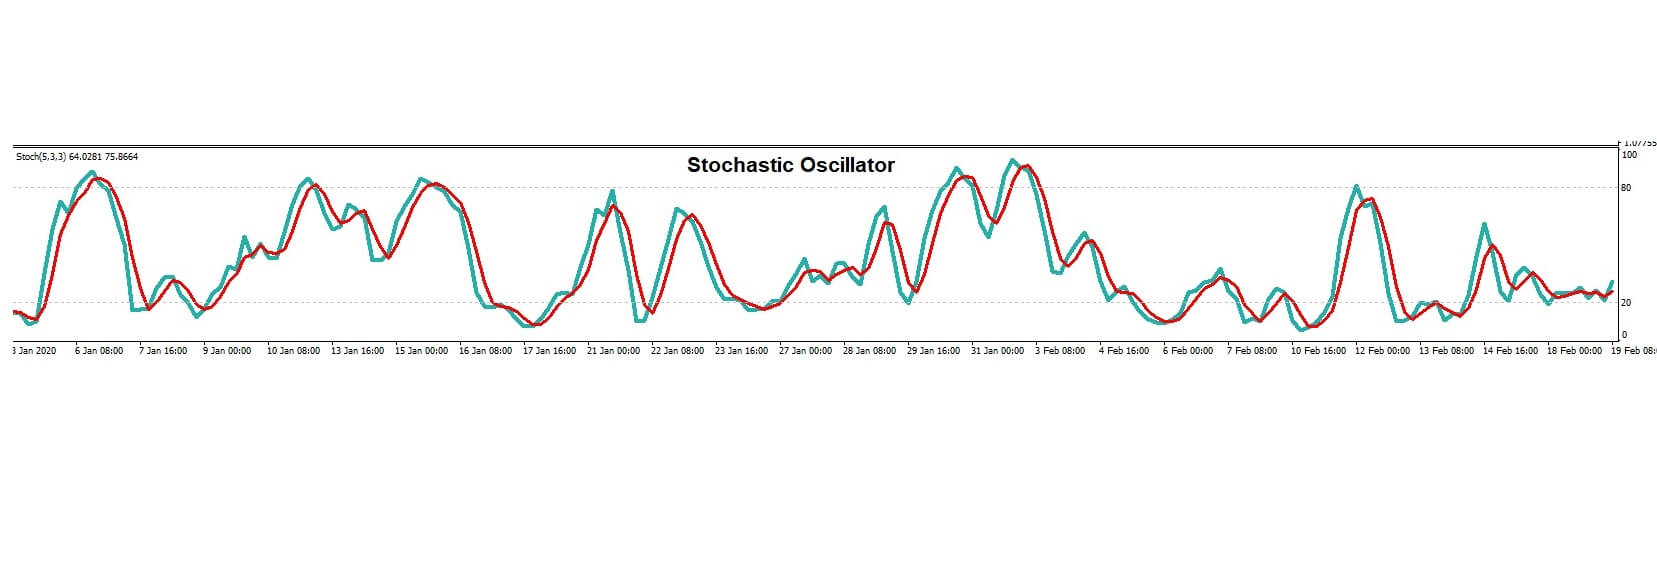
Insert A, The stochastic oscillator is used in technical analysis and was invented by George Lane in the late 1950s. The indicator measures the opening price of a financially traded asset and compares it to the closing price over a predetermined period of time. Because the data uses historical calculations and plots them in the form of two moving averages, the k-line, and the D-line, this is considered to be a lagging momentum indicator. The actual mathematical complications for the tool are very complex, and we will not be going into them in this session. The basic and generally widely used settings for the stochastic oscillator will automatically be set by your broker at 5 3 3. More experienced Traders are able to adjust the settings to their preference. However, we will be leaving them at the standard settings, and that way, we will be very much going with the crowd as it were in this example.
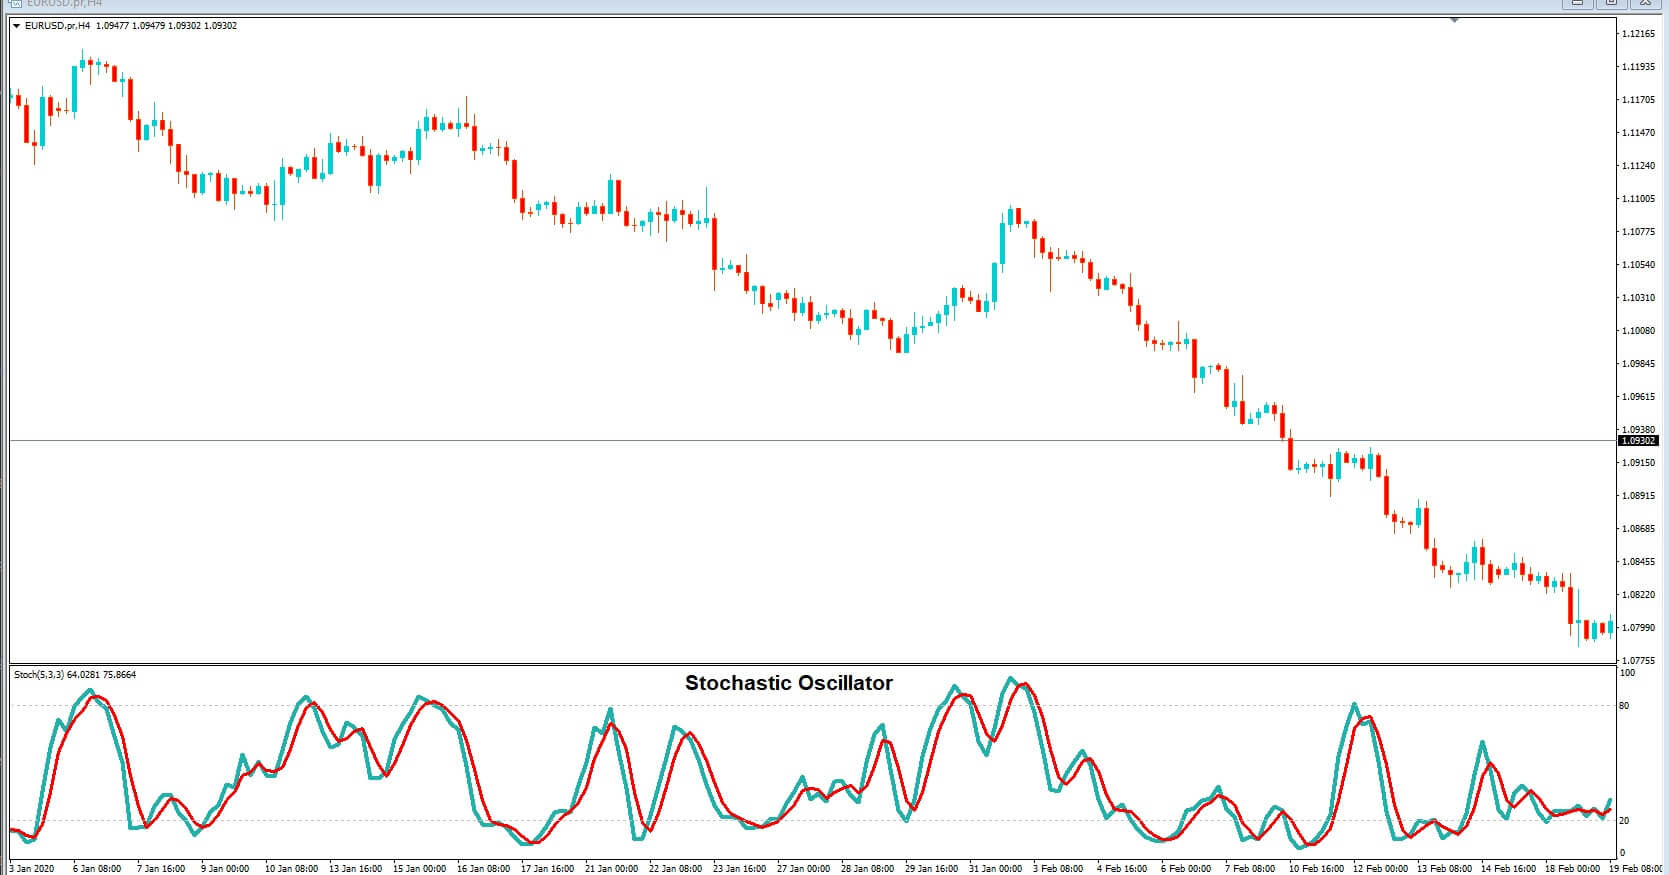
Insert B, The stochastic oscillator is widely used by professional traders and will be offered on almost every trading platform. It can simply be dragged straight onto your trading chart and will sit at the bottom, as in our example.
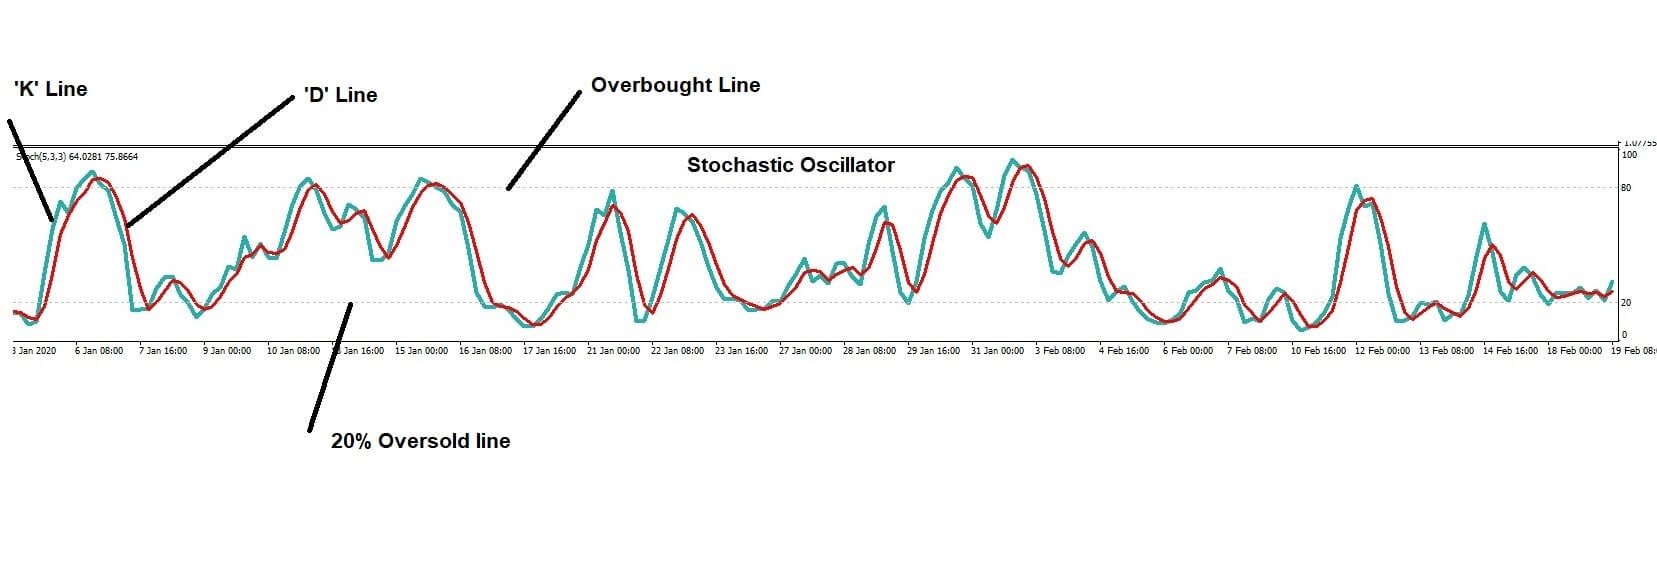
Insert C: The basic principle is that the Kline which is calculated over a slightly longer time period than the D line and when both of these lines are above the 80% Overbought line, the currency pair is considered to be overbought, and when the K and D lines are below the 20 % oversold line, the pair is said to be oversold.
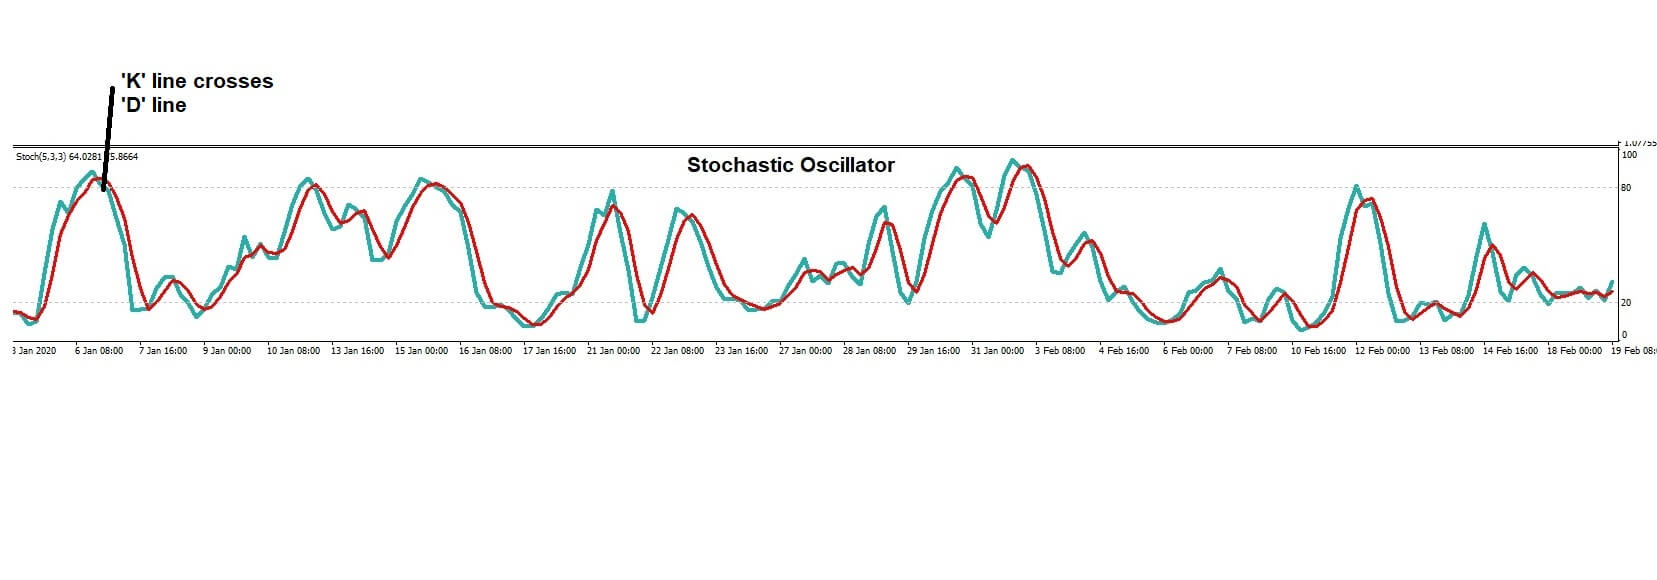
Insert D, traders look for the ‘k’ and D lines to have been above the 80% line in the overbought area and then dipped below the 80% line where the K-line has crossed over the d line, at which point they will go short on the currency pair.
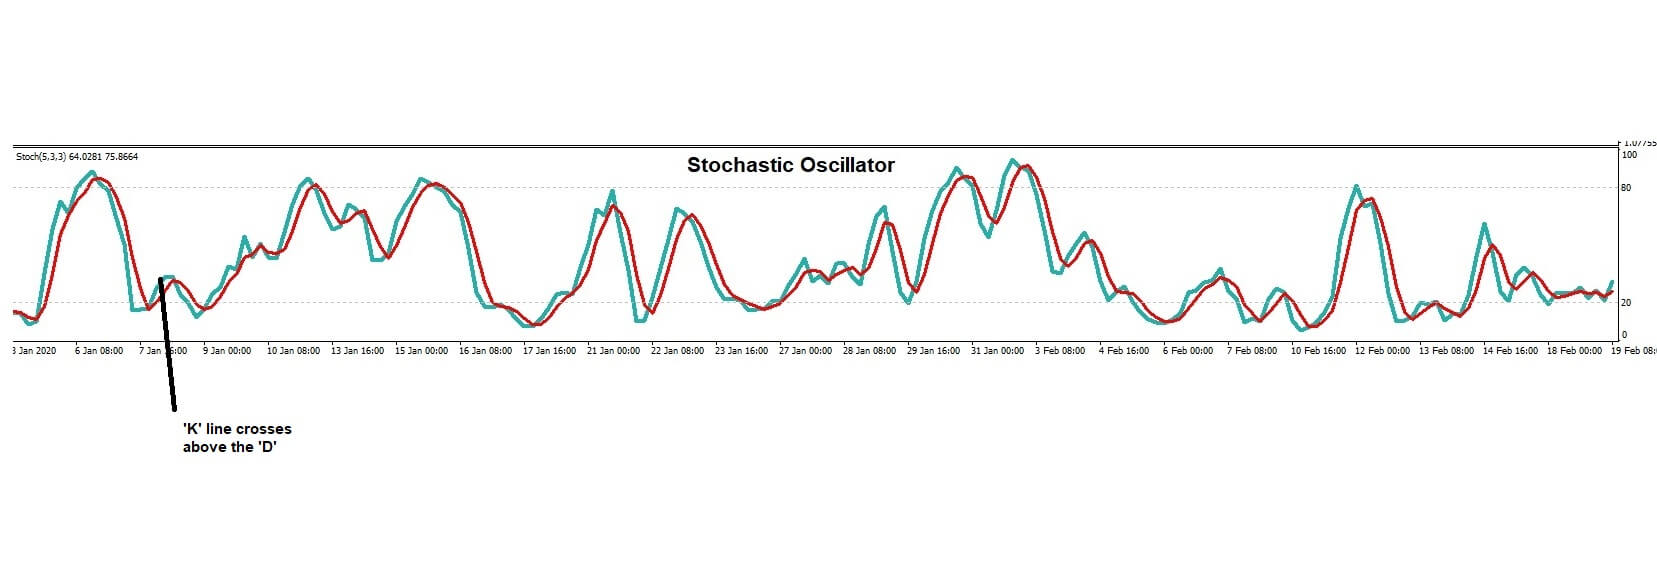
Insert E, Conversely, traders look for the K and D lines to have been below the 20% oversold line, and where the K-line has crossed above the D-line, they use this as a signal to buy a currency pair.
One of the biggest areas that new Traders falling into a trap is that they take the stochastic signal has been gospel and trade it accordingly and then wonder why they are losing money.
And so, is the stochastic indicator a friend or foe? First, we have to remember that all indicators, and especially lagging indicators, are just that: indicators. They are an indication that the market, in this example, might be overbought and ready to turn lower, or that the market is oversold and it might be ready to move higher.
Let’s drill down a little bit more by going back to our 4-hour chart of the EURUSD pair. The longer the time frame, the more likely, the longer trend will become apparent, and that’s where the more pips will be realized, and of course, that translates into more money-making opportunities.
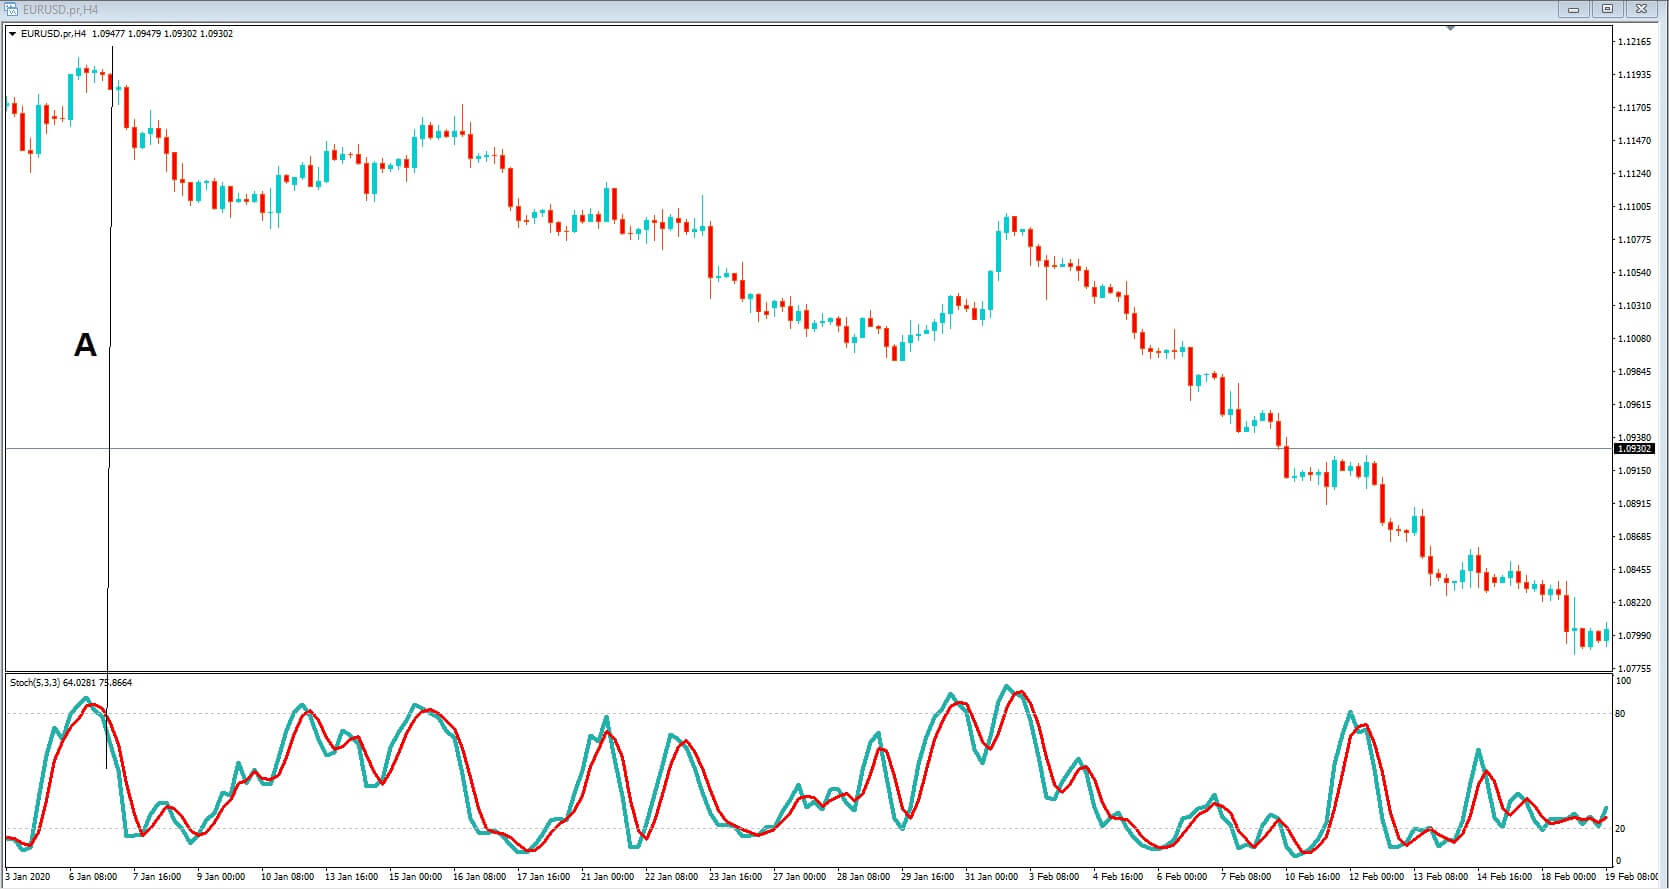
Insert F: By drawing a vertical line at position A, we can follow that down and see that the stochastic k and D lines have both moved above the 80% overbought area, and that’s the k-line has crossed below the d line, and both lines have moved below the 80% overbought line. This is represented by the price action which has been falling.
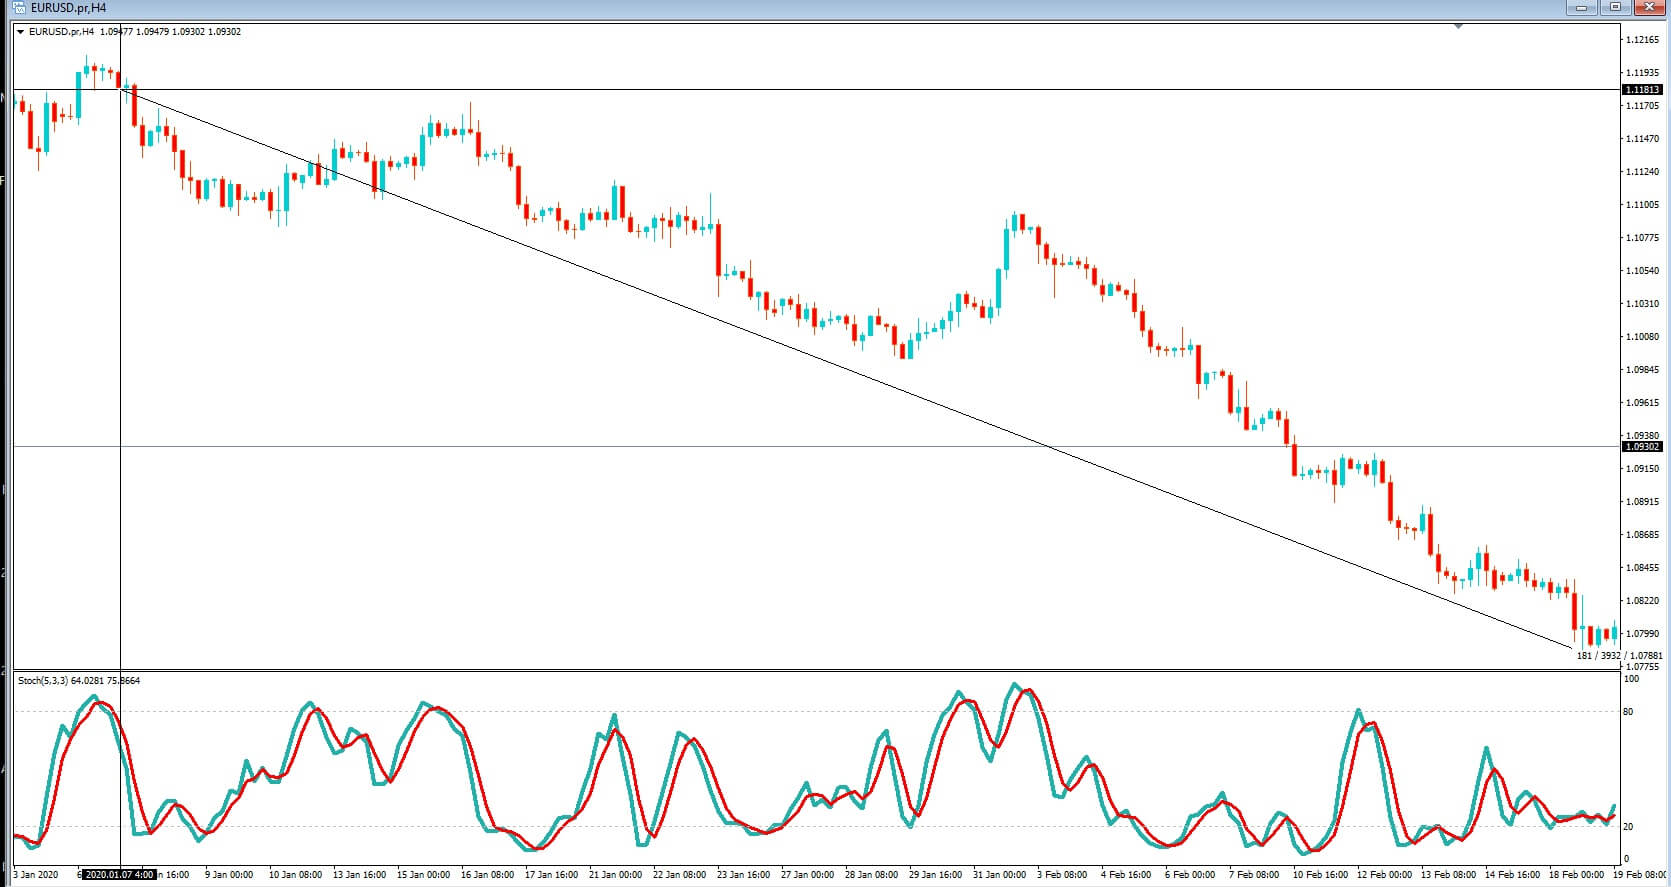
Insert G: Traders who sold the pair on this signal and stayed in the trade would have seen an overall pip movement in their favor of 390 pips, which is huge. The stochastic was a true friend at this point.
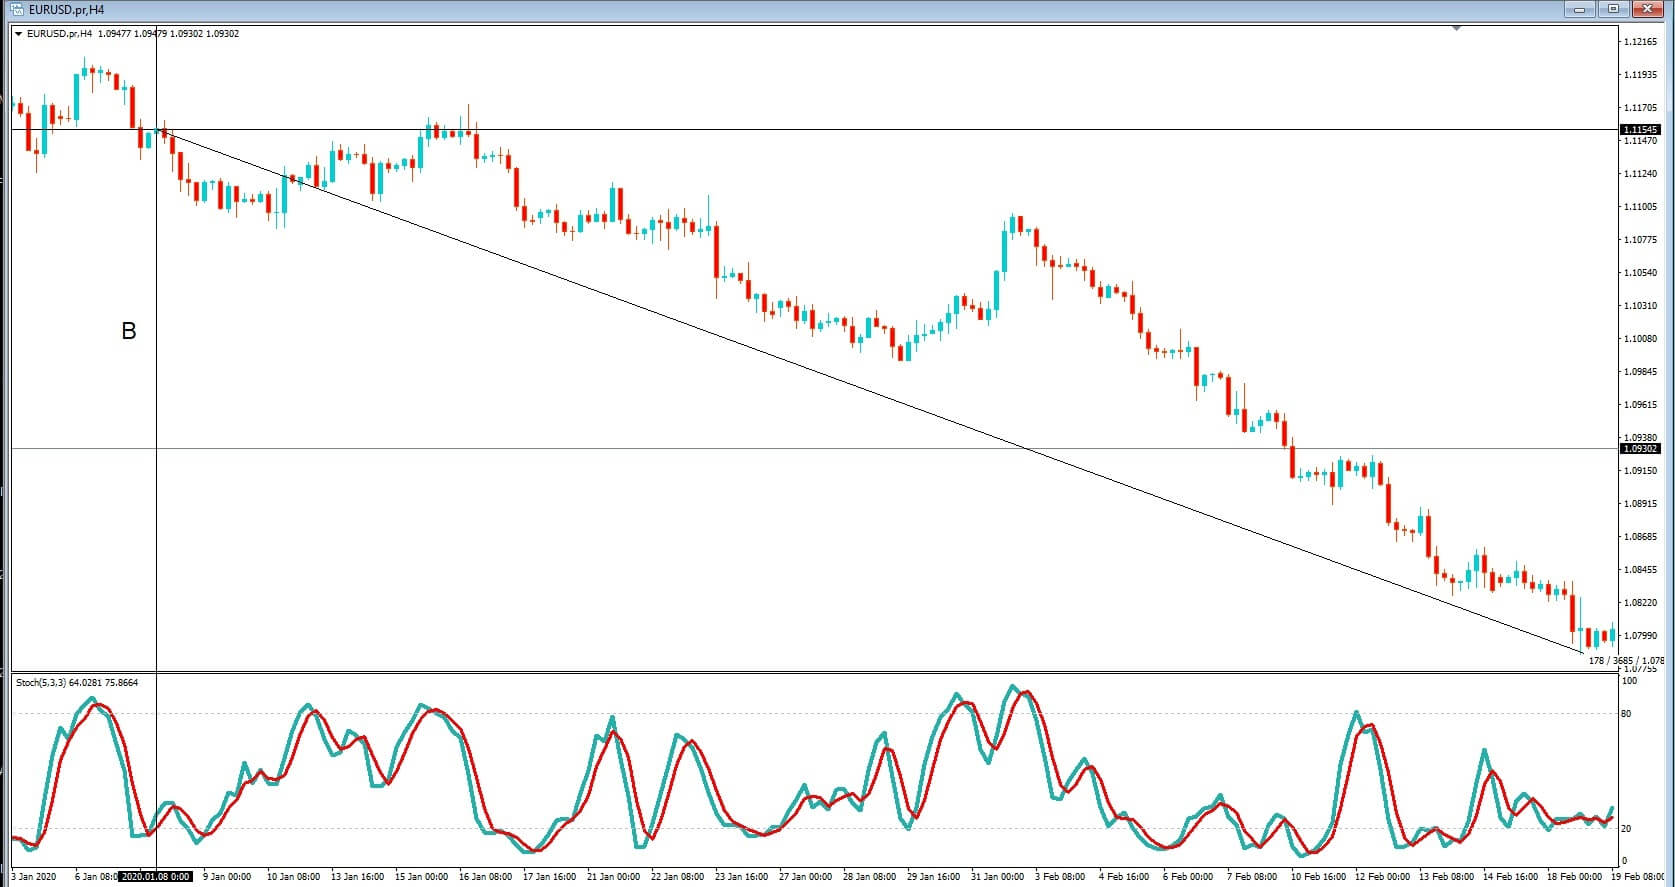
Insert H, However traders who abandoned the trade as soon as the stochastic became oversold, as per the example on your screen now at position B, because the K & D lines in the oversold area under the 20% line and where the k-line has crossed above the d line, they would have been extremely disappointed as the market continued to trend lower. While they would have made around 40 pips, they would have lost out on 350.
But one of the biggest problems we find with new traders is that they will buy a currency pair in a situation like this, where their trade goes immediately against them and falls
hitting them with losses of over 350 pics on this occasion because they have not supported their trade with a stop loss, due to poor risk management. In this example, the stochastic indicator would have been a foe.
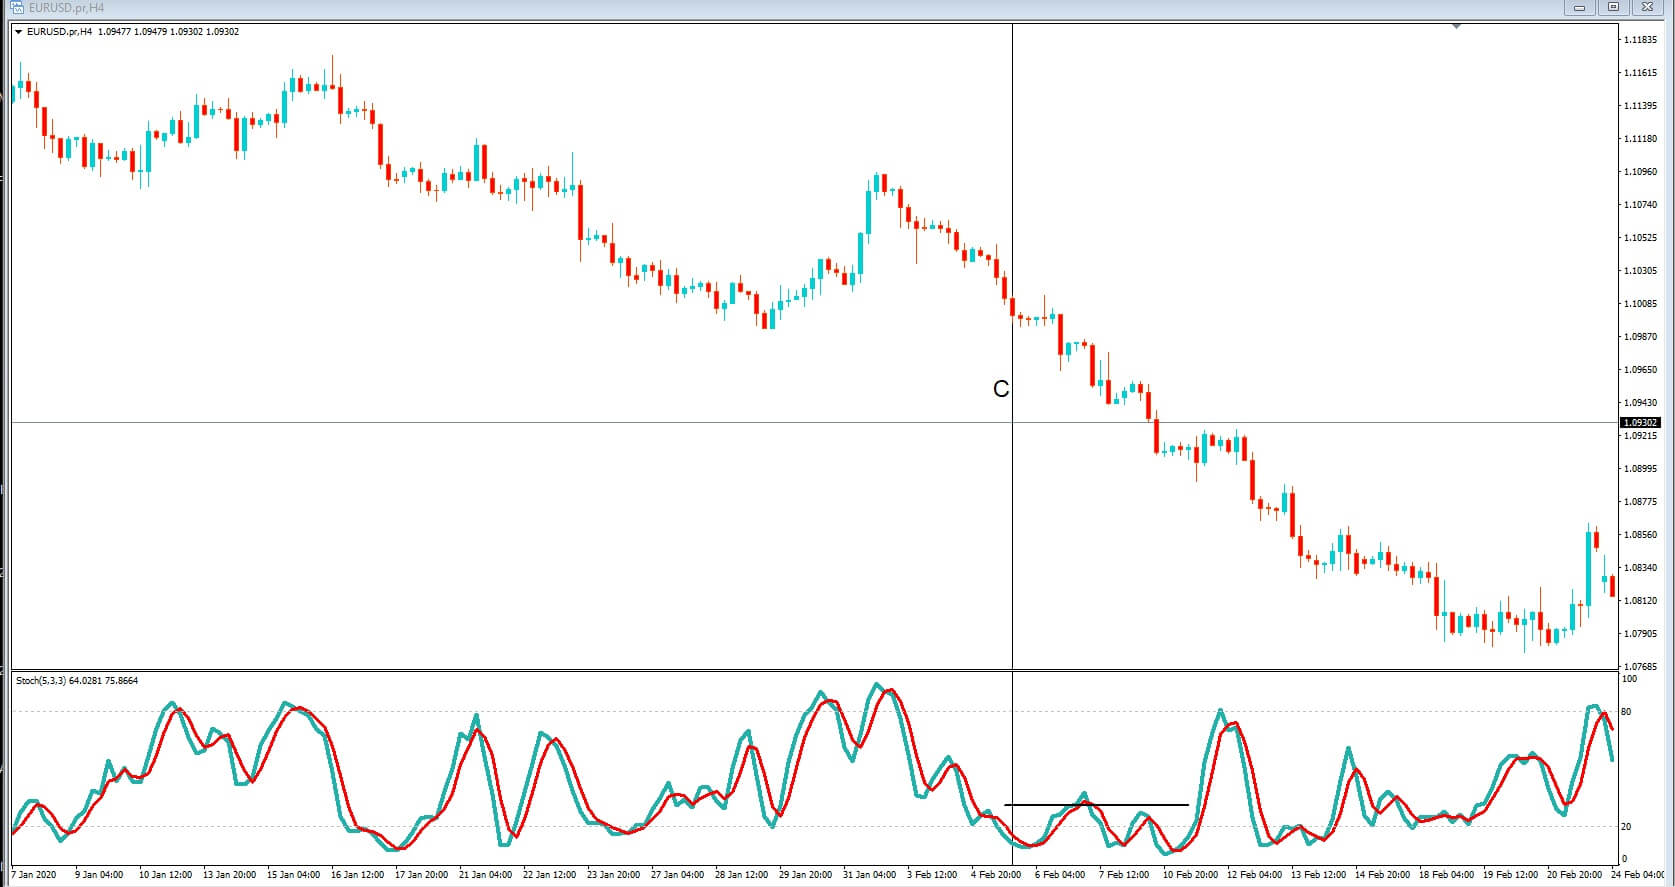
Insert I, Let’s return to our chart at position C, we can see that the stochastic is oversold, and more importantly, it is staying or remaining very close to the oversold 20% line as the market trends for lower.
And so the lesson here is that if the market is overbought, it does not necessarily mean that it will automatically fall, and which is clear from how example today if a pear is oversold, it does not necessarily mean that they will turn around and move higher.
So remember indicators are simply an indication that something might happen and not that it definitely will happen. Incorporate good risk management and money protecting tools such as stop losses in your trading plan. Learn to use price action as the definitive trendsetter, while incorporating other technical indicators to more reliably established entry points for your trades. And what is most important, which I’m sure you’ve heard many times, is to let the trend be your friend and I never trade against it.


