Recurring shapes and patterns Part 2 of 2
Continuing with our theme of looking for recurring shapes and patterns in technical analysis, we now turn our attention to example A, which is a one-hour chart of the GBPUSD pair.
Example A
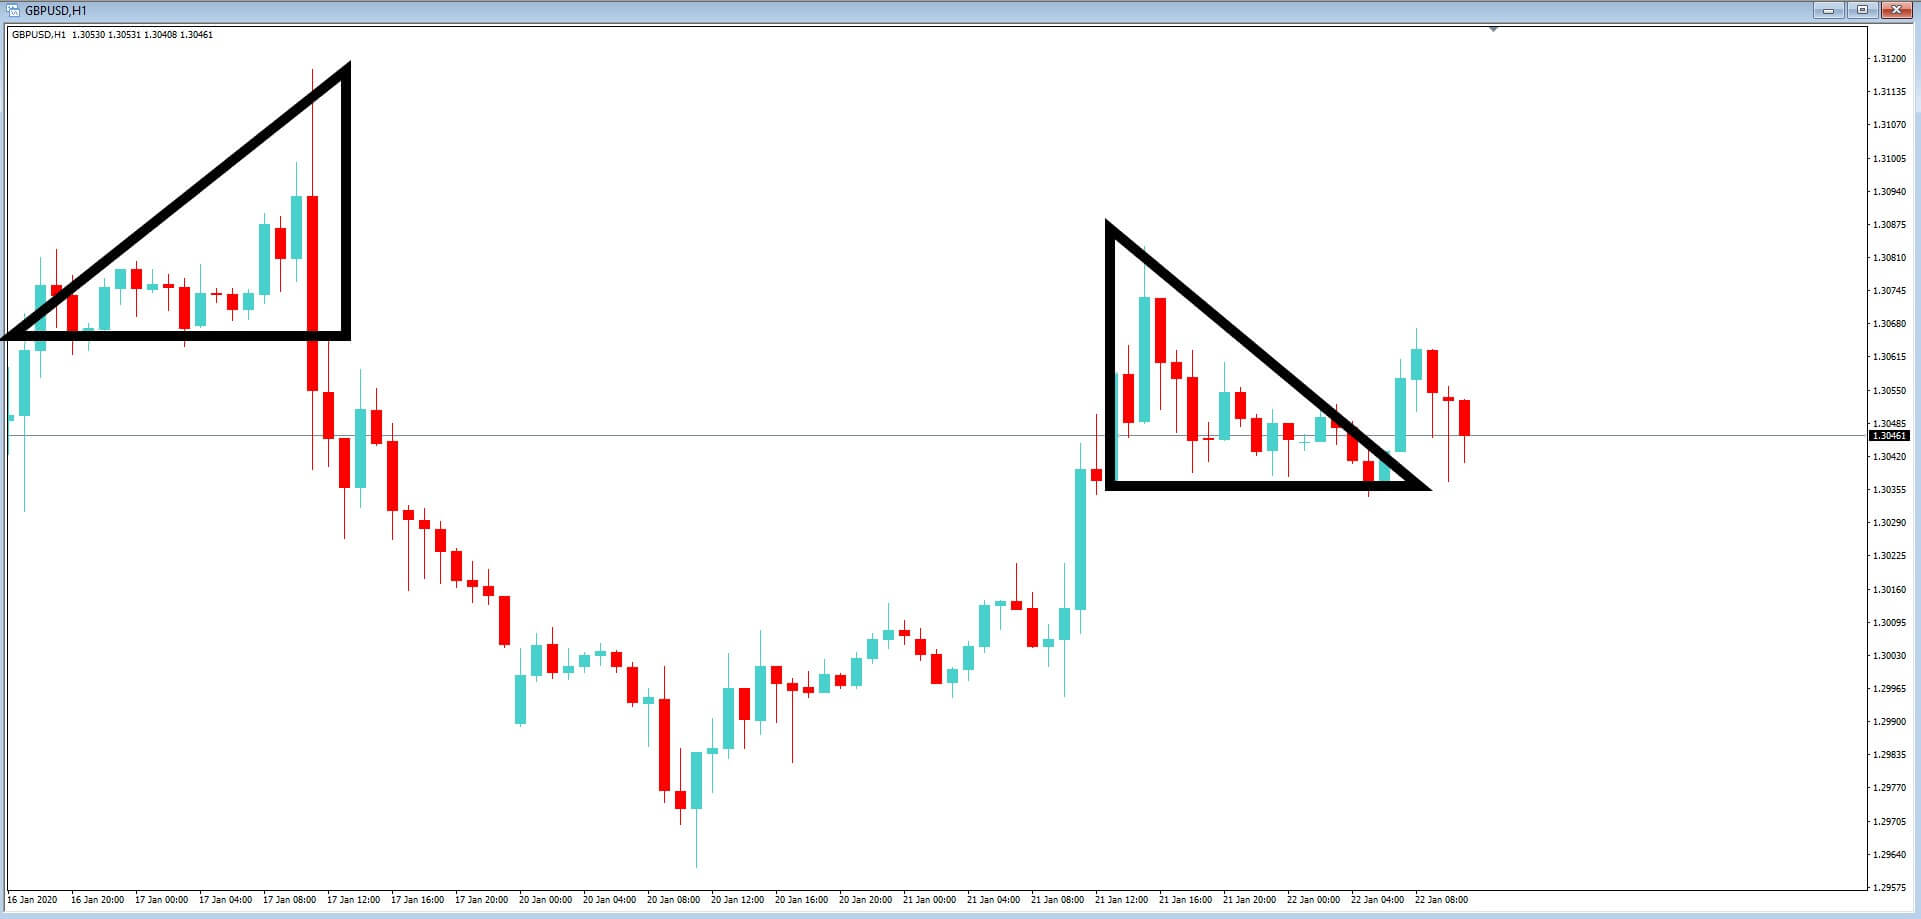
Here we can see price action without technical indicators, but where we have drawn on two wedge shapes on to our chart.
The wedge-shaped pattern on the left began when price action was fairly muted but began to become more volatile throughout the period, with the bottom of the wedge holding firm as an area of support. Only when the ascending area of resistance in the wedge shape is pierced at the top, as volatility increases, do we see the pair come back down and breach through the area of support, offering a pullback for the bears.
To the right of the screen, we have the opposite effect where, after a period of volatility within the wedge shape, price action becomes more muted as it falls down to the area of support — this time when price action becomes contracted due to consolidation within the market. Price action rejects the support line and exits the wedge shape and where the bulls traders have hold of the action.
Example B
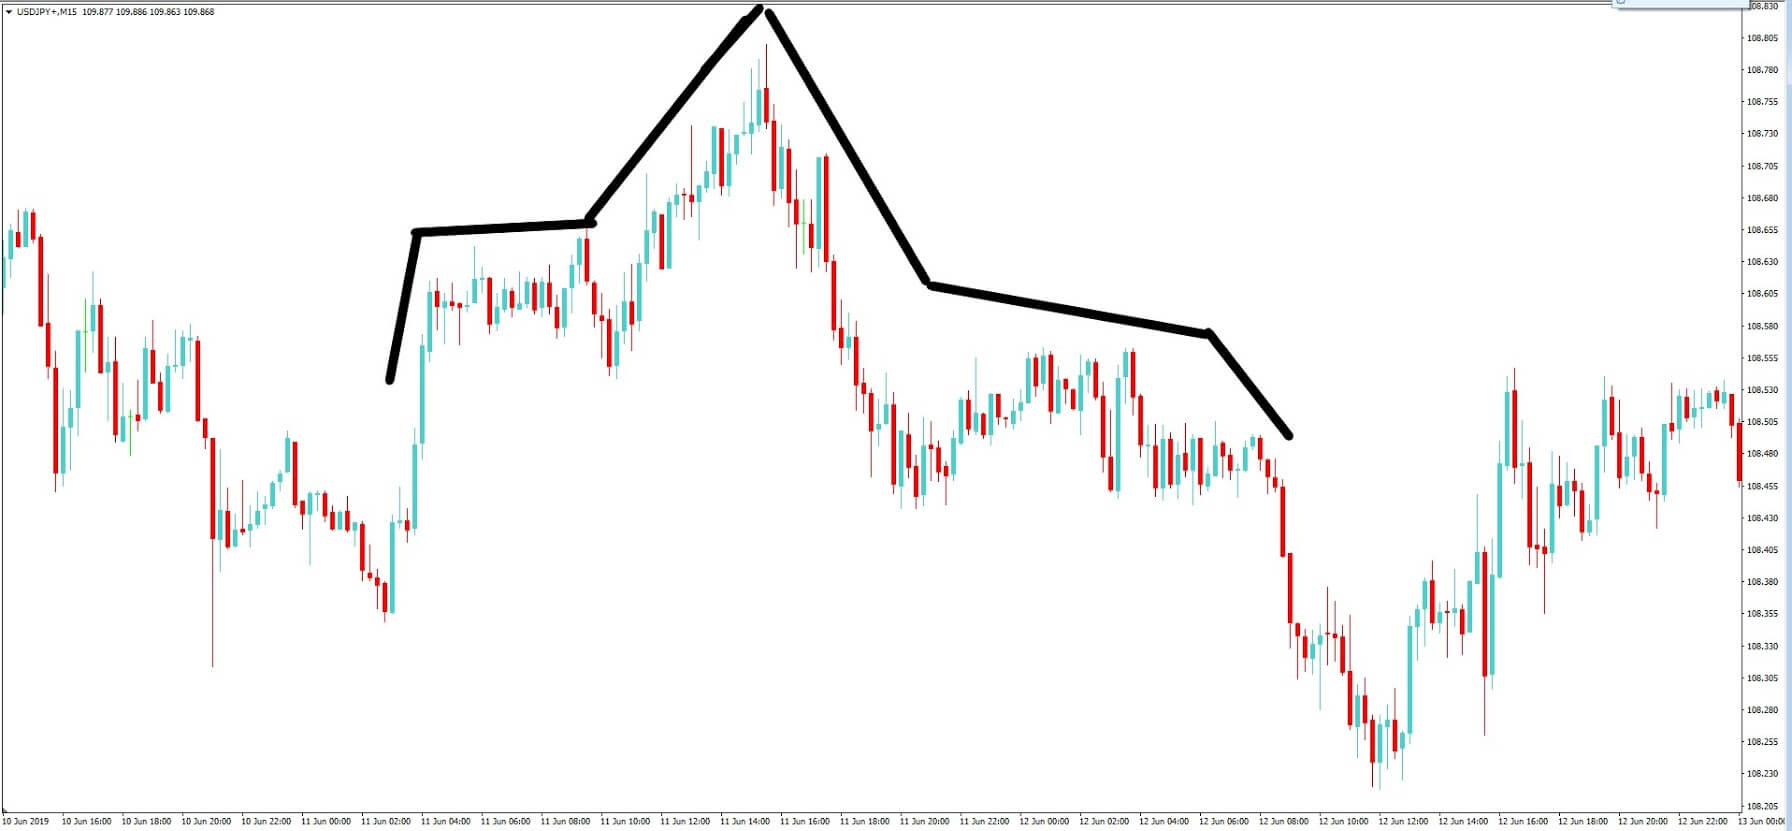
Example B is a 15-minute chart of the USDJPY pair. This is a classic head and shoulders shape. After a period of consolidation, which forms the basis of the left shoulder, price action is followed by a spike higher, which becomes the head, and where subsequent price action will consolidate by the right shoulder before traders look for a sell-off, which indeed does happen in this case, and is the basis of the right shoulder. Traders are particularly fond of this particular shape and closely look out for it.
Example C
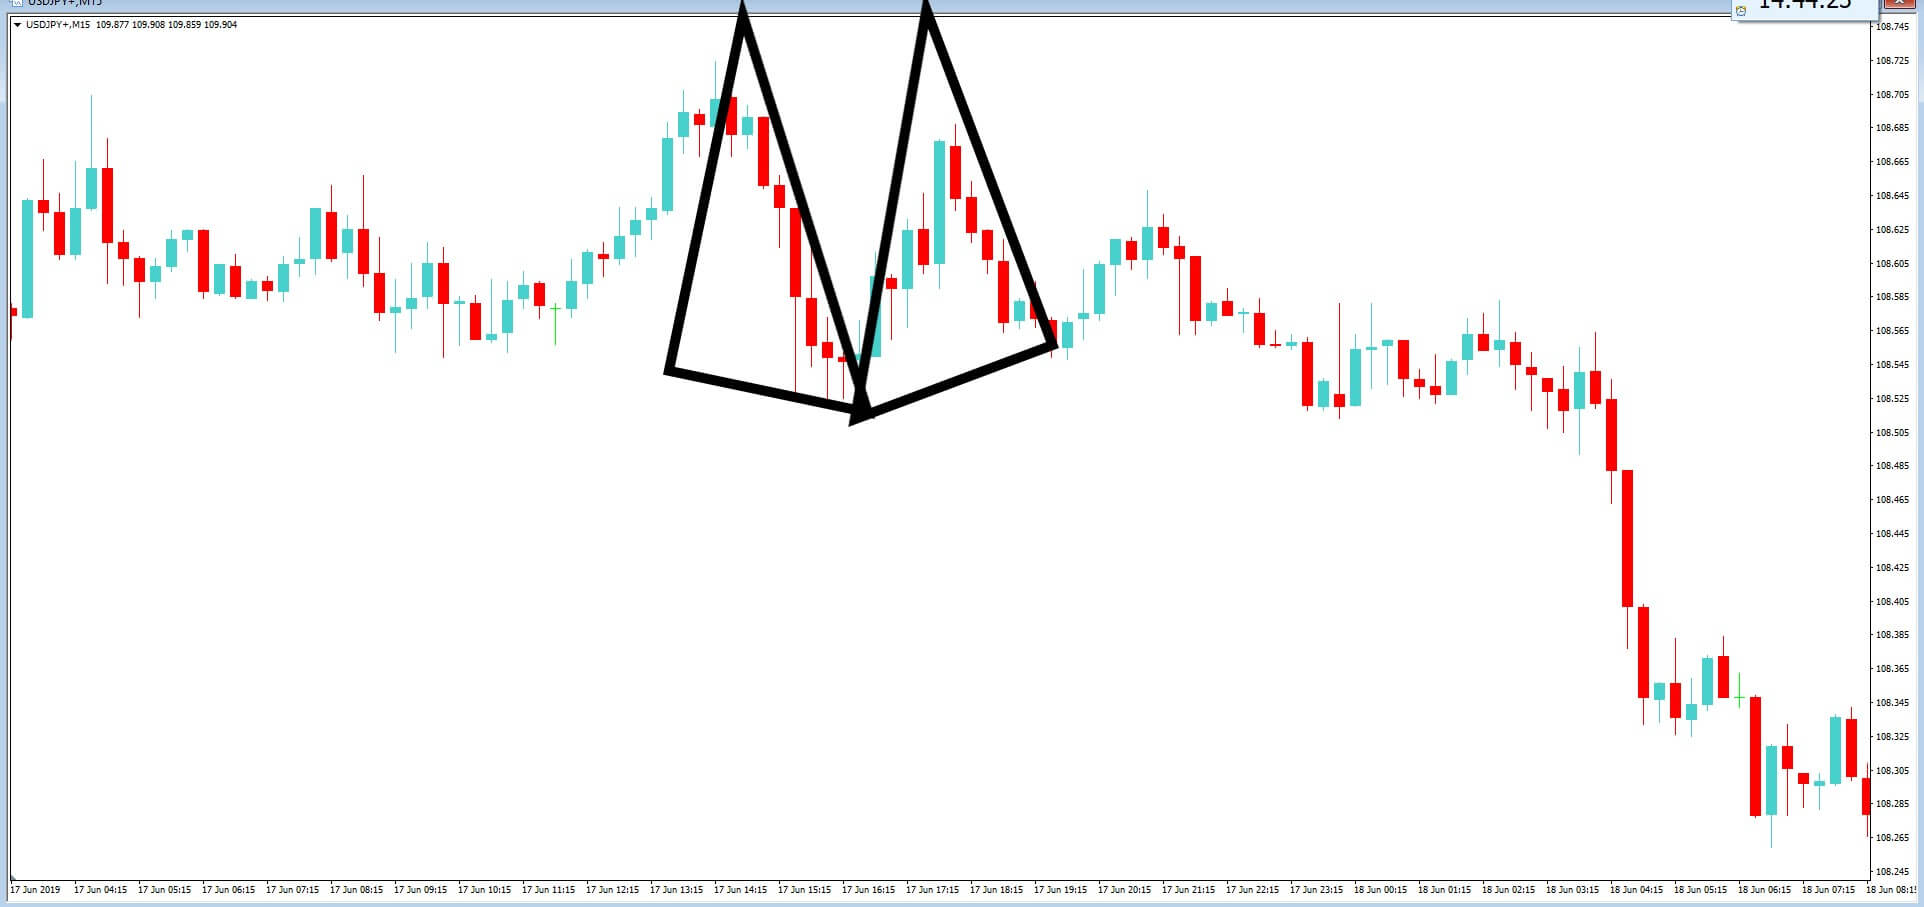
Example C is of the USDJPY 15 minute chart, where we have another chart which is called the butterfly. In these circumstances, we have a sell-off where the price action consolidates at a very narrow section before we see the bulls come in and drive price action back to similar levels as previously.
Example D
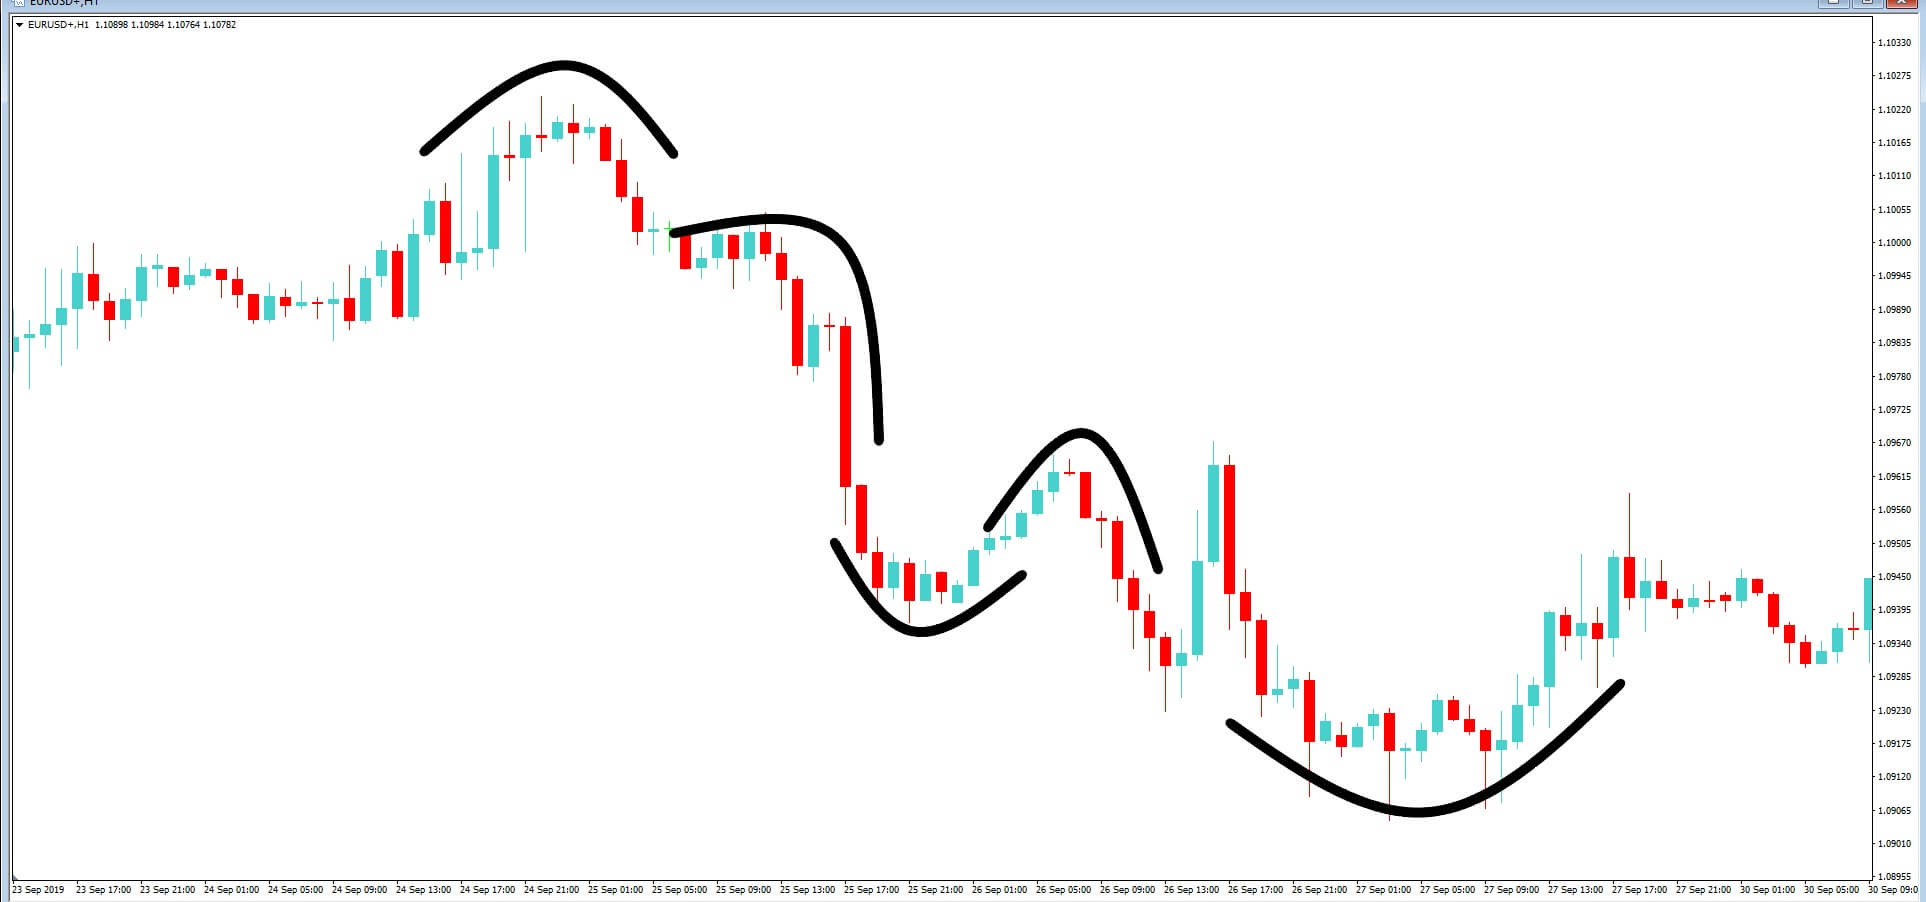
And finally, Example D, which is a one hour chart of the EURUSD pair. And just to re-emphasize from part 1, price action does not move in straight lines. When studied on a chart, it is clear to see that price action will regularly move in waves or half circles.
Keep a look out for the shapes and patterns we have identified in part 1 and part 2, because they are a regularly recurring feature of price action when trading the forex market. When viewed like this, it is much easier to pick out how price action is evolving on your charts.
Use drawing tools that may be available on your chart software and Identify chart patterns and then use them to calculate support and resistance lines and where price action might possibly break out, stall and consolidate, or reverse.