
When is a trend likely to end?
The one common thing that all traders have is the desire to enter a trade that turns into an extended rally and bags an awful lot of pips. In reality, it doesn’t often turn out like that. Trends run out of momentum, price action turns abruptly, sometimes without any clear indication as to why it happened. And Traders become frustrated with the number of stop-outs they have to endure while waiting for the profitable trades to materialize.
So what are the main reasons that trends end?
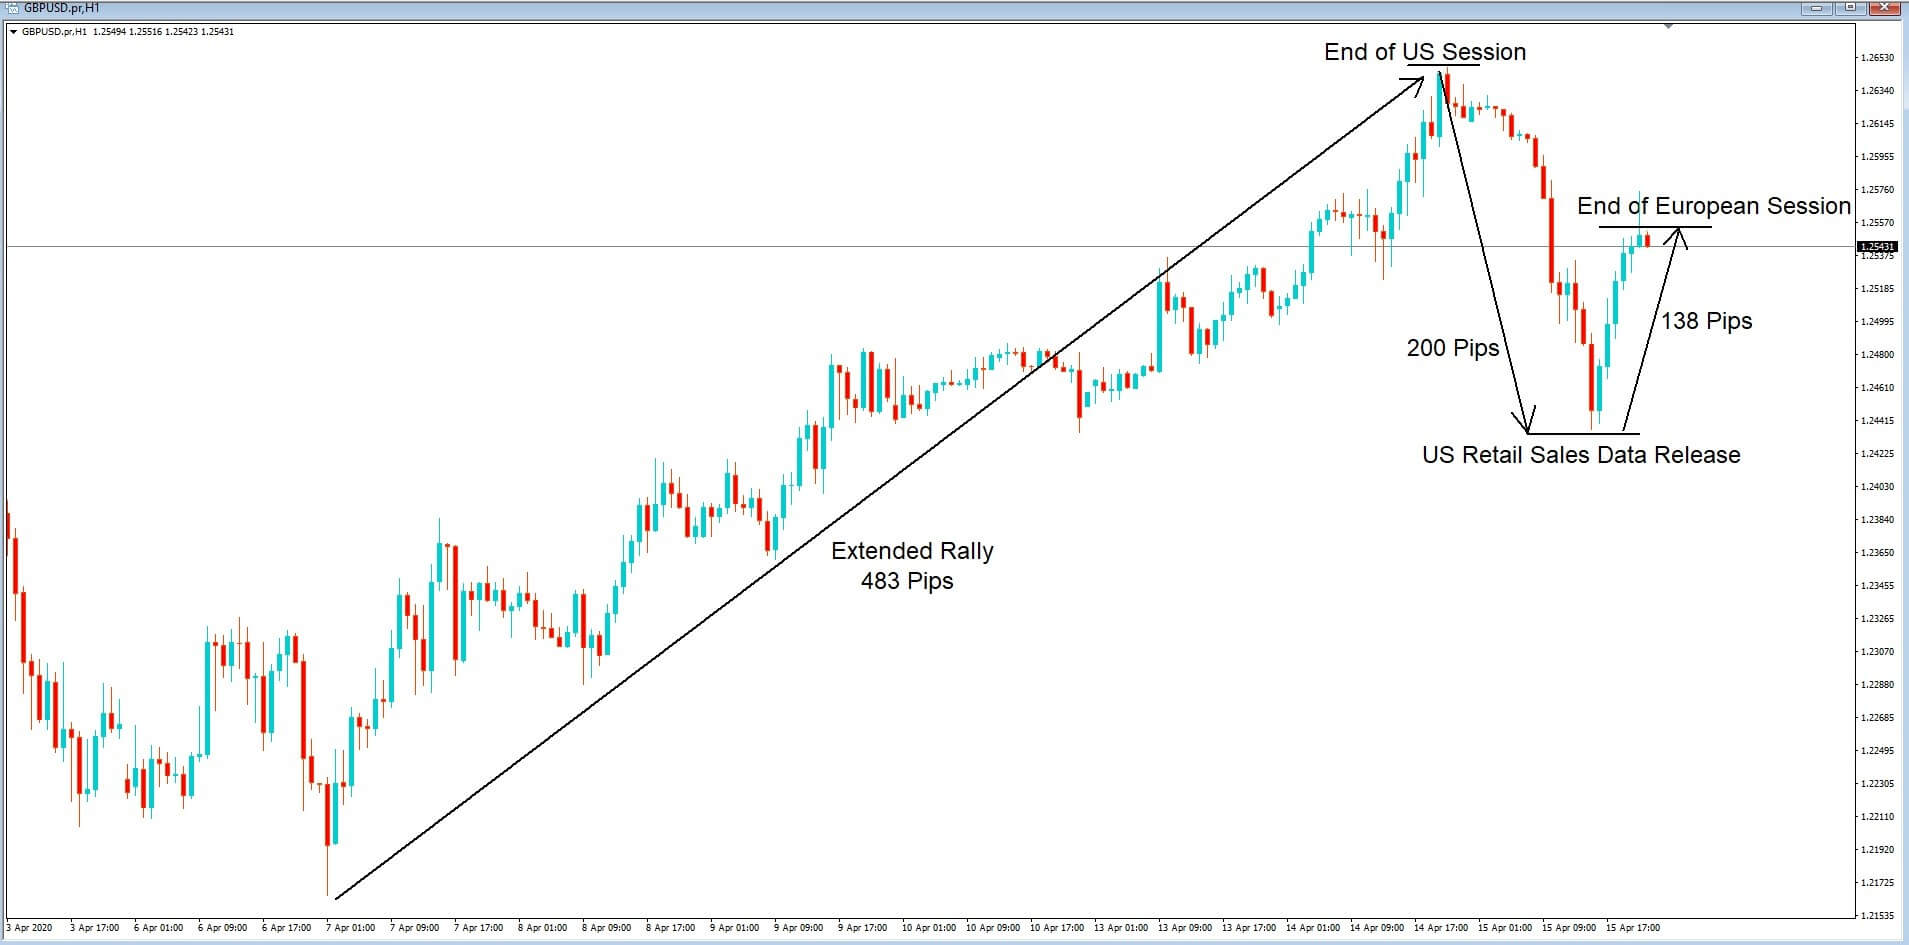
This is a screenshot of the GBPUSD pair on a 1-hour time frame. Firstly we note the extended rally of 483 pips to the upside. The rally ends at the end of the US trading session, Where us Traders will have no doubt taken their profits before the end of the session. And we’re at the start of the Asian session price action begins to fall lower. In fact, it falls 200 pips and where this trend finishes due to the US retail sales economic data figure which was released at 1:30 GMT on the 15th of April and which was – 8.7% month-on-month, and where this very poor number was seen as a fallout from the coronavirus pandemic.
Price action then turns north, where we have another rally to the upside of 138 pips and which runs out of steam at the end of the European session and part way into the US session.
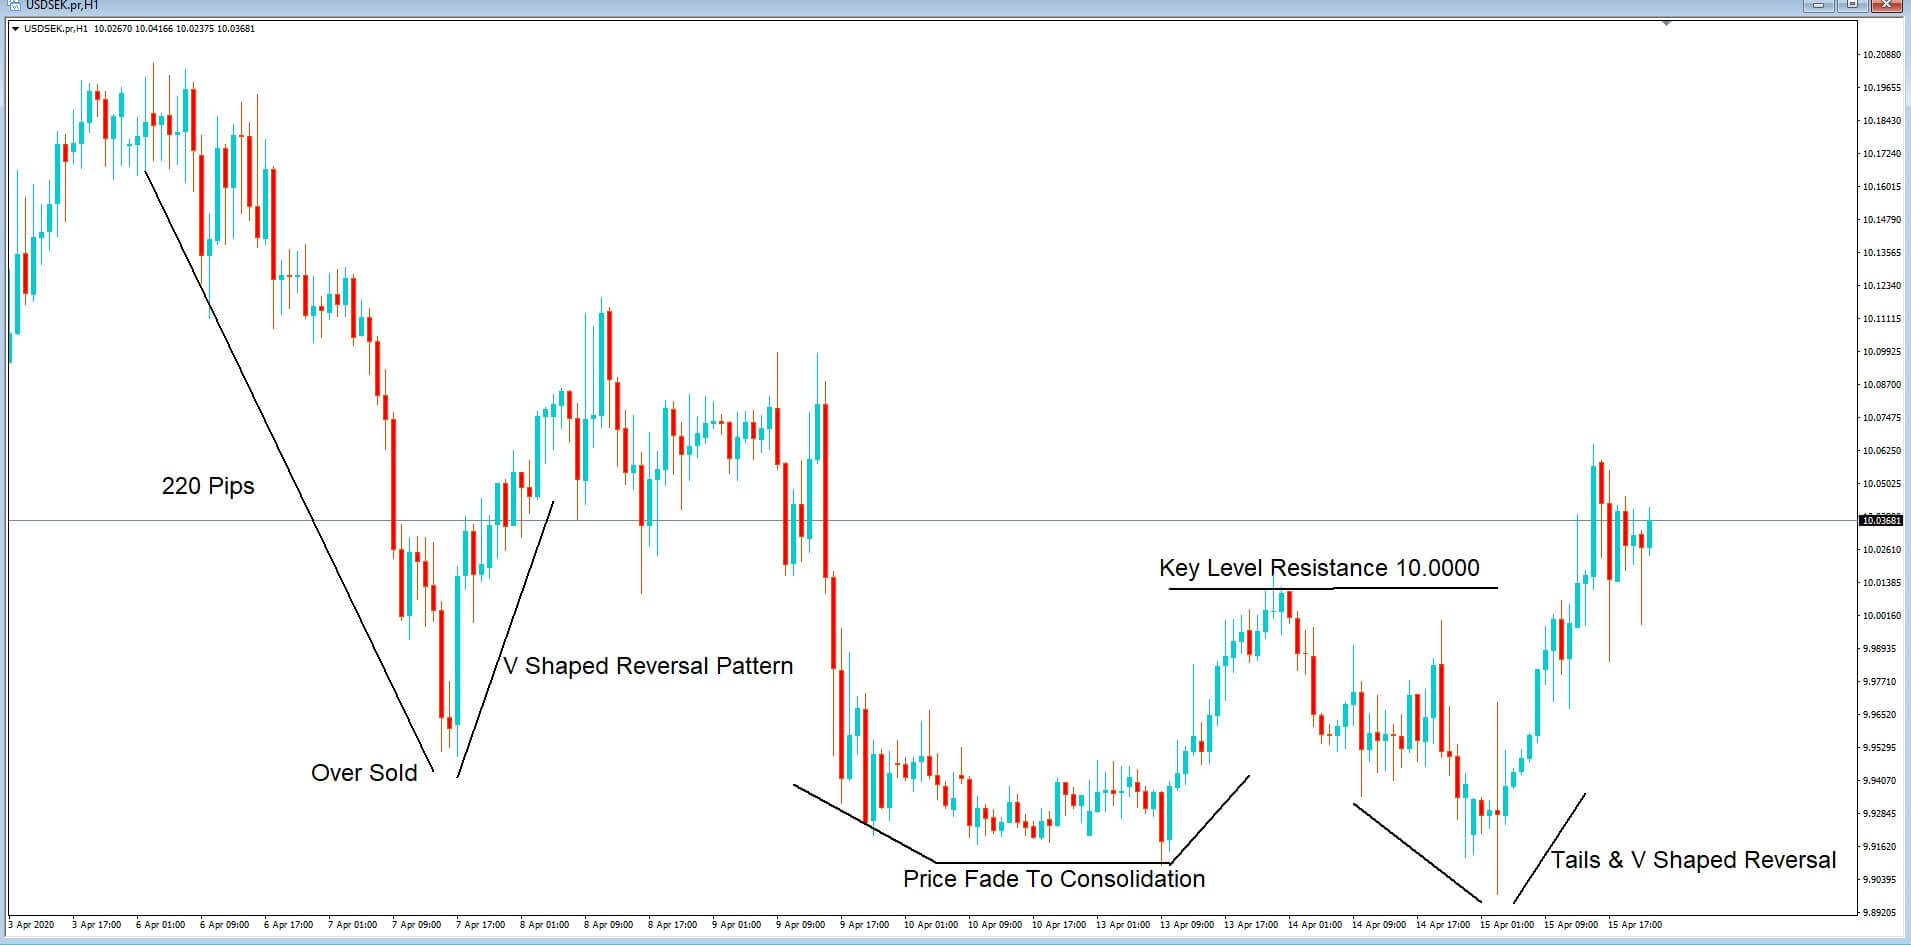 Here we have a 1-hour chart of the US dollar to Swedish Krona, or USDSEK, The first trend we see is a 220 pip move to the downside, which would have been considered as oversold and where price action is reversed in a classic v-shape reversal pattern.
Price action consolidates before falling again and fading into a consolidation phase before we see a bullish trend up to a key level of resistance and where that key level is 10.000.
The next trend is lower, where we can see a lot of tails, both of the bullish and bearish candlesticks, which usually means that there is uncertainty in the market. And eventually, price action moves higher up to and above the previous key level of resistance and where this reversal is a classic v-shape reversal pattern.
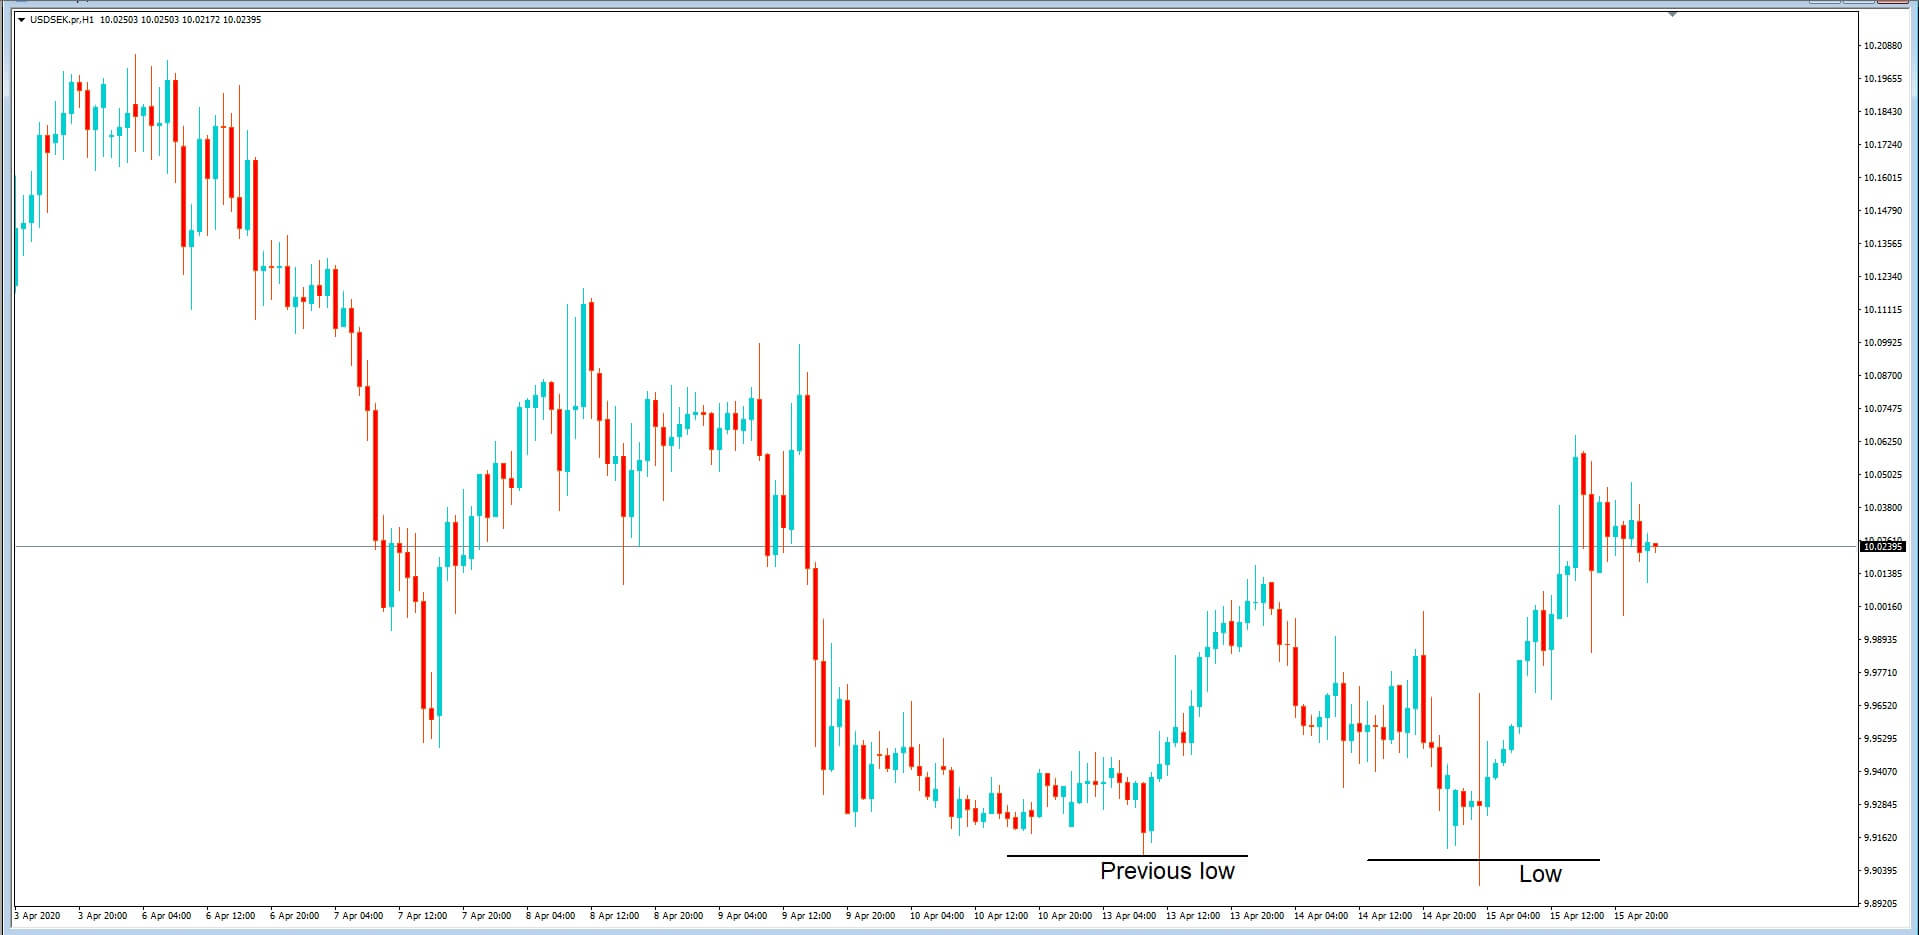
Another common reason for trends to end is areas where price action stalled and reversed previously, such as this low, and previous low, which is also known as a double bottom, or an area of support.
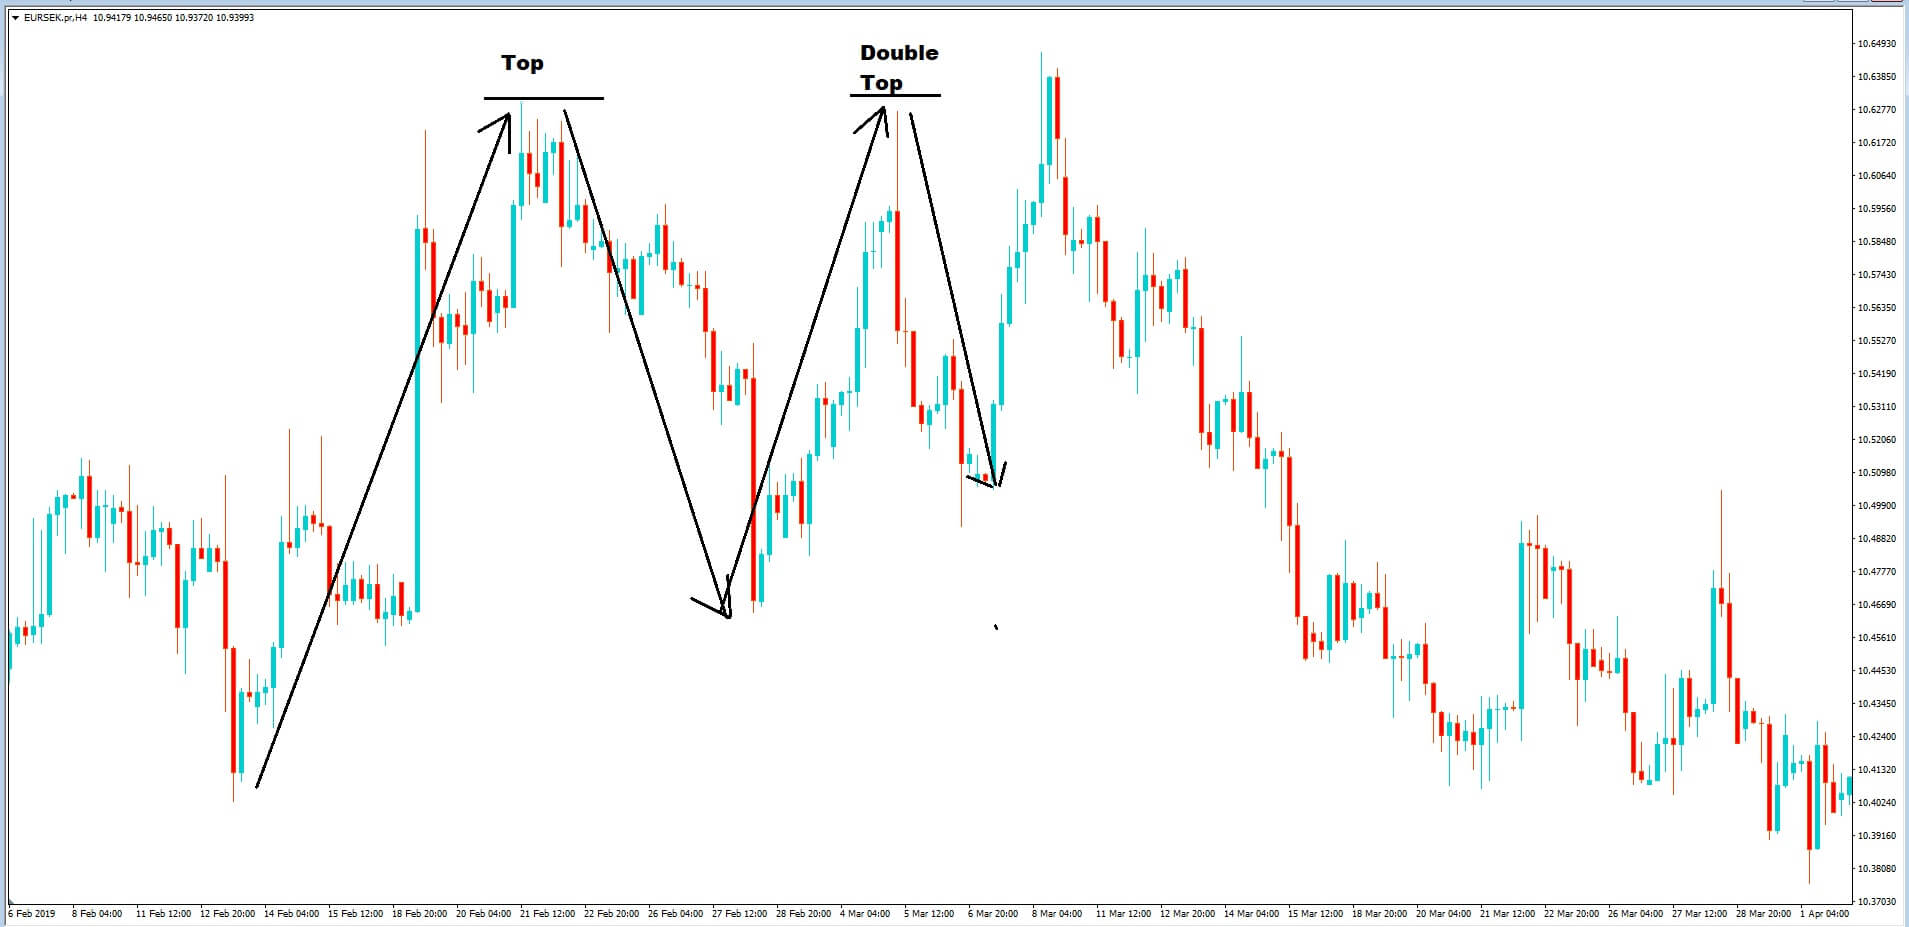
Or areas such as double tops, where traders see that price has previously been an area of resistance and where the price will be rejected multiple times as the area is seen as a barrier.
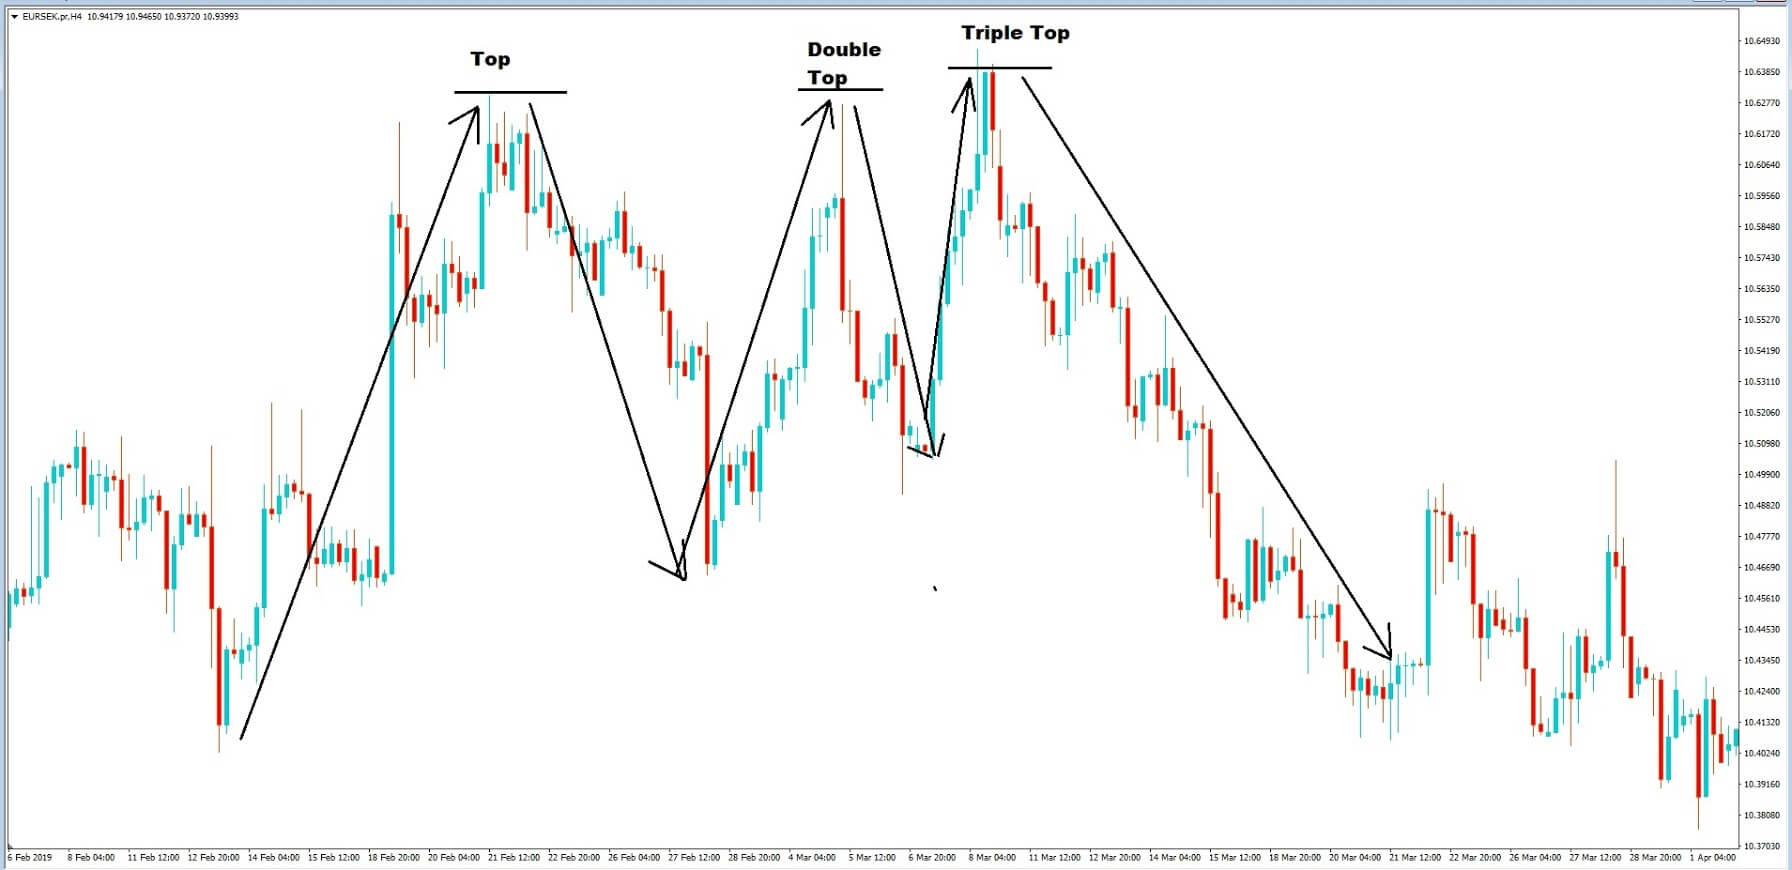
In this example, we can see that the trend is reversed on three occasions at very similar areas of resistance and where after the third move, higher price action aggressively gets sold.
These are the types of trend fade-outs and reversals that you will regularly see on charts. But where else might you expect to see trends end? Well, there are many different reasons that trends end, but the most common reasons are time zone change over, because of technical analysis such as signs the pair is overbought or oversold or just prior to or just after an economic data release, or perhaps because of profit-taking after price action begins to fade. It might be due to the run-up to a key policymaker speech, or in the aftermath of a key policy maker’s speech. Or a reversal in price subsequent to an economic data release, an emergency or unplanned data release, or even because of rumors circulating in the market.
It might also be because of unexpected events in another financial sector, including oil or the stock market, or perhaps there are not enough buyers or sellers to maintain the momentum.
A classic sign of the end of a trend is when price action begins to consolidate into a sideways motion, and you might see this during lulls in the market or at the end of the Asian, European, or US sessions.
Traders buy and sell a pair based on their trading portfolio requirements, if they trade for large institutions, or perhaps as speculators or because their balance sheet requirements have a need to add or sell off a particular currency. Maybe they have import and export requirements. They may have just seen a good trend and jumped on it, but when their session came to an end, they closed out their interest and took their profits. The bottom line is that we never know when the balance of buyers or sellers is dominating the price action, which in turn results in price action shifting one way to the other. But technical analysis is usually a very good tool to be able to determine when price action trends are coming to an end. So keep an eye out for long tails, the possible reversal in price action, small candlesticks, consolidation, sharp v-shaped reversal patterns, time zone sessions coming to an end, or beginning. And be very careful with regard to entering a trend that has gone on for a considerable number of pips, especially in the hundreds, because if you are not correct, you could see a sharp price action reversal leaving you looking at a financial loss making the trade.