

When it comes to consistently being profitable in crypto trading, the trend is definitely your friend. However, spotting the trend when it still in the early stages is very difficult, while running along with it all the way to the top is even more challenging.
More often than not, trends (both bullish and bearish) will pause their move briefly, which allows traders or investors to join the bandwagon. We saw this pause in many cases during the crypto market uptrends and downtrends. If a lot of new participants join, the asset price continues the trend. If not, we can expect a trend reversal.
Continuation patterns
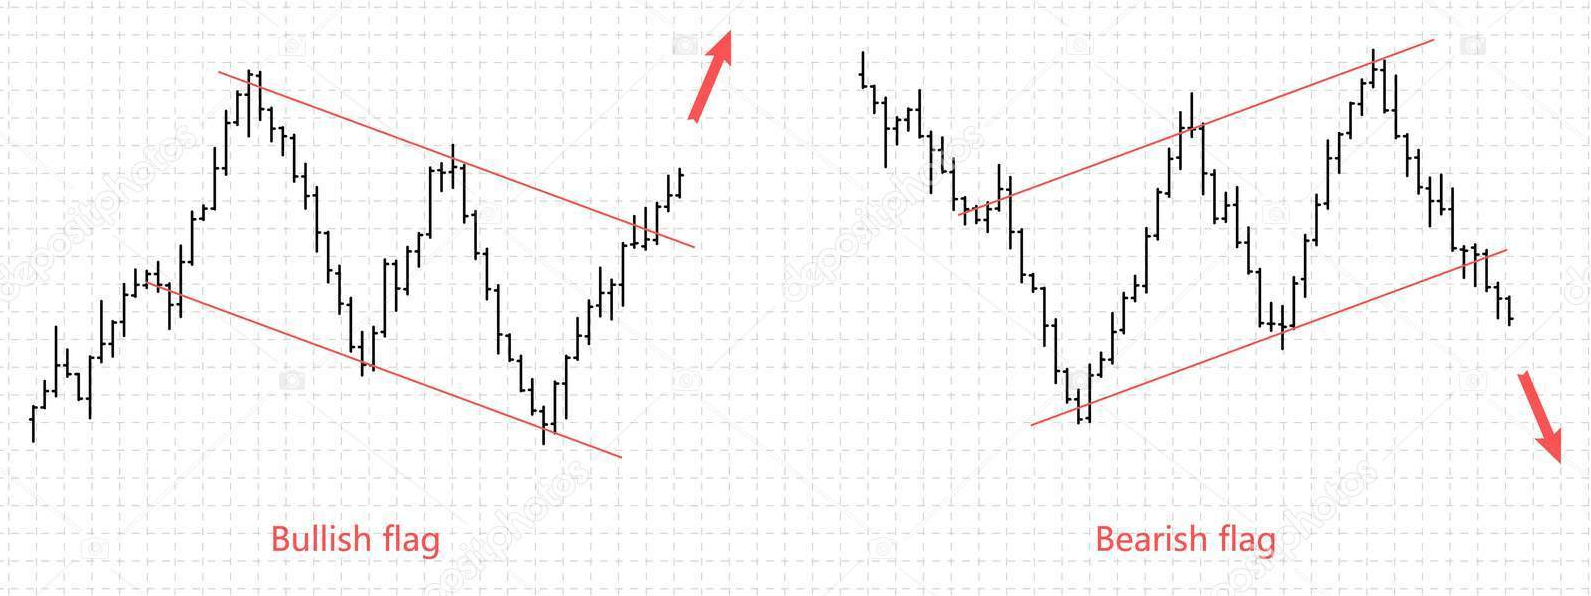
A trader can use continuation patterns to spot trend extensions. These patterns occur in a variety of shapes, with some of the most popular being known as bull and bear flags.
A bull flag is a pattern that occurs during an uptrend when the price is trying to continue upward. On the other hand, the bear flag occurs in a downtrend when the price wants to go further down.
Each flag pattern has two main components:
The pole and The flag. The “pole” is a part of the pattern that signifies a strong impulsive move, which is backed by a surge in trading volume, as well as by the subsequent pause in the trend, which represents the “flag,” which resembles a falling or rising channel.
The flag pattern has shown to be an invaluable addition to a traders’ toolset. It is mainly used to calculate the target as well as the direction of the move. As an example, if the resistance breaks in a bull flag, we can be confident that the price will continue upwards and set the target to approximately the length of the pole. On the other hand, if the support of the bull flag is breached, we know that the pattern is invalid and that the trend continuation is unlikely.
Calculating the profit target
A cryptocurrency move after a bull flag breakout or bear flag breakdown usually corresponds to the size of the pole of the flag.
Therefore, the profit target is derived like this:
Bull flag breakout equals to the breakout price plus pole hight
Bear flag breakdown equals to from the breakout price minus the pole hight
Pole height equals to the pole high minus the pole low.
Example of the Bull Flag
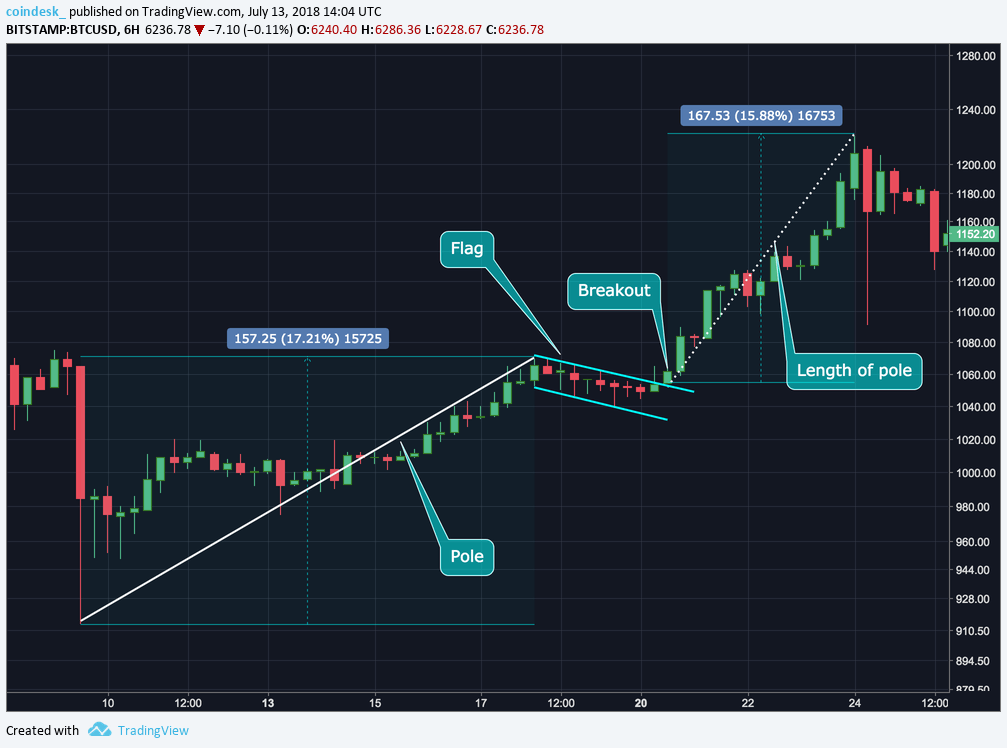
Let’s take a look at Bitcoin (BTC) on a 6-hour chart, where it presented a bull flag breakout. Bitcoin cleared this particular flag resistance on Feb 20, 2017, which signaled a continuation of the rally. The rally ranged from the $917 (which was the low of the pole) to the possibility to go towards $1,228 (target measured by the pole height method brought us to $157, which was added to breakout price).
In this case, Bitcoin came just $10 shy of the predicted price target on Feb 24, 2017.
Example of the Bear Flag
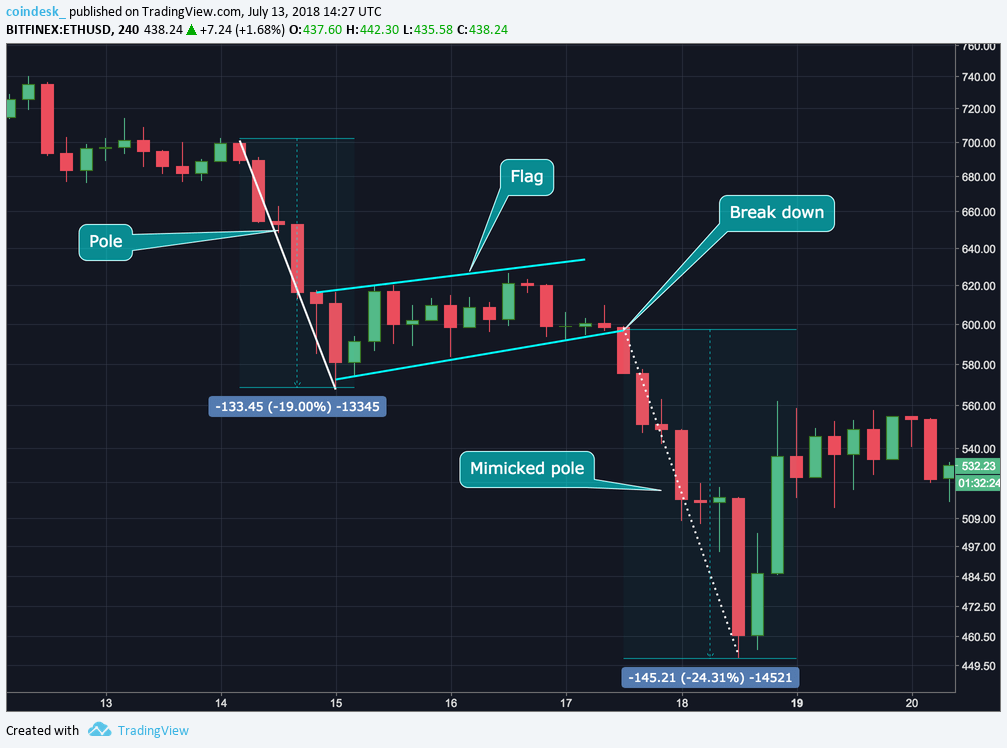
An example of the bear flag would be Ethereum’s (ETH) 4-hour chart, starting Mar 17, 2018. Ethereum broke the flag support, which suggested the continuation of the depreciation from the $699 pole high. The target would be $463 if we used the pole height method, which got us to the $133, which were then deduced from breakdown price.
As the move confirmed, Ethereum was just $12 shy of reaching the exact target level on Mar 18, 2018.
Summary
Bull and bear flags can be utilized in strongly trending markets to predict the price target of the move. However, they do not always perform as intended. In some cases, they can present a so-called “false breakout,” which occurs when price breaches the boundary of the flag but quickly retraces.
The risk of false breakouts can be mitigated by waiting for a candlestick to close outside of the flag territory.
For more superb educational content please visit our website https://www.forex.academy/