How to make money in crypto using Fibonacci retracements – part 2/2
What do Fibonacci levels represent?
The Fibonacci levels used within crypto trading are 23.6%, 38.2%, 50%, 61.8%, and 100%. They represent psychological barriers that repeatedly show up within the crypto markets.
Another interesting aspect of Fibonacci levels is (as with many indicators), the fact that they become more accurate with more people using and respecting them. This falls under the “self-fulfilling prophecy” paradigm.

How to use Fib retracements
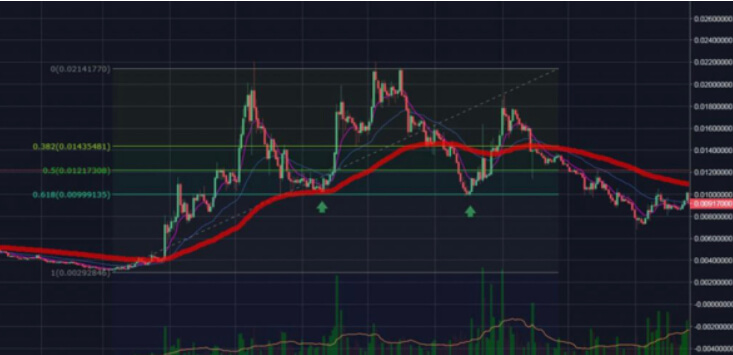
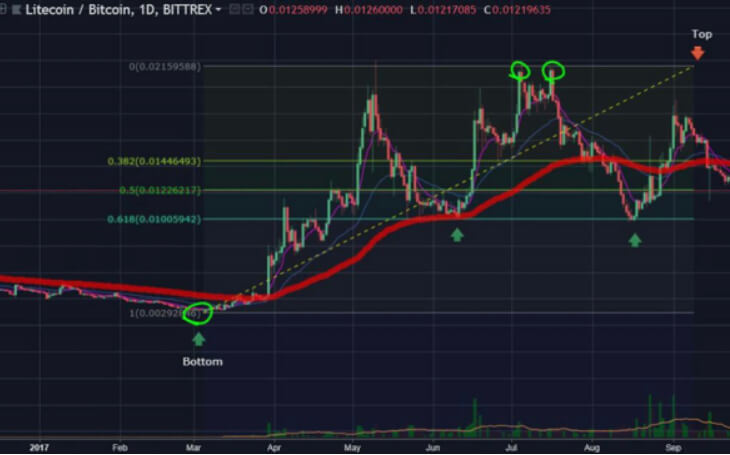
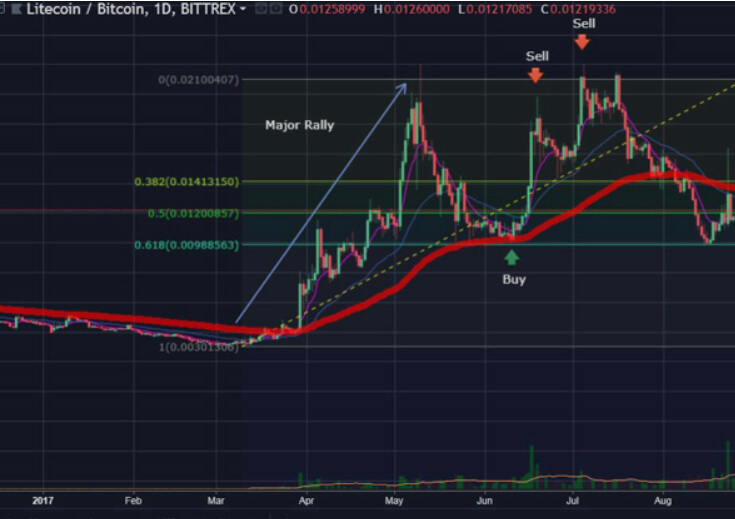
The Fibonacci retracement levels consist of horizontal lines that highlight areas of expected support and resistance. To create these Fib levels, you’ll need to draw a line between the lowest and the highest price of a particular trading cycle.
It’s up to the trader to choose whether they will use wicks or candles.

Fib retracements are a very popular tool amongst technical traders, as it allows them to identify levels where they can place their entry or exit points. More times than not, the market tends to struggle near these Fib levels.
Whether it is nature or a self-fulfilling prophecy, these levels do seem to work, and there are many traders that utilize Fib levels to profit in the volatile crypto market.
One thing to note is that you will never know how far the price will retrace exactly. This means that you can’t predict which Fib level the price will respect. That’s why it’s better to carefully watch the markets and wait for a level reaction before entering a position.
Can Fibonacci retracements be used with other indicators and tools?
Yes, they can. In fact, it’s highly recommended to use Fib retracements with some other indicators. If other tools and indicators overlap with the results of the Fibonacci retracement levels, the expected result is that much more realistic.
An example of using Fib retracements
Fibonacci retracement levels are very efficient when it comes to predicting a bounce off of a big red candle, upon the completion of a quick rally. These (fairly) quick trades can generate some good profit if timed properly.

Conclusion
Many traders use the Fibonacci retracements to decide where to set their buy orders. However, most of these traders use indicators such as volume and some momentum indicators alongside Fib retracements to increase the overall security of their decision.


