On the news front, the market isn’t expected to offer any major or high impact economic event until Wednesday. Therefore, the eyes will remain on the COVID19 cases and U.S. FOMC meeting minutes, which are coming out tomorrow to drive further price action in the market.
Economic Events to Watch Today
EUR/USD – Daily Analysis
The EUR/USD has managed to maintain its previous day winning streak and taking further bids just below the 1.1900 level while representing 25% gains on the day mainly due to the broad-based U.S. dollar weakness, triggered by the on-going uncertainty surrounding the much-awaited U.S. fiscal stimulus.
On the other hand, the US-EU trade concerns turned bitter as the U.S. keeps increasing the hardships for the E.U. goods, which eventually becomes the key factor that capped further upside momentum for the currency pair. In the meantime, the rising coronavirus cases in Germany also turned out to be a major factor that kept the traders cautious. As of writing, the EUR/USD currency pair is currently trading at 1.1893 and consolidates in the range between the 1.1865 – 1.1898.
The U.S. dollar losses were further bolstered by the uncertainty over the next round of the U.S. fiscal stimulus measures, as the U.S. Congress members failed again from signaling any talks on the much-awaited stimulus amid political differences, which continued to fuel doubts over the U.S. economic recovery.
As we all know, the online meeting between the world’s top two nations I,e the U.S. & China, has been postponed without giving any future dates that were initially scheduled for Saturday. Despite this, the conflicting tone remains on the card as the Trump administration keeps increasing the hardships of companies from China. The U.S. diplomats recently announced punitive measures for Huawei in their latest attack for China. However, these gloomy headlines tend t cap further gains in the equity market, which might help the U.S. dollar put the safe-haven bids ahead.
Across the pond, the US-EU trade concerns still not showing any sign of slowing down as the U.S. decided to maintain its 25% tariffs on a range of E.U. goods. This happens after the White House realized that the E.U. is not doing enough to obey with the WTO’s ruling over state aid to Airbus. However, these updates could halt the upward momentum in the currency pair.
At the coronavirus front, the actual coronavirus cases increased to 225,404, with a total of 9,236 deaths. Whereas, the cases raised by 1,390 in Germany on the day against the previous day +738. The death toll rose by 4, as per the German disease and epidemic control center report, Robert Koch Institute (RKI).
At the USD front, the broad-based U.S. dollar reported losses on the day as the possibility of the U.S. Congress agreeing to a fiscal stimulus bill this month has weakened amid political differences, which eventually destroyed hopes for a quick U.S. economic recovery. In the absence of significant data/events on the day, the market traders will keep their eyes on the headlines concerning the US COVID-19 aid package, virus figures, and Sino-American trade.
Daily Technical Levels
| Support | Pivot | Resistance |
| 1.1838 | 1.1860 | 1.1891 |
| 1.1807 | 1.1913 | |
| 1.1785 | 1.1945 |
EUR/USD– Trading Tip
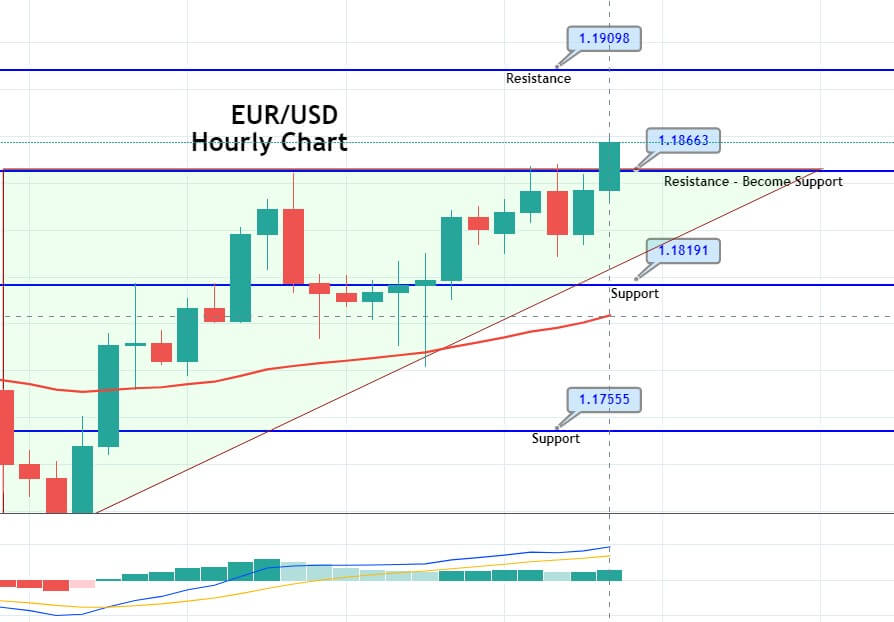
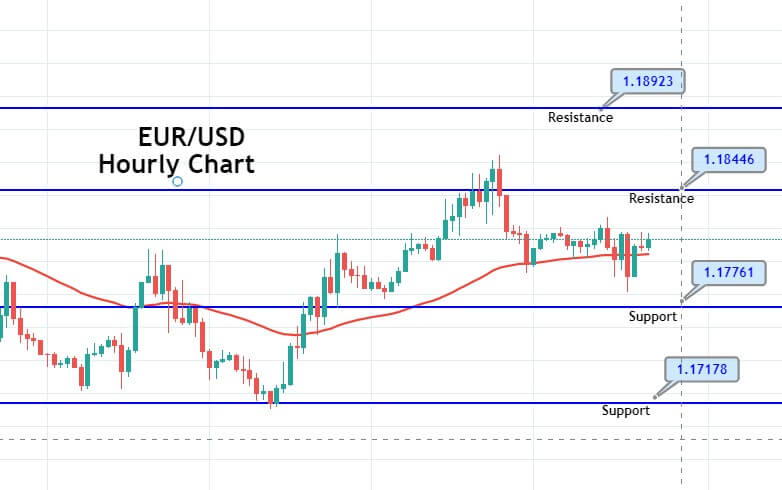
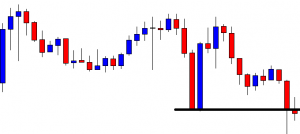
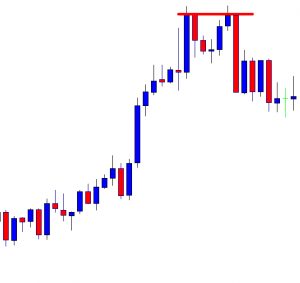
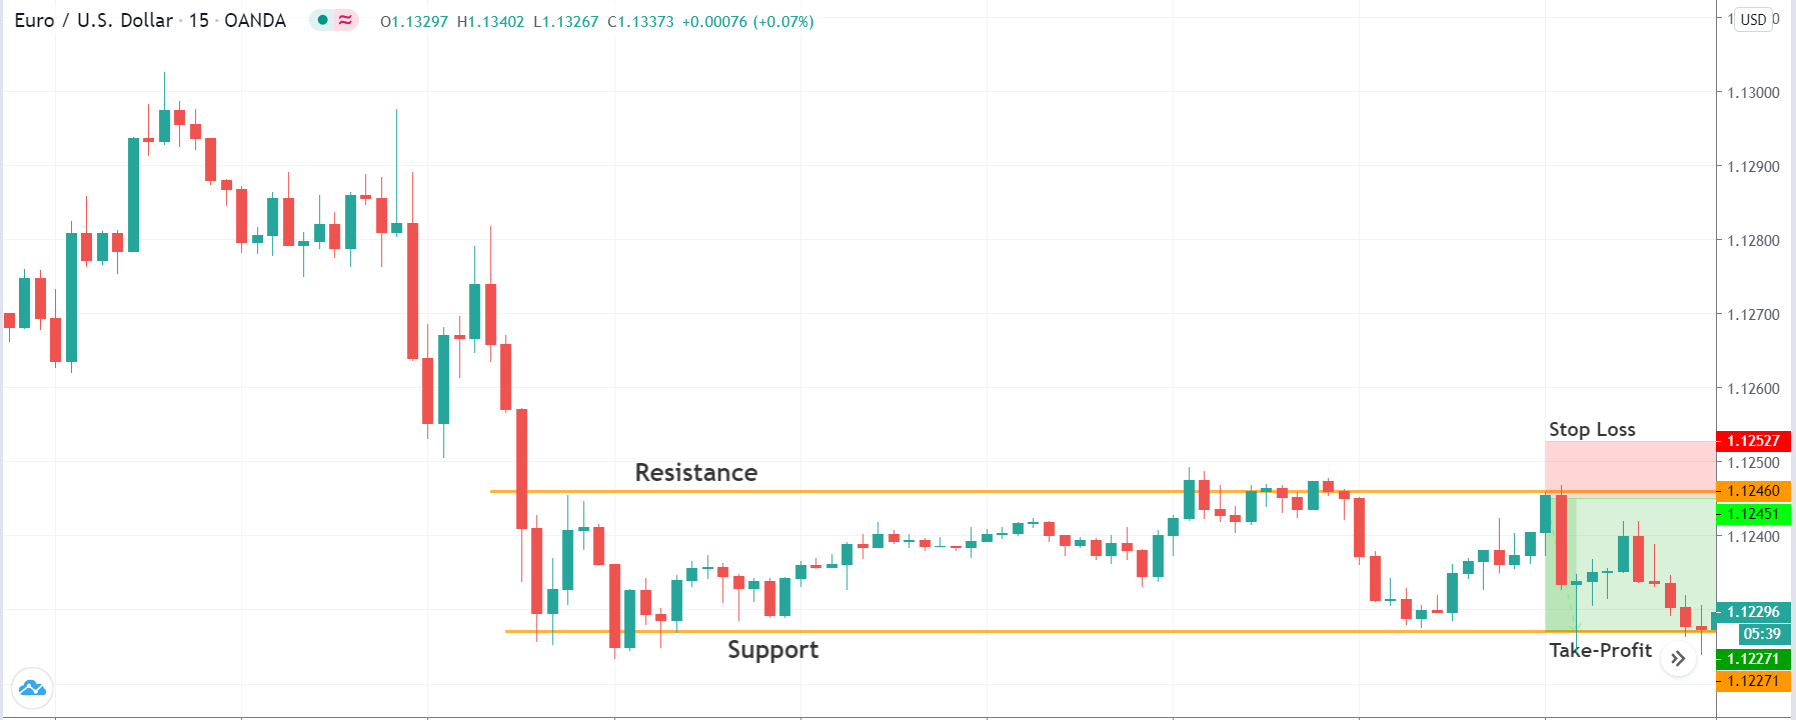
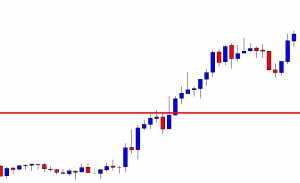
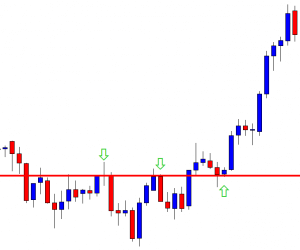
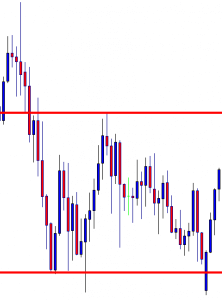
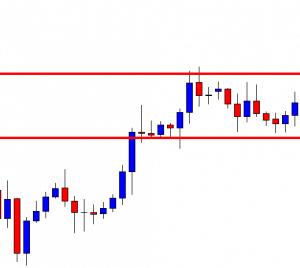
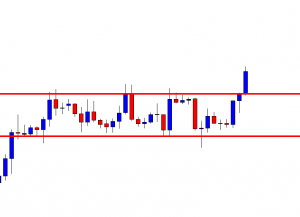
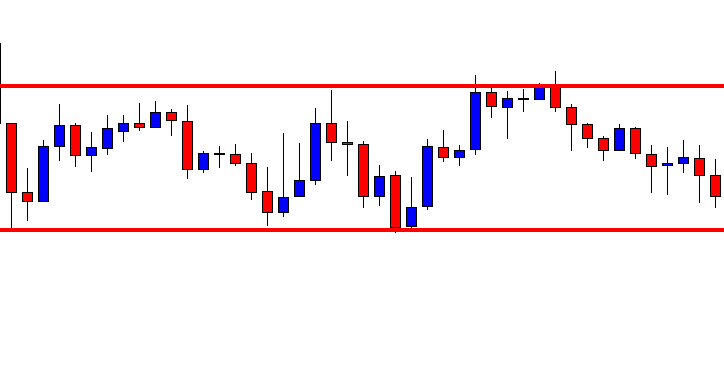
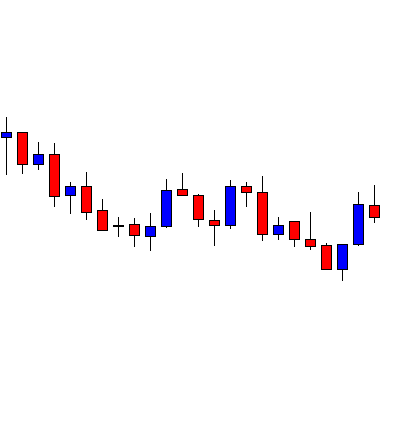
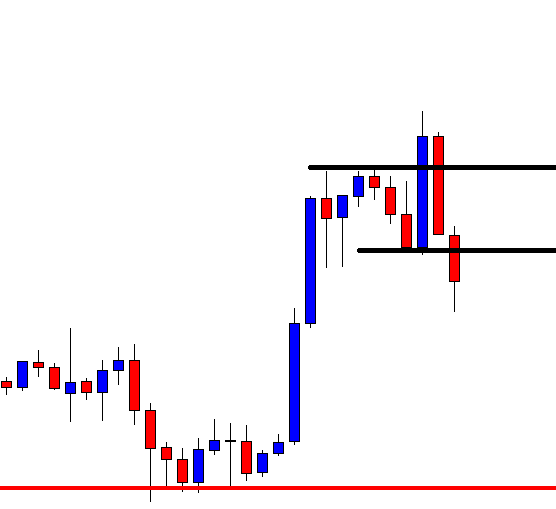
The EUR/USD pair has already violated the resistance level of 1.1862, which is now working as a support. On the 4 hour timeframe, the pair is supported by an upward trendline at 1.1880, while the double top resistance stays at 1.1916 level. Bullish bias seems dominant, and it may lead the EUR/USD prices towards the 1.1916 level today.
GBP/USD – Daily Analysis
Today in the Asian trading session, the GBP/USD currency pair remains on the bullish track and registered 4th day of winning streak while taking rounds near the 1.3120 and 1.3137 range mainly due to the broad-based U.S. dollar selling bias. That was triggered by the uncertainty surrounding the much-awaited coronavirus (COVID-19) relief package from America. The upbeat market mood also undermined the safe-haven U.S. dollar and contributed to the currency pair gains.
The upbeat market sentiment backed by multiple factors helped overshadowed the U.K.’s current economic slowdown and distracted from anxieties that the country is likely heading into an unemployment crisis. This, in turn, underpinned the local currency and gave further support to the major. At a particular time, the GBP/USD currency pair is currently trading at 1.3139 and consolidating in the range between 1.3095 – 1.3141. However, the pair’s traders seem cautious to place any strong bids ahead of the key 7th-round of EU-UK talks concerning Brexit.
It is worth mentioning that the cable pair has many more to cheer on the day. Be it broad-based U.S. dollar weakness or upbeat market trading sentiment, not to forget the Brexit talks, these all factors are supporting the currency pair for the time being, at least.
At the Brexit front, the hopes of the trade deal next week got further fueled by the UK PM Boris Johnson’s previous comments that the United Kingdom will not accept aligning to rules of the E.U. at the coming round of post-Brexit discussions. Even though the trade deal is agreed between the U.K. and E.U., as per the U.K. Express report, the E.U. fishermen could clash with U.K. fishermen.
The coming round of talk becomes the last scheduled meet; policymakers earlier showed a willingness to extend the talks till September if needed. According to the BBC report, the E.U. chief negotiator Michel Barnier said that the agreement would be needed by October to ratify before the current post-Brexit transition period ends in December. However, the policymaker from both sides keeps alleging each other while citing failures to agree over the key issues like fisheries, level playing field, and jurisdiction rules, to name a few.
Across the pond, the UK Chancellor Rishi Sunak shows a willingness to extend the furlough scheme after rising unemployment rate and hence reopened support scheme for self-employed. However, the improving market mood helped overshadowed the U.K.’s current economic recession fears and concerns that the country is expected to heading into an unemployment crisis.
The currency pair gains were also supported by the positive report that Imperial College London’s coronavirus (COVID-19) vaccine candidate is set for the next phase represents the Tory government’s efforts to control the pandemic.
On the other hand, the U.S. and China continue to struggle over one issue or the other. The Trump administration keeps increasing the hardships of companies from China by adding 38 Huawei facilities to the U.S.’ economic blacklist while also arresting a Chinese spy.
Whereas, the uncertainty over the next round of the U.S. fiscal stimulus measures remain on the cards, as the U.S. Congress members failed again from signaling any talks on the much-awaited stimulus amid political differences, which continued to fuel doubts over the U.S. economic recovery.
As in result, the broad-based U.S. dollar failed to gain any positive traction and extended its previous long bearish bias as doubts over the U.S. economic recovery remain amid coronavirus stimulus package. However, the losses in the U.S. dollar helped the currency pair to take bids on the day.
Daily Technical Levels
| Support | Pivot | Resistance |
| 1.3075 | 1.3099 | 1.3124 |
| 1.3050 | 1.3148 | |
| 1.3027 | 1.3173 |
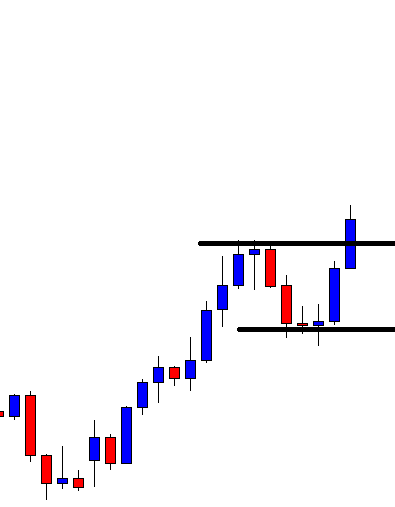
GBP/USD– Trading Tip
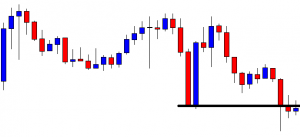
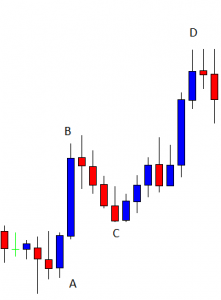
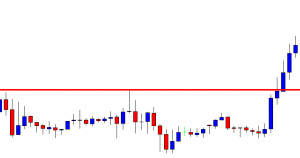
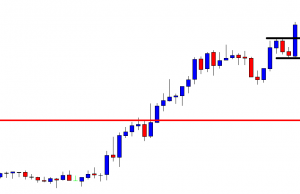
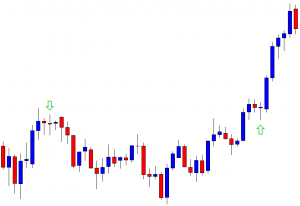
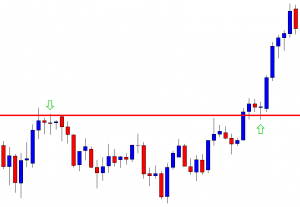
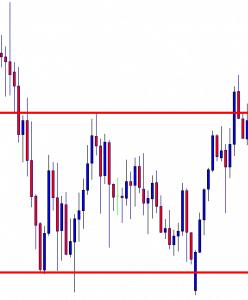
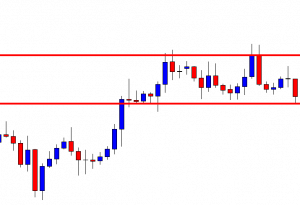
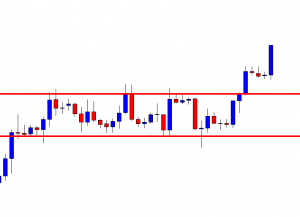
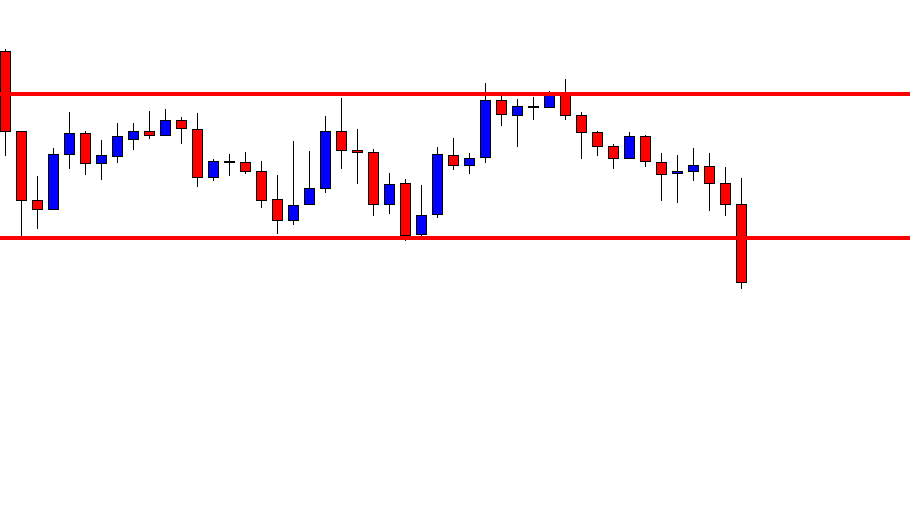
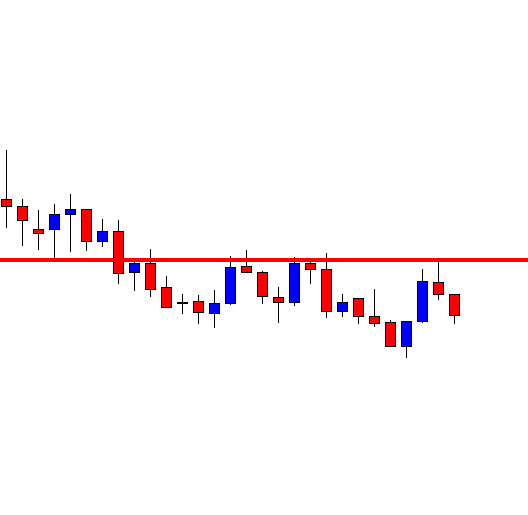
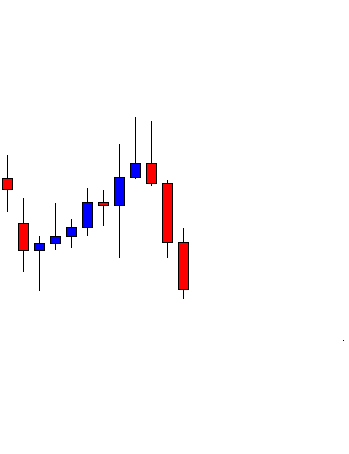
The GBP/USD pair is trading at 1.3137 level, and the pair was trading in between an ascending triangle pattern that has now been violated. The triangle pattern was extending resistance at 1.3125 level, and above this, the next resistance is pretty much likely to be found around 1.3189 level. At the same time, the support stays at 1.3125 and 1.3085 level. Bullish bias seems dominant today.
USD/JPY – Daily Analysis
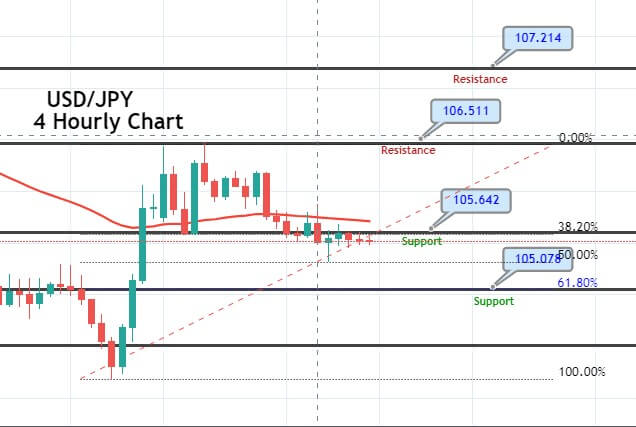
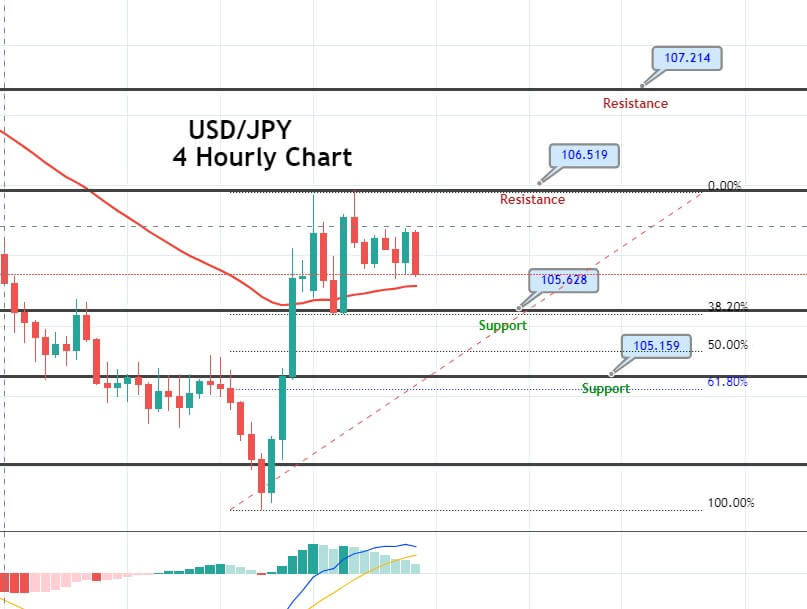
The USD/JPY currency pair extended its previous session losing streak and dropped further below 106.50 marks mainly due to the broad-based U.S. dollar four-day consecutive weakness, buoyed by the impasse over the next round of the U.S. fiscal stimulus measures. On the other hand, the upbeat market sentiment, backed by the optimism over a potential vaccine for the highly infectious coronavirus, undermined the safe-haven Japanese yen and helped currency pair to limit its deeper losses. In the meantime, the downbeat preliminary readings of Japan’s second quarter (Q2) Gross Domestic Product (GDP) also undermined the safe-haven Japanese yen currency and became one of the major factors that capped further downside for the currency pair. Currently, the USD/JPY currency pair is currently trading at 106.36 and consolidating in the range between 106.31 – 106.67.
Despite concerns about the ever-increasing coronavirus cases across the world and worsening US-China relations, the investors continued to cheer the optimism over a potential vaccine for the highly contagious coronavirus disease. Also, supporting factors could be the suspension of the US-China online meeting regarding the trade deal.
On the contrary, the fears of growing COVID-19 cases in the U.S., Australia, Japan, and some of the notable Asian nations like India continually fueling doubts over the economic recovery. As per the latest report, France recorded more than 3,000 new cases for the second day while Australia’s state Victoria marked the highest death loss, which resulted in an extended state of emergency until September 13. Singapore also reported 86 cases on the weekend. At the same time, New Zealand imposed fresh lockdowns after recording increased cases of Covid-19. However, these gloomy updates kept challenging the market risk-on tone, which might weaken the safe-haven JPY and help limit losses for the major.
Apart from the virus woes, the long-lasting tussle between the world’s two largest economies remained on the cards as China’s ambassador to the U.S. recently gave warning against the U.S. move to send ships to the South China Sea, which could raise further tensions between both nations and harm the trade deal. Whereas, President Trump announced yesterday that TikTok should give its U.S. operations to another company within one-month, or it will be banned in the U.S. due to significant security threats. In return, China’s Foreign Ministry recently said on the day that it would firmly oppose to U.S. actions.
As we mentioned, the downbeat preliminary readings of Japan’s second quarter (Q2) Gross Domestic Product (GDP) also gave some support to the currency pair. The world’s 3rd-largest economy declined by a 27.8% annualized pace during the second quarter of 2020. However, this marked the biggest economic fall on record and was led by the coronavirus-induced lockdown.
Daily Technical Levels
| Support | Pivot | Resistance |
| 105.7300 | 106.2000 | 106.4600 |
| 105.4800 | 106.9200 | |
| 105.0100 | 107.1800 |
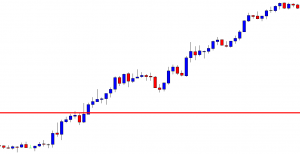
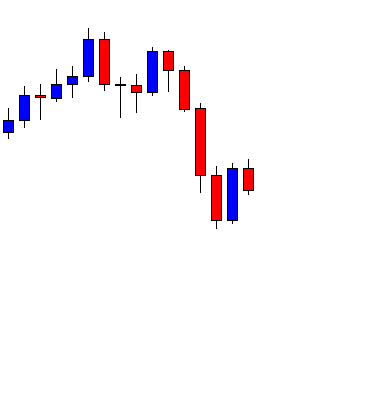
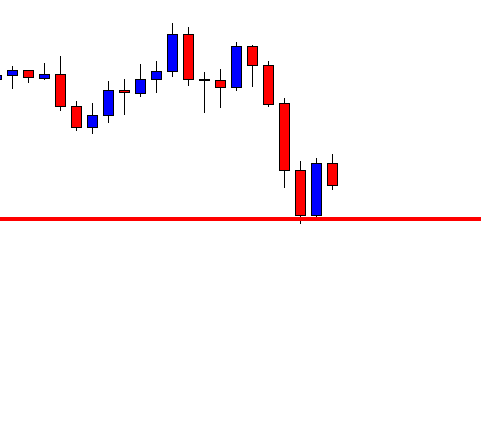
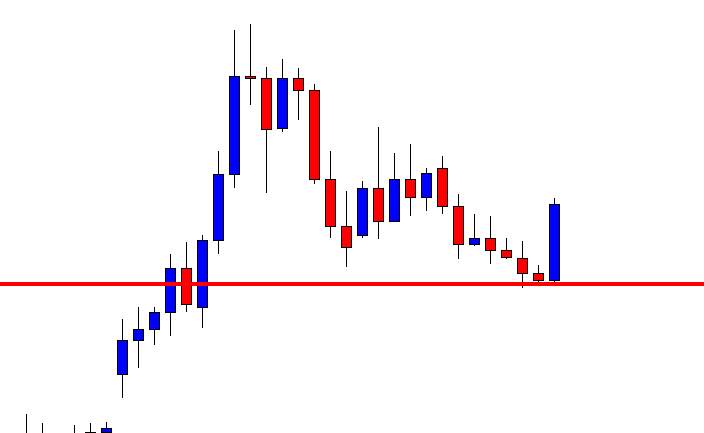
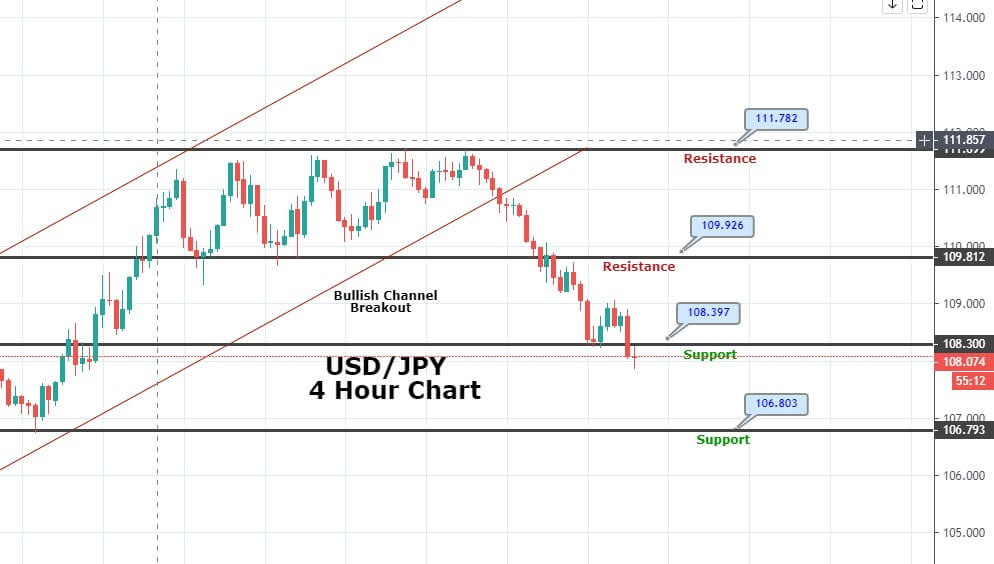
USD/JPY – Trading Tips
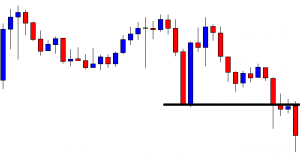
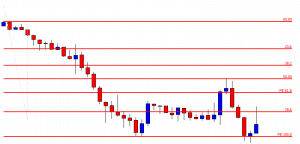
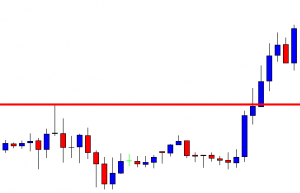
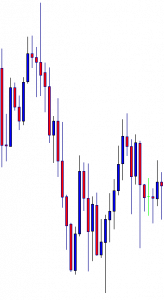
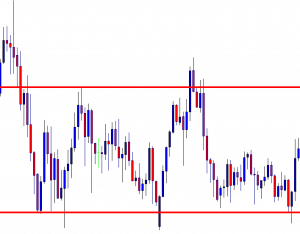
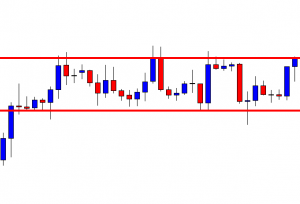
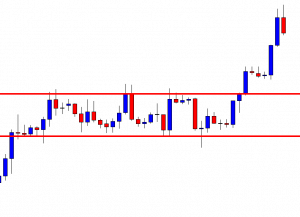
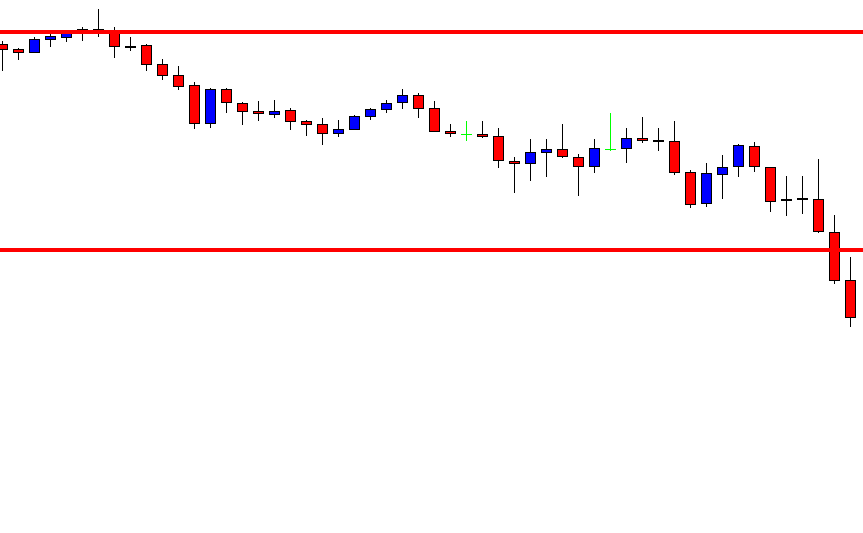
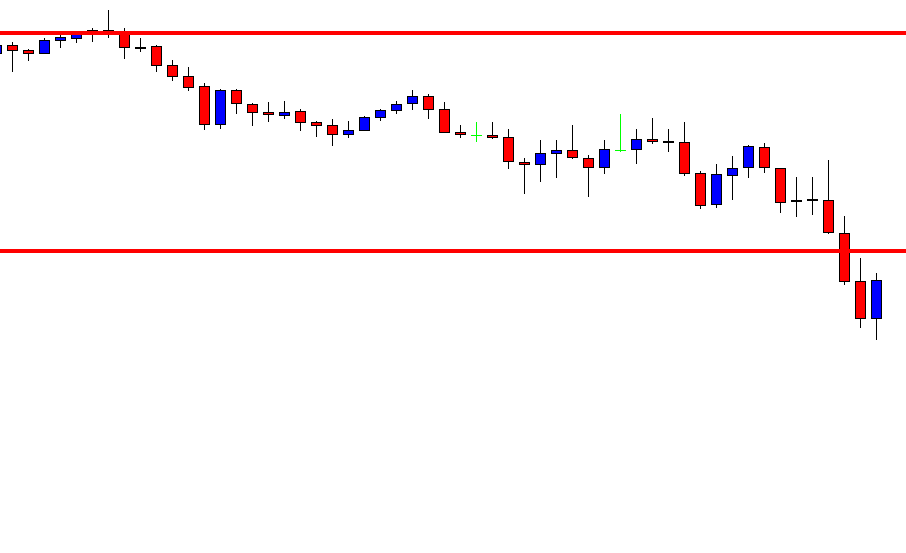
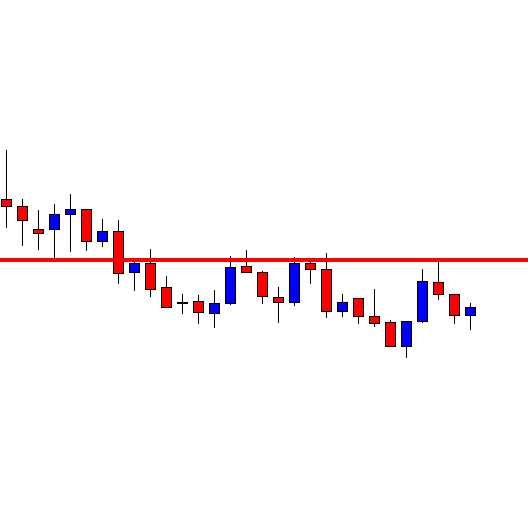
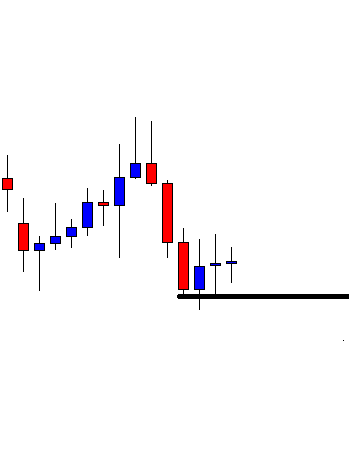
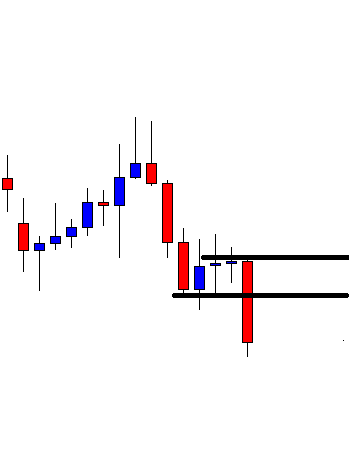
The USD/JPY has violated the upward trendline support level of 106.345, as it fell sharply in the wake of increased safe-haven appeal in the market. At the movement, the USD/JPY pair is holding below 50 periods EMA, while the RSI and MACD are in support of bearish trend. The recent candle is closing above 105.344 level, suggesting strong odds of bullish correction until 106. However, the violation of 106 can lead USD/JPY prices towards the 104.600 support level. Good luck!