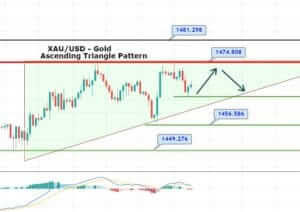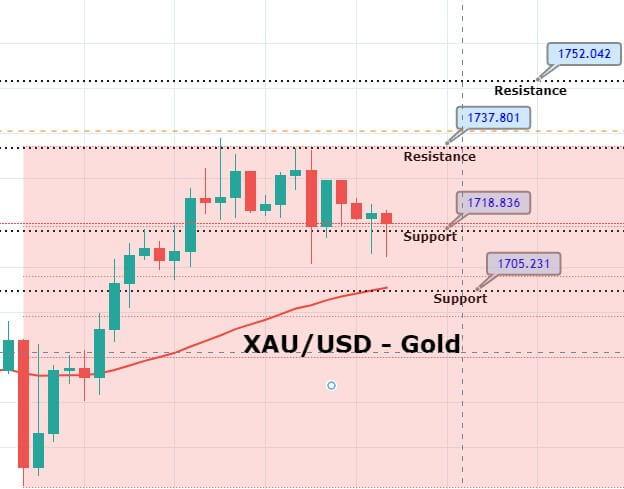
During the European session, the precious metal gold was trading at 1,718 area. Technically, gold entered the overbought zone and showed a slight bearish retracement at 1,718 region, which marks 23.8% Fibonacci retracement level and can be seen on the chart below.

As per the latest report from the Centers for Disease Control and Prevention (CDC), the number of COVID19 virus cases rose to 52,459 against the previous day’s 50,439, while the cases surged to 928,619 against 895,766. Despite this, the demand for safe-haven gold is getting hit as investors seem to do profit takings ahead of exhibiting a further bullish bias.
The positive mood around the equity market failed to impressed buyers, which normally weakens the Japanese yen’s safe-haven demand. The reason behind the risk-on market sentiment could be the hopes for the re-start the economy. The certainty about the drug trials for the treatments of the deadly disease keeps the market calm.
Gold – XAU/USD – Daily Technical Levels
Support Resistance
1,732.65 1,748.95
1,722.9 1,755.5
1,716.35 1,765.25
Pivot Point 1739.2
On the 4 hour timeframe, the precious metal gold has formed a bearish engulfing candle, which is suggesting odds of selling trend in the market below the 1,718 area. Since the overall trend seems bullish, we will try to capture quick sell in gold as soon as gold closes below 1,718, which is 23.8%, and violation of 1,718 level can open further selling until 1,708, which marks 38.2% retracement. Let’s look for selling positions below 1,728 and buying above 1712. Good luck!