On Thursday, the safe-haven demand remains high as the trader’s eyes stay on the United States and China trade news to observe the impact on the riks sentiment, which continues to play an impactable role in the USD/JPY currency par prices. The market will closely be observing the US producer Prices Index an Unemployment Claims data, which is scheduled to release ahead of day 2 of Powell’s testimony.
At the Hong Kong front, the Hong Kong civil unrest and violence take the worst turn for the 4th-straight day on Thursday, after the police reported that a man dressed in black and aged in his 30s died.
Economic Events to Watch Today
Let’s took at these fundamentals.
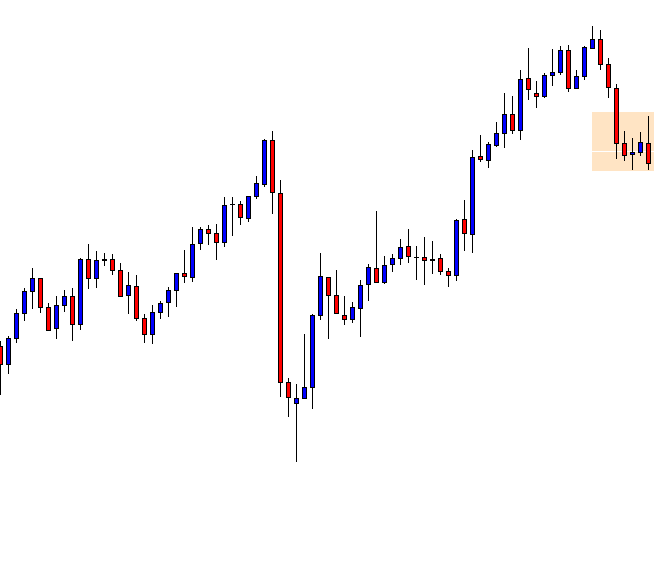
EUR/USD – Daily Analysis
The EUR/USD currency pair currently trading near the level of 1.1006 on the day. Even after the pair spot staying below 200-bar Simple Moving Average, the EUR/USD currency pair bounces off 61.8% Fibonacci retracement of its October month upward.
However, the buyers will likely wait for a bullish break of 200-bar moving Average at 1.1058 now, followed by 38.2% Fibonacci retracement and late-October lows surrounding 1.1065/75, to target 1.1100 marks.
On the positive side, if the GDP positive release, the pair may attempt recovery of 1.1040 and 1.156, the confluence zone of the 50 and 10-DMA. Buyers will likely try for the test of the 100-day Moving Average at 1.1100 on a continues break above the last.
On the technical side, the pairs Techincal st up continues to favor the buyers because the EUR/USD pair still on the track to test the immediate support of mid-October lows near the 1.0991. While the break bellow will likely escalate selling pressure, because of the buyer’s eyes 1.0950 as the next support, the more bearish trend in pairs could hit the multi-year lows of 1.0879 over again.
Daily Support and Resistance
S3 1.0958
S2 1.0983
S1 1.0996
Pivot Point 1.1008
R1 1.1021
R2 1.1033
R3 1.1058
EUR/USD– Trading Tips
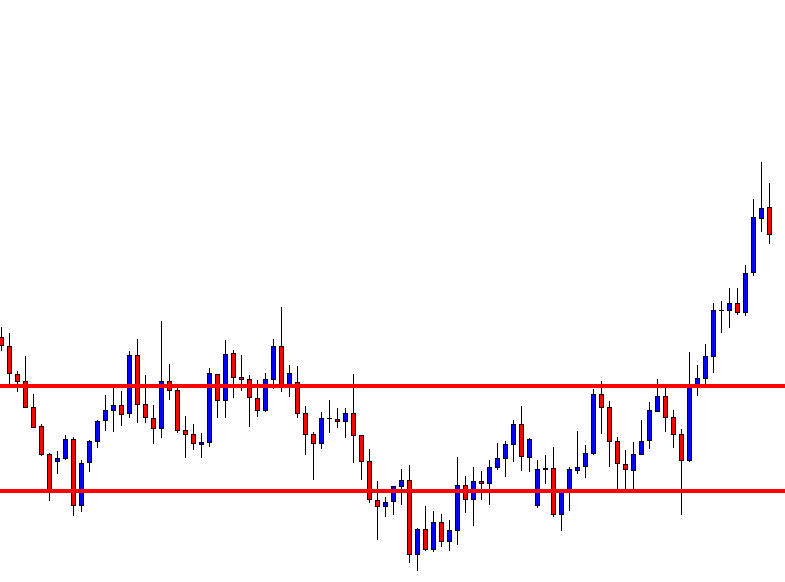
The EUR/USD continues to trade lower, maintaining a bearish bias after violating the support level of 1.1000. On the 4 hour timeframe, the EUR/USD has inside down candlestick pattern, which is signaling chances of further sell-off in the market.
For the moment, the EUR/USD is holding below a crucial trading level of 1.1000 as below this; the pair can continue falling until 1.0960. So consider staying bearish below 1.1000 level today.
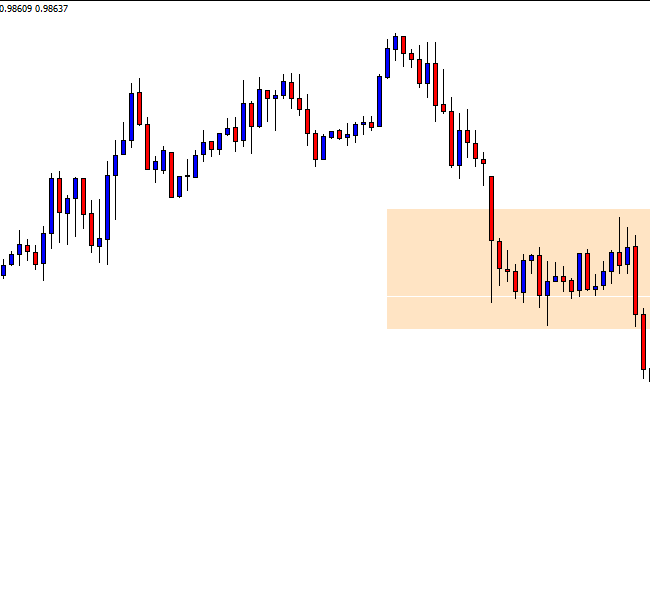
GBP/USD– Daily Analysis
The GBP/USD currency pair sideways and taking round to 12840 mainly due to optimism surrounding the United Kingdom political plays face the greenback strength ahead of the United Kingdom Retail Sales Data for October.
Brexit party leader Nigel Farage’s denial of the Conservative’s request of standing down more than 317 candidates, earlier promised, will likely negatively affect the British Prime Minister (PM) Boris Johnson’s popularity. The United Kingdom’s (UK) PM Boris Johnson was recently hackled during a speech to the flood-affected area. Whereas, surveys regarding the December election keep showing Tories holding power.
Looking forward to October, UK Retail Sales could boost the GBP/USD demand if it hit the upbeat predictions. However, the market’s rush to risk-safety can increase the USD gains if the Fed Chair support upside momentum during his Testimony 2.0.
Overview of UK Retail Sales, the UK retail sales, scheduled to be released later this session at 0930 GMT, is forecasted to come in at 0.2% MoM in October, after no increase seen in September. Total retail sales are seen coming at 3.7% over the year in the reported month, up from 3.1% booked previously.
Daily Support and Resistance
S3 1.2767
S2 1.2806
S1 1.2829
Pivot Point 1.2845
R1 1.2868
R2 1.2884
R3 1.2923
GBP/USD– Trading Tips
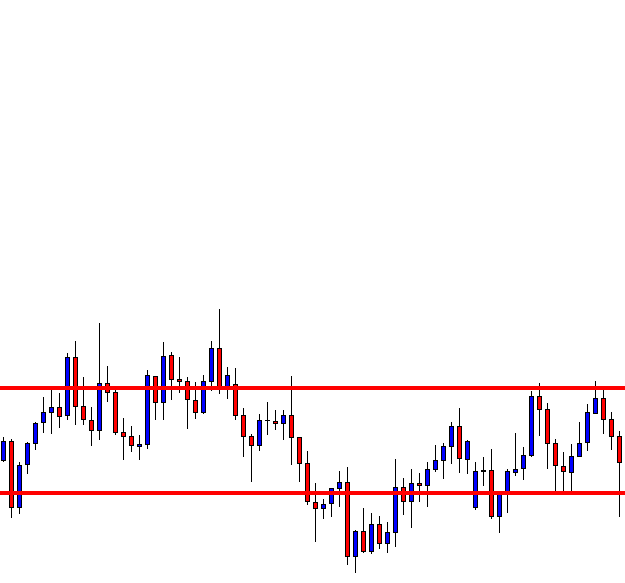
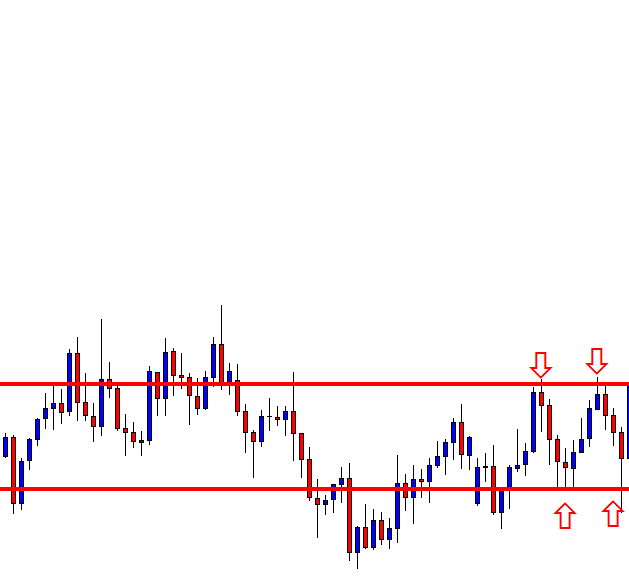
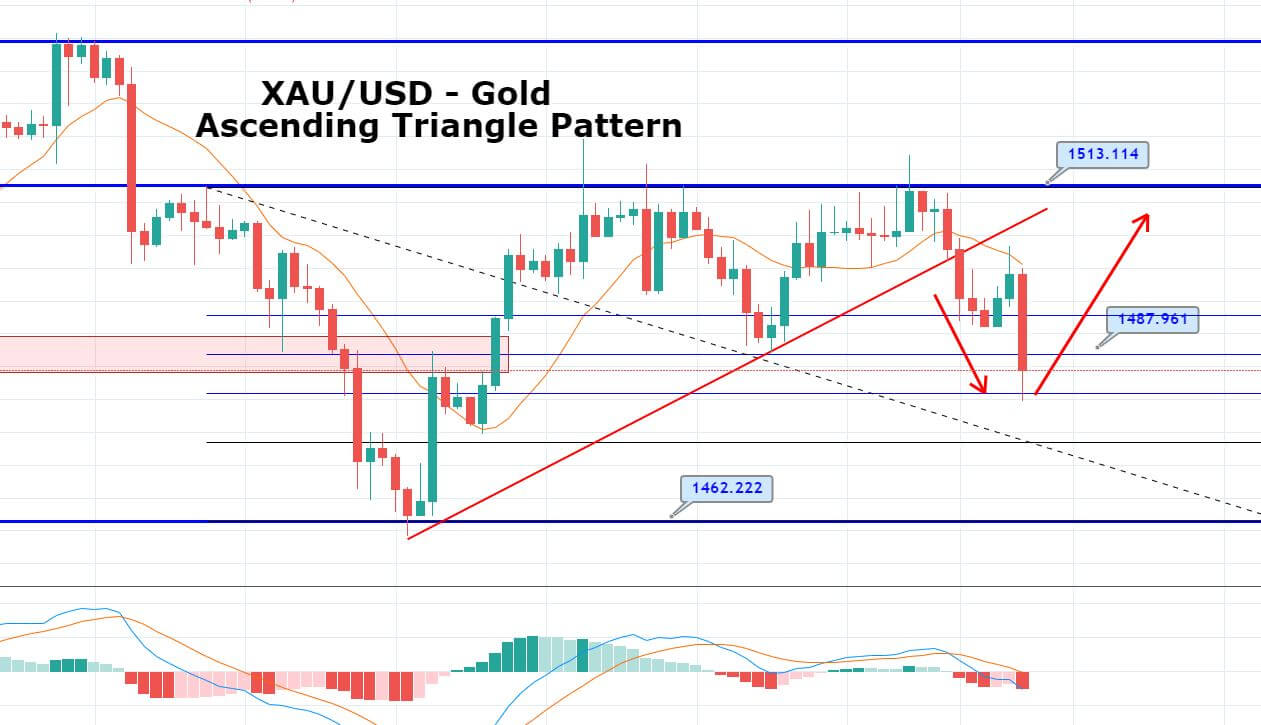
The GBP/USD is consolidating in the broad trading range of 1.2970 – 1.2780, while if we narrow it down, it becomes 1.2870 – 1.2785. The MACD and RSI have passed above 0 and 50, sequentially, indicating the probabilities of a downward movement in the GBP/USD.
At the moment, the GBP/USD trades at 1.2835 level, and it may find support around 1.2785. I will consider taking buying positions above 1.2845 and selling below the same level today.
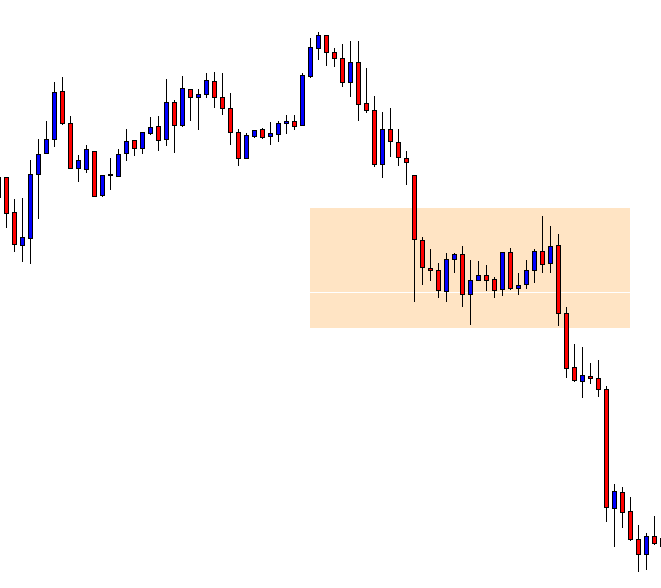
USD/JPY – Daily Analysis
The USD/JPY currency pair failed to hit the recovery track from thee 6-days lows of 108.65 and still stands near the range of 108.80 area, mainly due to on-going trade uncertainty between the United States and China. On the other hand, the pairs didn’t get any impact by the Japans Q3 GDP because of the renewed Sino-US trade war.
The Japanese Preliminary Q3 GDP rate slightly increased even less-than-expected across the time limit. However, the Japanese yen currency gave little attention to the sluggish figure releases. The Japanese yen continued getting support from the risk-off sentiment in Wall Street’s futures and global equities mainly after the United States and China trade tension again escalated during the overnight trading hours.
Trader’s eyes stay on the United States and China trade news to observe the impact on the riks sentiment, which continues to play an impactable role in the USD/JPY currency par prices. The market will closely be observing the US producer Prices Index an Unemployment Claims data, which is scheduled to release ahead of day 2 of Powell’s testimony.
At the Hong Kong front, the Hong Kong civil unrest and violence take the worst turn for the 4th-straight day on Thursday, after the police reported that a man dressed in black and aged in his 30s died.
Despite the Hong Kong confusion and renewed US-China trade tensions, the market mood looks to be developing over the last, with S&P 500 futures having flashed green as well as the Japanese stocks. This has helped put a minor buying under USD/JPY that is now trading in session highs near the 108.85 regions.
Daily Support and Resistance
S3 107.87
S2 108.37
S1 108.57
Pivot Point 108.86
R1 109.06
R2 109.36
R3 109.85
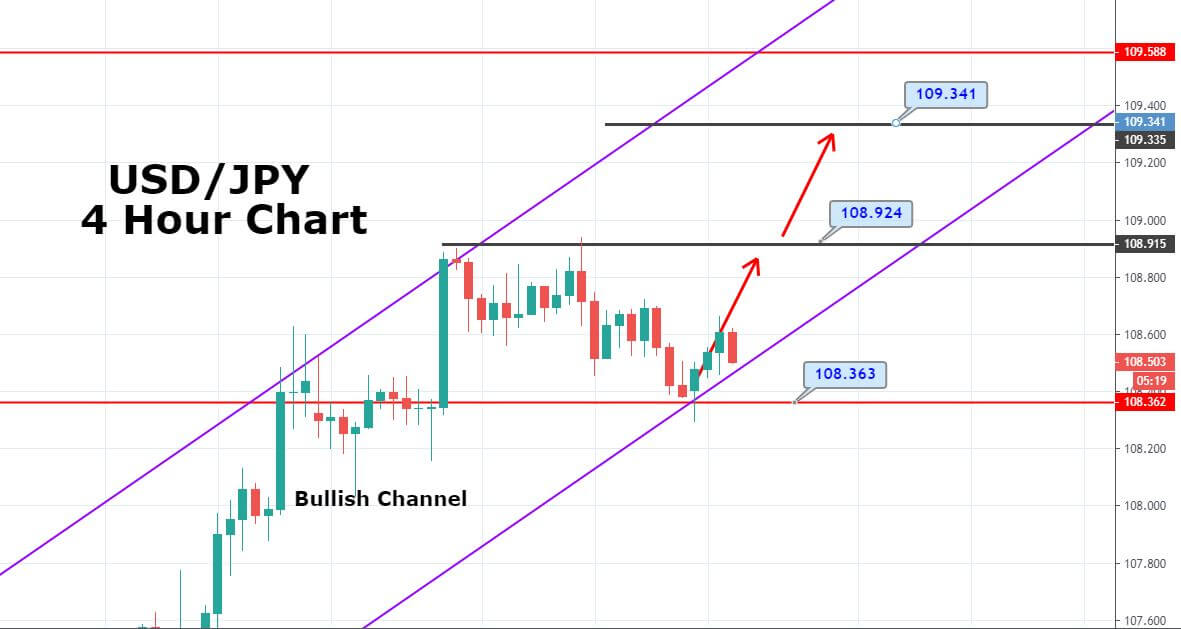
USD/JPY – Trading Tips
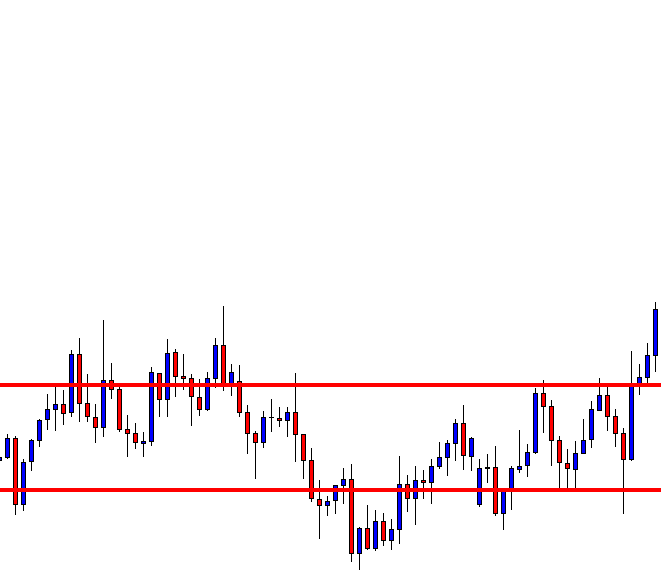
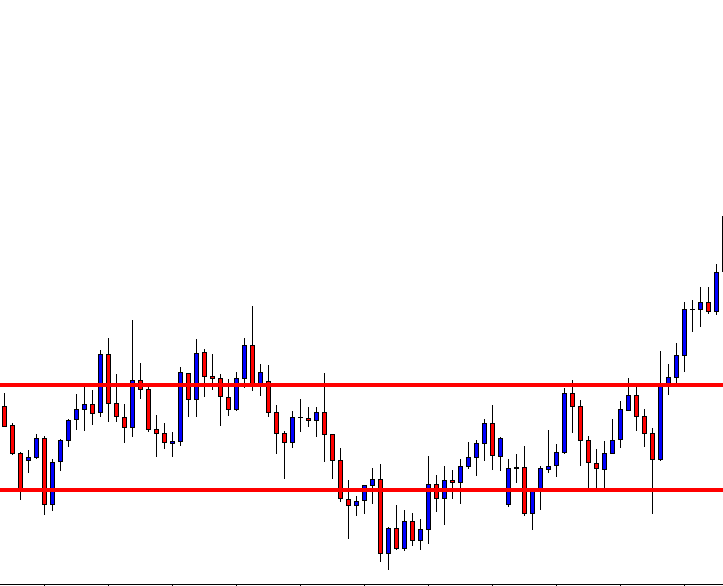
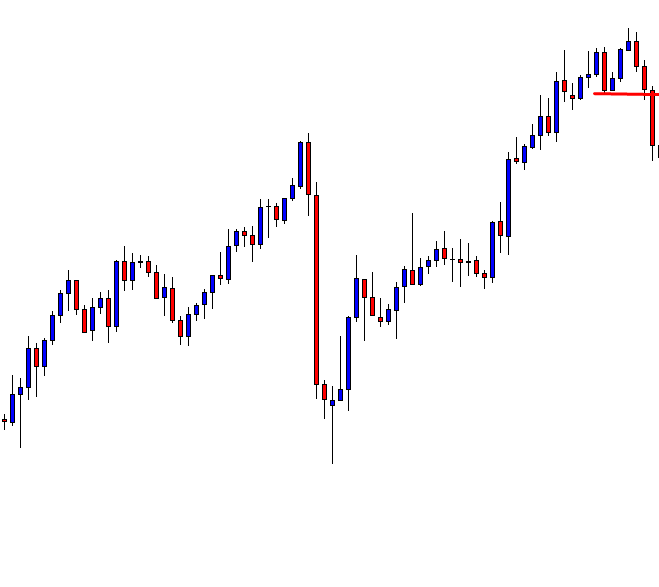
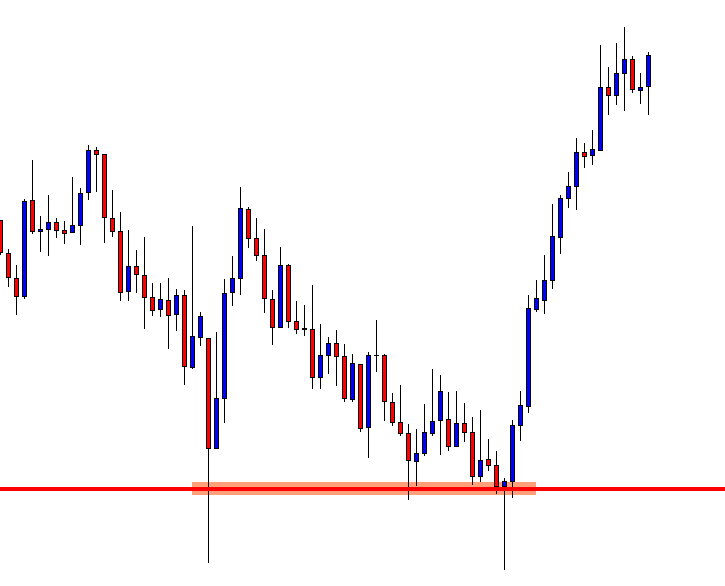
The USD/JPY is trading at 108.70, right above the 50% Fibonacci retracement level. This level also marks double bottom support and may keep the USD/JPY pair supported today.
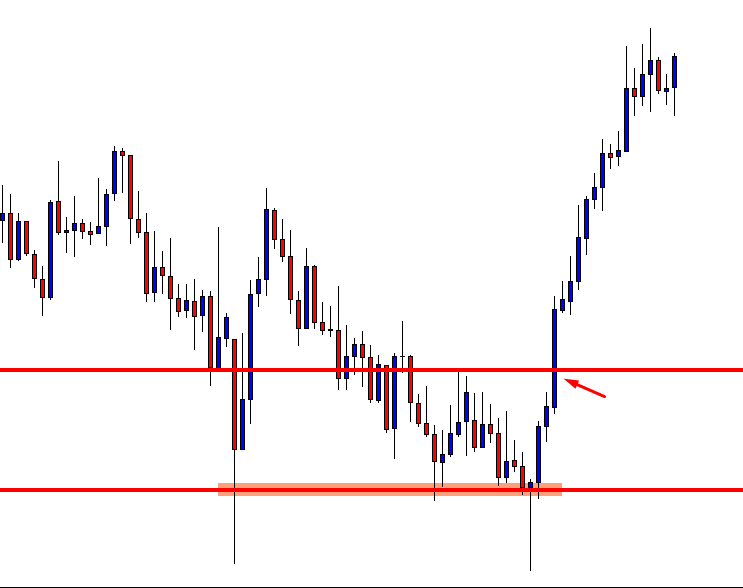
The violation of the 108.700 level can extend selling until 108.500, the 61.8% Fibo level today. The MACD and RSI are also supporting the bearish trend in the USD/JPY pair.
All the best!