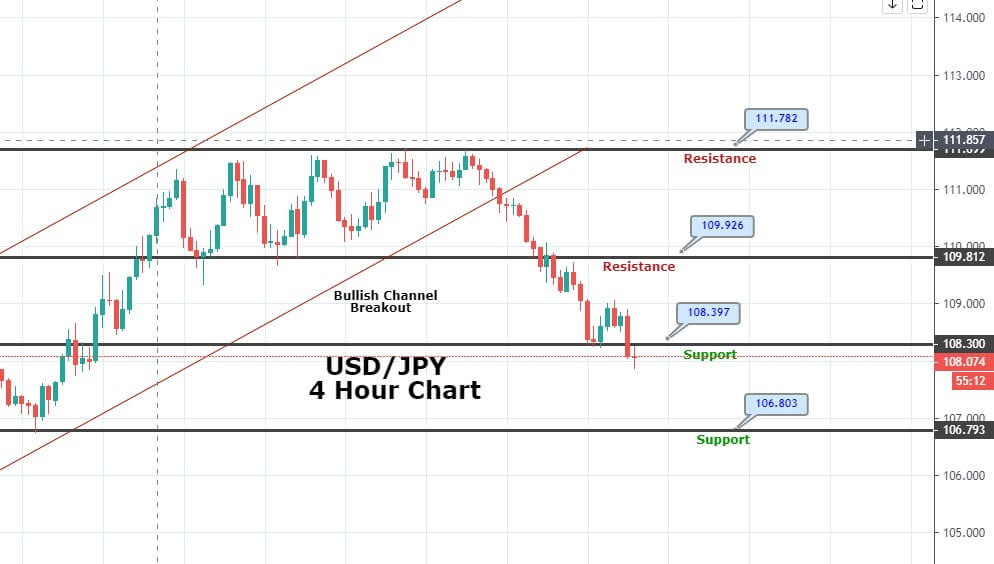
The USD/JPY has violated the horizontal support level of 108.300, which can ve seen on the 4-hour chart. Closing of candles below this level may extend selling bias until 107.450 as the demand for safe-haven assets remains solid.
The Japanese yen is a safe-haven asset, whereas the market treat also greenback as a safe-haven currency during the time of crises. So, as in result, the dollar index rose sharply from 94.65 to 103.00 in the ten days to March 19. The crash in the equity markets triggered in the wake of margin calls and liquidity crises, forcing investors to seek safety in the U.S. dollar.
Consequently, the market sentiment remains weak, with the S&P 500 futures currently reporting over a 1% decline on the day. If the risk sentiment gets worsens, the U.S. dollar will be able to find haven bids again, allowing a bounce in USD/JPY.
USD/JPY- Daily Technical Levels
Support Resistance
108.73 110.37
108.14 111.44
106.5 113.08
Pivot Point 109.79
Technically, USD/JPY is keeping the bearish bias as the pair has closed a bearish engulfing candle at 108.200, and the MACD is also in the selling zone. Both support the sentiment that the pair has the potential to go after further lower towards 107.350.
Entry Price: Sell at 107.984
Take Profit 106.734
Stop Loss 109.034
Risk/Reward 1.30
Profit & Loss Per Standard Lot = -$1000/ +$1300
Profit & Loss Per Micro Lot = -$100/ +$130