The broad-based U.S. dollar failed to stop its overnight losses and remain bearish on the day mainly due to the mixed U.S. Stimulus story. Moreover, the doubts over the U.S. economic recovery in the wake of coronavirus resurgence also weigh on the U.S. dollar. On the news front, eyes will remain on U.K.’s and Canada’s core retail sales to determine further market trends.
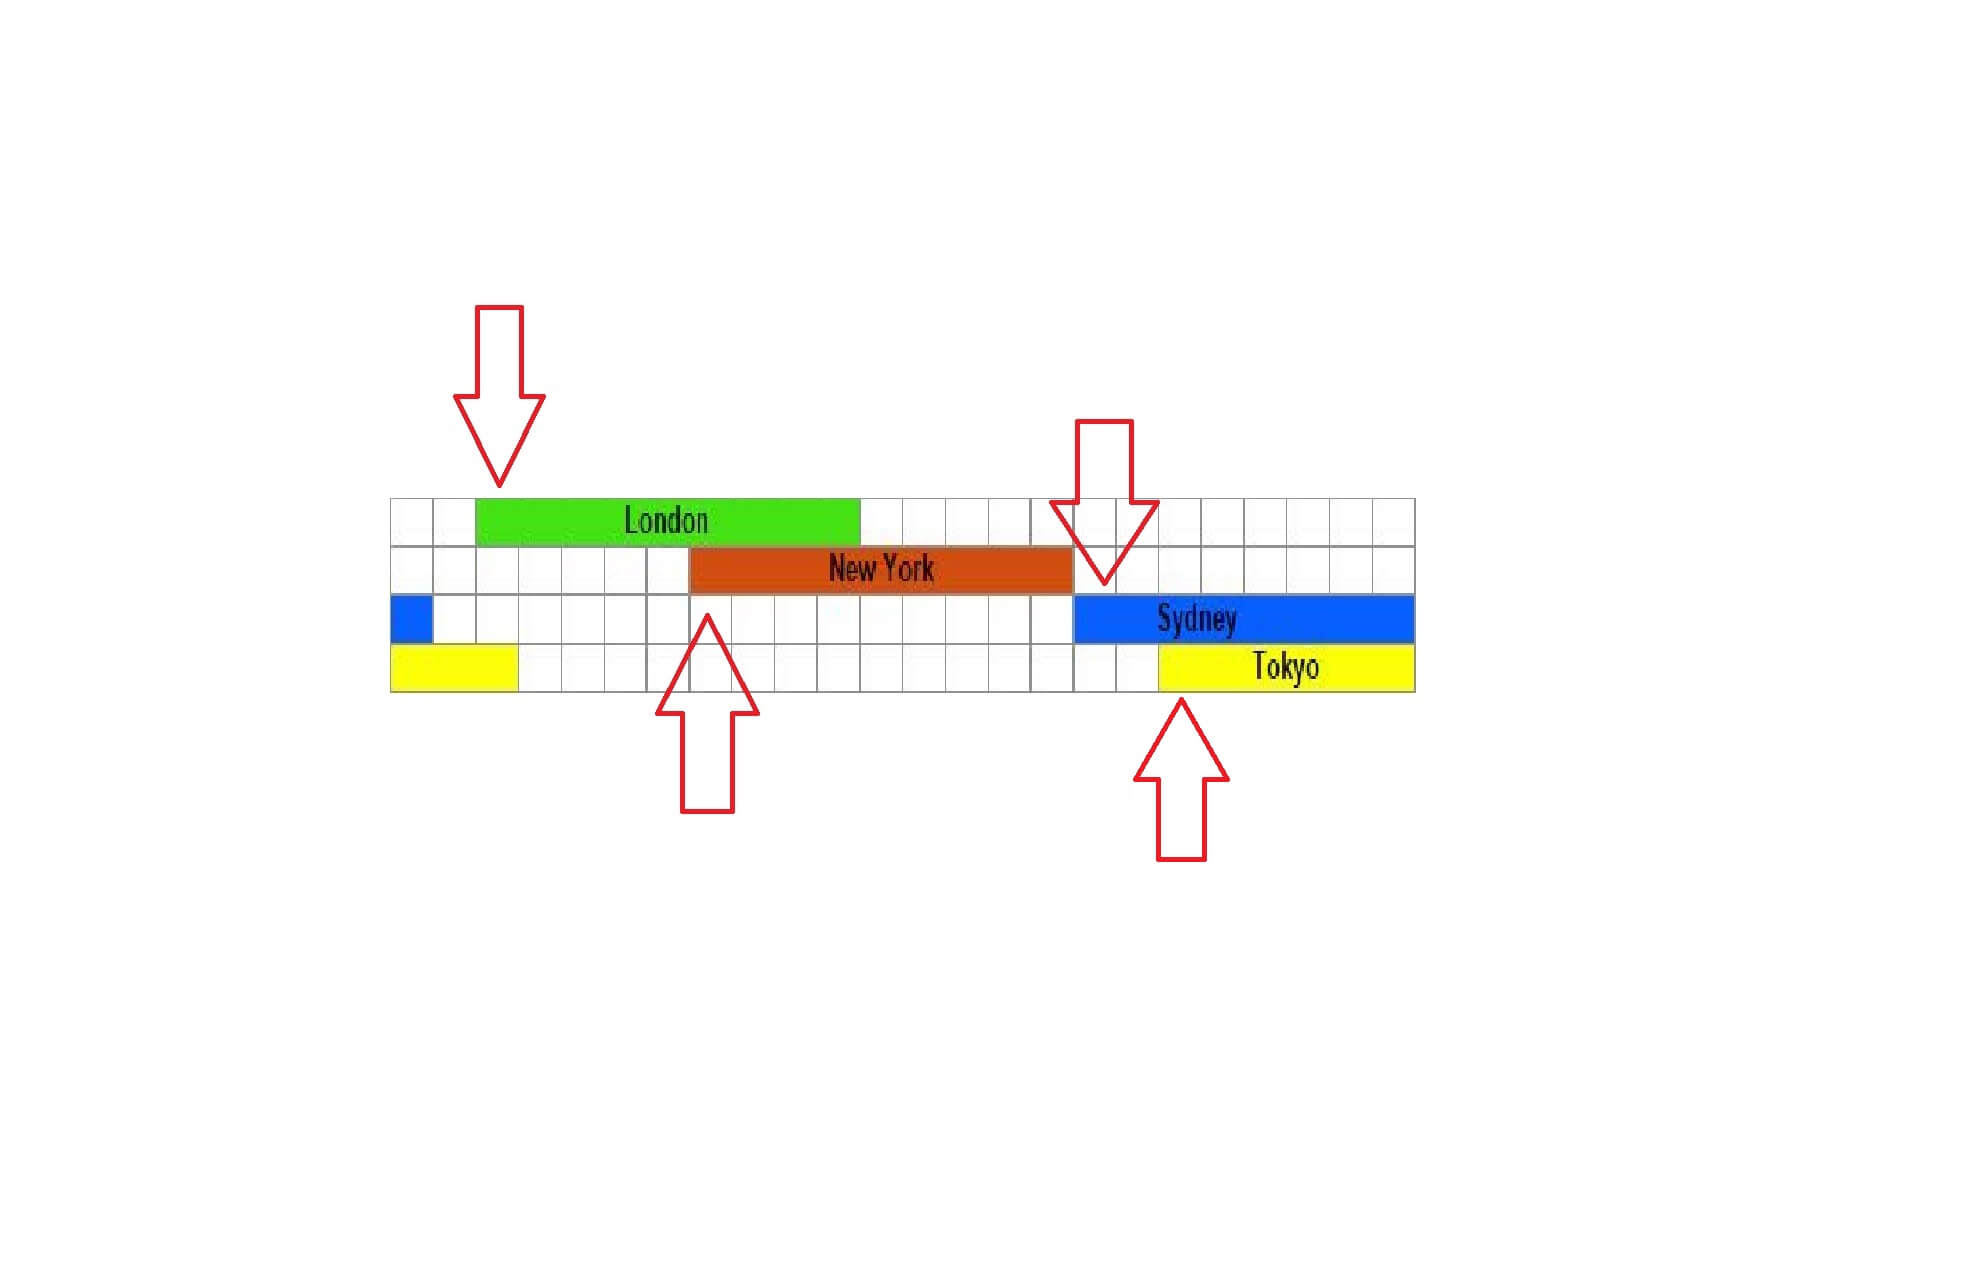
Economic Events to Watch Today
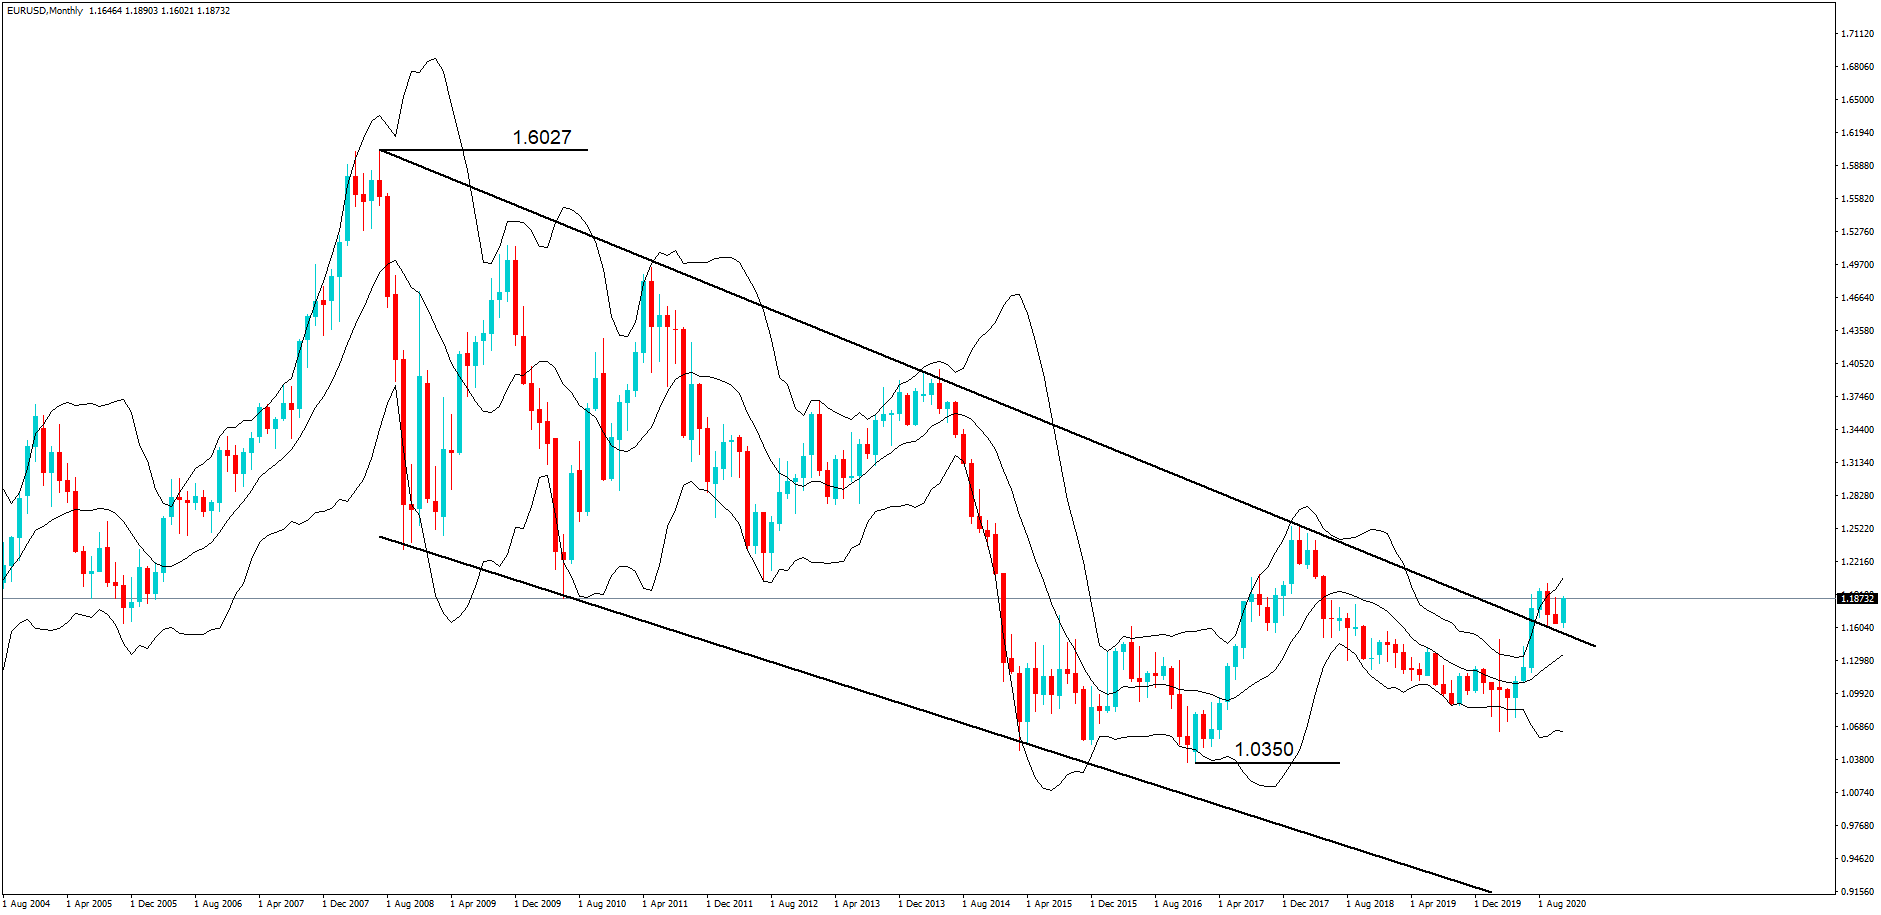
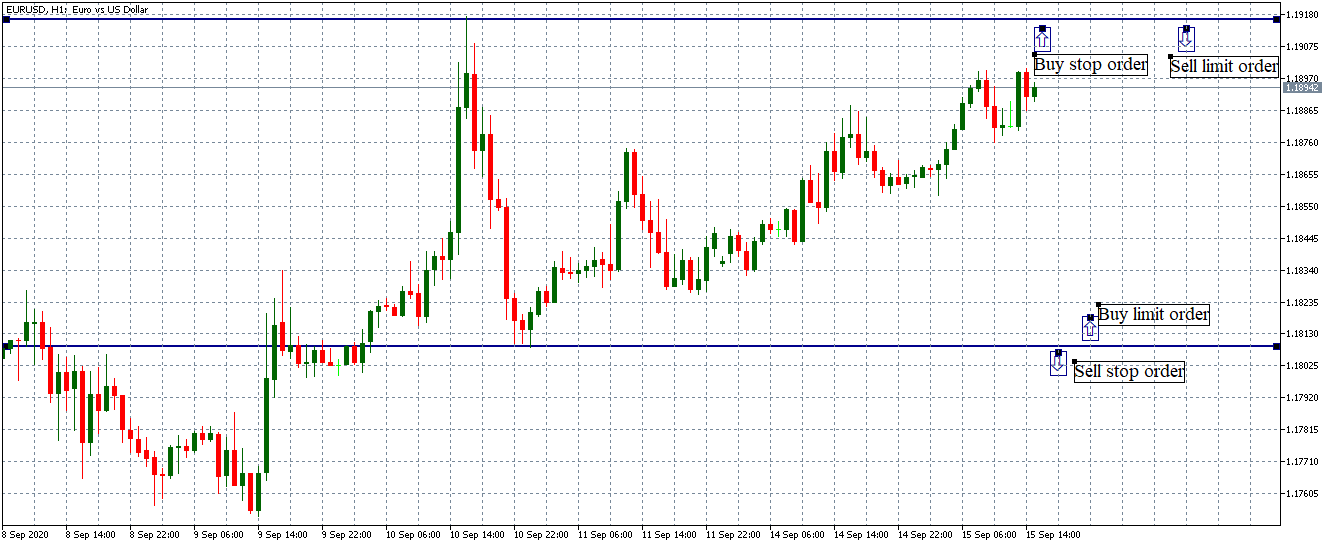
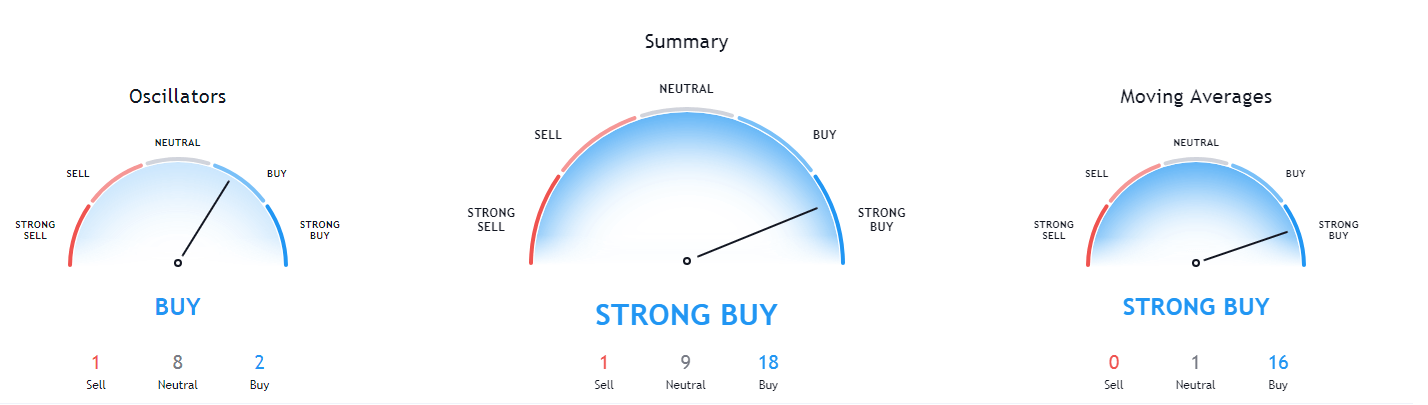
EUR/USD – Daily Analysis
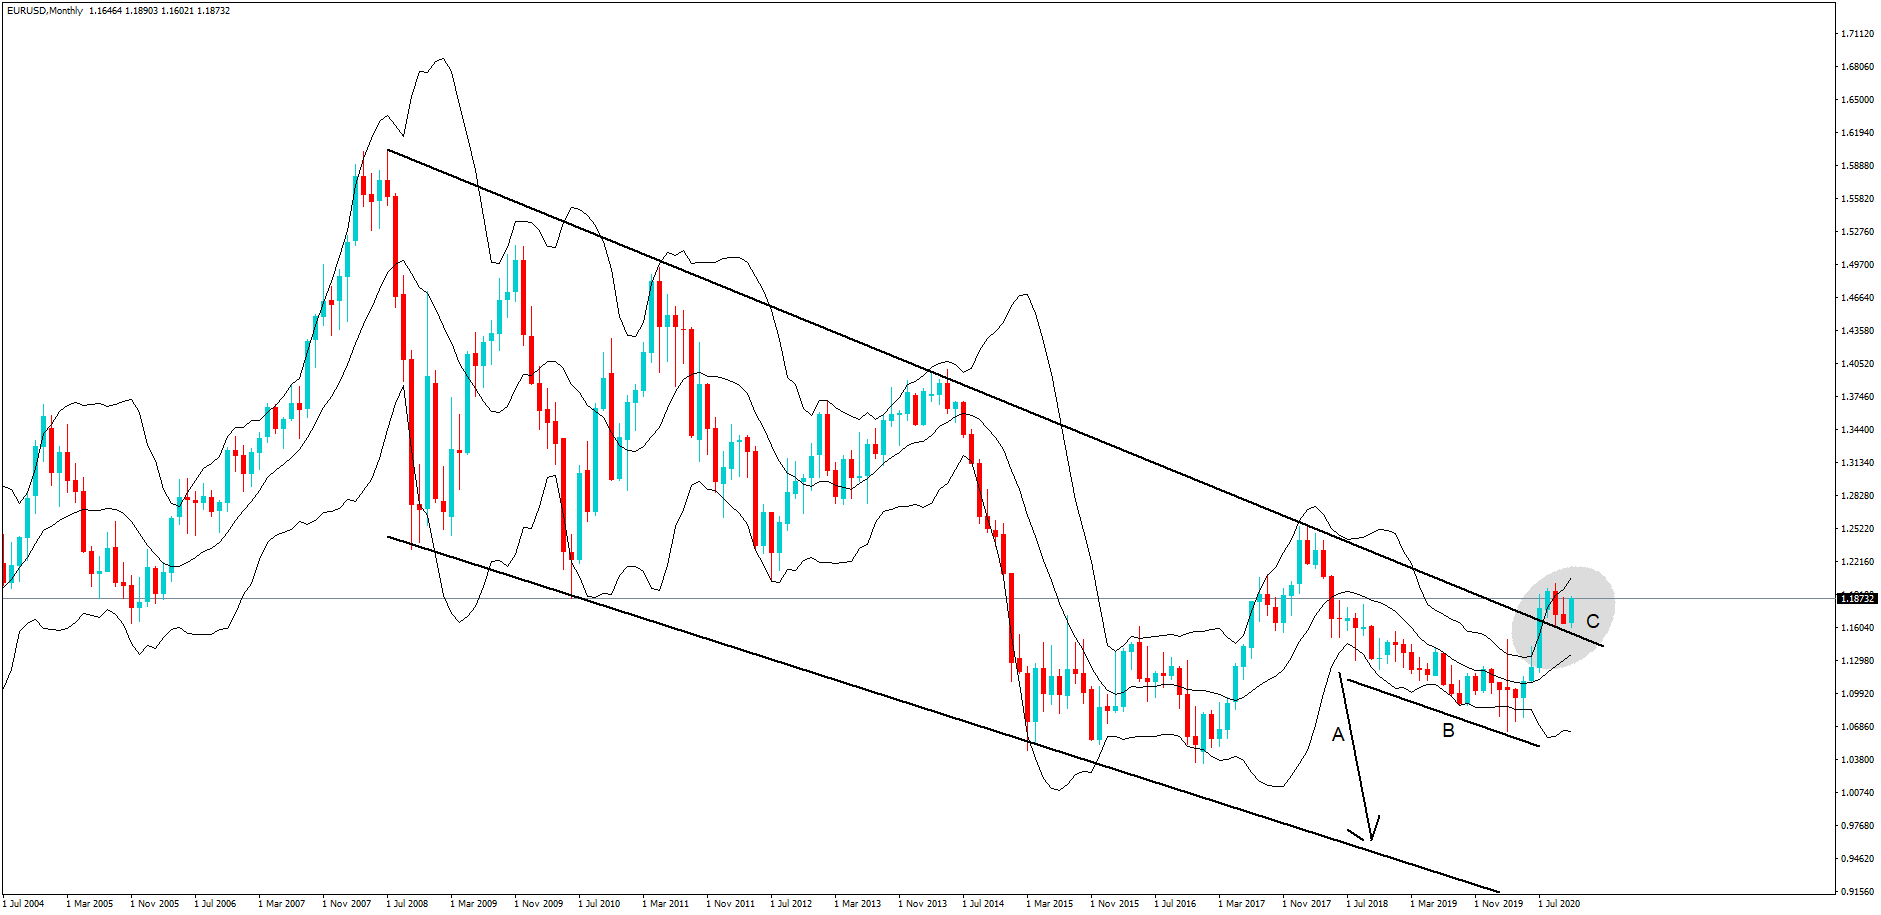
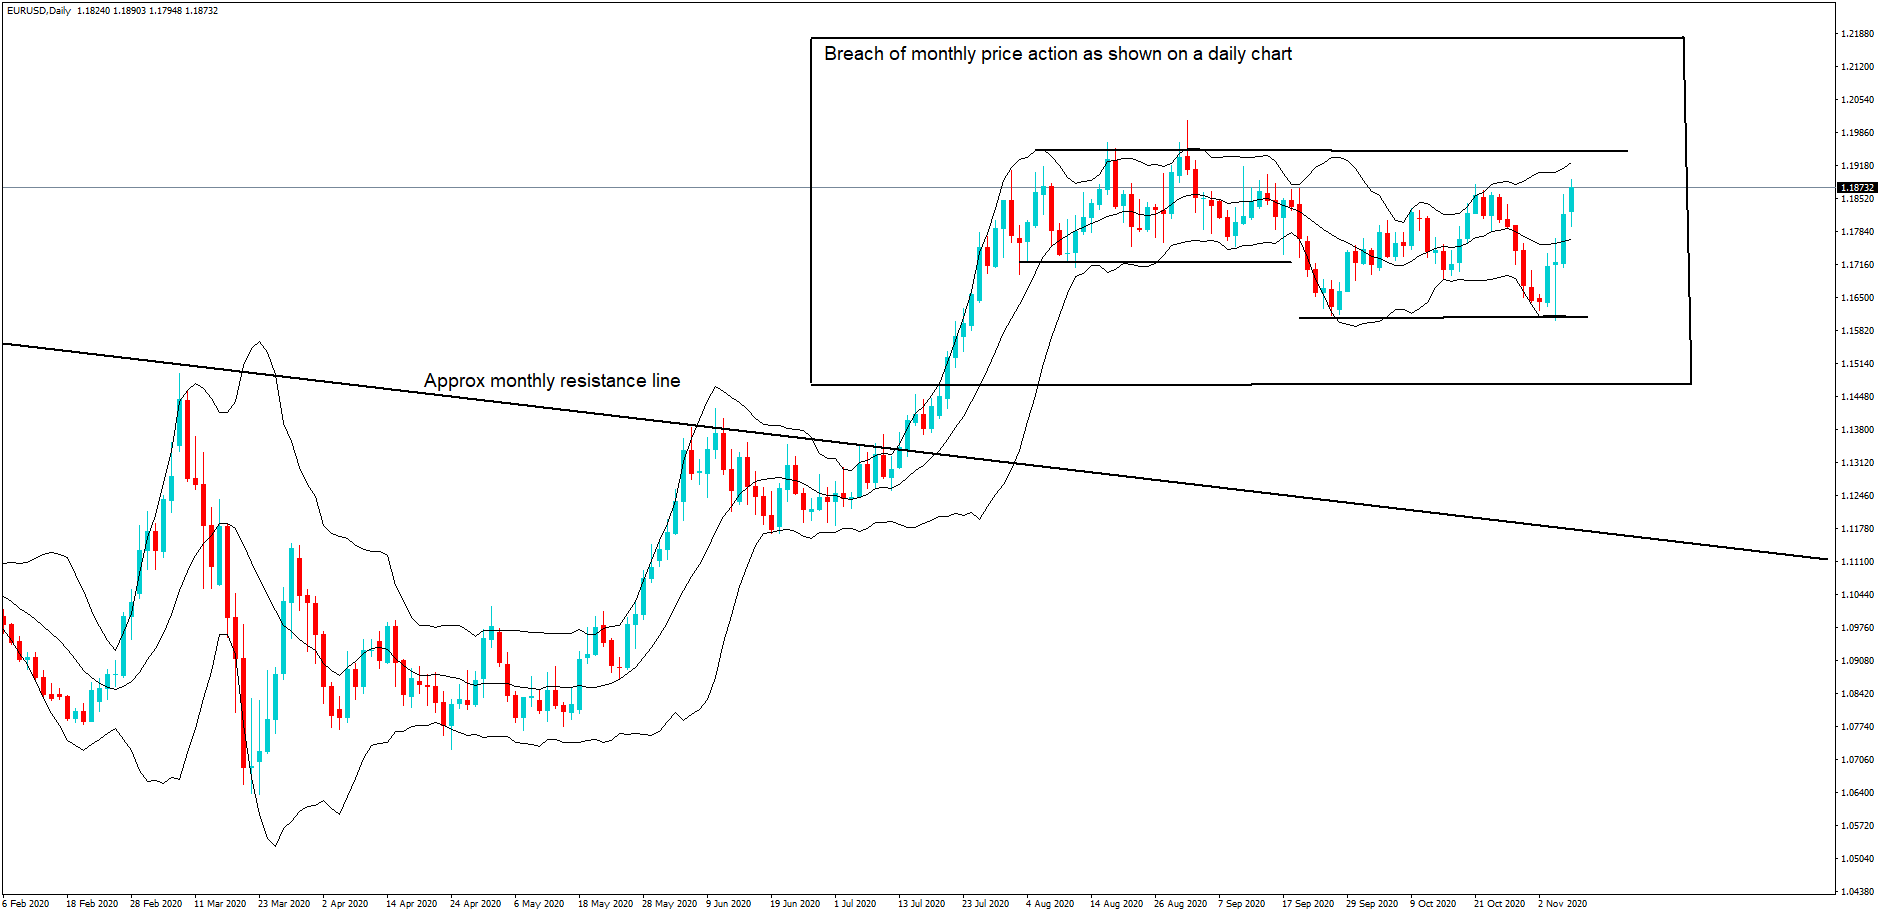
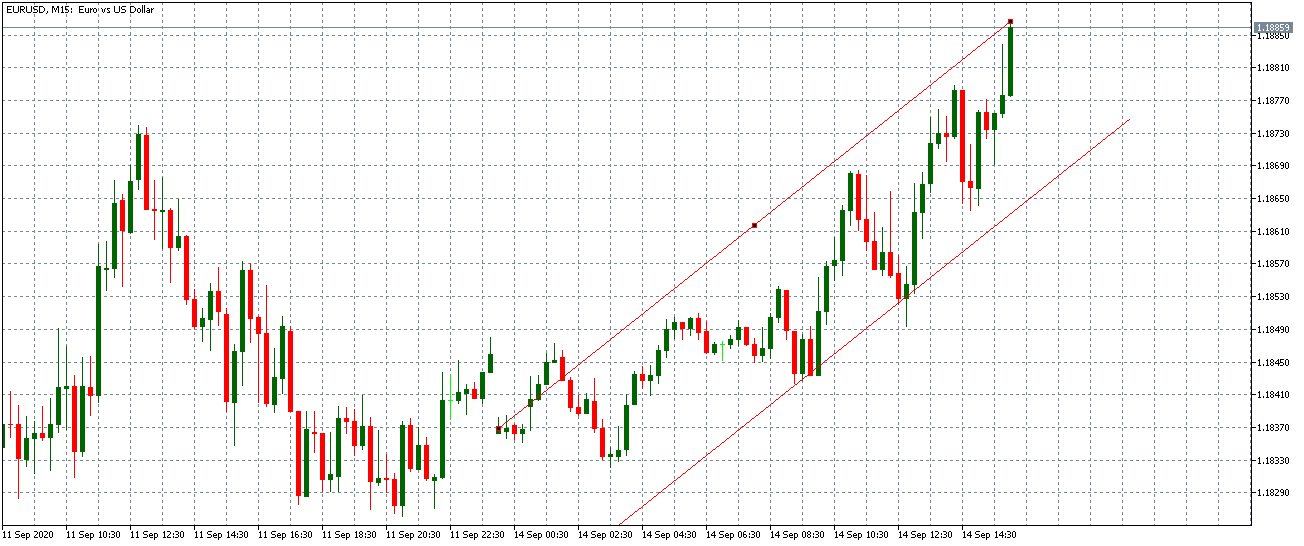
The EUR/USD currency pair managed to stop its previous day losing streak and remain bullish around the 1.1886 level mainly due to the broad-based U.S. dollar selling bias, triggered by the cautious sentiment around the U.S. stimulus story, which ultimately lends support to the currency pair. However, Mnuchin’s call to recollect funds allocated to Federal Reserve, which eventually weighed on the market trading sentiment, failed to provide any support to the greenback as the Republican heavyweight McConnell recently showed readiness to resume the discussions with the Democrats on a new COVID-19 relief package, which ultimately undermined the U.S. dollar.
That’s very surprising as the U.S. dollar usually draws bids alongside losses in the equities market. On the contrary, the buying interest around the single currency was capped by the intensifying virus fugues in Europe, which eventually becomes the key factor that has been capped further upside in the currency pair. At the moment, the EUR/USD currency pair is currently trading at 1.1888 and consolidating in the range between the 1.1865 – 1.1891.
The equity market has been declining since the day started amid mixed concerns over the U.S. stimulus story. The Mnuchin’s asked the Federal Reserve to return the remaining coronavirus stimulus funds, which could limit the central bank’s capacity to give additional support to businesses at a time when the coronavirus second wave is accelerating. Let me remind you that these funds were meant for global lending to local government, non-profits, businesses. These factors have been weighing on the market trading sentiment, which could be considered as the main factors that cap further downside in the safe-haven U.S. dollar losses.
On the contrary, Republican heavyweight McConnell recently showed a willingness to continue the negotiations with the Democrats on a new COVID-19 relief package. This news is negative for the U.S. dollar, as a stimulus package would have the effect of reducing the U.S. dollar.
As in result, the broad-based U.S. dollar failed to stop its overnight losses and remain bearish on the day mainly due to the mixed U.S. Stimulus story. Moreover, the doubts about the U.S. economic recovery in the wake of coronavirus resurgence also weigh on the U.S. dollar. Thus, the U.S. dollar losses could also be a key factor that kept the currency pair higher. Meantime, the dollar index unchanged at 92.306 (=USD), off Thursday’s low of 92.236, though it is still down 0.3% on the week.
On the bearish side, the intensifying market worries regarding the continuous hike in new coronavirus cases in Europe and the United States keep fueling the doubts over the global economic recovery through imposing back to back lockdown restrictions on economic and social activity, which eventually weighed on the shared currency and becomes the key factor that kept the lid on any additional gains in the currency pair.
In the absence of significant data/events on the day, the market traders will keep their eyes on the ongoing drama surrounding the U.S. stimulus package. In the meantime, the risk catalyst like geopolitics and the virus woes, not to forget the Brexit, will also be key to watch for a fresh direction.
Daily Technical Levels
Support Resistance
1.1836 1.1880
1.1820 1.1908
1.1791 1.1924
Pivot point: 1.1864
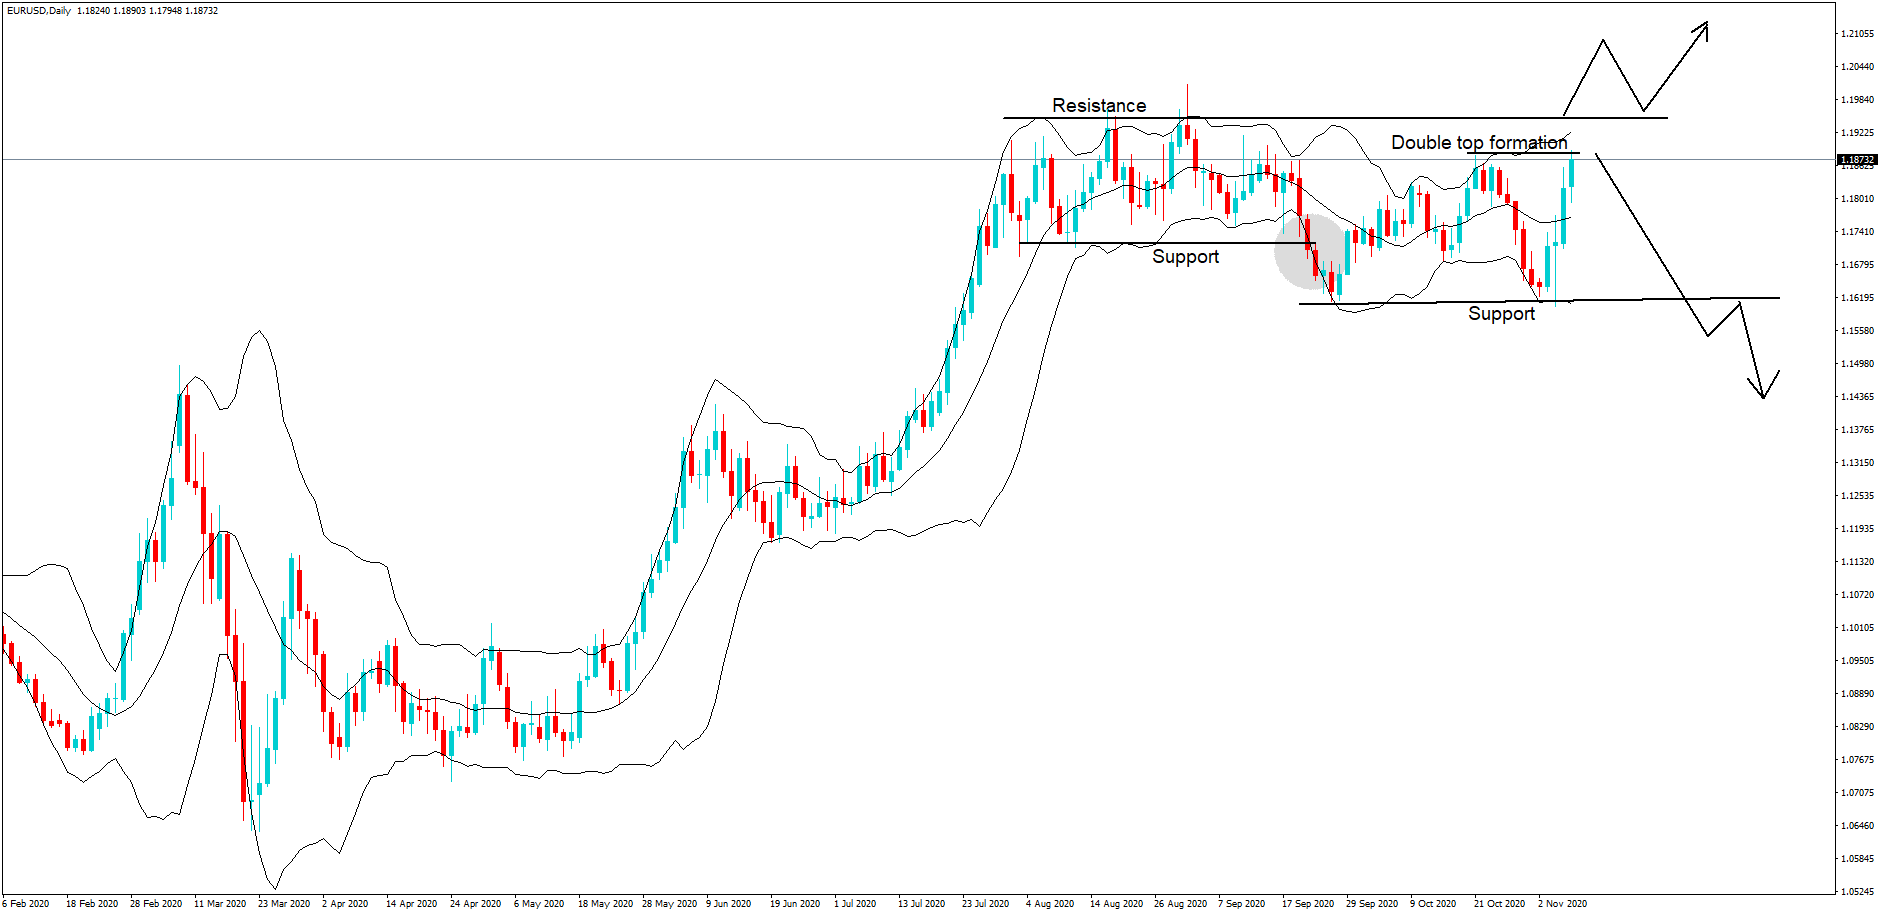
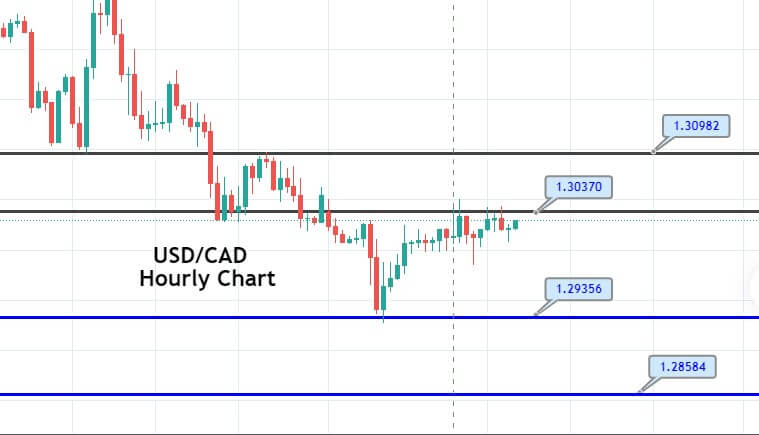
EUR/USD– Trading Tip
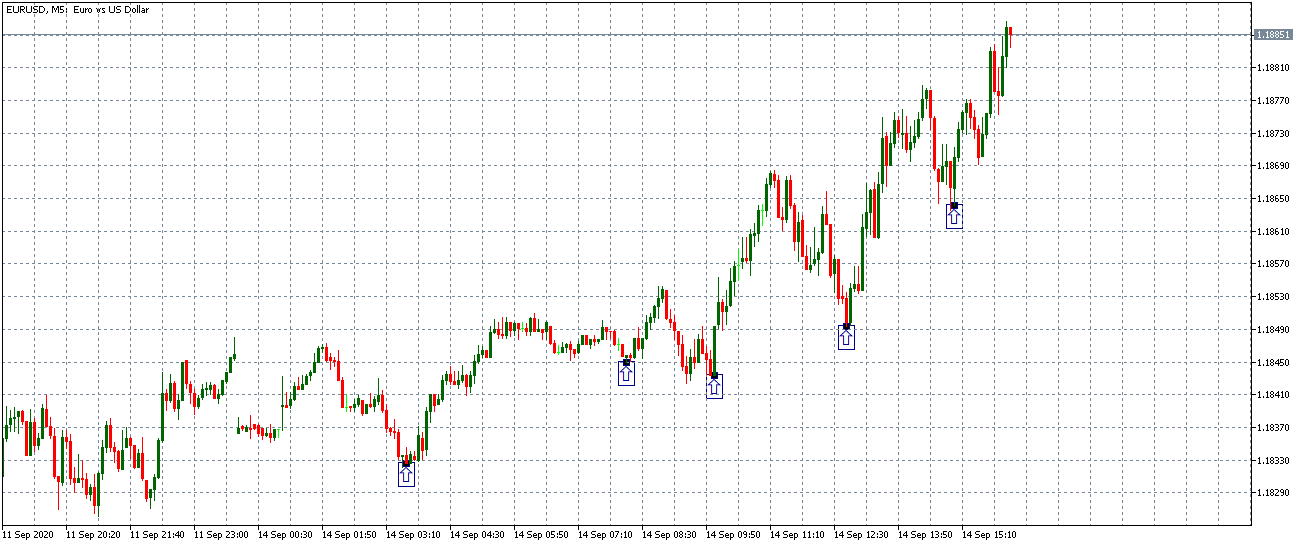
On Friday, the EUR/USD is trading with a bearish bias at the 1.1844 level, having violated an upward trendline on the hourly chart. On the lower side, the support stays at 1.1832, and below this, the EUR/USD may find next support at 1.1814. On the higher side, the resistance can be found at the 1.1867 level. The bullish bias remains dominants today as the MACD and 50 periods EMA support a bullish trend. We are already holding a buying trade from yesterday; therefore, you are advised to follow our forex signals page for more updates on the EUR/USD pair.
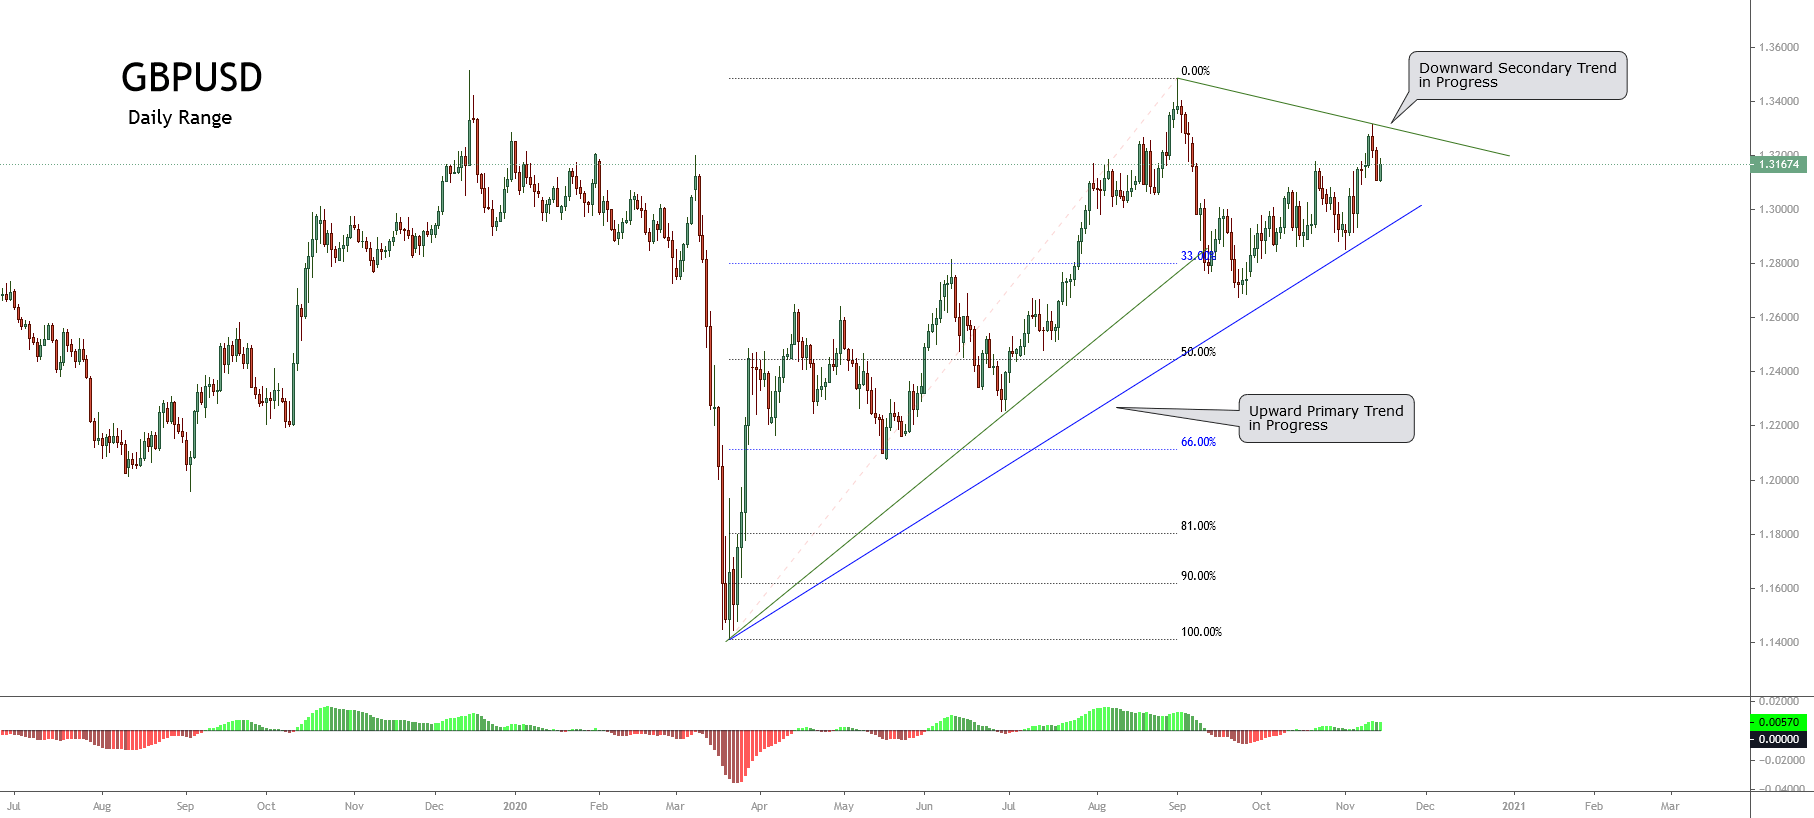
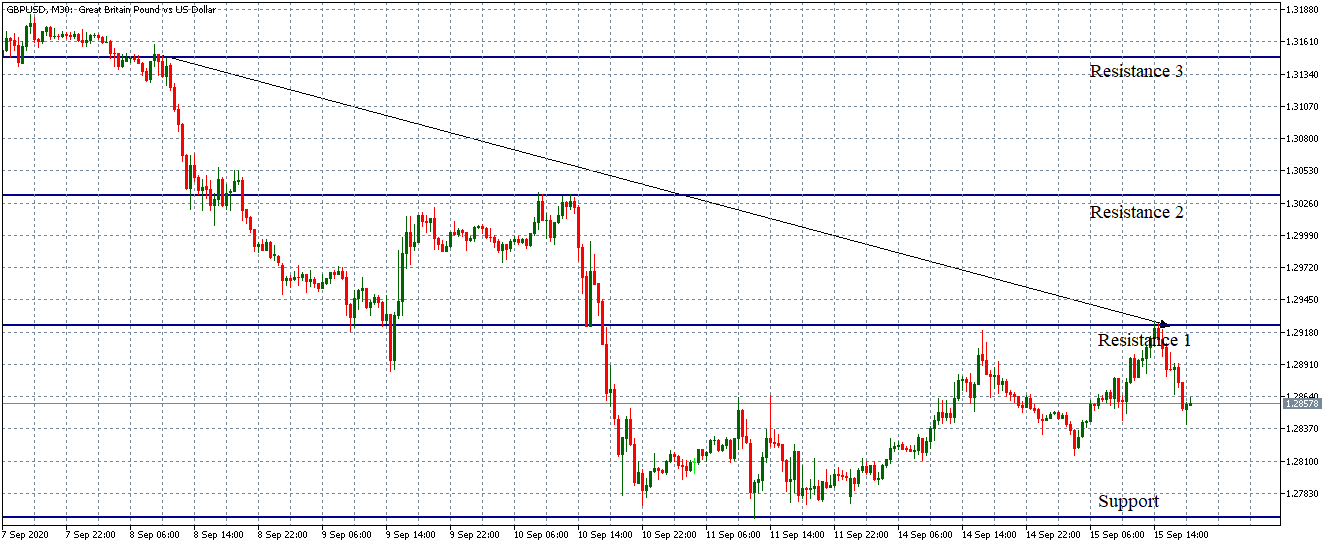
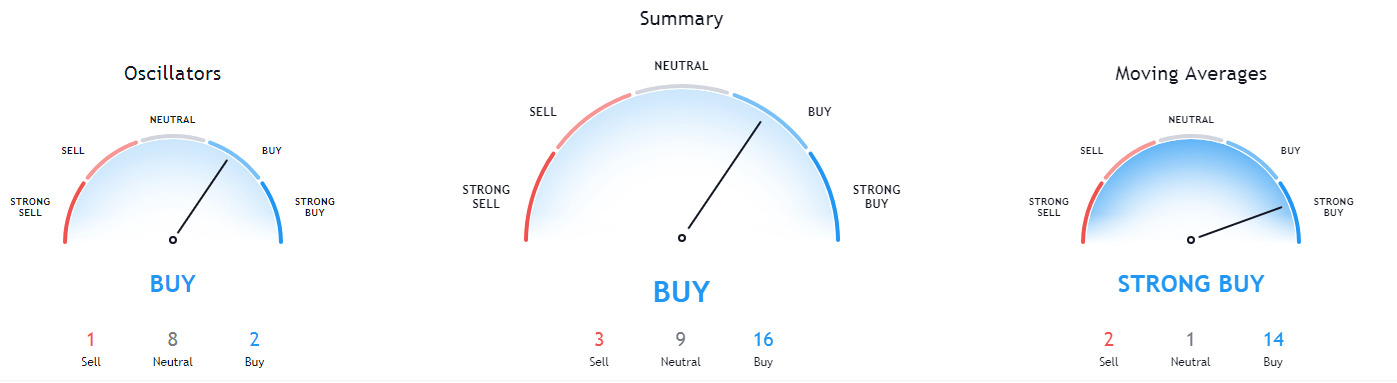
GBP/USD – Daily Analysis
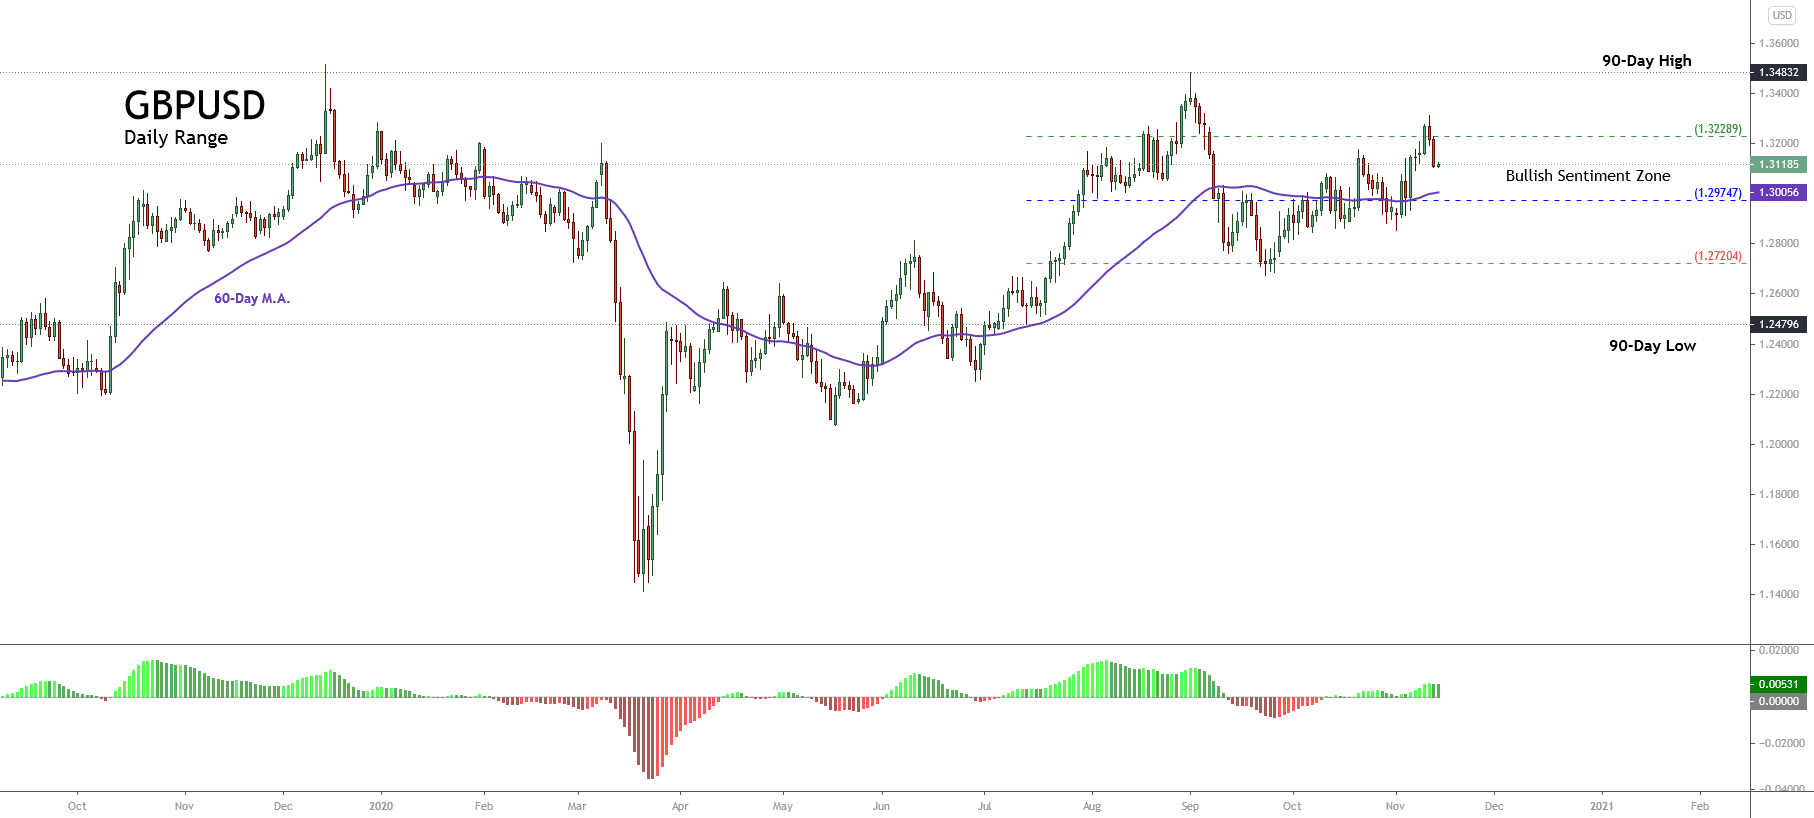
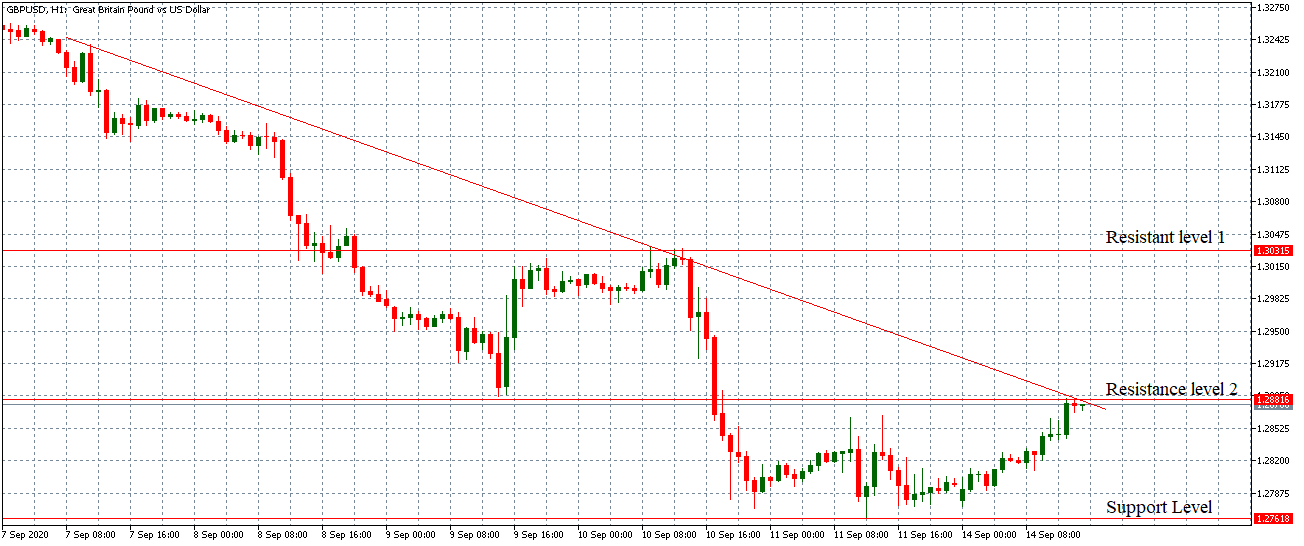
During Friday’s European trading session, the GBP/USD currency pair managed to gain positive traction for the second straight session and refresh the intra-day high around closer to 1.3300 level mainly due to the broad-based U.S. dollar fresh weakness, backed by the doubts over the next round of the U.S. fiscal stimulus measures, which eventually undermined the U.S. dollar and contributed to the currency pair gains.
On the contrary, the worsening coronavirus (COVID-19) conditions in the U.S. and Europe raised the fears of global economic recovery, which could be considered one of the key factors that kept the lid on any additional gains in the currency pair. In the meantime, the gains in the currency pair were also capped by negative Brexit news. At a particular time, the GBP/USD currency pair is currently trading at 1.3275 and consolidating in the range between 1.3247 – 1.3288.
According to the latest report, the European Union (E.U.) prepares for no-deal Brexit plans after the discussions’ dragging. The fears of no-deal Brexit were further bolstered after E.U.’s Chief Negotiator Michel Barnier self-isolated after a member of his team contracted the infection.
Despite the fears of no-deal Brexit and the Sino-American skirmish, not to forget the record single-day increase in COVID-19 cases, the currency pair managed to gain positive traction amid a weaker U.S. dollar. At the USD front, the broad-based U.S. dollar failed to gain any positive traction and edged lower on the day as doubts over the U.S. economic recovery remain amid the coronavirus crisis. The losses in the U.S. dollar kept the currency pair higher. Meantime, the dollar index unchanged at 92.306 (=USD), off Thursday’s low of 92.236, though it is still down 0.3% on the week.
In the absence of significant data/events on the day, the market traders will keep their eyes on the ongoing drama surrounding the U.S. stimulus package. In the meantime, the risk catalyst like geopolitics and the virus woes, not to forget the Brexit, will also be key to watch for a fresh direction.
Daily Technical Levels
Support Resistance
1.3155 1.3236
1.3118 1.3280
1.3073 1.3317
Pivot point: 1.3199
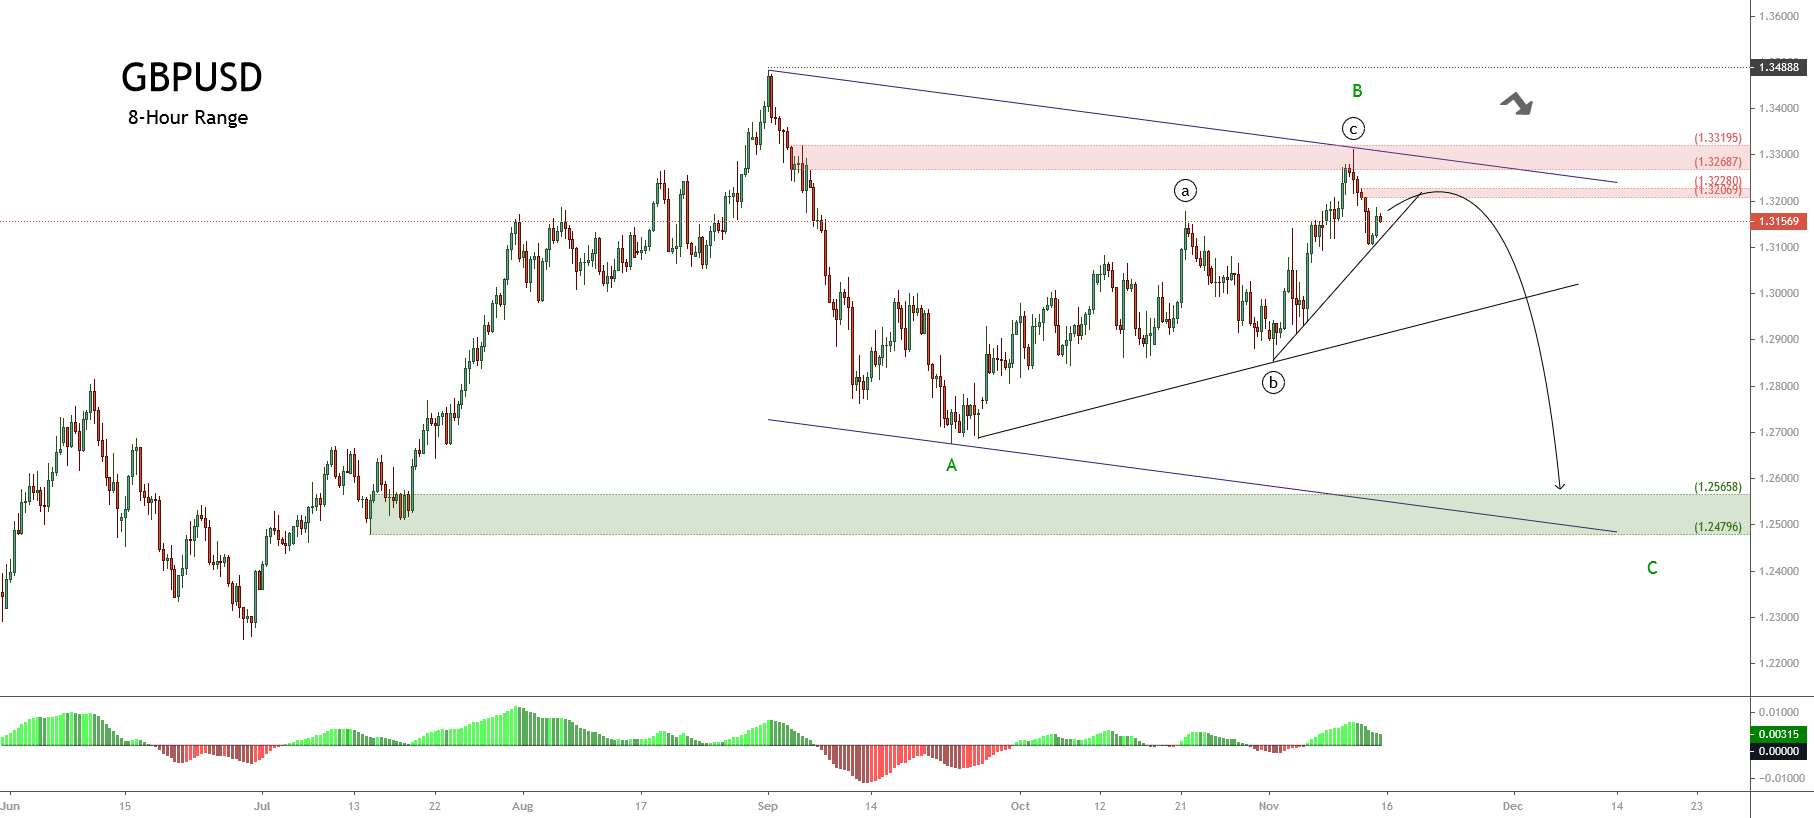
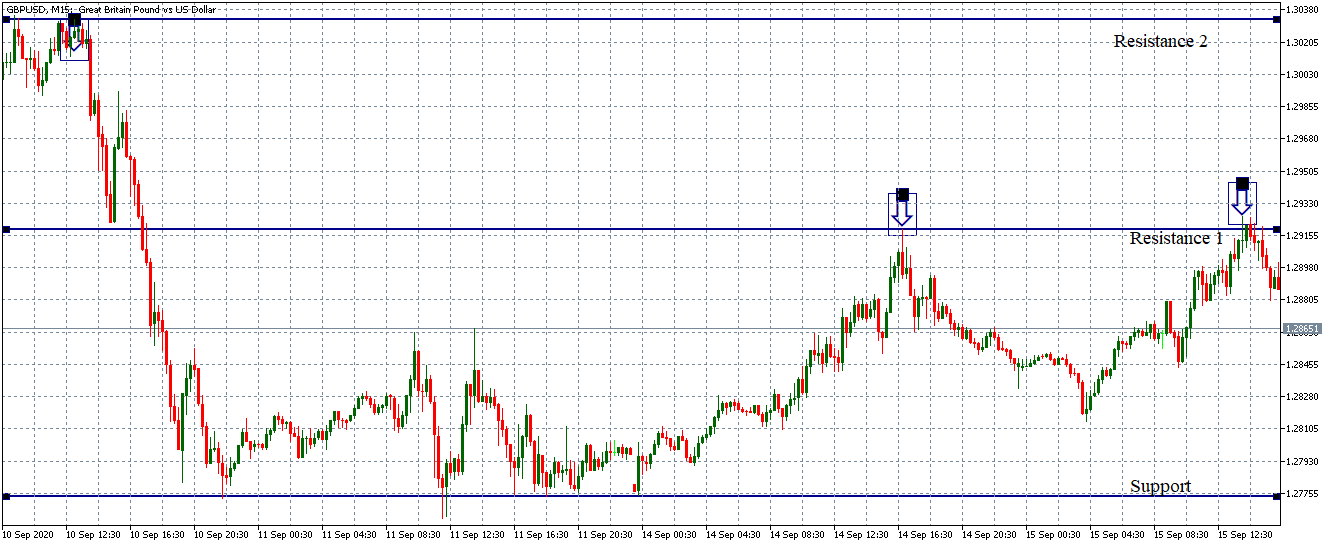
GBP/USD– Trading Tip
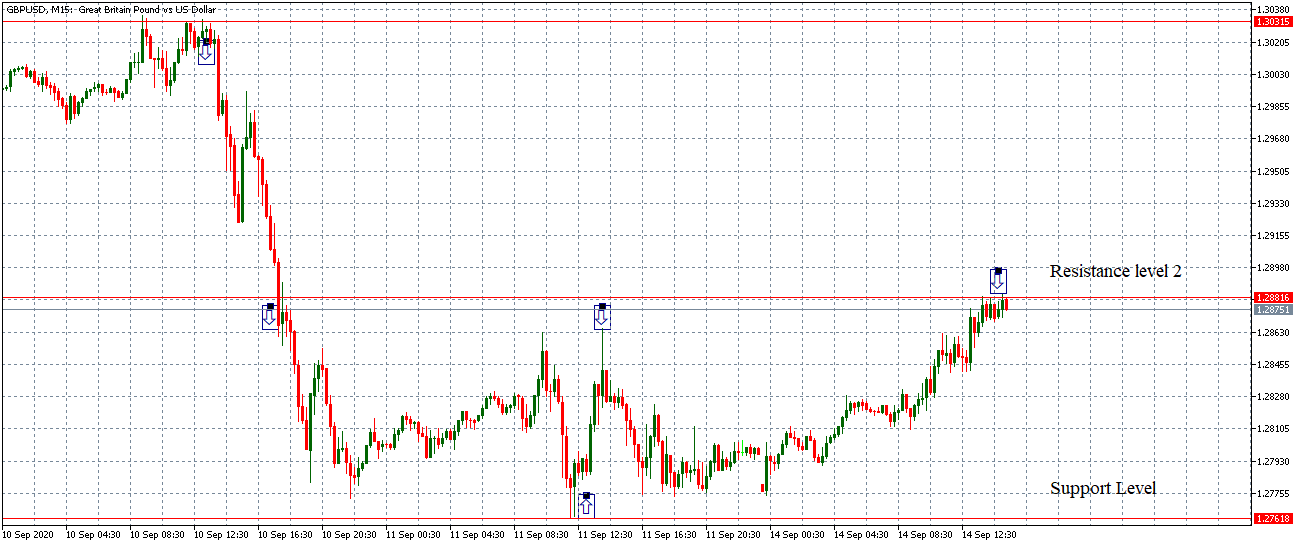
Most technical levels are the same as Sterling didn’t make any significant change in the market. The GBP/USD pair is trading bullish at the 1.3279 level, holding over the 1.3227 support level, which is extended by an upward trendline on a 2-hour timeframe. The Cable is likely to face immediate resistance at the 1.3297 area, which will be confirmed if the candle starts closing below this level. However, the bullish breakout of the 1.3297 level can drive further upside movement until the 1.3370 level today.
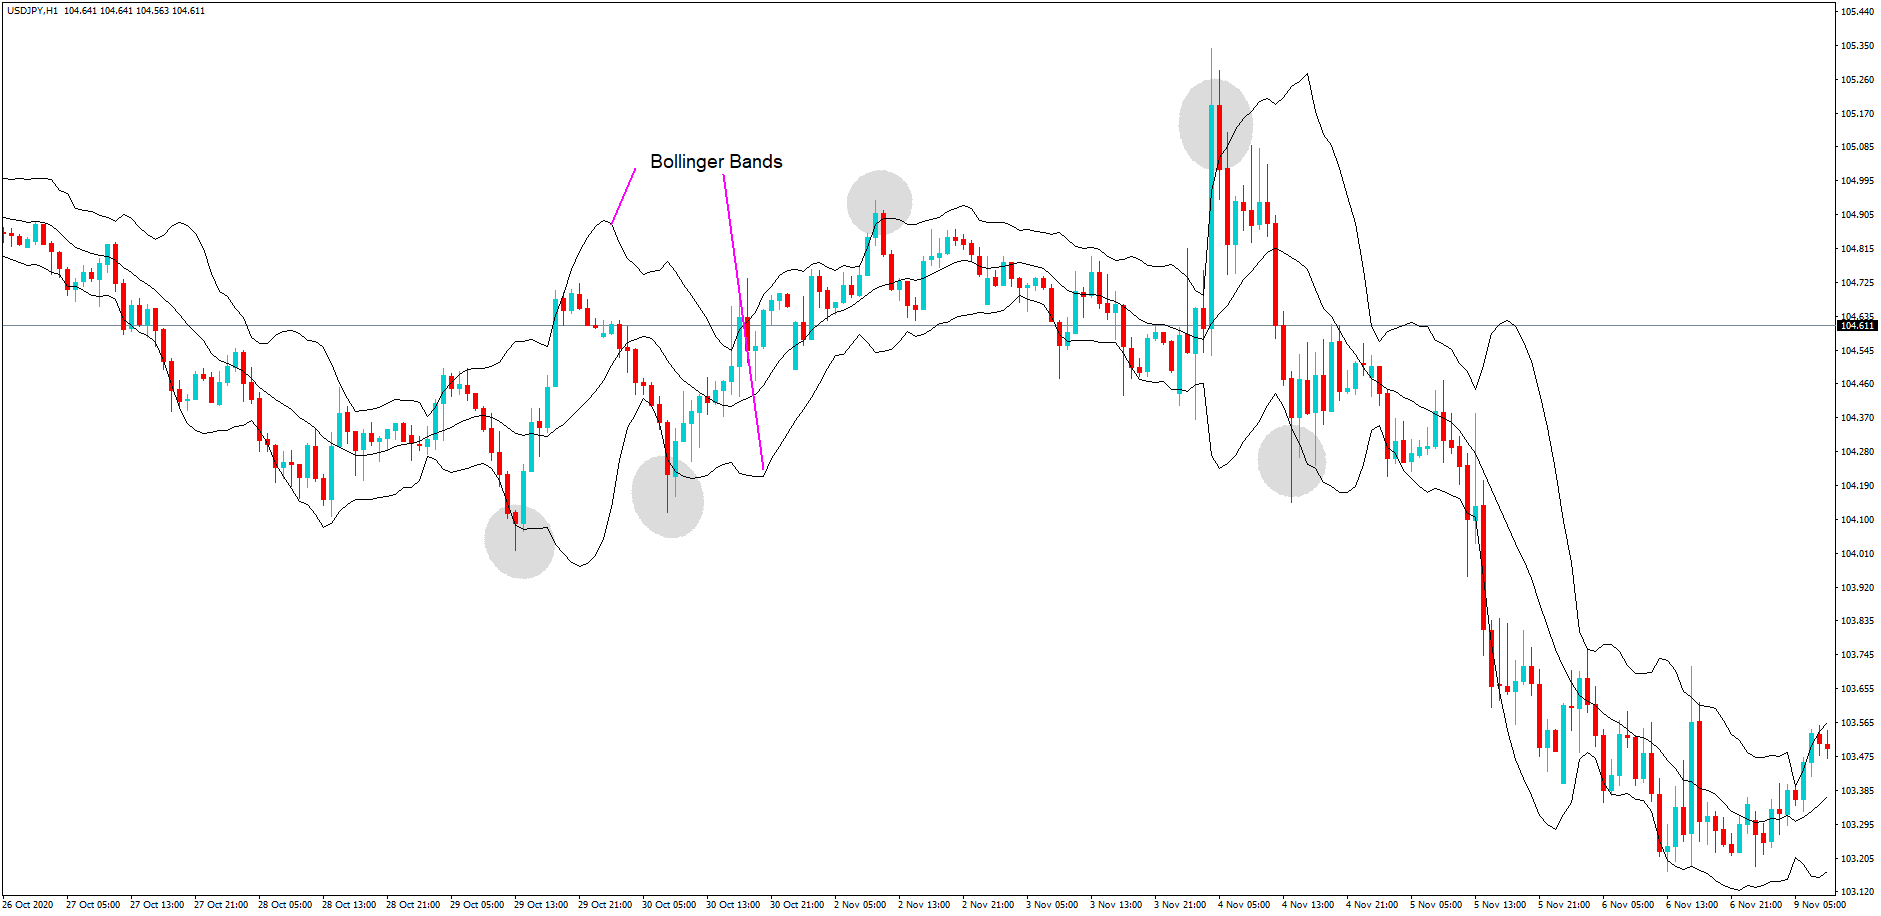
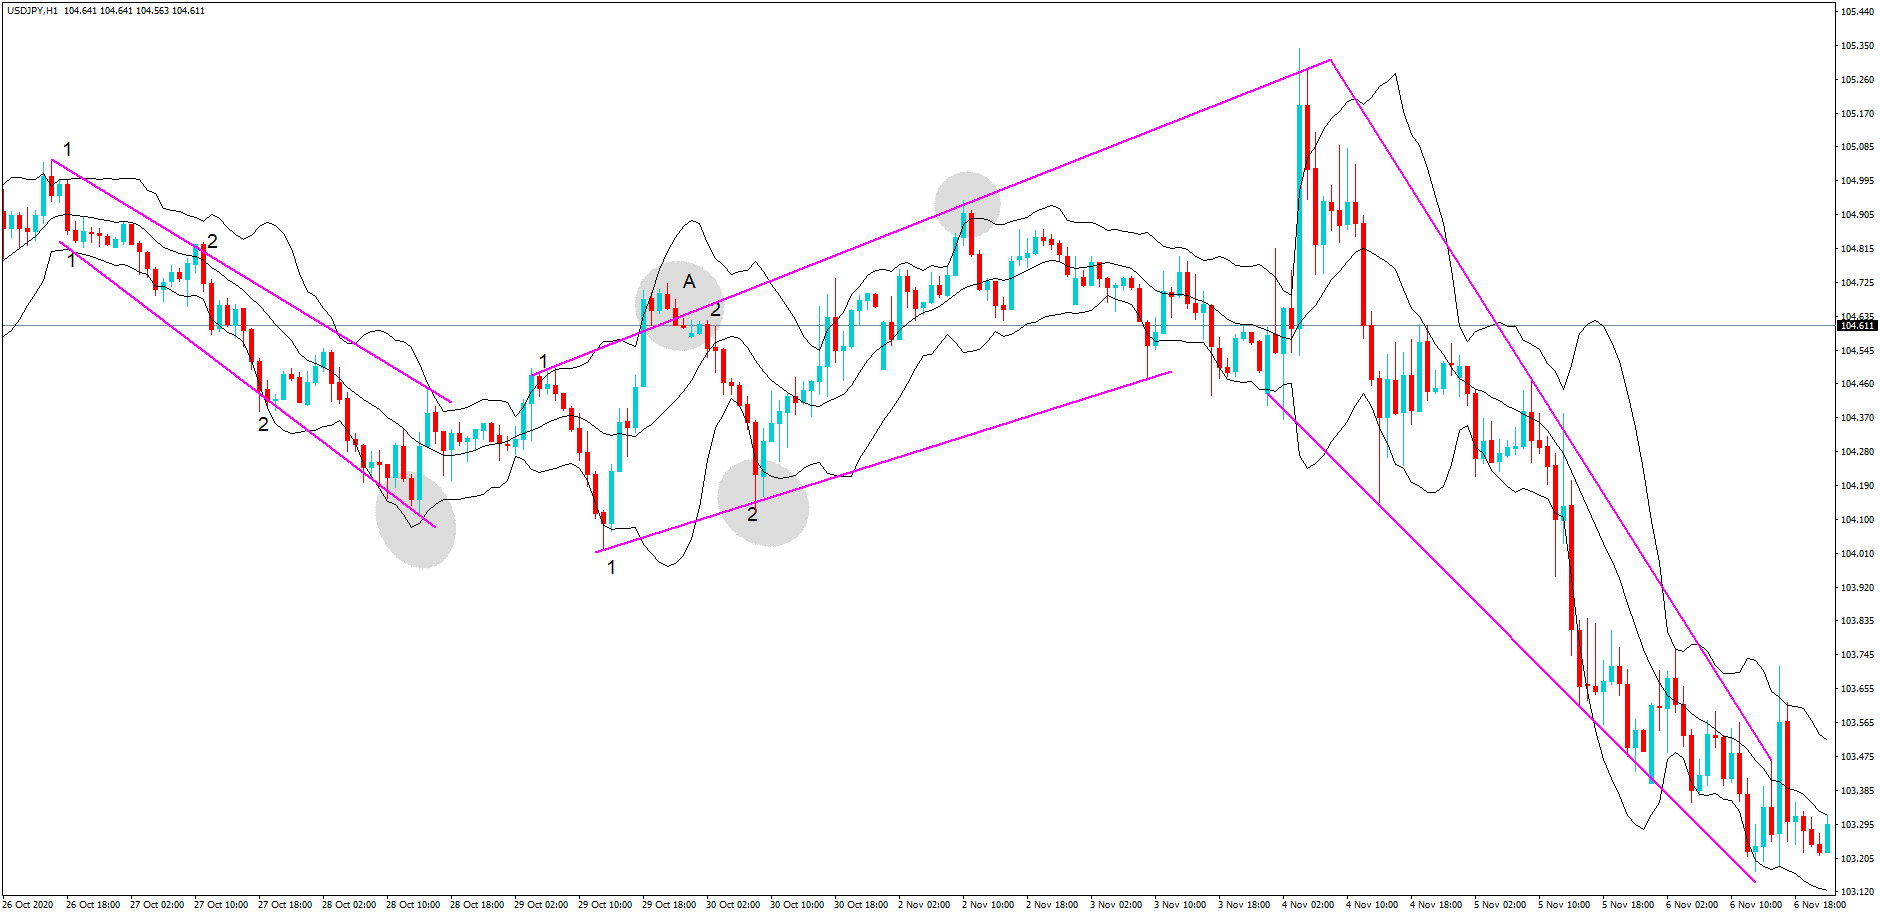
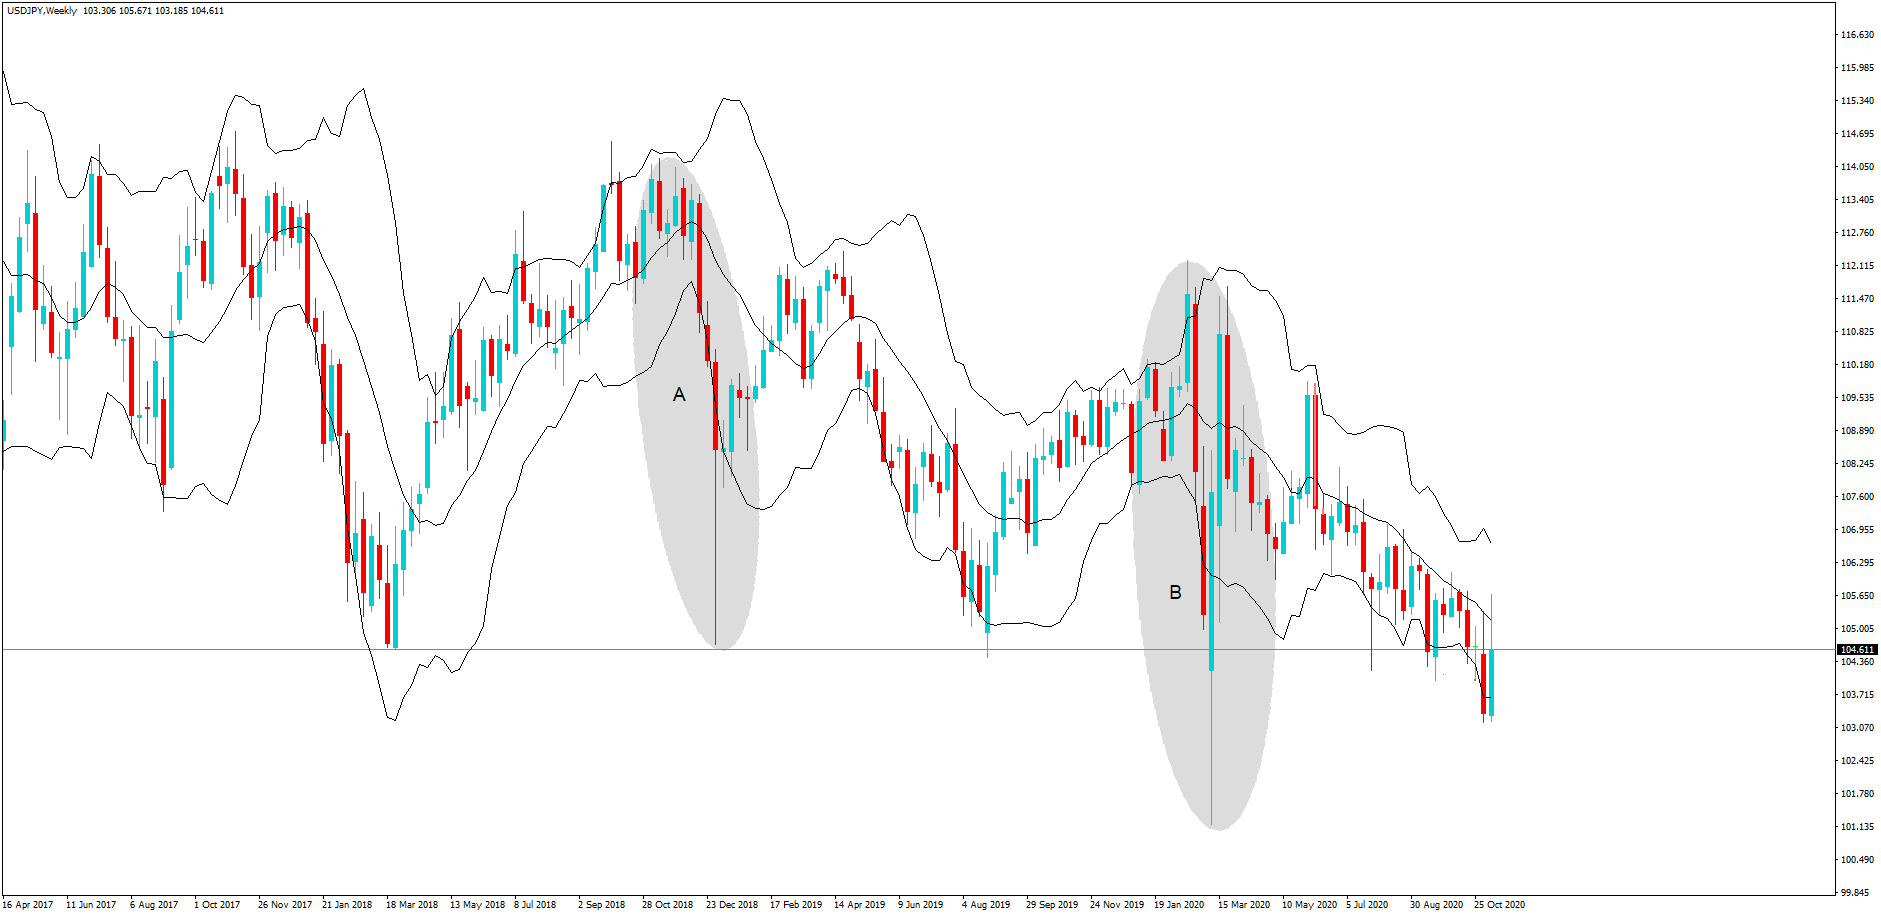
USD/JPY – Daily Analysis
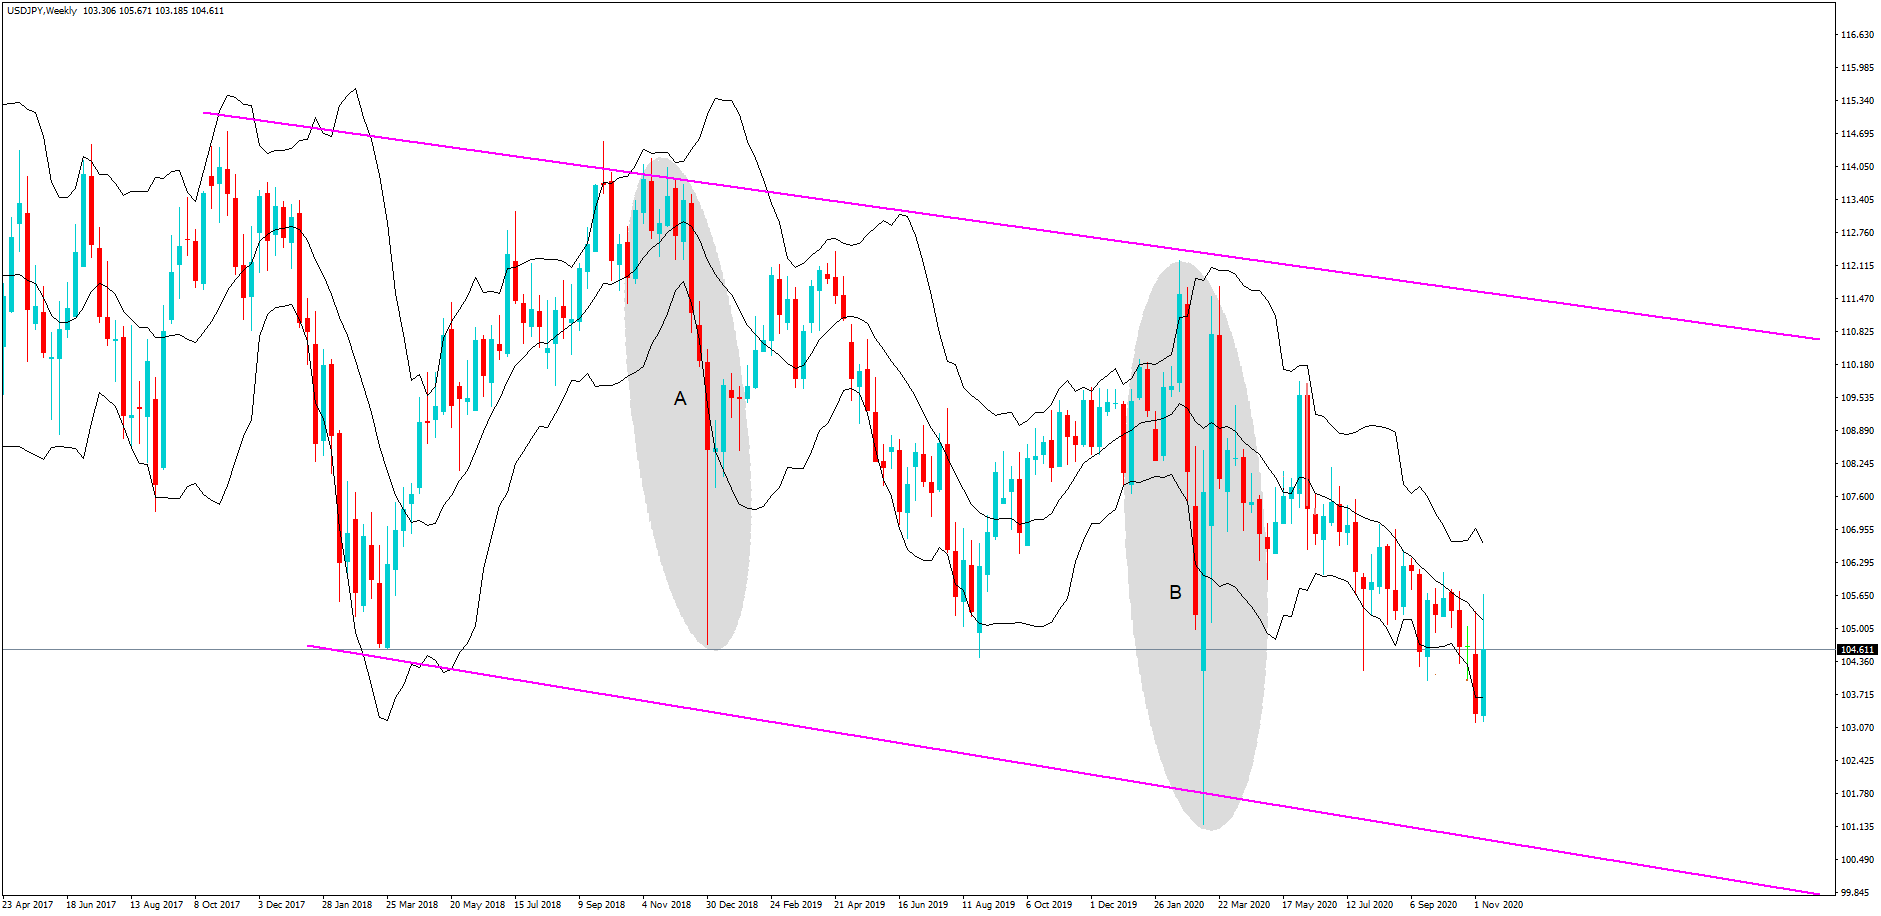
A day before, the USD/JPY pair was closed at 103.795 after placing a high of 104.207 and a low of 103.650. The currency pair USD/JPY remained bearish for the 5th consecutive session on Wednesday and dragged its prices below the 103.700 level. The USD/JPY pair was extending its losses due to the U.S. dollar weakness on Wednesday despite the latest optimism regarding the coronavirus vaccine. On Wednesday, Pfizer announced that its vaccine was 95% effective in its study and planning to seek authorization within days.
This news added to the market’s risk sentiment and supported the equity market by providing a 0.45% gain to Dow Jones and 0.04% to NASDAQ. The latest news from Pfizer and BioNtech failed to impress the market, and the pair USD/JPY continued following the U.S. dollar’s weakness on Wednesday. The currency pair was under pressure as the coronavirus situation was getting worse day by day in the U.S. as the death toll surpassed 250,000 level in the major economy. According to Johns Hopkins University, the coronavirus has cost almost 250,180 American lives so far, and the count was increasing day by day. This raised fears that more restrictions could be imposed in many states, which would slow down the economic recovery. These fears weighed in the local currency U.S. dollar, and hence, USD/JPY remained under pressure for the 5th consecutive session on Wednesday.
Given the rising number of infections in the country, the States like California and Illinois stretched their restrictions to battle the rising number of cases as any financial aid package was not close to being delivered by Congress. The rising number of coronavirus cases in the U.S. has forced U.S. officials to announce that public schools in New York City will close again on Thursday as the city has reached a 3% coronavirus test positivity rate. These fears also kept the U.S. dollar under pressure on Wednesday.
The House Speaker Nancy Pelosi and Senate Minority Leader Chuck Schumer urged the Senate Majority Leader Mitch McConnell to resume talks related to the coronavirus relief package. However, McConnell was insisting on a targeted package. The U.S. dollar came under further pressure after the hopes for the talks for further stimulus package increased and weighed on the USD/JPY pair.
On the data front, at 02:00 GMT, the TC Long Term Purchases surged to 108.9B from the expected 41.5B and supported the U.S. dollar. At 18:30 GMT, the Building Permits for October came in line with the projections of 1.55M. The Housing Starts rose to 1.53M from the expected 1.45M and supported the U.S. dollar that ultimately capped further losses in the USD/JPY on Wednesday. On the Japanese side, the Trade Balance for October raised to 0.31T against the 0.11T and supported the Japanese Yen that added further pressure on the USD/JPY pair on Wednesday.
Daily Technical Levels
Support Resistance
103.58 104.16
103.32 104.48
102.99 104.74
Pivot point: 103.90
USD/JPY – Trading Tips
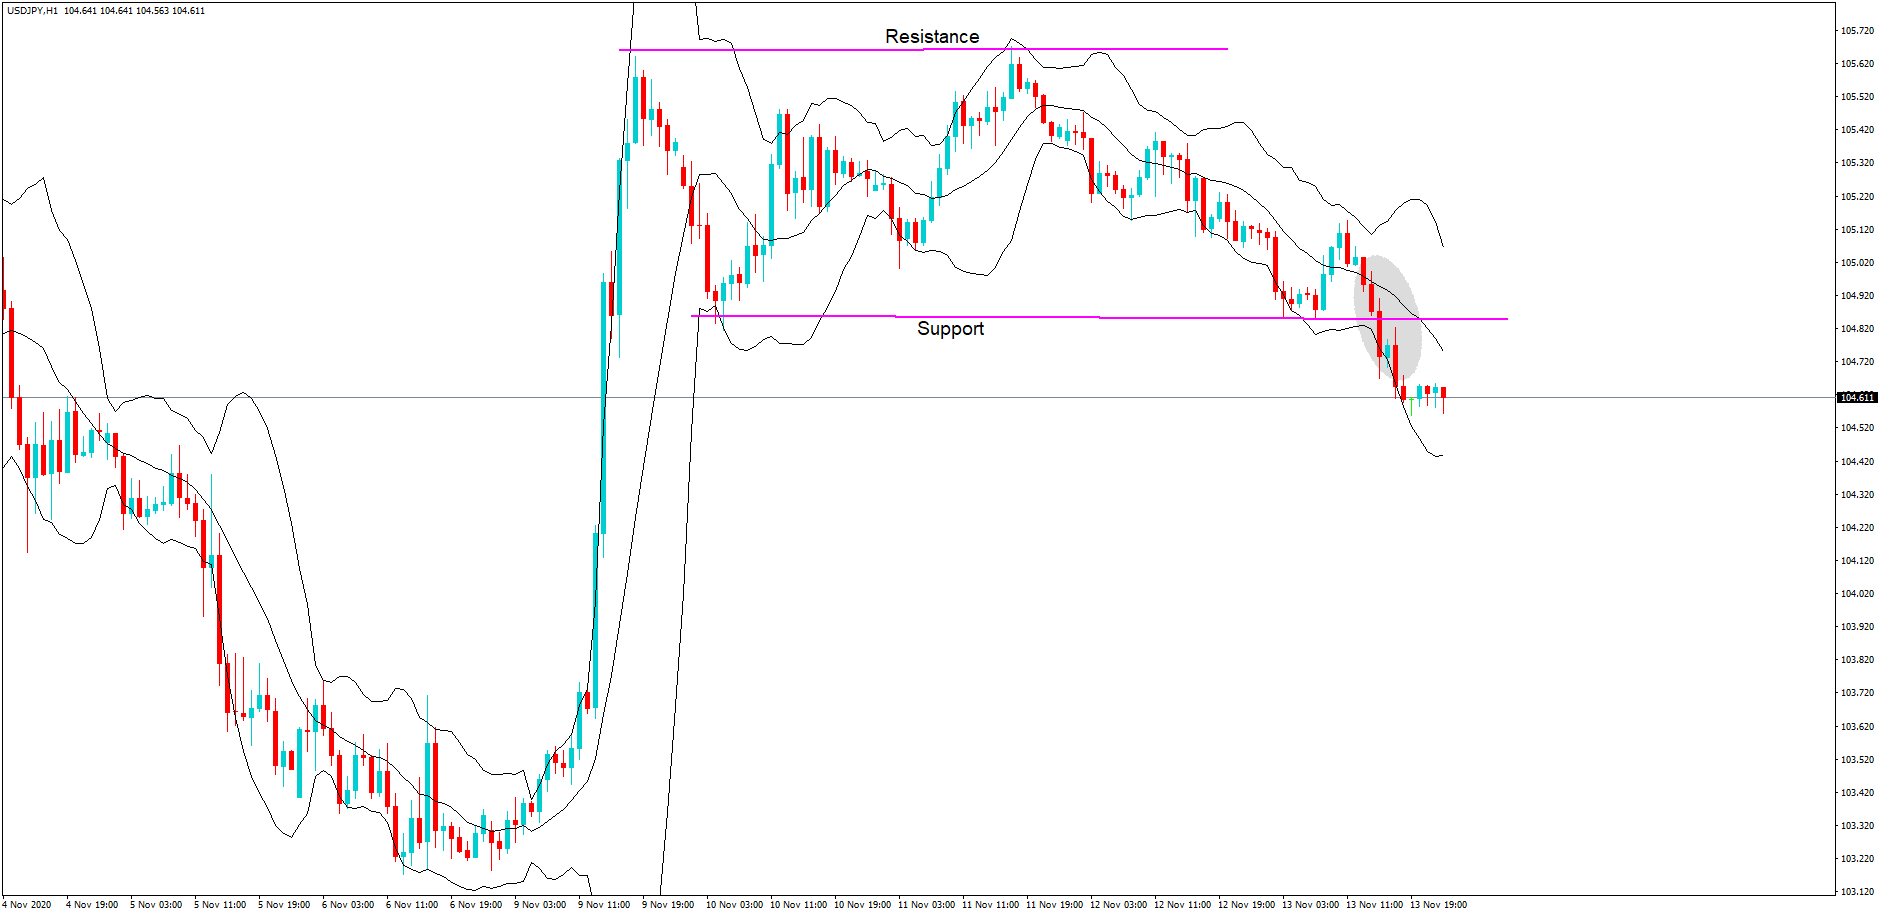
The USD/JPY extends its bearish trend below the 104.430 level, falling from the 104.850 support area. On the lower side, the USD/JPY pair is likely to find support at the 103.800 level, and violation of this level can also extend further selling bias until 103.227. On the higher side, the USD/JPY safe-haven pair may find resistance at 104.400 and may help us capture a selling trades below this level as the MACD and RSI support the selling trend today. Good luck!