Categories
Forex Videos

How To Trade Forex Like Bankers Do & Spot Their Tactics!


A retail trader’s insight into how bankers trade Forex


In this session, we will give retail traders some insight into how professional bankers trade forex, with their own bank’s money, in the forex market.

Wouldn’t it be absolutely fantastic if everybody traded forex the same way?  But of course, that is not the case because traders use different time frames, have different opinions about where currency exchange rates should be, they have different views on political and economic situations which will affect forex exchange rates, and this dynamic array of variances makes Forex moves very difficult to predict on a long-term basis.  Situations can change in the blink of an eye and cause price action moves and reversals, which nobody could have foreseen.

However, if retail traders knew what was going on behind the scenes at a major investment bank, might it give them a better understanding of how price action is affected by the big guns’ actions?  Well, yes, it would.

Firstly, it is he said that under 10% of bank traders’ own banks’ funds, accounts for 90% of all forex volumes. The best way to explain this is to say that the average forex retail trader probably trades between a couple of dollars per pip, with larger account balance traders ramping their trades up to $10 or a standard lot, equivalent, and perhaps a little more when risk suits. And now factor in the fact that over 75% of retail traders lose all of their money in the first 6 months of trading.

And now, let’s look at bankers. The majority of their trading is for their corporate or high net worth client base, where they instigate forex trades on those client’s behalf. And where some of these trades are speculative, and some of these trades are because of clients doing business in other currencies abroad, or perhaps hedging against inflation or portfolios or fluctuating exchange rates, etc.

But when the bankers themselves come to trade, these guys do not mess about. They are likely to instigate a spot or forward Forex trade in ticket sizes ranging from $10 million up to $500 million.  And in which case, they are certainly not picking their trades on a whim. They do not scalp, and they do not go long or short because a stochastic is overbought or oversold, or because an RSI has reached a particular area, or because a Fibonacci retracement to X, Y, or Z level has occurred.

Professional bank traders have a dedicated team behind them who are professional analysts and economists advising them. They have a defined fundamental and technical view of where an exchange rate should be and where reversals in price action might occur, and they tend to be swing traders, not intraday traders, and they usually only do a couple of trades a week on their own bank’s book. But how do they choose their levels?

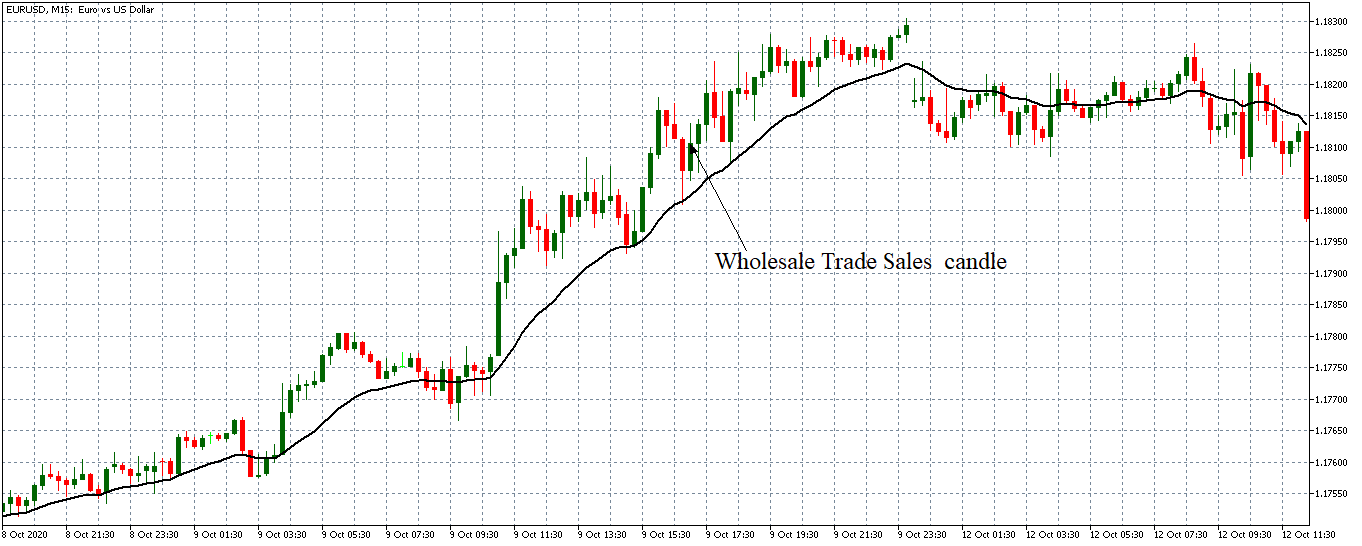
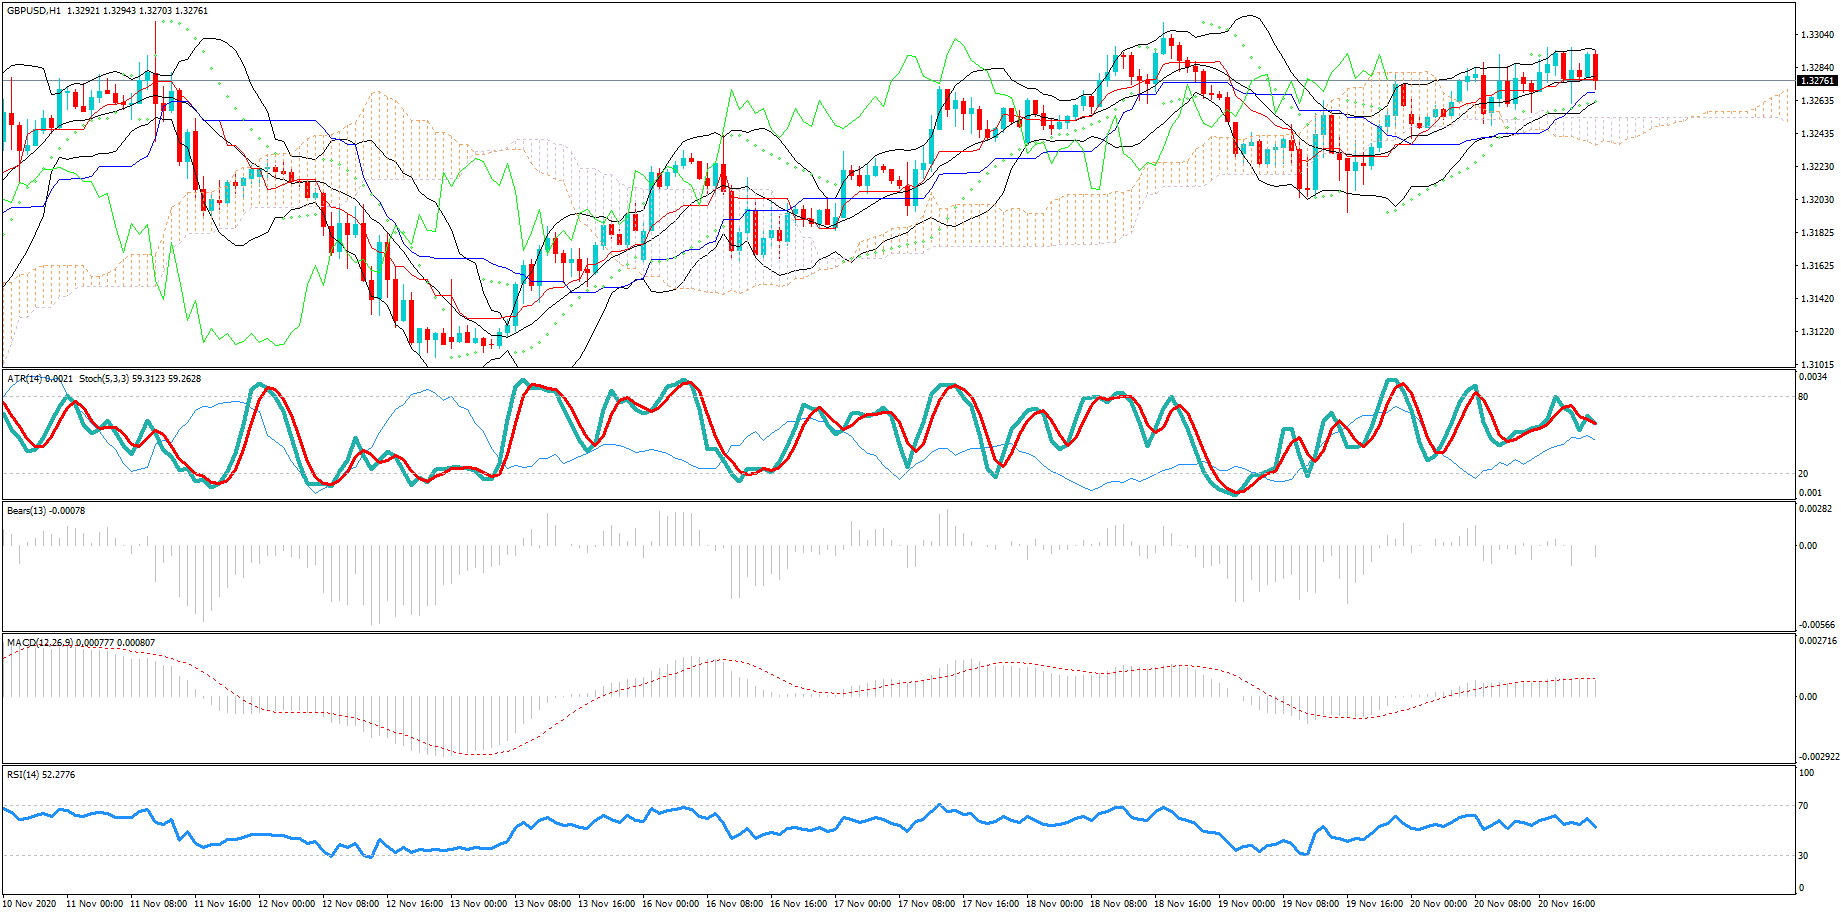
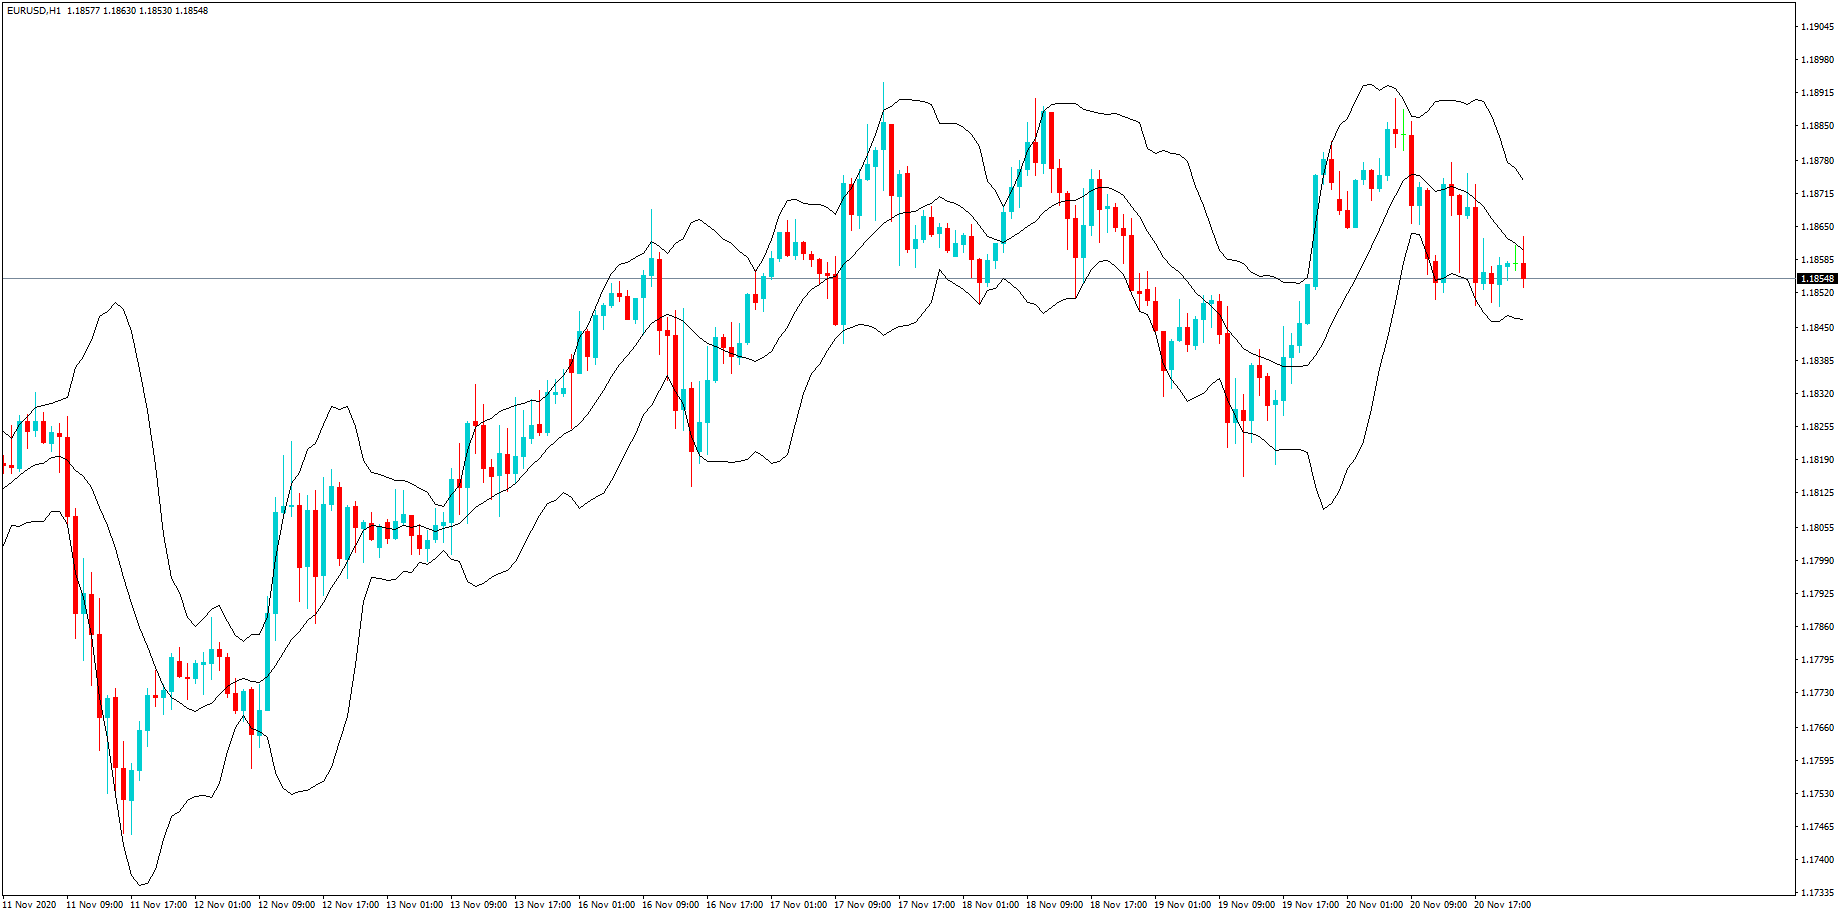
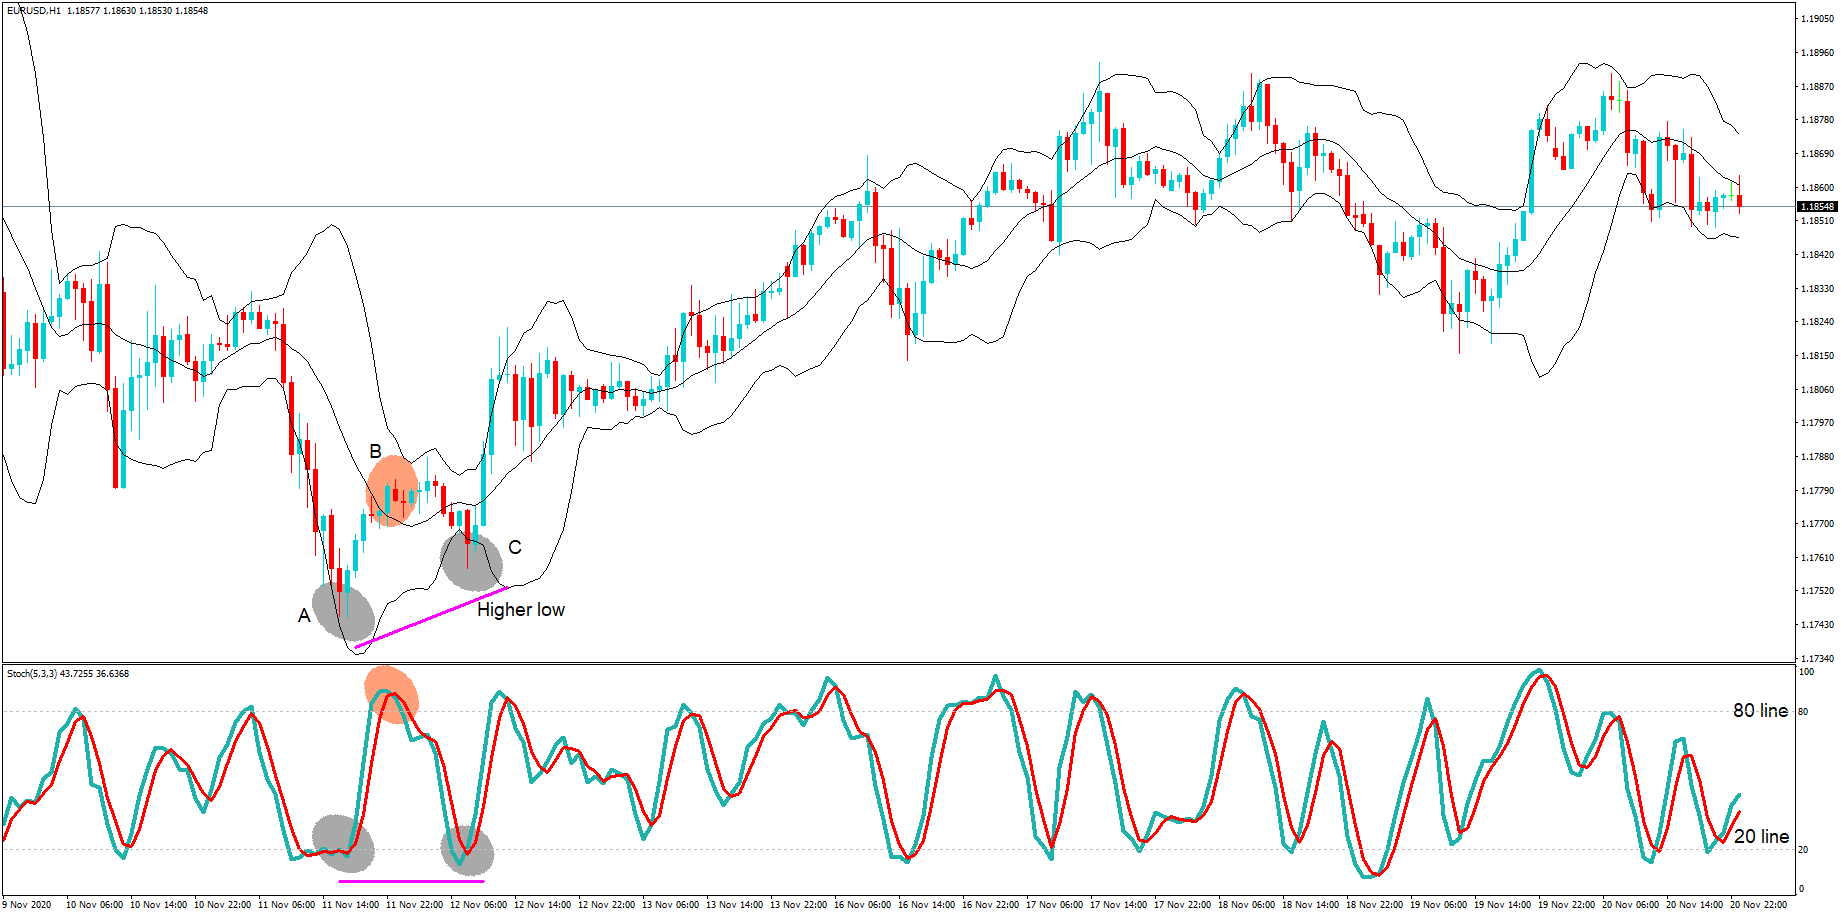
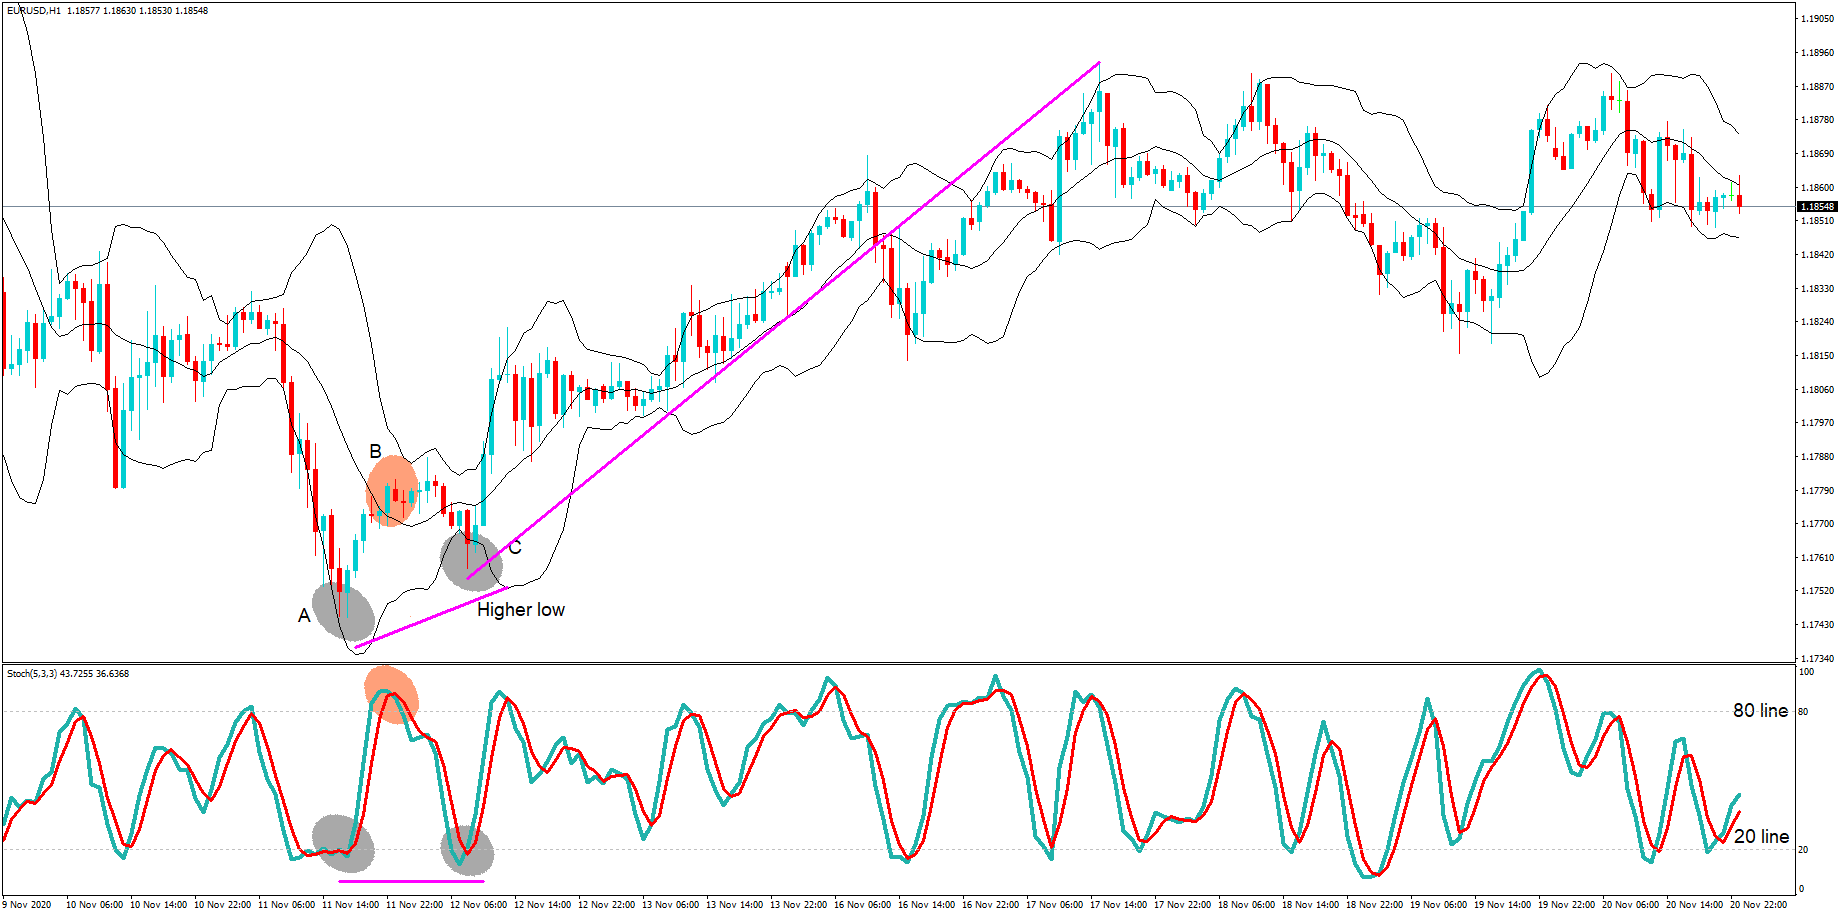
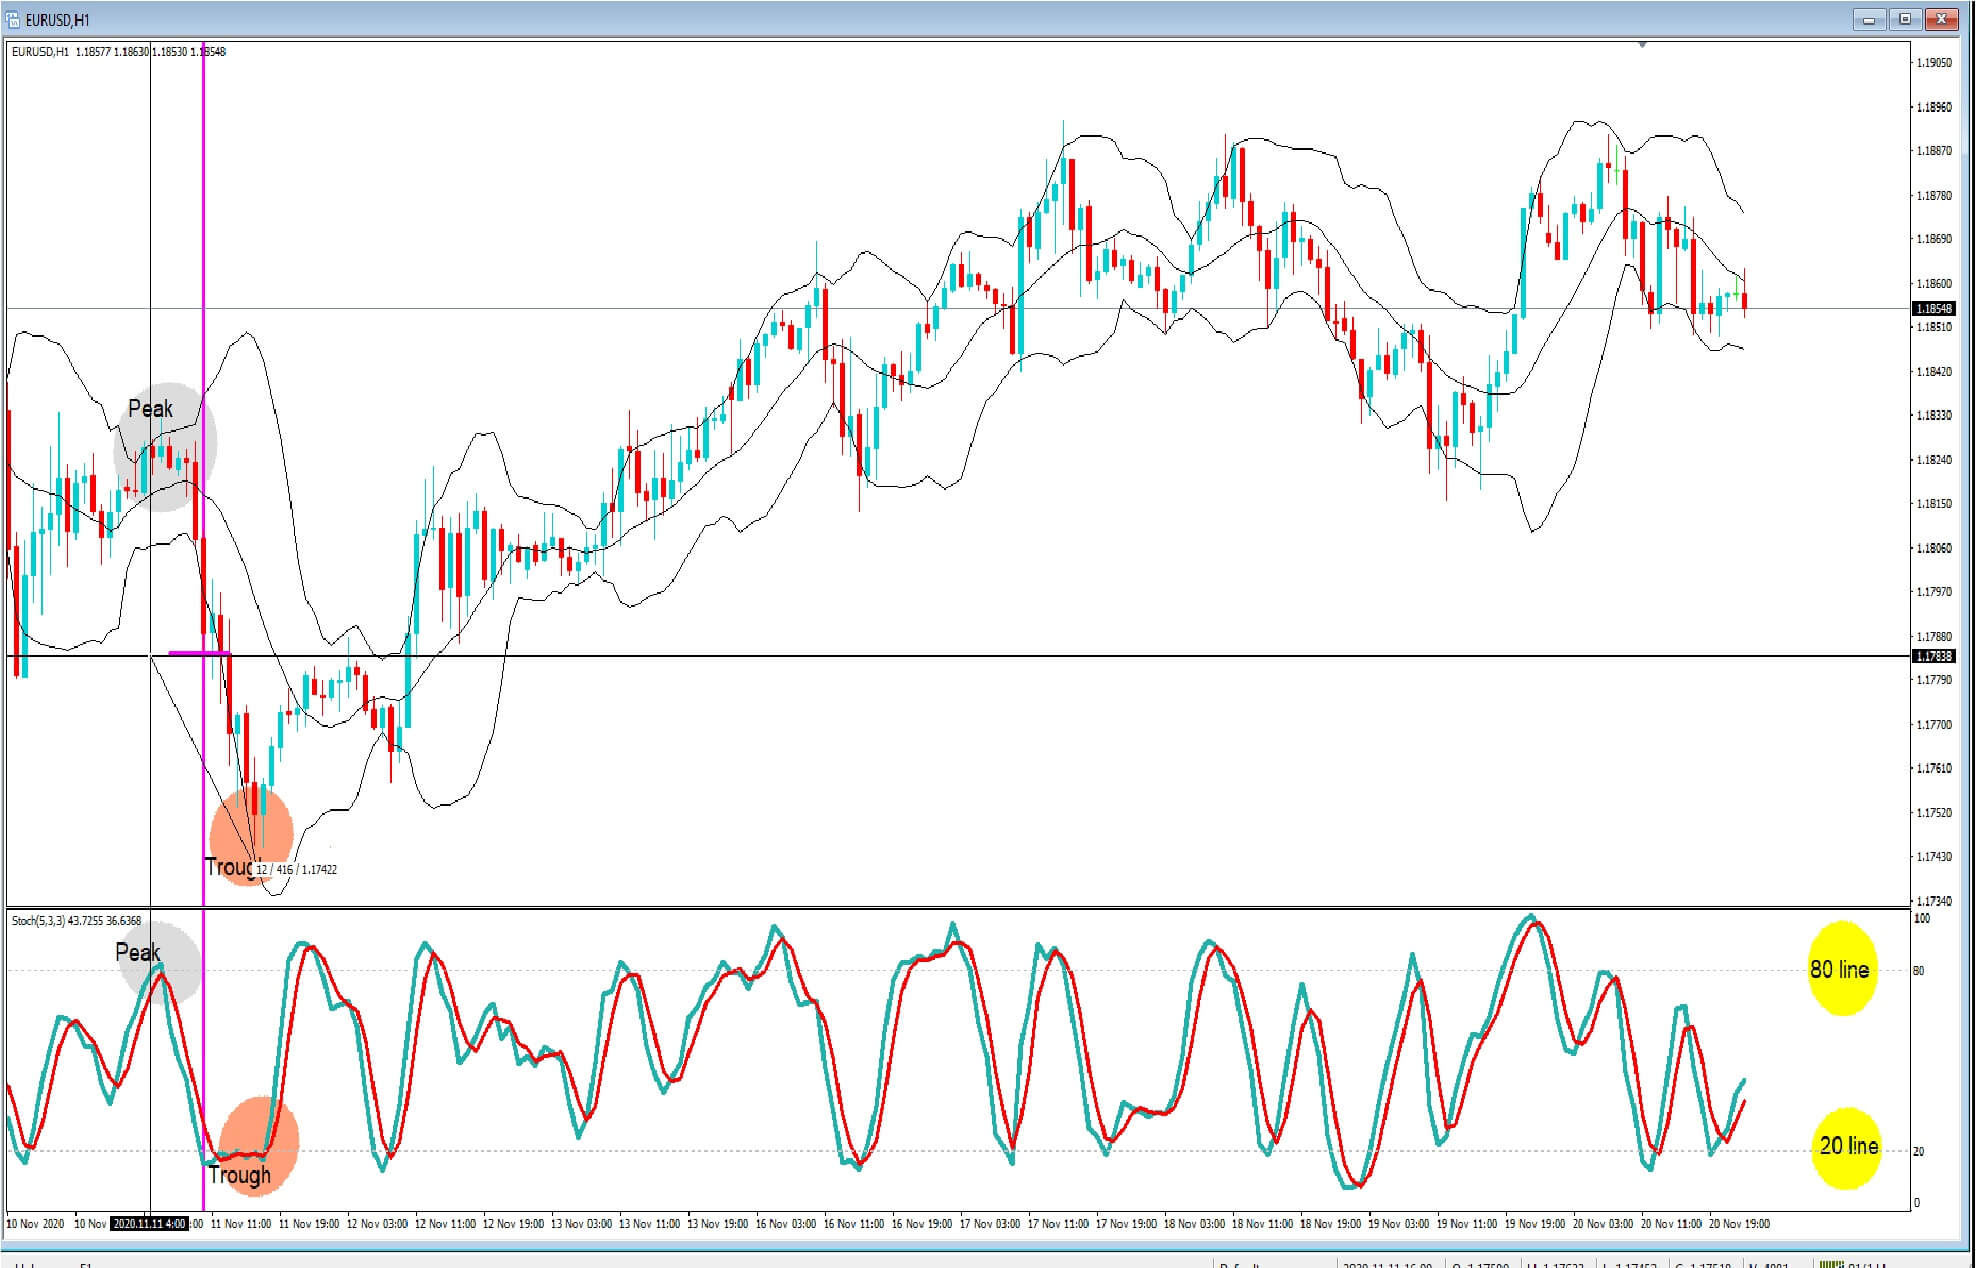
You definitely will not find something like this one hour chart of the EURUSD pair on a professional bank trader’s screen, which is cluttered with lagging indicators.

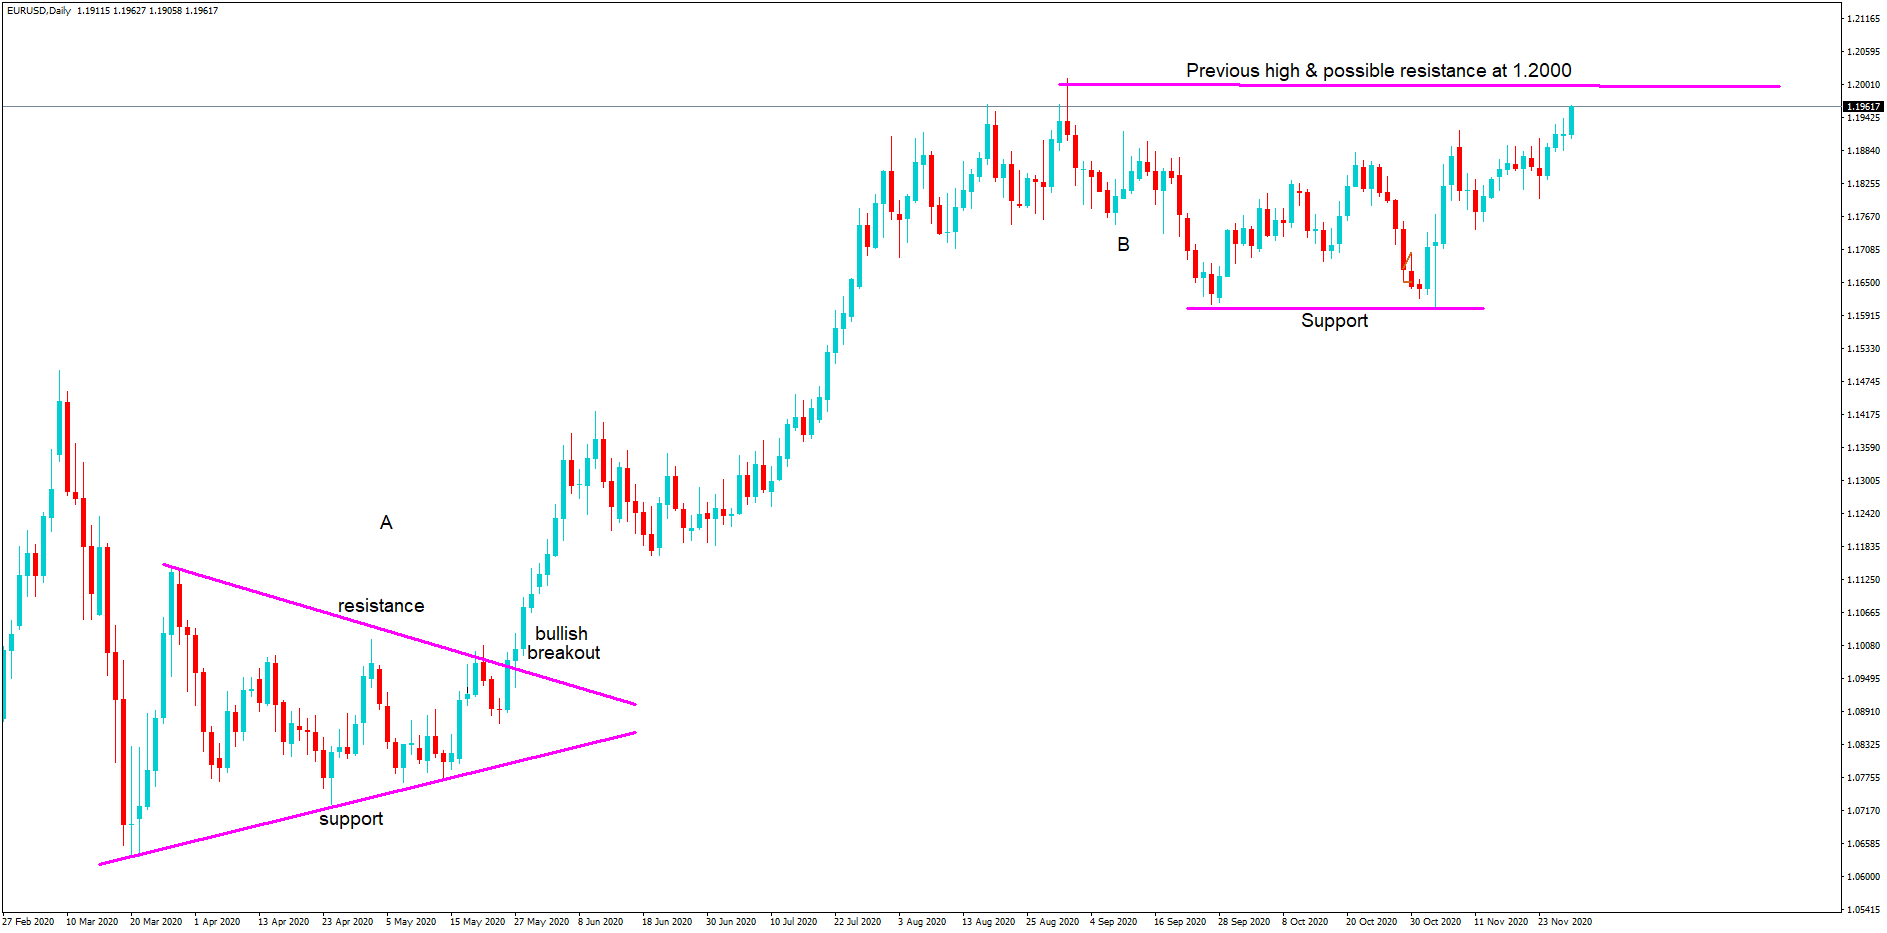
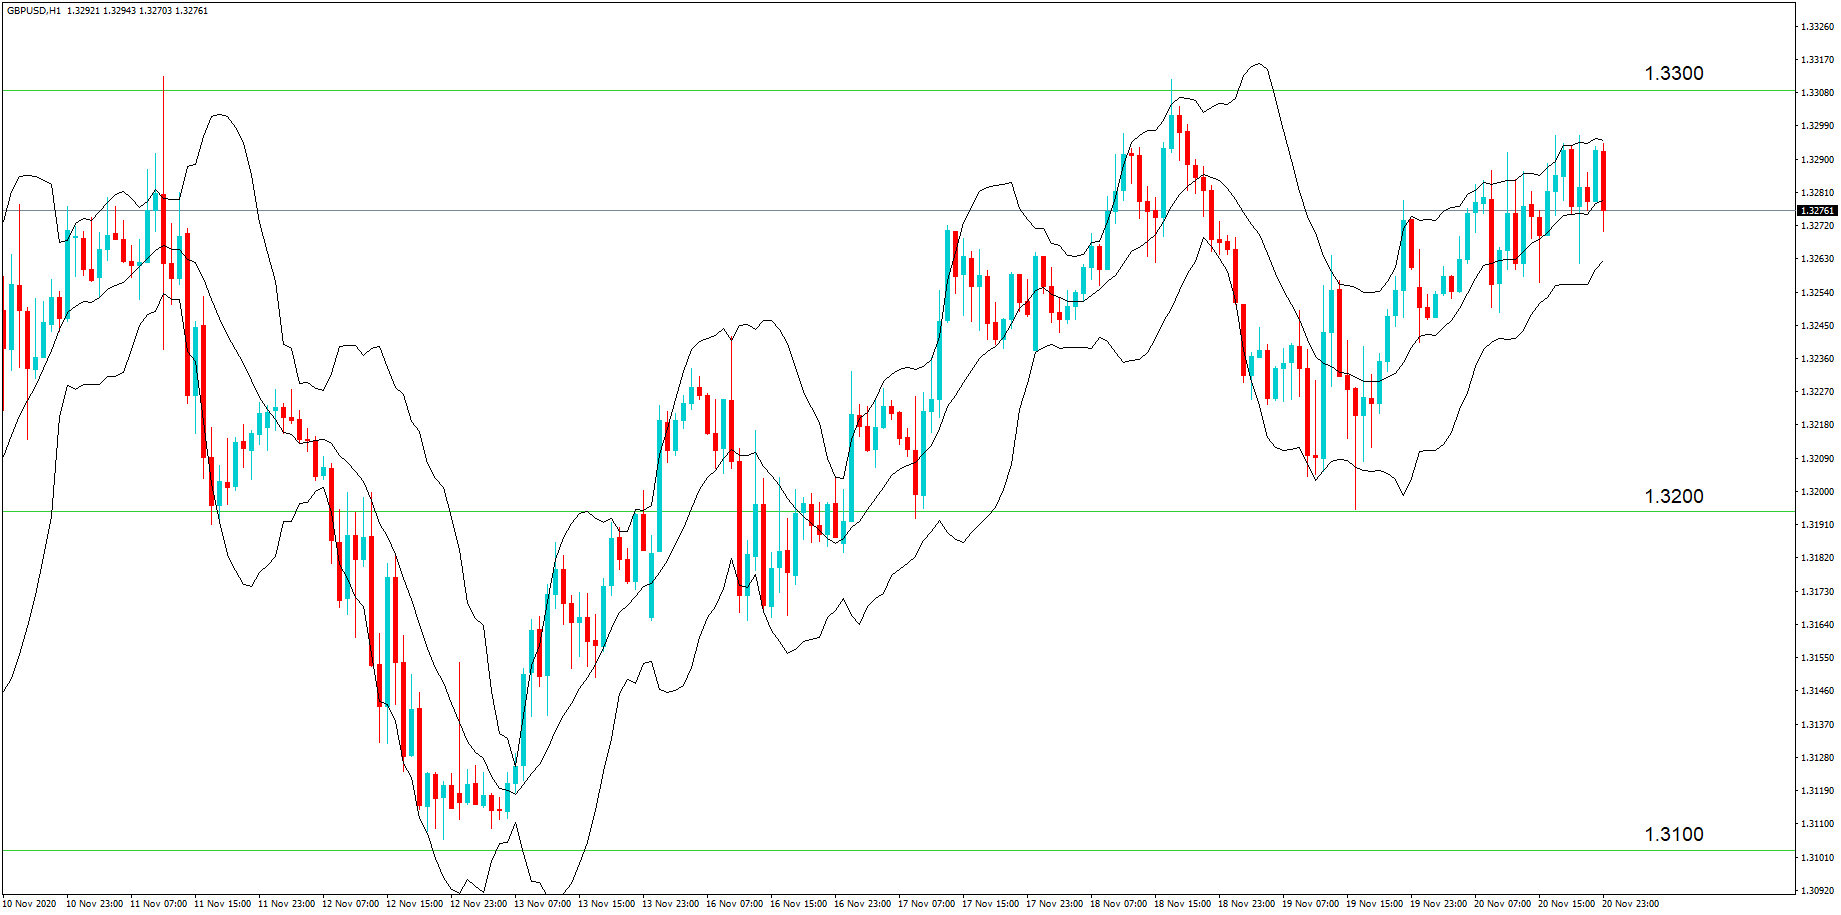
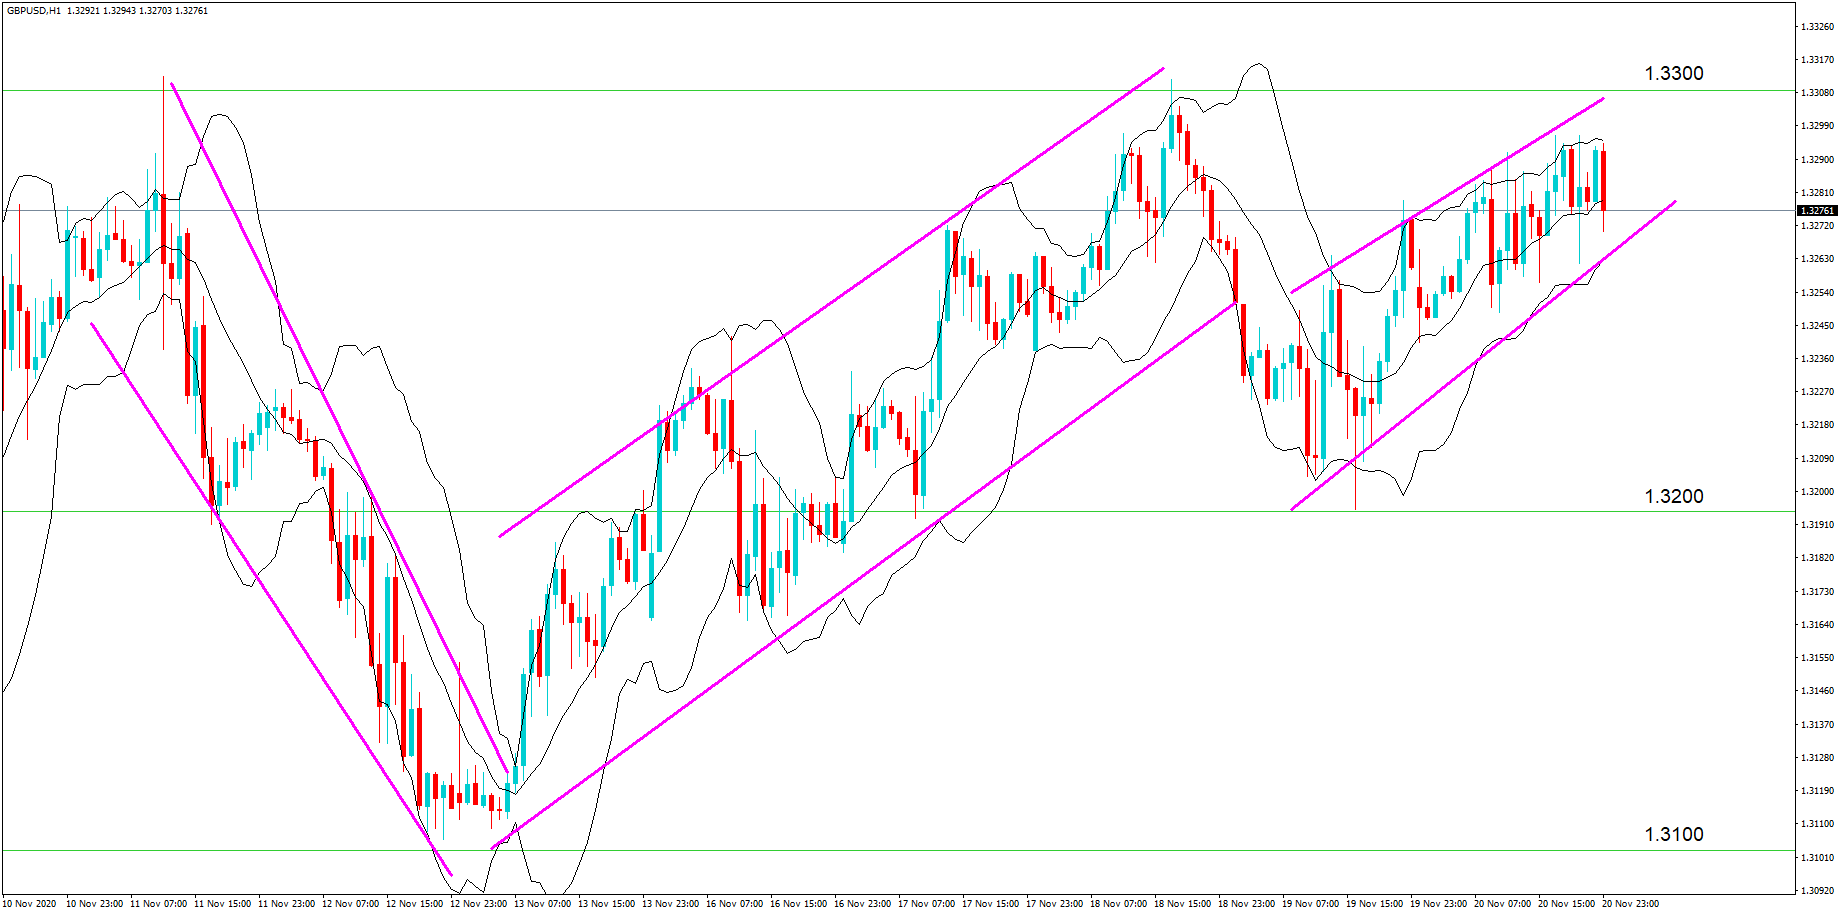
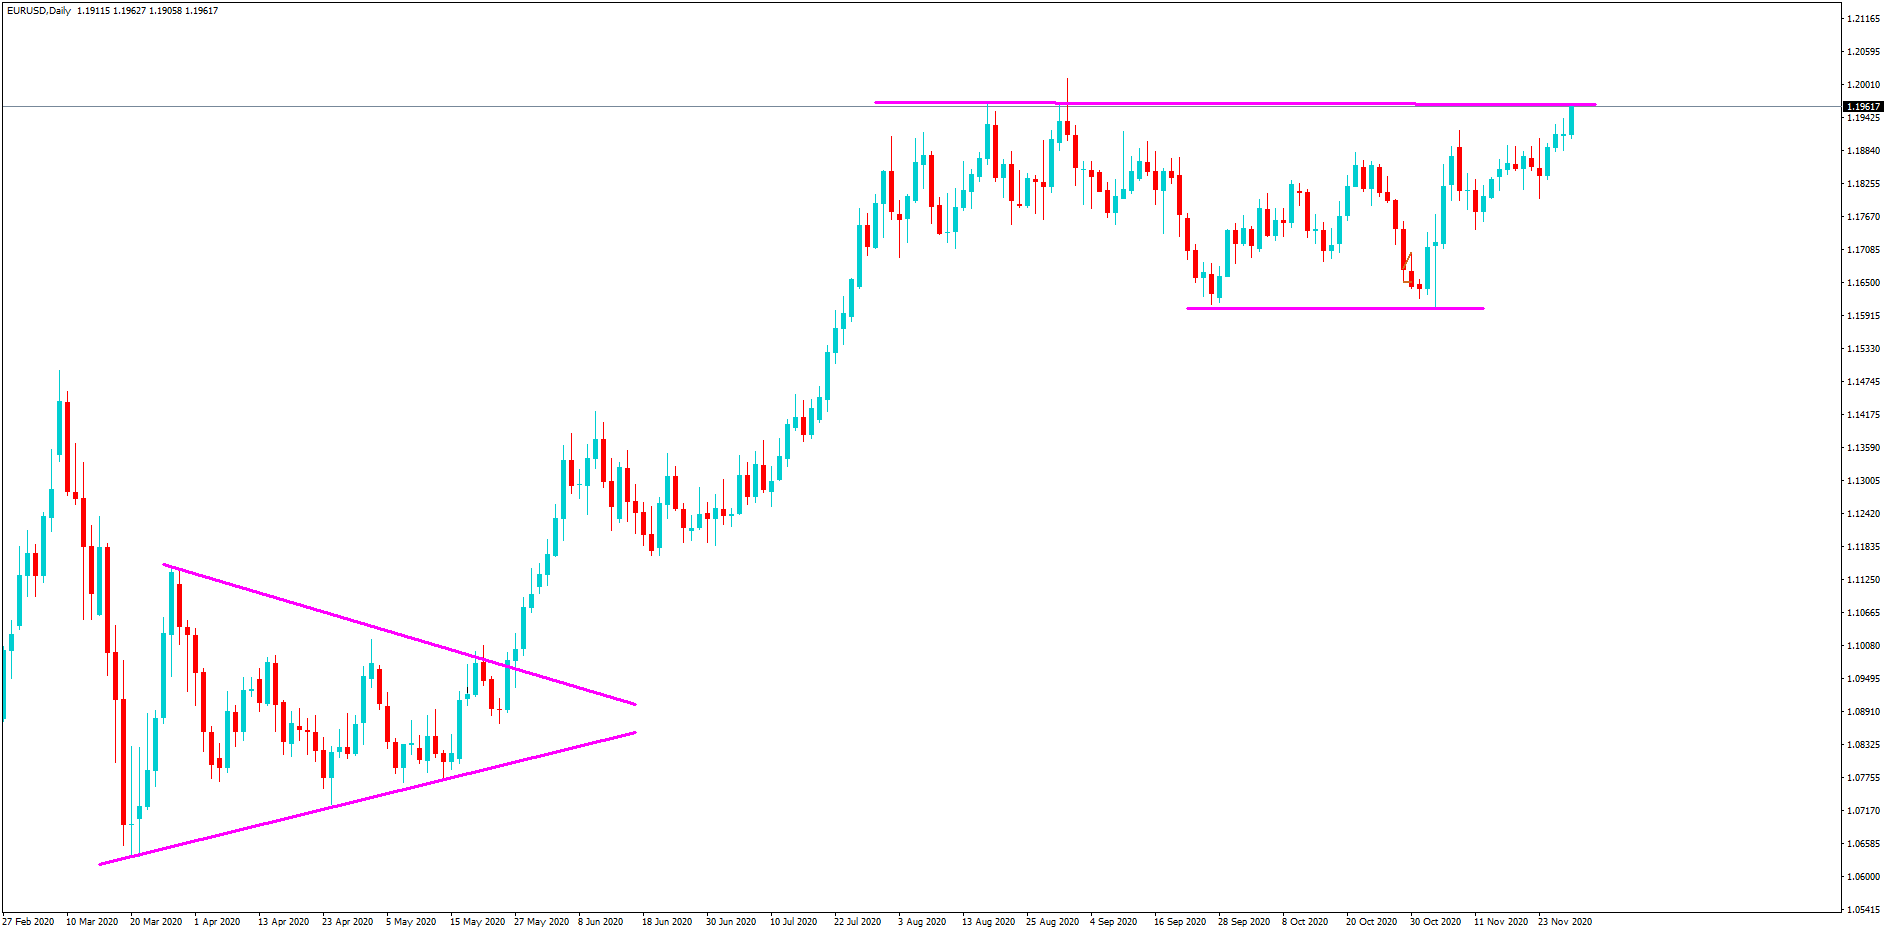
However, you probably would find something like this daily EURUSD chart. But what are they looking at? What information does such a chart provide them? 

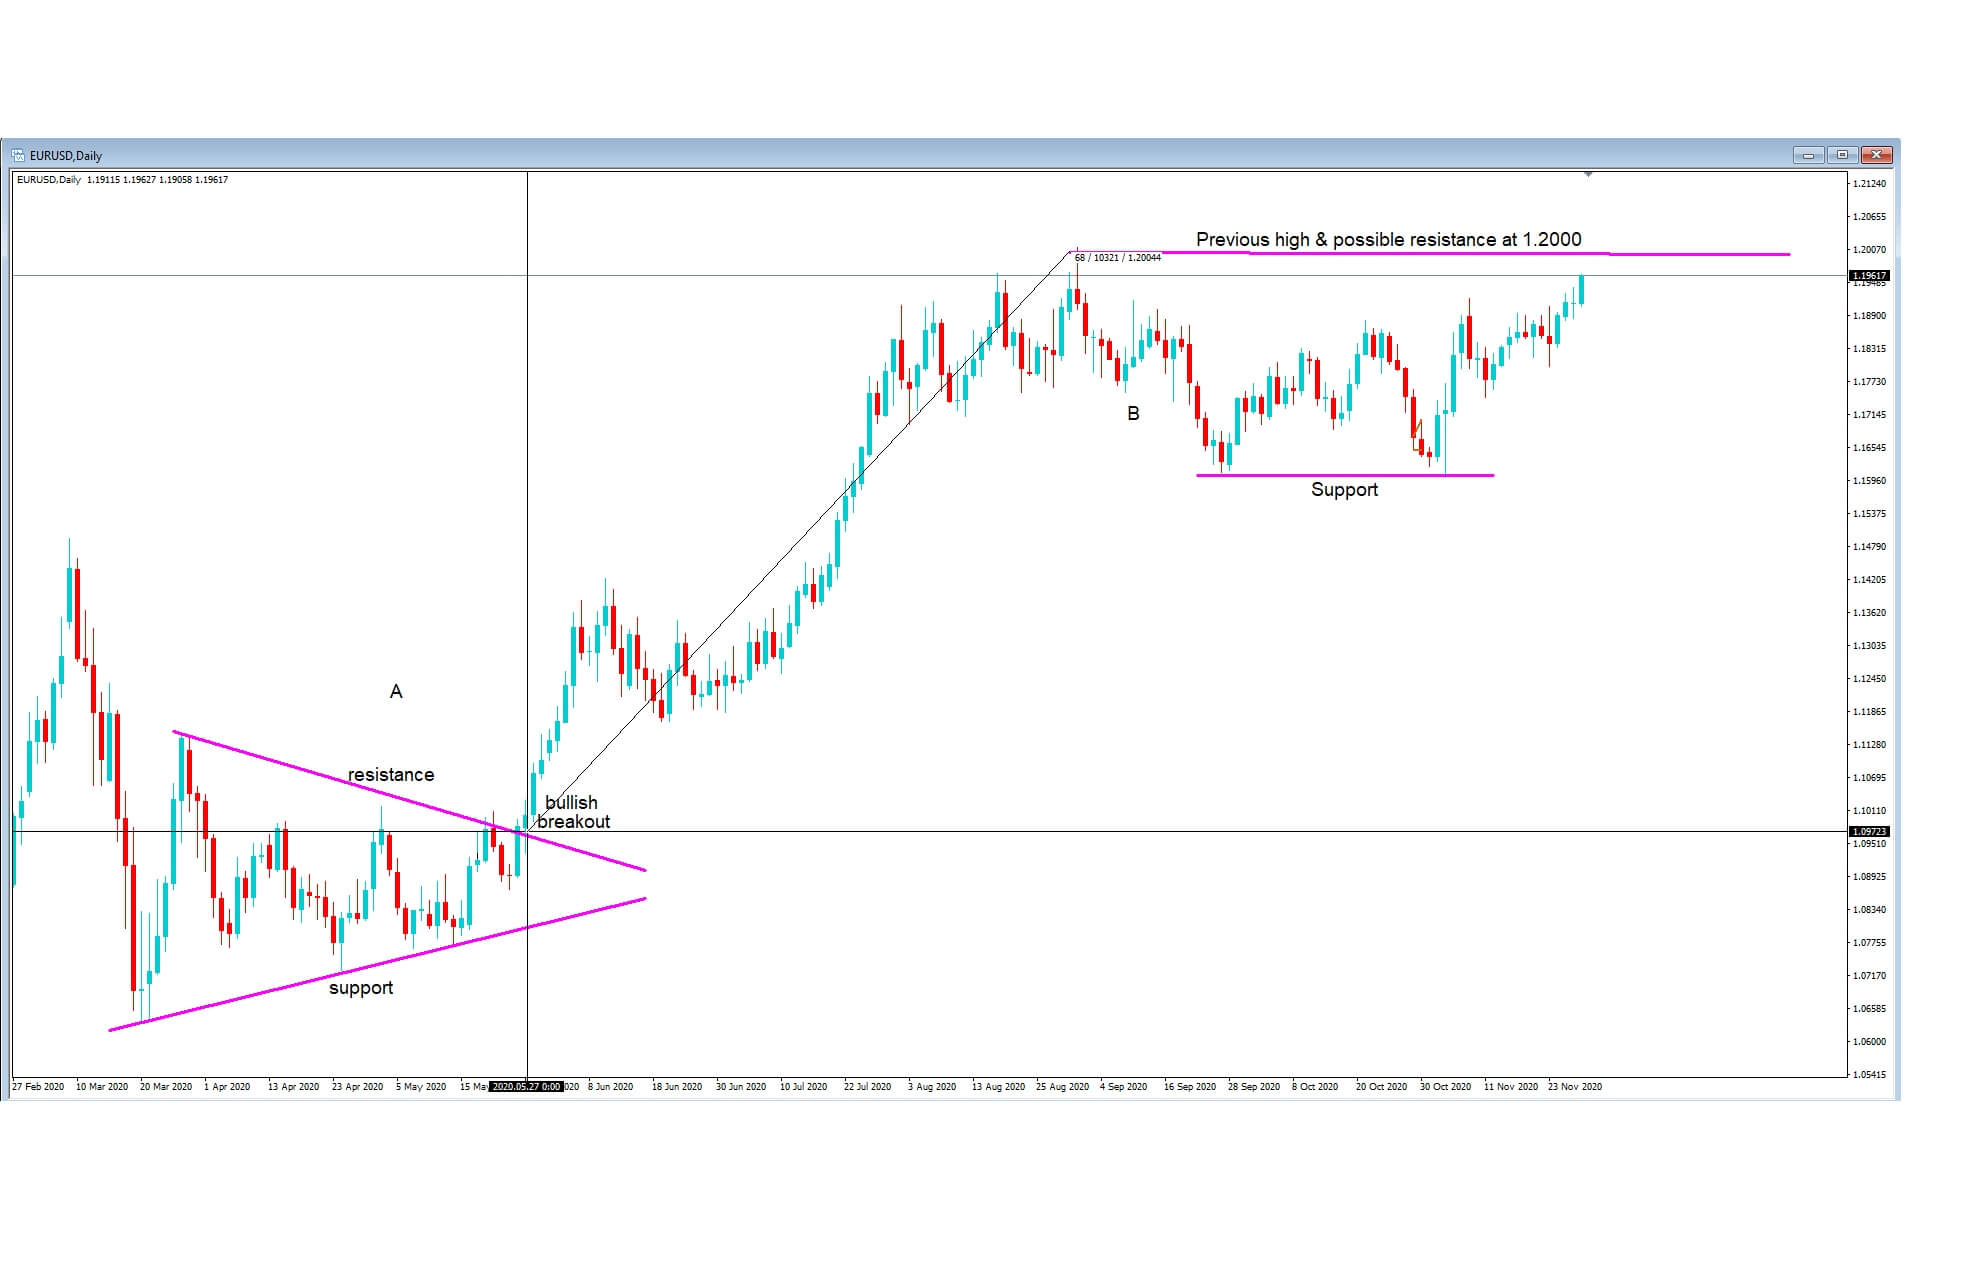
Actually, it provides them with a wealth of information, such as here we have added some notes, including at position A , which shows defined lines of resistance and support, in a wedge-shaped formation, where a bullish breakout occurs.

And at position B, where price reverses 300 pips from the key 1.200 level, before forming a support line and where the price is moving higher, potentially retesting that key level again.

Now, if our professional bank traders bought this pair at the breakout from position A and rode that trade up to the peak at position B, they would have made 1000 pips on that trade, on a multimillion Euro – in this case – ticket size. The profits would have been incredible. 

Therefore, we know that professional bank traders take a longer-term view of the market. They enter with large size ticket trades, and they use a minimal amount of technical analysis indicators, preferring to draw their own trendlines while looking for breakouts and concentrating heavily on key numbers for support and resistance.

While bankers have deep pockets in terms of how much exposure they have with regard to stop losses, it is almost impossible for a retail trader to incorporate the same amount of risk into their trades.  However, if a retail trader understands where these large ticket trades are occurring, it could be beneficial in terms of their own trading setups.

In conclusion, no matter what your trading style is, look at the longer time frames and look at key areas of support and resistance, which is the institutional size traders maybe referring to, in order to better select your trades on the lower time frames.

Categories
Forex Elliott Wave Forex Market Analysis

AUDUSD Consolidates its Gains Expecting the US Employment Data Ahead

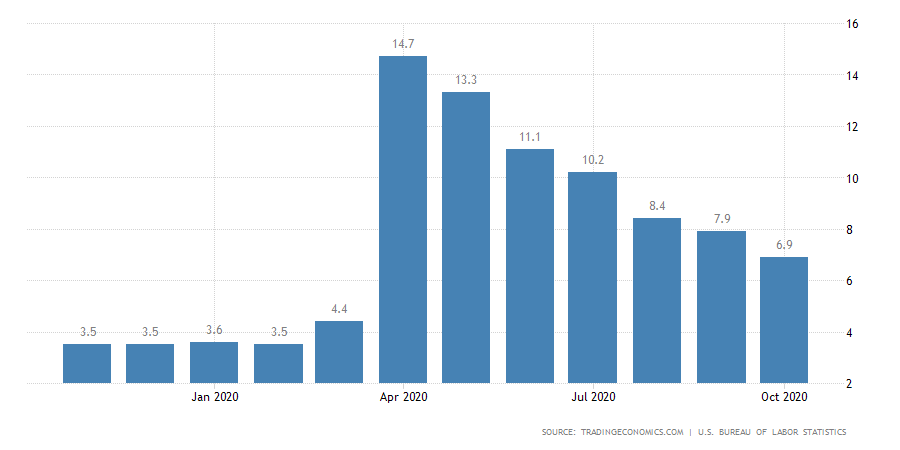
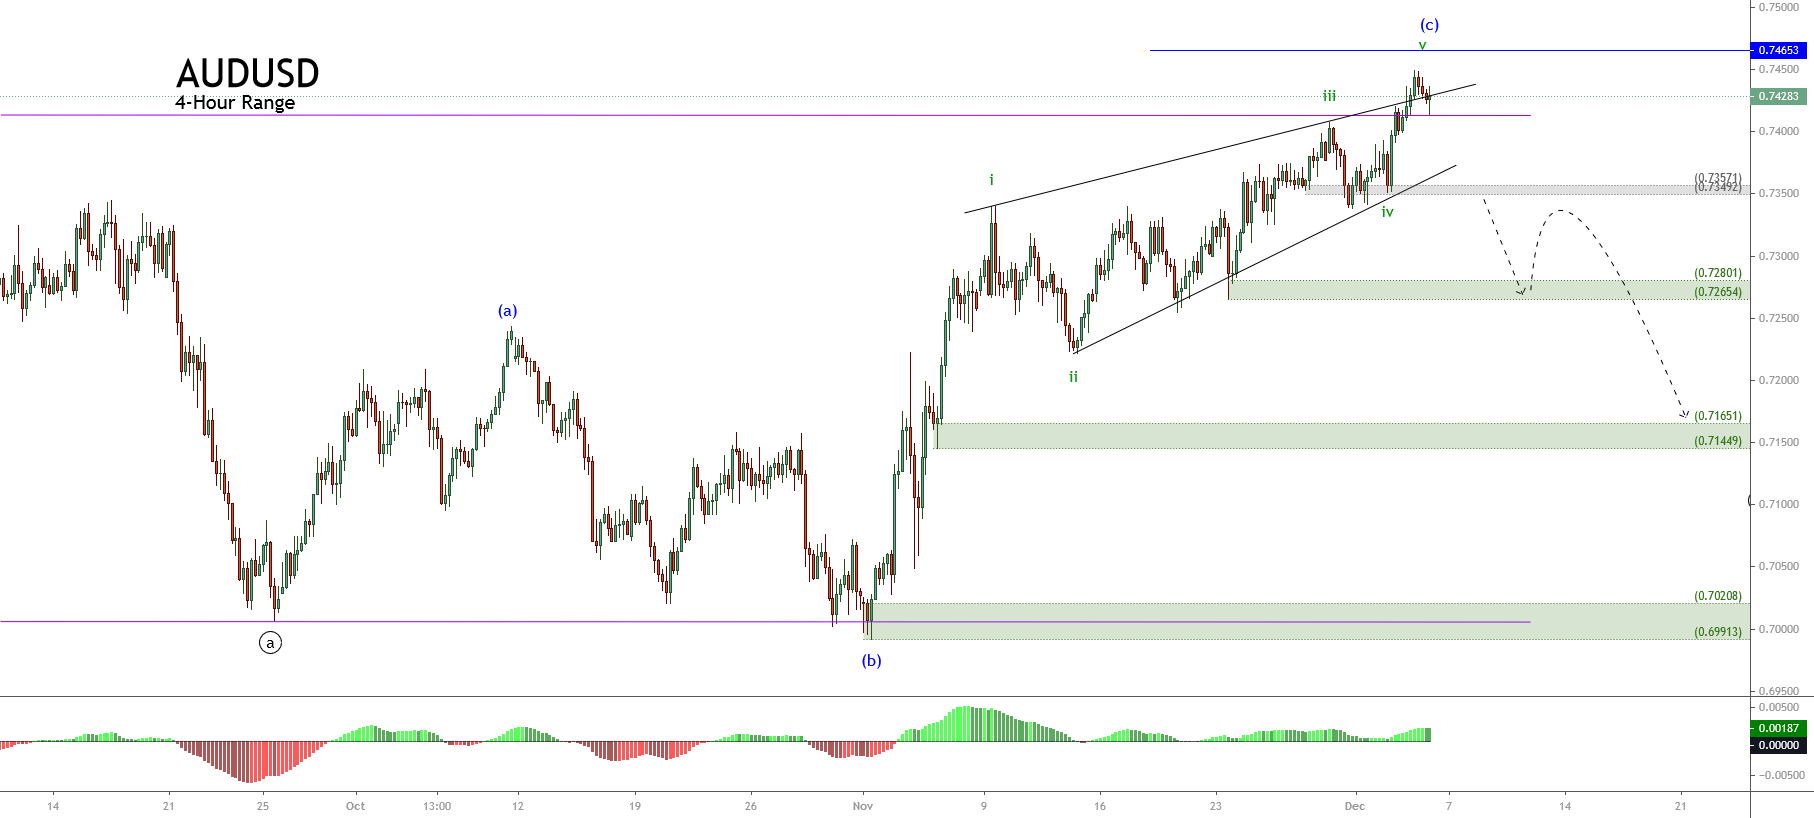
The price of AUDUSD reached a fresh yearly high at 0.74496 on the Thursday trading session expecting the last employment data release of the year for the US labor market corresponding to November. 

(Source: tradingeconomics.com)

Technical Overview

This year, as illustrated in the previous chart, Australia’s unemployment rate peaked at a record high of 14.7% in April, mainly boosted by the coronavirus lockdown. In this context, the analysts’ consensus expects the unemployment to drop to 6.8% for November, from 6.9% reported last October.

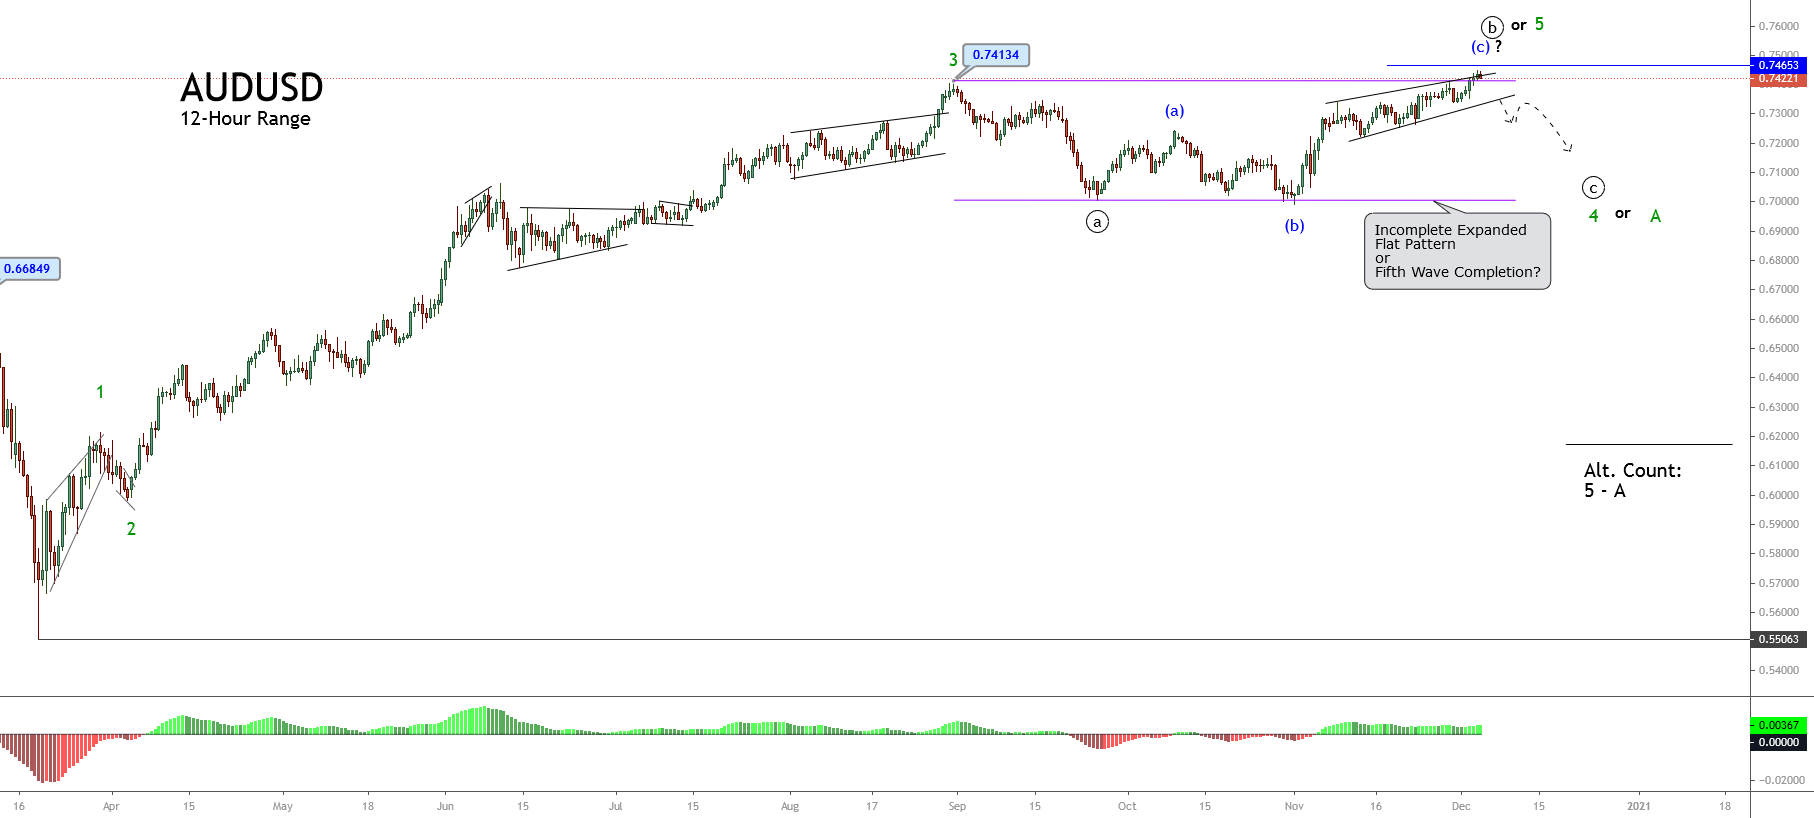
The mid-term Elliott wave perspective displayed in the 12-hour chart below reveals the upward progression in an incomplete five-wave sequence of Minor degree labeled in green. This bullish impulsive move began on March 18th when the Aussie found fresh buyers at 0.55063.

The previous chart also shows the Aussie’s advance in a third extended wave, suggesting that the price action could be moving in its fourth wave in green, still in development. 

This scenario considers that the Aussie moves in its internal wave (c) of Minuette degree labeled in blue, developing an ending diagonal pattern. Likewise, the wave of the upper degree corresponding to wave ((b)) of Minute degree identified in black should correspond to an expanded flat pattern, and the price should realize a new decline,

The alternative count considers the advance in the fifth wave of Minor degree in green is developing an internal ending diagonal pattern. In this case, the Aussie should start a decline corresponding to wave A in green.

Technical Outlook

The short-term Elliott wave for AUDUSD exposed in its 4-hour chart shows the advance in an ending diagonal pattern, which looks developing its fifth wave of Subminuette degree labeled in green.

Although the ending diagonal pattern suggests completing the fifth wave or wave (c), the Aussie must confirm its completion through the breakdown of its base-line that connects the waves ii and iv, in green. Also, the price should confirm the close below the intraday demand zone between 0.73492 and 0.73571.

Finally, if the price confirms its downward correction, the potential target area for this movement is from 0.7265 and 0.7144. If the area fails to hold, and the bearish pressure extends this downward movement, the Aussie could visit the base of its sideways channel on the psychologically key level of 0.70.

Categories
Forex Signals

USD/CAD Bearish Bias Seems to Halt – Eyes on U.S. NFP Figures! 

The USD/CAD pair was closed at 1.28619 after placing a high of 1.29411 and a low of 1.28519. The USD/CAD pair extended its losses for the 3rd consecutive day on Thursday due to broad-based U.S. dollar weakness and the rising crude oil prices.

The USD/CAD fell to its lowest since October 2018 on Thursday as the U.S. Dollar Index (DXY) reached 90.50 level, its lowest for 31 months. The U.S. dollar weakness could be attributed to the latest progress made in the talks of stimulus relief package in the U.S.

The Top Democrats officials, including President-elect Joe Biden, House Speaker Nancy Pelosi, and the Senate Minority Leader Chuck Schumer, have said that they favored a $908 billion worth bipartisan bill for now as it was the starting step towards the stimulus package. These comments from Democrats raised hopes that a deal might be reached between Republicans and Democrats. Both parties have a shared view that there was a need for a 2020 stimulus package in the economy and that a deal should be reached soon.

This progress raised the hopes and optimism in the market related to the U.S.’s stimulus package and weighed heavily on the U.S. dollar that ultimately added in the losses of the USD/CAD pair. Meanwhile, the WTI crude oil prices increased on Thursday as producers, including Saudi Arabia and Russia, resumed discussion to agree on how much crude to pump in 2021 after earlier talks failed to compromise how to tackle the weak oil demand coronavirus pandemic.

In late Thursday, OPEC+ announced after three days of discussion that they have agreed to increase the production by 500,000 barrels per day beginning in January. This will bring the total production cuts at the start of next year to 7.2 million BPD. On Thursday, the rising crude oil prices added strength in the commodity-linked Loonie that added further pressure on the USD/CAD pair.

On the data front, at 17:30 GMT, the Challenger Job Cuts for the year in November came in as 45.4%against the previous 60.4%. At 18:30 GMT, the Unemployment Claims from last week fell to 712K against the expected 775K and supported the U.S. dollar. At 19:45 GMT, the Final Services PMI for November rose to 58.4 against the forecasted 57.5 and supported the U.S. dollar. At 20:00 GMT, the ISM Services PMI stayed as forecasted 55.9.


Daily Technical Levels

Support Resistance

1.2898 1.2950

1.2877 1.2981

1.2847 1.3002

Pivot point: 1.2929

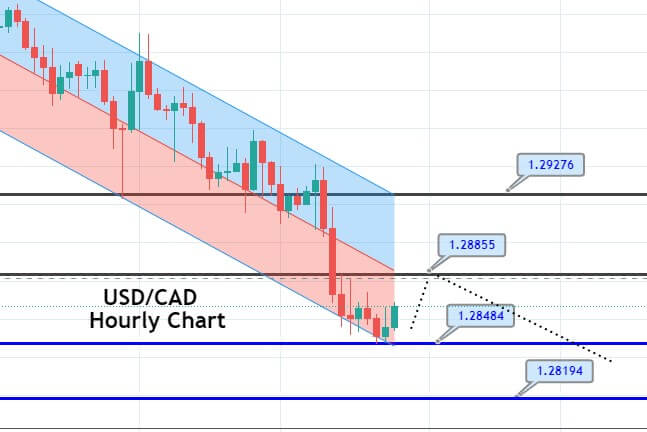
The USD/CAD traded in a selling mode, falling below the 1.2885 level to test the support area of the 1.2845 level. Bearish crossover of 1.2845 level can extend selling bias until 1.289 level. We opened a selling trade during the European open, but it seems to consolidate sideways ahead of the NFP figures. Here’s a trading plan for now…

Entry Price – Sell 1.28485

Stop Loss – 1.28885

Take Profit – 1.28085

Risk to Reward – 1:1

Profit & Loss Per Standard Lot = -$400/ +$400

Profit & Loss Per Micro Lot = -$40/ +$40

Fellas, now you can check out forex trading signals via Forex Academy mobile app. Follow the links below.

iPhone Users: https://apps.apple.com/es/app/fasignals/id1521281368

Andriod Users: https://play.google.com/store/apps/details?id=academy.forex.thesignal&hl=en_US

Categories
Forex Market Analysis

Daily F.X. Analysis, December 04 – Top Trade Setups In Forex – NFP in Highlights! 

The eyes will remain on the U.S. NFP data on the news side, which is expected to report a slight drop from 638K to 500K during the previous month. Besides, the U.S. Average Hourly Earnings m/m and Unemployment Rate will also remain the main highlight of the day, and these may determine the USD trend for today and next week. Let’s wait for the news.

Economic Events to Watch Today  


EUR/USD – Daily Analysis

The EUR/USD pair was closed at 1.21474 after placing a high of 1.21744 and a low of 1.21008. EUR/USD pair extended its gains for the 3rd consecutive day on Thursday due to the U.S. dollar’s weakness amid the rising hopes for the next round of U.S. stimulus package from Congress.

The Top Democrats, Joe Biden, and Nancy Pelosi backed the bipartisan $908 billion stimulus plan on the previous day. They urged the Senate Majority Leader Mitch McConnell to drop his plan to bring a more modest package. All top Democrats, including the President-elect Joe Biden, Nancy Pelosi, and the Senate Minority Leader Chuck Schumer, said that the bill would be acceptable as a starting point. 

The need for more stimulus relief packages to support the economy was increasingly evident, with both the ADP Non-Farm Payrolls and the ISM manufacturing survey below the expectations. Meanwhile, Car and Truck sales in November also fell from October level. On the coronavirus front, the U.S. had its deadliest day since the start of the pandemic on Thursday, with over 2700 recorded deaths due to coronavirus. Over the past 2-days alone, the death toll has reached 5000. The number of hospitalized people also reached for the first time, an alarming level of 100,000. All these developments weighed heavily on the U.S. dollar on Thursday and added strength to the EUR/USD pair.

The Spanish Services PMI for November raised to 39.5 against the expected 36.5 and supported Euro and added further gains in EUR/USD pair. At 13:45 GMT, the Italian Services PMI declined to 39.4 against the forecasted 40.9 and weighed on Euro. At 13:50 GMT, the French Final Services PMI fell to 38.8 against the anticipated 49.1 and weighed on Euro. AT 13:55 GMT, the German Final Services PMI came in line with the expectations of 46.2. At 14:00 GMT, the Final Services PMI from Eurozone raised to 41.7 against the expected 41.3 and supported Euro and the EUR/USD pair raised further. At 15:00 GMT, the Retail Sales for October also surged to 1.5% against the anticipated 0.7% and supported Euro and helped the EUR/USD pair to continue its bullish momentum.

From the U.S. side, at 17:30 GMT, the Challenger Job Cuts for the year in November came in as 45.4%against the previous 60.4%. At 18:30 GMT, the Unemployment Claims from last week fell to 712K against the anticipated 775K and supported the U.S. dollar. At 19:45 GMT, the Final Services PMI for November surged to 58.4 against the anticipated 57.5 and supported the U.S. dollar. At 20:00 GMT, the ISM Services PMI stayed as anticipated 55.9.

Daily Technical Levels

Support   Resistance

1.1971       1.2122

1.1873       1.2175

1.1819       1.2273

Pivot point: 1.2024

EUR/USD– Trading Tip

On Friday, the EUR/USD pair continues to trade sideways ahead of the NFP figures, which may drive sharp movements during the U.S. session.

On the higher side, the EUR/USD may find an immediate resistance at 1.2160 and 1.2196 level. Simultaneously, the closing of candles below the 1.2103 level can send the EUR/USD pair further lower until 1.2080. Trend depends upon the NFP data.


GBP/USD – Daily Analysis

The GBP/USD closed at 1.34525 after placing a high of 1.34998 and a low of 1.33288. The GBP/USD pair rose and reached above one year’s highest level over the bullish Brexit bets and the U.S. dollar’s weakness. On Thursday, the latest news raised the British Pound over the board that suggested that the Brexit trade deal could be reached by the weekend after the two sides showed hints of compromise over fish quotas. The positive news made the British Pound the best performer on the day in the G10 currencies. 

In an attempt to break the deadlock, Mr. Barnier and Boris Johnson lowered their demands by asking to get back only 60% of the fish that E.U. boats currently catch in British waters, down from 80%. Under the reported proposal, the U.K. would hold onto increased stocks of fish that are sold in the U.K. while the E.U. will keep the similar quotas of stock that are popular in the E.U. but not in the U.K.

The compromise was reported less than a week after E.U. Brexit negotiator Michel Barnier proposed to return about 15-18% of the fish caught by European fleets in British waters to the U.K. under a free trade agreement; however, at that time, the U.K. rejected this proposal.

The progress on fisheries is progress after a months-long stalemate; however, other key sticking points, including the level-playing field and governance, need to be solved to reach a deal. The time for the end of the Brexit transition period is near, and both sides have shown hints that a deal might reach by this weekend.

All these optimistic Brexit progress reports gave the local currency British Pound strength and supported the GBP/USD pair’s upward momentum that led the pair to its one-year highest level near 1.35000 on Thursday.

On the data front, at 14:30 GMT, the Final Services PMI from Britain raised to 47.6 against the expected 45.8 and supported British Pound and added further gains in GBP/USD pair.

From the U.S. front, at 17:30 GMT, the Challenger Job Cuts for the year in November came in as 45.4%against the previous 60.4%. At 18:30 GMT, the Unemployment Claims from last week declined to 712K against the projected 775K and supported the U.S. dollar. At 19:45 GMT, the Final Services PMI for November rose to 58.4 against the projected 57.5 and supported the U.S. dollar. At 20:00 GMT, the ISM Services PMI stayed as projected 55.9.

Furthermore, the gains in GBP/USD pair on Thursday were also because of the U.S. dollar’s weakness due to the progress in talks to reach a consensus between Republicans & Democrats over the second round of stimulus talks. Joe Biden, Nancy Pelosi, and Chuck Schumer have shown their consent for the bipartisan bill of $908 billion. This progress raised the hopes for a stimulus bill and weighed on the U.S. dollar that added strength to the GBP/USD pair.

Daily Technical Levels

Support   Resistance

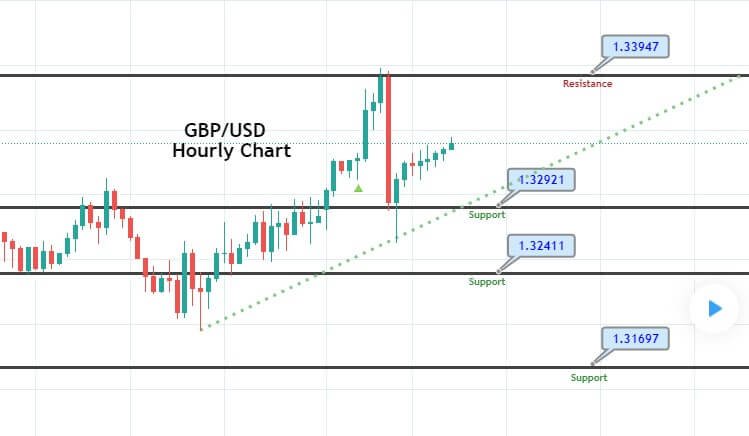
1.3286       1.3441

1.3209       1.3519

1.3131       1.3596

Pivot Point: 1.3364

GBP/USD– Trading Tip

The GBP/USD is trading sideways in between a fresh trading range of 1.3305 – 1.3445. Breakout of this range can lead the Cable price towards the 1.3517 level. The volatility seems low ahead of the Christmas holidays. However, the European session can trigger a buying trend until the 1.3515 level, while support continues to stay at the 1.3305 level. A bearish breakout of the 1.3305 level can trigger selling until the 1.3212 level. The MACD and RSI are suggesting a bullish bias in the market. Let’s consider taking buying trades over 1.3305 and 1.3447 level today.


USD/JPY – Daily Analysis

The USD/JPY pair was closed at 103.841 after placing a high of 104.534 and a low of 103.669. The USD /JPY pair dropped to its lowest since November 18 on Thursday due to broad-based U.S. dollar weakness.

The U.S. Dollar Index extended its losses for 3rd consecutive day on Thursday and fell to a 31-month lowest level below 91.10 after the hopes for the next round of stimulus raised in the market. The top three Democratic Leaders, President-elect Joe Biden, House Speaker Nancy Pelosi, and Senate Minority Leader Chuck Schumer, backed the bipartisan proposal for a coronavirus relief package worth $908 billion. They all urged the Senate Majority Leader Mitch McConnell to drop his plans of bringing a more modest package back to the floor of the upper chamber.

Both parties agree that more relief aid should be delivered to Americans to curb the coronavirus pandemic’s effects but have differences over the size, method, and healthcare system. The renewed efforts to strike a deal followed a months-long deadlock over the second stimulus relief package and weighed heavily on the greenback that added losses in the USD/JPY pair.

On the data front at 17:30 GMT, the Challenger Job Cuts for the year in November came in as 45.4%against the previous 60.4%. At 18:30 GMT, the Unemployment Claims from last week dropped to 712K against the estimated 775K and supported the U.S. dollar, and capped further losses in the USD/JPY pair. At 19:45 GMT, the Final Services PMI for November rose to 58.4 against the estimated 57.5 and supported the U.S. dollar. At 20:00 GMT, the ISM Services PMI stayed as estimated at 55.9.

Furthermore, the U.S. dollar was also weak because of the rising cases of coronavirus in the U.S. The U.S. saw its deadliest day since the start of the pandemic on Thursday after 2,700 deaths were reported in a single day. Over the past two days only, the death toll has reached 5,000 in the U.S. from the coronavirus, and the hospitalization rate has also increased, with more than 100,000 cases reported to be hospitalized in a single day.

These raised concerns for the U.S. economy as many states were still under strict restrictive measures, and the economic activities there were still affected. The rising number of deaths might weigh more on the local currency. The U.S. dollar came under pressure and dragged the USD/JPY pair further on the downside.

Daily Technical Levels

Support   Resistance

104.13       104.54

103.95       104.77

103.72       104.95

Pivot point: 104.36

USD/JPY – Trading Tips

The USD/JPY has violated the sideways trading range of 104.600 – 104.200, and now it’s trading at 103.876 level. On the lower side, the pair has formed a triple bottom level, supporting the pair around 103.700 level. Investors seem to wait for the U.S. NFP and unemployment rate figures to determine further U.S. dollar trends. On the lower side, the USD/JPY may head towards the 103.200 level upon a bearish breakout of the 103.750 support level. While resistance stays at 104.350 today. Good luck

Categories
Crypto Market Analysis

Daily Crypto Review, Dec 4 – Bitcoin Above $19,000; Ether Fighting for $600

The cryptocurrency sector has spent the day trying to regain its recent highs, with Ethereum breaking $600 and Bitcoin breaking $19,000. Bitcoin is currently trading for $19,314, representing an increase of 1.14% compared to our last report. Meanwhile, Ethereum’s price has increased by 2.15% on the day, while XRP managed to lose 0.52%.

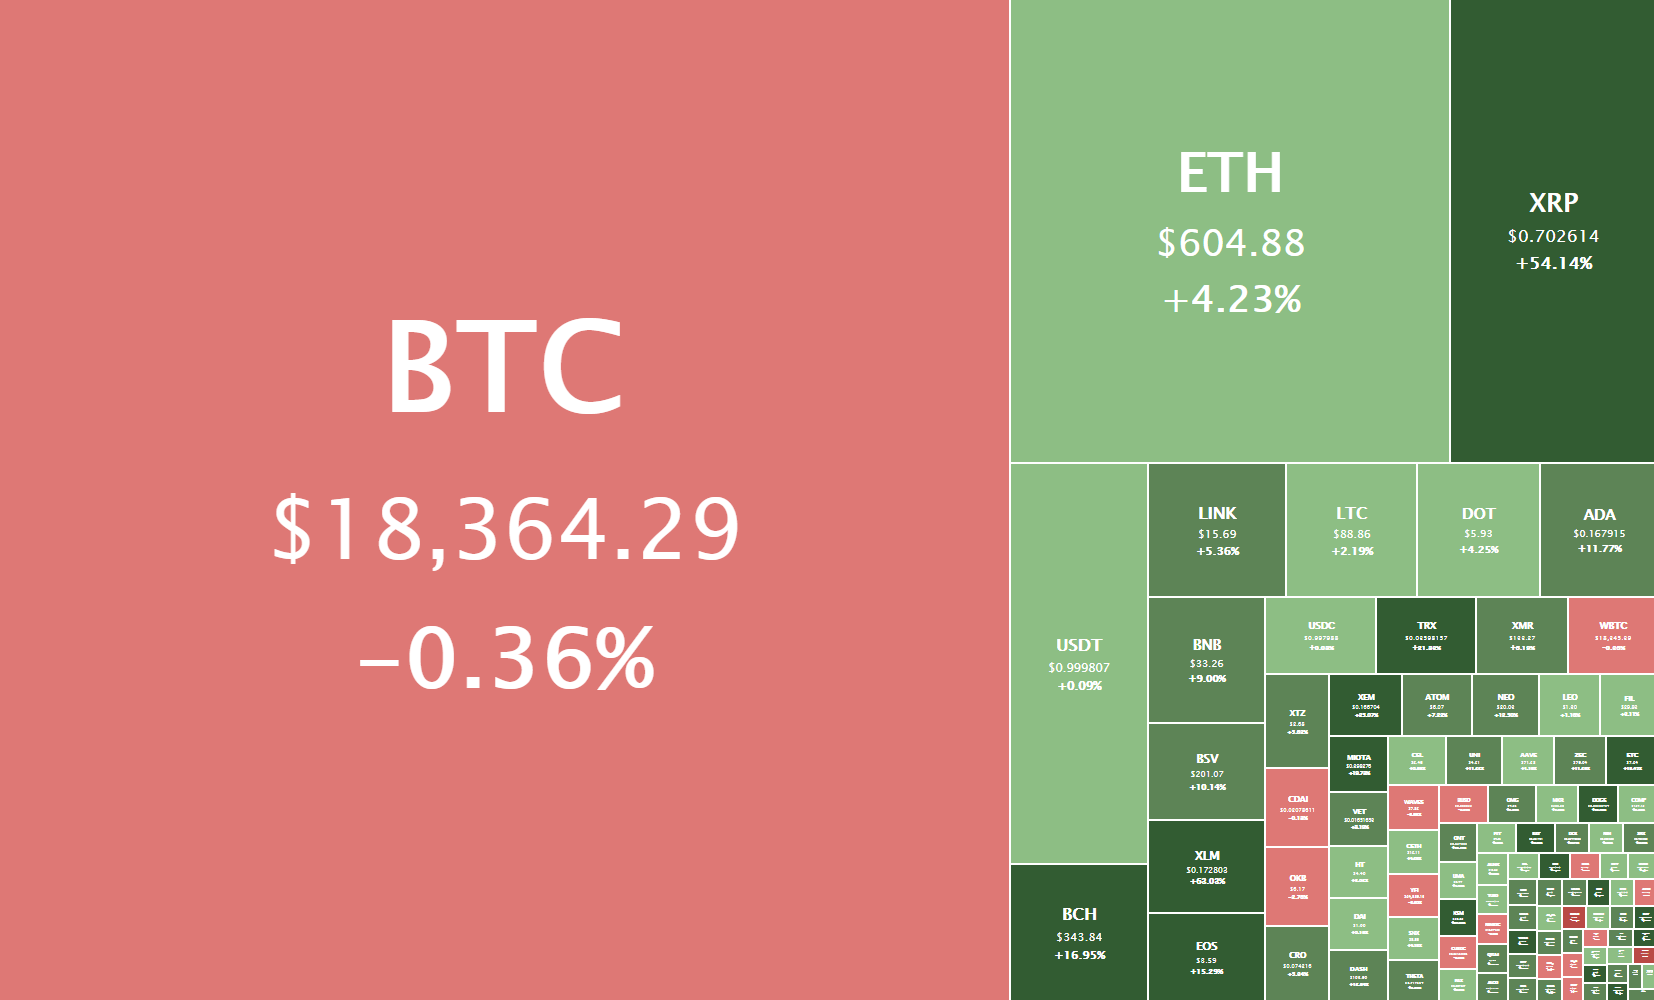
 Daily Crypto Sector Heat Map

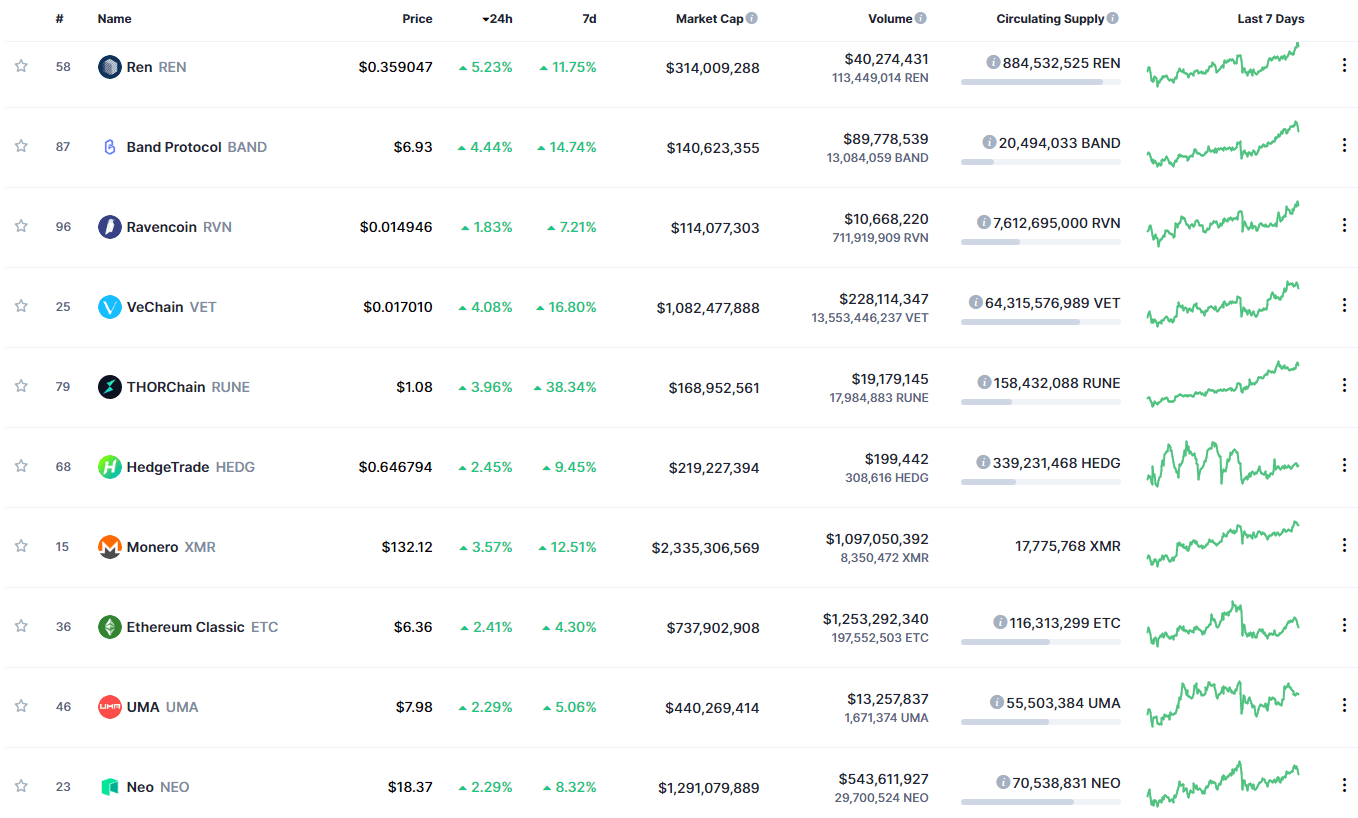
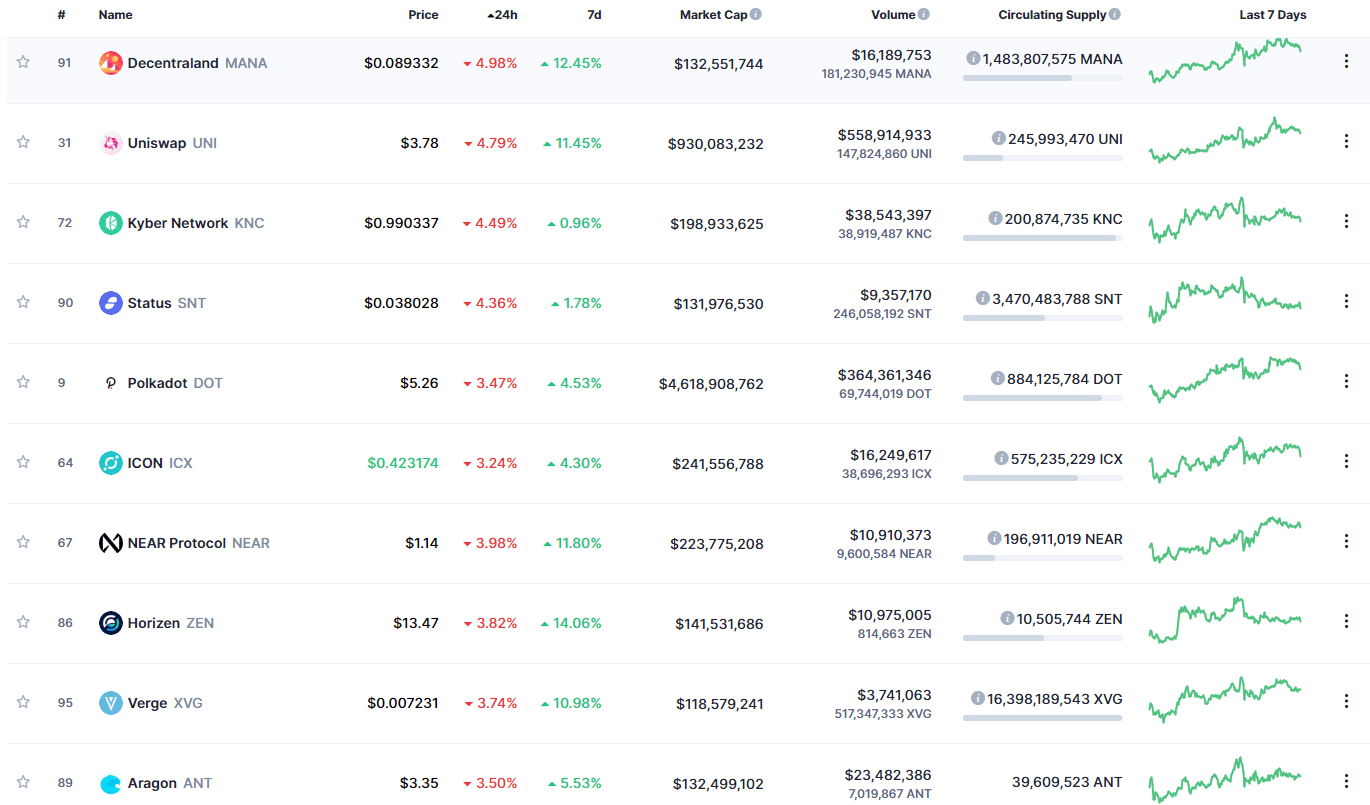
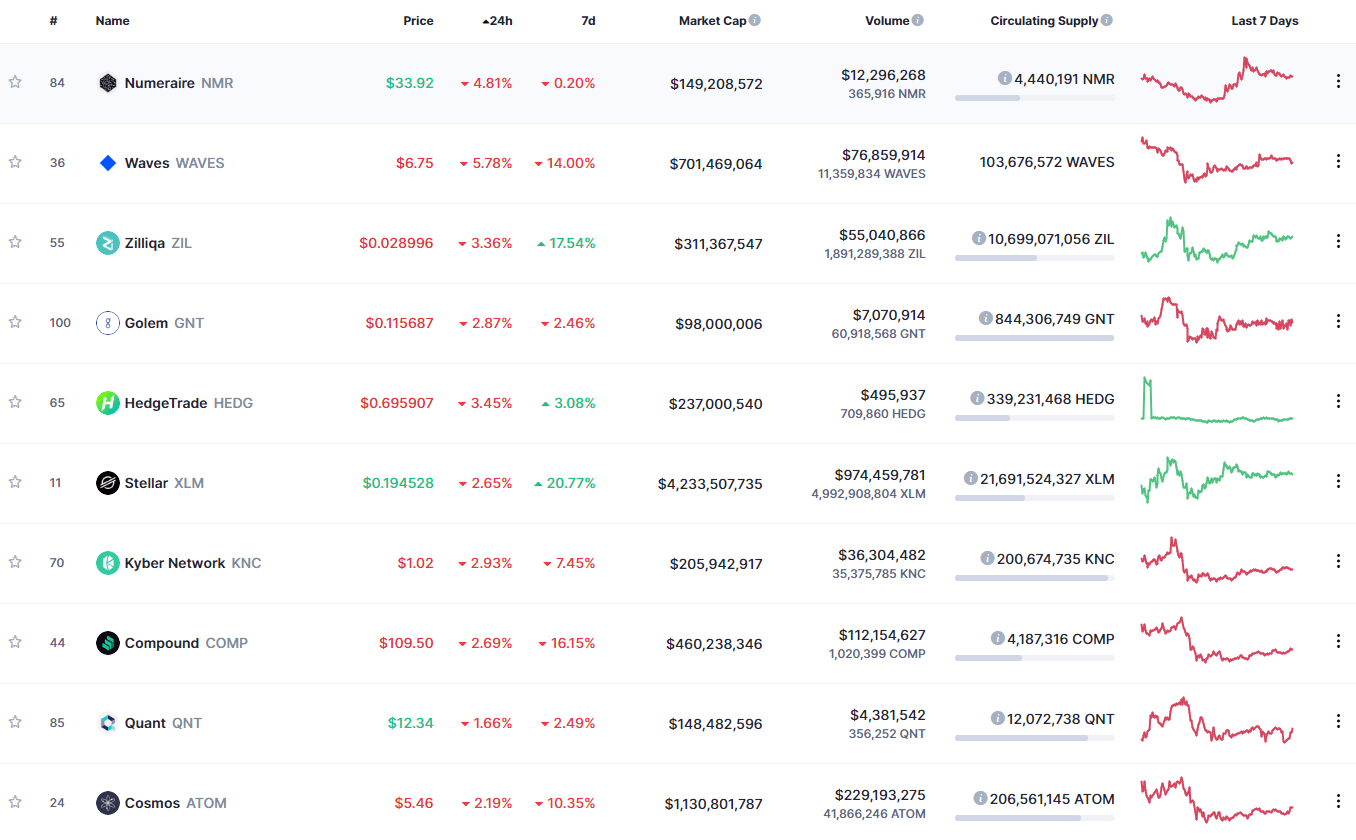
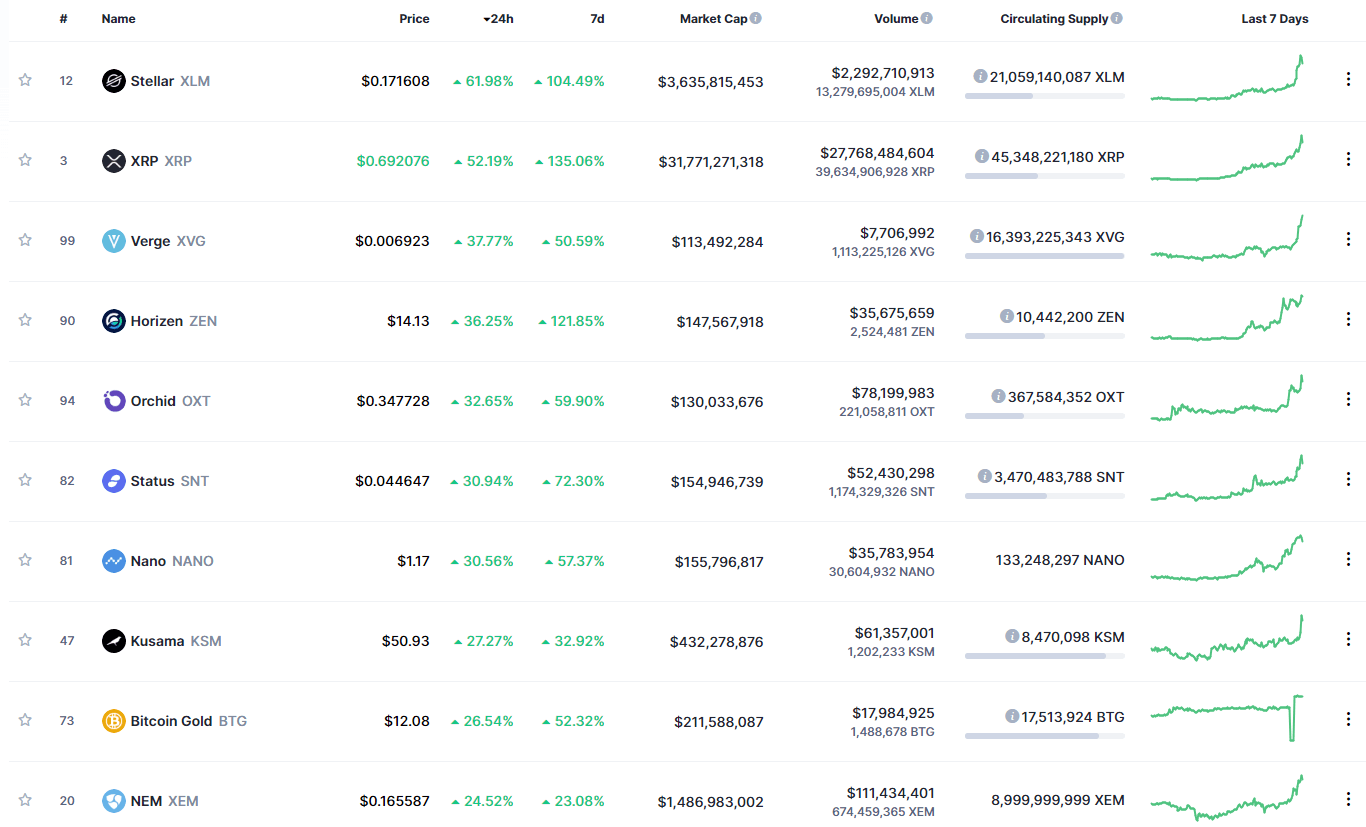
The past 24 hours have passed without any major winners or losers in the top100 cryptos. Ren gained 5.23% in the past 24 hours, making it the most prominent daily gainer in the top100. It is closely followed by Band Protocol’s 4.44% and VeChain’s 4.08% gain. On the other hand, Decentraland lost 4.98%, making it the most prominent daily loser. It is followed by Uniswap’s loss of 4.79% and Kyber Network’s loss of 4.49%.

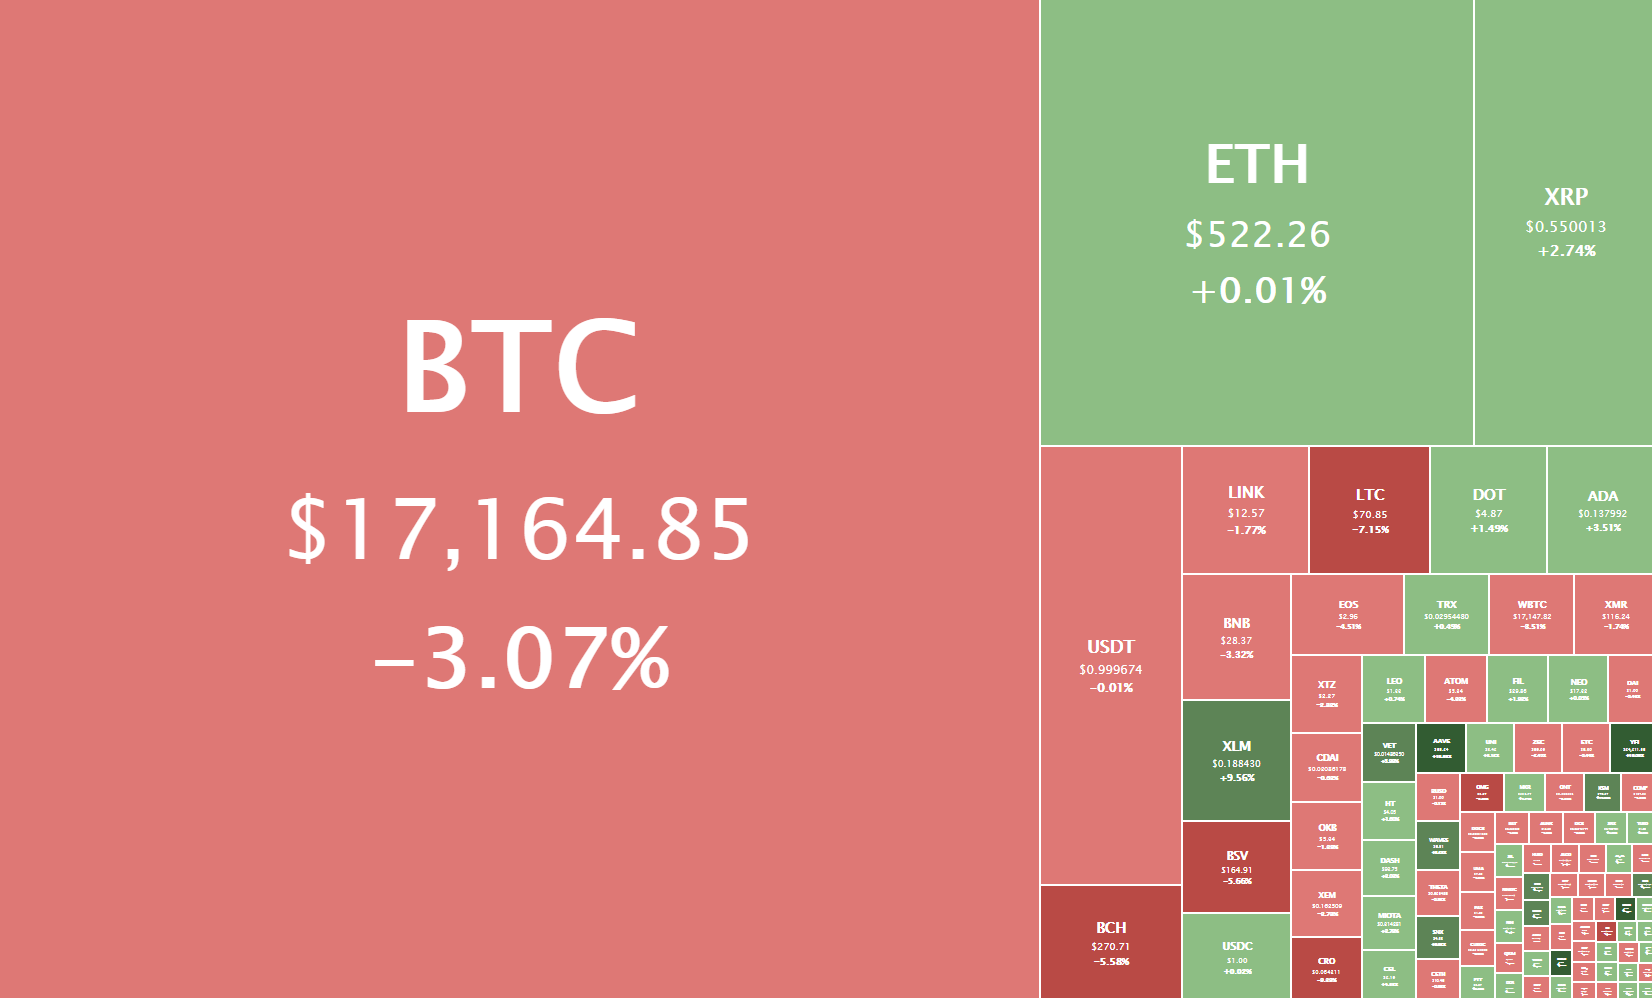
Top 10 24-hour Performers (Click to enlarge)

Bottom 10 24-hour Performers (Click to enlarge)

Bitcoin’s market dominance has barely changed since we last reported, with its value currently being 62.4%. This value represents a difference of 0.1% to the upside when compared to yesterday’s value.

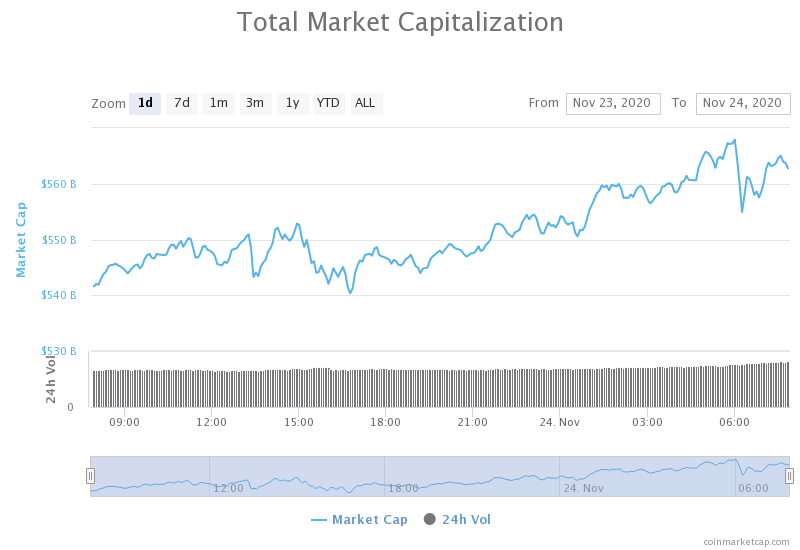
Daily Crypto Market Cap Chart

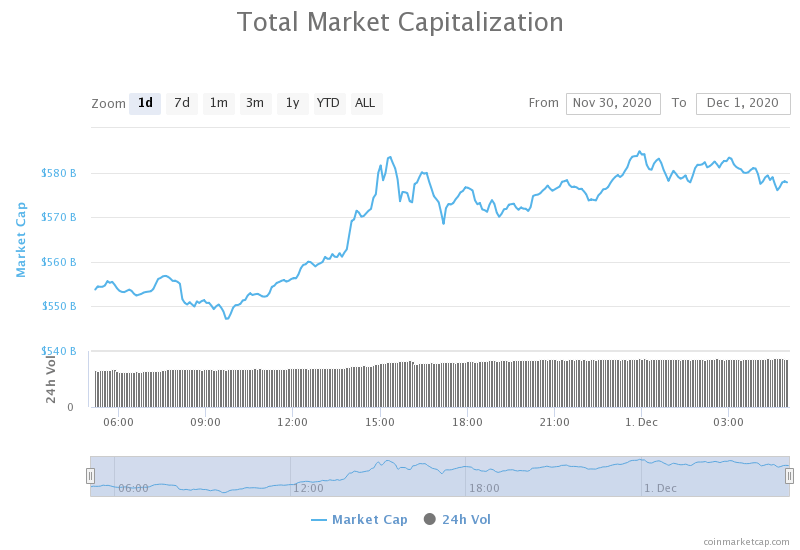
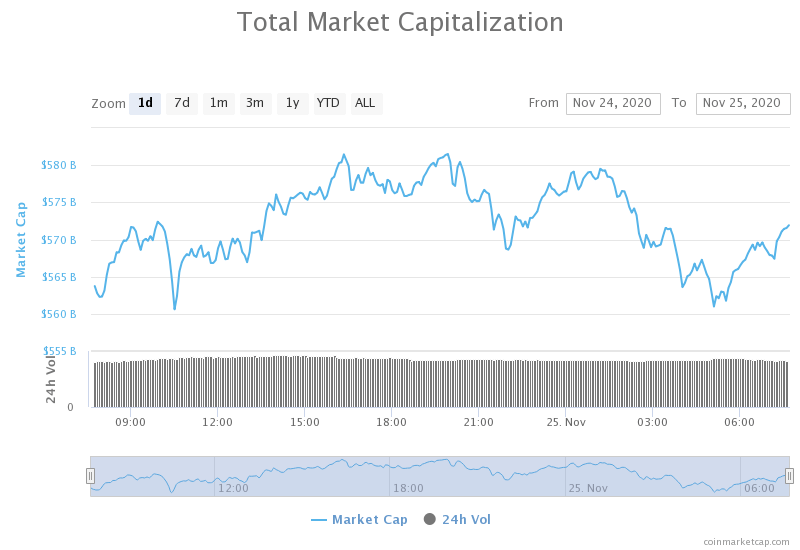
The crypto sector capitalization has decreased just slightly in the past 24 hours. Its current value is $570.51 billion, representing a $0.54 billion decrease compared to our previous report.

_______________________________________________________________________

What happened in the past 24 hours?

_______________________________________________________________________

_______________________________________________________________________

Technical analysis

_______________________________________________________________________

Bitcoin

Bitcoin has spent the day trying to break its immediate resistance (which is sitting at $19,490). However, all attempts throughout the day have been unsuccessful, which prompted Bitcoin to pull back slightly. However, the largest cryptocurrency by market cap has established its presence above $19,000 with confidence once again.

Bitcoin is quite unpredictable at the moment, making safe trades hard to find. Traders should pay attention to BTC volume and enter trades with a high profit/loss ratio to quickly mitigate the risk of things turning from good to bad.

BTC/USD 1-hour chart

Bitcoin’s technicals on all time-frames are bullish, but they all show some signs of neutrality (or even bearishness) alongside the overall bullishness.

BTC/USD 1-day Technicals

Technical factors (4-hour Chart):
  • Price is currently above its 50-period EMA and slightly above its 21-period EMA
  • Price is at its middle Bollinger band
  • RSI is neutral (56.72)
  • Volume is average
Key levels to the upside          Key levels to the downside

1: $19,500                                 1: $19,000

2: $19,666                                 2: $18,790

3: $20,000                                 3: $18,500

Ethereum

Ethereum has spent the day following Bitcoin’s movement, with its price first pushing towards the upside and then pulling back as it was unable to break a certain level (in this case, $620. On the other hand, the second-largest cryptocurrency by market cap has seemingly established its presence above $600, though not with nearly as much conviction as Bitcoin did.

If Ethereum traders followed our advice from yesterday’s analysis, they would have made quite a good profit by longing Ether after it broke $600, with a stop-loss set slightly below this level. While trading Ethereum is still quite possible, the current high correlation with Bitcoin’s movement makes Bitcoin a (possibly) better option to trade, simply due to fewer variables a trader would have to consider.

ETH/USD 1-hour Chart

Ethereum’s daily and monthly overviews are completely bullish, while its 4-hour and weekly time-frames show some form of neutrality next to the overall bullishness.

ETH/USD 1-day Technicals

Technical Factors (4-hour Chart):
  • The price is currently above its 50-period and slightly above its 21-period EMA
  • Price is at its middle Bollinger band
  • RSI is neutral (57.22)
  • Volume is average
Key levels to the upside          Key levels to the downside

1: $620                                     1: $600

2: $630                                     2: $510 

3: $735                                      3: $500

Ripple

The fourth-largest cryptocurrency by market cap has had another extremely slow day, with its price barely fluctuating at all. The low volume and low volatility are continuing throughout the week, with XRP just barely moving to the downside as a response to the minor pullback caused by Bitcoin’s movement.

Trading XRP is a near-impossible feat at the moment, as the cryptocurrency currently shows no volatility and (therefore) no trade opportunities.

XRP/USD 2-hour Chart

XRP’s daily and monthly overviews are completely bullish, while its weekly time-frames show bullish sentiment with a hint of neutrality. Its 4-hour overview, however, is completely bearish.

XRP/USD 1-day Technicals

Technical factors (4-hour Chart):
  • The price is (at the moment of writing) slightly above its 50-period EMA and slightly below its 21-period EMA
  • Price is slightly below its middle Bollinger band
  • RSI is neutral (48.53)
  • Volume is slightly below average
Key levels to the upside          Key levels to the downside

1: $0.666                                   1: $0.6

2: $0.78                                     2: $0.596

3: $0.79                                   3: $0.535

Categories
Forex Elliott Wave Forex Market Analysis

Is GBPUSD Preparing a Reversal Move?

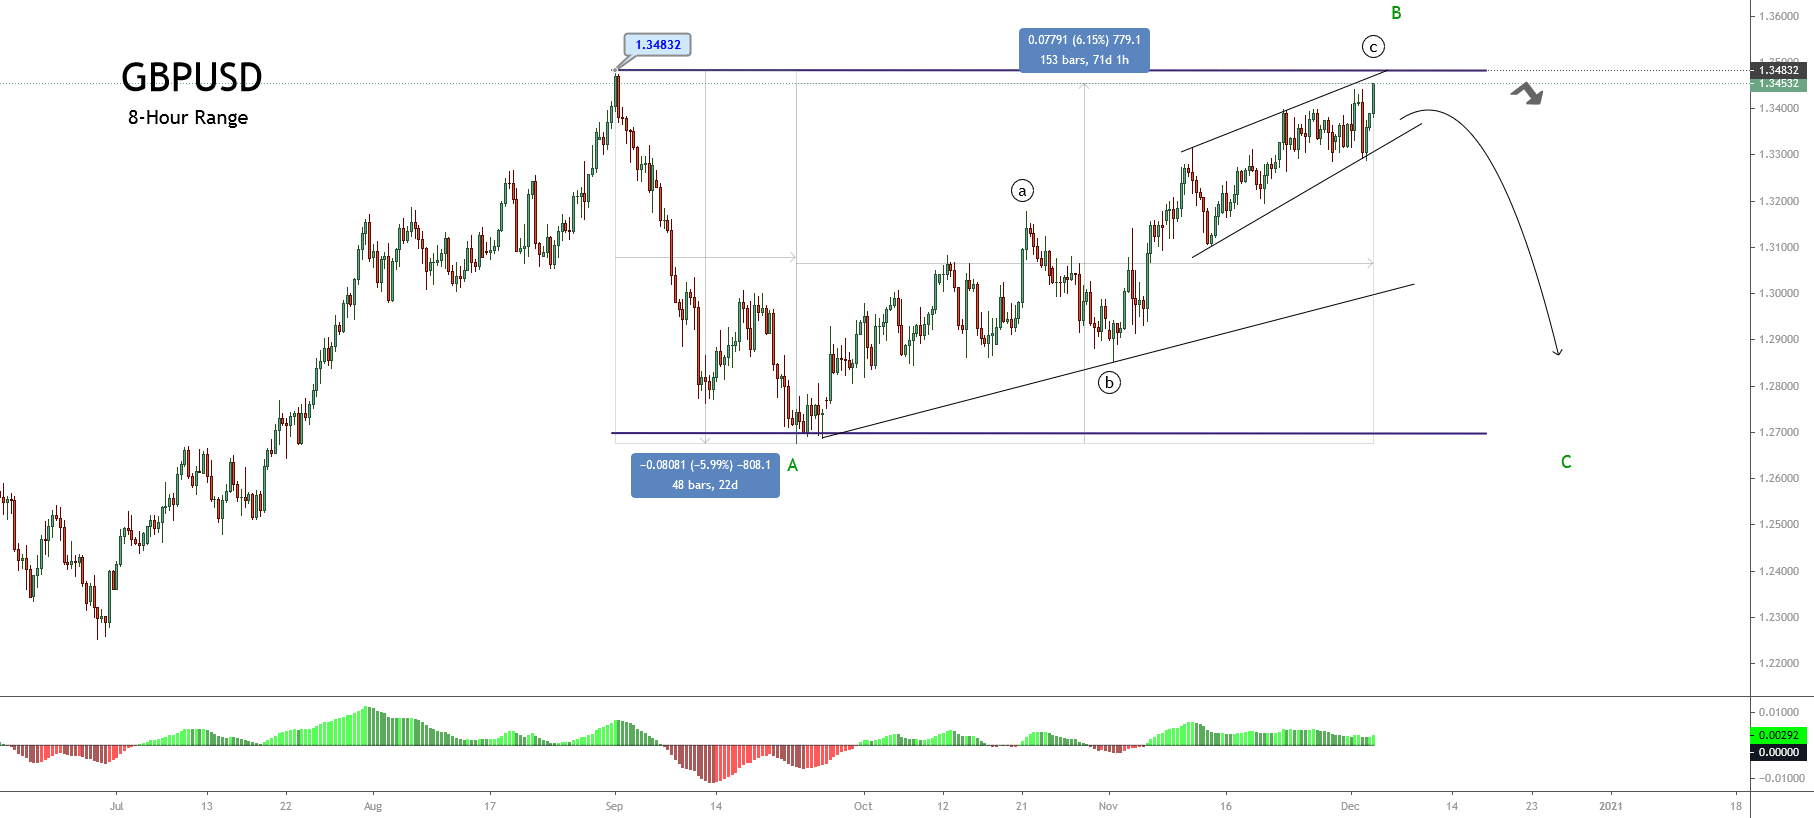
The GBPUSD pair is seen advancing in an ending diagonal pattern inside an incomplete flat pattern of Minor degree, identified in green, which is in progress since September 01st when the Sterling found resistance 1.34832. 


Technical Overview

The previous 8-hour chart exposes the advance in a potential flat pattern (3-3-5), which currently develops its wave B of Minor degree identified in green. In this context, once the current corrective rally ends, the next potential move, according to the Elliott Wave theory, could correspond the wave C. This movement should follow an internal structure subdivided into five wave segments.

Analyzing wave B’s internal structure, currently, we see the price advancing in its wave ((c)) of Minute degree labeled in black. In this context, according to the textbook, the pattern identified in the current wave ((c)) has the shape of an incomplete ending diagonal pattern.

On the other hand, looking at the price and time relationship presented in the first chart, it is interesting to compare the elapsed time of the current wave B with wave A. This comparison suggests that the current wave B can be thought of as a corrective rally; thus, the next move could become an aggressive decline. 

Nevertheless, considering that the current wave B remains in progress, the short-term bias is still on the bullish side.

Technical Outlook

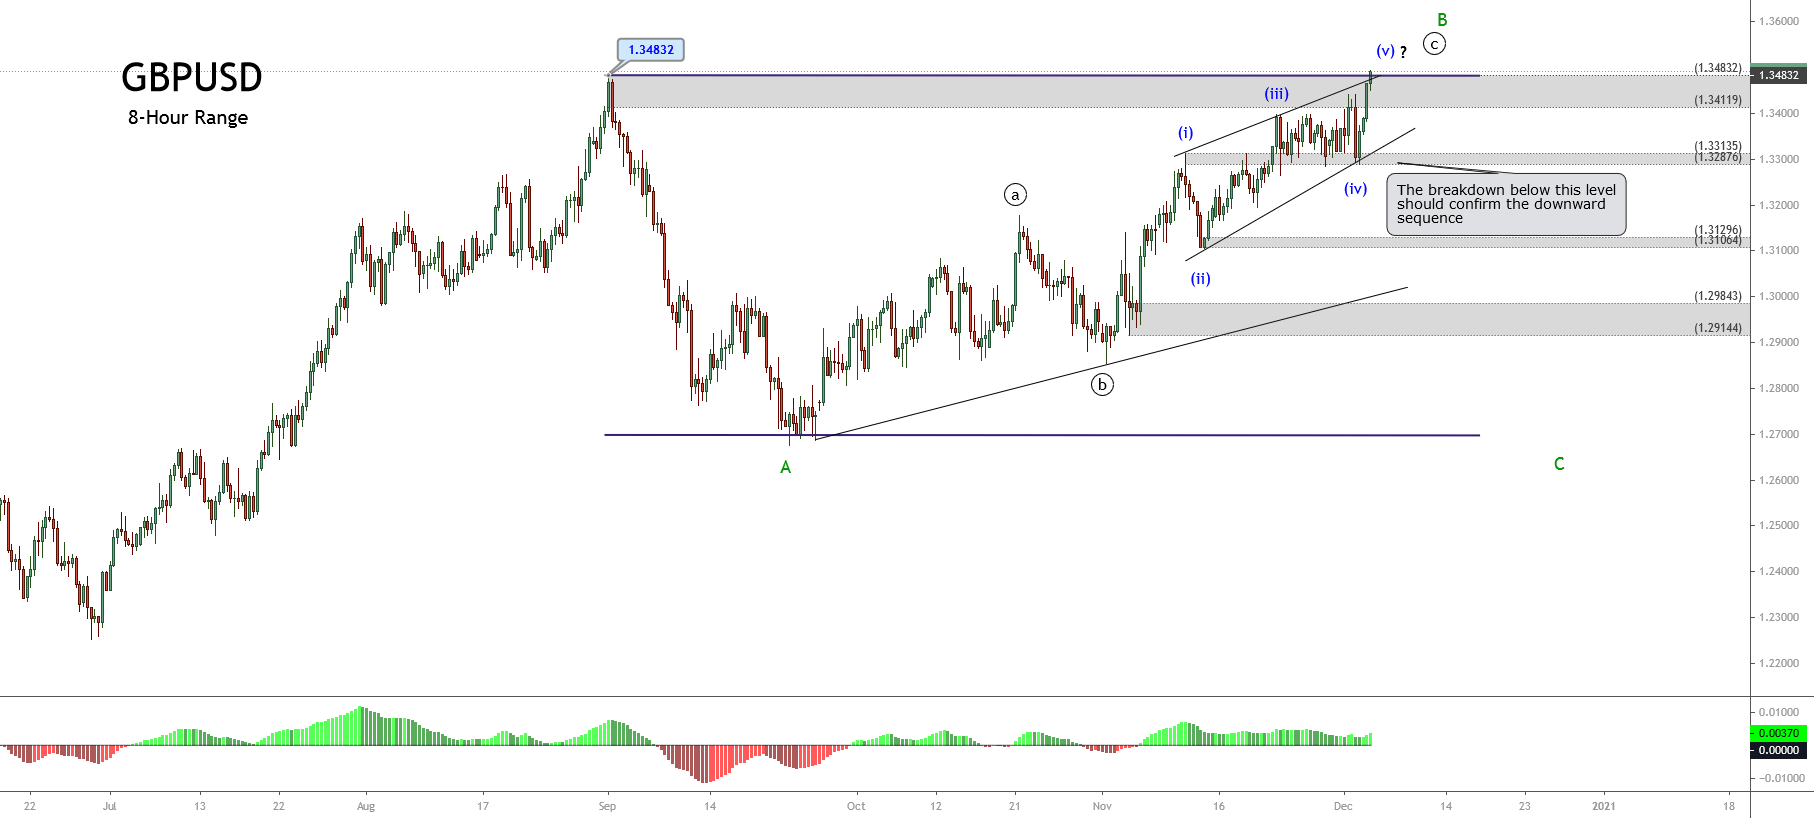
The next 8-hour chart shows the GBPUSD advance in its fifth wave of Minuette degree, labeled in blue, which belongs to the wave ((c)), in black, suggesting a terminal movement.

In this context, the price’s test of the upper sideways channel trendline suggests that the Pound Sterling could develop an expanded flat pattern. This Elliott Wave pattern’s implication makes us consider a strike over the origin of wave A located at 1.34832, where the pair should start to decline, developing its wave C in green.

Finally, both the ending diagonal pattern and the expanded flat pattern requires the pair to confirm the breakdown below the demand zone between 1.33135 and 1.32876. If the pair’s price action confirms this breakdown, it could move down up to the level of 1.29144.

Categories
Crypto Market Analysis

Daily Crypto Review, Dec 3 – PayPal and BlackRock Heads Extremely Bullish on Bitcoin; Crypto Sector Consolidating

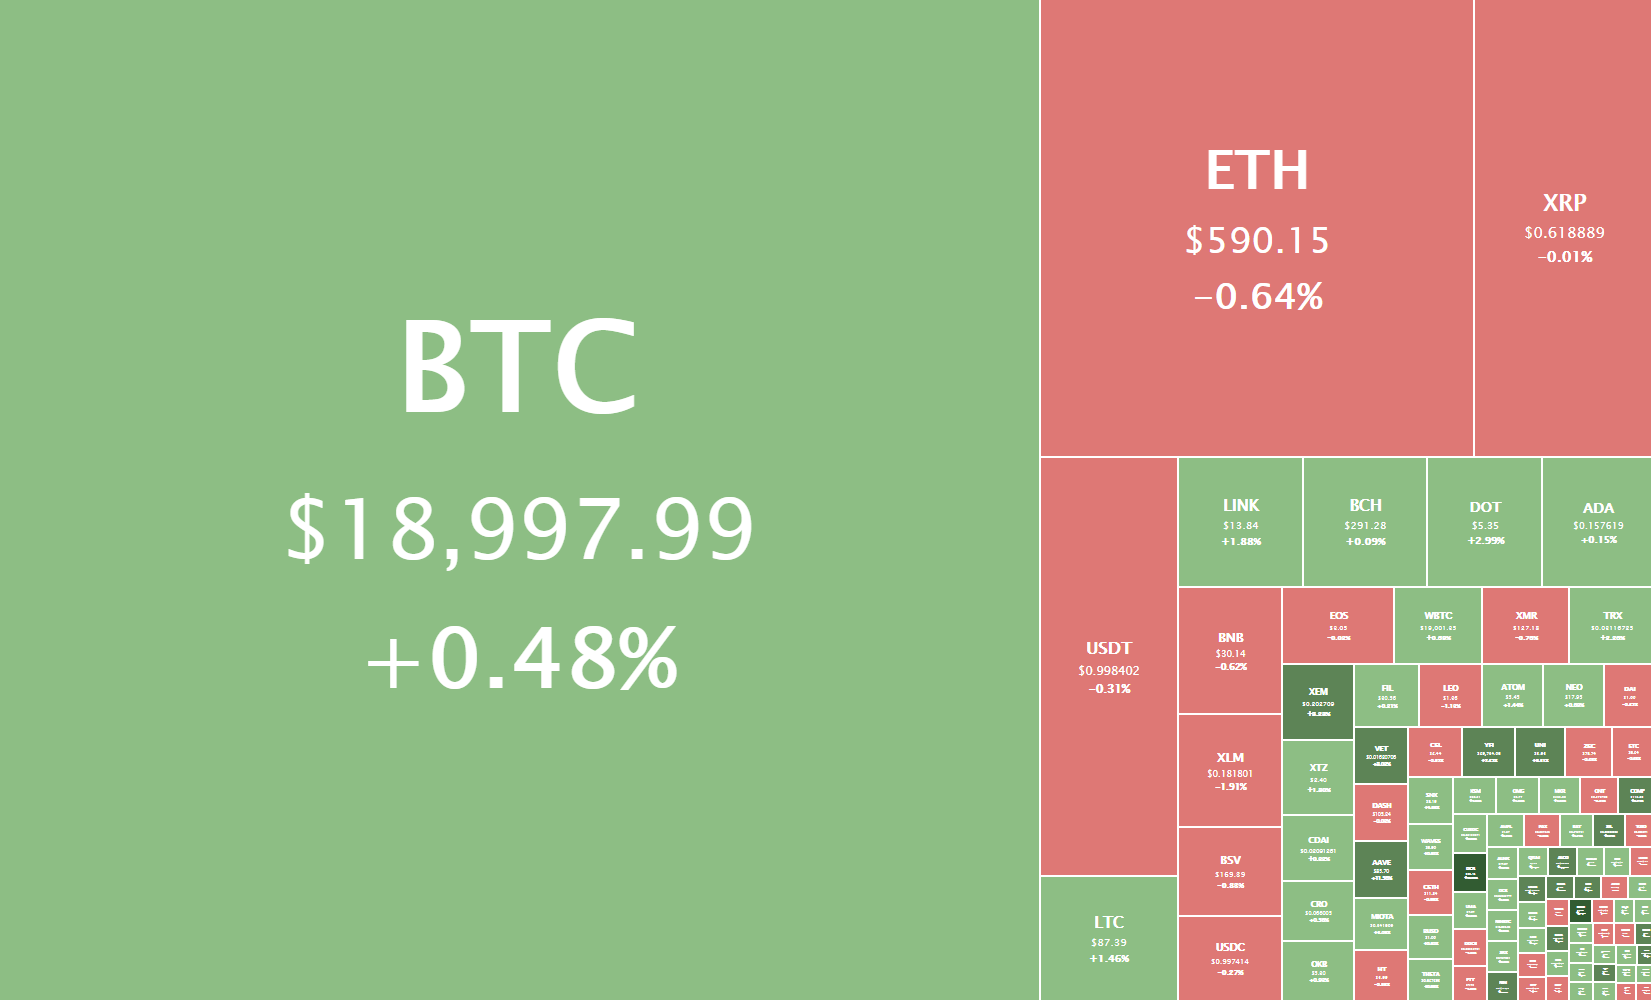
The cryptocurrency sector has spent the day stabilizing after a sudden drop. Bitcoin is currently trading for $18,997, representing an increase of 0.48% compared to our last report. Meanwhile, Ethereum’s price decreased 0.64% on the day, while XRP managed to lost 0.01%.

 Daily Crypto Sector Heat Map

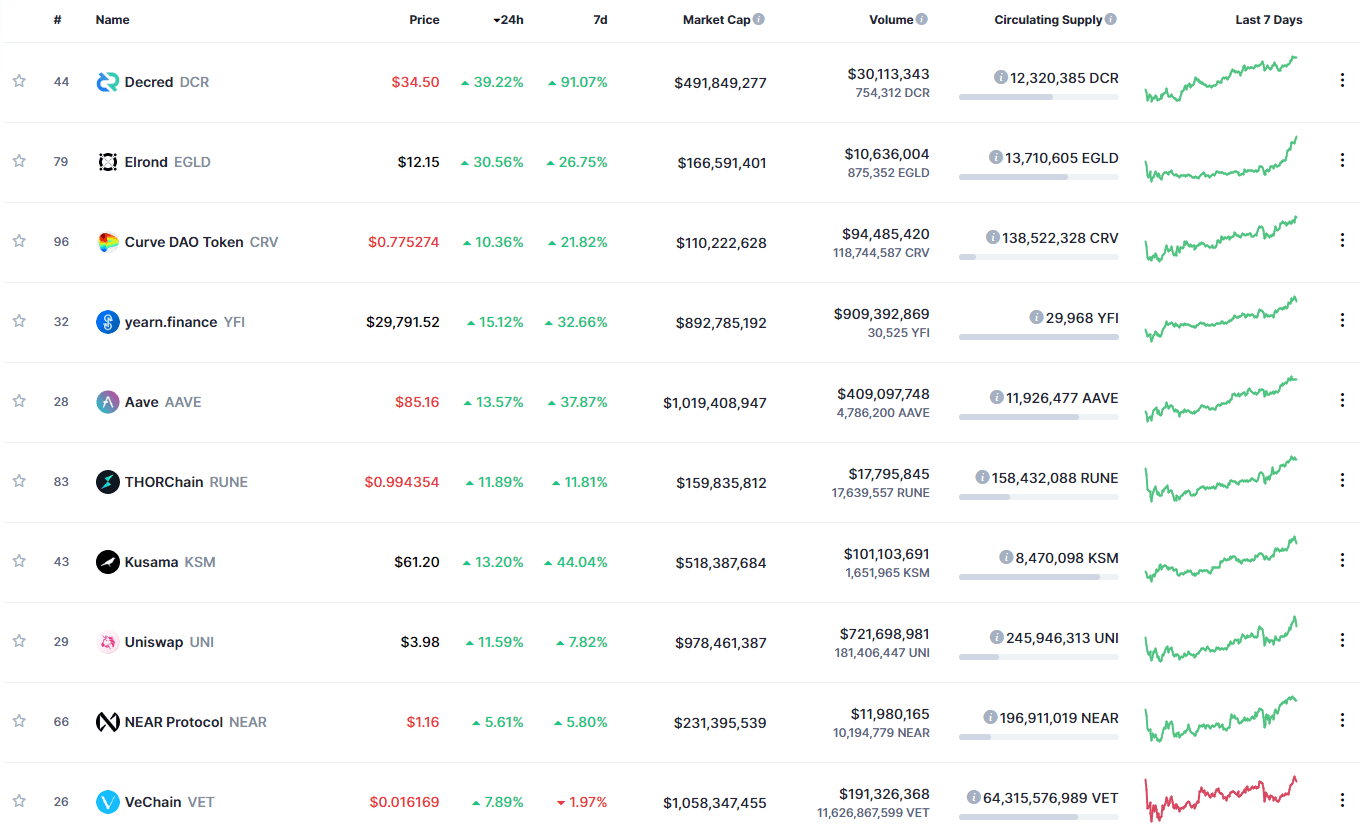
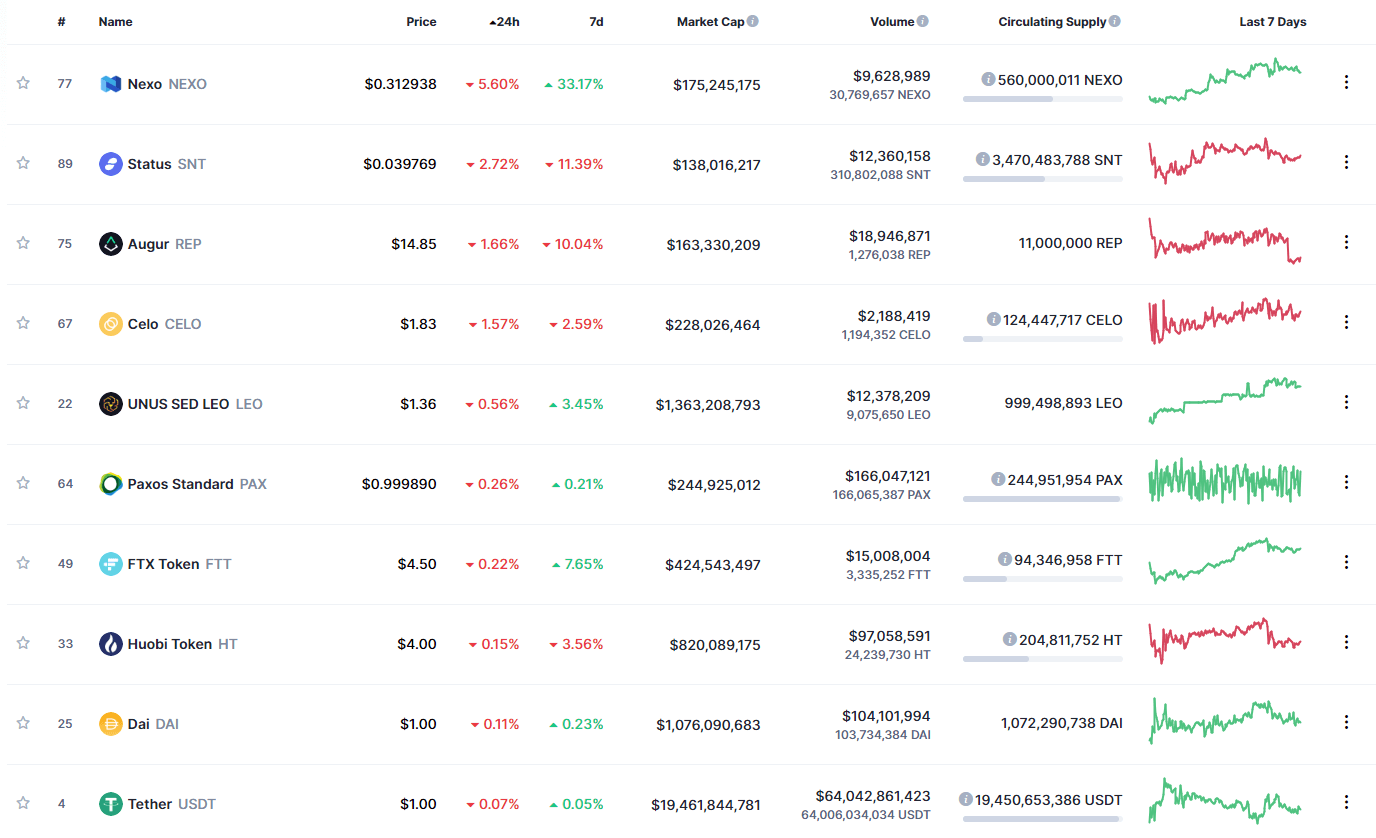
Decred gained 39.22% in the past 24 hours, making it the most prominent daily gainer in the top100. It is closely followed by Elrond’s 30.56% and Curve DAO Token’s 10.36% gain. On the other hand, Nexo lost 5.60%, making it the most prominent daily loser. It is followed by Status’s loss of 2.72% and Augur’s loss of 1.66%.

Top 10 24-hour Performers (Click to enlarge)

Bottom 10 24-hour Performers (Click to enlarge)

Bitcoin’s market dominance hasn’t changed since we last reported, with its value currently staying at 62.3%. This value represents a 0% difference when compared to yesterday’s value.

Daily Crypto Market Cap Chart

The crypto sector capitalization has increased significantly in the past 24 hours. Its current value is $571.05 billion, representing a $10.27 billion increase compared to our previous report.

_______________________________________________________________________

What happened in the past 24 hours?

_______________________________________________________________________

_______________________________________________________________________

Technical analysis

_______________________________________________________________________

Bitcoin

Bitcoin has spent the day recovering from yesterday’s pullback and trying to regain $19,000. However, this level has proven to be a solid resistance zone, and it is unsure whether Bitcoin will manage to push over it. On the other hand, the overall sentiment around the largest cryptocurrency by market cap is incredibly bullish, mostly due to the massive investments coming from the institutional side.

Bitcoin is very volatile and unpredictable at the moment, making the trades quite hard to pull off. Traders should pay attention to volume and watch smaller time-frames and enter trades with a high profit/loss ratio to mitigate the risk when things go bad.

BTC/USD 4-hour chart

Bitcoin’s short-term technicals are completely bullish, while its weekly and monthly technicals show some signs of neutrality alongside the overall bullishness.

BTC/USD 1-day Technicals

Technical factors (4-hour Chart):
  • Price is above its 50-period EMA and slightly above its 21-period EMA
  • Price is at its middle Bollinger band
  • RSI is neutral (54.55)
  • Volume is average
Key levels to the upside          Key levels to the downside

1: $19,000                                 1: $18,790

2: $19,500                                 2: $18,500

3: $19,666                                  3: $18,240

Ethereum

Ethereum has spent the day mostly flat and hovering right under the $600 mark. The second-largest cryptocurrency by market cap has continuously failed to break the immediate resistance level but did not back down from it.

Ethereum traders have a good chance of catching a safe trade with a stop-loss slightly below $600 if Ether pushes above $600 (either because of its own price movement or as a response to Bitcoin breaking $19,000 with conviction).

ETH/USD 4-hour Chart

Ethereum’s daily and monthly technicals are completely bullish, while its 4-hour and weekly time-frames show some neutrality next to the overall bullishness.

ETH/USD 1-day Technicals

Technical Factors (4-hour Chart):
  • The price is above its 50-period and at its 21-period EMA
  • Price is at its middle Bollinger band
  • RSI is neutral (54.35)
  • Volume is average
Key levels to the upside          Key levels to the downside

1: $600                                     1: $510

2: $630                                     2: $500 

3: $735                                      3: $490

Ripple

The fourth-largest cryptocurrency by market cap has had another slow day, with its price fluctuating between $0.6 and $0.64. The $0.6 support level seems to be holding quite well, while the $0.625 level got ignored several times, which made us remove it from the key levels section.

Trading XRP is almost impossible as the cryptocurrency currently has no volatility and (therefore) no trade opportunities.

XRP/USD 4-hour Chart

XRP’s daily and monthly technicals are completely bullish, while its 4-hour and weekly time-frames’ show bullish sentiment with a hint of neutrality.

XRP/USD 1-day Technicals

Technical factors (4-hour Chart):
  • The price is slightly above its 50-period EMA and at its 21-period EMA
  • Price is at its middle Bollinger band
  • RSI is neutral (51.08)
  • Volume is slightly below average
Key levels to the upside          Key levels to the downside

1: $0.666                                   1: $0.6

2: $0.78                                     2: $0.596

3: $0.79                                   3: $0.535


Categories
Forex Signals

AUD/USD Supported By Upward Channel – Brace for a Buy Trade! 

The AUD/USD closed at 0.73723 after placing a high of 0.73731 and a low of 0.73393. The increasing risk sentiment in the market due to vaccine hopes they raised the risk-sensitive Aussie in the market and supported the AUD/USD pair’s upward momentum. Another factor involved in the rising AUD/USD prices on Tuesday as the US dollar’s weakness.

The US dollar lost its traction in the market after the hopes for further stimulus from Congress were raised, and the macroeconomic data also came in against the local currency. The losses in the US dollar could also be attributed to the rising number of coronavirus cases in the USA.

On Tuesday, the US health officials said that Americans would hopefully receive the vaccine shots against the coronavirus starting from mid-December after the emergency authorization use of Pfizer’s vaccine will be approved by the US FDA. This positive news supported the risk sentiment, raised the risk-sensitive Aussie on board, and supported the AUD/USD pair’s upward momentum.

Another reason behind the bullish movement of the AUD/USD pair on Tuesday was the increasing hopes of the US stimulus bill after the testimony of Jerome Powell and Steven Mnuchin. The Fed chair Jerome Powell said that the rising number of coronavirus cases and deaths because of the pandemic had destroyed the US economy’s outlook. The outgoing US Treasury Secretary Steven Mnuchin also urged the lawmakers to release the second round of US stimulus package as the economy has been hit hard because of the pandemic due to increased restrictive measures in many states of America.

On the data front, at 02:30 GMT, the AIG Manufacturing Index came in November as 52.1 against the previous 56.3. At 05:30 GMT, the Building Permits from Australia raised in October to 3.8% against the forecasted -3.0% and supported the Australian dollar that added gains in AUD/USD pair. The Current Account Balance from Australia for October also raised to 10.0B from the forecasted 7.2B and supported Aussie that added further gains in AUD/USD pair. At 10:30 GMT, the Commodity Prices for the year from Australia were reported as 2.2%.

From the US front, at 20:00 GMT, the ISM Manufacturing PMI for November fell to 5.75 against the projected 5.9 and weighed on the US dollar and supported the upward momentum of the AUD/USD pair. For October, the Construction Spending rose to 1.3% against the estimated 0.8% and supported the US dollar. The ISM Manufacturing Prices for November surged to 65.4 against the forecasted 65.0 and supported the US dollar. The Wards Total Vehicle Sales from the US declined to 15.6M against the estimated 16.1M and weighed on the US dollar that added further gains in AUD/USD pair.

Meanwhile, on Tuesday, the Reserve Bank of Australia kept its Cash Rates to their rock bottom level at 0.1% and said it would not further cut the rates. The Governor of RBA Philip Lowe said that the bank was doing its best to revive the nation from its current coronavirus induced recession. Lowe added that the economic recovery was underway, but its economic data was coming better than expected.

He also said that the recovery was still expected to be uneven and was dependent on significant policy support. RBA’s GDP forecast would grow by around 5% in 2021 and 4% in 2022. The positive comments from RBA and positive outlook for Australia added strength in local currency Aussie and supported the bullish momentum of the AUD/USD pair on Tuesday.


Daily Technical Levels

Support Resistance

0.7347 0.7382

0.73270.7395

0.7313 0.7416

Pivot point: 0.7361

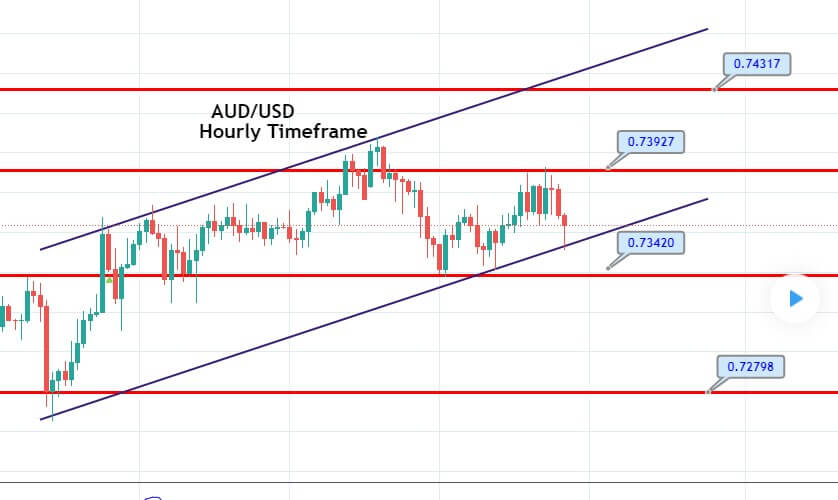
The AUD/USD is trading sideways, holding between 0.7392 – 0.7342 levels, and closing of candles below 0.7392 level supports selling bias. While buying trend can be seen over 0.7345 level. On the 2 hour timeframe, the AUD/USD has formed an upward channel, which is likely to keep the pair supported. Let’s consider taking a buying trade over the 0.7340 level today. Good luck! 


Categories
Forex Market Analysis Forex Technical Analysis

NZDJPY Fills the Gap Unfilled Since May 2019

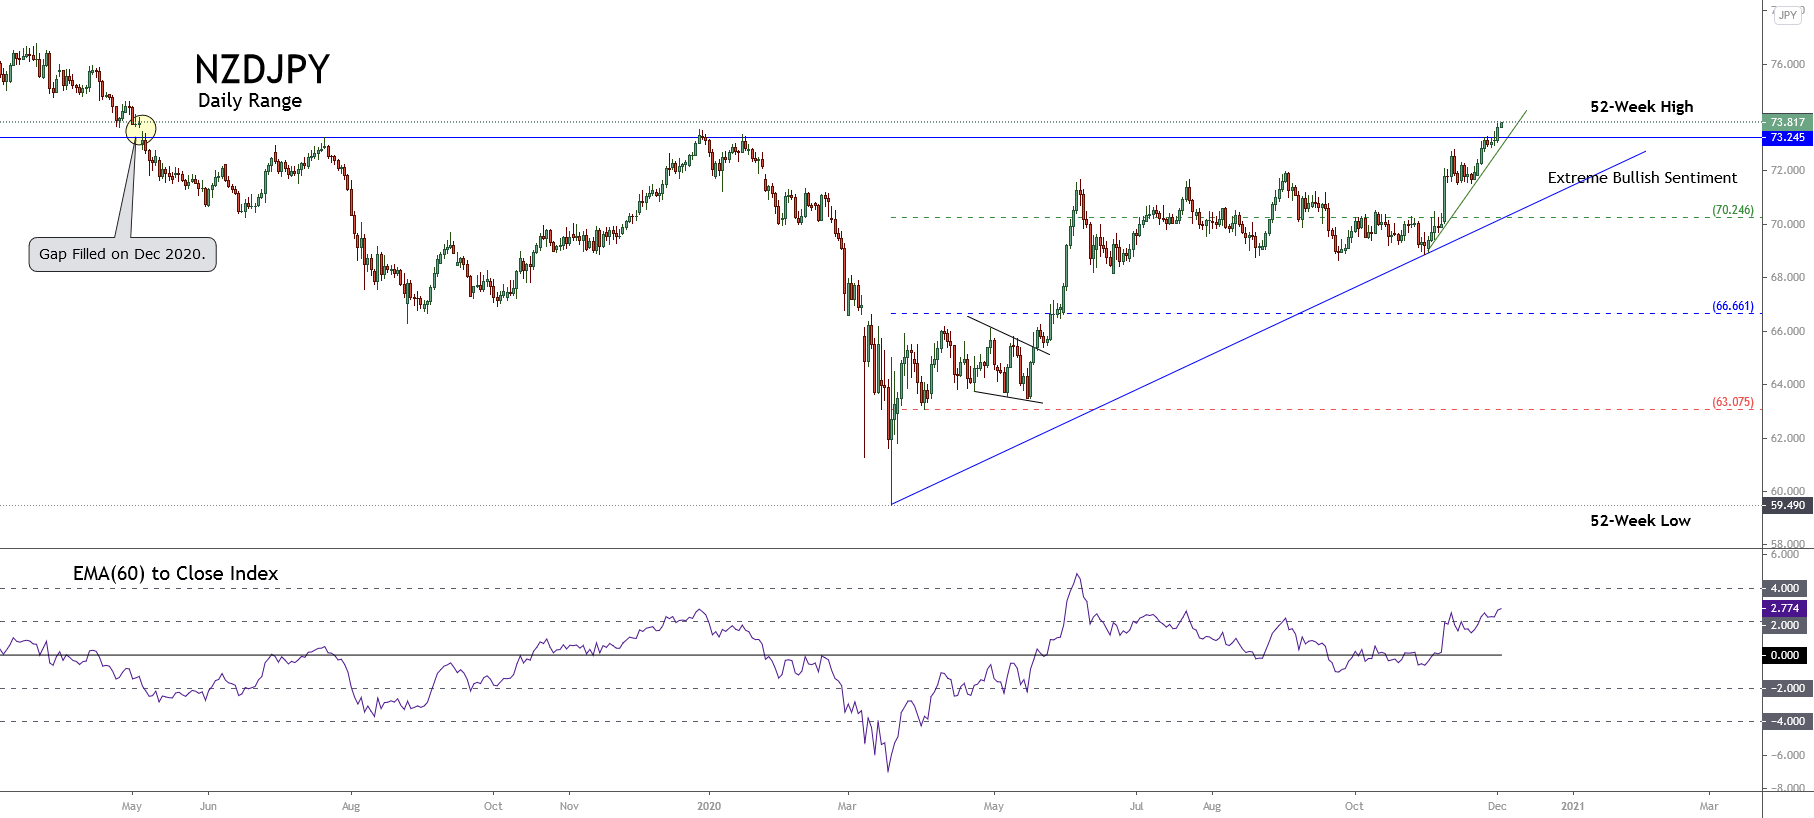
The NZDJPY advanced 5.70% in November, consolidating the price in the extreme bullish sentiment zone. Likewise, as illustrated in the following daily chart, during December’s kickoff trading, the cross reached the yearly high of 73.831, filling the gap that opened on May 06th, 2019.

Technical Overview

The previous chart also exposes the cross advancing in a mid-term uptrend drawn in blue, which remains active since last March 18th, when the price found support at 59.490. Likewise, we distinguish an accelerated short-term bullish trend plotted in green, which began in early November. 

The 2.774 reading observed in the EMA(60) to Close Index leads us to suspect that the impulsive bull market developed in the NZDJPY cross seems to be in an exhaustion stage. Therefore, the cross is likely to develop a reversal movement in the following trading sessions.  

Nevertheless, before taking a position on the bearish side, the price action must confirm the reversal movement. 

Technical Outlook

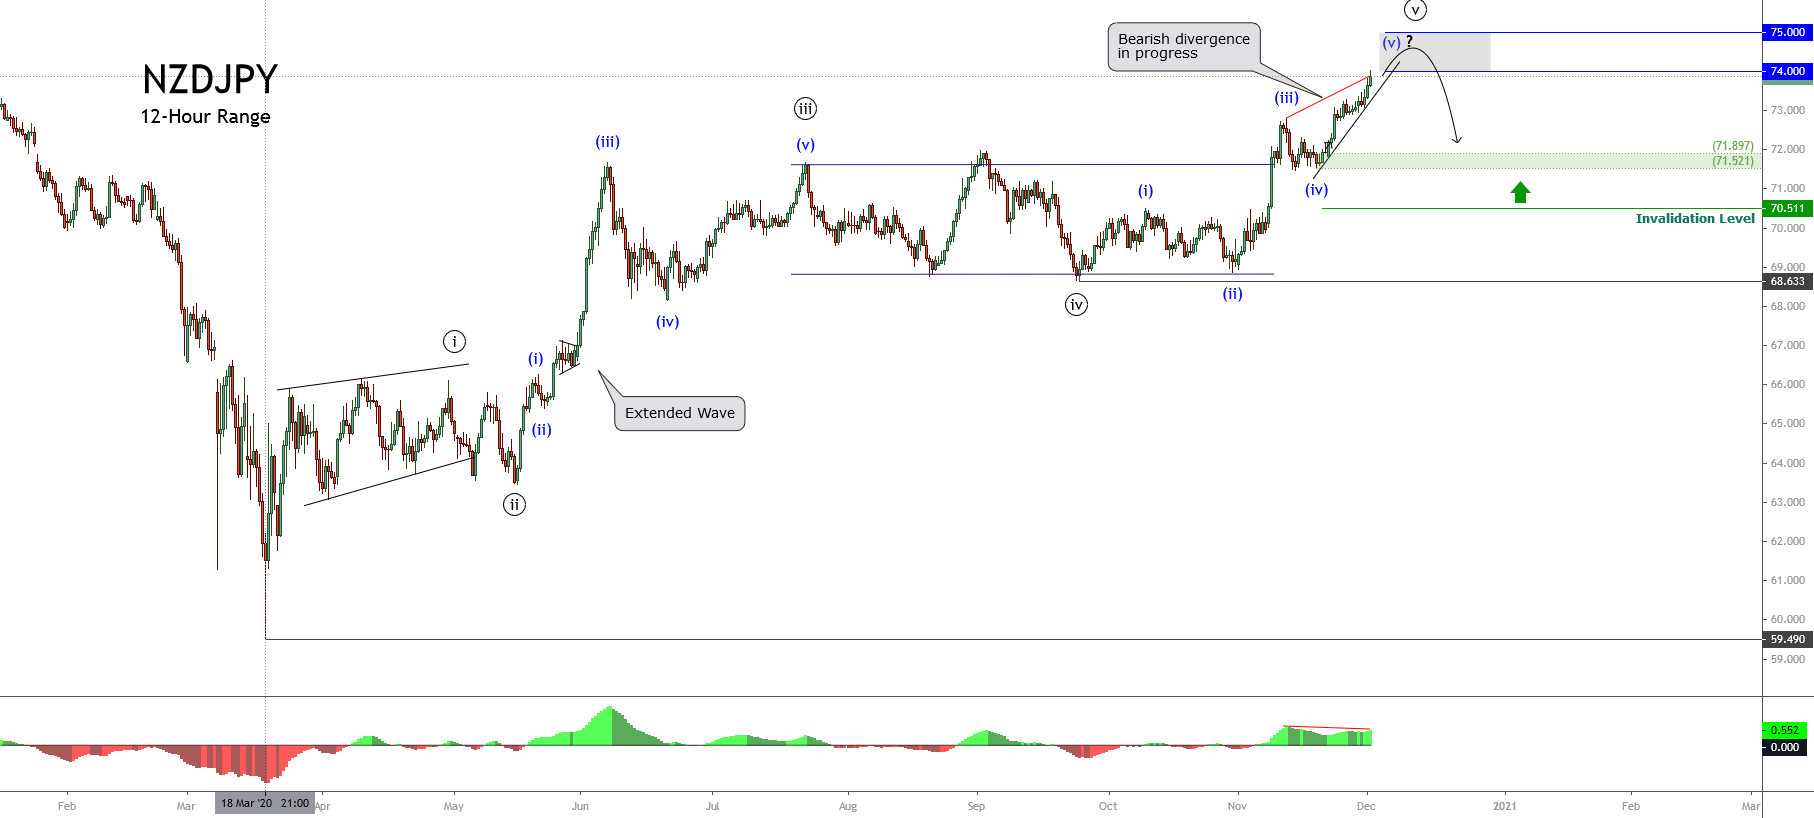
The following 12-hour chart presents the mid-term Elliott Wave view or the NZDJPY cross. The drawings reveal the cross advancing in an incomplete fifth wave of Minuette degree, labeled in blue that belongs to the fifth wave of Minute degree, in black.

NZDJPY’s price movements reveal an impulsive five-wave sequence of Minute degree identified in black, which began last March 18th, when the cross found fresh sellers after the massive sell-off developed in the global stock market. 

Likewise, once the extended third wave (in black) ended, the cross developed a sideways movement as a flat pattern, which found fresh buyers at 68.633. In this context, considering the Elliott Wave theory and that wave ((iii)) was the extended wave, the next impulsive wave ((v)) (in black) can’t be extended and should look similar to wave ((i)), also in black. 

On the other hand, watching the fifth wave’s internal structure (in black), the wave (ii) (in blue) looks like a complex correction, and the third wave is the extended movement. In this context, the current wave (v) (in blue), which is still in development, shouldn’t be an extended rally.

Consequently, the cross could complete its fifth wave of Minute degree in the area defined by the psychological levels between 74.00 and 75.00. Finally, until the cross shows evidence of a reversal, such as a bearish engulfing candle, we should consider the cross’ trend as bullish.

Categories
Crypto Market Analysis

Daily Crypto Review, Dec 2 – Traders Sell the News on ETH 2.0 Phase 0 Launch; Crypto Market in the Red

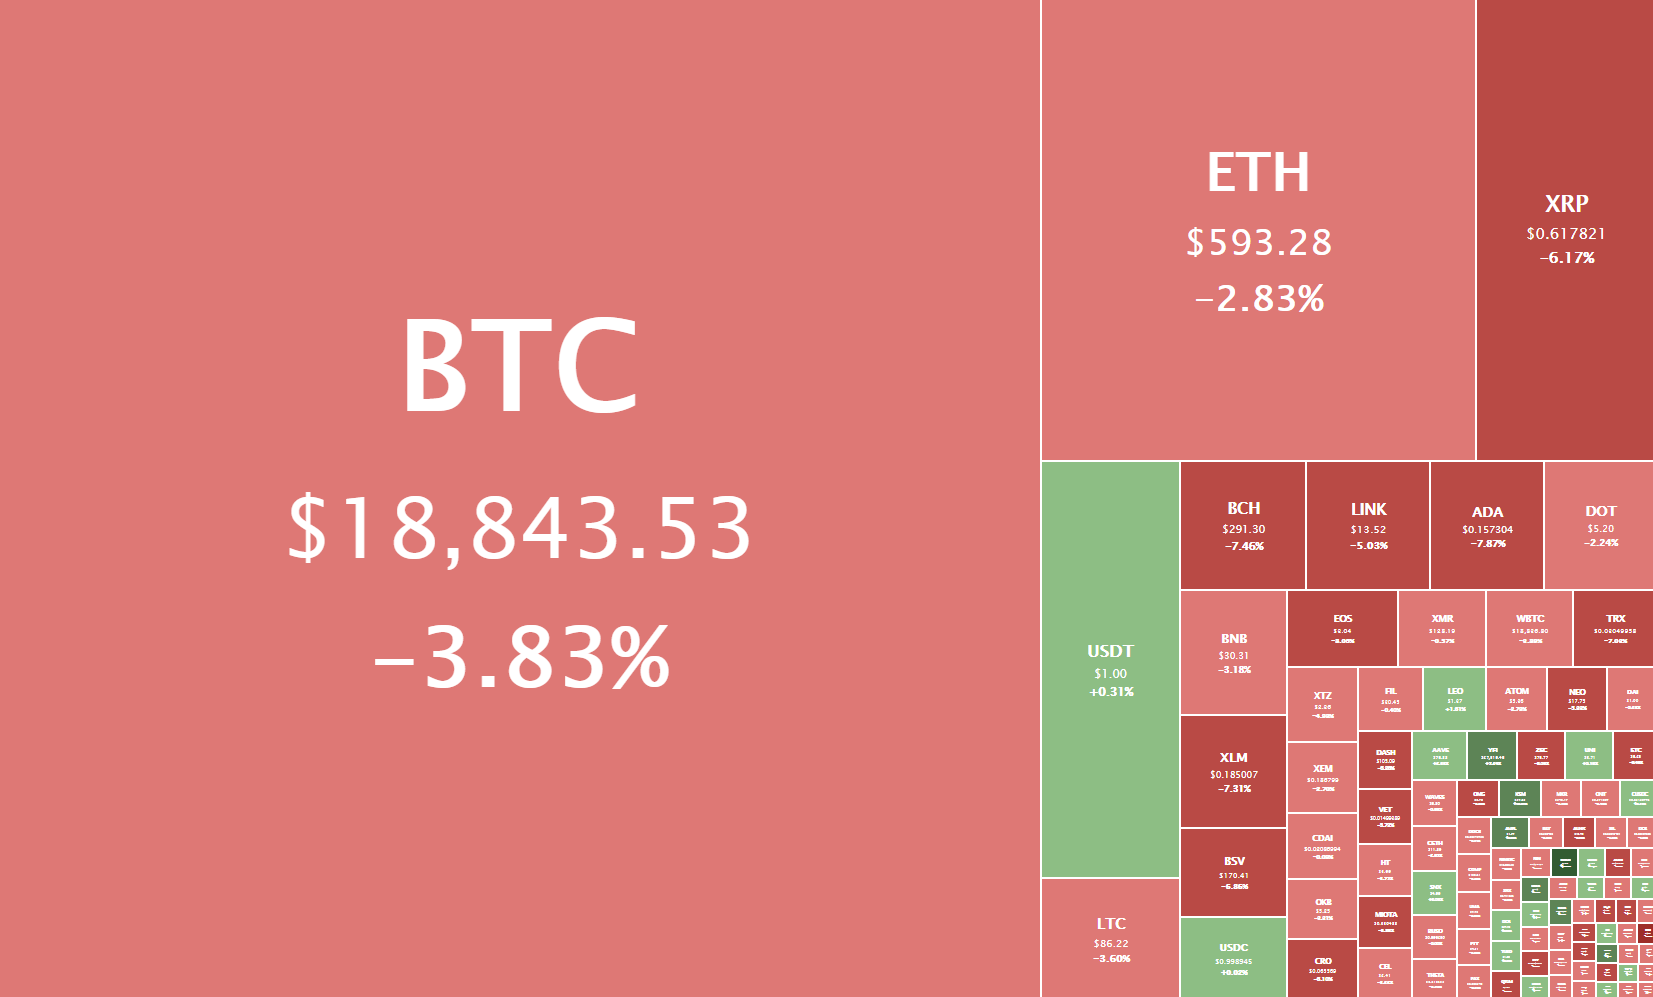
The cryptocurrency sector has dipped as the market entered a “selloff” mode the moment Ethereum’s 2.0 Phase 0 launched. The largest cryptocurrency by market cap is currently trading for $18,843, representing a decrease of 3.83% on the day. Meanwhile, Ethereum lost 2.83% on the day, while XRP managed to lost 6.17%.

 Daily Crypto Sector Heat Map

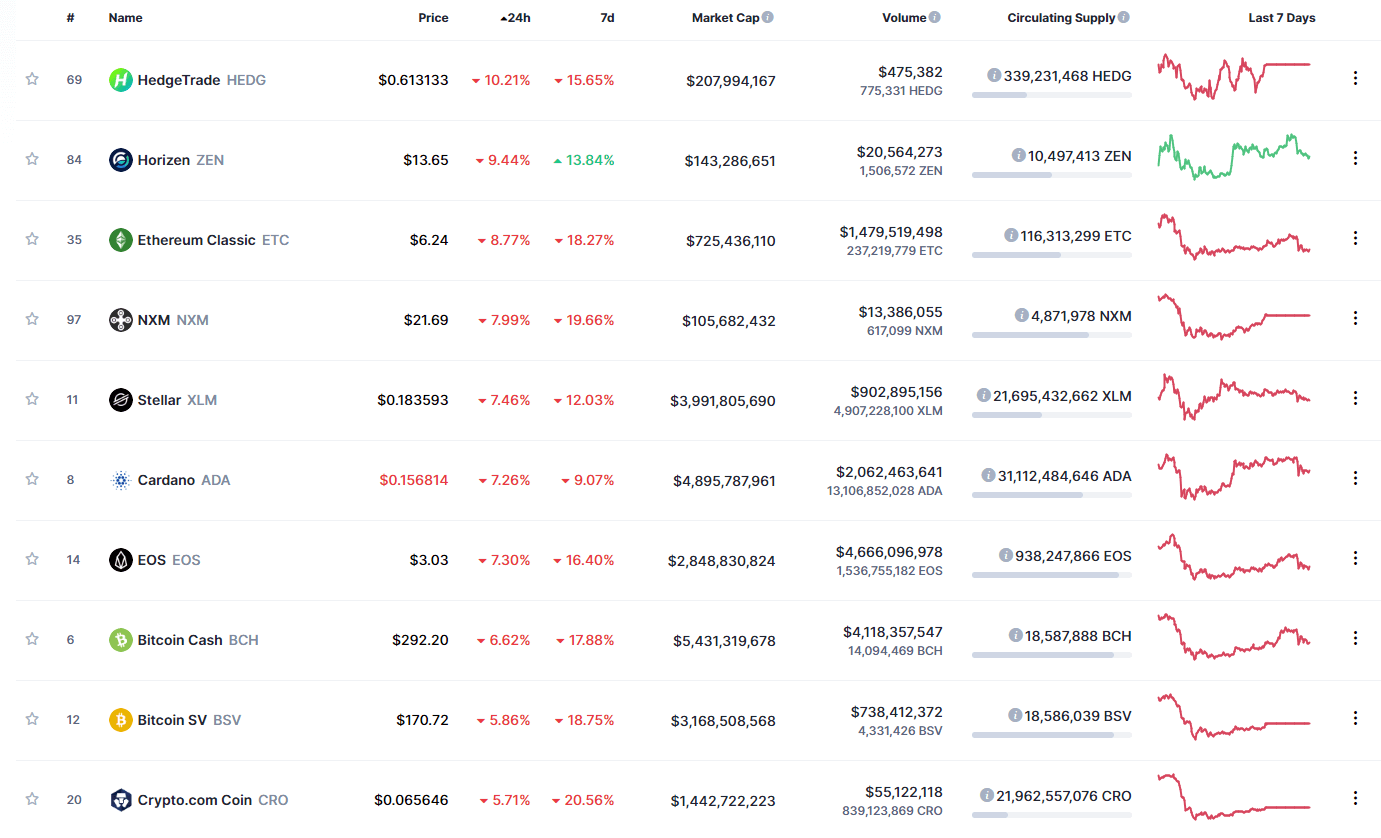
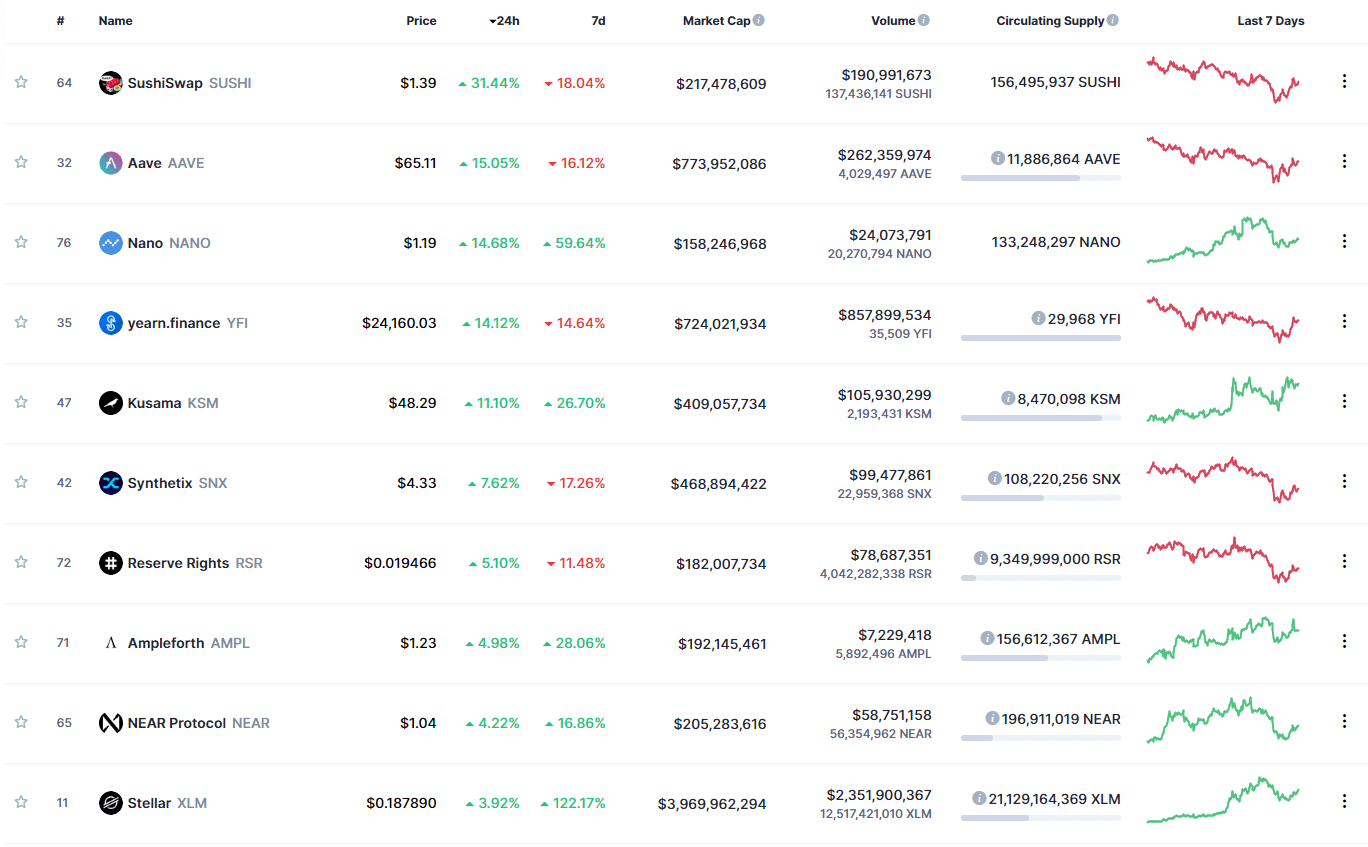
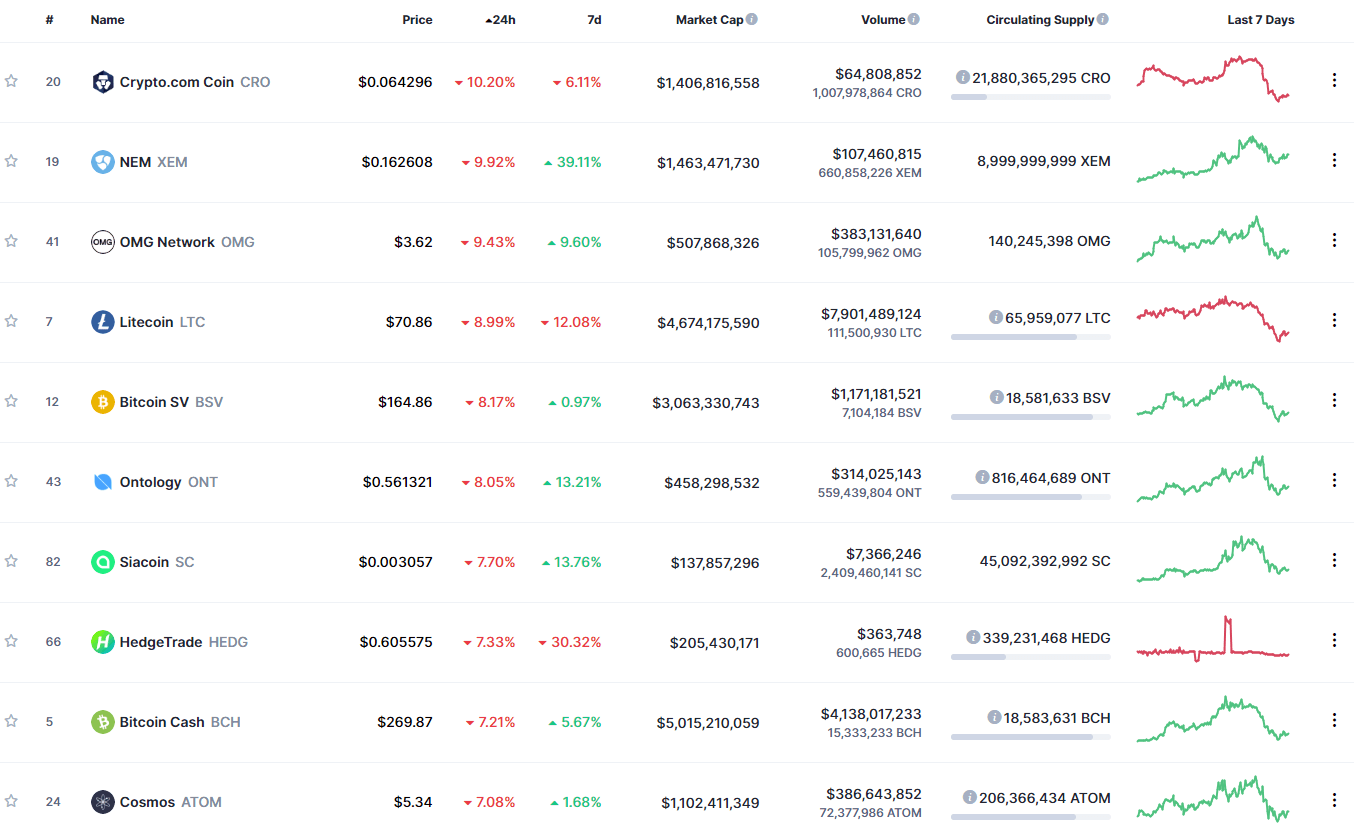
SushiSwap gained 34.83% in the past 24 hours, making it the most prominent daily gainer in the top100. It is closely followed by Kusama’s gain of 10.74% and Ampleforth’s 9.05% gain. On the other hand, HedgeTrade lost 10.21%, making it the most prominent daily loser. It is followed by Horizen’s loss of 9.44% and Ethereum Classic’s loss of 8.77%.

Top 10 24-hour Performers (Click to enlarge)

Bottom 10 24-hour Performers (Click to enlarge)

Bitcoin’s market dominance has decreased slightly since we last reported, with its value currently staying at 62.3%. This value represents a 0.1% difference to the downside when compared to yesterday’s value.

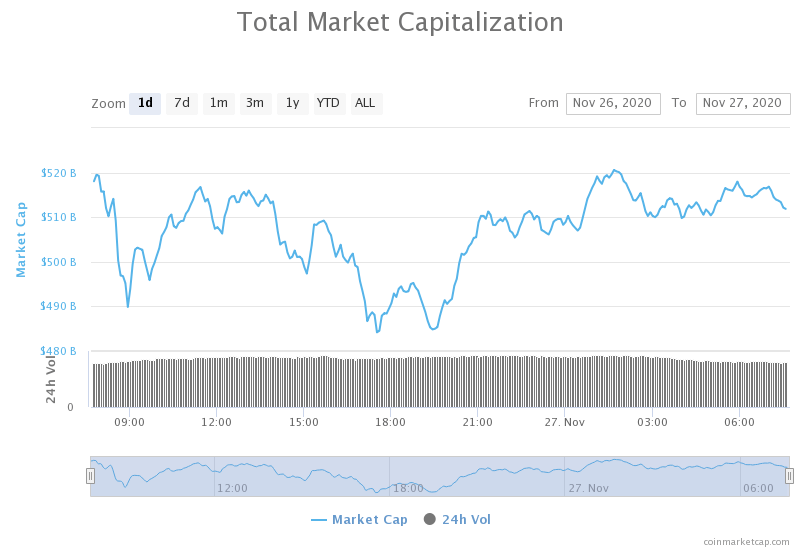
Daily Crypto Market Cap Chart

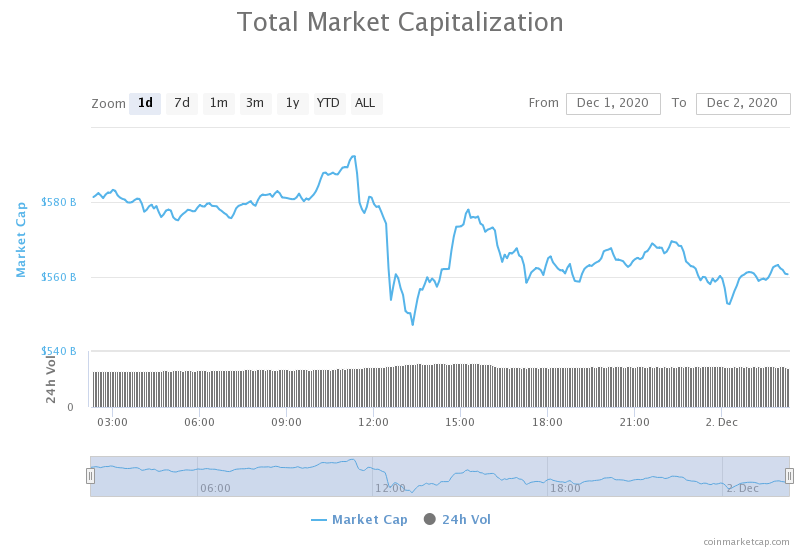
The crypto sector capitalization has decreased significantly in the past 24 hours. Its current value is $560.78 billion, representing a $17.09 billion increase compared to our previous report.

_______________________________________________________________________

What happened in the past 24 hours?

_______________________________________________________________________

_______________________________________________________________________

Technical analysis

_______________________________________________________________________

Bitcoin

Bitcoin has spent the day pulling back from its all-time highs and towards the $18,500 level. Its price formed a triangle formation on the 30-minute time-frame right after the price dump (which happened at the exact moment ETH 2.0 Phase 0 launched, as people were selling the news) and then broke it to the downside. Its price is now fighting for the $18,790 level (78.6% Fib retracement).

Bitcoin is quite volatile and unpredictable at the moment, but short trades in either direction could be viable. Traders should pay attention to volume and watch smaller time-frames and catch formations to trade off of them.

BTC/USD 30-minute chart

Bitcoin’s technicals on all time-frames are slightly tilted towards the buy-side. However, they show slight neutrality signs, except for the monthly overview, which is completely bullish.

BTC/USD 1-day Technicals

Technical factors (4-hour Chart):
  • Price is far above its 50-period EMA and at its 21-period EMA
  • Price is at its middle Bollinger band
  • RSI is near the overbought territory (52.95)
  • Volume is average
Key levels to the upside          Key levels to the downside

1: $19,000                                 1: $18,790

2: $19,500                                 2: $18,500

3: $19,666                                  3: $18,240

Ethereum

Ethereum has, just like Bitcoin, pulled back as traders sold the news of ETH 2.0 Phase 0 launching. While its move wasn’t as pronounced, the second-largest cryptocurrency by market cap did lose quite a bit of value, as well as most likely confirmed its position below $600. The double top formation was confirmed, which added to the decisiveness of the drop.

Ethereum traders should pay close attention to Bitcoin’s movement, as it currently dictates the market direction regardless of what news moves the market (news on Bitcoin or any other altcoin).

ETH/USD 4-hour Chart

Ethereum’s daily and monthly technicals are completely bullish and show no signs of neutrality. However, its 4-hour and weekly time-frames’ sentiment is bullish but shows some neutrality.

ETH/USD 1-day Technicals

Technical Factors (4-hour Chart):
  • The price is far above its 50-period and at its 21-period EMA
  • Price is at its middle Bollinger band
  • RSI is near being overbought (55.86)
  • Volume is average
Key levels to the upside          Key levels to the downside

1: $600                                     1: $510

2: $630                                     2: $500 

3: $735                                      3: $490

Ripple

The fourth-largest cryptocurrency by market cap had a pretty slow day, with its price hovering slightly above the $0.6 mark. Its price did feel the push towards the downside that the whole crypto sector experienced, but to a much lesser extent. XRP has found support at its 4-hour 50-period moving average, above which it is currently trading.

Trading XRP is almost certainly an inferior option to trading Bitcoin and Ethereum at the moment, as both the volume and volatility are low.

XRP/USD 4-hour Chart

XRP’s daily and monthly technicals are completely bullish and show no signs of neutrality. However, its 4-hour and weekly time-frames’ sentiment is bullish but shows some neutrality.

XRP/USD 1-day Technicals

Technical factors (4-hour Chart):
  • The price is slightly above its 50-period EMA and slightly below its 21-period EMA
  • Price is slightly below its middle Bollinger band
  • RSI is neutral (49.86)
  • Volume is below average
Key levels to the upside          Key levels to the downside

1: $0.666                                   1: $0.625

2: $0.78                                     2: $0.596

3: $0.79                                   3: $0.535


Categories
Forex Market Analysis

Daily F.X. Analysis, December 02 – Top Trade Setups In Forex – Advance NFP in Focus!

On Wednesday, the eyes will remain on the Fed Chair Powell Testifies, ADP Non-Farm Employment Change and Unemployment Rate from the Eurozone. A primary focus will remain on the ADP Non-Farm Employment Change as this will help investors determine the odds of actual NFP data, which is due on Friday.

Economic Events to Watch Today  


EUR/USD – Daily Analysis

The EUR/USD closed at 1.20715 after placing a high of 1.20764 and a low of 1.19243. The EUR/USD surged above 1.2000 level and reached 1.20764 level, the highest level since May 2018 amid the optimism surrounding the coronavirus vaccine and broad-based U.S. dollar weakness.

Many factors were involved in the breakout of the EUR/USD pair on Tuesday above the 1.2000 level, including the latest optimism because of vaccine hopes, monetary stimulus from both sides, and the political certainty for a change. 

Pfizer and BioNtech were the first to report a high efficacy of 95% in a phase-3 coronavirus immunization trial on November 09. After that, many drug companies, including Moderna, AstraZeneca, Novavax, and Oxford University, also followed them. Pfizer and Moderna have already applied for emergency use authorization from the US FDA, and soon after getting the approval, these vaccines will be available for usage. Even Pfizer has sent its first mass shipment of vaccine to Chicago on Monday. All this vaccine optimism pushed the safe-haven U.S. dollar down and raised the risk sentiment in the market that supported the upward momentum of the EUR/USD pair on Tuesday.

On the stimulus front, the European Central Bank and the U.S. Federal Reserve were set to expand their bond-buying schemes. Since the pandemic has started, the stimulus aid from ECB has supported the Eurozone’s economy by allowing governments to spend more. In the United States, the Federal Reserve’s dollar printing triggered a broad risk-on mood that also helped the riskier assets like EUR/USD pair to rise. 

On the Political certainty front, the U.S. elections have declared a final winner- Joe Biden. While outgoing President Donald Trump has been continuously crying foul, his attempts to overturn the elections failed, and investors continued to price the Joe Biden victory and selling the U.S. dollar. Moreover, the nomination of Janet Yellen as Treasury Secretary was also reassuring.

On the E.U. front, the political development in the upcoming Brexit deal has entered a tunnel as an intense final round of talks is in progress, and the results of talks are yet to be declared. All these factors combined and supported the EUR/USD pair’s upward momentum on Tuesday.

On the data front, at 13:15 GMT, the Spanish manufacturing PMI for November declined to 49.8 against the forecasted 50.8 and weighed on Euro. At 13:45 GMT, the Italian Manufacturing PMI also dropped to 51.5 against the projected 52.0 and weighed on the single currency. At 13:50 GMT, the French Final Manufacturing PMI raised to 49.6 from the expected 49.1 and supported Euro. AT 13:55 GMT, the German Final Manufacturing PMI stayed the same at 57.8. The German Unemployment Change came in as -39K against the expected 9K and supported the single currency. At 14:00 GMT, the Final Manufacturing PMI from the Eurozone remained flat with the expected 53.8. At 15:00 GMT, the CPI Flash Estimate for the year dropped to -0.3% against the estimated -0.2% and weighed n Euro. The Core CPI Flash Estimate for the year came in line as expected 0.2%. 

On the U.S. front, at 20:00 GMT, the ISM Manufacturing PMI for November fell to 5.75 against the forecasted 5.9 and weighed on the U.S. dollar and supported the upward momentum of the EUR/USD pair. The Construction Spending for October surged to 1.3% against the estimated 0.8% and supported the U.S. dollar. The ISM Manufacturing Prices for November also surged to 65.4 against the forecasted 65.0 and helped the U.S. dollar. The Wards Total Vehicle Sales from the U.S. declined to 15.6M against the estimated 16.1M and weighed on the U.S. dollar that added further gains in EUR/USD pair.

Given the above manufacturing data, the Eurozone economy’s outlook looks somewhat better than the United States outlook that added extra pressure on the U.S. dollar and helped the EUR/USD pair to place highs above the 1.200 level on Tuesday.

Daily Technical Levels

Support   Resistance

1.1971       1.2122

1.1873       1.2175

1.1819       1.12273

Pivot point: 1.2024

EUR/USD– Trading Tip

The EUR/USD surged dramatically on the back of risk-on sentiment amid positive reports over the COVID19 vaccine, which dragged the pair higher above the 1.2074 level. On the higher side, the violation of the 1.2010 resistance level is now working as a support, and it can lead the pair further higher until 1..2160. The bullish bias remains dominant today, especially over the 1.2015 level. However, the EUR/USD pair has recently formed a tweezers top pattern around 1.2076, suggesting the odds of bearish retracement. In this case, the EUR/USD can also drop until the support level of 1.2017 that marks 23.6% Fibonacci retracement. Let’s keep an eye on the 1.2060 support level today. 


GBP/USD – Daily Analysis

The GBP/USD closed at 1.34224 after placing a high of 1.34424 and a low of 1.33149. After placing losses for three consecutive days, the GBP/USD pair rose on Tuesday and recorded gains on the back of broad-based U.S. dollar weakness and increased Brexit hopes. The GBP/USD pair hit the highs at 1.3400 level on Tuesday over the positive Brexit news after the Times Radio’s Chief Political Commentator Tom Newton Dunn tweeted the U.K. and E.U. trade deal talks have entered a mythical tunnel. Though either side formally confirmed or rejected the “tunnel” status of negotiations after his tweet. 

The tunnel refers to a state of intense negotiation that essentially ends up having some agreement between both parties, and before that, neither side leaves. Though it does not guarantee a deal will be made, it shows a strong willingness/commitment from both sides to work as hard as possible to get a compromise. After this tweet by Dunn, the GBP/USD pair started to gain traction and rise in the financial market due to increased demand for British Pound. 

On the other hand, the GBP/USD pair’s gains could also be attributed to the U.S. dollar’s weakness. The greenback was weak across the board after the release of poor macroeconomic data and the rising number of coronavirus cases in the U.S.

The top U.S. health officials announced plans on Tuesday to begin vaccinating Americans against the coronavirus as early as mid-December amid the increasing death from coronavirus. The nationwide deaths hit the highest number for a single day in six months in the U.S. and raised economic recovery fears that led to the U.S. dollar’s weakness and improved GBP/USD pair.

On the data front, at 20:00 GMT, the ISM Manufacturing PMI for November declined to 5.75 against the estimated 5.9 and weighed on the U.S. dollar and supported the bullish momentum of the GBP/USD pair. For October, the Construction Spending rose to 1.3% against the projected 0.8% and helped the U.S. dollar. The ISM Manufacturing Prices for November also raised to 65.4 against the estimated 65.0 and supported the U.S. dollar. The Wards Total Vehicle Sales from the U.S. fell to 15.6M against the anticipated 16.1M and weighed on the U.S. dollar that added further gains in GBP/USD pair.

On Britain front, at 12:00 GMT, the Nationwide HPI for November raised to 0.9% against the forecasted 0.2% and supported the British Pound that added further gains in GBP/USD pair on Tuesday. At 14:30 GMT, the Final Manufacturing PMI also raised to 55.6 against the expected 55.2 and supported the British Pound that added further gains in GBP/USD pair.

Daily Technical Levels

Support   Resistance

1.3316       1.3342

1.3301       1.3353

1.3290       1.3368

Pivot point: 1.3327

GBP/USD– Trading Tip

The GBP/USD is trading sideways, having violated the narrow trading range of 1.3397 – 1.3304. The market is expected to display choppy sessions with a new limited range of 1.3397 to 1.3452 level. The violation of a triple top resistance level of 1.3397 level is now working as a support, and it may trigger a bounce off in the Cable until 1.3452 and 1.3512 level. Let’s keep an eye on the 1.3397 level to stay bullish above this level today. 


USD/JPY – Daily Analysis

The USD/JPY pair was closed at 104.305 after placing a high of 104.576 and a low of 104.180. The USD/JPY pair stayed on a bullish track on Tuesday despite the broad-based U.S. dollar weakness due to increased risk flow in the market. The stock markets have been buoyed by the news that the first coronavirus vaccine could be administered by the end of the year. Despite the acceleration of the pandemic in the U.S. and many other parts of the world, the riskier assets gained on the back of improved risk sentiment due to vaccine hopes. The U.S. Dollar Index (DXY) that measures the U.S. dollar value against the six currencies basket fell to 92 levels on Tuesday.

The pair rose above 104.5 level on Tuesday amid the broad-based risk sentiment in the market over the optimism surrounding the vaccine hopes. However, the gains in USD.JPY pair started to fade away in the late trading session after the US ISM Manufacturing PMI release for November. In November, the declining manufacturing activity was the proof of halted manufacturing activity due to the rising number of restrictive measures in many states of America due to escalated second wave of coronavirus.

At 04:30 GMT, the Unemployment Rate from Japan for October remained flat with the expectations of 3.1%. At 04:50 GMT, the Capital Spending for the quarter from Japan came in as -10.6% against the expected -12.0% and supported the Japanese Yen that limited the USD/JPY pair’s gains. AT 05:30 GMT, the Final Manufacturing PMI from Japan also raised to 49.0 against the expected 48.3 and supported the Japanese Yen that capped further gains in the USD/JPY pair.

On the U.S. dollar front, at 20:00 GMT, the ISM Manufacturing PMI for November fell to 5.75 against the projected 5.9 and weighed on the U.S. dollar that capped further gains in the USD/JPY pair. For October, the Construction Spending surged to 1.3% against the estimated 0.8% and supported the U.S. dollar and added gains in the USD/JPY pair. The ISM Manufacturing Prices for November also rose to 65.4 against the expected 65.0 and helped the U.S. dollar that added additional gains in the USD/JPY pair. The Wards Total Vehicle Sales from the U.S. dropped to 15.6M against the expected 16.1M and weighed on the U.S. dollar that capped further gains in the USD/JPY pair.

Meanwhile, the U.S. death rate because of the COVID-19 virus has also increased to an alarming level as it posted the highest number for a single day in six months. The Top U.S. health official announced plans on Tuesday to begin vaccinating Americans against the coronavirus as early as mid-December. This statement also raised the risk sentiment and added weight on the Japanese Yen that supported the USD/JPY pair’s upward momentum on Tuesday.

Furthermore, On Tuesday, Federal Reserve Chairman Jerome Powell said that the United States economy’s outlook was extraordinarily uncertain due to increased numbers of coronavirus cases that have affected the U.S. economy hardly. 

In his testimony to the U.S. Senate Committee on Banking, Housing and Urban Affairs, Powell said that the increasing number of COVID-19 cases in the U.S. and abroad were concerning. He said that until the people were confident about re-engaging the economic activities confidently, full economic recovery was impossible. At the same time, Powell was upbeat over the recent optimistic news on vaccine development worldwide.

Meanwhile, several programs set by the Federal Reserve in March are near to end of the year. In response to this, Powell stated that these programs would help unlock almost $2 trillion funding. After this report, the USD/JPY pair started losing its early daily gains as the greenback became weak across the board due to rising hopes for stimulus measure.

Furthermore, On Tuesday, the outgoing Treasury Secretary Steven Mnuchin also testified before the Senate and urged lawmakers to pass a second stimulus bill quickly. This also added in the U.S. dollar weakness and capped further gains in the USD/JPY pair on Tuesday.

Daily Technical Levels

Support   Resistance

104.03       104.16

103.97       104.23

103.91       104.29

Pivot point: 104.10

USD/JPY – Trading Tips

The USD/JPY is trading with a sideways trading range of 104.600 – 104.200, holding below an immediate resistance level of 104.600. On the lower side, the safe-haven currency pair may find support at the 103.719 level. The pair seems to disrupt the resistance level of 104.600, and if this happens, the USD/JPY may soar until the next resistance area of 105.030 level. The MACD and RSI support the buying trend, but we should only take buying positions over the 104.600 level today. Good luck!
Categories
Forex Elliott Wave Forex Market Analysis

EURJPY Advances Toward Key Supply Zone

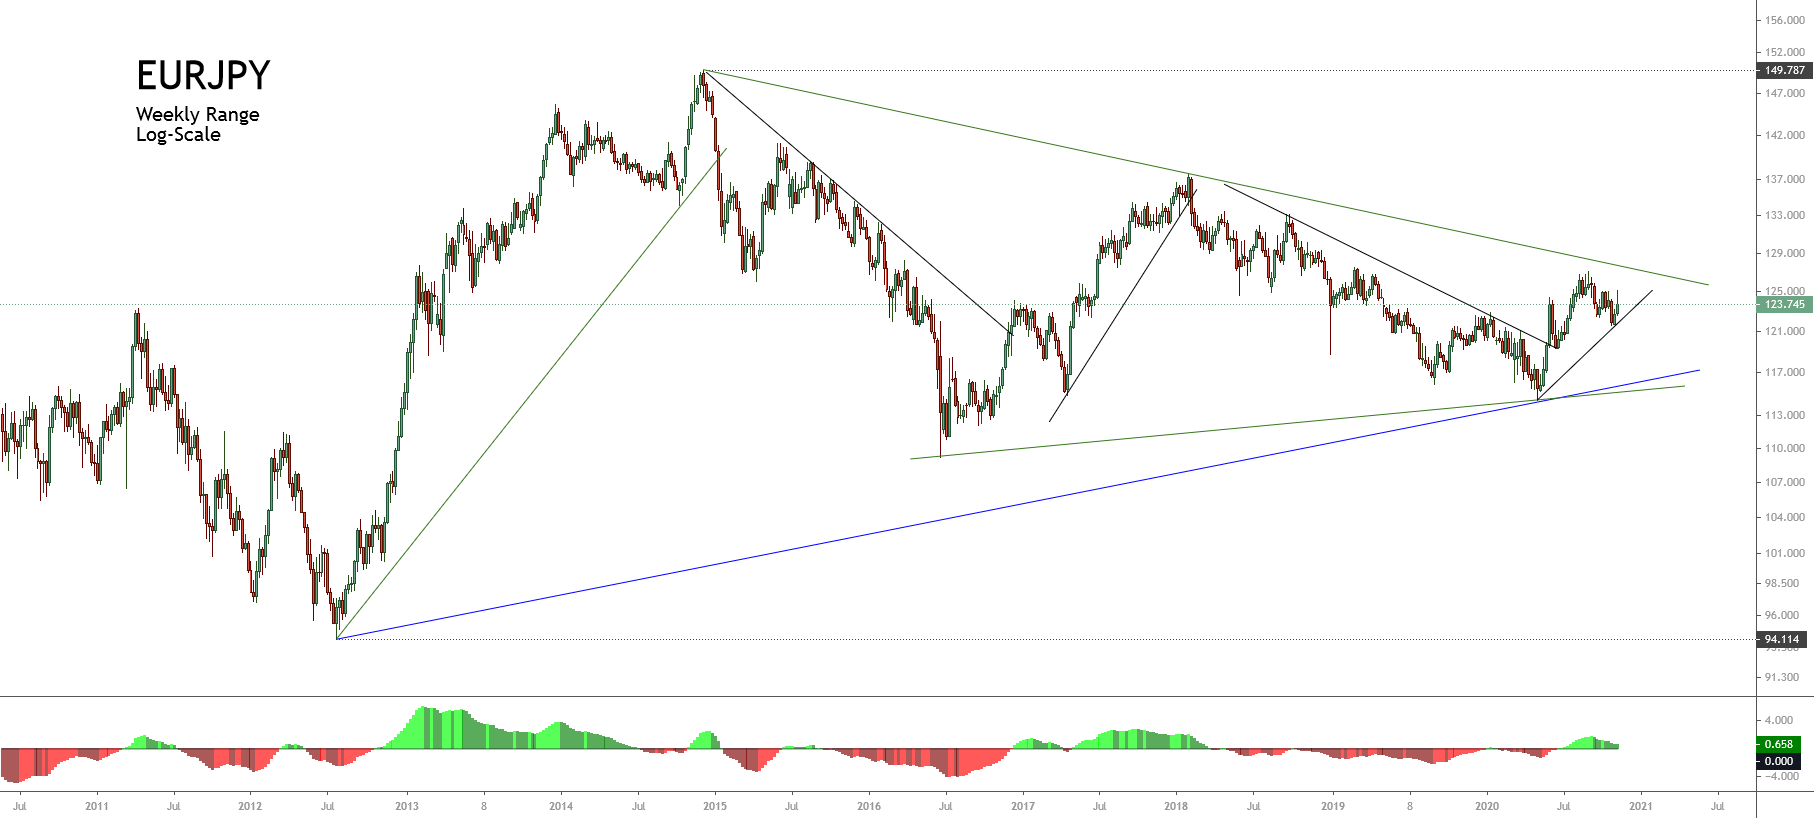
In our latest EURJPY analysis, we commented on its advance in an incomplete corrective structure identified as a triangle pattern, which remains in development since mid-2014.

Technical Overview

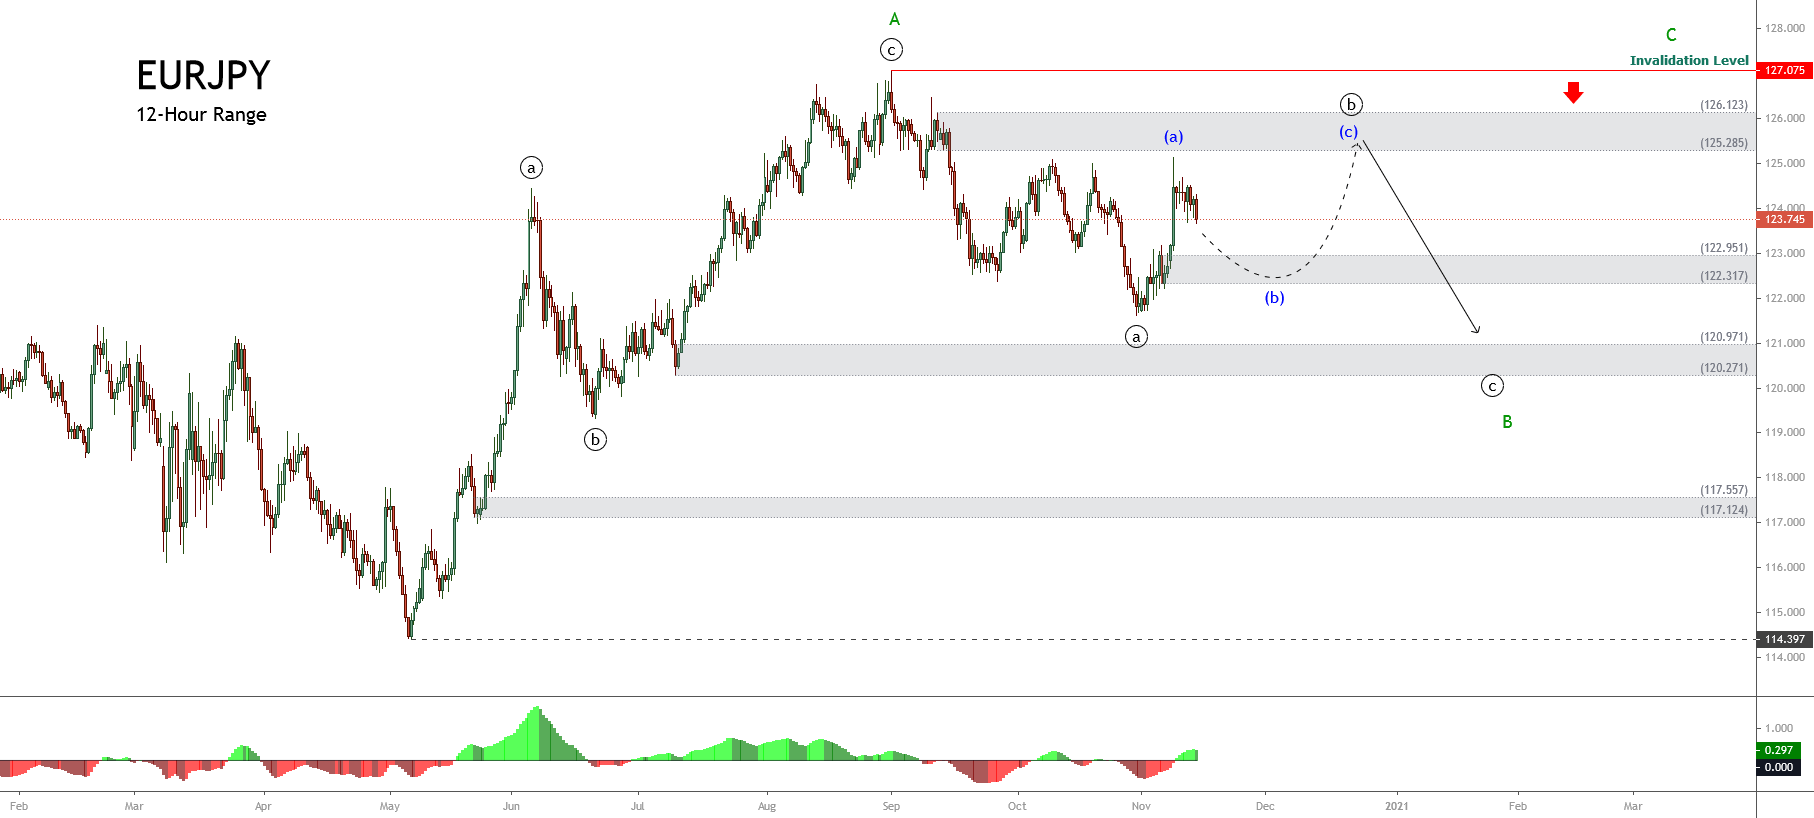
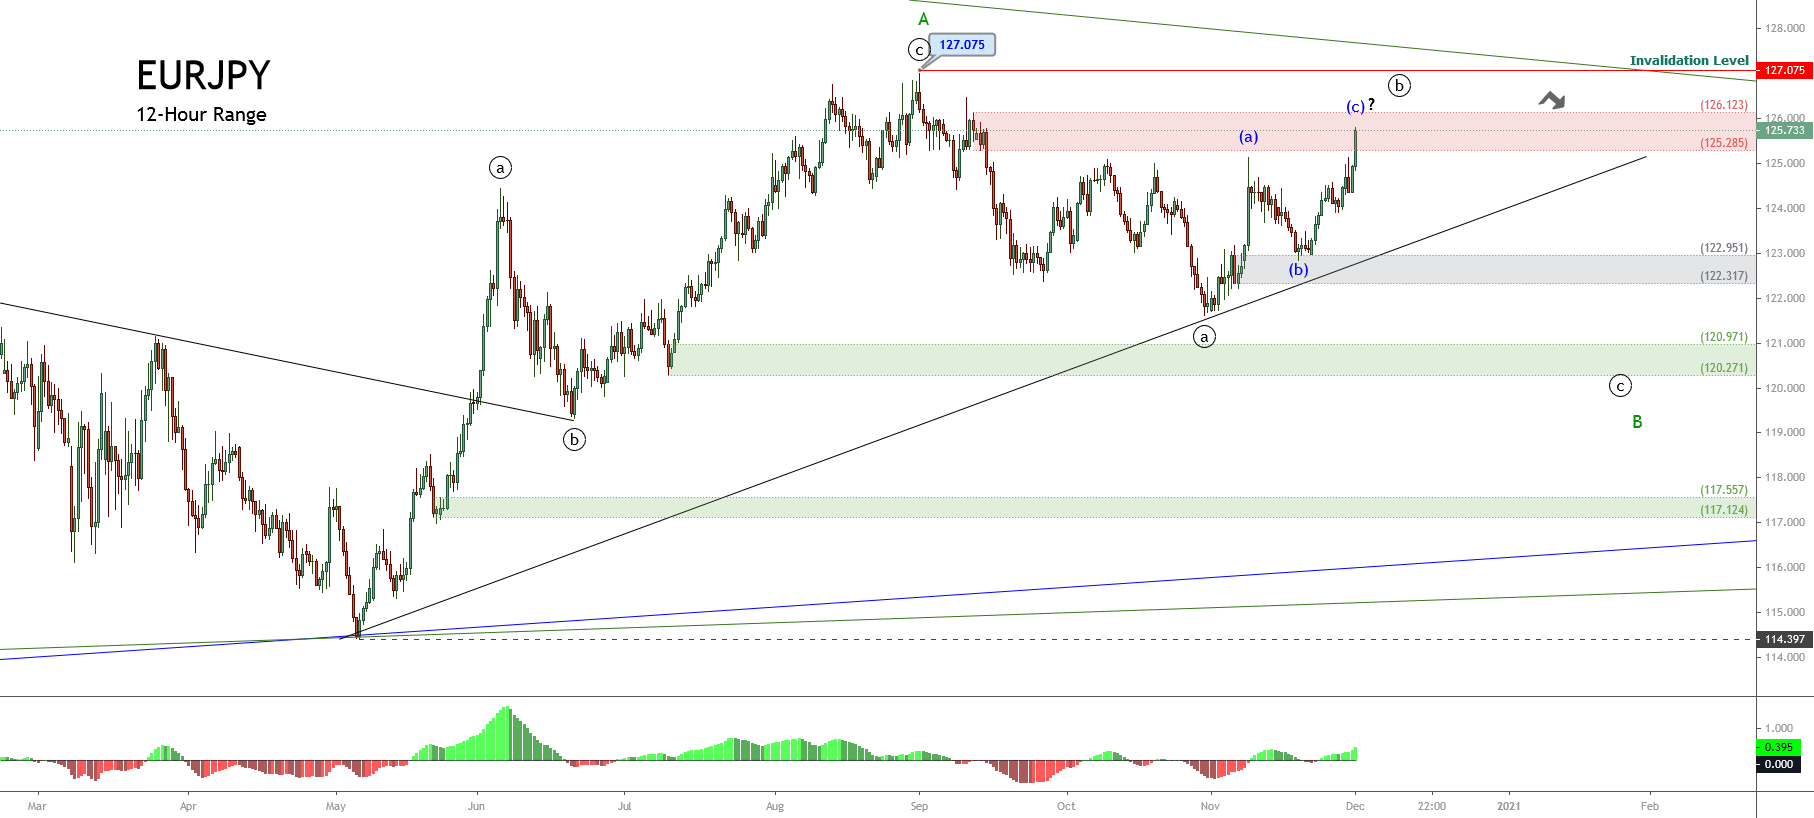
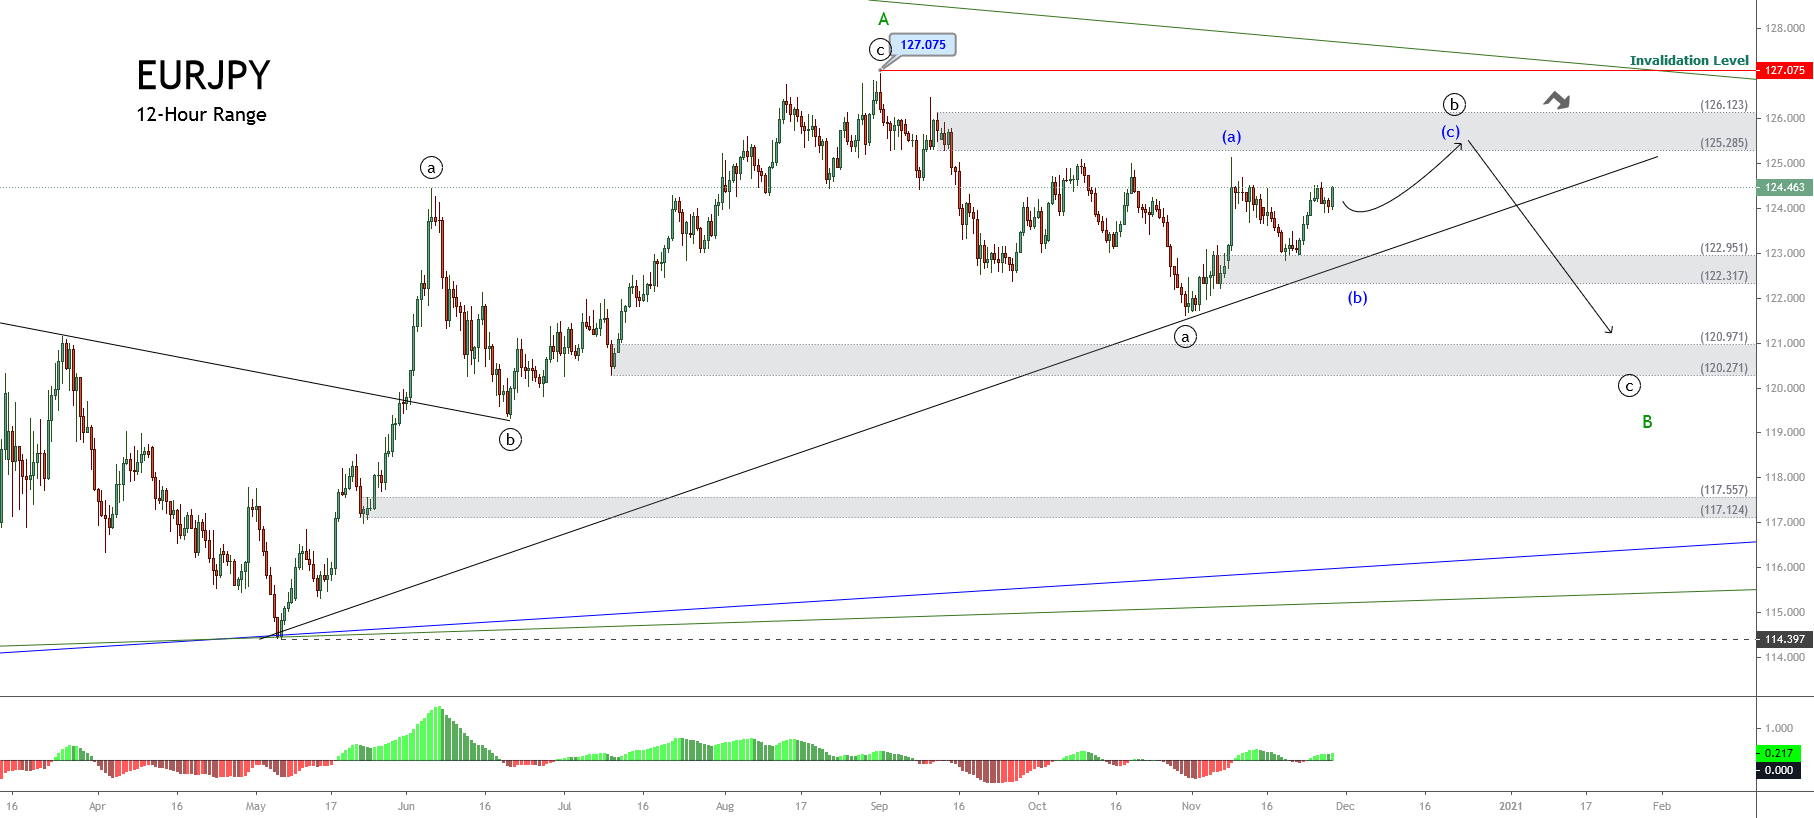
Also, we saw that the mid-term trend looks like an incomplete corrective structure, which seems to advance in a wave B of Minor degree, labeled in green. Moreover, the structure observed previously unveiled the progress in an incomplete wave ((b)), identified in black, which should develop a bounce toward the supply zone between 125.285 and 126.123.

The price action is currently seen advancing in its wave (c) of Minuette degree, labeled in blue, which has now reached the supply zone between 125.285 and 126.123 forecasted in our previous analysis.

On the other hand, the current wave (c), in blue, that remains in development could extend its gains toward the psychological barrier of 126, where the cross could start to decline to the wave ((c)), in black. This bearish sequence, possibly developed with five internal segments, should complete the wave B of Minor degree, in green.

Short- term Technical Outlook

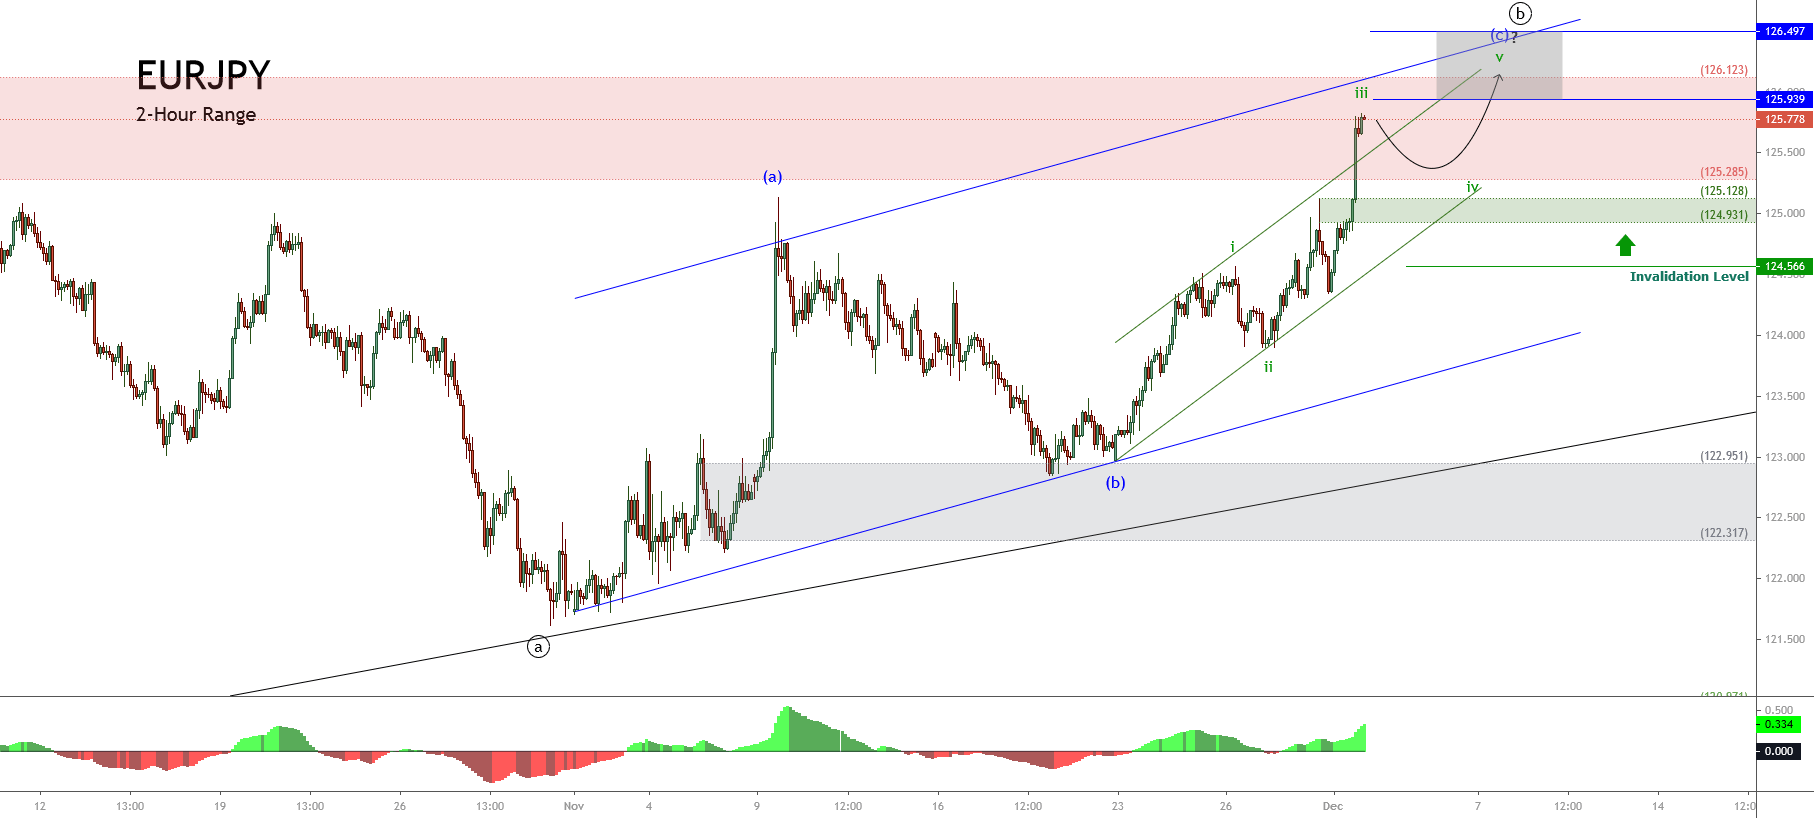
The EURJPY in its 2-hour chart reveals the internal structure created by the wave (c), in blue, which shows the intraday ascending channel plotted in green. The price action that has surpassed the ascending channel’s upper line suggests the rise of the third wave of Subminuette degree labeled in green that is in progress.

In this context, according to the Elliott Wave theory, once the EURJPY completes the advance of the third wave, in green, the cross should experience a limited decline corresponding to the fourth wave in green. This drop could reach the demand zone between 124.931 and 125.128, where the price could find fresh buyers expecting the price to head toward new highs.

The fifth wave’s potential target zone, in green, is located between 125.939 and 126.497. In this area, the cross could complete the wave ((b)) of Minute degree in black. 

Finally, the invalidation level of this intraday bullish scenario is found at 124.566, which corresponds to the top of the first wave of Minute degree.

Categories
Forex Videos

EUR/USD This Week’s Forecast!


Where next for the EURUSD pair?

Thank you for joining this forex academy educational video.

In this session, we will be looking at the EURUSD pair.

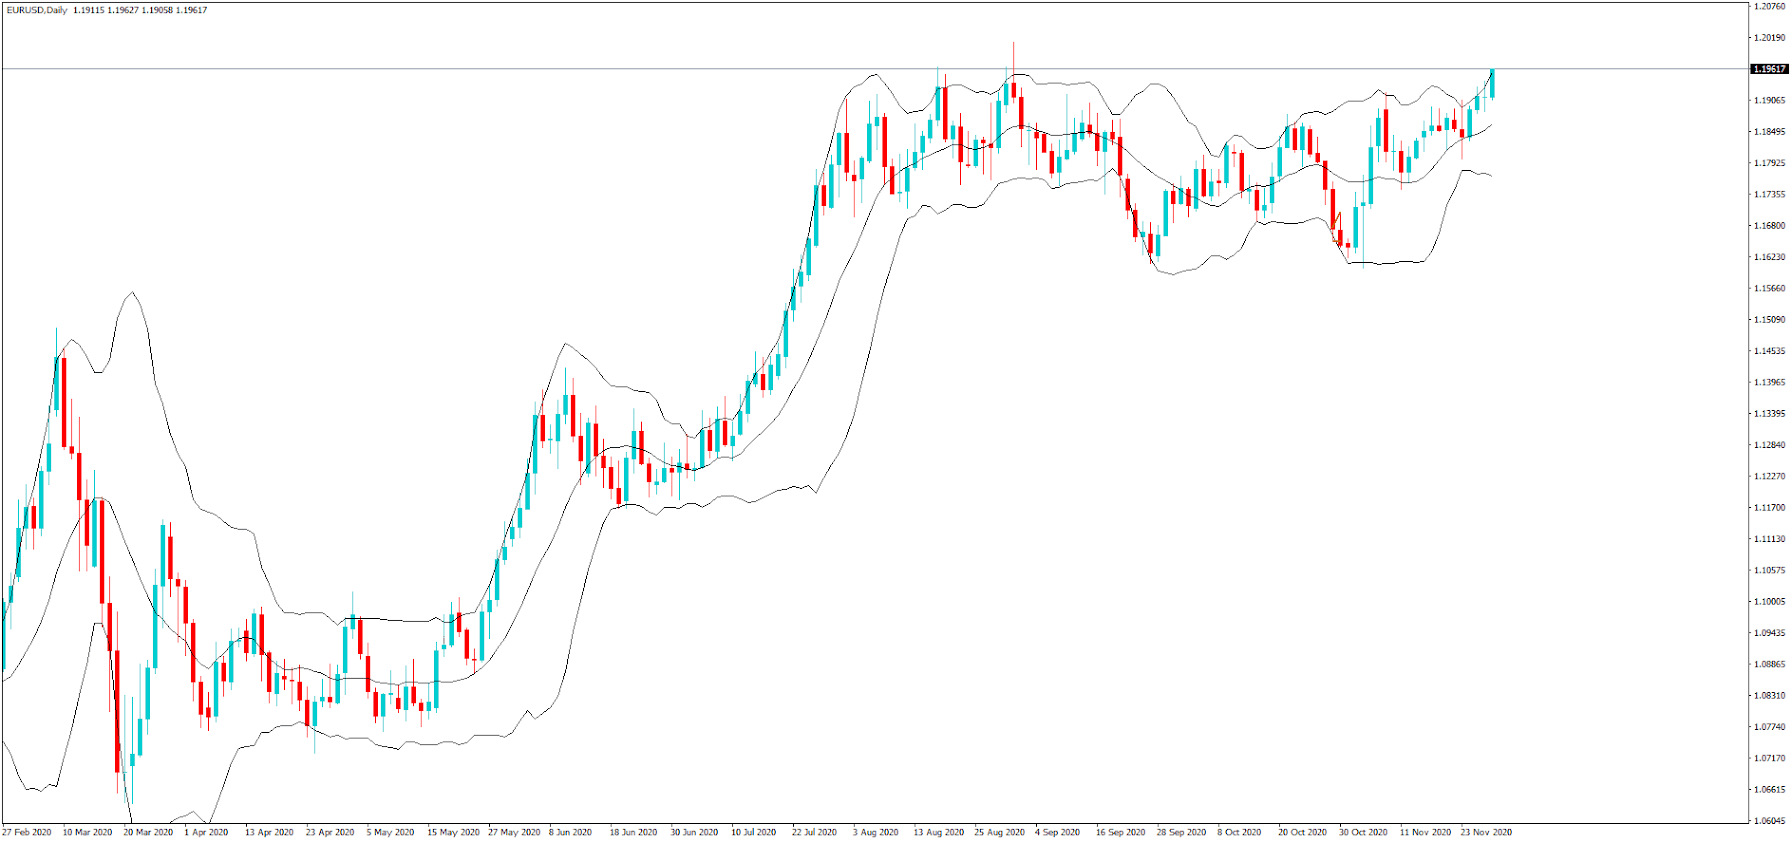
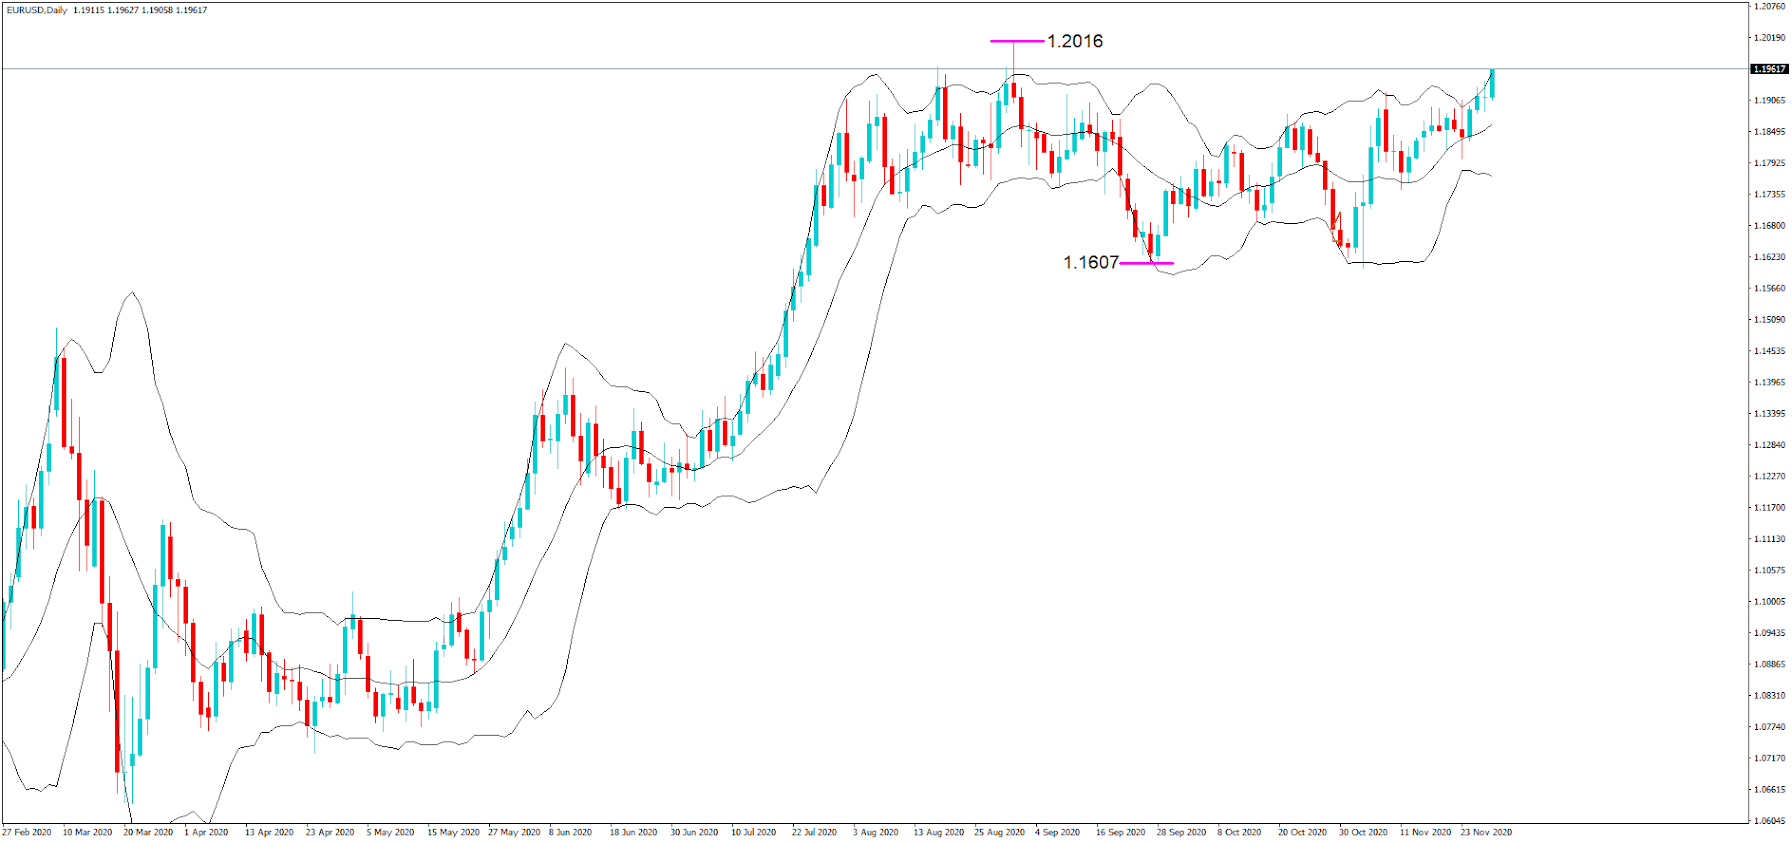
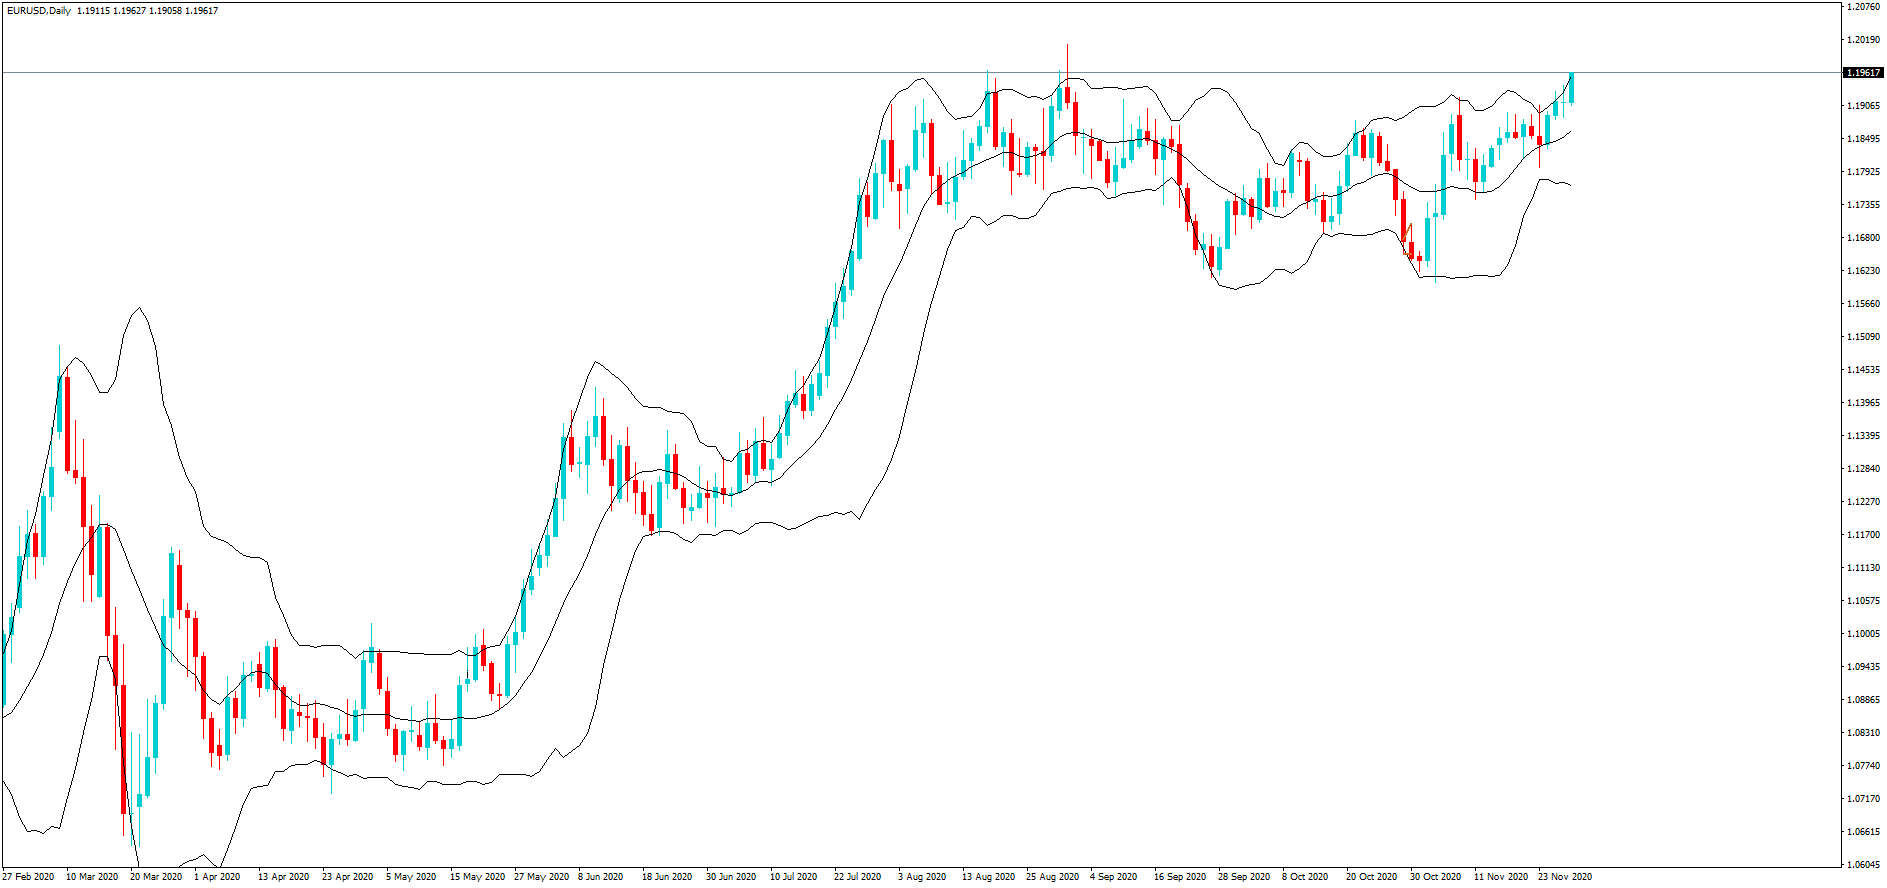
This is a daily chart for the pair, which shows that the bulls are in control and pushing the pair up to the key 1.20 level from the current 1.1961 at the time of writing.

 This week’s broad dollar weakness has pushed the dollar index under the key 92.00 level, has certainly helped to give the euro a lift.  However, while publicly declaring a neutral stance on the strength of the euro, the ECB will no doubt privately be hoping for or a decline, simply for export reasons while the Euro area is still in the grips of the pandemic, and where the recovery path is muted.

Some analysts believe that the current level of ECB monetary easing policy is discounted in the pair’s exchange rate and believe that leveraged investors are reluctant to continue long positions from these highs……  

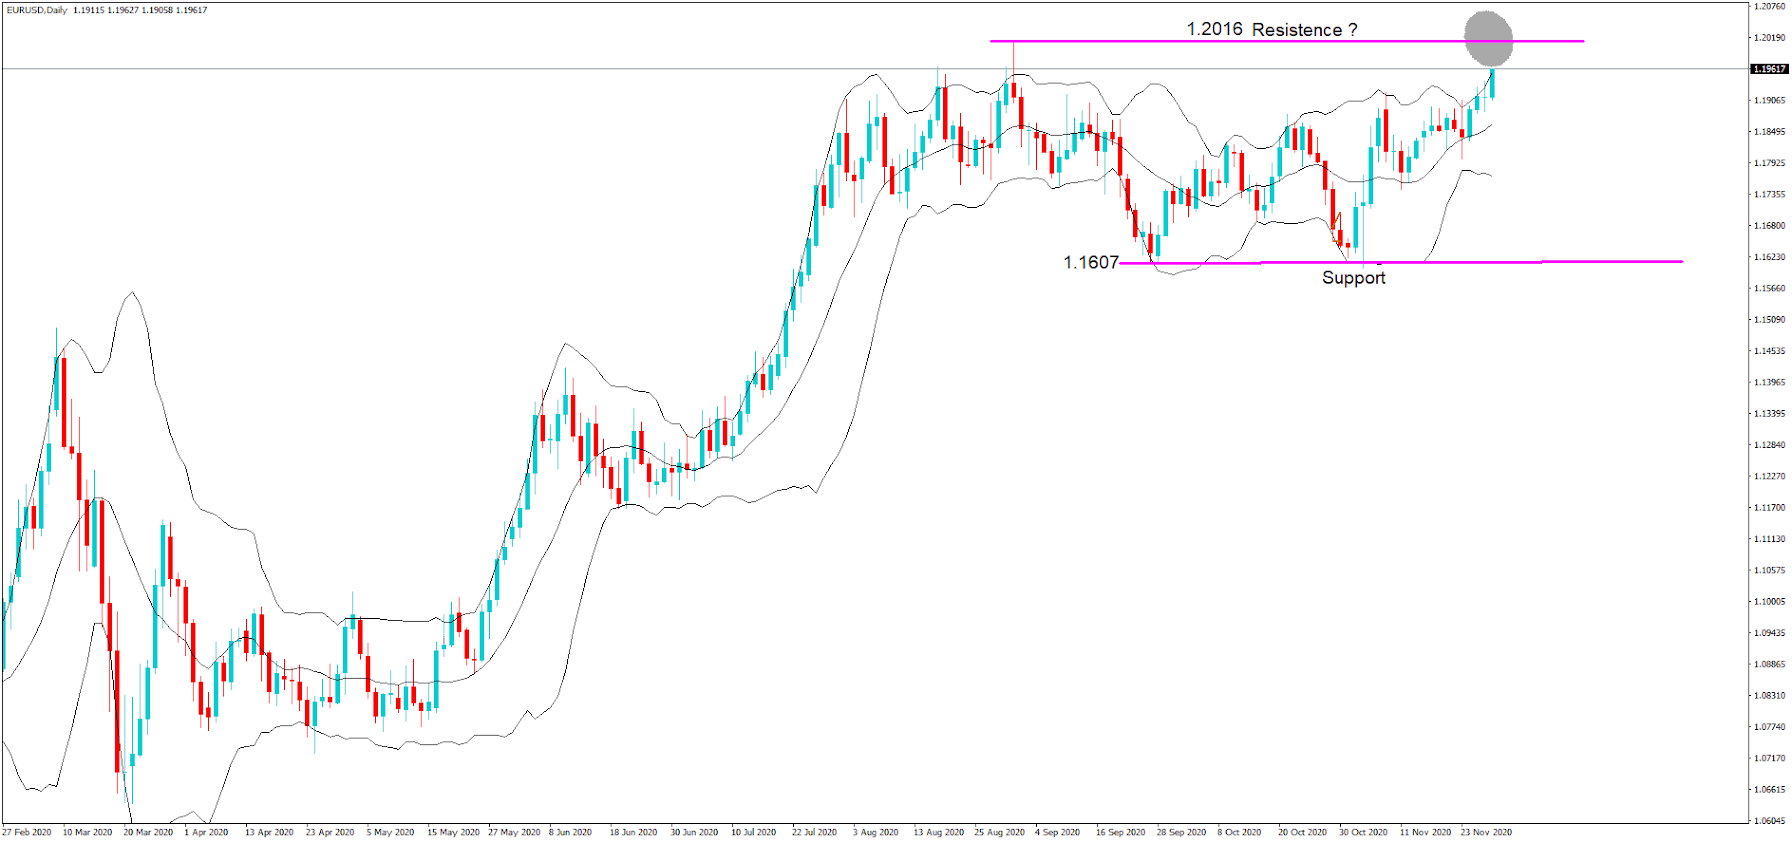
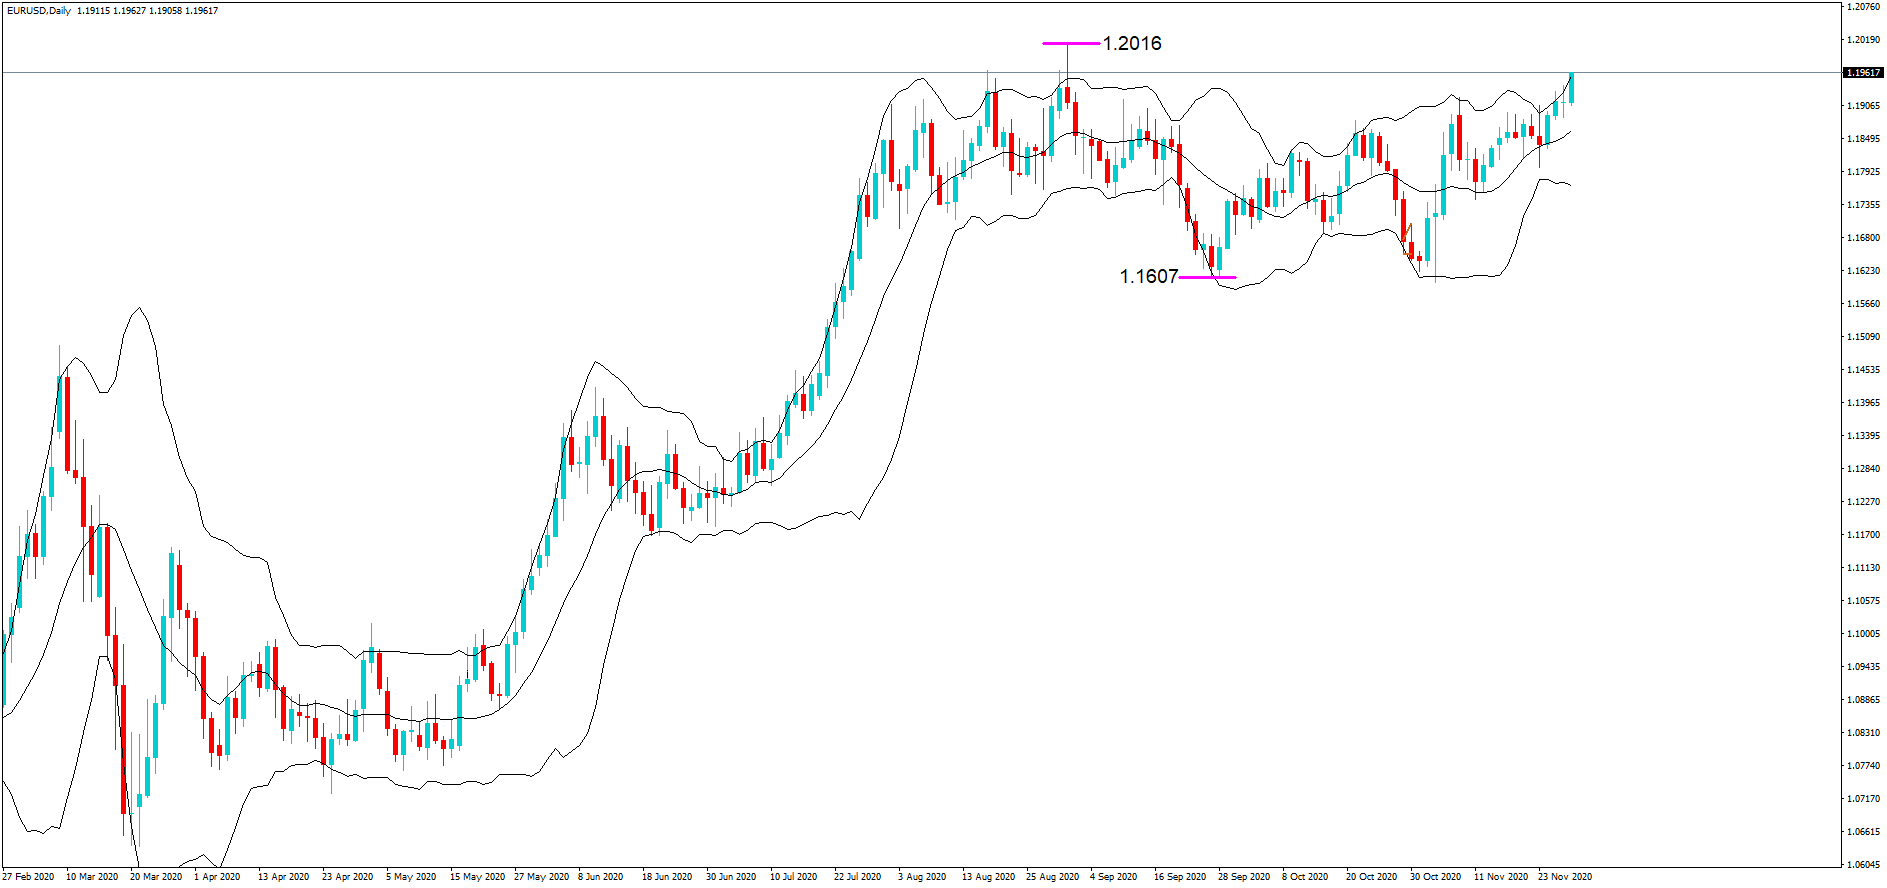
….and where the market saw a distinct pullback from the 1.2016 level to 1.1607 at the beginning of August 2020. Certainly, If the big guns stop buying because of these reasons, price action will stall at the key 1.2000 level for a second time, and a reversal would follow

Other fundamental risks include a new US president in the waiting and whereby President Biden’s post-inauguration monetary policies will directly affect the markets and especially US stock markets and the value of the dollar, whose decline has helped lift the Euro in recent months and where the Covid relief financial stimulus package has been a long time in coming.

Also is the conundrum of the ongoing Brexit free trade agreement negotiations between the EU and UK. A failure to reach an agreement in what is seen as the eleventh-hour talks, before the end of the transition period on the 31st of December, would mean increased tariffs between the EU and UK where the EU exports than it imports, and which would be potentially harmful for the ailing EU economy.  This would affect the value of the euro negatively.

Now let’s look at the technical risks.

The daily chart clearly shows a support line at the key 1.1600 area, and we are very close two a retest of the key 1.200 line to the upside. Should that happen, we will have had two attempts at a support line and two attempts at a resistance line, which will give us a confirmed sideways range for the pair. The risk for bulls is a potential double top formation, with its danger of a reversal.  The previous 300 pip, reversal as shown, must be a warning sign for buyers.

The next test would be price action moving above the 1.20 line, pulling back to it, and finding support there, potentially leading to a higher continuation.

Traders should look to use the 1 and 4-hour charts to gain an intraday perspective of what is happening around this key 1.2000 level, to ascertain if it will become an area of support or resistance while factoring in the very risky fundamental reasons as previously alluded to.

Categories
Forex Signals

EUR/JPY Bullish Engulfing Signals Further Buying – Quick Signal Update!

During Tuesday’s early European trading session, the EUR/JPY currency pair managed to extend its overnight bullish streak and drew some further bids around closer to the 125.00 level mainly due to the market risk-on mood, which tends to undermine the safe-haven Japanese yen and contributes to the currency pair gains. Hence, the market trading sentiment was being supported by the prospects of a COVID-19 vaccine.

Across the pond, the shared currency upticks also played a significant role in underpinning the currency pair. On the contrary, the long-lasting coronavirus woes in the U.S. and Europe keep challenging the upbeat market sentiment, which becomes the key factor that kept the lid on any additional gains in the currency pair.

On the contrary, the intensifying coronavirus woes across the globe and intensifying lockdowns restrictions in Europe and the U.S. keep challenging the upbeat market performance and become the key factor that kept the lid on any additional gains in the currency pair.

In the absence of the key data/events on the day, the market traders will keep their eyes on US ISM Manufacturing PMI for November and original comments from the Fed Chair’s Testimony for fresh impetus. In addition to this, the updates about the U.S. stimulus package will also be key to watch. In the meantime, the risk catalyst like geopolitics and the virus woes, not to forget the Brexit, will not lose their importance.


Daily Support and Resistance
S1 122.99
S2 123.8
S3 124.11
Pivot Point 124.62
R1 124.93
R2 125.44
R3 126.25

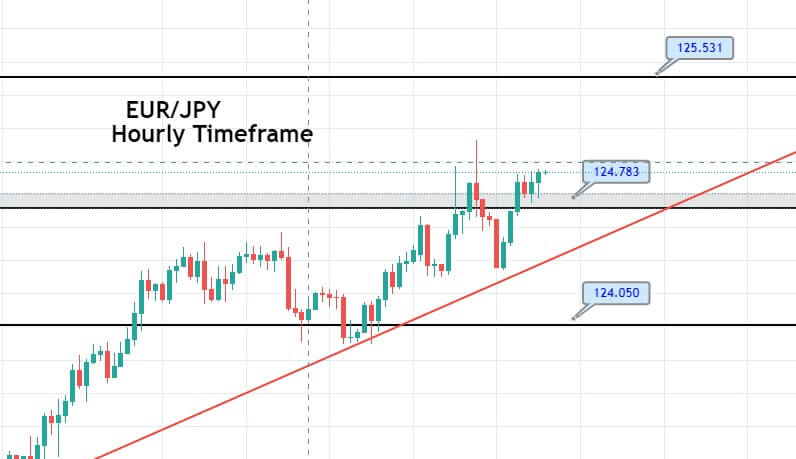
The EUR/JPY has violated the resistance level of 124.780, and above this, the pair has the potential to go after the 125.530 level. However, if the EUR/JPY pair fails to stay over 124.750 support, the odds of bearish reversal will also remain solid. The leading indicator, such as MACD is supporting the buying trend. Checkout a trade setup below.

Entry Price – Buy 124.898

Stop Loss – 124.498

Take Profit – 125.298

Risk to Reward – 1:1

Profit & Loss Per Standard Lot = -$400/ +$400

Profit & Loss Per Micro Lot = -$40/ +$40

Fellas, now you can check out forex trading signals via Forex Academy mobile app. Follow the links below.

iPhone Users: https://apps.apple.com/es/app/fasignals/id1521281368

Andriod Users: https://play.google.com/store/apps/details?id=academy.forex.thesignal&hl=en_US

Categories
Forex Market Analysis

Daily F.X. Analysis, December 01 – Top Trade Setups In Forex – Manufacturing PMI Figures in Highlights!

Eyes will remain on the series of Manufacturing PMI figures from the Eurozone, UK, Canada, and the U.S. Although it is a low impact event, it may help determine the market sentiment today. The U.S. Fed Chair Powell will be in highlight as he is due to testify on the CARES Act before the Committee on Banking, Housing, and Urban Affairs, in Washington DC. Lastly, the ECB President Lagarde is also due to speak at an online event hosted by the Atlantic Council; however, it is now expected to significantly influence the Euro.

Economic Events to Watch Today  


EUR/USD – Daily Analysis

The EUR/USD closed at 1.19547 after placing a high of 1.20030 and a low of 1.19235. The currency pair EUR/USD surpassed the 1.20000 level on Monday amid the rising risk sentiment in the market and decreasing U.S. dollar; however, the pair started to lose its gains and ended up posting losses for the day.

The EUR/USD pair continued its bullish movement in the early trading session on Monday as the risk sentiment improved with more positive news from the coronavirus vaccine side. Pfizer has sent the first mass shipment of its vaccine to Chicago on Monday. Whereas, Moderna has applied for emergency use authorization of its vaccine from the US FDA on Monday. Both these latest reports from the vaccine side added further strength in the risk sentiment as it showed progress in steps that would eventually lead to global economic recovery.
The improved risk sentiment because of optimism regarding vaccine and economic recovery gave strength to riskier assets like EUR/USD pair on Monday.

Meanwhile, the U.S. dollar’s weakness also played an essential role in raising the currency pair EUR/USD above the 1.2000 level. The U.S. dollar was weak across the board due to the latest announcement that Congress has started its brief session to pass the next stimulus package for coronavirus.

Furthermore, both sides’ macroeconomic data were also in favor of pushing the currency pair EUR/USD near its mid-August high level on Monday. From the European Union side, The German Prelim CPI for November came in as -0.8% against the forecasted -0.7% and weighed on the single currency Euro. At 13:00 GMT, Spanish Flash CPI for the year came in as -0.8% against the forecasted -0.9% and supported Euro. At 15:00 GMT, the Italian Prelim CPI for November came in as -0.1%against the forecasted -0.2% and supported the single currency Euro.

On the U.S. dollar front, At 19:45 GMT, the Chicago PMI for November dropped to 58.2 against the anticipated 59.4 and weighed on the U.S. dollar. At 20:00 GMT, the Pending Home Sales for October fell to -1.1% against the estimated 1.1% and weighed on the U.S. dollar. However, the gains in the EUR/USD pair failed to remain till the end of the trading day and started to reverse in late trading hours amid the concerns of coronavirus pandemic in Europe. The outlook for the largest economy in the Eurozone, Germany, became increasingly uncertain due to the rising number of coronavirus cases surpassed above 1 Million.

Daily Technical Levels

Support   Resistance

1.1962       1.1976
1.1954       1.1982
1.1948       1.1991
Pivot point: 1.1968

EUR/USD– Trading Tip

The market’s technical side remains mostly unchanged on the back of a limited number of economic events on the calendar. The EUR/USD pair is trading with a bullish bias at the 1.1955 area, facing immediate resistance at the 1.2000 area. Closing of candles above the 1.1915 support level suggests odds of bullish bias in the EUR/USD as this level is extended by an ascending triangle breakout pattern. On the lower side, the EUR/USD may find support at the 1.1912 and the 1.1865 areas; however, bullish bias remains stable over the 1.1912 level.


GBP/USD – Daily Analysis

The GBP/USD closed at 1.33229 after placing a high of 1.33856 and a low of 1.32911. The GBP/USD pair tried to rise and post gains for Monday but failed to do so and continued its bearish streak for the third consecutive day. The rise in GBP/USD pair in the earlier trading session on Monday was due to the hopes that there was little progress in Brexit talks between U.K. and E.U. to settle disputes on several issues, including the fishing quotas.

The rise in British Pound was due to the latest comments from French European Affairs Minister Clement Beaune. On Monday, he said that he hoped to see an agreement in the next few days and called on negotiators to leap required. He acknowledged that two sticking issues, U.K. fishing waters and the so-called level-playing field for business, are still unresolved.

As both sides have already warned each other that the time was running out, a French presidency official said on Monday that Britain should clarify its positions and consult to find a Brexit deal on its association with the European Union. He added that the E.U. also has the interest to fight for, to give fair competition for its businesses and fishermen. He said that the Union has made a clear and balanced offer for a future partnership with Britain and that the E.U. will not accept a substandard deal that would not respect the E.U.’s interests.

On the other hand, Boris Johnson’s officials believed that the Brexit trade deal could be reached within days if both sides continue working in good faith to resolve fishing rights’ big obstacle. The U.K.’s Foreign Secretary Dominic Raab called on the E.U. to recognize that regaining control over British waters was the question of sovereignty for Britain. He said that talks were going good and he believed a deal on fish might be achievable during the final week of talks.

These optimistic and hopeful comments from both sides added strength to the GBP/USD pair on Monday during the early trading session. Still, the currency pair failed to maintain its gains and started to decline and post losses for the day despite the broad-based U.S. dollar weakness due to insufficient macroeconomic data on the day.

On the U.S. dollar front, at 19:45 GMT, the Chicago PMI for November fell to 58.2 against the estimated 59.4 and weighed on the U.S. dollar. At 20:00 GMT, the Pending Home Sales for October also declined to -1.1% against the projected 1.1% and weighed on the U.S. dollar that capped further losses in GBP/USD pair.

From the Britain side, at 14:30 GMT, the M4 Money Supply for October from Britain was dropped to 0.6% against the forecasted 1.0% and weighed on British Pound and added further losses in GBP/USD pair. The Net Lending to Individuals for October also declined to 3.7B against the expected 4.7B and weighed on British Pound and supported the bearish momentum in GBP/USD pair. At 14:32 GMT, Mortgage Approvals for October raised to 98K against the anticipated 85K and supported British Pound and capped further losses in the currency pair.

Meanwhile, the GBP/USD pair’s bearish trend was continued for the third consecutive day because of the rising fears that the U.K. and E.U. will end up having no-deal at the end of the transition period that is due on December 31. Only a month has left behind to resolve both parties’ issues, and none of them has shown any lenience. If both sides failed to reach a deal by the end of the deadline, then the U.K. will be forced to trade with the E.U. under the World Trade Organization terms that will not be good for both sides.


Daily Technical Levels

Support   Resistance

1.3316       1.3342
1.3301       1.3353
1.3290       1.3368
Pivot point: 1.3327

GBP/USD– Trading Tip

The GBP/USD is trading sideways, within a narrow trading range of 1.3397 – 1.3304. The market is likely to exhibit choppy sessions until this narrow trading range gets violated. On the higher side, the GBP/USD is facing a triple top level at the 1.3397 level; however, the bullish breakout of the 1.3397 level can trigger a buying trend until the 1.3454 level. On the lower side, the Cable is supported over 1.3350 level, supported by an upward channel on the four hourly charts. The MACD suggests a buying trend, and we should look for a buy trade over the 1.3325 level or 1.3400 level today.


USD/JPY – Daily Analysis

The USD/JPY pair was closed at 104.289 after placing a high of 104.384 and a low of 103.830. After placing losses for two consecutive days, the USD/JPY pair rose on Monday as the U.S. dollar rebounds.

The broad-based U.S. dollar weakness in the early trading session pushed the USD/JPY pair lower after the hopes for the U.S. stimulus measure raised. However, Wall Street’s main indexes’ poor performance allowed the U.S. dollar to remain firm against its peers. The Dow Jones Industrial Average and the S&P 500 indexes lost about 1.2% and 0.78% respectively on Monday, which added strength to the U.S. dollar and pushed the USD/JPY pair higher.

Meanwhile, on Monday, US Health Secretary Alex Azar said that Americans could get their first shot of coronavirus vaccine before Christmas if all thing went well. These comments from Azar added further strength in risk-sentiment and weighed on the safe metal Japanese Yen that added gains in USD/JPY pair. Furthermore, on Monday, Moderna applied for emergency authorization with the U.S. Food and Drug Administration to start using its vaccine to reduce the effect of coronavirus. Pfizer and BioNtech, which has already filed for similar FDA approval earlier this month, sent the first mass shipment of its COVID-19 vaccine to Chicago through United Airlines on Friday. This positive news from the drug companies added optimism in the market and weighed on the safe-haven Japanese Yen that added further gains in the USD/JPY pair.

On the data front, at 04:50 GMT, the Prelim Industrial Production for October from Japan raised to 3.8% against the forecasted 2.3% and supported the Japanese Yen that capped further gains in the USD/JPY pair. The Retail Sales for the year from Japan stayed the same as expected by 6.4%. At 10:00 GMT, the Housing Starts for the year came from Japan came in as -8.3% against the forecasted -9.0% and supported the Japanese Yen.

On the U.S. dollar front, at 19:45 GMT, the Chicago PMI for November declined to 58.2 against the expected 59.4 and weighed on the U.S. dollar that capped further gains in the USD/JPY pair. At 20:00 GMT, the Pending Home Sales for October fell to -1.1% against the estimated 1.1% and weighed on the U.S. dollar that capped further gains in the USD/JPY pair.
Another factor involved in the risk sentiment that supported the upward momentum of the USD/JPY pair on Monday was the start of a brief session of Congress over the issue of a second stimulus bill for the coronavirus pandemic. The Democrats and Republicans were under dispute over the size of the stimulus package, and now that the Presidency has shifted from Republicans to Democrats after the victory of Joe Biden, it could be expected that a massive stimulus is on its way that would curb the effects of COVID-19 and support the risk sentiment of the market. The improved risk demand added pressure on the safe-haven Japanese yen and supported the USD/JPY pair on Monday. Another factor involved in the gains of the US/JPY pair was Pfizer’s vaccine’s shipment to Chicago on Monday, along with the latest application by Moderna to FDA for emergency use authorization of its vaccine.

Daily Technical Levels

Support   Resistance

104.03       104.16
103.97       104.23
103.91      104.29
Pivot point: 104.10

USD/JPY – Trading Tips

The USD/JPY is trading with a sideways trading range of 104.475, holding below an immediate resistance level of 104.478. On the lower side, the safe-haven currency pair may find support at the 103.719 level. The pair seems to disrupt the resistance level of 104.478, and if this happens, the USD/JPY may soar until the next resistance area of 105.030 level. The MACD and RSI support the buying trend, but we should only take buying positions over the 104.500 level today. Good luck!
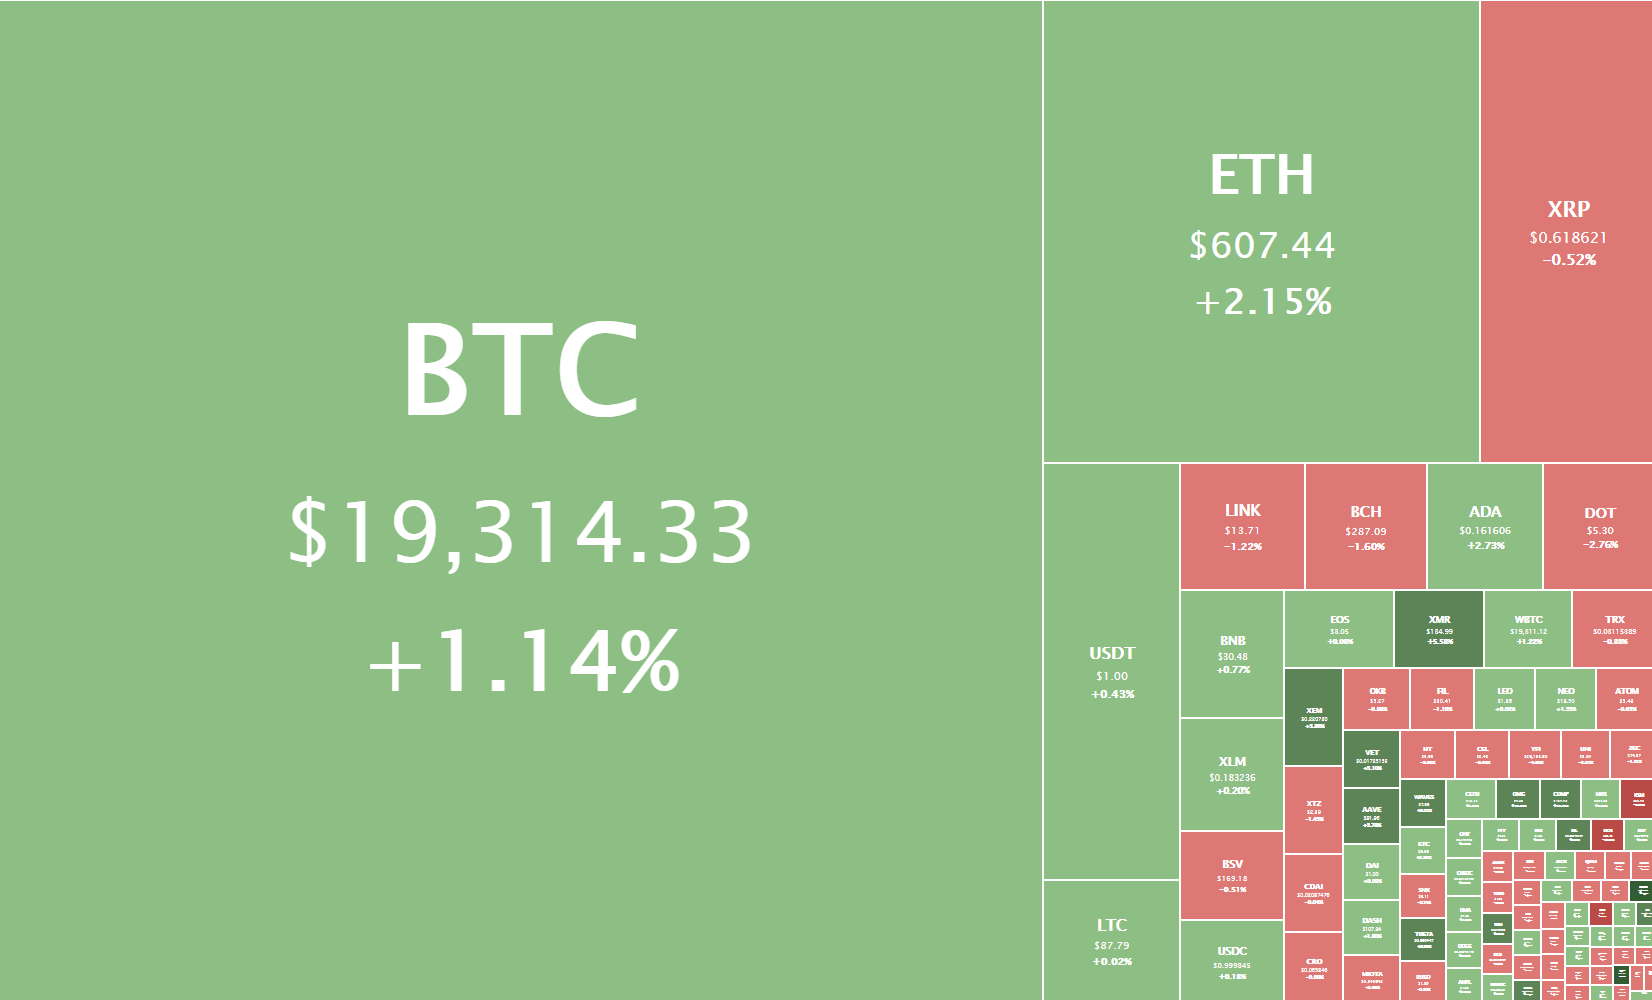
Categories
Crypto Market Analysis

Daily Crypto Review, Dec 1 – Bitcoin’s New Monthly All-Time High; Ethereum 2.0 Phase 0 Launches Today

The cryptocurrency sector has pushed further up as Bitcoin made a new all-time high for a moment. The largest cryptocurrency by market cap is currently trading for $19,443, representing an increase of 5.03% on the day. Meanwhile, Ethereum gained 3.45% on the day, while XRP managed to gain 3.78%.

 Daily Crypto Sector Heat Map

BitTorrent gained 18.25% in the past 24 hours, making it the most prominent daily gainer in the top100. It is closely followed by Litecoin’s gain of 11.22% and Decentraland’s 7.69% gain. On the other hand, Numeraire lost 4.81%, making it the most prominent daily loser. It is followed by Waves’ loss of 5.78 and Zilliqa’s loss of 3.36%.

Top 10 24-hour Performers (Click to enlarge)

Bottom 10 24-hour Performers (Click to enlarge)

Bitcoin’s market dominance has increased slightly since we last reported, with its value currently staying at 62.4%. This value represents a 0.7% difference to the upside compared to the value it had yesterday.

Daily Crypto Market Cap Chart

The crypto sector capitalization has increased significantly in the past 24 hours. Its current value is $577.86 billion, representing a $24.86billion increase compared to our previous report.

_______________________________________________________________________

What happened in the past 24 hours?

_______________________________________________________________________

_______________________________________________________________________

Technical analysis

_______________________________________________________________________

Bitcoin

Bitcoin has spent the day continuing its push towards the upside, even posting a new all-time high (on most exchanges) for a moment as it reached $19,864 on Bitstamp. However, the 20,000 mark and BitMEX’s $20,093 remain untouched. With the buys on exchanges and derivatives markets and institutional investments, a strong all-time high might be posted extremely soon.

Bitcoin trading is quite hard at the moment simply due to how the cryptocurrency moves. Still, traders can squeeze a profit if they trade along with the main trend and long Bitcoin when the volume increases.

BTC/USD 4-hour Chart

Bitcoin’s technicals on all time-frames are tilted towards the buy-side but show slight neutrality signs, or even slight signs of bearishness.

BTC/USD 1-day Technicals

Technical factors (4-hour Chart):
  • Price is far above both its 50-period EMA and its 21-period EMA
  • Price is near its top Bollinger band
  • RSI is near the overbought territory (69.43)
  • Volume is average
Key levels to the upside          Key levels to the downside

1: $19,500                                 1: $19,000

2: $19,666                                 2: $18,790

3: $20,000                                  3: $18,500

Ethereum

Ethereum has, just like Bitcoin, continued its climb up. However, the move has stopped slightly below its most recent highs, topping at $617.87. The second-largest cryptocurrency by market cap now has two scenarios to play out:

  1. It can create a double top and start moving back towards the supporting levels;
  2. It can continue moving up on fundamentals and break the recent high and the recent trading patterns it created.

Ethereum’s current fundamental outlook is extremely bullish due to its Phase 0 of Ethereum 2.0 launching. This, along with Bitcoin moving towards the upside, has made trading any potential pullbacks quite impossible due to the amount of potential risk such trade would carry.

ETH/USD 4-hour Chart

Ethereum’s 4-hour, daily, and monthly technicals are extremely bullish and show no signs of neutrality. On the other hand, its weekly time-frame’s sentiment is bullish but shows some neutrality.

ETH/USD 1-day Technicals

Technical Factors (4-hour Chart):
  • The price is far above both its 50-period and its 21-period EMA
  • Price is near its top Bollinger band
  • RSI is near being overbought (68.63)
  • Volume is average
Key levels to the upside          Key levels to the downside

1: $600                                     1: $510

2: $630                                     2: $500 

3: $735                                      3: $490

Ripple

The fourth-largest cryptocurrency by market cap has tried moving up, as well, but in a much tamer manner. XRP has established its presence above $0.625 and pushed towards $0.666, which stopped the move. XRP will most likely continue trading in a range-bound by $0.666 to the upside and either $0.625 or $0.596 to the downside

Trading XRP is quite difficult at the moment, and trading Bitcoin or Ethereum is potentially more profitable and slightly more straightforward.

XRP/USD 4-hour Chart

XRP’s technicals on the 4-hour and weekly time-frames are bullish but show some signs of neutrality. On the other hand, its daily and monthly overviews are completely bullish.

XRP/USD 1-day Technicals

Technical factors (4-hour Chart):
  • The price is above its 50-period EMA and slightly above its 21-period EMA
  • Price is between its middle and top Bollinger band
  • RSI is neutral (60.95)
  • Volume is average
Key levels to the upside          Key levels to the downside

1: $0.666                                   1: $0.625

2: $0.78                                     2: $0.596

3: $0.79                                   3: $0.535


Categories
Forex Elliott Wave Forex Market Analysis Forex Signals

Is EURNZD Developing a Terminal Formation?

The EURNZD cross presents a downward sequence in its 12-hour chart that began on August 20th when the price found fresh sellers at 1.82238. This sequence formed three internal segments and, recently, is likely forming a reversal movement in the following trading sessions.

Technical Overview

The previous chart illustrates the bearish primary trend identified with the descending trendline, drawn in blue. Moreover, the secondary trend, plotted in green, reveals an aggressive decline that is happening since October 20th when the cross found resistance at 1.80212. But we see all that the EURNZD price seems to have found support on November 23rd on 1.69472. Currently, the price action appears consolidating in a narrow range between 1.69622 and 1.70645.

In Elliott Wave theory terms, the cross is advancing in an incomplete downward corrective sequence of Minute degree identified in black, which currently is drawing its wave ((c)). Likewise, its internal structure suggests the progress in the fifth wave of Minuette degree labeled in blue.

The following 2-hour chart reveals the EURNZD cross is moving mostly sideways following a descending wedge breakout, or in terms of the Elliott Wave theory, an ending diagonal breakout. 

Nevertheless, the bullish reversal is still unconfirmed as long as the cross keeps moving below the level of 1.70486.

Short-term Technical Outlook

The EURNZD cross shown in its 2-hour chart below presents a sideways movement below the pivot level of 1.70486, which could correspond to the fifth wave of Minuette degree, labeled in blue. 

Considering that the cross remains in a consolidation structure, there are two potential scenarios:

  • The first scenario occurs if the price action breaks and closes above the 1.70486 pivot level. In this case, the EURNZD could develop an upward movement. According to the Dow Theory, the cross should make an upward motion to the area between 1.73016 and 1.76560. Likewise, the invalidation level for this reversal scenario is seen on 1.69472, which corresponds to the low made on November 24th.
  • The second scenario calls for the price to drop and close below the 1.69472 level. If that happens, the cross could continue its decline toward the lows zone made in January, near the 1.6650 level. The price could find support and complete the wave ((c)) of Minute degree labeled in black. In this scenario, the invalidation level would be located above the last relevant swing high of 1.70961.

However, let’s remember that as long as the price doesn’t confirm any breakout, bullish, or bearish, the bias should be kept neutral.

Categories
Forex Basic Strategies

Successfully Scalp Forex Pairs with these Two Tools

Introduction

Scalping is a short term trading style, and it is quite popular among professional Forex traders. This type of trading is more concise than day trading, which involves traders placing buy/sell orders throughout the trading day. But Scalping is different. Scalpers believe that making money from the small price action moves is easier than waiting for the considerable moves.

For scalping, our focus should be mostly on technical analysis rather than fundamentals.  By using technical analysis, traders use historical price information to predict the future price movement. To be successful in scalping, traders must have live feeds, direct access to the broker, and have the stamina & patience to sit in front of the computer and place as many trades as possible in smaller time frames to make money.

Scalping typically requires smaller timeframes such as a 5-minute, 15-minute, or even 1-minute charts. Some traders also use the tick chart or 30-seconds chart to scalp the Forex market. However, it requires an advanced skill set to be successful at this because the lower the timeframe is, the faster it moves. In this article, Let’s learn how to scalp the 1-minute Forex charts using Pin bars and Trend lines.

Pin Bars

Pin Bar is a candlestick pattern that consists of only one candle, which represents a sharp reversal. There are two types of Pin Bar.

  1. The Bullish Pin Bar’s closing price is higher than the candle’s opening price, and the candle’s wick must be two to three times longer than the real body.
  2. The Bearish Pin Bar’s closing price is lower than the candle’s opening price, and the tail of the candle must be two to three times longer than the real body.

Trend Lines

Trend lines act as an essential tool for analysts while performing technical analysis. These lines are a visual representation of support and resistance levels in any trading timeframe. Traders apply these trend lines on the price charts to get a clear picture of the ongoing trend to make an accurate trading decision. Also, the trend lines on the highs and lows of the price chart create a channel.

Trading Strategy – Pin Bars + Trendlines

The one-minute trading timeframe volatiles a lot, and this small timeframe never moves in a single trend. We will always see the transitions from buy trend to sell and sell trend to buy in less than a couple of minutes. This is the essence of trading the lower timeframes. Therefore, before trading the one-minute timeframe, it is advisable to let go of all of your rigid trading beliefs.

Most of the scalpers fall into their ego and deny to close their losing positions. If you fall into this trap, then scalping is not for you. You must have a strong mindset and follow the rules like world-class traders to scalp the Forex market successfully.

Buy Examples

As you can see in the below image of the GBP/CHF Forex pair, the price was in an uptrend. Whenever the price approached the trend line, buyers immediately came back and printed a Pin bar candle, which is an indication to go long.

In this example, the market gives us three buying opportunities, and all the three trades performed well. When you take an entry at the pin bar formation, and the very next candle goes against you and closes below the pin bar, it is an indication for you to close your positions and wait for the next signal. On a one-minute time frame, always go for 2-3 pip stop loss and 6-7 pip targets only.

Below is another buying example in the GBP/AUD Forex pair. Here, the market gave us only one trading opportunity. As the price chart implies, the buyers were in complete control, and the price action is moving calmly. This means that there is a very less chance of spikes or fake outs. It is always advisable to find the less volatile currencies and try not to scalp the opening hours of the market.

Sell Examples

In the below USD/CHF 1-minute Forex chart, the overall trend was down. We can see the price printing the pin bars twice in a downtrend, which indicates us to go short. There are various ways to close your positions. We can choose any significant support/resistance area to book profit or close our positions when the price action starts to lose its momentum.

Some scalpers prefer to ride longer moves based on the market circumstances, while some like to close their positions after making 5 to 6 pips. So exiting completely depends on your trading style.

Below is another selling example of this strategy in the USD/CHF Forex pair. When price approached the trend line in a downtrend, we can see the market printing Pin Bars. This shows that the price action is ready to print brand new lower lows. Activate your trade when the market gives both the signals. In healthy market conditions, expect brand new lower lows or higher highs, and please avoid trading choppy market conditions.

Conclusion

Scalping proved to be a great way to make profits in a very short time. Make sure to understand that it requires a lot of hard work, patience, and dedication to master trading the lower timeframes. The more the trades you get into, the more the amount of money you will make. Scalping can be very difficult in the beginning, but with some practice and a right strategy, you will get the hang of it.

It is hard to scalp the 1-minute chart by using price action alone. Most of the highly successful scalpers use some indicators and candlestick patterns to confirm the market trend. Using the pin bars and trend lines on the 1-minute chart will help you filter out the bad trading signals, and this will drastically enhance the odds of your trades. Cheers!

Categories
Forex Elliott Wave Forex Market Analysis Forex Price Action Forex Technical Analysis

Is EURGBP Ready for a Fresh Rally?

In our latest EURGBP technical analysis, we commented on the cross moving in an incomplete sideways corrective formation of Minor degree, identified in green. Its internal structure suggested the completion of a double-three pattern of Minute degree.

Also, we saw the pierce and bounce of the September 03rd low at 0.8658, when EURGBP dropped to 0.88610, found fresh buyers there, and created an intraday impulsive move identified as the first wave of Minute degree, labeled in black.

As the next 4-hour chart shows, once the EURGBP cross completed its first wave, in black that belongs to wave C, in green, it reacted mostly bearish, developing a correction, extending the move below our forecasted area, and testing the lows of the previous bullish impulsive move.

The breakout of the short-term descending trendline confirmed the end of wave ((ii)) of Minute degree and the beginning of the third wave of the same degree, which remains in progress.

Likewise, in the last chart, we distinguish the advance of the third wave of Minuette degree identified in blue in its internal structure.

Short-term Technical Outlook

The short-term Elliott Wave view of the EURGBP cross, unveiled in the below 4-hour chart, reveals the breakout of the descending trendline that follows the wave ((ii)) identified in black, which suggests the beginning of a new rally.

Once the price found fresh buyers at 0.88998, the cross began to advance mostly bullish in an impulsive sequence of Minuette degree, identified in blue, that remains in progress. This upward move corresponds to the internal structural series of wave ((iii)) of Minute degree that belongs to wave C of Minor degree, in green.

Furthermore, considering the reduced period it took for the first stage of wave (iii) to complete, It is plausible that the third wave in progress will be the extended wave, as the Elliott Wave theory states that only one extended wave would occur in an impulsive structure. 

In this context, the current upward move could advance to the next supply zone between 0.90446 until 0.90686. But, if the cross maintains its bullish momentum, it could strike the next potential target zone between 0.91260 and 0.91464.

Finally, the current bullish scenario’s invalidation level is 0.88610, which corresponds to the origin of the wave C in green.


Categories
Crypto Market Analysis

Daily Crypto Review, Nov 30 – Ethereum Soars on Great Fundamentals; Bitcoin Bulls Back in the Game

The cryptocurrency sector has spent the weekend regaining what was lost during the crash on Nov 25. Almost every single cryptocurrency in the top100 ended up being in the green. The largest cryptocurrency by market cap is currently trading for $18,369, representing an increase of 4.43% on the day. Meanwhile, Ethereum gained 9.79% on the day, while XRP managed to gain 6.67%.

 Daily Crypto Sector Heat Map

Kusama gained 19.14% in the past 24 hours, making it the most prominent daily gainer in the top100. It is closely followed by Ampleforth’s gain of 16.24% and Zilliqa’s 13.48% gain. On the other hand, Numeraire Coin lost 5.56%, making it the most prominent daily loser. There were no other cryptocurrencies in the top100 that lost over 1% of its value.

Top 10 24-hour Performers (Click to enlarge)

Bottom 10 24-hour Performers (Click to enlarge)

Bitcoin’s market dominance has decreased slightly since we last reported, with its value currently staying at 61.7%. This value represents a 0.5% difference to the downside compared to the value it had on Friday.

Daily Crypto Market Cap Chart

The crypto sector capitalization has increased significantly over the weekend. Its current value is $553.00 billion, representing a $38.14 billion increase compared to our previous report.

_______________________________________________________________________

What happened in the past 24 hours?

_______________________________________________________________________

_______________________________________________________________________

Technical analysis

_______________________________________________________________________

Bitcoin

Bitcoin has spent the weekend recovering from the Nov 25 crash. The price was slowly going up over the weekend, creeping up to and past $18,000 once again. The largest cryptocurrency by market cap is currently between its 61.8% and 78.6% Fib retracement levels, and a break to either side of this range may determine its short-term fate.

Bitcoin’s short-term future will greatly depend on if it breaks its immediate support or resistance level. In both cases, a strong rally towards that side may form, so traders should be prepared to “catch” the trade quickly.

BTC/USD 1-hour Chart

Bitcoin’s daily, weekly, and monthly technicals are tilted towards the buy-side but show slight neutrality signs. On the other hand, its 4-hour technicals are completely bullish.

BTC/USD 1-day Technicals

Technical factors (4-hour Chart):
  • Price is above both its 50-period EMA and its 21-period EMA
  • Price is near its top Bollinger band
  • RSI is neutral (62.26)
  • Volume is average
Key levels to the upside          Key levels to the downside

1: $18,500                                 1: $17,850

2: $18,790                                 2: $17,450

3: $19,000                                  3: $17,000

Ethereum

Ethereum has, just like Bitcoin, been climbing back and trying to reach its recent highs. The second-largest cryptocurrency by market cap is currently fighting to pass the 78.6% Fib retracement level, sitting at $592.5. If this level gets conquered with conviction, we may expect another run past $600.

Ethereum’s current fundamental outlook is very bullish due to its Phase 0 of Ethereum 2.0 launching. This, combined with Bitcoin moving towards the upside, has made trading any potential pullbacks impossible due to how risky it would be.

ETH/USD 4-hour Chart

Ethereum’s 4-hour, daily, and monthly technicals are completely bullish and show no signs of neutrality. On the other hand, its sentiment seen in the weekly time-frame’s is bullish but shows some neutrality.

ETH/USD 1-day Technicals

Technical Factors (4-hour Chart):
  • The price is far above both its 50-period and its 21-period EMA
  • Price is at its top Bollinger band
  • RSI is near being overbought(68.26)
  • Volume is average
Key levels to the upside          Key levels to the downside

1: $600                                     1: $510

2: $630                                     2: $500 

3: $735                                      3: $490

Ripple

The fourth-largest cryptocurrency by market cap has spent the weekend trying to maintain its level after a small rally that took its price from $0.55 to $0.65. XRP seems to be trading in a range, bound by the 38.2% Fib retracement ($0.582) and 61.8% Fib retracement ($0.657).

Trading XRP may not be optimal as trading Bitcoin, or Ethereum is potentially more profitable and slightly more straightforward.

XRP/USD 2-hour Chart

XRP’s technicals on shorter time-frames (4-hour and daily) are extremely bullish, while its weekly and monthly overviews show some signs of neutrality and bearishness (though they are still bullish).

XRP/USD 1-day Technicals

Technical factors (4-hour Chart):
  • The price is above its 50-period EMA and slightly above its 21-period EMA
  • Price is between its middle and top Bollinger band
  • RSI is neutral (58.86)
  • Volume is average
Key levels to the upside          Key levels to the downside

1: $0.657                                   1: $0.625

2: $0.711                                     2: $0.582

3: $0.79                                  3: $0.535


Categories
Forex Elliott Wave Forex Market Analysis

EURJPY Advances from Demand Zone Forecasted

In mid-November, we commented about the technical market context of the EURJPY cross, as its big picture displayed in its weekly chart revealed a technical formation identified as a triangle pattern, which continues progressing since mid-2014.

Moreover, our previous mid-term Elliott wave analysis in its 12-hour chart revealed the advance of an incomplete corrective structure of Minor degree, which currently advances in wave B in green.

In this regard, our main outlook anticipated the progress in its wave ((b)) of Minute degree identified in black. The internal structure also suggested a limited decline toward the demand zone between 122.951 and 122.317. Once reached, the price could have completed the internal wave (b) of Minuette degree labeled in blue. 

Once the cross completed its wave (b), in blue, the cross should begin its wave (c), in blue, with a potential target in the supply zone between 125.285 and 126.123.

Technical Outlook

Currently, the EURJPY cross in its 12-hour chart reveals the bounce from the previous demand zone forecasted, where the price began to advance in its wave (c) in blue.

In the previous chart, we distinguish wave (c)‘s upward progress, which should evolve in a five-wave sequence according to the Elliott Wave theory. The figure also shows the potential target zone between 125.285 and the psychological barrier of 126.

This price landscape brings us three potential scenarios for the current upward movement:

  • First scenario: The EURJPY cross reaches the supply zone between 125.285 and 126.123, completing its wave ((b)) in black, and the price starts to decline in an internal five-wave sequence corresponding to wave ((c)).
  • Second scenario: The cross’ short-term rally fails to surpass the end of wave (a), in blue, and begins to decline. This scenario should be indicative of strong bearish pressure.
  • Third scenario: EURJY price action surpasses the invalidation level located on 127.075. In this case, the cross could be creating a bullish breakout of the long-term triangle, suggesting the continuation of the long-term bullish trend.

Nevertheless, before placing any position on the bearish side or continue on the bullish side, the price action must confirm the end of wave ((b)) in black.

Categories
Crypto Market Analysis

BTC/USD Weekly Chart Analysis + Possible Outcomes

In this weekly BTC/USD analysis, we will be taking a brief look at the most recent events, current chart technical formations, as well as the possible BTC short-term price outcomes.

Overview

Bitcoin has spent the past week experiencing a long-awaited pullback, after which it started consolidating. The largest cryptocurrency by market cap has dropped significantly and reached as low as $16,200 before bears reached exhaustion after failing to break its all-time high. While some analysts are calling for an end of the pullback, most of the data shows otherwise. First off, the current controversy around China seizing 1% of all Bitcoin is contributing towards the overall bearish sentiment. Second, a poll done on crypto investors says that the majority of investors believe that BTC will end up correcting as much as 40%. All this, plus the fact that Bitcoin couldn’t push past $17,260 for a couple of days now, is a testament to the short-term bearish sentiment.

On the other hand, people shouldn’t mistake this for a long-term bearish trend. In fact, Bitcoin has never been more bullish long-term.

Technical factors


Bitcoin has continued moving up and performed exactly what we called last week (a push towards the all-time high). Once again, as expected, the push didn’t break the all-time high and has triggered a strong pullback. Bears have reached exhaustion at just over $16,000 and Bitcoin has started consolidating in a range, bound by $17,260 (both horizontal resistance and a 100-period moving average) to the upside and $16,420 to the downside.

The hash ribbons indicator still shows a buy/accumulate signal as it points out to miner capitulation.

Likely Outcomes

Bitcoin’s movement is a bit less obvious this week when compared to the past weeks. The cryptocurrency has a couple of scenarios it can play out as it leaves the current range-bound trading.

1: If Bitcoin breaks the range to the downside (slightly less likely), its most likely target will be $15,500. Due to the short-term bearish sentiment surrounding Bitcoin at the moment, a short trade doesn’t have to be considered as “trading against the large trend” and may actually be a good profit-making opportunity.

In this case, a clear stop-loss should be set a little above $16,420.

2: The second (just slightly more likely) scenario happens if Bitcoin manages to break the $17,260 mark. In this case, the cryptocurrency can reach many targets, but will most likely pass the $17,600 immediate resistance and push higher. The next zone of resistance after that is the $18,250-$18,450.

Trading Bitcoin’s sideways action in a current range is not advised as the price could break out of it at any time.

Categories
Forex Fundamental Analysis

Everything About ‘Business Investment’ Fundamental Forex Driver

Introduction

The economy is intricately woven. Although consumption accounts for about 70% of the GDP, this consumption wouldn’t be met if the supply was cut short. The point here is – all aspects of the economy are intertwined. Therefore, a change in one aspect of the economy is bound to influence the others significantly. In this article, we will see how investments by businesses influence the economy and how it impacts the forex market.

Understanding Business Investment

In the most basic sense, business investment is defined as spending money to acquire assets, start a business, or expand a business with the anticipation of making profits.

As an economic indicator, Business Investment’ represents the change in capital expenditure in the private sector. This expenditure is an inflation-adjusted value.

Source: Ernst & Young UK

In the UK, for example, business investment data is published quarterly. The data in this report is usually segregated depending on the asset type. These categories include; private sector business investment, investment in transport equipment, investment in ICT equipment and machinery, investment in buildings and structure, and investment in intellectual property products. Cultivated biological resources and the manufacture of weapons are included in the calculation. Note that the following are excluded from the calculation of the data in this report: expenditure on residential dwellings, expenditure on land and existing building, and the cost of ownership or transfer of non-produced assets.

In the calculation of the Business Investment’ in the UK, the data from the Annual Business Survey (ABS) is used to establish a benchmark on investment for various industries.

Using Business Investment in Analysis

As we mentioned earlier, business investment is part of the GDP and is also correlated with other economic aspects. The fact business investment data measures the value of the inflation-adjusted value of capital expenditure gives us a dependable ‘real’ figure of the economic activities over a specific period.

The primary effect of business investment will be on the labor market. When business investment increases, it could mean that new business ventures are being set up or the existing ones are being scaled up and expanded. In both instances, it means that more labor will be required. Remember that business investment encompasses investments made in any profit-making venture; it could be in agriculture, in the financial markets, or the informal sector. As a result, increased business investment lowers the rate of unemployment in the economy.

Furthermore, the increased production leads to the growth of output hence higher levels of GDP.

Source: Ernst & Young UK

Conversely, when business investment decreases, it could imply that economic activities are being scaled down. Scaling down operation implies that less labor will be needed. The result is an increase in unemployment levels. More so, scaling down operations implies low economic outputs hence lower levels of GDP.

Business investment goes hand in hand with the level of demand in the economy. Business investment can be said to be responding to levels of demand. Therefore, when business investment increases, it means that there is a higher demand in the economy. By itself, the increased demand means that other aspects of the economy, such as the labor market, are performing well. On the other hand, decreasing business investment means that demand is falling. Demand Reduction is synonymous to a contracting economy.

The business investment data can also be used to analyze the business cycles and, as a result, help in forecasting recessions and recoveries in the economy. Using historical data on business investment, we can establish a pattern. This pattern will show us periods when business investments were slowing down, when they were stagnating, and when they were rapidly increasing. Naturally, periods when business investments are increasing can be regarded as the expansion stage. The recession stage is characterized by a continuous fall in business investments. When business investments have stagnated, this period could be considered the peak of the business cycle.

In predicting recessions and recoveries, let’s use the example of the coronavirus pandemic. Towards the end of the first quarter of 2020, business investments dropped continuously. The continuous drop in business investment was because investors anticipated the demand in the economy to be severely depressed, especially in the consumer discretion industry. While other sectors of the economy saw some increased investments, most sectors experienced a drastic reduction in business investments. The primary goal when making any investment is to earn profits. In this instance, due to the social distancing rules, massive losses were forecasted across the economy. As a result, business investment reduced as investors looked to reduce their exposure to a contracting economy.

At the beginning of the third quarter of 2020, business investment started increasing. This period signified the beginning of economic recovery from the coronavirus-induced recession. The recovery was prompted by a host of expansionary monetary and fiscal policies implemented by governments and central banks. These policies included lowering interest rates and offering economic stimulus packages of trillions of dollars. These policies signified the revival of the economy to the private sector, hence the increase in business investment.

Impact of Business Investment on Currency

In the forex market, the level of business investment can be used to foretell the policy actions of governments and central banks.

In any economy, the private sector is the single largest employer. Therefore, when the business investment is continuously falling, it can be anticipated that the labor market conditions will worsen, and demand in the economy will be severely depressed. This scenario may trigger expansionary fiscal and monetary policies to stimulate the economy and avoid a recession. Such policies make the domestic currency depreciate relative to others.

Conversely, the currency will appreciate when business investment increases. This increase can sign that the economy is performing well with an increase in the money supply. Contractionary monetary and fiscal policies may be implemented to avoid runaway inflation and prevent the economy from overheating. These policies make the domestic currency appreciate.

Sources of Data

In the UK, the Office for National Statistics publishes the quarterly business investment data. Trading Economics has in-depth and historical data on the UK business investment. It also publishes data on global business investment.

How Business Investment Data Release Affects The Forex Price Charts?

The most recent publication of the UK’s business investment data was on September 30, 2020, at 6.00 AM GMT. The release can be accessed from Investing.com. Moderate volatility is to be expected on the GBP when the data is released.

In the second quarter of 2020, business investment in the UK decreased by 26.5%, which was better than the -31.4% expected by analysts.

Let’s see how this release impacted the EUR/GBP pair.

EUR/GBP: Before the Business Investment Data Release on September 30, 2020, 
just before 6.00 AM GMT

The EUR/GBP pair was trading in a weak uptrend before the publication of the UK business investment data. As shown in the above 15-minute chart, candles are forming just above the 20-period MA.

EUR/GBP: After the Business Investment Data Release on September 30, 2020,
at 6.00 AM GMT

The pair formed a 15-minuted bearish ‘Doji’ candle after the news release. Subsequently, the pair adopted a bearish trend.

Bottom Line

While business investment is a significant indicator in the forex market, we may not entirely know the extent of its impact on the GBP. This is because its publication is scheduled at the same time as the GDP – which is a high-impact economic indicator.

Categories
Forex Videos

Forex Technical Indicators That Will Lose You Money!


Thank you for joining this Forex academy educational video.

In this educational tutorial, we will be looking at one of the main reasons why new traders lose money when they start trading Forex.

A first, let’s take a look at this warning which regulated brokers in the United Kingdom must adhere to on their website:  contracts for difference, also known as cfds, are complex instruments and come with a high risk of losing money rapidly due to leverage.  72.6% of retail investor accounts lose money when trading cfds.  You should consider whether you understand how cfds work and whether you can afford to take the highest risk of losing your money.

We have hidden the name of this broker, but in fact, 72.6% is one of the lower percentages of retail traders losing money, some are above 80%.

And yet, these high levels of losers remain the same year after year.  So, what is going on?  Unfortunately, most new traders will not go to the lengths of studying how the currency markets work.  They hardly ever bother to learn about fundamental analysis, which is crucial. Most of them will look at a couple of videos on YouTube, where so-called traders claim to have made money on a particular trade setup, which they may have the need to record several times previously in order to come up with one successful winning trade.  And yet most new traders will follow this strategy blindly and where of course, the markets can change direction in an instance, thus leaving them wondering what went wrong and how they lost their money.

The next common mistake made by new traders, who may have trolled through the internet to find some trade setups, is to overload their screens with too many indicators, which can be a hindrance because one ends up focusing on the indicators, which tend to be lagging price action,  and not the most important indicator on the screen itself; price action, which is a leading indicator.

Often these types of traders will look at one of the indicators, which might suggest price is going to go in a certain direction, and then trade according to that one single indicator, which may be in contradiction to the others. Occasionally they will be right, but more often than not they will be wrong, and end up losing money on a trade.

Let’s take a look at that chart again, which is a 1-hour chart of the British pound to US dollar, and by stripping out all of the indicators and drawing in three lines, we can much more easily see that price action is simply gravitating towards three major levels, 1.31 1.32 and 1.33.

INSERT C again

Yet this was impossible to see with all of the indicators on the previous chart.

And now, when we add in three very simple trendlines, we can see a clear direction of this pair, which trades within the trendlines and within the 3 key levels of 1.3100, 1.3200, and 1.3300. 

Unless taught, most new traders would never consider drawing trendlines on their charts and stripping away many of the technical indicators they have become reliant on.

 Another area where new traders fall down is trading over economic data releases because they have not bothered to follow a calendar or are not aware are of the significance of avoiding trading during times of high impact data releases.

Or trading during the end of a particular time zone, where the new time zone traders may have a completely different approach to the markets due to the local sentiment, which can cause price action reversal.

Trading the markets, especially foreign exchange, is extremely complex, just as the warning at the beginning of this video mentioned.  New traders are advised to comprehensively learn about how professional traders go about their daily business.  They must learn how to read price action, which is the best leading indicator of all.  They must also learn about fundamental analysis, how one market will affect the other, such as the stock market’s relationship with the foreign exchange market.

In conclusion, the absolute good news is that all of this information is available on the forex academy website.  It has been put together by extremely competent and experienced traders with a wealth of knowledge and great success behind them.  Be patient; take the time to troll through all of the videos because every one of them will help you to become a more successful trader.

Categories
Crypto Market Analysis

Daily Crypto Review, Nov 27 – Satoshi Nakamoto Emails Discovered; Crypto Market Consolidating

The cryptocurrency sector has started its consolidation period after a bloodbath it experienced yesterday. The largest cryptocurrency by market cap is currently trading for $17,164, representing a decrease of 3.07 % on the day. Meanwhile, Ethereum is gaining 0.01% on the day, while XRP managed to gain 2.47%.

 Daily Crypto Sector Heat Map

SushiSwap gained 31.44% in the past 24 hours, making it the most prominent daily gainer in the top100. It is closely followed by Aave’s gain of 15.05% and Nano’s 14.68% gain. On the other hand, Crypto.com Coin lost 10.20%, making it the most prominent daily loser. NEM lost 9.92% while OMG Network lost 9.43%, making them the 2nd and 3rd most prominent daily losers.

Top 10 24-hour Performers (Click to enlarge)

Bottom 10 24-hour Performers (Click to enlarge)

Bitcoin’s market dominance has stayed at the same place as yesterday, with its value currently staying at 62.2%. This value represents a 0% difference when compared to the value it had yesterday.

Daily Crypto Market Cap Chart

The crypto sector capitalization has decreased significantly over the course of the day. Its current value is $511.86 billion, representing a $48.67 billion decrease compared to our previous report.

_______________________________________________________________________

What happened in the past 24 hours?

_______________________________________________________________________

_______________________________________________________________________

Technical analysis

_______________________________________________________________________

Bitcoin

The largest cryptocurrency by market cap has triggered a rally towards the downside after creating a double top, which brought its price as low as $16,215. While some analysts say that the downturn is not over yet, Bitcoin has recovered slightly and is now consolidating just above the $17,000 mark.

While shorting Bitcoin could be a good profit-making opportunity if the downtrend continues, trading against the long-term trend is very risky. However, thinking about hedging against any downturns should be considered.

BTC/USD 1-hour Chart

Bitcoin’s daily and weekly technicals are tilted towards the buy-side and show no signs of neutrality. On the other hand, its monthly technicals show some signs of neutrality, while its 4-hour technicals are completely bearish.

BTC/USD 1-day Technicals

Technical factors (1-hour Chart):
  • Price is far below its 50-period EMA and at its 21-period EMA
  • Price is at its middle Bollinger band
  • RSI is neutral (44.33)
  • Volume is average
Key levels to the upside          Key levels to the downside

1: $17,450                                 1: $17,000

2: $17,850                                 2: $16,800

3: $18500                                   3: $16,350

Ethereum

Ethereum has experienced the same chain of events Bitcoin did in the past day or so. The downtrend ended up bringing Ethereum’s price back to as low as $480 before recovering. However, Ethereum’s ascending channel (yellow dotted) top line has stayed strong and triggered a mini-rally, which then brought the price above the red ascending line as well. Ethereum is now consolidating at around $515.

Ethereum’s current fundamental outlook is very bullish, but (as we said in our previous articles) any sharp move to the downside triggered by Bitcoin will affect Ethereum in a major way as well. This makes trading up hard, as one needs to constantly check Bitcoin’s price as well.

ETH/USD 1-hour Chart

Ethereum’s daily, weekly, and monthly technicals are completely bullish and show no or just slight neutrality signs. On the other hand, its sentiment seen in the 4-hour time-frame’s is completely bearish.

ETH/USD 1-day Technicals

Technical Factors (4-hour Chart):
  • The price is far below its 50-period and at its 21-period EMA
  • Price is at its middle Bollinger band
  • RSI is neutral (44.53)
  • Volume is average
Key levels to the upside          Key levels to the downside

1: $600                                     1: $510

2: $630                                     2: $500 

3: $735                                      3: $490

Ripple

The fourth-largest cryptocurrency by market cap has posted lower highs three times in a row, with its lows testing the $0.625 support level each time the price went down. However, the third time XRP went towards this level, Bitcoin’s push towards the downside triggered XRP bears, which took over the market. The downturn ended at the $0.475 level, which held up quite nicely. XRP is now trading in the middle of a range, bound by $0.475 to the downside and $0.625 to the upside.

Trading XRP may not be optimal at the moment as trading Bitcoin is both potentially more profitable and a bit more straightforward.

XRP/USD 1-hour Chart

XRP’s technicals on all time-frames are bullish, with its daily time-frame being the only one not showing any signs of neutrality. The other time-frames show either slight neutrality or even slight bearishness.

XRP/USD 1-day Technicals

Technical factors (4-hour Chart):
  • The price is slightly below its 50-period EMA and at its 21-period EMA
  • Price is slightly above its middle Bollinger band
  • RSI is neutral (48.78)
  • Volume is slightly above average
Key levels to the upside          Key levels to the downside

1: $0.625                                   1: $0.475

2: $0.79                                     2: $0.443

3: $0.963                                  3: $0.4


Categories
Forex Elliott Wave Forex Market Analysis Forex Technical Analysis

AUDNZD: Potential Bounce among Overall Weakness

This analysis discusses AUDUSD’s overall Elliott Structure, the likelihood of a short bounce in the AUDUSD, and its potential continuation.

Technical Overview

In our last AUDNZD technical analysis, the Oceanic cross was moving in an incomplete complex corrective sequence corresponding to wave (c) of Minuette degree labeled in blue, which belongs to wave ((y)) of Minute degree identified in black. 

As illustrated in the following 8-hour chart corresponding to our previous mid-November analysis, we commented on the broadening corrective formation the cross develops, which implies an acceleration of the downward sequence. Also, the move that pierced below the wave (a) in blue suggested further declines in the following trading sessions.

Likewise, we observed the potential bearish reaction areas for the decline until two potential demand zones. The first one located between 1.05186 and 1.04870, and the second one bounded between 1.03511 and 1.02864.

On the other hand, according to the Elliott wave theory, a complex corrective formation as a double-three pattern follows an internal sequence subdivided into 3-3-3, where each “three” corresponds to a single complete corrective wave.

Once completed, the current corrective structural series of wave 2 or B of Minor degree, the AUDNZD cross should give way to the start wave 3 or C, in green.

Technical Outlook

The AUDNZD cross in the next 8-hour chart exposes the price action advancing in its wave iii of Subminuette degree labeled in green, which belongs to the incomplete wave (c) of Minuette degree identified in blue. 

Considering the acceleration present in wave (c), the cross could develop an internal upward corrective movement corresponding to wave iv, in green. This move could find resistance in the adjacent supply zone between 1.0457 and 1.05603, where the cross could resume its downward movement, leading it to complete the wave ((y)) of Minute degree and, in consequence, wave 2 or B, in green. 

Once the current downward sequence finishes, the Oceanic cross will be ready for a new long-term rally corresponding to wave 3 or C, in green, which according to the Elliott wave theory, should be the largest wave of the impulsive sequence.

Finally, the invalidation level for the short-term bearish scenario is found at 1.07029, above the end of wave ii in green.


Categories
Forex Market Analysis

Daily F.X. Analysis, November 27 – Top Trade Setups In Forex – French Events in Focus! 

The economic calendar is a bit muted on the last trading day of the week as investors seem to enjoy the Thanksgiving holiday. However, France is due to report few low impact economic events such as French Consumer Spending with a positive forecast of 3.6% vs. -5.1%, Prelim CPI m/m with a neutral forecast of 0.0%, and Prelim GDP with a neutral growth rate forecast of 18.2% vs. 18.2%. These events are likely to have a muted impact on the market today. 


Economic Events to Watch Today  


EUR/USD – Daily Analysis

The EUR/USD pair was closed at 1.19123 after placing a high of 1.19406 and a low of 1.18850. EUR/USD pair hit a fresh 2-months high on Thursday in the early trading session and started to decline and ended up posting losses for the day after the German Consumer Confidence contracted.

At 12:00GMT, the German GfK Consumer Climate in November missed the market’s expectations and dropped to -6.7 against the expected -4.9 and weighed on Euro. At 14:00 GMT, the M3 Money Supply for the year from Eurozone remained flat at 10.5%. Private Loans for the year also came in line with the expectations of 3.1%.

The Eurozone’s largest economy, Germany, appeared to struggle to shake off the coronavirus crisis as consumers’ confidence declined. The investors became cautious about it. That weighed on the single currency Euro and added in the losses of EUR/USD pair.

Furthermore, the European Central bank (ECB) published its November policy meeting minutes in which the policymakers believe that there was the possibility that pandemic might have long-lasting effects. They were cautious that pandemics might take a toll on the demand side, supply sides and reduce the economy’s growth potential.

Minutes revealed that Inflation would remain negative for longer while employment could contract further. Policymakers believed that flexibility from PEPP was essential to its continued success, and they wanted to wait for a further fiscal response before reacting instead. They were of the review that more bond-buying may not have the same impact now. There were no surprises in the minutes as Central Bank has begun to pave the way towards additional easing next December.

The single currency Euro came under pressure after releasing these minutes from the European Central Bank and weighed on EUR/USD pair on Thursday. The U.S. markets were closed due to the Thanksgiving Holiday, and as Friday is not an official holiday, thin trading is expected to extend into the weekend.

Moreover, the currency pair also followed yesterday’s release of the flash US GDP data for the third quarter that remained low at 33.1% in annualized terms and raised concerns over the world’s largest economy. The coronavirus vaccine and the U.S. stimulus talks are considered as the prevailing risks to the Federal Reserve’s outlook going ahead.

The demand for safe-haven greenback continued to slip with the global economy’s improving outlook after the release of vaccines for a deadly virus. The weak U.S. dollar kept the losses in EUR/USD pair limited on Thursday.

Daily Technical Levels

Support   Resistance

1.1885      1.1934

1.1859      1.1957

1.1836      1.1983

Pivot point: 1.1908

EUR/USD– Trading Tip

On Friday, the direct currency pair EUR/USD is trading with a bullish bias at the 1.1912 level, holding above an immediate resistance becomes a support level of the 1.1905 level. On the higher side, the EUR/USD pair may find resistance at 1.1979, and a bullish breakout of 1.199 level can extend the upward trend until 1.1942. On the 2 hour timeframe, the EUR/USD pair has violated the symmetric triangle pattern that was extending resistance at the 1.19052 level, and now this level is working as a support. Let’s consider taking a buying trade over the 1.1905 level, and above this, the next target stays at 1.1997.


GBP/USD – Daily Analysis

The GBP/USD pair was closed at 1.33550 after a high of 1.33974 and a low of 1.33218. GBP/USD pair struggled to surpass the 1.3400 level and was unable to do so during the early European session, and after that, sellers came in and reversed the pair’s movement to as low as 1.3320 level.

The GBP/USD pair was amongst the worst performers on Thursday out of the G10 currencies, with losses of around 40 pips on the day. After posting gains for four consecutive days, the GBP/USD pair declined on Thursday. Much of the GBP/USD pair’s bullish rally was due to the U.S. dollar’s weakness following the U.S. President-elect Joe Biden’s victory at the start of the month was also escalated by the combination of vaccine optimism and the increasingly dovish tone of the FOMC.

Federal Reserve is expected to squeeze their asset purchase program in December to offer the economy more stimulus because of the rising number of coronavirus cases across the States that has forced the local governments to impose a second lockdown, as the fiscal stimulus from Congress remains indefinable.

Meanwhile, British Pound has also performed significantly better during this month as the hopes surrounding the Brexit deal were higher after the French compromise over the fisheries issue. An agreement over one sticking point also revealed progress made in the Brexit agreement and supported the Sterling that added gains in GBP/USD pair. Furthermore, the vaccine development from Pfizer & BioNtech, Moderna, and AstraZeneca also gave strength to the GBP/USD pair after adding demand for the market’s risk sentiment.

However, on Thursday, the tone behind GBP/USD was changed somewhat after the hopes for a Brexit deal started to fade away. Many reports suggested that the remaining key sticking issues related to Ireland and level playing field were proving to be very hard to reach an agreement. During Thursday’s European session, the Irish Foreign Minister said that Brexit’s outstanding issues were proving to be complicated. E.U. sources also reported that talks between the E.U. and the U.K. were not going well. Simultaneously, the French Foreign Minister put public pressure on the U.K. to adopt a more realistic negotiating stance on Wednesday that faded the optimistic tone around the market and weighed on GBP/USD pair.

During the Thanksgiving Holiday in the U.S. and, in the absence of any macroeconomic data from the U.K., the GBP/USD pair continued following the latest headlines and dropped on Thursday.

Daily Technical Levels

Support   Resistance

1.3318      1.3394

1.3282      1.3434

1.3242      1.3470

Pivot point: 1.3358

GBP/USD– Trading Tip

The GBP/USD traded in line with our previous forecast to hit the support level of 1.333, which is extended by an upward channel. On the higher side, Cable may find resistance at 1.3400 level that’s extended by the double top pattern on the two-hour timeframe. Simultaneously, the bullish crossover of the 1.3400 level is likely to open additional room for buying until the 1.3446 level. On the 4 hour timeframe, the GBP/USD pair has formed a bullish channel that supports the pair at the 1.333 area, and violation of this level on the lower side can drive a sharp selling trend until the 1.3270 mark. The RSI and MACD are suggesting a selling trend in sterling. However, I will prefer to open a buying trade over the 1.3330 area and selling trade below the same level today. 


USD/JPY – Daily Analysis

The USD/JPY pair was closed at 104.233 after placing a high of 104.479 and a low of 104.214. On Thursday, the U.S. dollar was down in early trading session subdued by weak U.S. economic data. The optimism surrounding the coronavirus vaccines prompted investors to seek out riskier assets instead of safe-haven. The U.S. Dollar Index (DXY) was down on Thursday against the basket of six major currencies by 0.3% at 91.97 level, the lowest level in more than two months as the volume was limited due to the holiday in the U.S. for Thanksgiving.

In late Wednesday, the Federal Reserve released the minutes of its last monetary policy meeting, and they showed that Fed members debated on a range of options on bond purchases to support the recovery, including pivoting to purchases of longer-term securities that could put more pressure on the dollar by keeping longer-term yield unattractively low. These comments from the Fed weighed on the U.S. dollar and added pressure on the USD/JPY pair on Thursday.

Meanwhile, the number of global coronavirus cases reached above 60 million on Thursday, out of which 12.7 million were from the U.S., according to Johns Hopkins University. Many states in the U.S. started to impose restrictive measures to curb the increasing numbers of coronavirus cases that led to more job losses, weighed on the U.S. dollar, and kept the USD/JPY pair under pressure.

Positive data from 3 vaccine candidates and their efficacies, along with a smoother transition to Joe Biden administration in the U.S., added pressure on the greenback and forced investors to move towards riskier currencies. Reports also suggested that the Fed’s monetary easing was on its way that continued weighing on the greenback and added pressure on the USD/JPY pair. Apart from this, a mixed performance in the European equity markets provided a modest lift to the safe-haven Japanese yen that ultimately contributed to the USD/JPY pair’s fall on Thursday.

Due to the absence of any macroeconomic data on the day and the thin liquidity conditions due to the Thanksgiving Holiday, the pair USD/JPY continued following the last day’s economic data of Unemployment claims that showed a negative labor market report and added pressure on the pair.

Daily Technical Levels

Support   Resistance

104.27      104.63

104.09      104.79

103.92      104.98

Pivot point: 104.44

USD/JPY – Trading Tips

The USD/JPY pair’s recent price action has violated the choppy trading range of 104.700 – 104.056. On the lower side, the USD/JPY pair can drop further until the next support level of 103.667 level, especially after the breakout of the 104.150 support level. On the higher side, a bullish breakout of 104.700 resistance can extend the buying trend until the next resistance area of 104.700 and 105.063 level. On the lower side, the support continues to hold around the 103.667 level. The MACD suggests selling bias in the USD/JPY pair; thus, we should consider selling trade below 104.150 and buying above the same. Good luck! 

Categories
Forex Basic Strategies

Top 3 Terrific Ways To Trade Price Channels Like A Pro

Introduction

A price channel is a state of the market that slopes up or down bounded by a trendline above and below the asset’s price. The upper trend line acts as a resistance to the price, while the lower trend line acts as support. The price channel helps traders maintain the focus on the price alone, unlike the other trading tools, which are plotted directly over the price chart. In an uptrend, as long as the price advances and moves within the channel, the underlying asset trend is considered bullish. The break below the channel line is a sign of the trend being reversed. Two main components of the price channel are the Main Trend Line & the Channel Line.

Main Trend Line – It takes a minimum of two to three points on the price chart to draw the trend line. The line sets the tone for the price slop as well as the trend. To draw a bearish trend line, we need at least three reaction points at the highs. To draw a bullish trend line, we also need two to three reaction lows on the price chart.

Channel Line – After drawing the main trend line, we draw the channel line parallel to the main trend line. For drawing the channel line, we also need two to three reaction highs and reaction lows in accordance with the trend. This channel line also acts as a support in an uptrend and resistance in a downtrend.

Trading Strategies To Trade The Price Channel

Trends + Channel

Channels are perfect to trade the pullback markets. It is advisable to look for the price channel that is sloping at a healthy angle. Don’t try to trade the steep or flat channels as they won’t provide good trading opportunities.

Firstly find a trending market and mark at least two reactions of highs and lows. For taking buy entries, wait for the price to touch the channel line and for selling trades, wait for the prices to touch the main trend line. Remember not to trade both buy and sell opportunities in an up-trending market. This approach is used by amateur traders who fail most of the time as we are going against the flow.

The price chart below indicates the price channel on the AUD/NZD forex pair.

The price gave the first selling opportunity on the 16th of May and the second trade was around 19th May. These trades printed a brand new lower low, and we closed our trades when the prices broke the channel.

Reversals + Channels 

In this strategy, we need two timeframes to find accurate trading opportunities. Look for an uptrend on the higher timeframe and then see the same chart on a lower timeframe. On the lower timeframe, let the price to pull back enough. When the prices gave enough pullback, draw the price channel on that pullback. If the prices break below the channel line (in an uptrend) and get knocked back immediately, it is a sign for us to go long. When this happens, we can expect a brand new higher high.

As you can see in the image below, the pair was in an overall downtrend. During the pullback phase, price action tries to break the price channel but get knocked back immediately. It means that some buyers are trying to take the price higher, but the aggressive sellers are grabbing the opportunity to fill a few more orders. After the fake-out, prices held inside the price channel for a bit, and after a few hours, we witnessed a brand new lower low.

Breakouts + Channel

Breakout trading is the most common yet effective approach to take high probability trades. Firstly, find an up-trending market and draw a price channel. Wait for the price to approach any significant level and break below the price channel to take the trade. When the price action goes below the channel line, it is a sign for us to go short. Similarly, in a downtrend, draw the price channel and let the price approach any significant level to take the breakout trade. After the breakout, go long and place the stops just below your entry. If the price holds after the breakout, it is a great sign to take the trade.

The image below represents a sell trade in the GBP/AUD Forex pair. As you can see, the prices were in an uptrend, and when the sellers broke below the price channel, we took a sell trade. We choose a smaller stop-loss order as the channel line also acts as dynamic support to the prices. For booking profits, a higher timeframe support area was a perfect place.

Conclusion

Trading Channels are effective as they provide numerous trading opportunities when the market is moving in that state. You can use all the mentioned ways stated above to trade a channel or use the method that best works for you. When trading, the channel always trade with the trend. Do not over trade whatsoever. If you get used to it, sooner or later, you will blow your trading account. Don’t do this. Instead, always follow the trend. The trend is your friend. Let the market pullback to the channel line to trade with the trend. Another approach is to wait for the prices to break the channel to trade the reversals. These simple approaches are healthier ways to grow your trading account while trading channels. All the best!

Categories
Forex Elliott Wave Forex Market Analysis

Beware of these Supply and Demand Zones on the GBPJPY

The short-term overview for the GBPJPY pair reveals the sideways movement in a trading range bounded by its 90-day high and low range between levels of 133.040 and 142.714. The cross recently developed a rally that found resistance in the bullish sentiment zone resistance located on 140.296, where the GBPJPY presents a set of scenarios.

Technical Overview

The following 12-hour chart illustrates the short-term market participants’ sentiment bounded by the 90-day high and low range. The figure presents a bullish bias that remains active since the GBPJPY found fresh buyers on 133.040.

After the cross found resistance at 140.296, the price action retraced it until a neutral zone located on 137.877, forming an intraday sideways channel that suggests a pause in the short-term bullish cycle.

On the other hand, the following figure unveils that the retail traders’ market sentiment is positioned on the bearish side. As the chart shows, 75% of retail traders hold their positioning on the sell-side, which is contrarian.

(source: myfxbook.com)

In this context, we can see that numerous retail traders are expecting a downward movement, while the price action remains moving in the bullish sentiment without exposing a reversal pattern. Thus, it is plausible the GBPJPY pair could develop a new upward movement.

Short-term Technical Outlook

The short-term Elliott Wave view shows a movement inside an incomplete corrective wave of Minor degree, labeled in green, which could be in its wave C

The following chart shows the price action developing an upward corrective rally, which could correspond to a wave (ii) or (b) of Minute degree identified in green. In this context, the following movement should correspond to wave (iii) or (c).

Under this scenario, if the supply zone between 139.831 and 140.315 confirms the end of the current second segment, in blue, GBPJPY should begin a decline to the first demand zone between 137.594 and 137.196. Moreover, the market action could extend its down move toward the next demand zone between 134.997 and 134.404.

An alternative scenario considers the possibility of the price extending its advance beyond the 140.315 level. In this case, the GBPJPY could find fresh sellers in the next supply zone between 141.759 and 142.714. The pair could complete its wave B in green and start to weaken, developing the wave C subdivided into a five-wave sequence with a potential target in the demand zones identified in green.

Finally, the invalidation level of the bearish scenario is set above the origin of wave A in green at 142.714

Categories
Crypto Market Analysis

Daily Crypto Review, Nov 26 – Bitcoin’s “Flash Crash” Pulls Price Below $18,000; Blood on the Crypto Streets

The cryptocurrency sector has ended the day in the red as Bitcoin failed to stay above $19,000 and even falling below $18,000 as bears took control of the market. The largest cryptocurrency by market cap is currently trading for $17,000, representing a decrease of 10.67%% on the day. Meanwhile, Ethereum is losing 15.34% on the day, while XRP lost 16.88%.

 Daily Crypto Sector Heat Map

Zilliqa 23.75% in the past 24 hours, making it the most prominent daily gainer in the top100. It is closely followed by Horizen’s gain of 18.71% and Elrond’s 11.54% gain. On the other hand, Verge lost 24.86%, making it the most prominent daily loser. Kusama lost 15.78% while Reserve Rights lost 13.81%, making them the 2nd and 3rd most prominent daily losers.


Top 10 24-hour Performers (Click to enlarge)

Bottom 10 24-hour Performers (Click to enlarge)

Bitcoin’s market dominance has increased over the day, with its value currently staying at 62.2%. This value represents a 0.6% difference to the upside compared to the value it had yesterday.

Daily Crypto Market Cap Chart

The crypto sector capitalization has decreased over the course of the day. Its current value is $560.17 billion, representing an $11.36 billion decrease compared to our previous report.

_______________________________________________________________________

What happened in the past 24 hours?

_______________________________________________________________________

_______________________________________________________________________

Technical analysis

_______________________________________________________________________

Bitcoin

The largest cryptocurrency by market cap has created a double top, which triggered a pullback from the recent highs. Not only has the price retraced to the sub-$19,000 level, but it has also broken the $18,500 support level. The price will most likely end up below the $17,850 level, as the market is calling for a pullback for quite some time. However, if the market recovers, we can expect the price to end up between $17,850 and $18,500.

While shorting Bitcoin might be a good profit-making opportunity at the moment, trading against the long-term trend is extremely risky. However, thinking about hedging versus any downturns might be a good option at the moment.

BTC/USD 1-hour Chart

Bitcoin’s 4-hour, daily, and weekly technicals are heavily tilted towards the buy-side and show no signs of neutrality or bearishness. On the other hand, its monthly technicals are showing some signs of neutrality.

BTC/USD 1-day Technicals

Technical factors (1-hour Chart):
  • Price is far below its 50-period EMA and its 21-period EMA
  • Price slightly below its lower Bollinger band
  • RSI is extremely oversold (23.98)
  • Volume is average (one candle spike)
Key levels to the upside          Key levels to the downside

1: $18500                                  1: $17,850

2: $19000                                  2: $17,450

3: $19500                                   3: $17,000

Ethereum

While Ethereum did follow Bitcoin to the downside, both in price direction and severity of the move, the situation doesn’t look that bad. The second-largest cryptocurrency by market cap has started its pullback after failing to stay above $600, culminating in a full-blown dump from $570 to $505. However, the ascending (red) line held up, and ETH reclaimed previous levels and is currently consolidating around $530.

Ethereum’s current outlook is very bullish, but any sharp move to the downside coming from Bitcoin will affect it in a major way. Traders should pay close attention to Bitcoin’s moves if they want to trade Ether.

ETH/USD 1-hour Chart

Ethereum’s technicals are a bit confusing, as its daily and monthly overviews are completely bullish, while its weekly overview shows slight signs of neutrality. Its 4-hour technicals, however, are pointing towards the sell-side.

ETH/USD 1-day Technicals

Technical Factors (4-hour Chart):
  • The price is below both its 50-period and its 21-period EMA
  • Price is below its bottom Bollinger band
  • RSI is extremely oversold (19.47)
  • Volume is above average
Key levels to the upside          Key levels to the downside

1: $600                                     1: $510

2: $630                                     2: $500 

3: $735                                      3: $490

Ripple

The fourth-largest cryptocurrency by market cap has performed similarly to the aforementioned two cryptocurrencies. XRP has posted lower highs three times in a row while testing the $0.625 support level each time. However, the last time XRP went towards this level, bears took over and pushed the price further down. XRP bears have seemingly reached exhaustion, and the cryptocurrency is now consolidating around the $0.575 level.

Trading XRP is not advised as trading Bitcoin is (at the moment) both potentially more profitable and more straightforward.

XRP/USD 1-hour Chart

XRP’s technicals on all time-frames are tilted towards the buy-side, with its daily overview being the most bullish time-frame. Its other time-frames show signs of neutrality or even slight bearishness.

XRP/USD 1-day Technicals

Technical factors (4-hour Chart):
  • The price is far below both its 50-period EMA and its 21-period EMA
  • Price is slightly below its bottom Bollinger band
  • RSI is close to being oversold (31.85)
  • Volume is above average
Key levels to the upside          Key levels to the downside

1: $0.625                                   1: $0.475

2: $0.79                                     2: $0.443

3: $0.963                                  3: $0.4


Categories
Forex Market Analysis

Daily F.X. Analysis, November 26 – Top Trade Setups In Forex – Thanksgiving Day! 

The economic calendar is a bit muted amid the Thanksgiving holiday. Most Forex brokers remain open for every holiday except Christmas and New Year’s Day. Stock markets and banks have slightly different holiday schedules. In addition to this, the eyes will remain on ECB Monetary Policy Meeting Accounts during the European session. It’s a detailed record of the ECB Governing Board’s most recent meeting, providing in-depth insights into the economic conditions that influenced their decision on where to set interest rates. 

Economic Events to Watch Today  


EUR/USD – Daily Analysis

The EUR/USD pair closed at 1.19136 after placing a high of 1.18959 and a low of 1.18334. EUR/USD pair extended its upward momentum on Wednesday amid the broad-based U.S. dollar weakness and the rising optimism around the market. 

The risk sentiment was triggered by the latest vaccine development that suggested a quick economic recovery and pushed riskier assets like EUR/USD pair on the higher levels. The currency pair EUR/USD rose and placed fresh highs on Wednesday after reaching its highest level since mid-August.

The U.S. dollar was weak on Wednesday after the release of mixed and depressing data from the U.S. The Unemployment claims rose unexpectedly and weighed on the U.S. dollar, and supported the upward momentum in EUR/USD pair.

On the data front, there was no data from the Europe side on Wednesday, while from the U.S., at 18:30 GMT, the Prelim Gross Domestic Product for the third quarter came in line with the anticipations of 33.1%. The Unemployment Claims from last week rose to 778K against the projected 732K and weighed on the U.S. dollar. The Core Durable Goods Orders for October rose to 1.3% against the estimated 0.5% and supported the U.S. dollar. The Durable Goods Orders also rose to 1.3% from the projected 1.0% and helped the U.S. dollar. The Goods Trade Balance from the U.S. for October came in as forecasted -80.3B. The Prelim Wholesale Inventories for October rose to 0.9% against the estimated 0.4% and weighed on the U.S. dollar that added strength to EUR/USD pair.

At 18:36 GMT, the Prelim GDP Price Index for the third quarter also remained as expected at 3.6%. At 20:00 GMT, the Revised UoM Consumer Sentiment for November also came in line with the projections of 76.9. The Core PCE Price Index for October remained flat with the predictions of 0.0%. The New Home Sales for October surged to 999K against the anticipated 972K and supported the U.S. dollar. The Personal Income declined to -0.7% from the projected 0.0% and weighed on the U.S. dollar added in the gains of EUR/USD pair. The Personal Spending raised to 0.5% from the forecasted 0.4% and supported the U.S. dollar. The Revised UoM Inflation Expectations also came in line as expected at 2.8%.

On Wednesday, the European Central Bank released its review on the economy’s financial stability. The central bank warned that European banks would not see profits return to the pre-pandemic level before 2022. According to ECB, the Eurozone leaders have struggled to make sizeable profits over the last decade after the 2008 global financial crisis with more robust regulatory scrutiny and low-interest rates. While the recent coronavirus crisis has worsened bottom lines further, and that will continue to affect the financial sector in the coming months.

In simple words, the banks’ profitability will remain weak, which could hurt their ability to lend money to businesses and individuals that would also reflect the economy’s weak health. These comments from ECB failed to break the upward momentum of the EUR/USD pair on Wednesday.

Daily Technical Levels

Support   Resistance

1.1888     1.1936

1.1861     1.1957

1.1841     1.1984

Pivot point: 1.1909

EUR/USD– Trading Tip

The EUR/USD is trading with a bullish bias at the 1.1936 level, holding below an immediate resistance level of 1.1979. On the higher side, the EUR/USD pair may find resistance at 1.1979, and a bullish breakout of 1.199 level can extend the upward trend until 1.1942. On the 2 hour timeframe, the EUR/USD pair has violated the symmetric triangle pattern that was extending resistance at the 1.19052 level, and now this level is working as a support. Let’s consider taking a buying trade over the 1.1905 level, and above this, the next target stays at 1.1997.


GBP/USD – Daily Analysis

The GBP/USD pair closed at 1.33864 after a high of 1.33935 and a low of 1.33037. GBP/USD pair extended its gains for the 4th consecutive session on Wednesday amid the U.S. dollar weakness and the rising global market confidence due to vaccine progress. Meanwhile, the currency pair GBP/USD also remained under pressure on Wednesday after the Brexit uncertainty returned to the market.

The GBP/USD pair has been trading with an upside bias since the start of this week due to rising optimism in the market regarding the latest vaccine developments. Pfizer and BioNtech first reported its vaccine’s efficacy rate, followed by Moderna and AstraZeneca within two weeks. The back to back vaccine progress and the fact that Pfizer and BioNtech have already filed for emergency use authorization of their vaccine and others being in line for it has further supported the market’s risk sentiment.

The risk perceived GBP/USD pair gained traction and saw a jump in demand on expectations that the U.K. and the E.U. were getting closer to reaching a deal on Brexit. However, on Wednesday, the lack of recent progress raised uncertainty in the market and weighed on British Pound.

The French Foreign Minister Jean-Yves Le Drian recently commented that British proposals in the latest negotiations were insufficient. He also accused the U.K. of slowing talks over secondary subjects and playing with the calendar. He urged that securing a deal over fisheries will not be the adjustment variable in the talks.

Meanwhile, a BBC reporter Katya Adler also tweeted that E.U. sources have said that there were doubts about the E.U. Brexit negotiator Michelle Barnier going to London to negotiate once he leaves quarantine on Friday and that the talks were not going well. These updates were also confirmed by the President of the European Commission, Ursula von der Leyen, who said on Wednesday morning that she could not say if there will be a deal and the next few days would be decisive.

All this Brexit news dented the expectations that the two sides will eventually reach a deal on key sticking points. However, market participants decided not to react to such news for Wednesday and continued following the market’s optimism.

On the data front, at 18:30 GMT, the Prelim Gross Domestic Product for the third quarter remained flat with the expectations of 33.1%. The Unemployment Claims from last week surged to 778K against the anticipated 732K and weighed on the U.S. dollar. 

The Core Durable Goods Orders for October raised to 1.3% against the forecasted 0.5% and supported the U.S. dollar. The Durable Goods Orders increased to 1.3% from the estimated 1.0% and helped the U.S. dollar. The Goods Trade Balance from the U.S. for October remained flat at -80.3B. The Prelim Wholesale Inventories for October raised to 0.9% against the projected 0.4% and weighed on the U.S. dollar that added strength to GBP/USD pair.

At 18:36 GMT, the Prelim GDP Price Index for the third quarter also came in line with the projections of 3.6%. At 20:00 GMT, the Revised UoM Consumer Sentiment for November also remained flat at 76.9. The Core PCE Price Index for October stayed the same at 0.0%. The New Home Sales for October raised to 999K against the estimated 972K and supported the U.S. dollar. The Personal Income fell to -0.7% from the forecasted 0.0% and weighed on the U.S. dollar added in the GBP/USD pair’s gains. The Personal Spending rose to 0.5% from the projected 0.4% and supported the U.S. dollar. Revised UoM Inflation Expectations also remained flat at 2.8%.

Daily Technical Levels

Support   Resistance

1.3325     1.3416

1.3269     1.3451

1.3235     1.3507

Pivot Point: 1.3360

GBP/USD– Trading Tip

The GBP/USD is trading bullish around 1.3396 level, facing resistance at 1.3400 level. The resistance level is extended by the double top pattern at 1.3400 level, and a bullish crossover of 1.3400 level is likely to open further room for buying until 1.3446 level. On the 4 hour timeframe, the GBP/USD pair has formed a bullish channel that supports the pair at the 1.333 area. The RSI and MACD are suggesting a buying trend in sterling. However, I will prefer to open a buying trade over the 1.3396 area today. 


USD/JPY – Daily Analysis

The USD/JPY pair closed at 104.456 after a high of 104.596 and a low of 104.253. The USD/JPY pair stayed relatively low, around 104.5 level for the majority of the day, and remained more down during the American trading hours due to mixed macroeconomic data releases from the U.S.

The U.S. Dollar Index (DXY) edged lower in the late American session, remained at the 91.97 level, and kept the U.S. dollar depressed. On the data front, at 18:30 GMT, the Prelim Gross Domestic Product for the third quarter remained flat at 33.1%. The Unemployment Claims from last week rose to 778K against the expected 732K and weighed on the U.S. dollar. The Core Durable Goods Orders for October rose to 1.3% against the expected 0.5% and supported the U.S. dollar. The Durable Goods Orders surged to 1.3% from the anticipated 1.0% and helped the U.S. dollar. 

The Goods Trade Balance from the U.S. for October remained flat with the expectations of -80.3B. The Prelim Wholesale Inventories for October rose to 0.9% against the estimated 0.4% and weighed on the U.S. dollar.

At 18:36 GMT, the Prelim GDP Price Index for the third quarter remained flat at 3.6%. At 20:00 GMT, the Revised UoM Consumer Sentiment for November stayed at 76.9. The Core PCE Price Index for October came in line with the expectations of 0.0%. The New Home Sales for October surged to 999K against the projected 972K and supported the U.S. dollar. The Personal Income dropped to -0.7% from the expected 0.0% and weighed on the U.S. dollar. The Personal Spending surged to 0.5% from the forecasted 0.4% and supported the U.S. dollar. The Revised UoM Inflation Expectations also came in line with the anticipations of 2.8%.

The rising unemployment claims and declined personal income weighed on the local currency while the durable goods orders and new home sales, along with the personal spending, supported the U.S. dollar on Wednesday.

Meanwhile, from the Japanese side, the year’s SPPI declined to -0.6% from the forecasted -0.5% and weighed on the Japanese Yen. At 09:59 GMT, the BoJ Core CPI for the year raised to 0.0% from the forecasted -0.1% and supported the Japanese Yen that added weight on the USD/JPY pair on Wednesday.

The currency pair USD/JPY remained bullish throughout the day despite the U.S.’s mixed economic data on the back of rising optimism in the market. The global market sentiment remained confident due to the rising number of vaccine candidates reporting progress. The race to file for emergency use authorization of vaccine started with Pfizer and BioNtech has extended to AstraZeneca and Moderna that has helped raised hopes for a pre-pandemic economic environment and supported the risk sentiment.

The rising risk sentiment added weight on the safe-Haven Japanese Yen and supported the USD/JPY pair’s upward momentum on Wednesday. Another factor involved in the USD/JPY pair’s upward movement was the beginning of the transition of the presidency of President-elect Joe Biden.

Daily Technical Levels

Support   Resistance

104.27     104.63

104.09     104.79

103.92     104.98

Pivot point: 104.44

USD/JPY – Trading Tips

The USD/JPY continues to trade in a fresh choppy range of 104.700 – 104.056 level. On the higher side, a bullish breakout of 104.700 resistance can extend the buying trend until the next resistance area of 104.700 and 105.063 level. On the lower side, the support continues to hold around 104.056 and 103.667 level. The MACD suggests an overbought situation of the USD/JPY pair; thus, we should look for selling trade below 104.598 and buying above the same. Good luck! 

Categories
Forex Videos

Forex – Overbought & Oversold – Easy Market Reversal Strategy!


Overbought and oversold, how can you tell when the market will reverse? 


Thank you for joining this forex academy educational video.

In this session, we will be looking at when a currency pair is overbought or oversold and how to take advantage of this.

To try and gauge the best way wait to take advantage of when a market is overbought or oversold, we must first take a look at the biggest by volume currency pair traded in the forex market: the Euro against the US dollar, a so-called major currency pair. And this is a one-hour chart of recent price action.

To establish when a pair is oversold or overbought, there are a multitude of tools available. We will focus on one oscillator and price patterns. 

First of all, we have the stochastic oscillator.  This tool consists of two moving averages that crossover at certain points, and when they move up and cross the 80-line, an asset is said to be overbought, and when the moving averages move lower and under than the 20-line, it is said to be oversold.

One of the problems with the stochastic oscillator, as we can see here, if we draw a magenta coloured vertical line, the market is actually oversold at the halfway point between the peak and the trough of this move.  The pair continues to move lower after it is oversold. This is common with the stochastic.

…in this example, it has moved lower by a further 41 pips after showing as oversold, before price action eventually does turn around and move higher, and it is then when the stochastic begins to comply with the price action.

One way that professional traders will guard against using the stochastic oscillator to get into a trade too early is to wait until the indicator has gone above the 80 and its moving averages have crossed over and moved under the line before they enter a short trade, or have moved under the 20 line, crossed over, and moved up above the line before they will enter a long trade. 

Professional traders will very rarely use a single indicator such as the stochastic on its own to enter a trade.

In this A B C scenario, we have more clues about potential future price direction.  First, we have the stochastic showing oversold at position A, and when price action reverts higher to position B, price action appears to stay inflated and ignores the stochastic, initially. However, when price moves lower at position C, we have a divergence in the stochastic and price action, where the stochastic has moved lower to the 20% line, and price action at position C has not moved lower to the level at position A. It has formed a higher low, and this is an indication in itself that price action may be fading to the downside, especially when coupled with the hesitation to move lower at position B, and whereby a bear candle spike outside of the Bollinger band at position C is another hint that price action may move back inside the bands, because, as you will probably know, 95% of price action will revert inside the Bollinger bands if it spikes outside.

This setup, simply by using the stochastic to show oversold, where its moving averages have moved under the 20 line, then crossed over and moved higher than the 20-line, plus divergence in price action, and a higher low set up, and a candle spike outside the Bollinger bands has been the set up for this bull trade which saw 140 pips to the upside.

Simply look out for this setup in reverse to take on a bear trade.


Categories
Forex Market Analysis

EURCAD Looks Bouncing from Demand Zone

The EURCAD cross is still moving in a likely incomplete triangle pattern, developing since mid-March when the price found resistance on 1.59914. As pictured by the following 12-hour chart, the mid-term Elliott Wave structure shows the incomplete progress of a contracting triangle of Minor degree labeled in green.

Technical Overview

According to the Elliott wave theory, the triangle pattern follows an internal structure subdivided into 3-3-3-3-3 waves. In this context, the EURCAD triangle appears to be completing its third internal segment and start developing a new rally corresponding to wave D of Minor degree, identified in green.

On the other hand, considering the Alternation Principle, and in view that the movement developed by the wave C, in green seems like a complex corrective sequence, which took an extended time span, the following move -corresponding to wave D, could develop in a shorter time range. In this regard, it is possible that the cross would create an aggressive rally.

Short-term Technical Outlook

The short-term view displayed in its 12-hour chart (shown above) shows that the EURCAD reacted mostly upward in the demand zone identified in green between 1.54535 and 1.54273. This situation leads to expect that market participants could continue pushing it higher.

An alternative scenario considers the possibility of a new limited decline toward the next demand zone between 1.53688 and 1.53130. In this zone, the cross could find fresh buyers and complete its wave C of Minor degree, identified in green.

On the other hand, before taking any position on the bullish side, it is convenient to wait for the descending upper-line breakout that connects the waves (ii) and (iv). This would confirm the cross’s bullish bias. As for the targets, the suggested following movement, corresponding to wave D, in green, could rise till the next supply zone, located between 1.59139 and 1.59791.

Finally, the bullish scenario has its invalidation level at the end of wave A in green, located at 1.50562

Categories
Forex Elliott Wave Forex Market Analysis Forex Technical Analysis

Would you Trade this CADJPY Pattern?

The CADJPY cross moved up in the Tuesday trading session, boosted by the stock market’s risk-on sentiment. Although the cross advances 2.25% during the current month, the price is under -4% (YTD).

Technical Overview

The CADJPY prices represented in the next 12-hour chart reveal the short-term market participants’ sentiment moving in the 90-day high and low range. The figure illustrates the cross advancing mostly upward in the bullish sentiment zone.

On the other hand, the previous chart presents a contracting triangle, which began in early June when CADJPY found fresh sellers on 81.909, followed by a first support level at 77.614. According to the classic chartist theory, the triangle pattern distinguishes itself as a continuation formation. In this case, this contracting triangle suggests further upsides.

In this regard, the likely next move could lead to a test of its intraday resistance of 80.591: this level corresponds to the bullish sentiment zone’s resistance, as well. If the price overcomes it and extends its upward advance, the cross could reach its supply zone between 80.985 and 81.424, a level that matches the triangle pattern’s upper trendline.

Conversely, a downward correction could drop it to its demand zone between 79.468 and 79.237.

Short-term Technical Outlook

The short-term Elliott Wave view for the CADJPY cross displayed in the next 4-hour chart reveals the advance in an incomplete internal structural series of a contracting triangle pattern, which currently advances developing its wave (e) of Minuette degree, labeled in blue.

The previous chart presents the price advancing in the wave b of Subminuette degree, identified in blue, which belongs to wave (e), also in blue. According to the Elliott Wave theory, the triangle pattern follows an internal sequence subdivided into 3-3-3-3-3 waves. In this context, and observing its advance in the triangle formation, the cross could develop its latest decline before starting a rally that corresponds to wave ((c)) of Minute degree, labeled in black.

The current downward move, corresponding to wave c, in green, could reach two potential demand zones. The first one is located between 79.468 and 79.237, whereas the second one is seen from 78.878 to 78.394.

Once CADJPY starts to get fresh buyers, the cross could experience a strong rally and test June’s high zone of 81.909.

Finally, the bullish scenario has its invalidation level below the wave (a) of Minuette degree in blue located at 77.585, under the contracting triangle pattern limits.

Categories
Crypto Market Analysis

Daily Crypto Review, Nov 25 – Bitcoin Above $19,000: What’s Next?

The cryptocurrency sector has spent the day pushing towards the upside as Bitcoin rallied and reached past $19,000. The largest cryptocurrency by market cap is currently trading for $19,093, representing an increase of 4.37% on the day. Meanwhile, Ethereum lost 0.55% on the day, while XRP gained 14.94%.

 Daily Crypto Sector Heat Map

Verge 63.06% in the past 24 hours, making it the most prominent daily gainer in the top100. It is closely followed by Stellar’s gain of 59.30% and Status’s 31.14% gain. On the other hand, Bitcoin Gold lost 16.21%, making it the most prominent daily loser. SushiSwap lost 12.05% while Balancer lost 7.89%, making them the 2nd and 3rd most prominent daily losers.

Top 10 24-hour Performers (Click to enlarge)

Bottom 10 24-hour Performers (Click to enlarge)

Bitcoin’s market dominance has increased over the course of the day, with its value is currently staying at 61.06%. This value represents a 1% difference to the upside compared to the value it had yesterday.

Daily Crypto Market Cap Chart

The crypto sector capitalization has increased slightly over the course of the day. Its current value is $571.53 billion, representing an $8.86 billion increase compared to our previous report.

_______________________________________________________________________

What happened in the past 24 hours?

_______________________________________________________________________

_______________________________________________________________________

Technical analysis

_______________________________________________________________________

Bitcoin

The largest cryptocurrency by market cap has had an exciting day as its price reached past the $18,500 mark and pushed towards its all-time highs. Bitcoin managed to get to $19,450 before the momentum started dying off. It is currently consolidating just at the $19,000 mark, fighting to stay above it. This move was enabled by a booming altcoin situation, which led to a money pour-over into Bitcoin.

Any trading to the downside is completely irresponsible now due to how Bitcoin is moving. On the other hand, its movement towards the upside is very hectic, and traders should pay attention to when they enter and exit trades. If Bitcoin establishes its presence above the $19,000 mark with confidence, another push that might break the $20,000 all-time high level is entirely possible.

BTC/USD 2-hour Chart

Bitcoin’s technicals are tilted to the bull-side slightly, with only the weekly time-frame being completely bullish. In contrast, its other time-frames contain a hint of neutrality or even bearishness.

BTC/USD 1-day Technicals

Technical factors (4-hour Chart):
  • Price is above its 50-period EMA and at its 21-period EMA
  • Price slightly above its middle Bollinger band
  • RSI is neutral (55.57)
  • Volume is average
Key levels to the upside          Key levels to the downside

1: $19000                                  1: $18500

2: $19500                                  2: $17,850

3: $19,666                                  3: $17,450

Ethereum

Ethereum’s parabolic move, which brought its price from $480 to $625, has seemingly ended, and Ethereum has entered a consolidation/retracement phase. While it was uncertain whether the second-largest cryptocurrency by market cap will stay above $600, the fight for the level has ended, and ETH moved back below it.

Ethereum has a very strong zone of resistance above $600 and all the way up to $632. On the other hand, it has a decently strong support zone at $575-$580. We can expect Ethereum to move in that range in the short-term unless a new breakout occurs.


ETH/USD 2-hour Chart

Ethereum’s technicals are tilted to the bull-side slightly, with only the monthly time-frame being completely bullish. In contrast, its other time-frames contain slight neutrality or even bearishness.

ETH/USD 1-day Technicals

Technical Factors (4-hour Chart):
  • The price is above its 50-period and slightly below its 21-period EMA
  • Price is near its bottom Bollinger band
  • RSI is neutral (50.82)
  • Volume is above average
Key levels to the upside          Key levels to the downside

1: $600                                     1: $510

2: $630                                     2: $500 

3: $735                                      3: $490

Ripple

The fourth-largest cryptocurrency by market cap’s controversial parabolic rise has died down and actually kept most of its gains. XRP has moved back from its recent highs of $0.78 (and even $0.9 on some exchanges) to a steadier $0.68, which is its current price. We can also see that XRP made a double top at the $0.735 mark, as well as a double bottom at the $0.625 support level.

Trading XRP is more manageable now as the volatility has died down, and the zones of support/resistance have been established. However, trading crypto overall is extremely risky at the moment, and only moves to the upside (and possibly sideways movement) should be traded.

XRP/USD 2-hour Chart

XRP’s 4-hour and daily overviews are completely bullish and show no signs of neutrality whatsoever, while its weekly and monthly overviews show slight neutrality or even a hint of bearishness.

XRP/USD 1-day Technicals

Technical factors (4-hour Chart):
  • The price is far above its 50-period EMA and slightly above its 21-period EMA
  • Price is slightly above its middle Bollinger band
  • RSI is neutral (59.98)
  • Volume is above average
Key levels to the upside          Key levels to the downside

1: $0.79                                     1: $0.625 

2: $0.963                                   2: $0.475

3: $1.01                                    3: $0.443


Categories
Forex Market Analysis

Daily F.X. Analysis, November 25 – Top Trade Setups In Forex – Unemployment Claims Eyed! 

The economic calendar is filled with medium impact economic events such as Unemployment Claims, UoM Consumer Sentiment, and Prelim GDP q/q from the United States on the news front. The market may show some price action during the U.S. session on the release of U.S. Jobless Claims.

Economic Events to Watch Today  


EUR/USD – Daily Analysis

The EUR/USD pair was closed at 1.18897 after placing a high of 1.18959 and a low of 1.18334. After placing losses for two consecutive days, the EUR/USD pair rose and started to post gains on Tuesday amid the rising optimism and risk sentiment surrounding the market.

The safe-haven appeal suffered after AstraZeneca’s latest news that its vaccine could reach a 90% efficacy rate on the second dosage from 70% in the first one. However, the EUR/USD pair traders remained confused on Tuesday and moved the currency pair between gains and losses throughout the day and ended the day with gains as optimism regarding vaccine overshadowed the U.S. dollar’s strength. The U.S. dollar was strong in the market ahead of Wall Street’s opening; however, it fell under selling pressure after the U.S. Consumer Confidence fell in November. 

On the data front, at 12:00 GMT, the German Final GDP for the third quarter raised to 8.5% against the forecasted 8.2% and supported the single currency Euro that added further gains in EUR/USD pair. AT 14:00 GMT, the German IFO Business Climate for November also raised to 90.7 against the expected 90.3 and supported EUR/USD pair. At 19:00 GMT, the Housing Price Index for September elevated to 1.7% against the projected 0.8% and supported the U.S. dollar from the U.S. side. 

The S&P/CS Composite -20 HPI for the year also surged to 6.6% against the expected 5.3% and supported the U.S. dollar that ultimately capped further gains in EUR/USD pair. At 19:59 GMT, the Richmond Manufacturing Index dropped to 15 points from the projected 20 and weighed on the U.S. dollar that added gains in EUR/USD pair. The most awaited C.B. Consumer Confidence from the U.S. was released at 20:00 GMT also fell to 96.1 against the anticipated 97.7 and weighed on the U.S. dollar that added further gains in EUR/USD pair on Tuesday.

Meanwhile, the reports that the U.S. President Trump has agreed with the transition process with Joe Biden and that the White House has given the go-ahead to Biden raised the risk sentiment and added further gains EUR/USD pair. Furthermore, the vaccine hopes also kept the market sentiment improved with the news that the new vaccine developed by AstraZeneca, a British Pharmaceutical, can provide 90% protection against the coronavirus and be cheaper against the previous Pfizer and Moderna due to its comfortable storage facility. These reports raised hopes that the global economy will start recovering now, and the riskier asset EUR/USD pair gained traction and started posting gains.

Daily Technical Levels

Support   Resistance

1.1851     1.1911

1.1814     1.1934

1.1791     1.1972

Pivot point: 1.1874

EUR/USD– Trading Tip

The EUR/USD is trading with a bullish bias at the 1.1895 level, holding below an immediate resistance level of 1.1912. On the higher side, the EUR/USD pair may find resistance at 1.1912, and a bullish breakout of 1.1912 level can extend the upward trend until 1.1942. On the 2 hour timeframe, the EUR/USD pair was supported by an upward trendline, which got violated, and now the same trendline is supporting EUR/USD pair at 1.1862. Let’s look for a selling trade below the 1.1866 level today. 


GBP/USD – Daily Analysis

The GBP/USD pair was closed at 1.33615 after a high of 1.33802 and a low of 1.32929. The currency pair GBP/USD continued its bullish movement on Tuesday for the 3rd consecutive day. The GBP/USD pair continued getting support from the British Pound’s strength after the rising Brexit optimism in the market. The hopes that a Brexit deal will be reached soon between the U.K. and the E.U. kept underpinning the Sterling and forced GBP/USD pair to remain on the market’s positive side.

Although nothing has been confirmed about the Brexit deal, the talks between both nations have been extended into this week. On Tuesday, a member of the Bank of England’s monetary policy committee said Tuesday that vaccine news had provided some light at the end of the tunnel.

He also said that he saw a long-term scarring effect from the coronavirus outbreak. He added that it was too early to say that vaccine news will significantly improve the Bank’s economic outlook for 2021. He said that even if the economy came back because of the vaccine, it would have to face the economy-Brexit’s further long-term problem.

On the data front, at 16:00 GMT, the CBI Realized Sales for November came in as -25 against the forecasted -34 and supported British Pound and added in the gains of the GBP/USD pair. At 19:00 GMT, the Housing Price Index for September rose to 1.7% against the expected 0.8% and supported the U.S. dollar from the U.S. side. The S&P/CS Composite -20 HPI for the year also raised to 6.6% against the estimated 5.3% and helped the U.S. dollar that ultimately capped further gains in GBP/USD pair. At 19:59 GMT, the Richmond Manufacturing Index fell to 15 points from the anticipated 20 and weighed on the U.S. dollar that added gains in GBP/USD pair. The most awaited C.B. Consumer Confidence from the U.S. was released at 20:00 GMT, also fell to 96.1 against the projected 97.7 and weighed on the U.S. dollar that added further gains in GBP/USD pair on Tuesday.

Furthermore, the GBP/USD pair was also supported by the latest optimism in the market that had kept the risk-on market sentiment improved. The risk perceived British Pound was supported by the risk sentiment raised by the AstraZeneca vaccine news. Its vaccine was proven to be 90% effective in the second dosage. It was said to be cheaper as it can be stored in an ordinary refrigerator compared to Pfizer, and Moderna’s vaccines that provide 95% protection against the virus were not so easy to store. This optimism also kept the market’s risk sentiment on the upper side and continued supporting the GBP/USD pair on Tuesday.

Daily Technical Levels

Support   Resistance

1.3289     1.3312

1.3274     1.3320

1.3266     1.3336

Pivot point: 1.3297

GBP/USD– Trading Tip

The GBP/USD traded bearishly at 1.3340, having bounced off over the support area of the 1.3292 level. On the higher side, the pair may go after the resistance level of 1.3394. Over there’s an upward trendline that is supporting Sterling on the 2-hour timeframe. The Cable below the 1.3292 level may find support at the 1.3240 level while the RSI and MACD support buying. Thus we should consider taking buying trade over the 1.3292 level to target 1.3394. 


USD/JPY – Daily Analysis

The USD/JPY pair was closed at 104.439 after placing a high of 104.759 and a low of 104.144. The pair USD/JPY seesawed on Tuesday as it moved in an upward direction in early trading hours and reached near 104.76 level while in the late trading session, the USD/JPY pair started to lose its earlier gains and continued its bearish bias. The selling bias in the currency pair USD/JPY raised on Tuesday after posting massive gains on Monday amid the mixed market sentiment. The safe-haven Japanese Yen was under pressure on Tuesday after the positive market mood circulated due to progress in AstraZeneca’s coronavirus vaccine.

The equity market rallied after the latest optimism regarding the 90% adequate protection against the coronavirus with a comfortable storage facility compared to Pfizer’s and Moderna vaccine’s 95% protection against the virus with a difficult storage facility. The market participants continued following the optimism and shifted towards riskier assets against the safer ones.

The equity market was also boosted on Tuesday, with Dow Jones moving up at 30,000 points and the three main indexes in Wall Street rising by 1.5% each. The risk rally in Wall Street added pressure on the safe-haven Japanese Yen and supported the USD/JPY pair’s upward momentum on Tuesday. The USD/JPY pair could not remain on the upper side for long and started to lose its earlier gains after releasing the U.S. Macroeconomic data. At 19:00 GMT, the Housing Price Index for September from the U.S. rose to 1.7% against the anticipated 0.8% and supported the U.S. dollar. The S&P/CS Composite -20 HPI for the year also raised to 6.6% against the estimated 5.3% and helped the U.S. dollar. At 19:59 GMT, the Richmond Manufacturing Index was dropped to 15 points from the forecasted 20 and weighed on the U.S. dollar that added pressure on the USD/JPY pair. The most awaited C.B. Consumer Confidence from the U.S. was also released at 20:00 GMT that fell to 96.1 against the estimated 97.7 and weighed on the U.S. dollar that ultimately added in the losses of the USD/JPY pair on Tuesday.

The decline in Consumer Confidence in November weighed on the local currency U.S. dollar as the rising number of coronavirus cases in the U.S. was raising questions over the economic recovery in the absence of further stimulus aid. The talks were set to resume between Republicans and Democrats to discuss the possibility of delivering an additional aid package in December.

Furthermore, the latest news from the White House that the U.S. President-elect Joe Biden was formally given the go-ahead by the federal agency to begin his transition to the presidency also capped further losses in the USD/JPY pair on Tuesday. The U.S. General Services Administration (GSA), an independent agency, determined that Biden was the outward winner of the election and informed Biden that his transition until January 20 could officially begin. The go-ahead was given by the White House to Biden to intensify the fight against the coronavirus. All these positive news kept the risk-on market sentiment supported and continued supporting the USD/JPY pair.

Daily Technical Levels

Support   Resistance

103.76     103.87

103.69     103.93

103.64     103.99

Pivot point: 103.81

USD/JPY – Trading Tips

The USD/JPY continues to trade in a fresh choppy range of 104.700 – 104.056 level. On the higher side, a bullish breakout of 104.700 resistance can extend the buying trend until the next resistance area of 104.700 and 105.063 level. On the lower side, the support continues to hold around 104.056 and 103.667 level. The MACD suggests an overbought situation of the USD/JPY pair; thus, we should look for selling trade below 104.598 and buying above the same. Good luck! 

Categories
Forex Elliott Wave Forex Market Analysis

Is the US Dollar Index Ready for a Bounce?

The US Dollar Index (DXY) advances in the extreme bearish sentiment zone finding an intraday support on Monday’s trading session at 92.016. During this intraday bounce, the price jumped to the extreme bearish zone’s resistance, where the price action started to consolidate. Even considering this intraday recovery, the Greenback accumulates losses of nearly 4.40% (YTD).

Technical Overview

The US Dollar Index, represented in its 8-hour chart, shows the market sentiment’s participants moving within its 90-high and low range, and it reveals the bearish pressure on the Greenback. In this regard, as long as the price keeps moving below 92.663, the short-term trend should stay mostly bearish.

On the other hand, the big picture under the Elliott Wave perspective illustrated in its 8-hour chart reveals the progress in an incomplete corrective formation, which could correspond to a flat pattern.

According to the wave theory, the flat pattern follows an internal sequence subdivided into 3-3-5. In this case, the Greenback should advance in a rally in a wave ((c)) of Minute degree identified in black subdivided into five segments.

An alternative scenario considers the possibility of a triangle pattern (3-3-3-3-3) or a double-three (3-3-3) in progress. However, the structure observed until this point doesn’t allow us to confirm or discard any of these potential Elliott wave formations.

Short-term Technical Outlook

The Greenback in its 4-hour range unveils the completion of the wave ((b)) of Minute degree labeled in black in the demand zone between 92.019 and 91.750, where the price bounced from on Monday’s trading session until 92.800.


Once the price reacted mostly upward, the US Dollar Index began to decline in a wave ii or B of Subminuette degree identified in green. In this regard, a bullish confirmation should lead us to expect further upward movements that could boost the price toward the next supply zone between 93.343 and 93.545.

If the Elliott wave formation corresponds to a Flat pattern, the price could surpass the supply zone level of 94.303 and seek to test the end of wave ((a)) located on 94.742.

On the other hand, we should be aware that a rally in the US Dollar Index implies a potential drop in the pairs against the US Dollar, for example, EURUSD or GBPUSD.

Finally, the return to a  bullish scenario holds its invalidation level at 92.016, which corresponds to the bottom of the first upwards move identified in green.

Categories
Forex Signals

GBP/USD Bounces off Upward Trendline Support – Quick Update on Signal

The GBP/USD pair closed at 1.33222 after a high of 1.33975 and a low of 1.32636. The British Pound raised to its 10-weeks high level and then gave up some gains against the U.S. dollar in late trading sessions on the back of U.S. dollar strength. The rise in GBP/USD pair came in after the rising optimism over a Brexit deal after the European Commission reportedly told E.U. ambassadors that 95% of a post-Brexit deal had been agreed.

Daily Technical Levels

Support Resistance

1.3289 1.3312

1.3274 1.3320

1.3266 1.3336

Pivot point: 1.3297

The GBP/USD traded bearishly at 1.3290, but it now seems to bounce off over the support area of the 1.3292 level. On the higher side, the pair may go after the resistance level of 1.3394. Over there’s an upward trendline that is supporting Sterling on the 2-hour timeframe. Below the 1.3292 level, the Cable may find support at the 1.3240 level while the RSI and MACD are in support of buying. Thus we should consider taking buying trade over the 1.3292 level to target 1.3394. 


Entry Price – Buy 1.33583

Stop Loss – 1.33631

Take Profit – 1.33983

Risk to Reward – 1:1

Profit & Loss Per Standard Lot = -$400/ +$400

Profit & Loss Per Micro Lot = -$40/ +$40

Fellas, now you can check out forex trading signals via Forex Academy mobile app. Follow the links below.

iPhone Users: https://apps.apple.com/es/app/fasignals/id1521281368

Andriod Users: https://play.google.com/store/apps/details?id=academy.forex.thesignal&hl=en_US

Categories
Crypto Market Analysis

Daily Crypto Review, Nov 24 – XRP’s Push to $0.9 Manipulated? Ether Breaks $600 on Amazing News

The cryptocurrency sector has spent been in the green overall, with Bitcoin consolidating and altcoins booming. The largest cryptocurrency by market cap is currently trading for $18,364, representing a decrease of 0.36% on the day. Meanwhile, Ethereum gained 4.23% on the day, while XRP gained a whopping 54.14%.

 Daily Crypto Sector Heat Map

Stellar 61.98% in the past 24 hours, making it the most prominent daily gainer in the top100. It is closely followed by XRP’s gain of 52.19% and Verge’s 37.77% gain. On the other hand, SushiSwap lost 11.14%, making it the most prominent daily loser. Quant lost 9.44% while Nexo lost 8.27%, making them the 2nd and 3rd most prominent daily losers.

Top 10 24-hour Performers (Click to enlarge)

Bottom 10 24-hour Performers (Click to enlarge)

Bitcoin’s market dominance has reduced drastically over the course of the day, with its value is currently staying at 60.06%. This value represents a 2.6% difference to the downside compared to the value it had yesterday.

Daily Crypto Market Cap Chart

The crypto sector capitalization has increased significantly over the course of the day. Its current value is $562.75 billion, representing a $21.04billion increase compared to our previous report.

_______________________________________________________________________

What happened in the past 24 hours?

_______________________________________________________________________

_______________________________________________________________________

Technical analysis

_______________________________________________________________________

Bitcoin

The largest cryptocurrency by market cap has stayed pretty stable today as it couldn’t break the $18,500 mark. The price has been hovering right under the level for the whole day, and even made a couple of attempts to break it but to no avail. On the other hand, this small zone of resistance and support wasn’t broken to the downside either, as a break below $18,270 could spell a retracement.

This is a prime example of uncertainty due to Bitcoin’s current level (some are taking profits while some are investing). However, trading pullbacks in a bull trend is extremely risky and should be avoided.

BTC/USD 4-hour Chart

Bitcoin’s technicals are divided, with its daily and monthly overviews showing a slight hint of bearishness alongside the bullishness that overwhelms it. In contrast, the 4-hour and weekly overviews are completely bullish.

BTC/USD 1-day Technicals

Technical factors (4-hour Chart):
  • Price is above its 50-period EMA and at its 21-period EMA
  • Price is at its middle Bollinger band
  • RSI is neutral (53.88)
  • Volume is average
Key levels to the upside          Key levels to the downside

1: $18500                                  1: $17,850

2: $19000                                  2: $17,450

3: $19500                                   3: $17,130

Ethereum

With Ethereum’s 2.0 version 0 launch approaching, Ethereum has continued to increase in price. Today’s move was a continuation of the uptrend that started on Nov 0, additionally fueled by the announcement that the deposits required for Ethereum’s 2.0 version 0 to launch have passed the threshold. This news is a big sigh of relief for the ETH devs, as they were wondering if the protocol will reach its goal on time for the Dec 1 launch. This extremely bullish news has pushed Ethereum past $600, which it is now testing.

If Ethereum manages to successfully stay above $600, it will have very little resistance to the upside and basically trade only versus profit-taking sellers.

ETH/USD 1-hour Chart

Ethereum’s 4-hour and monthly time-frames are completely bullish, while its daily and weekly time-frames are slightly more tilted towards the neutral position.

ETH/USD 1-day Technicals

Technical Factors (4-hour Chart):
  • The price is far above its 50-period and slightly above its 21-period EMA
  • Price is between its middle and top Bollinger band
  • RSI is coming out of the overbought territory (59.88)
  • Volume is above average
Key levels to the upside          Key levels to the downside

1: $600                                     1: $510

2: $630                                     2: $500 

3: $735                                      3: $490

Ripple

The fourth-largest cryptocurrency by market cap has exploded to the upside and reached over $0.90 on the US cryptocurrency exchange Coinbase only to crash back down by roughly 30% in mere seconds. This was its highest price since May 2018. The rally was apparently driven by the Coinbase users as XRP did not see the same heights on any other exchange. Bitstamp and Binance saw a high of only $0.79.

Analysts believe that this rally is a culmination of an uptrend triggered in late Oct when an anonymous whale sent an astonishing $50 million worth of XRP at the time to Bitstamp. Ever since then, XRP/USD has been seeing a strong uptrend, up by 128.63% in the past week.

Trading XRP is simply impossible at the moment due to the amount of risk associated with this type of volatility.

XRP/USD 1-hour Chart

XRP’s 4-hour and weekly overviews are completely bullish and show no signs of neutrality, while its daily and monthly overviews show slight neutrality or even slight bearishness.

XRP/USD 1-day Technicals

Technical factors (4-hour Chart):
  • The price is above its 50-period EMA and at its 21-period EMA
  • Price is slightly above its middle Bollinger band
  • RSI is neutral (53.65)
  • Volume is above average
Key levels to the upside          Key levels to the downside

1: $0.79                                     1: $0.625 

2: $0.963                                   2: $0.475

3: $1.01                                    3: $0.443


Categories
Forex Market Analysis

Daily F.X. Analysis, November 24 – Top Trade Setups In Forex – Consumer Confidence in Focus!

On the news front, the focus will remain on the U.S. Prelim Consumer Confidence and C.B. Leading Index m/m, which are expected to report mixed outcomes and drive choppy movement in the U.S. dollar. Let’s focus on technical levels today.

Economic Events to Watch Today  


EUR/USD – Daily Analysis

The EUR/USD pair closed at 1.18402 after placing a high of 1.19058 and a low of 1.17997. The EUR/USD pair rose to its highest since November 9 and reversed its direction after that, and continued placing losses for the day. The decline in the EUR/USD pair despite the improved risk sentiment was due to the U.S. dollar’s strength. The risk-on market sentiment was supported by the latest optimism from various vaccine developments. In contrast, the strength in the U.S. dollar was derived from better-than-expected U.S. macroeconomic data on Monday.

A British pharmaceutical AstraZeneca announced that its potential vaccine was more than 90% effective in its clinical trials for protecting the coronavirus. The first dosage of its vaccine provides 70% protection, while the second dosage could increase the efficacy rate to 90%.

AstraZeneca also said that it would be cheaper than its rival Pfizer vaccine as it can be stored at refrigerator temperature while Pfizer’s vaccine requires a frozen temperature that could make its cost of distribution higher.

Meanwhile, the risk sentiment was also supported by the reports that the US FDA has approved the antibody-drug used by U.S. President Donald Trump last month during his treatment of coronavirus for emergency use. These optimistic reports gave the EUR/USD pair strength in the earlier session and pushed its prices to their highest since November 9.

On the data front, at 13:15 GMT, the French Flash Services PMI declined to 38.0 against the forecasted 39.2 and weighed on Euro. The French Flash Manufacturing PMI also fell to 49.1 against the projected 50.2 and weighed on Euro. At 13:30 GMT, the German Flash Manufacturing PMI raised to 57.9 against the forecasted 56.0 and supported Euro. German Flash Services PMI remained flat with the expectations of 46.2. At 14:00 GMT, Flash Manufacturing PMI from Eurozone in November raised to 53.6 from the projected 53.2 and supported single currency Euro. Flash Services PMI declined 41.3 against the expected 42.2 and weighed on Euro.

The mixed data from Eurozone related to business activity failed to provide any significant movement in EUR/USD pair while the currency pair followed the U.S. dollar movement after the release of macroeconomic data in the American session.

At 19:45 GMT, the Flash Manufacturing PMI from the U.S. in November rose to 56.7 against the projected 52.5 and supported the U.S. dollar. The Flash Services PMI surged to 57.7 against the projected 55.8 and supported the U.S. dollar. After the release of better than expected Manufacturing and Services PMI, the strong U.S. dollar exerted pressure on EUR/USD pair on Monday.

Daily Technical Levels

Support   Resistance

1.1855      1.1871

1.1845      1.1877

1.1839      1.1888

Pivot point: 1.1861

EUR/USD– Trading Tip

The EUR/USD traded sharply bearish, falling from 1.1866 level to 1.1816 support level, which is extended by double bottom level. Closing of a candle over 1.1816 is supported by bullish correction, but at the same time, the EUR/USD pair may also head further higher until the 1.1866 resistance mark. On the 2 hour timeframe, the EUR/USD pair was supported by an upward trendline, which got violated on Monday, and now the same trendline is supporting EUR/USD pair. Let’s look for a selling trade below the 1.1866 level today. 


GBP/USD – Daily Analysis

The GBP/USD pair closed at 1.33222 after a high of 1.33975 and a low of 1.32636. The British Pound raised to its 10-weeks high level and then gave up some gains against the U.S. dollar in late trading sessions on the back of U.S. dollar strength. The rise in GBP/USD pair came in after the rising optimism over a Brexit deal after the European Commission reportedly told E.U. ambassadors that 95% of a post-Brexit deal had been agreed. The deal might be announced over the coming days to allow sufficient time for ratification by the European Parliament before year-end, possibly just the week after Christmas.

Meanwhile, on the data front, at 14:30 GMT, the Flash Manufacturing PMI from the U.K. raised to 55.2 against the forecasted 50.5 and supported British Pound and supported GBP/USD pair. The Flash Services PMI for November from the U.K. also raised to 45.8 against the forecasted 43.2 and supported British Pound and added gains in the GBP/USD pair.

From the U.S. side, at 19:45 GMT, the Flash Manufacturing PMI from the U.S. in November surged to 56.7 against the anticipated 52.5 and supported the U.S. dollar that capped further gains in GBP/USD pair. The Flash Services PMI rose to 57.7 against the forecasted 55.8 and supported the U.S. dollar, and GBP/USD pair lost some of its gains.

Meanwhile, on Monday, the Governor of Bank of England Andrew Bailey said that the long-term effects of a no-deal Brexit on the economy would be worse than the coronavirus pandemic’s long-term impacts. He added that he was relatively optimistic about the economy’s ability to recover from the coronavirus outbreak, but it would be more difficult to adjust with the U.K. trading with the E.U. on World Trade Organization terms.

These concerns added pressure on risk-on market sentiment and made GBP/USD pair to lost some of its earlier daily losses.

Furthermore, Prime Minister Boris Johnson confirmed that the England lockdown would be lifted on December 2, though regional restrictions would be kept to stop coronavirus spread. The second lockdown miscued the U.K. economy that the economy could slip into a double-dip recession and these concerns also added pressure on the GBP/USD pair that lost some of its earlier daily gains.

Daily Technical Levels

Support Resistance

1.3289      1.3312

1.3274      1.3320

1.3266      1.3336

Pivot point: 1.3297

GBP/USD– Trading Tip

The GBP/USD traded bearishly at 1.3290, but it now seems to bounce off over the support area of the 1.3292 level. On the higher side, the pair may go after the resistance level of 1.3394. Over there’s an upward trendline that is supporting Sterling on the 2-hour timeframe. Below the 1.3292 level, the Cable may find support at the 1.3240 level while the RSI and MACD are in support of buying. Thus we should consider taking buying trade over the 1.3292 level to target 1.3394. 


USD/JPY – Daily Analysis

The USD/JPY pair closed at 104.544 after placing a high of 104.635 and a low of 103.681. The USD/JPY pair rose by about 100 pips on Monday after the U.S. dollar became strong across the board. The strength of the greenback was derived from the release of macroeconomic data from the U.S.

At 19:45 GMT, the Flash Manufacturing PMI from the U.S. in November raised to 56.7 against the estimated 52.5 and supported the U.S. dollar. The Flash Services PMI surged to 57.7 against the estimated 55.8 and supported the U.S. dollar that added gains in the USD/JPY pair on Monday.

The better-than-expected U.S. business activity data showed that it was expanded in November at its fastest rate in more than five years and boosted optimism about the U.S. economy’s health that lifted the U.S. dollar, and provided strength to the rising USD/JPY pair.

Other than economic data, the USD/JPY pair was also supported by the market’s rising risk sentiment. The risk sentiment was supported by the latest optimism regarding vaccine developments from different countries. AstraZeneca, the British pharmaceutical, said that its vaccine was 70% effective on the first dosage and 90% effective on the second dosage.

It also reported that it would be cost-effective also as it does not require the frozen temperature to be stored and can only be stored in a refrigerator. These optimistic reports added strength in the risk sentiment and weighed on the safe-haven Japanese Yen that ultimately added strength in the USD/JPY pair.

On Monday, another positive news was that Regeneron’s coronavirus antibody cocktail that President Donald Trump used last month when he was hospitalized with COVID-19 had been approved for an emergency authorization use by the US FDA. There were also reports that the vaccine developed by Pfizer and BioNtech will likely be approved by the US FDA by December 11 and will be available for Americans to use.

With more progress in the vaccine area, lifting the lockdown restrictions increased along with the chances for an economic recovery that raised the risk sentiment and weighed on the safe-haven Japanese Yen that added gains in the USD/JPY pair. However, the pandemic hit economy still needs further support from governments to go through the crisis, and that is why investors were hopeful that the Fed and European Central Banks would likely issue more stimulus aid in December. The USD/JPY pair will likely rise as the risk sentiment has been improved after vaccine development progress.

Daily Technical Levels

Support Resistance

103.76      103.87

103.69      103.93

103.64      103.99

Pivot point: 103.81

USD/JPY – Trading Tips

The USD/JPY has violated a choppy range of 104.056 – 103.667 level. On the higher side, a bullish breakout of 104.056 resistance can extend the buying trend until the next resistance area of 104.59 and 105.063 level. On the lower side, the support continues to hold around 104.056 and 103.667 level. The MACD suggests an overbought situation of the USD/JPY pair; thus, we should look for selling trade below 104.598 and buying above the same. Good luck! 

Categories
Forex Market Analysis

Watchout the Potential Next Rally of GBPAUD

GBPAUD advances on Monday’s trading session in the bullish sentiment zone, testing the resistance level at 1.82688, which corresponds to the extreme bullish zone’s resistance.

Technical Overview

The following 12-hour chart illustrates the price that reached a new peak in the 90-day range at 1.85272. The cross began to retrace towards the neutral zone at level 1.80104, where the price found support and began to move mainly sideways on the bullish sentiment zone, finding resistance at level 1.82688.

Likewise, it highlights the support’s confirmation in the neutral level of the 90-day range, which leads to the observation of the upward pressure it shows the cross short term. In this context, the GBPAUD cross could experience a new rally that could lead to a test of the psychological resistance level located on 1.8500.

Short-term Technical Outlook

The short-term Elliott Wave graph of the GBPAUD cross unfolded in the following 12-hour chart shows the price action moving in an incomplete wave ((c)) of Minute degree labeled in black, which belong to the fourth wave of Minor degree identified in green.

The big picture reveals the cross is moving in an impulsive descending structure of Minor degree, in green, progressing in its fourth wave. This corrective structural series began last September 11th when the GBPAUD found fresh buyers at 1.74935.

The completion of the internal wave ((a)) at 1.85272 on October 21st and wave ((b)) at 1.79378 on November 09th leads to the anticipation of further upward movements in a five-wave internal sequence corresponding to wave ((c)) identified in black. In this regard, the previous chart shows the price starting to develop its third wave (iii) of Minuette degree, labeled in blue.

In this context, the current upward sequence in development has two potential targets as follows.

  • The first potential target is found in the supply zone between 1.84295 and 1.85272. If the price starts to decline from this zone, this could indicate a dominant bearish pressure that could drag the price toward the last September’s lows zone on 1.7500.
  • The second potential target zone is between 1.87353 and 1.89667, which corresponds with the ascending channel’s upper line. If the GBPAUD cross reaches this zone, this could indicate a dominant bullish pressure, and a correction could likely drive the price to the end of wave ((b)) on 1.7937, where the cross could find fresh buyers.

For the active intraday bullish scenario, the short-term invalidation level is located at 1.79378, which corresponds to the origin of wave ((c)).

Categories
Forex Basic Strategies

Combining The ‘Rail Road’ Trading Pattern With Pivot Points To Generate Accurate Trading Signals

Introduction

In the previous set of articles, we discussed strategies based on most of the technical indicators in forex. But there is one technical indicator that was not covered extensively and, i.e., the ‘Pivot Points’ indicator. Traders do not use it extensively because they don’t know the right way of using it and are not aware of their strength.

Today, we solve this problem by discussing a mostly based strategy on the Pivot Points indicator. By now, we all know that a technical indicator should never be in isolation. Therefore, the ‘Pivot Points’ indicator is combined with some very powerful chart patterns and key technical levels to improve the probability of successful trades.

‘Pivot Points’ are nothing but potential support and resistance levels that will help us determine the same, even it is established. The pivot point’s parameters are usually taken from the previous day’s trading range to calculate today’s pivot points. The simplest way of plotting the pivot point indicator on the chart is by selecting the indicator from the broker’s charting software.

The main pivot point (PP) is the central pivot based on which all other pivot levels are calculated. Calculating the central pivot point is pretty simple. We just have to add yesterday’s high, low, and close and then divide that by 3, a simple average of the high, low, and close. We don’t have to worry about the calculations as the software does all that for us and gives it readymade.

The only thing we have to remember is that if the price is trading above the central pivot point, it signals a bullish trend. If the price is below the central line, it is considered a bearish trend.

Time Frame

The strategy works well on small time frames such as 15 minutes, 3 minutes, and 1 minute. It would not be wrong to classify the above strategy as a ‘Scalping Strategy.’

Indicators

We use just one technical indicator for the strategy and, i.e., ‘Pivot Points.’ We could also use the Simple Moving Average (SMA) to get a clear idea about the market trend.

Currency Pairs

The strategy is only applicable to major currency pairs of the forex market. EUR/USD, USD/JPY, GBP/USD, GBP/JPY, AUD/USD, EUR/GBP, and NZD/USD are preferred currency pairs.

Strategy Concept

The ‘Pivot Point’ strategy is based on the concept that when price respects any of the support and resistance levels of the ‘Pivot Point’ indicator, they tend to become ‘true’ S/R levels that can be relied upon. When price re-tests these ‘true’ support and resistance levels, it moves in the direction as anticipated. The above logic works greatly in favor of traders and thus increases the probability of making a profit. However, there are some rules we need to follow to execute the above strategy successfully. Let’s discuss these rules in detail.

Trade Setup

To explain the strategy, we will be executing a ‘long’ trade in EUR/USD currency pair using the strategy’s rules. Here are the steps to execute the strategy.

Step 1: Firstly, we have to plot the pivot point indicator on the chart with its default settings. As this is mostly an intraday strategy, we start each day as fresh using the partitions made by the pivot point indicator. The below image exactly shows how the beginning of a new day would look like on the pivot points.

Step 2: Next, we need to wait for the price to touch any support and resistance levels as plotted on the chart by the pivot point indicator. Not all touches are going to be important to us. Only the price touches that cause major price movement in the market will be considered as significant. For instance, if the price touches R1, R2, R3, R4, or R5 and goes down to the central line (PP), this shall be considered ‘true’ resistance. Likewise, if the price touches S1, S2, S3, S4, and S5 and goes back up to the central line, this shall be considered ‘true’ support.

The below image shows how price touches S1 and travels close to the central line. Hence, this can be considered as ‘true’ support. The further price travels, the stronger is going to be the ‘support.’

Step 3: After establishing ‘true’ support and resistance levels, we wait for the price to return to this level and show a suitable price action pattern before we can actually enter into a trade. Once the price touches established ‘support’ or ‘resistance,’ we need to watch for the formation of the ‘Rail-Road Track’ candlestick pattern on the chart. The ‘Rail-Road Track’ is essential because it confirms the respective level. We still don’t enter for a trade. The next step explains the rule of ‘entry.’

Step 4: To be sure that the support or resistance is holding, we enter only after the price starts moving in the direction we expect to move. For example, in the case of ‘true’ support, we enter ‘long’ when the price moves a further higher from the ‘support.’ Similarly, in the case of ‘true’ resistance, we enter ‘short’ when the price moves further lower from the ‘resistance.’

Step 5: In this step, we define the take-profit and stop-loss levels for the trade. The stop-loss is placed below the ‘support’ from where the price had bounced off, in case of a ‘long’ position. On the other hand, it is placed above the ‘resistance’ from where the price had collapsed. The ‘take-profit’ is set at the opposing ‘support’ and ‘resistance’ level as indicated by the pivot point indicator.

Strategy Roundup

The pivot point strategy is like a complementary tool to the traditional S/R strategy that can be used to improve the results. Since we are dealing with really small time frames, the probability of ‘successful trades’ can be ‘low.’ However, that shouldn’t be a concern for us as the risk to reward (RR) of trades executed using the above strategy is above average. This will ultimately put us in a profitable position.

Categories
Forex Signals

USD/CAD Choppy Trading in Play – Brace for a Breakout! 

The USD/CAD closed at 1.30921 after placing a high of 1.30967 and a low of 1.30387. The USD/CAD pair remained on the upward momentum on Friday despite the strength in WTI Crude Oil prices and the Canadian Dollar amid the positive optimism regarding the vaccines. The optimism surrounding the vaccine development from Pfizer and Moderna was also followed by Oxford, the Russian Sputnik V, and China’s Sinovac and raised the market’s risk-on sentiment that supported the risk perceived USD/CAD pair on Friday.

On the data front, at 18:30 GMT, the Core Retail Sales from Canada raised to 1.0% against the expectations of 0.0% and supported the Canadian Dollar. For September, the Retail Sales also grew to 1.1% from the forecasted 0.2% and kept the Canadian Dollar. The NHPI for October came in line with the projection of 0.8%. At 18:32 GMT, the Corporate Profits for the quarter from Canada also came in line with the anticipations of 44.9%.

The Canadian Dollar was strong across the board on Friday due to supportive macroeconomic data and the rising Crude oil prices. The WTI crude oil was higher on Friday above the $42.5 level after the increased optimism about the coronavirus vaccines from across the world. The rising crude oil prices also supported the commodity-linked currency Loonie that capped further USD/CAD pair gains.

Meanwhile, the Canadian health officials warned that daily coronavirus infections could reach 60K per day by the end of December from their current level of 4.8K if people continue to increase their number of daily contacts. The Canadian PM Justin Trudeau said that Canada saw a massive spike in cases and that there was a risk that hospitals could get overwhelmed. He also said that it was frustrating that Canadians would have to do more to contain the virus from what they did weeks ago. These virus tensions across the North kept the Canadian Dollar weak and supported the rising USD/CAD prices on Friday. 

On the US dollar front, the Dollar was strong across the board as the US Federal Reserve Chairman refrained from providing any clues about further easing in the upcoming Fed meeting and supported the USD/CAD pair’s upward momentum.


Daily Technical Levels:

Support Resistance

1.3039 1.3114

1.3007 1.3157

1.2964 1.3189

Pivot point: 1.3082

The USD/CAD pair is trading sideways in between the narrow range of 1.3120 – 1.3045 level. Investors seem to wait for a solid reason to trigger a breakout of the choppy range. The idea will be take a sell USD/CAD pair below 1.3045 level until 1.2937. Conversely, the continuation of a bullish trend over 1.3120 can lead the USD/CAD pair towards 1.3245. Good luck! 

Categories
Forex Basic Strategies

The Best Tools to Trade Pullbacks Effectively

A Pullback is a pause, retracement, or consolidation of a price from the most recent peak during an ongoing trend. The pullback is widely seen as a trading opportunity after the underlying asset experienced a large upside or downside move. For example – Any forex pair is in a strong uptrend, and some healthy news came, and price action dropped back to the most recent support area that indicates the professional traders are booking the profits.

Pullbacks happen all the time, and if you learn how to trade them successfully, it can be a great skill as a trader. Trading the pullback is the easiest way to trade the market, sometimes you will recognize the high probability pullback trades and sometimes extreme volatile pullbacks, and you can enhance your repertoire and find many higher probability trades. If you are new in the market, then pullback trading is a fantastic and easy way to find superior risk-to-reward ratio trades. In this article, we will explore five trading strategies that provide excellent pullback trades.

Pullback Trading Strategies

Two-Legged Pullback To The MA 

Al Brooks popularized the concept of two legs pullback in his price action books. He explained most of the time, price action print two legs to reach the moving average. We backtested his strategy and found out that his techniques work very well in the trending market, but sometimes in the strong trending market, you will only witness one leg.

This is because most market operators are in a hurry to move the market; this may be because of any fundamental news. To filter out all the low probability trades, it is advisable to find a trending market and then wait for the price action to print the two legs towards the moving average, and when all the moves complete, take the buy entry.

The image below represents the buying trade in the EURGBP forex pair. The moving average indicates the buying trend in the currency. Price action pulled back to the moving average, prices responded from the moving average and goes a bit higher and end up printing the second leg. The second leg goes down to the moving average, but the strong buyers smack back up and close above the moving average. Furthermore, the price slows down a bit, and we took buying entry with the stops below the entry, and for taking profit, we choose the brand new higher high.

Candlestick Pattern + MA

This method will use the bullish engulfing candlestick pattern with a moving average to successfully trade the market.

Here we need two ingredients.

  1. Price action pullback to the moving average.
  2. The market forms a bullish engulfing pattern.

First of all, look for the strong trending market and wait for price action to approach the moving average. At this stage, if the price action prints the engulfing pattern,  it’s the right time for you to go for a buy entry. Otherwise, no entries are allowed for you. An  Engulfing Pattern indicates the sellers try to print the brand new lower low, but because of dynamic support of moving average prices pulled back and buyers end up eating all the sellers. As a result, we witnessed the Bullish Engulfing pattern.

The image below represents the buying trade in the EURNZD forex pair. As you can see, at the end of the downtrend, price action goes above the moving average, and we witnessed the engulfing pattern. The trading pattern closed above the moving average, which was a confirmation of buyers came back to the show and were expecting the brand new higher high.

Trendlines + Channel Trading

This one is the simple trading approach, which is not much popular, but it often generates wonderful trading results. First of all, you must draw the trend line to the ongoing trend, and when the price action pulls back enough, then draw the price channel to identify the oversold and overbought area. When price action approaches the trend line as well as the lower line of the price channel, it is an indication to go long.

The image below represents the buying entry in the AUDCHF forex pair. The trend line was the indication that the buyers are leading the show. During the pullback phase, when enough sellers approach the trend line and the lower channel line, it gave the strong buying candle. The reason we got the strong candle is because for the support and resistance trader, the zone was a dynamic support area to go long.

RSI + Stochastic Indicator

In this approach, we are using the two oscillators to trade the pullbacks. Stochastic and RSI both are oscillators, and they both oscillate between the significant levels. In an uptrend, wait for the price action to pull back. When the stochastic and RSI gave the oversold signal, it is a perfect time to go for a brand new higher high.

The image below indicates the buying trade in the AUDCHF forex pair. The pair was overall in an uptrend, and during the pullback, both of the indicators were showing the oversold signals, and the reversal at the oversold area was a great sign to go long. When both oscillators indicate the same sign, there is no point in going for more significant stops. When both oscillators gave the reversal signal at the significant resistance level, that’s a perfect time to close your trade.

Conclusion

All the pullback strategies share the same goal, which is to time the market. The better you master the skill of timing before the take-off, the more profits you will make. If you are a newbie trader, then master these strategies first on the demo and then apply to the live market because trying any of these strategies in the live market is dangerous without having any experience.

So never try anything on the live account. Instead, practice them on demo first and then make a profit on a live account. When you master these strategies, then you can very easily design a pullback strategy for yourself. Whichever strategy fits nicely into your trading approach, master it.

Categories
Crypto Market Analysis

Daily Crypto Review, Nov 23 – Ethereum Exploding as its 2.0 Update Launch Approaches; Crypto Market in the Green

The cryptocurrency sector has spent the weekend being quite volatile as Bitcoin had a flash crash, which brought its price below $18,000, followed by a rally that brought it back above it. The largest cryptocurrency by market cap is currently trading for $18,461, representing an increase of 0.61% on the day. Meanwhile, Ethereum skyrocketed by gaining 8.13% on the day, while XRP gained 0.09%.

 Daily Crypto Sector Heat Map

Waves 38.43% in the past 24 hours, making it the most prominent daily gainer in the top100. It is closely followed by Horizen’s gain of 31.65% and Numeraire’s 21.56% gain. On the other hand, Terra lost 5.45%, making it the most prominent daily loser. HedgeTrade lost 3.22% while Crypto.com Coin lost 1.65%, making them the 2nd and 3rd most prominent daily losers.

Top 10 24-hour Performers (Click to enlarge)

Bottom 10 24-hour Performers (Click to enlarge)

Bitcoin’s market dominance has reduced drastically over the course of the weekend, with its value is currently staying at 63.2%. This value represents a 2.9% difference to the downside compared to the value it had on Friday.

Daily Crypto Market Cap Chart

The crypto sector capitalization has increased significantly over the course of the weekend. Its current value is $541.71 billion, representing a $34.48 billion increase compared to our previous report.

_______________________________________________________________________

What happened in the past 24 hours?

_______________________________________________________________________

_______________________________________________________________________

Technical analysis

_______________________________________________________________________

Bitcoin

The largest cryptocurrency by market cap has spent the weekend with decently high volatility as its price managed to go from above $18,500 to $17,600 and then back above $18,500 in just one day. While this “flash crash” is behind Bitcoin, the bulls seem to be more and more wary of the new highs, and a retracement before another push towards the upside is quite possible.

Due to many people taking profits and shorting Bitcoin to hedge their portfolios, the largest currency has a hard time going up. However, trading pullbacks in a bull trend is equally as risky. Bitcoin traders would have the most chance of succeeding if they traded only long positions.

BTC/USD 2-hour Chart

Bitcoin’s technicals are semi-divided, with its daily and monthly overviews showing a slight bullish tilt with signs of bears still present. In contrast, the 4-hour and weekly overviews show no signs of bearish presence and are completely bullish.

BTC/USD 1-day Technicals

Technical factors (4-hour Chart):
  • Price is above its 50-period EMA and at its 21-period EMA
  • Price is at its middle Bollinger band
  • RSI is neutral (51.42)
  • Volume is average
Key levels to the upside          Key levels to the downside

1: $18500                                  1: $17,850

2: $19000                                  2: $17,450

3: $19500                                   3: $17,130

Ethereum

Ethereum’s 2.0 version 0 launch is approaching, and Ethereum bulls seem to be back in the game. The second-largest cryptocurrency by market cap broke out of the ascending (red) line and pushed towards the upside, eyeing the $600 resistance level. While the rally was strong, Ethereum bulls started showing exhaustion at $580. With that being said, the move is still not considered over, and there is more opportunity to the upside.

We mentioned on Friday that Ethereum’s downside is quite defined, but that its upside isn’t. With ETH entering territory that was explored only a couple of times, the opportunity for volatility (but also slippage) is increasing.

ETH/USD 4-hour Chart

Ethereum’s 4-hour and daily time-frames are completely bullish, while its longer time-frames (weekly and monthly) are slightly more tilted towards the neutral position.

ETH/USD 1-day Technicals

Technical Factors (4-hour Chart):
  • The price is far above both its 50-period and its 21-period EMA
  • Price is at its top Bollinger band
  • RSI is extremely overbought (72.01)
  • Volume is above average
Key levels to the upside          Key levels to the downside

1: $600                                     1: $510

2: $630                                     2: $500 

3: $735                                      3: $490

Ripple

The fourth-largest cryptocurrency by market cap has, just like Ethereum, had quite an amazing weekend. XRP continued its rally to the upside that began on Nov 20 and reached as high as $0.49 before starting to consolidate. While consolidating, it has seemingly created a triangle formation that should keep its price at bay before ~80% of the formation is done.

While it is quite unknown how XRP will act right now, all chances are that it will stay within the triangle formation’s bounds for some time, at least.

XRP/USD 1-hour Chart

XRP’s daily and weekly overviews are completely bullish and show no signs of neutrality, while its 4-hour and monthly overviews show slight neutrality.

XRP/USD 1-day Technicals

Technical factors (4-hour Chart):
  • The price is above its 50-period EMA and at its 21-period EMA
  • Price is slightly above its middle Bollinger band
  • RSI is neutral (53.65)
  • Volume is above average
Key levels to the upside          Key levels to the downside

1: $0.476                                   1: $0.3328 

2: $0.509                                   2: $0.3244

3: $0.792                                  3: $0.31


Categories
Forex Market Analysis

Daily F.X. Analysis, November 23 – Top Trade Setups In Forex – PMI Figures in Highlights! 

On the news front, eyes will remain on the Manufacturing PMI and Services PMI figures from the Eurozone, the U.K., and the United States. Almost all economic figures are expected to perform better than previous months, perhaps due to a lift of lockdown. Price action will depend upon any surprise changes in the PMI figures.

Economic Events to Watch Today  


EUR/USD – Daily Analysis

The EUR/USD pair closed at 1.18563 after placing a high of 1.18906 and a low of 1.18495. Despite vaccine-related optimism and improved risk sentiment in the market, the currency pair EUR/USD dropped on Friday amid the continuous rise in the number of coronavirus cases along with the latest disagreement between the Fed and U.S. Treasury related to the unused funds of emergency lending programs.

On Thursday, U.S. Treasury Secretary Steven Mnuchin sent a letter to Fed’s Chair Jerome Powell and asked him to return the unused funds in five emergency lending programs that will expire in December. Mnuchin claimed that those funds could be used for other purposes by Congress. Mnuhcin also asked Powell to extend the other four emergency credit facilities.

Meanwhile, the U.S. coronavirus situation got worse as November was not still over, but there have been almost 3 million new cases reported. It is about a quarter of all the U.S. cases since the beginning of the pandemic. The U.S. hospitalization rate was getting higher to an alarming level as it was forcing the health care system to reduce care for even non-COVID-19 patients.

Given the coronavirus situation in the U.S., many states announced restrictive measures to control the spread. On the European side, the situation was a bit under control after the strict lockdown measures. However, the old continent’s situation in Europe was far from getting better, and market players were worried that a steep economic downturn would be seen in the last quarter of the year.

These tensions raised the concerns that economic recovery was under pressure and supported the safe-haven appeal that ultimately weighed on the risk perceived EUR/USD pair on Friday. Furthermore, central banks’ calls for another round of stimulus measures to help support the economy started to increase. In response, the Federal Reserve Chairman Jerome Powell has been refrained to give any hint about any action in December whereas, his European counterpart Christine Lagarde has said that a large easing package will be coming in the next meeting. Lagarde’s comments also weighed on the single currency that ultimately added losses in the EUR/USD pair on Friday.

At 12:00 GMT, The German PPI for October remained flat at 0.1% on the data front. At 19:50 GMT, the Consumer Confidence also came in line with the expectations of -18. There was no macroeconomic figure to be released from the U.S., which means the pair EUR/USD was unaffected by any data on Friday.

Meanwhile, the vaccine news from Pfizer and BioNtech that they were going to apply for US FDA approval for emergency authorization use of their vaccine raised the risk sentiment in the market. Combined with this optimism, the other companies, including Moderna, Oxford, the Russian Sputnik V, and China’s Sinovac, also provided updates about the vaccine’s efficacy and supported the market’s risk of improved sentiment that ultimately capped further losses in the EUR/USD pair.


Daily Technical Levels

Support  Resistance

1.1831      1.1898

1.1790      1.1924

1.1764      1.1965

Pivot point: 1.1857


EUR/USD– Trading Tip

The EUR/USD is trading with a bearish bias at the 1.173 level, forming an ascending triangle on the 2-hour timeframe. On the lower side, the pattern supports the EUR/USD pair at 1.1850, and here violation of the 1.1850 level can extend the EUR/USD pair towards the 1.1816 level. On the higher side, a bullish breakout of the 1.1889 level can extend the buying trend until the 1.1924 level. The bullish bias remains dominants today as the MACD and 50 periods EMA support a bullish trend. Let’s consider taking a buying trade over 1.1889 with a take profit of 1.1924 level. 

GBP/USD – Daily Analysis

The GBP/USD pair closed at 1.32891 after placing a high of 1.32977 and a low of 1.32403. GBP/USD remained bullish on Friday amid the latest Brexit optimism and the coronavirus vaccine’s rising hopes. The currency pair remained on the upper track this week as Brexit dominated the scene and supported the British Pound. The coronavirus situation in the U.K. was improving as the U.K. was set to announce a wide easing of coronavirus rules for a week at Christmas.

Next week, Boris Johnson will announce a plan for an easing of rules on Covid, and he also warned that the level of restrictions for the rest of next month would depend on how well the public obey the current lockdown in England that will end on 2nd December. Brexit headlines were, however, contradictory during the week as PM Boris Johnson signaled that the U.K. would prosper without a deal and E.U. officials indicated that talks could collapse. The British press talked about a French compromise on the fisheries issue that a key sticking point in the Brexit deal. After the French compromise on fisheries, the Brexit optimism continued supporting the British Pound and added gains in GBP/USD pair.

Another factor involved in the GBP/USD’s bullish sentiment, Pfizer and BioNtech said that they would apply for approval of emergency use of their vaccine on Friday, which also helped risk sentiment improve and support the British Pound. Following Pfizer, Moderna also said that its vaccine was 94.5% effective in preventing the coronavirus and helped raise the market’s optimism that also supported the GBP/USD pair’s upward trend.

On the data front, at 05:01 GMT, GfK Consumer Confidence remained flat with the forecasted -33. At 12:00 GMT, the Retail Sales from the U.K. for October raised to 1.2% against the expected -0.3% and supported British Pound that added further gains in GBP/USD pair. The Public Sector Net Borrowing declined to 21.6 against the forecasted 31.6B and kept British Pound and added improvements in the currency pair GBP/USD pair.

Meanwhile, in the U.S., the need for a stimulus package increased with the rising coronavirus cases, but Fed Chairman Jerome Powell refrained from giving any hint about further aid in the upcoming December meeting. The hospitalization in the U.S. for coronavirus patients increased to a worse level, forcing many state governors to announce restrictive measures to control the virus’s spread. It weighed on the U.S. dollar and helped GBP/USD pair to post gains on Friday.

Daily Technical Levels

Support   Resistance

1.3211      1.3296

1.3161      1.3331

1.3127      1.3381

Pivot point: 1.3246

GBP/USD– Trading Tip

The GBP/USD continues trading bullish at the 1.3307 level, holding over the 1.3303 support level, supporting the buying trend. The recent bullish engulfing candle on the 2-hour timeframe can lead Sterling further higher until the 1.3368 area. The MACD and RSI have crossed over on the higher side, suggesting further odds of bullish trend continuation. Typically such kind of ascending trend breakout can lead the pair further higher, so let’s consider taking buying trade over the 1.3307 level today. 


USD/JPY – Daily Analysis

The USD/JPY pair closed at 103.823 after placing a high of 103.909 and a low of 103.700. After falling for six consecutive days, the USD/JPY pair posted small gains on Friday amid the reports about the resumption of the U.S. fiscal aid talks. The small uptick in the USD/JPY pair after massive selling in the previous six days could be solely attributed to optimism led by reports that U.S. lawmakers have agreed to resume talks on another coronavirus stimulus package.

The positive sentiment was somehow offset by the U.S. Treasury Secretary Steven Mnuchin’s decision to end some pandemic relief for struggling businesses. This came in after the tensions increased about the potential economic fallout from the continuous rise in new coronavirus cases, which held the U.S. dollar bulls from placing aggressive bets.

Meanwhile, the safe-haven appeal came back in the market after the number of coronavirus cases started to increase in the U.S. On Thursday, the U.S. reported about 185,000 cases of coronavirus in a single day and set a record. The number of hospitalized patients in the U.S. also increased by almost 50% in just the last two weeks that eventually urged many states to impose new restrictions to stop the virus from spreading further.

Meanwhile, the Governor of California imposed a 10 PM curfew in most populated U.S. states that will take effect from Saturday. Moreover, the Centre for Disease Control advised Americans not to travel on Thanksgiving holiday as it would increase the infection rate. These concerns added uncertainty in the market and raised a safe-haven appeal that supported the safe-haven Japanese Yen and capped the USD/JPY pair’s gains on Friday.

There was no macroeconomic data from the U.S. on Friday, and from Japan, at 04:30 GMT, the National Core CPI for the year from Japan remained flat with the anticipations of -0.7%. The macroeconomic data failed to impact on currency pair USD/JPY.

Pfizer and BioNtech announced on Friday that they would apply on the day to the US FDA for approval of emergency use of their vaccine on the vaccine front. This, combined with the other companies, included AstraZeneca and Oxford University’s latest reports of their vaccine’s efficacy, added strength in the risk sentiment, and supported the USD/JPY pair’s gains on Friday.

Daily Technical Levels

Support   Resistance

103.56      104.07

103.38      104.40

103.04      104.58

Pivot point: 103.89

USD/JPY – Trading Tips

The USD/JPY extends its bearish trend below the 104.102 level, consolidating within a narrow trading range 104.102 – 103.650. On the lower side, the USD/JPY pair is likely to find support at the 103.650 level, and violation of this level can also extend further selling bias until 103.227. On the higher side, the USD/JPY safe-haven pair may find resistance at 104.400 and may help us capture a selling trades below this level as the MACD and RSI support the selling trend today. Good luck! 

Categories
Forex Technical Analysis

The Core Principles of Technical Analysis

Most of the content about the technical analysis will try to give you a narrow view of how we approach this analysis. And there is a reason for that. People will want what they can understand, masses are not amused with complex analysis, only a handful of people will really dive into what this analysis has to say. Therefore, limiting the technical analysis to line drawing, pattern recognition, and candlesticks is also a limitation to what you can learn unless you do your own research. 

Learning technical analysis is not hard to do, it can be as deep and complex as you want or very simple. Interestingly, technical analysis guides and books tend to repeat the same ways and tools of doing it even though it is a very wide concept. When we talk about the basics, the most dominant technical analysis methods are the Price Action patterns, candlesticks, pivots, support and resistance lines, and trend lines. They are regarded as basic since they are derived directly based on what is seen on the chart. We would also like to add they are mostly subjective even with the “rules” that define them. Technical indicators are the second method of chart analysis, also called secondary indicators by some professionals as they calculate based on the original price action data.

Volume or volatility is the third technical dimension, often missed by some analysts but very important to professionals. The last technical analysis dimension we would like to add is the timeframe or time scope. As we move on to each of these concepts, you can find traders who are successful using just the price action or only indicators without much regard to fundamental analysis. The main idea behind this is that they do not want to be distracted by the news that may not be as important or true and only want to keep the analysis based on factual data – historic price movements represented as charts. 

PA patterns are created by the price movement on the y-axis and time on the x-axis. As these shapes and patterns repeated, analysts collected them, making several most popular patterns regarded as most reliable. The patterns serve to predict the future price action once they are formed, all of these patterns point the price will likely go up o down. The most common patterns are double tops and bottoms forming the letter W and M, cup and handle, ascending and descending triangles, and the head and shoulders.

There is no good statistical record of how reliable are these patterns as they are subjective, one analyst can see the pattern others do not, or the patterns can stack one inside the other. However, they are used in conjunction with other tools and timeframes. All this can make you wonder if there is any reason to believe patterns exist or the movement is random, at the end of the day it is just another element to help you decide. The final judge of your technical analysis is the account balance. 

Candlesticks have more information about the price movement than a single line. They have several structural elements: the body color, the wick, and the top and bottom body levels. Based on these, analysts have created a plethora of patterns that aim to predict when a trend or reversal is about. Similar to price action patterns, candlestick patterns reliability cannot be tested objectively, only you can test and fit them in with other indications. Candlesticks are essential to creating pivot points, moments where the price turned in another direction. 

Pivot points consist of at least three candles and they mostly serve to draw lines, be it support and resistance, trend, channel, or Fibonacci retracement lines. Some traders will draw lines where others would not, thus a definitive support or resistance line cannot be drawn for all. The same applies to trend lines and other constructs where their form will depend on the beholder. While support and resistance lines indicate likely price direction reversal once they are reached, their interpretation can also help breakout strategies.

Now traders can get confused about whether they should enter a trade on an S/R line breakout or wait for a reversal. Of course, the price will not exactly break through the support or resistance line or bounce right off it, you will mostly see something in between. Consequently, this presents a question of how reliable can such analysis be. If we use multiple questionable elements for one comprehensive analysis, one can wonder would multiple more reliable elements result in better technical analysis and therefore trading. 

These basic technical analysis elements form the complete picture for a pure PA trader, with the addition of volume. Volume cannot be represented by a candlestick alone, nor by observing PA patterns or any other basic technical analysis element. Volume is measured and is represented as a special tool. Traders mostly use it to confirm a trend is emerging, to confirm a breakout, and also to exit any trades if the market is not active enough. Some trading strategies rely on low volume markets or sessions to avoid surprise movements. If we combine volume with other technical analysis tools, the result is almost always beneficial. Some strategies use volume or volatility to filter losing trades, others use volume for entries. 

Secondary indicators are derived from the price action statistics, numbers. At its base, they are formulas that give out a number of values. These values can be presented on a chart or in some other form in a separate plane. The basic secondary indicator is the Moving Average. MAs are very common and can be calculated in so many ways to reflect a specific price action interpretation. They can also contain other measurement values in an effort to be more reliable, lag less, and so on. One such example is the Volume Weighted MA where volume is also included in the calculation.

How a trader will use MAs depends on his goals and imagination, adding more different MAs can produce various uses, or, as some professionals do, use the MA and the price on the chart to produce trade signals when they cross. Indicators can be very complex to include many factors derived from the price action, to the point they represent complete trading solutions. Unlike PA patterns, support and resistance lines, and other subjective basic technical analysis tools, indicators are exact since they are based on data numbers. However, this does not mean they are reliable as reliability depends on the formula and how it is interpreted. 

The basic principle of technical analysis is the combination of several indicators. Some professionals just rely on how the chart looks to them and make trade decisions based on that. They do not need anything exact. Others need exact points, values, signals to the point their complete money management is based on this analysis. There are also mixed type analysis, PA lines, and patterns combined with Moving Averages and volatility indicators. The goal is to use the right combination that collectively gives meaning to a particular trader.

It is not only about combining several tools but also combining timeframes. The analysis will likely be more reliable if other time scopes are included. This will help traders to pinpoint optimal trade exits and entries and also see the bigger picture of what is going on in the market. Some strategies may require lower timeframes such as 5 minute or 15-minute candles, while other systems may work only on the daily timeframe. After all, technical analysis will become unique to a particular trader, aimed and aligned to his goals and personality. Also, be wary of over-optimizing and overcomplicating technical analysis, it is not going to result in the best performance.

Categories
Crypto Market Analysis

BTC/USD Weekly Chart Analysis + Possible Outcomes

In this weekly BTC/USD analysis, we will be taking a brief look at the most recent events, current chart technical formations, as well as the possible BTC short-term price outcomes.

Overview

Bitcoin has spent the week constantly pushing towards the upside, with its price moving from around $16,500 on Monday all the way up to $19,000 at one point on Saturday. This left Bitcoin holders in a dilemma: should they hold or hedge their investments. Most holders are already satisfied with the BTC movement and don’t want to invest at such a high price, while some are hedging or even selling their funds to take a profit. On the other hand, such a large rally has “invited” the retail market to join in, and they are the majority of the buy force, alongside institutional investors that do not care about the current price and just want to invest every time they have funds available.

While many analysts called for a stronger pullback long before the most recent push, all significant bear-related signals were false.

Technical factors


Bitcoin has continued moving up, supported by the 50-period MA, which has proven as great support, as well as by the ascending (pink dotted) line. On top of that, the largest cryptocurrency by market cap has done a great job pushing through its previous highs and making higher highs/higher lows. If we consider the year-to-date Bitcoin balance on exchanges dropping 18% and institutions being more and more involved, we can almost certainly expect a long-term price increase.

The hash ribbons indicator is showing miner capitulation (ever since Oct 29), sending out a major buy/accumulation signal.

Likely Outcomes

Bitcoin has one main scenario, as well as one supporting scenario that is likely to play out.

1: If Bitcoin manages to hold the so-called pivot zone (18,250-$18,450), it is almost certain to bounce and reach the all-time high level, and possibly even pass it. In that case, longing Bitcoin after it confirms its position above the pivot zone is a great trade, as it has defined targets (target 1 = Bitcoin’s ATH; target 2 = ride the bull wave and continuously take profit until volume dies out) as well as a defined stop-loss target (right below the pivot zone).

If the first scenario plays out, it will most likely play out on the Nov 23rd, as this is when the pivot zone is meeting the ascending support line and (most likely) the 50-period moving average.

2: The second (and a bit less likely) scenario happens when Bitcoin fails to hold the pivot zone, in which case we can expect a price drop to $17,260.

A move that will end up below $17,260 is highly unlikely, simply due to the overall sentiment currently surrounding Bitcoin.

Categories
Forex Elliott Wave Forex Market Analysis

GBPJPY Consolidates in the Bearish Sentiment Zone

The GBPJPY cross continues moving by its seventh session in a row in a sideways channel turning in the neutral zone. However, since the last Thursday trading session, the price is consolidating in the bearish sentiment zone.

Technical Overview


The following 8-hour chart illustrates the 90-day high and low range, which exposes the market participants’ sentiment. The figure shows the price action moving around the pivot level at 137.877. Nevertheless, the close below the pivot level pulled the price toward the bearish sentiment zone.

Additionally, the strong bearish rejection in the price action decreasing from the extreme bullish sentiment zone of 140.296 toward the pivot level leads to suspect that the intraday upward movement developed on November 09th couldn’t be as strong as it seemed.

On the other hand, both the positive EMA(60) to Price Index and the 200-period moving average moving below the price, leads to the conclusion that the mid-term sentiment remains on the bullish side. In this regard, the short-term sideways channel’s breakdown could confirm the turning bias from bullish to bearish.

Short-term Technical Outlook

The GBPJPY cross short-term view and under the Elliott Wave perspective reveals the sideways progress in an incomplete corrective sequence that corresponds to wave B of Minor degree labeled in green.

The next 4-hour chart illustrates the advance in a broadening structural series that could correspond to a possible double-three pattern that ended once the price topped at 140.315 on November 11th.

If this scenario is correct, then the pair’s action should be advancing in wave C of Minor degree labeled in green. In this context, the GBPJPY cross should confirm the end of its internal corrective wave corresponding to wave (ii) of Minuette degree identified in blue. In this scenario, the bearish pressure could drag the price toward the end of wave A zone located between levels 133.70 and 133.

The alternative count considers the possibility that wave B of Minor degree remains incomplete and the internal structural series corresponds to a triple-three pattern. In consequence, the current downward move would correspond to the second wave ((x)) of Minute degree. If this scenario is valid, the wave (c) of Minuette degree in blue should have a limited decline, likely until the previous lows located between 135 and 134.

Finally, the invalidation level for both short-term scenarios locates at 140.315, which corresponds to the end of wave ((y)) in black.

Categories
Forex Basic Strategies Forex Daily Topic

Trading The Forex Market Like A Pro Using The Williams %R Indicator

Introduction

In the forex market, the Relative Strength Index (RSI) is the most sought after technical indicator for measuring overbought and oversold conditions in the market. However, there are times when RSI can give misleading signals. To overcome some of these limitations of RSI, we use William’s %R (Williams Percentage Range) to help us identify when an asset is oversold or overbought.

Having determined that the asset has moved too much in one direction, we can position ourselves on the other side of the market after suitable confirmation. In today’s article, let’s discuss a strategy based on William’s %R indicator to identify when the market has become overbought or oversold. Let us first get into the specifications of the strategy.

Time Frame

The strategy works well on higher time frames such as ‘Weekly’ and ‘Daily.’ Therefore, the strategy is suitable for swing and long-term traders.

Indicators

We use the following indicators in the strategy:

  • William’s %R
  • Simple Moving Average (standard setting)

Currency Pairs

The strategy applies to all currency pairs listed on the broker’s platform, including major, minor, and exotic pairs. This is one of the distinguishing features of the strategy.

Strategy Concept

The William’s %R indicator usually ranges between 0 to -100, where a reading of 0 to -20 tells us that the asset is overbought. On the other hand, if %R falls in the range of -80 and -100, the asset is said to be oversold. As with other technical indicators, %R generates accurate trading signals when used in conjunction with other analytical tools such as chart patterns and systems.

Just because an asset may appear overbought and oversold based on the %R, this doesn’t necessarily mean that the price will reverse. Hence, we include a few concepts of the chart pattern and price action to confirm that the reversal is real. The more we wait, the higher the confirmation. But this reduces the risk-to-reward (RR) ratio moderately. This depends more on the type of trader if he is more conservative or aggressive.

In the strategy, we firstly establish a trend that is mostly in the overbought or oversold situation. This means William’s %R should indicate an overbought situation of the market for a major part of the trend during an uptrend. On the other hand, in a downtrend, William’s %R should indicate an oversold market situation for a major part of the trend. When the trend remains in the overbought or oversold condition for most of the time, the reversal tends to be sharp in nature.

This is why the above condition is important for the strategy. Next, we wait for the ‘Bullish Engulfing’ pattern to appear on the price chart, in a reversal of a downtrend. Likewise, in a reversal of an uptrend, we wait for the ‘Bearish Engulfing’ pattern to appear on the chart. This is the first sign of reversal. The reversal is confirmed when the price starts moving above the moving average, in a downtrend, and below the moving average, in an uptrend.

Stop-loss for the trade will be placed below the ‘engulfing’ pattern in a ‘long’ position and above the ‘engulfing’ pattern in a ‘short’ position.

Trade Setup

In order to explain the strategy, we will be executing a ‘long’ trade in EUR/USD currency pair using the below-mentioned rules. Here are the steps to execute the strategy.

Step 1: The first step of the strategy is to identify the major trend of the trend. An easy to determine trend is if the price is below the simple moving average, the market is in a downtrend, and if the price is above the simple moving average, the market is in an uptrend. Here we need to make sure that William’s %R indicates an overbought/oversold market situation for the major part of the trend.

The below image shows an example of a downtrend that is oversold.

Step 2: The next step is to wait for the market to present the ‘Engulfing’ pattern on the chart. In a downtrend, the ‘Bullish Engulfing’ pattern indicates a reversal of the trend, while in an uptrend, the ‘Bearish Engulfing’ pattern indicates a reversal of the trend. If the second of the engulfing pattern closes above the MA in a reversal of the downtrend, the reversal will be more prominent. Similarly, if the second candle closes below the MA in a reversal of the uptrend, the reversal can be resilient.

Step 3: The rule of entering the trade is fairly simple. We enter ‘long’ when the price starts moving further above the moving average after the occurrence of an ‘engulfing’ pattern. Similarly, we enter ‘short’ when the price starts moving further below the moving average after the occurrence of the ‘engulfing’ pattern.

Step 4: Lastly, we need to determine the stop-loss and take-profit for the trade. In a ‘long’ position, stop-loss is placed below the ‘Bullish Engulfing’ pattern. In a ‘short’ position, it is placed above the ‘Bearish Engulfing’ pattern. The take-profit is set at a point where the resultant risk-to-reward (RR) ratio of the trade will be 1.5. However, partial profits can be taken at the opposing ‘support’ and ‘resistance’ levels that might be a hurdle for the price.

In our example, the risk-to-reward (RR) ratio of 1.5 was achieved after a period of one month since traded on the ‘Daily’ time frame.

Strategy Roundup

William’s %R is a very powerful indicator that helps us identify opportunities during a reversal phase of the market. It is important to note that %R should never be used in isolation. Combining the %R indicator with chart pattern, price action, and market trend gives us an edge in the market, which is difficult to get when applied individually. Trade executed using the above strategy can longer than expected to give desirable results since it is based on a higher time frame.