
EURUSD approaching resistance – buyers beware!
Thank you for joining this forex academy educational video.
In this session, we will be looking at the EURUSD pair, which has found a recent bid tone at the time of writing and is approaching a significant area of resistance.
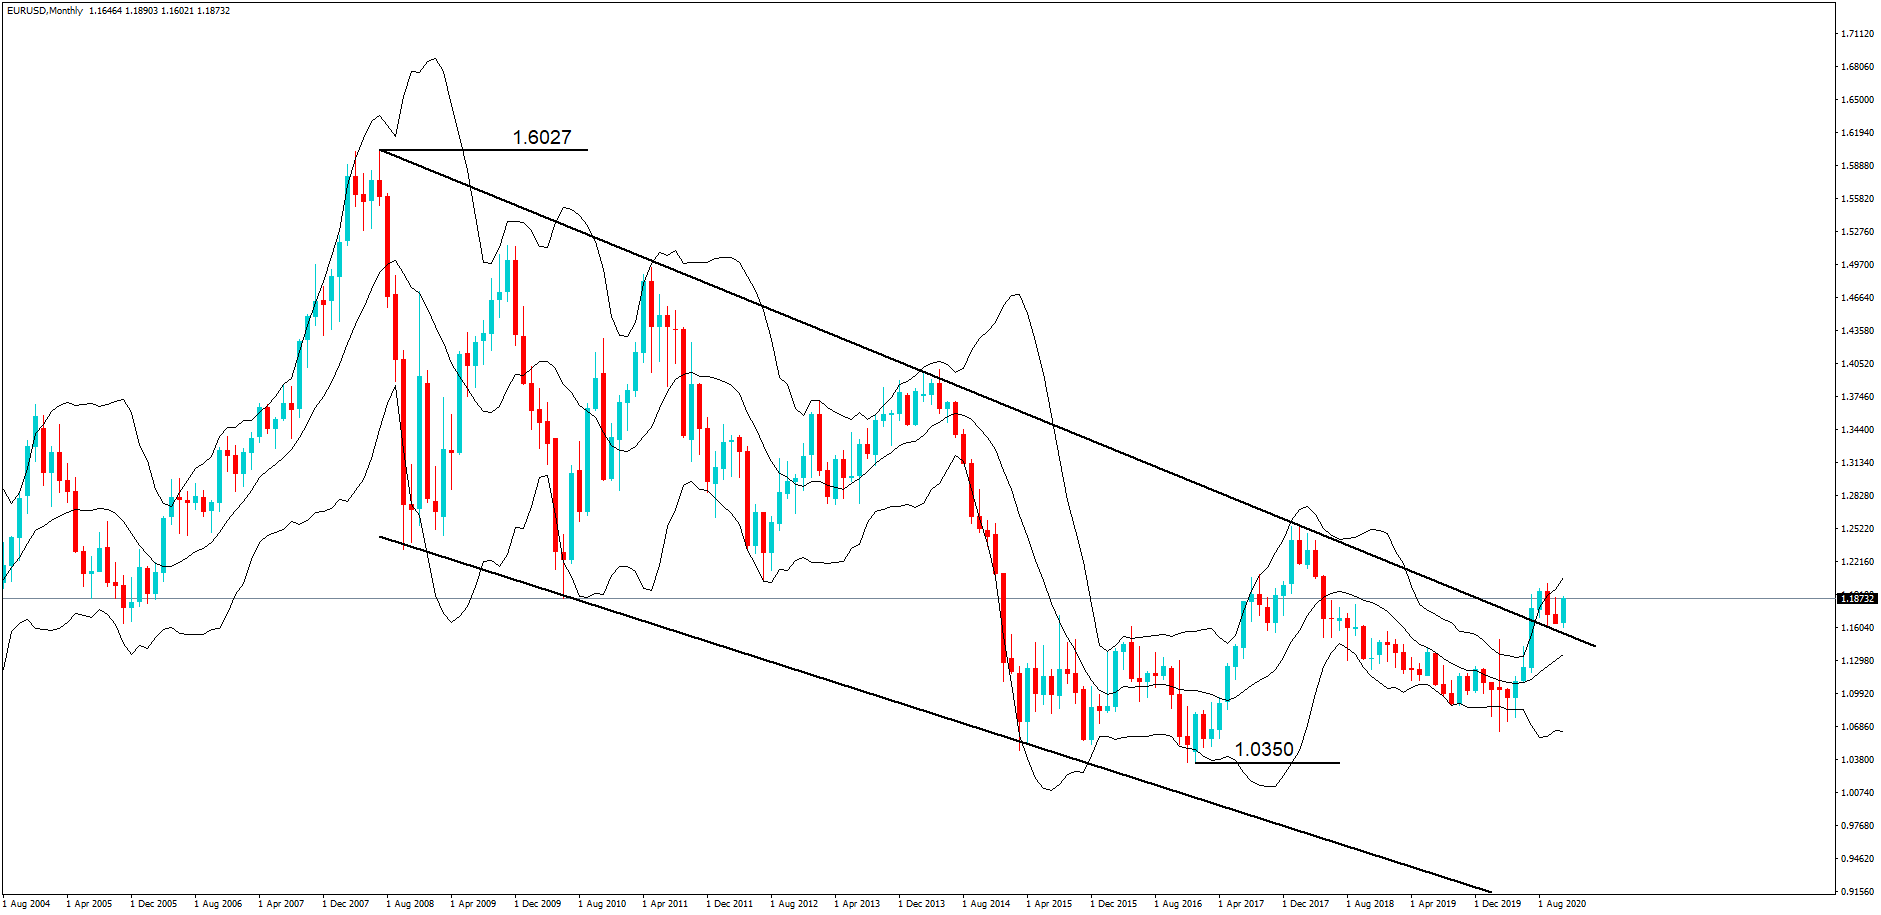
In this monthly chart, we can see the overall declining price action, which has been conforming to the trendlines from December 2007, where price reached a heady high of over 1.600 against the US Dollar, to a low in January 2017 of 1.0350. That’s quite a fall.
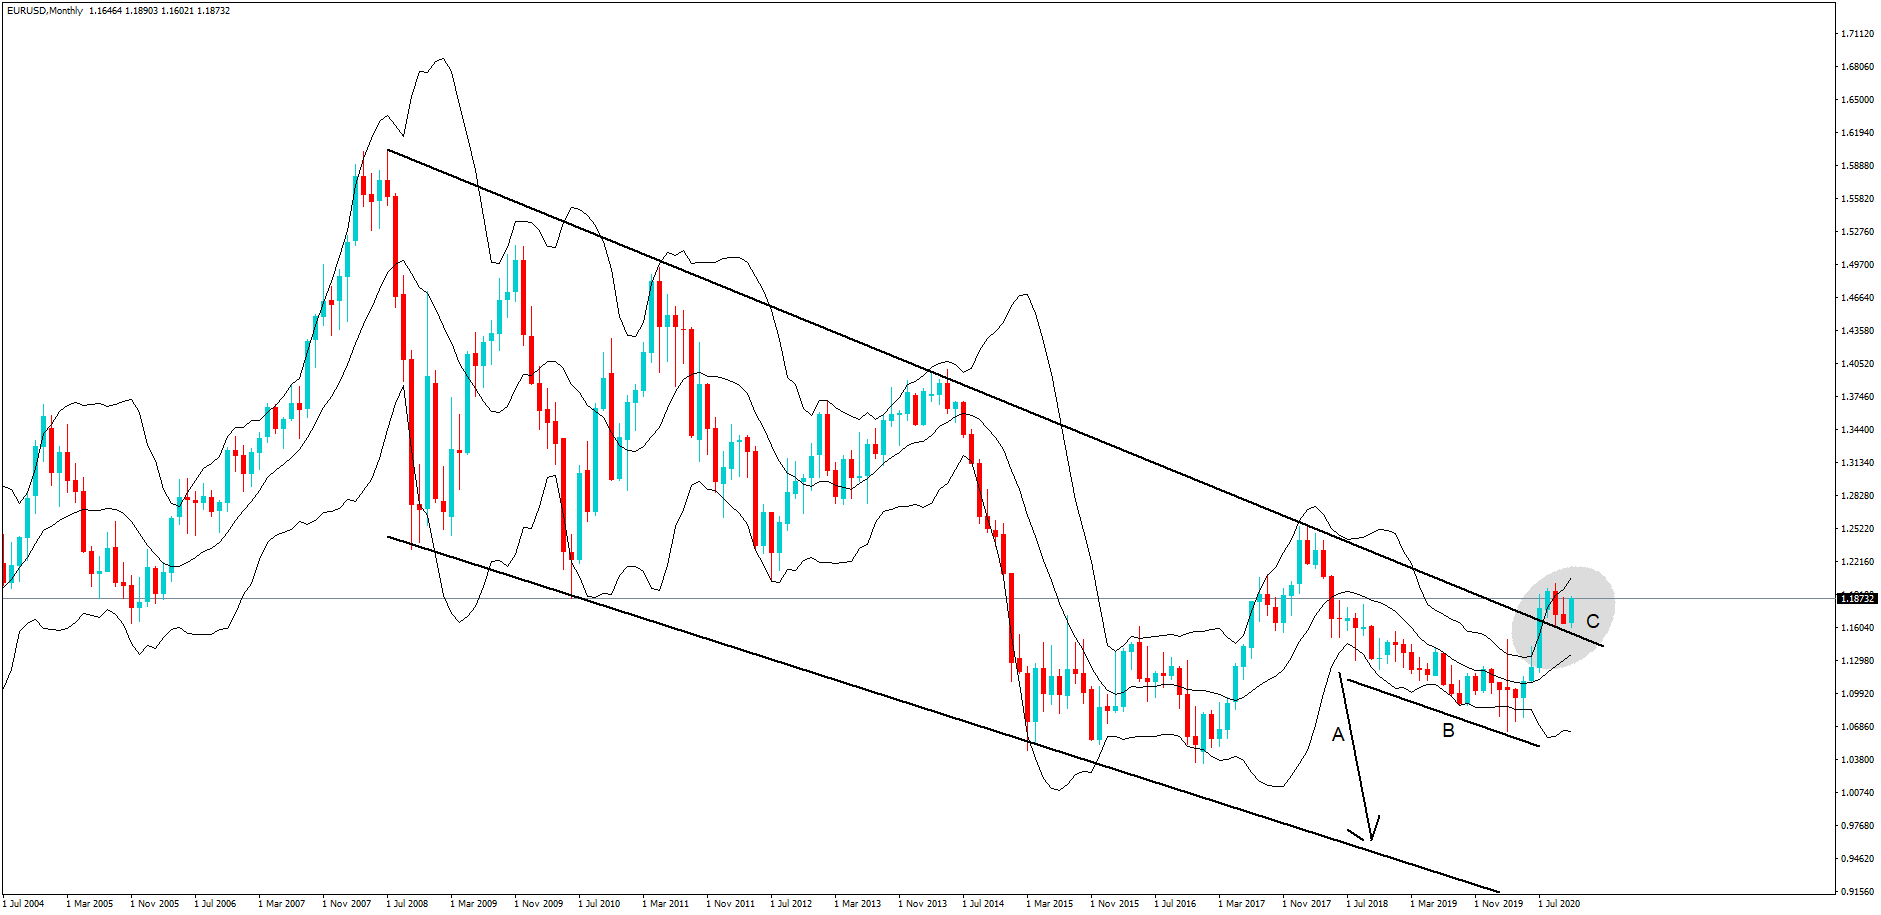
The continuation with the rejection of the declining resistance line and a failure at position A of price action to continue down to the support line gave rise to a lack of institutional sized sellers and a shallower support line forming around position B until price action reverted to the resistance line, where it eventually breached it at position C. This shows that institutional size traders were finding the Euro attractive than the US dollar at around the time of the Covid pandemic seriously affecting the United States economy, while the Europeans got to grips with the pandemic in terms of financial relief packages for EU citizens and businesses.
The big test for institutional size traders is whether or not this is just a breach and that price action will move back inside the channel to retest the shallower support line at position B or if there is a sustained move higher, which will be a failing of the monthly trend.
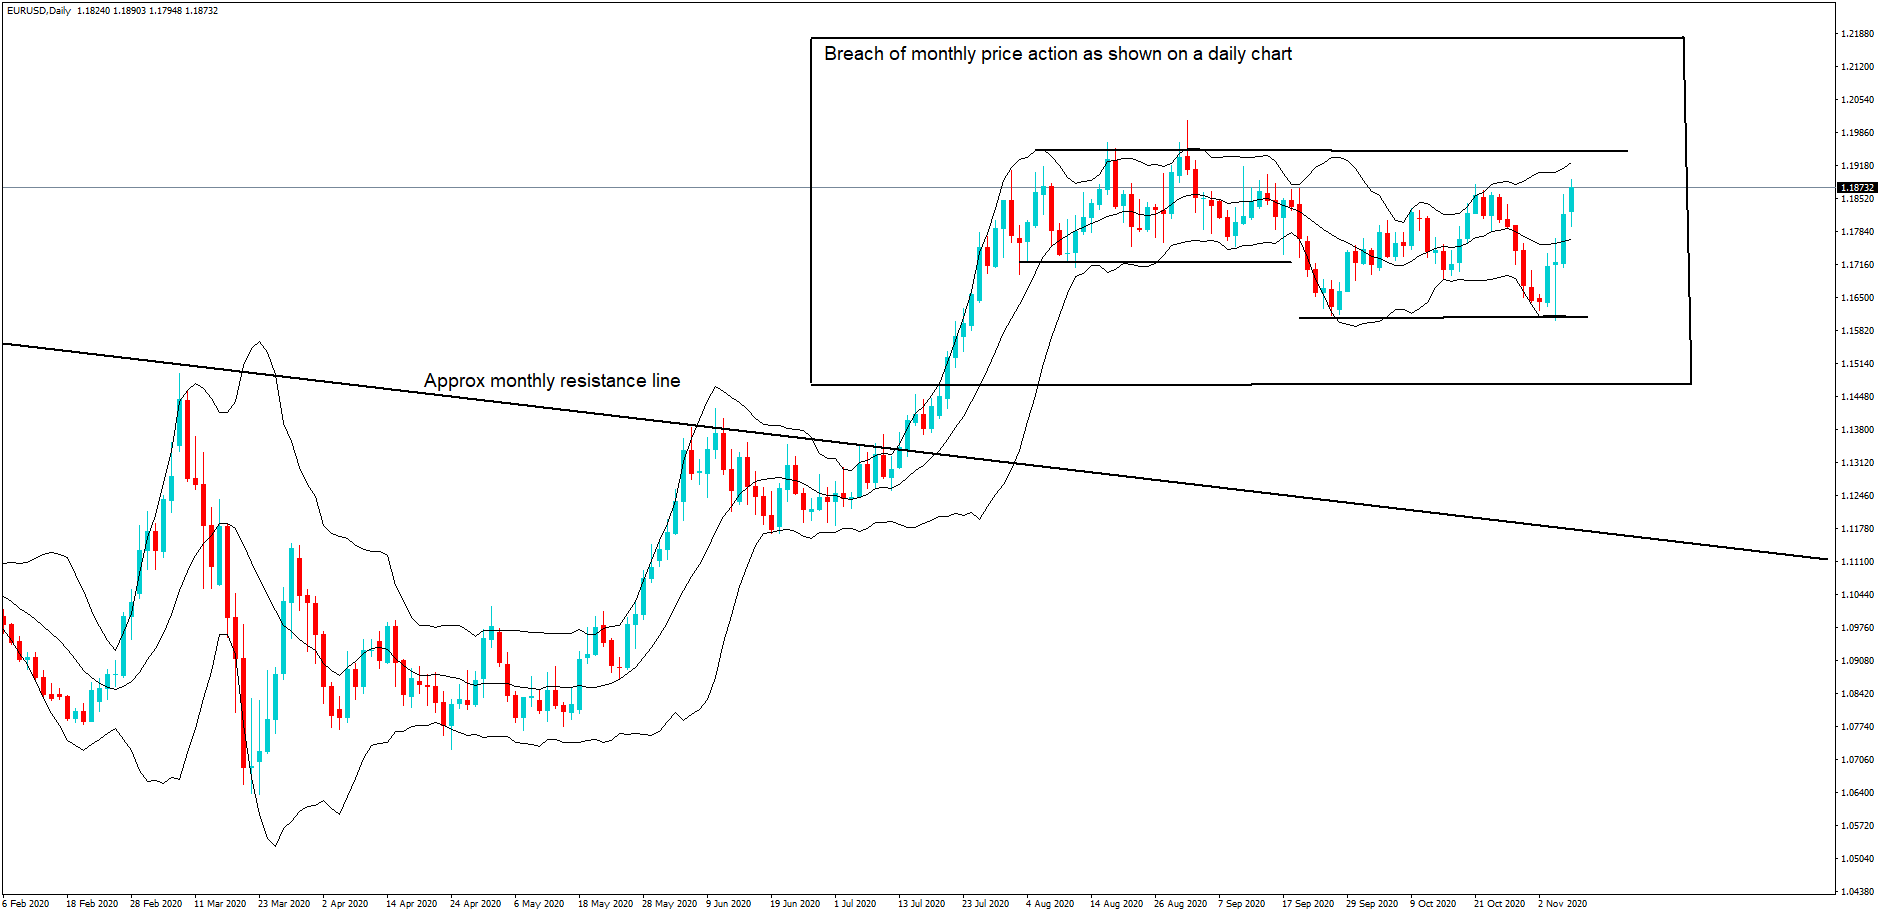
In this chart, we have reduced the monthly candlesticks to a daily chart to try and identify the section of price action which has been going on since the monthly resistant line was breached in order to try and ascertain where the levels are where we might find further resistance and which might cause price action to revert back into to the monthly channel or to try and identify if the price action will continue outside of that trend and form a new bid trend.
In this chart of the daily time frame, we have identified a clear area of resistance at around 1.1950, followed by a period of support at around 1.1717, which eventually is breached to just above 1.1600, only for price action to find support here and move higher.
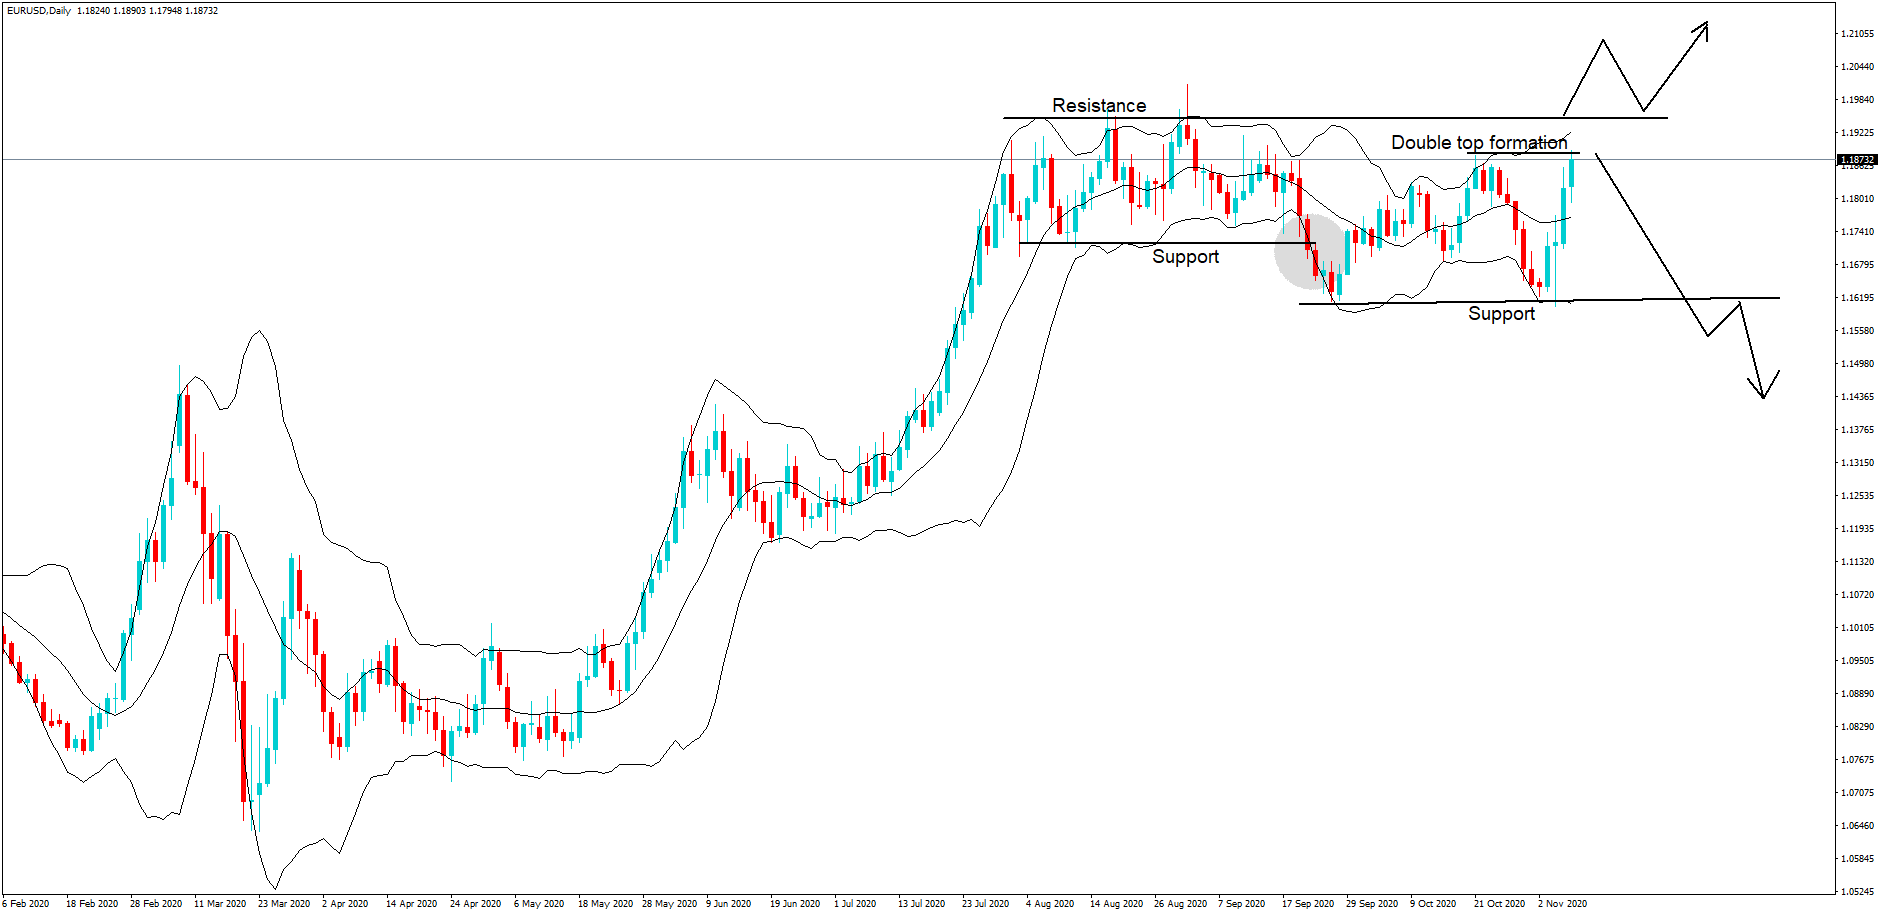
Price action has currently reached a double top formation, and with the original area of resistance only around 50 pips above it, the next test will be to see if the price action will continue up to the resistance line, then move above it, fall back to it and where that then becomes an area of support – such as our hypothetical arrows – and that price action will conform a continuation to the upside and the end of the monthly bear channel.
Conversely, should price action move back below the support line, and then back up to it, and fall lower and where they support line becomes an area of resistance, again – such as our hypothetical arrows – this will tell institutional traders that the breach of the monthly trend may see price action fall back in line with the bear trend.
New traders are advised to look at the longer-term trading picture, such as the daily and monthly charts because this is where the swing traders look for trading ideas, and this includes institutional size investors, and these types of traders have big money to play with, which will have a major impact on price direction in the forex market.
Related posts
 Daily FX Brief, November 25 – Major Trade Setups – Stronger Dollar In Play!
 Daily F.X. Analysis, May 29 – Top Trade Setups In Forex – Fed Chair Powell Speech in Focus!
 Forex – How To Trade The USDJPY Pair!
 Daily F.X. Analysis, November 18 – Top Trade Setups In Forex – Series of Inflation Reports Ahead!