Categories
Forex Price Action

The Daily-H4 Combination Trading: Do Not Only Look for Reversal Candle

The daily–H4 combination traders are to wait for the daily chart to produce a reversal candle first to look for entry. Once the chart produces a daily reversal candle, traders are to flip over to the H4 chart; wait for consolidation and an H4 reversal candle to trigger an entry. We must not forget that if the daily chart is trending, the daily-H4 combination trading strategy may offer entry as well. In today’s lesson, we are going to demonstrate an example of that.

This is a daily chart. The pair produced a bullish engulfing candle and three more bullish candles followed. The daily-H4 combination traders are to keep their eyes on the pair right after it produces that bullish engulfing candle. Let us assume on the fourth day, we flip over to the H4 chart as well.

This is how that H4 chart looks. The chart shows that after making a bullish move, the price starts having consolidation. The last candle comes out as a bearish pin bar. It seems the chart may take time to produce a bullish reversal candle to offer a long entry. Then again, we never know. It may be just around the corner.

The char produces a good-looking bullish engulfing candle closing well above consolidation resistance. The buyers may trigger a long entry right after the last candle closes by setting stop loss below consolidation support and by setting take profit with 1R. Let us move to the next chart to see how the trade goes.

The price consolidates again. After producing such a good-looking signal candle, it seems a bit unusual. The last candle has a bearish body but it has a long lower shadow. Be patient and see what the price does next.

Look at the last candle. It comes out as a bullish engulfing candle. This is a strong sign that the price may head towards the North now. As far as the last candle is concerned, the price may not take too long to hit the target.

As expected, the price heads towards the North with good bullish momentum. It produces only one bearish candle before hits the target. As it seems, a bearish inside bar followed by a bullish engulfing candle may push the price towards the North further. Anyway, the buyers have achieved their 1R here with ease.

The message we get from today’s lesson is that if the daily chart is trending, we may keep an eye on the H4 chart to take entries with the trend as well. If it produces a reversal candle, we may look for entries too. However, we must not look for short entries if the last daily candle is bullish and vice versa.

Categories
Forex Price Action

The H1-15M Combination Trading: Waiting for an H1 Reversal Candle Ensures Better Reward

The H1 reversal candle plays a significant part in the H1-15M chart combination trading. If the traders wait to get an H1 reversal candle, by using candle’s lower low/higher high, they get a better risk-reward. In a bearish market, a trader needs to wait for an H1 bearish reversal candle after the breakout. In a bullish market, he needs to do the opposite. In today’s lesson, we are going to demonstrate an example of a bullish market where the H1-15M chart combination offers an entry upon producing an H1 bullish reversal candle. Let us get started.

This is an H1 chart. The chart shows that the price heads towards the North with good bullish momentum. The price, then upon finding its resistance, has been in a bearish correction. It consolidates around a level and heads towards the North. The buyers are to keep their eyes on the chart with a hope that it may make a bullish breakout.

The chart shows that the last candle makes a bullish breakout closing well above the last highest high. The buyers are to wait for the chart to produce an H1 bullish reversal candle followed by a 15M bullish candle to trigger a long entry. Let us keep watching the chart to get that H1 bullish reversal candle.

The chart shows that it produces two doji candles. It means the price has been in bearish correction at the minor charts. An H1 bullish reversal candle at the breakout level would be the ‘getting ready’ signal to go long in the pair.

Look at the last candle. The last candle comes out as a bullish candle forming at the breakout level. The buyers are waiting for the chart to produce such a candle. They may flip over to the 15M chart now. Let us flip over to the 15M chart.

The last candle comes out as a bearish inside bar. Since the H1 candle closes as a bullish candle, so a 15M bullish candle is the signal to trigger a long entry. Let us proceed to the next chart.

Here it is. The chart produces a bullish Pin Bar. The buyers may trigger a long entry right after the last candle closes. Traders may set their stop loss below the H1 bullish reversal candle’s lowest low, which is below the red-marked level. To set take profit, they may use Fibonacci levels. If the price trends from 61.8%, it usually goes up to the level of 161.8%. Let us find out how this one goes.

Yes, the price heads towards the level of 161.8% with good bullish momentum. If we flip over to the 15M chart right after the breakout, we would take entry by setting stop loss below 00.00%. By waiting for an H1 reversal candle, we may set the stop loss below 38.2%. This ensures a better risk-reward. On the other hand, if we always wait to get an H1 reversal candle after the breakout, we may not get it all the time. Thus, we end up being offered less number of entries in the H1-15M chart combination trading.


Categories
Forex Daily Topic Forex Price Action

The Levels You Need to Pay Extra Attention

Support and Resistance are the two key factors of Forex trading. The good thing is in most cases time these levels can be guessed well earlier. By drawing support/resistance levels where the price reacts earlier,   we can spot those levels. This helps a trader set his stop loss, take profit and make a trading decision. In today’s lesson, we are going to demonstrate an example of how the previous levels where the price reacts earlier play a significant part as far as support/resistance is concerned.

Look at the chart carefully. The price makes a strong bearish move and makes an upside correction. The chart produces a spinning top followed by a bearish engulfing candle. If we consider the existent trend and candlestick pattern, it is a short signal. The question is whether it really is a short signal or not. Look at the next chart.

At the correction, one of the candles breaches through a level. This level was a level of support earlier. After being bearish, the level should work as a level of resistance. It does not. The price breaches through the level. In fact, it may work as a level of support again. If it produces a bullish reversal candle, the buyers are going to take control here.

The level seems to hold the price as a level of support. It produces two a bullish pin bar and a doji candle. If it produces a bullish engulfing candle here, the price may get bullish and head towards the North.

The chart produces a bullish engulfing candle closing well above the wave’s highest high. Let us calculate whether the buyers should go long here or not. The price makes a bullish move breaching a significant level. The price makes a bearish correction and the breakout level works as a level of support. As far as price action trading is concerned, traders may trigger a long entry right after the last candle closes.

As expected, the price heads towards the North with good bullish momentum. It gets the buyers 1R already. The last candle comes out as a bearish inside bar. The price may reverse now. However, there is still a 40% possibility that the price continues its bullish move. Let us assume that the buyers close the trade and cash in some profit.

If we consider the whole scenario, the market seems bearish in naked eyes. When we draw the significant level, it gives us a clearer picture of the breakout and correction. We, then realize that the market is actually bullish. A long entry at the pullback gets the buyers some green pips. This is what Support and Resistance (significant levels) do.

Categories
Forex Price Action

The H4-Daily Combination Strategy: Do not Get Carried Away

In today’s lesson, we are going to demonstrate an example of an H4-daily chart combination trading. The lesson has an important message to remember for the H4-Daily combination traders. Let us get started.

The chart shows that the price produces a double top and heads towards the South with good bearish momentum. The daily candle closes as a bearish Marubozu candle having no lower shadow at all. The next trading day starts with a Spinning Top. It seems that the H4 chart starts having consolidation. The last H4 candle comes out as a bullish engulfing candle. This looks good for the sellers that the price is having consolidation after making a good bearish move. However, the H4-Daily combination traders must not forget one thing that the signal is to be produced within the next two candles. Otherwise, it becomes daily support.

The fifth H4 candle of the day comes out as a bearish engulfing candle. The candle closes well below consolidation support. The sellers may trigger a short entry right after the last candle closes by setting stop-loss above consolidation resistance and by setting take profit with 1R.

The next candle comes out as a bullish inside bar after triggering the entry. The sellers would love to get a long bearish candle here. However, a bullish inside bar suggests that the bear still holds the key. Let us proceed to the next chart.

The next candle comes out as a bearish engulfing candle. This looks extremely good for the sellers now. The price finds another resistance. This attracts sellers to add more short positions. Anyway, the H4-Daily combination traders are to wait for the price to hit their 1R take profit.

The price takes two more candles to hit the target. I would say that the price hits the target at a moderate pace here. Anyway, the H4-Daily combination strategy offers entry, and the trade setup works well for the sellers.

The message this lesson has is that we must not get carried away with bullish or bearish move followed by consolidation. The H4 chart is to produce a trade signal within the next day. If it does not, that chart does not belong to the H4-Daily combination trading strategy.  If it does, then the H4-Daily combination traders may trigger an entry.

Categories
Forex Fibonacci

How to Use Fibonacci Levels in the H1-15M Combination Trading

In today’s lesson, we are going to demonstrate an example of an H1 chart offering an entry. We find out how Fibonacci levels and 15-min chart help us take the entry. Let us get started.

This is an H1 chart. The chart shows that the price after making a strong bearish move has been making an upward correction. The chart produces a Shooting Star and creates a bearish momentum. However, the sellers are to wait for the chart to make a breakout at the lowest low of the wave. Let us proceed to the next chart to find out what the price does next.

The price keeps driving towards the South and makes a breakout at the lowest low. The breakout candle has a long lower shadow, but it closes well below the level of support. The H1-15M combination traders may flip over to the 15M chart now.

This is how the 15M chart looks. The last candle comes out as a bullish candle. The sellers are to wait for a bearish reversal candle to go short in the pair. They must concentrate hard on the chart. It is waiting time for the sellers.

The 15M chart produces a bearish reversal candle. The candle has a long lower shadow but has a thick bearish body. Moreover, the H1 chart makes a breakout, so a 15M bearish reversal candle means a lot to the sellers. The sellers may trigger a short entry right after the last candle closes. There is another equation, which we will reveal in a minute. Let’s now find out how the trade goes.

The price heads towards the South with good bearish momentum. The 15M chart shows that it consolidates now and then. The H1 chart should look much more bearish than this. Ok, here is the equation we have pointed out a bit earlier. Let us draw Fibonacci levels and find out how it may help us set our stop-loss and take-profit levels.

The Fibonacci levels show that the price trends from the level of 61.8%. It makes a breakout at the level of 100.0 and heads towards the level of 161.8. When the price trends from 61.8%, it creates an extra momentum. This is what this example shows, as well. With Fibonacci, we know where to set the take-profit level. Yes, it is to be at 161.8%. With stop-loss, you may set it above 61.8% if you are too defensive a trader. If you want to be too tight with your stop loss, you may set it between 78.6% to 100.0%. The first one offers less risk-reward, but it has a higher winning percentage. On the other hand, the second one offers excellent risk-reward but has less winning percentage. The choice is yours.

Categories
Forex Daily Topic Forex Price Action

Double Top-Engulfing Combination and Trade Management

In today’s lesson, we are going to demonstrate an example of daily-H4-combination trading. The trade setup starts with a double top, and the trend-initiating candle comes out as a bearish engulfing candle. The price consolidates and produces another bearish engulfing candle closing below consolidation support. We find out what happens next and how we may manage the trade to get the best result out of it.

This is an H4 chart. The chart shows that the price produces a double top. At the second rejection, the reversal candle comes out as a bearish engulfing candle and drives the price towards the South with good bearish momentum. Upon finding its support, it consolidates for a while and produces another bearish engulfing candle. We know what the daily-H4 combination traders are to do here.

The daily-H4 combination traders may trigger a short entry right after the last candle closes by setting stop-loss above consolidation resistance and by setting take profit with 1R. Let us proceed to the next chart to find out what the price does after triggering the entry.

The next candle comes out as a bearish candle as well. It looks good for the sellers. It seems the price may not take too long to hit the target of 1R. Let us proceed to the next chart.

It does not look good for the sellers now. The last candle comes out as a bullish engulfing candle. It suggests that the price may get bullish and hit the stop loss. Since this is an H4 chart, traders are to manage their trades according to the candlestick. The entry is carrying a loss now. Traders have three options here.

  1. They may close the whole entry
  2. They may let the whole trade run
  3. They may close 50% of the entry

It depends on an individual trader how he likes to manage his trades. Some traders may want to keep the whole trade, and some may want to close the whole trade. There is a saying that cut your losses short and let your profit run. Thus, we may manage the trade by closing half of it and let the rest of it run. This is how we earn or lose 50% of the initial target. Let us see how it goes now.

The chart produces a spinning top and heads towards the downside. The last candle comes out a hammer, but it hits the target of 1R. This means the trade setup brings profit for the sellers. It may have gone another way round. Thus, in such a situation, taking out half of the trade offers us less profit but less loss as well in the end. It does not always happen. However, when it does, we may consider managing the trade by doing it so.

Categories
Forex Elliott Wave

Advanced Applications in Wave Analysis – Part 2 of 4

Introduction

As we commented in previous articles that cover the corrective structures, R.N. Elliott considers its study as a key to understand the current market situation and what to expect for the next path.

In this educational article, we expand the observations of the flat and the zigzag pattern.

Corrective Patterns in Action

In the first part of this four-part series, we commented that impulsive waves create trends. Corrective waves correct or retrace the progression of the trending movement developed by the motive waves. A corrective structure will never appear in a wave 1, 3, 5, in a wave A and C of a zigzag, and wave C of a flat pattern.

The Flat Pattern

The flat pattern develops different variations depending on the strength of the trend or the level of complexity of the correction in progress. In its fundamental nature, the flat follows an internal sequence as 3-3-5.

On the other hand, variations in the flat pattern surge in the extensions of its waves B and C. In brief words, as wave B extends more than the 100% of wave A, wave C will tend to be short. And the lesser the retrace of wave A by wave B, the larger wave C will be.

  1. Failure in B. This case represents the scenario when wave B retrace between 61.8% and 81% the progress of wave A. If wave B extends beyond 81%, it means that the market is temporarily weak. Wave B will fail when the wave A be a double zigzag or a double combination. Wave C will tend to retrace the advance of wave B entirely. This variation could appear in waves 2, 4, A, B, or inside a horizontal triangle in its legs C, D, or E.
  2. Failure in C. This type of failure tends to occur when wave A experiences a complete or almost complete retracement made by wave B. When the price movement fails in wave C, the market shows a signal against the dominant trend. In this context, this pattern will appear in a terminal sequence. Wave C duration will be shorter than wave B and will show a similar duration than wave A. This variation could arise in waves 2, 4, A, B, or the wave 5 of a terminal impulsive wave.
  3. Regular. This formation is the typical flat pattern. Wave B retraces at least 81% of wave A, and wave C will advance wave B entirely. Also, this wave could extend between 10% and 20% beyond the end of wave A. In this variation, wave B will tend to be a complex structure, and its extension in time will be longer than waves A and C. The regular flat could rise in waves 2, 4, A, B, or in waves C, D, or E in a terminal impulsive wave.
  4. Double Failure. This scenario is infrequent; however, the double failure occurs when wave B to retrace beyond 81% of wave A, and wave C doesn’t extend beyond 100% of wave A. The double failure variation will look like a contracting triangle. Finally, this scenario will tend to appear in waves 2, 4, in wave A inside of a triangle or an irregular flat. When it happens in a wave B, it could belong to a zigzag, a regular on in an extended flat.
  5. Extended. This configuration occurs when wave C advance reaches between 138.2% or beyond 161.8% of wave B. Waves A and B must be similar in terms of price and time. This variation should tend to appear in waves 1, 3, or 5 as an impulsive terminal wave. In waves A, B, C, or D in a horizontal triangle, or wave E of an expanding triangle.
  6. Irregular. This is the most straightforward variation of the flat pattern. At the same time, it isn’t easy to find it in the real market. This pattern is indicative of the strength of the previous move. Wave B must be higher than wave A in price. Generally, wave C will be equal to wave A in price and time relation. This variation tends to appear in waves 2, 4, in wave B before the extended wave C of a flat, or as the wave B in a zigzag when wave C moves beyond 161.8% of wave A.
  7. Continuous. This correction is the most powerful variation of the flat pattern. This type of formation tends to imply volatile movements of the same degree. The continuous flat pattern tends to emerge in the second wave after an extended third wave. When it appears in the fourth wave, this variation could occur before a fifth extended wave. In a wave B, it surges before an extended wave C; in a triangle pattern, it could happen in the a-b-c series, or in a wave B of a zigzag that forms a triangle structure.

The following figure represents the seven flat pattern variations.

The Zigzag Pattern

The main difference between zigzag and flat pattern is that zigzag does not have a wide variety. The central aspect to take in consideration with the zigzag pattern is the extension of wave C compared with wave A, and the subdivisions number of wave C compared with wave A.

  1. Wave A. This wave must have an impulsive structure; this means that its internal structure must contain five segments. The A wave of a zigzag formation shouldn’t experience a retrace beyond 61.8% by wave B. If the wave B retraces beyond 61.8%, this could be indicative that the market is developing a complex correction as a double zigzag or a double combination.
  2. Wave B. This wave must show a corrective structure with three segments in its construction. As stated earlier, its progression should not go beyond 61.8% of wave A. This wave never will present a continuous correction. If this situation occurs, then the zigzag moves inside a triangle pattern. In this case, the zigzag will be the second wave of an impulsive sequence. Consequently, if this scenario occurs, then the wave B could not be a complex corrective structure as a double or triple zigzag, nor any other type of combination of corrective structures.
  3. Wave C. This part of the zigzag pattern contains five internal segments. Its extension could be from 61.8% to 161.8% of wave A.

Conclusions

In this educational article, we presented the variations of the flat pattern and the zigzag. These variations can provide a significative clue to the wave analyst respecting to the market situation and what to expect for the following sessions.

In the next educational article, corresponding to the third part of the advanced applications in wave analysis, we will present the variations in the triangle pattern.

Suggested Readings

      • Neely, G.; Mastering Elliott Wave: Presenting the Neely Method; Windsor Books; 2nd Edition (1990).
Categories
Forex Elliott Wave

Advanced Applications in Wave Analysis – Part 1 of 4

Introduction

The Elliott wave theory applied in financial markets allows the wave analyst to support its forecasting process and make a decision in the investment stage.

This educational article corresponds to the first of four parts, which aim to help understand the current market position. In particular, we’ll present the impulsive waves and its variations.

Impulsive Waves in Action

The impulsive movements appear only in advance positions. In consequence, waves 2, 4, b, d, or x, will never be part of a motive wave. The wave analyst can find motive waves in only two market stages, in a trend structural series or when the markets develop a terminal sequence.

Trending Impulsive Waves

  1. First Extended Wave. When the market progress in a first extended wave, the second wave shouldn’t retrace beyond 38.2% of the first wave and should take more time in its formation than the fourth wave. The fifth wave will be the shortest motive wave. 
  2. First Non-Extended Wave. When the first wave is not the extended wave, the second wave can retrace it until 99%. If the first wave surges after a noticeable decline, the third wave will be the extended wave.
  3. Second Wave. If the first motive wave is (or probably will be) the extended wave, the second wave should not retrace beyond 38.2%. If the first wave is not the extended wave of the impulsive sequence, the second wave could retrace it until 99%. If in the second wave, its wave A retraces beyond 61.8%, thus the second wave should fail in its wave C.
  4. Third Extended Wave. This sequence has more chances to occur in the real market. In general, the fourth wave tends to take more time in its completion than the second wave. When the third wave is the extended move, the fifth wave tends to fail.
  5. Third Non-Extended Wave. When the third wave is not the extended wave, then the first or fifth wave will be the extended wave. However, the third wave will never be the shortest.
  6. Fourth Wave. If the fifth wave is the extended wave, then the fourth wave will be the complex correction of the complete five-wave sequence. If the first wave is the extended move, then the fourth wave will be a simple correction, and the second wave the complex correction. Generally, when the fifth wave is the extended move, the third wave will experience a retrace between 50% and 60%. If the third wave is the extended wave, the fourth wave will be the complex and retrace the third wave between 38.2% and 61.8%.
  7. Fifth Extended Wave. When the fifth wave is the extended move, its length in terms of price will be at least the length between the first and the end of the third wave. In general, this extended wave should not experience a complete retrace.
  8. Fifth Non-Extended Wave. In this case, the fifth wave should experience a retracement near to 100%. If the fifth wave belongs to the third wave of upper degree, then the fifth wave will experience a retrace until the fourth wave zone.
  9. Failure in Fifth Wave. This case is possible when the third wave is the extended wave.

Terminal Impulsive Waves.

In his work “The Wave Principle,” R.N. Elliott defined this kind of pattern as “triangle diagonal.” However, Glenn Neely to avoid confusion re-calls to this pattern as “terminal impulsive wave,” providing an intuitive and it-self definition. 

  1. First Extended Wave. In this case, the terminal impulsive wave tends to appear. The second wave shouldn’t retrace beyond 61.8% of the first wave. The third wave should extend near to 61.8% of the first wave, but it should never be less than 38.2%. The fourth wave will tend to be 61.8% of the second wave, and the guideline that connects the ends of waves 2 and 4, should be clear in its identification.
  2. First Non-Extended Wave. When this scenario occurs, the terminal structure will be the wave C of a corrective formation and not the end of an impulsive sequence.
  3. Second Wave. As we said previously, if the first wave is the extended wave, the second wave should retrace until 61.8% of the first wave. If the first wave is not an extended wave, thus the second wave could retrace until 99% the first wave.
  4. Third Extended Wave. When the third wave is the extended wave, rarely the market will develop a terminal impulsive wave. The likely context in its appearance could occur in a wave C, not in a motive wave.
  5. Third Non-Extended Wave. If this scenario occurs, the first wave will likely be the extended wave, and the fifth wave will be the terminal impulsive wave.
  6. Fourth Wave. The third wave should not experience a retrace beyond 61.8% by the fourth wave.
  7. Fifth Extended Wave. This scenario can happen if the structure advances inside of the fifth wave of upper degree or when the terminal impulsive sequence is the wave C of a corrective pattern, except in a horizontal triangle.
  8. Fifth Non-Extended Wave. In this scenario, the fifth wave shouldn’t be higher than 61.8% of the third wave, and the fifth wave shouldn’t be more complex than the other two impulsive waves. The fourth wave should take less time and price than the second wave.

Conclusions

In this educational article, we reviewed the context of each case of extended, non-extended, and corrective waves, which advances in a motive sequence.

In particular, the wave analyst must maintain in consideration that in an impulsive sequence must have only one extended wave, in this context, a complex correction should appear before or after an extended wave.

In our next article, that corresponds to the second part, we’ll present the observations in corrective waves, in particular, we’ll discuss the flat and zigzag patterns.

Suggested Readings

  • Neely, G.; Mastering Elliott Wave: Presenting the Neely Method; Windsor Books; 2nd Edition (1990).
  • Prechter, R.; The Major Works of R. N. Elliott; New Classics Library; 2nd Edition (1990).
Categories
Forex Price Action

The H1-15M Breakout Trading: Concentrate on Breakout and Reversal Candle

In today’s lesson, we are going to demonstrate an example of a trade setup based on the H1-15M chart combination. Usually, the straighter the first move, the better it is.  However, the price sometimes consolidates in the first arm as well. Such consolidation makes a move look weak and may hold us back from eyeing on the chart. We try to find out whether we should skip eyeing on such a chart or not.

This is an H1 chart. The chart shows that the price makes a bullish move. Then, it produces a bearish inside bar followed by a bullish engulfing candle. The H1-15M buyers may flip over to the 15M chart to get a 15M bullish reversal candle to trigger a long entry. However, those two bearish H1 candles suggest that the 15M chart does not produce any bullish reversal candle after the H1 breakout. The price starts having a bearish correction instead.

The chart makes its bullish move, followed by a bearish correction. The bullish move does not look that impressive. It consolidates before making the bearish correction. Many traders may skip eyeing on this chart to go long in the pair. Ideally, the H1-15M combination trading requires an H1 breakout followed by a 15M bullish reversal to offer a long entry. Let us proceed to the next chart to find out what the price does here.

The price finds its support and heads towards the North. The last candle closes above the level of resistance. This is an H1 breakout. The H1-15M combination traders are to flip over to the 15M chart to trigger a long entry. Let us flip over to the 15M chart first.

This is how the 15M chart looks right after the H1 breakout. If the price comes back to the breakout level, and the level produces a 15M bullish reversal candle, the buyers may trigger a long entry.

The 15M chart produces a bearish engulfing candle closing within the breakout level. The next candle comes out as a bullish engulfing candle. The H1-15M buyers may trigger a long entry right after the last candle closes by setting stop loss below consolidation support and by setting take profit with 1R.

The price never looks back before hitting 1R. It heads towards the North at a very good pace. Consolidation and bullish reversal candle come out exactly the buyers would want to get. Do not forget that the first bullish move does not look that impressive. The breakout and 15M chart’s price action attract the buyers to go long here, though. This is what we are to look for in the H1-15M combination trading. It is good if the price makes a strong move in the first arm. However, if it does not, we may still eye on the chart to see whether it makes an H1 breakout and offers us an entry by producing a 15M bullish reversal candle.

Categories
Forex Elliott Wave

Additional Observations in Wave Analysis – Advanced Level

Introduction

R.N. Elliott, in his treatise “The Wave Principle,” emphasizes the importance of the corrective patterns knowledge. Elliott adds that its comprehension can provide to wave analyst an advantage in the forecasting process.

Glenn Neely, in his work “Mastering Elliott Wave,” not only expands this information defining a set of observations about the different corrective patterns and its potential implication for the next path. He also extends these observations to impulsive structures.

Corrective Patterns

The significative movements occur after a correction; in this sense, the knowledge of the potential extension of the next move provides a valuable edge to wave analyst.

The following list shows the corrective formations according to their strength level.

  1. Triple zigzag. This complex corrective pattern is the strongest of the corrections group. The triple zigzag rarely appears in the real market; however, its appearance is indicative of its strength (or weakness) level. When it surges, it will raise on a terminal structure, or in a triangle pattern. Once the triple zigzag ends, the next move will not experience a complete retracement.
  2. Triple Combination. This type of complex correction can be formed by a combination of flat, zigzag, and triangle. Usually, it will end with a triangle pattern. Once the triple three formation ends, the next path would tend to retrace the entire movement even in an upper degree. If this pattern surges as a terminal structure, the next move should entirely retrace the formation triple three.
  3. Triple Flat. This complex formation corresponds to the combination of three flat patterns. In this case, the next path should not retrace its advance completely, except when the Elliott wave structure surges as a terminal structural series in the fifth wave.
  4. Double Zigzag. This complex corrective pattern should not experience a complete retracement by the next movement.
  5. Double Combination. The double combination is a complex corrective pattern that generally could contain a zigzag or a flat formation with a triangle. In the same way, this structure tends to end with a failure in wave c. This pattern tends to be entirely retraced by the next path.
  6. Double Flat. This complex combination surges in rare cases. However, when it rises, generally, the next move will not retrace the complex structure fully.
  7. Extended Zigzag. This variation of the zigzag pattern generally appears in triangle formations or at the end of a terminal structure. The next path of an extended zigzag generally will never be entirely retraced.
  8. Extended Flat. This variation tends to emerge in triangle patterns. In the same way that the extended zigzag, the next move should not retrace it completely.
  9. Zigzag. This standard corrective pattern can be found in the real market. In general, the next path could retrace wholly and partially the extension of the zigzag pattern.
  10. Flat. Although this pattern and its variations are typical, the retracement of the next movement tends to be unclear.
  11. Double Three. In general, the extension of this complex corrective pattern tends to warn about the potential next movement. In short, while most extended being the double three pattern, the next move will be stronger.

Triangles

Glenn Neely, in his work, considers that triangle patterns require a different treatment. 

  1. Contracting Triangle. The thrust developed in a contracting triangle is a movement with a higher level of momentum. This move will be bigger or smaller, in terms of time, depending on its nature. If the contracting triangle is horizontal, the next path will be equal to the largest segment of the triangle. In the irregular contracting triangle case, the next movement will reach the 161.8% respecting to the largest leg of the triangle. Finally, in the continuous contracting triangle, the thrust can reach the 261.8% of the broadest segment of the triangle. 
  2. Expanding Triangle. In this kind of triangle, the thrust differs from the case of the contracting triangles. The thrust of an expanding triangle tends to be minor than the most extended segment of the triangle.

Impulses

The advantage of the next movement of an impulsive wave is the knowledge of the potential correction. In this context, it is tough to determine what kind of correction will occur before the corrective sequence begins. 

  1. Trend. After the motive wave completion, the impulsive movement should not experience a retracement beyond the origin of its first segment, except if the impulsive wave corresponds to a fifth wave. In general, waves A, 1, or 3, should not experience a retrace greater than 61.8% by the next move.
  2. First Extended Wave. When the extended wave is the first move, the motive wave should experience a retracement until the end of wave 4. 
  3. Third Extended Wave. In this case, once the impulsive wave is completed, the motive structure should experience a retrace between the high and low of the fourth wave.
  4. Fifth Extended Wave. The next corrective structure of a fifth extended wave should retrace more than 61.8% to the impulsive move.
  5. Terminal Structure. The movement after a terminal structure should retrace the progression of the terminal structure completely. The time elapsed in the evolution of the corrective move should be shorter than 50% of the time elapsed in the making of the terminal structure.

Conclusions

In this educational article, we discussed the observations described by Glenn Neely in his work “Mastering Elliott Wave” concerning the potential next movement, depending on the pattern in progress.

In this context, Neely, following the steps of R.N. Elliott, provides an ample proportion of time to describe what to expect after a corrective structure. This knowledge could provide the wave analyst an advantage in its comprehension about the market situation and what should be the potential next move.

In our following article, we will present the advanced applications in the wave analysis in a four-part series.

Suggested Readings

– Neely, G.; Mastering Elliott Wave: Presenting the Neely Method; Windsor Books; 2nd Edition (1990).

Categories
Forex Daily Topic Forex Price Action

The H1-15M Combination Trading in a Bearish Market

In today’s lesson, we are going to demonstrate an example of the H1-15M combination trading strategy offering a short entry. In one of our previous lessons, we demonstrated an example of a long entry. Let us see how it ends up offering us the entry.

This is an H1 chart. The chart shows that the price gets caught within two horizontal levels. The chart shows that the price after getting the last rejection has been heading towards the South. The sellers are to wait for a bearish breakout to go short in the pair.

Here it comes. The last candle breaches the level of support closing well below it. The H1-15M combination traders may flip over to the 15M chart to get a bearish reversal candle for triggering a short entry. Let us flip over to the 15M chart.

This is how the 15M chart looks. As expected, the last candle comes out as a bearish candle. If the next 15M candle comes out as a bearish candle closing below the last candle, the sellers may trigger a short entry. If the chart consolidates, the sellers are to wait for a 15M bearish reversal candle to take the entry. Let us find out what happens here.

The chart produces a bullish corrective candle. The sellers are to wait for a bearish reversal candle to go short in the pair. Usually, if the price makes a correction, it goes towards the breakout level and produces a reversal candle there. Let us find out where it produces a bearish reversal candle for the sellers.

The chart produces a bearish engulfing candle closing below consolidation support. The sellers may trigger a short entry right after the last candle closes. Stop Loss and Take Profit are to be set according to the H1 chart. Stop Loss is to be set above H1 horizontal resistance before the breakout, and Take Profit is to be set with 1R. Let us now find out how the entry goes.

This is the H1 chart. We see that the price heads towards the South with good bearish momentum and hits the target of 1R with ease. After producing the 15M bearish reversal candle, the price never looks back but goes towards the trend’s direction. This is what usually happens in the H1-15M combination trading. The price heads towards the trend’s direction without wasting time.

Do a lot of backtesting in your trading chart to find out some entries based on the H1-15M chart. Then, do some demo trading with the strategy before going live. It will help you be a better trader.


Categories
Forex Daily Topic Forex Price Action

When a Double Top and an Engulfing Candle Comes Together

In today’s lesson, we are going to demonstrate an example of a chart where the price heads towards the downside upon making a double top. At the second rejection, the chart produces a bearish engulfing candle. Usually, a combination of these two does not usually go wrong. The price does not make a deep consolidation afterward. However, it still heads towards the South with good bearish momentum. Let us have a look at how it happens.

This is a daily chart. The chart shows that the last candle comes out as a Shooting Star. The daily –H4 combination traders may consider it as a bearish reversal candle and flip over to the H4 chart.

The H4 chart shows that the price produces a double top. At the second bounce, the reversal candle comes out as a bearish engulfing candle. This combination may attract the sellers to look for short entries upon consolidation and getting bearish reversal candle.

The chart produces a bullish candle. It finds its resistance and produces a bearish engulfing candle closing below consolidation support. The sellers may trigger a short entry right after the last candle closes by setting stop-loss above consolidation resistance and take profit with 1R. Here is an equation that we may think about that. The price does not make a deep consolidation. Since the price is bearish upon a double top and an engulfing candle, most probably, it will make a strong bearish move. However, if you are in doubt, leave it out. Let us proceed to the next chart to find out what happens.

The next candle comes out as a doji candle. The price heads towards the Stop Loss, but it does not hit, though. It looks good for the sellers since the candle closes below the breakout level. Let us proceed to the next chart to find out what the price does.

The chart produces a long bearish candle and hits the target of 1R. Shallow consolidation may hold the price back a little to hit the target in a hurry. However, in the end, the sellers make some green pips with a combination of a Double Top and an Engulfing candle.

This trade setup does not meet all the requirements for combination breakout trading. The trend starts from a Double top resistance along with a bearish engulfing candle; it continues its bearish journey with more candles even after a shallow consolidation. This is what a combination of a Double Top/Bottom along with an engulfing candle can do. Thus, be keen on a chart if a trend starts with a combination of these two.

Categories
Forex Daily Topic Forex Price Action

The H1-15M Combination Trading Has a Lot to Offer

In today’s article, we are going to demonstrate a combination strategy. The combination is made of the H1 and the 15M chart. Since these two are busy intraday charts, thus a trader can find a good number of entries with this strategy. Let us now proceed and find out how it works.

The above image displays the H1 chart. The chart shows that the price gets caught within two horizontal levels. At the last bounce, the chart produces a bullish engulfing candle and heads towards the North. The sellers may wait for the chart to produce a bearish reversal candle at the level of resistance. On the other hand, the buyers are to wait for a breakout at the level.

The bull wins. A good-looking bullish candle breaches through the level of resistance, closing well above the level of resistance. Some traders may trigger a long entry right after the last candle closes. Some may initiate their long entries by setting limit order above the level of resistance. Every strategy has some advantages as well as disadvantages. Anyway, we are going to flip over to the 15 M chart to trigger an entry.

This is how the 15M chart looks. The last candle closes as a bullish candle too. This suggests that the bull has taken control. The H1-15M combination traders are to wait for the price to consolidate and produce a 15 M bullish candle to offer them a long entry.

The chart produces a bearish engulfing candle followed by a bullish engulfing candle. The buyers (H1-15M combination traders) may trigger a long entry now. The stop loss is to be set below the level of new support (breakout level), and take profit may be set with 2R. Let us proceed to the next chart to find out what the price does after triggering the entry.

This is the H1 chart. The chart shows that the price heads towards the North with good bullish momentum. The buyers achieve their 1R with ease. The point we may notice that the price never even comes back to the breakout level again after triggering the entry.

By using the H1-15M strategy, traders can get an excellent risk-reward. It offers a high winning percentage as well. In most cases, the price heads towards the trend’s direction with good momentum. On the contrary, the 15M chart may not always consolidate and produce the signal candle. Thus, traders may not get as many entries as they would like. However, since it is the H1-15M combination, it still offers a good number of entries per week in major pairs.

Categories
Forex Elliott Wave

Additional Basic Rules in Wave Analysis – Advanced Level

Introduction

In our previous educational article, we learned to recognize and count waves finishing the essential topics in the wave analysis process.
From now, we will start to present additional concepts and rules described by Glenn Neely in his work “Mastering Elliott Wave,” which would support the wave study.

Points of Tangency in the Guidelines

The tangency rule will help wave analysts in the process of identification between impulsive and corrective waves. This rule establishes that in a five segments pattern, only four internal movements will be touched simultaneously. This rule can be applied in impulsive and triangular formations.

The following figure illustrates a different set of Elliott wave structures where the wave analyst can apply this rule.

From the figure, the guidelines of both the first and second patterns converge each other. In the third figure, the guideline is parallel. The wave analyst must consider that the different segments that conform to the Elliott wave structure under analysis must have the same degree.

The following figure illustrates the tangency rule application in complex corrections.

From the figure, we distinguish that once touched the fourth point, corresponding to wave C completion, the price reacts against the direction of wave C. This reaction corresponds to a wave X. Its finalization will give the start of a new corrective structure from where the wave analyst could apply the tangency rule.

Rule of Time

Time is an essential element when the wave analyst makes its market study. According to the Elliott wave theory, in an impulsive structure, the two non-extended waves tend to be similar in price, time, or both. In corrective waves, a zigzag pattern its waves A and C tends to be identical in terms of time.

In short, the rule of time establishes that there can not be three adjacent waves of the same degree, which be equivalent or similar in time in a simultaneous way. 

The next picture illustrates the rule of time applied in impulsive structures.

From the figure, we observe that:

  1. If the two first segments of a pattern are equal or similar, the third segment will be different in terms of time, price, or both. The theory says that the third move will elapse the sum of the first and the second part.
  2. If the second segment lapses more than the first move, the third segment will be related in 61.8% or 161.8% of the first movement.
  3. If no one of the waves matches in terms of time, these could be adjusted in a Fibonacci ratio.

The following figure exposes the rule of time applied in corrective waves, in particular, the case of a flat pattern.

In some cases, the time elapsed by the wave C will be the sum of the time-lapsed by waves A and B. However, in the real market, the typical situation that could occur is that waves A and C will tend to match in terms of time, and wave B will be longer.

Conclusions

In this educational article, we started to present two basic rules for the wave analysis process. The first one corresponds to an extension of the canalization process, which its use allows the wave analyst to visualize with an objective method to define what kind of structure could be developing the price action.

The second one will bring the wave analyst a tool that would make a forecast of what could be the next path the market could take.

In the next educational article, we will present the advanced rules defined by Glenn Neely in his work “Mastering Elliott Wave.”

Suggested Readings

– Neely, G.; Mastering Elliott Wave: Presenting the Neely Method; Windsor Books; 2nd Edition (1990).


Categories
Forex Fibonacci

Fibonacci Trading: How Fibonacci Levels Give Clues to the Traders

In today’s Fibonacci lesson, we are going to demonstrate an example of a chart, which makes a bearish move. We dig into the charts and find out how we can take an entry based on Fibonacci levels and how the levels may help us giving clues to execute our plan. Let us get started.

The above figure shows an H1 chart. The chart shows that the price makes a bearish move at a moderate pace. It seems that the price finds its support. It has been having consolidation around the level of support having bounces three times. The last candle in this chart comes out as a bullish Marubozu candle. This may push the price towards the North. However, the sellers may still have the hope that they may get a bearish breakout here. Let us proceed to the next chart to find out what the price does.

The chart produces a bearish engulfing candle breaching the level of support. The pair trades for two more candles after the breakout. An important point is to be noticed here that the price is having an upside correction after the breakout. Sometimes price keeps trending after a breakout, whereas sometimes price makes the correction. Fibonacci levels have an important role to play in this. Thus, if we use Fibonacci levels, we are able to find out whether the price trends or makes correction well ahead. Let us now find out how we take the entry. We are to flip over to the minor chart. Since this is an H1 chart, we may flip over to the 15 M chart to trigger the entry.

Look at the arrowed candle. The candle comes out as a bearish Marubozu candle forming track rail. The candle is formed right at a flipped resistance. A short entry may be triggered right after the arrowed candle closes. The chart also shows how the price heads towards the South after the signal candle. Let us now see the H1 chart with Fibonacci levels.

The chart shows that the price trends from 78.6% level. Thus, it may reverse at 138.2%. It hits 161.8% here. However, we may set our target at 138.2% if the price trends from 78.6% to be safe. The Stop Loss may be set here above 100.0 Fibonacci level.

These are the things we must remember when we trade a chart trending from a 78.6% level.

  1. The price may make a reversal at 138.2.
  2. If the price trends from 78.2%, it most probably makes a correction after the breakout. Otherwise, it does not give a good risk-reward as well.


Categories
Forex Elliott Wave Forex Signals

CADJPY Moves in an Elliott Wave Triangle

Description

The CADJPY cross, in its 4-hour chart, shows a triangle pattern that should continue the upward movement of the previous impulsive move in the following trading sessions.

The Elliott wave perspective of CADJPY reveals the price action is running in a descending triangle, which could be ended its wave (e) of the Minuette degree labeled in blue. At the same time, CADJPY should be ending its wave ((ii)) of Minute degree in black.

The upward movement developed in the Thursday trading session, warns us that CADJPY could resume its advances in a wave ((iii)) of Minor degree.

Our bullish scenario considers an upside entry from the current zone at 76.373. In a conservative outlook, we expect a potential profit target at 77.973.3

Finally, the upward scenario will be invalid if the price action declines below 75.573.

Chart

Trading Plan Summary

  • Entry Level: 76.373
  • Protective Stop: 75.573
  • Profit Target: 77.973
  • Risk/Reward Ratio: 2 
  • Position Size: 0.01 lot per $1,000 in trading account.
Categories
Forex Fibonacci

Determining Higher Highs or Lower Lows to Draw Fibonacci Levels

Fibonacci levels are obtained by using higher highs or lower lows. A chart may have many higher highs/lower lows. Thus, Fibonacci levels can be obtained at different levels. A trader may find it difficult to spot out the levels where the price may react. In today’s lesson, we are going to see how different higher highs may lead us to having Fibonacci levels where the price does not react.

This is an H1 chart. The price heads towards the North with good bullish momentum before making a bearish correction. The point can be used to draw Fibonacci levels. The price then makes another bullish move and makes a new higher high. Some traders may want to use the last higher high to draw their Fibonacci levels. To make it clear, look at the chart below.

Some traders may use AB, while some others may use AC to draw Fibonacci levels. These two arms point out Fibonacci levels at different levels. Let us assume that we draw our Fibonacci levels by using AC.

The chart shows that the price after making the last higher high has started having a bearish correction. The buyers are to wait for the price to come at 78.6% level and make a breakout at the level of 100.0 to offer them a long entry. If the 78.6% is breached, 61.8% may do the same and offer them an entry as well. Let us proceed to the next chart to find out what happens next.

The price does not even come at 78.6%. It heads towards the North and makes a breakout at the level of 100.0. The price then never looks back. It hits the level of 161.8% in a hurry. The Fibonacci buyers do not find an entry here since the price does not trend from a 78.6% level. It trends way above the level of 78.6%.

Let us draw the Fibonacci levels with AB arm.

If we draw Fibonacci levels by using AB, we see that the price trends from 78.6% level. One candle breached through the level, but the next candle closes well above the level of 100.0. The buyers may set their target around 138.2% since it trends from 78.6%. However, it goes up to 161.8%.

To sum up the lesson, Fibonacci traders are to be well calculative at the time of selecting the first arm. With AC, there is no correction. The price trends towards the North straight. With AB, the price makes a correction and then makes another bullish move. Usually, a straight arm works well and provides accurate Fibonacci Fibonacci levels. Over here, we have seen that AB provides the Fibonacci levels, where the price reacts and help the buyers take a trading decision.


Categories
Forex Fibonacci

Fibonacci Trading: Be sure whether the Level is Held or Breached

Breakout plays a very vital role in the Forex market. Traders use breakout, breakout levels to make a trading decision. Fibonacci traders are to make sure whether a particular level is breached or it holds the price to make a better trading decision. In today’s lesson, we are going to demonstrate an example where Fibonacci traders may need to concentrate more to be sure about the Fibonacci level from where the price trends. Let us get started.

This is an H1 chart. The chart shows that the price makes a strong bearish move. It makes an upside correction followed by a strong bearish move again. The price has been having an upside correction again. Fibonacci traders are to draw the Fibonacci levels in the chart to find out where the price makes a bearish reversal and how far it may go up to.

Here are the levels. The chart shows that the price produces a bearish engulfing candle and heads towards the South with good bearish momentum. The question is whether the price trends from 78.6% or 61.8%. It is a vital issue since the price heads towards either 138.2% or 161.8% based on these two levels. If we concentrate on the chart, we see one of the bullish candles closes above the 78.6% level. However, the price comes back within the 78.6% level with the next candle. This means the H1 chart does not make a bullish breakout at 78.6%. The sellers may plan their entries to go short up to 138.2% in this chart. Let us proceed to the next chart to find out what price does.

The price breaches the 100.0 level and trades below for several candles. The sellers may wait for a bearish reversal candle and go short in the pair as long as they are satisfied with the risk-reward factor. Usually, it is best if the price goes back to the 100.0 level and produces a bearish reversal candle around the level as far as the risk-reward ratio is concerned. However, it may be produced anywhere between 100.0% to 123.6%. The sellers with different strategies may set their stop loss at different levels, but their last take profit level is to be set at 138.2 %. Let us proceed to the next chart to find out what the price does next.

The chart shows that the price hits 138.2%. As expected, it has been roaming around the level. It seems that the price may have found its support around 138.2% level, and it may make a bullish reversal. The sellers with Fibonacci levels have completed their mission with perfection.

Categories
Forex Elliott Wave

How to Count Using the Elliott Wave Principle Part 3 of 3 – Advanced Level

Introduction

Previously, we presented in a theoric way several criteria to realize wave counting, which could allow the wave analyst to foresee the likelihood next path of the market. In this educational article, we’ll analyze some examples in the real market.

Case 1 – NZDUSD Advances in a Corrective Sequence

The NZDUSD price in its hourly chart shows the progress in two consecutive corrective patterns. Our intraday analysis begins at the intraday high at 0.61305 reached on April 14th.

The price market reveals a decline in five internal segments of Subminuette degree identified in green. Once completed this move, the kiwi reacted bullishly, moving upward in three waves. This move ended a wave (b) of the Minuette degree labeled in blue. 

Observe how the price action completed the wave (c) of Subimiuette degree, developing an ending diagonal pattern, as commented on the previous article. The breakdown of this Elliott wave formation suggests the beginning of a bearish sequence that will correspond to a wave (c) of the Minuette degree.

The bearish sequence corresponding to wave (c) ended at 0.59104 on April 23rd reveals us that NZDUSD completed a zigzag pattern of Minuette degree.

The next move, developed by the NZDUSD cross, reflected the advance as a flat pattern and ended at 0.61758 on April 30th, when the kiwi developed an ending diagonal in the same way that the wave (b) of the previous zigzag pattern.

On the other hand, from the two patterns analyzed, we note the alternation principle in the corrective sequence, while the first correction is a zigzag, the second one is a flat pattern

Finally, the two consecutive corrective patterns, lead us to observe that NZDUSD completed a 3-3 sequence. In this context, the study of previous waves will reveal what should be the likely structure in progress and what could be the potential next move.

Case 2 – EURGBP Begins a Five-Wave Sequence from a Different Low

The second case considers the scenario when the market starts a five-wave sequence from a higher low. 

The EURGBP cross in its hourly chart shows the aggressive sell-off developed on December 12th, when the price plummeted to 0.82758. After this decline, the price consolidated and reached a slightly higher low at 0.82767 from where the cross began an impulsive movement identified as wave (i) of Minuette degree labeled in blue. 

Once the second wave ended, EURGP realized a third extended wave, which boosted the cross until 0.85917 reached on December 23rd. 

In this case, we observe the alternation principle in action. As the second wave is a simple correction. In consequence, the fourth wave must be a complex correction. In fact, from the chart, we observe that EURGBP developed a triangle pattern, which retraced beyond 38.2% of the third wave of Minuette degree. This context leads us to conclude that the cross should not reach a new higher high.

In this sense, the price action realized a limited higher high, which topped at 0.85959 last January 14th, from where it started to decline.

Conclusions

In this educational article, we showed a group of examples. In the first one, corresponding to the NZDUSD cross, we learned how the price action tends to end in ending diagonal patterns. 

In the same way, we observed the alternation principle applied in corrective waves, while the first corrective structure corresponded to a zigzag, the second formation built a flat pattern.

In the second chart, we observed that an impulsive sequence not necessarily will begin in the lowest (or highest) level of the price chart. This context makes us remember that an Elliott wave structure could finish developing a failure in the wave 5 or C.

On the other hand, the retracement experienced by the third extended wave beyond the 38.2% warned us about the exhaustion of the bullish momentum. This context provides us a signal of the limited potential next move corresponding to the fifth wave.


Categories
Forex Fibonacci

Fibonacci Trading: When Momentum is Lacking

Traders wait for the price to trend from 61.8% Fibonacci level. This is what attracts more traders to trade, which generates good momentum. When the price trends from 61.8% level, it usually goes up to 161.8%. Since the price gets enough space to move, it offers better risk-reward. This is another reason that Fibonacci traders love to trade in a chart when the price trends from 61.8%. However, the Forex market is uncertain. We may see that the price does not head towards 161.8% with good momentum upon trending from 61.8% from time to time. In today’s lesson, we are going to demonstrate an example of this.

This is an H1 chart. The chart shows that the price heads towards the South with good bearish momentum. Upon producing a strong bearish candle, it starts having a bullish correction. Fibonacci traders shall get themselves ready by drawing Fibo levels on the chart to find out potential short opportunities in the pair.

Here it is. The chart shows that the price breaches 78.6% level and trades above the level for two more candles. This means the price is in 61.8% zone. If the price trends from here, it may go towards 161.8% level. Yes, it would be better if the price goes towards the North and trends right from the level 61.8%. Nevertheless, the sellers still are to count the move from 61.8% zone. The chart produces a bearish engulfing candle followed by a doji candle. Since the reversal candle comes out as a bearish engulfing candle forming from 61.8% zone, some sellers may trigger a short entry (some may wait for the price to breach the last lowest low). Let us proceed to the next chart to find out what the price does.

The price heads towards the South and it makes a breakout at the last swing low as well. The pair may get more short orders now. However, the price does not head towards the South. It seems that 161.8% level is far away for the price to reach. It does not usually happen but this is how the Forex market runs. It does not always run on a single equation. A question may be raised here what does a trader do with his entry? Since it is an H1 chart based entry, it must be left behind and let it decide its fate by setting Stop Loss and Take Profit accordingly.

Categories
Forex Elliott Wave

How to Count Using the Elliott Wave Principle Part 2 of 3 – Advanced Level

Introduction

In our previous educational article, we discussed the basic concepts of the Wave Principle developed by R.N. Elliott and the wave counting process.

Glenn Neely, in his work “Mastering Elliott Wave,” describes a series of rules that will allow the wave analyst to objectively identify what kind of structural sequence is developing the price action.

In this educational article, we present a summary of the basic rules described by Neely and their impact on the wave analysis and counting process.

Use of Retracements in Wave Analysis.

When the wave analyst faces his first real-time market analysis, it may seem confusing to define what kind of wave the market is developing.

To solve this problem, Neely defined a set of rules that will allow the wave analyst to determine what kind of sequence the market develops.

These rules are described as follows.

Our reader can examine with more detail these rules and the Fibonacci retracements use in wave analysis here.

Types of Structural Series

R.N. Elliott, in his work “The Wave Principle,” defined some specific patterns that tend to repeat across the time. These patterns are built by different structural series that the wave analyst should know before to start the counting process. These Elliott wave structures are formed as follows.

Impulsive waves (:5)

  • Impulse – 5-3-5-3-5
  • Leading or Ending Diagonal – 3-3-3-3-3

Corrective waves (:3)

  • Zigzag – 5-3-5
  • Flat – 3-3-5
  • Triangle: – 3-3-3-3
  • Double Three – 3-3-3
  • Triple Three – 3-3-3-3-3

Remember that double and triple three are combined patterns.

The First Count and the Recount

As the level of complexity increases, wave sequences tend to create new waves of a higher degree, which can lead to confusing the wave analyst to identify where each wave begins and ends. For this, we use the validation channels and rules we have seen in previous articles.

Usually, the first analysis tends to be the one that presents the greatest challenge, because it tends to consider the highest level, or the lowest, to start the wave count. However, not necessarily the lowest, or highest level will be the beginning of an impulsive structure. This situation occurs because most methods of analysis consider the highest and lowest level as the starting point for analysis.

In terms of wave theory, a structural sequence will not end at the highest (or lowest) point due to the loss of momentum of price action. This situation will be reflected in one of the following four ways:

  1. An impulsive sequence containing a failure in the fifth wave.
  2. A flat pattern will end with a C-wave failure.
  3. A complex formation will end with a non-restrictive contractive triangle.
  4. An impulsive structure ends with a terminal pattern.

The following figure shows each of the four scenarios where the sequence will not end at the lowest level.

When a potential impulsive pattern experiences a reversal higher than its beginning, then the recount must consider that the origin of the previous movement is not the origin of an impulsive structural series, but can be part of a complex corrective structure.

Conclusions

In this educational article, we review different criteria described by Glenn Neely in his work “Mastering Elliott Wave,” which allow the wave analyst to identify what kind of structure the market could be developing.

Later, we reviewed the different patterns that R.N. Elliott described in his work “The Wave Principle” and his internal sequences. Currently, the patterns described by Elliott in the 1930s still can be recognized in the real market.

Finally, we discussed the cases where the market does not finish or start a new impulsive or corrective sequence from the lowest or highest point but will depend on how the previous structural series ends. 

In the next educational article, corresponding to the third and last part of the wave counting process, we will see a series of examples of wave counting and identification.

Suggested Readings

  • Neely, G.; Mastering Elliott Wave: Presenting the Neely Method; Windsor Books; 2nd Edition (1990).
  • Prechter, R.; The Major Works of R. N. Elliott; New Classics Library; 2nd Edition (1990).
Categories
Forex Daily Topic Forex Price Action

Spot the Chart Accordingly before Triggering for an Entry

In today’s lesson, we are going to demonstrate an example of a chart, which may entice traders to take entry more than once. Some traders may get themselves engaged in taking entry. We find out why we price action traders skip taking those entries. Let us get started.

This is an H4 chart. The price makes a strong bearish move by producing three consecutive Marubozu bearish candles. The last candle comes out as a doji candle. The price may consolidate now. The sellers are to wait for a strong bearish reversal candle upon consolidation to go short in the pair. Let us proceed to the next chart.

The chart produces a bearish Marubozu candle again. As a reversal candle, it is a strong one. However, the price has not consolidated well. It has produced the bearish reversal candle upon having a shallow consolidation. Moreover, the last candle does not close below the level of support. Thus, the sellers may skip taking the entry but wait for the right time to come. The chart still looks good for the sellers.

The chart produces a bullish engulfing candle. The price may make a deeper consolidation this time. The sellers may keep their eyes on the chart again to go short in the pair. Let us proceed to the next chart to find out what happens next.

The price makes a deeper consolidation. Upon finding its resistance, it makes a bearish move. It seems that the price may make a breakout here. A question may be raised here whether the sellers on the H4 chart shall take the entry or not? We find out the answer in a minute. Meanwhile, let us proceed to the next chart.

The next H4 candle closes well below the level of support. The pair trades below the breakout level for one more candle as well. However, the sellers on the H4 chart may skip taking the entry. The reason behind that is the chart takes more than six candles (a day) to make the breakout. This level of support is a daily level of support now. Thus, the sellers may take the trading decision as far as the daily chart is concerned. If they take their trading decision by observing the H4 chart, it may not be that fruitful. The risk-reward may not be a good one. It may not end up being a daily breakout, but the price may come back in. Or, the daily chart may produce a bullish corrective candle next day, which makes the price hit the H4 sellers stop loss. Thus, in such cases, they might have to take losses only because the pair belongs to the daily chart. Thus, for better trading, traders shall take a closer look before taking entry on a chart to determine whether it favors their trading chart.

Categories
Forex Elliott Wave Forex Signals

Gold Could Develop a Bearish Wave C

Description

Gold, in its 2-hour chart, illustrates a decreasing advance that could correspond to a corrective structure in progress, which could result in further declines.

The Elliott wave sequence suggests the possibility of an incomplete wave ((c)) that could be developing its internal wave (ii) of the Minuette degree identified in blue.

On the other hand, the yellow metal retraced until 50% of the last bullish sequence. This retrace makes us foresee that the upward cycle could be in an exhaustion stage, and Gold couldn’t realize a new higher high that surpass the April high at $1,747.74 per ounce.

Our bearish scenario foresees a decline from the current area at $1,696 per ounce, with a potential bearish target located at level $1,676. 

The scenario forecasted will be invalid if the price surpasses and closes above $1,711 per ounce.

Chart

Trading Plan Summary

  • Entry Level: $1,696.62
  • Protective Stop: $1,711.62
  • Profit Target: $1,676.62
  • Risk/Reward Ratio: 1.33
  • Position Size: 0.01 lot per $1,000 in trading account.
Categories
Crypto Market Analysis Forex Elliott Wave Forex Signals

Bitcoin Cash Prepares for a New Rally

The price of Bitcoin Cash (BCH/USD) is preparing to develop a new rally that could take it to beat the previous highs of March, located in the area of 352.96.

BCH/USD, in its 4-hour chart, shows the advance of a potential upward impulsive sequence that began when the price found its bottom at level 133.67 last March 13th.

From the previous chart, we observe the price action advancing in its wave ((iv)) of Minute degree labeled in black. At the same time, this ongoing structural series is forming the internal segment corresponding to wave (c) of the Minuette degree identified in blue.

The wave (c) in progress began at the top of April 30th, located at level 275.95, when Bitcoin Cash completed its wave (b).

The internal structure of the wave (c) shows the intraday downward trendline joining the sequence of lower highs, which leads us to conclude that the short-term sentiment maintains on the bearish side.

On the other hand, according to the Elliott wave theory, for the long-term structural series to be a valid impulsive sequence, the wave ((iv)) must not penetrate the area of wave ((i)).

In this context, the corrective downward movement currently being developed by BCH/USD should not fall below the 200 level, which corresponds to the top of the wave ((i)).

On the other hand, one of the aspects that consider both the alternation principle and the construction of the extended wave indicates that an extended wave will be preceded or followed by a complex corrective structure.

Considering this Elliott wave concept, from the 4-hour chart, we observe that the current corrective sequence shows a level of complexity higher than the complexity level developed by wave ((ii)). Consequently, once the structural series of wave ((iv)) will complete, BCH/USD should perform a new upward impulsive movement that should present the characteristic of an extended wave, which could surpass the level 352.

In conclusion, as long as the wave ((iv)) of Minute degree does not finish, our preferred positioning will remain neutral, waiting for confirmation to enter on the bullish side that allows incorporation to the wave ((v)).

Categories
Forex Elliott Wave Forex Signals

EOS Consolidates on the Leading Diagonal Pattern

The EOS prices develop a bullish sequence following the Elliott wave structure of a leading diagonal pattern, which began on the March low at 1.4200.

The price action developed by EOS and reflected in its 4-hour chart, shows the cryptocurrency testing the baseline of the leading diagonal pattern, which links the end of the waves ((ii)) and ((iv)) of Minute degree labeled in black.

According to the textbook, a leading diagonal pattern is an impulsive structure having five internal segments, which are subdivided into an internal sequence 3-3-3-3-3. This pattern tends to appear on the first wave of an impulsive series.

So far, EOS completed a five-wave bullish sequence of Minute degree. This impulsive wave began in the March low at 1.4200. At the same time, this structural series gave rise to a higher-grade impulsive wave corresponding to the wave 1 of Minor degree labeled in green.

Following the wave theory described by R.N. Elliott, since EOS completed an impulsive movement, the market must perform a corrective sequence of the same degree and in the opposite direction to the previous move.

From the previous chart, we observe the price action developing a corrective downward movement. Within its internal structure, we recognize that the sequence in progress could correspond to a wave ((b)) of Minute degree identified in black.

This movement, which is composed of a three-wave internal structure, is moving on the baseline of the leading diagonal pattern. A bearish breakdown would activate the wave ((c)) in black.

Once EOS completes this three-wave sequence, it will end the wave 2 of Minor degree, and consequently, the price action will give way to a third upward wave.

According to the alternation principle between the impulsive waves, considering that the first wave has a lower momentum, the third wave could have a higher momentum than the first one.

In conclusion, in the short term, our preferred positioning remains on the bullish side, which will be confirmed once the Minor degree wave-2 is finished.

Categories
Forex Fibonacci

Fibonacci Levels Help Traders Make Better Trading Decision

In today’s lesson, we are going to demonstrate a chart where the price makes a strong bearish move from a Fibonacci level. It has two messages, which we will find out soon. Let us get started with the chart’s price action.

The chart shows that the price makes a strong bearish move. The last candle comes out as a long bearish candle, which states that the sellers dominate over the buyers. Traders may want to wait for the price to make a bullish correction to go short in the pair with more aggression.

The chart produces a bullish inside bar. The sellers are to keep their eyes on the pair to get a bearish reversal candle to go short. It seems that the pair may produce a strong bearish reversal candle (the signal candle) soon.

The chart produces a bearish inside bar, which is not the sellers’ favorite to go short. The price makes a little bearish move and heads towards the North again. Look at the last candle in the chart. It comes out as a bearish engulfing candle, which is one of the strongest bearish reversal candles.

As expected, the bearish engulfing candle drives the price towards the South. The sellers on the minor chart are going short. Thus, the price is about to make a breakout at the last swing low on the chart as well.

The price makes a breakout at the last swing low and heads towards the South further. Then, it produces two bullish candles in between but continues its bearish journey again. The price may have found its support since it produces four consecutive bullish candles. The price may continue its bearish journey, or it may make a bullish reversal. The bull looks good here. Let us draw Fibonacci levels and see whether it gives us a clue about the trend continuation or a reversal.

The chart produces a bullish inside bar right at 138.2 level. Please note that the price makes its bearish move from 78.6 level. The level of 78.6 has a strong relation with 138.2. If the price trends from 78.6, it often makes a reversal at 138.2. This is what happens here.

To sum up, if we learn the art of using Fibonacci levels and understand how a level is related to others, it becomes easy for us to take trading decisions such as entry, exit, and taking a partial profit. In the end, it makes us prolific traders.


Categories
Forex Fibonacci

Fibonacci Trading and Deeper Correction

In today’s lesson, we are going to demonstrate an example where the chart produces a reversal candle at a Fibonacci level, but the price does not head towards the trend’s direction. It then makes a deeper correction. It finds its new resistance and heads towards the trend’s direction with good momentum. Let us now have a look.

The price heads towards the South with excellent bearish momentum. It produces six consecutive bearish candles, four of them having solid long bearish bodies. The sellers are to wait for the price to make a bullish correction and to produce a bearish reversal candle at the value area. Let us proceed to the next chart.


The price makes a bullish correction and produces a bearish engulfing candle. However, the price does not make a bearish breakout. It rather goes towards the North again. The last two candles come out as bullish candles. The price goes towards the North further for a deeper correction.

The chart produces a bearish Marubozu candle. The combination of the last two candles is called Track Rail. The Track Rail is one of the strongest reversal signal candles. The sellers may keep their eyes on this chart with attention. The Fibonacci traders may draw their Fibonacci levels to find out which level it is trending from.

Let us proceed to the next chart to find out what the price does.

The chart produces another bearish candle and makes a breakout at the wave’s lowest low. The Sellers then take control of the pair and drive the price towards the South at an extreme pace. The last candle on this chart comes out as an inverted hammer. It suggests that the price may keep heading towards the South. However, do not forget that the chart produces a bullish Pin Bar as well, and the last candle closes within the level of support where the Pin Bar bounces off.

Anyway, let’s draw the Fibonacci level on the chart and see how the price reacts to some levels.

The chart gives us a clearer picture. At first, the price produces the bearish reversal candle at 78.6. The asset does not make a breakout. Instead, it goes towards the North and finds its resistance at 61.8. The level produces a bearish reversal candle followed by a breakout at the wave’s lowest low. The price then hits 161.8 level with ease.

If the price makes a breakout by trending from 78.6, it may not hit 161.8 level. The price usually reverses at 138.2 if it trends from 78.6. Stay tuned. We are going to study with some live examples on this soon.


Categories
Forex Elliott Wave

How to Count Using the Elliott Wave Principle Part 1 of 3 – Advanced Level

Introduction

Wave counting is a systematic process by which the wave analyst identifies in a logical and standardized order the movement developed by the action of the market.

R.N. Elliott, in his work “The Wave Principle,” comments out that counting is not the most relevant part of the study of wave theory; however, this process empathizes that it is useful when studying the market progress across time.

Elliott, the Wave Principle, and Financial Markets

The Wave Principle, defined by R.N. Elliott, is part of the law of nature, which, when known, can make predictions without knowing the underlying causes that originated this phenomenon.

In this context, financial markets are the result of a socio-economic interaction, which reflects the psychological feeling of the participants interacting in the negotiation process.

Despite the interests of each market participant, the outcome of the trading process is reflected in a price chart.

Elliott, in his work “The Wave Principle,” detected that price tends to make repeated movements over time. 

On the one hand, there are movements that, over time, create trends. Elliott defined these movements as impulsive and are characterized by being composed of five segments.

On the other hand, Elliott described movements that oppose to impulsive moves as corrections and are composed of three internal segments.

Once the price action completes an impulsive sequence and a corrective movement, the market completes a cycle and starts a new one of similar dimension or degree

The following figure shows the complete structure of a cycle.

What We Have Studied So Far

Until now, our study of wave analysis has included the following aspects:

  • Identification of directional and non-directional movement.
  • Impulsive and corrective structure.
  • Types of corrective waves.
  • Extensions.
  • Canalization.
  • The alternation principle.
  • Validation of impulsive and corrective waves.
  • Complex corrective structures.
  • Identification and wave degrees.

The process of analyzing and identifying waves will be an integration of all these concepts, which will allow the wave analyst to make a high probability forecast for the next market movement.

The Degrees Importance

R.N. Elliott defined a set of degrees that do not obey a specific timeframe, for example, hourly chart, or 2-day temporality. But allow the wave analyst to evaluate a structural sequence that maintains a proportionality in terms of price and similar time.

Also, the use of the degrees allows us to identify, and in turn, to predict what will be the next movement that should act for the price in a given time horizon.

The following table shows the different degrees described by Elliott and the contributions incorporated by Prechter & Frost in his work “Elliott Wave Principle.”

In general, our analyses will start from the Subminuette degree.

Conclusions

In this first section, we have seen the basis of the Wave Principle developed by R.N. Elliott. Likewise, we review the structure that makes up a complete cycle and concludes with the description of the different degrees that Elliott defined to maintain a systematic order in the process of analysis.

In the next educational article, we will review the different regression rules that will allow us to systematize the counting process in the first wave count.

Suggested Readings

  • Neely, G.; Mastering Elliott Wave: Presenting the Neely Method; Windsor Books; 2nd Edition (1990).
  • Prechter, R.; The Major Works of R. N. Elliott; New Classics Library; 2nd Edition (1990).
  • Prechter, R., Frost.A.J.; Elliott Wave Principle: Key to Market Behavior; New Classic Library; 10th Edition (2005).
Categories
Forex Fibonacci

Fibonacci Trading: How Fibonacci Levels Can be Used in Trading?

Fibonacci levels and price action around those levels give traders clue what they should do with their potential trade setup. The 61.8% level is the most significant level, which is paid attention by the traders to make a trading decision. The price usually goes towards the level of 161.8% when it trends from 61.8%. Since it creates enough space for the price to travel, different traders trade and make use of the wave-length in differently.  We will learn some other strategies that are integrated with Fibonacci levels. Meanwhile, let us demonstrate an example of a chart where the price reacts at 61.8% and trends towards 161.8% afterwards.

The chart shows that upon producing a double bottom, the price heads towards the North and makes a new higher high. The buyers are to wait for the price to make a bearish correction now.

The price heads towards the South upon producing a bearish inside bar. The last candle comes out as a bearish engulfing candle closing within a flipped support. Let us wait and see whether the level produces a bullish reversal candle.

The price produces three bullish candles at the flipped support. The last candle looks to be the strongest one. The price may head towards the North and makes a breakout at the highest high of the wave.

As expected, the price heads towards the North and makes a breakout at the highest high of the wave. The price continues its journey towards the North further. The last candle on the chart comes out as a bullish candle having a long upper shadow. Do you notice anything interesting here? Look at the next chart.

The price after making a bullish move, it starts having a bearish correction. The price consolidates around the 61.8% level. It produces a hammer and heads towards the North. It makes a breakout at the last highest high and heads towards the North with good bullish momentum. The price hits 161.8% as it usually does when it trends from 61.8% level.

Some traders go long in this chart before the price makes the bullish breakout. As long as 61.8% level produces a strong reversal candle, they trigger their entry. It provides an excellent risk-reward but less winning percentage. On the other hand, some traders trade once the price makes a breakout. This offers not that great a risk-reward but an excellent winning percentage.

Categories
Forex Daily Topic Forex Fibonacci

Draw Fibonacci Levels on Your Trading Chart

Fibonacci traders are to find out a good move, followed by a price correction. They keep their eyes on the 61.8% level with extreme attention. If the level of 61.8% produces a reversal candle, traders trigger for entry. Usually, the price goes up to the level of 161.8% if the price trends from 61.8%. This allows an excellent risk-reward to the traders as well. In today’s article, we are going to demonstrate an example of how the golden ratio of 61.8% plays such an important role in moving the market towards the trend. Let us get started.

The chart shows that it makes a bullish move upon producing a bullish engulfing candle. The price makes a downside correction and moves towards the North again. This time the price makes the move with good bullish momentum. The Fibonacci traders are to wait for the price to make a downside correction and draw Fibonacci levels to go long in the pair. Let us proceed to the next chart to find out whether it starts having downside correction or heads towards the North further.

This is an interesting move by the chart. It has a bearish gap, but the candle comes out as a bullish candle. Despite having an upper shadow, this is a bullish reversal candle. Let us find out how the price reacts upon getting such a bullish reversal candle.

The price heads towards the North with extreme bullish momentum. The bull outplays the bear. This is such a strong bullish move that the buyers would love to make full use of it. Do you notice something interesting? Yes, the price trends from the 61.8% zone. Let us draw the Fibonacci levels and see how it looks.

The chart shows that despite having a bearish gap, the chart produces a bullish candle within 61.8% zone and heads towards the North. It hits the level of 161.8% in a hurry as well. This is what the Fibonacci golden ratio level does almost all the time. There are different ways of trading and catch such a move. Some traders enter before the breakout, while some enter after the breakout at the highest high of the wave. Both have merits and demerits, which we will learn in our forthcoming Fibonacci lessons. Meanwhile, concentrate on your chart and practice drawing Fibonacci levels by pointing out the highest high and the lowest low. Start practicing this, so you get well acquainted with Fibonacci significant levels and how the price reacts to them. This will help you trade much better soon.

Categories
Forex Elliott Wave

Alternation and Extensions in the Wave Analysis – Advanced Level

Introduction

In previous articles, we discussed the concepts of alternation and extensions and their importance in wave analysis.

R.N. Elliott, in his work “The Wave Principle,” described alternation as a principle of nature. Likewise, since financial markets are the result of human activity, and consequently part of nature, they are governed by the “law of nature.”

Elliott also identified the existence of extensions as part of impulsive movements. In particular, in his Treatise, Elliott points out that extensions should appear only on one of the three motive waves and never on more than one.

In this educational article, we will review and expand on the concepts of Alternation and Extensions applied in wave analysis.

Alternation

As we have seen in previous articles, alternation can be recognized in different forms, which are detailed as follows:

  1. Price, which corresponds to vertical advance, either increasing or decreasing.
  2. Time, which corresponds to the time taken by the construction of each wave.
  3. Severity, which is the ratio of the wave to the impulsive pattern, this aspect applies only to corrective waves 2 and 4.
  4. Complexity, which refers to the number of subdivisions that the Elliott pattern has in development.
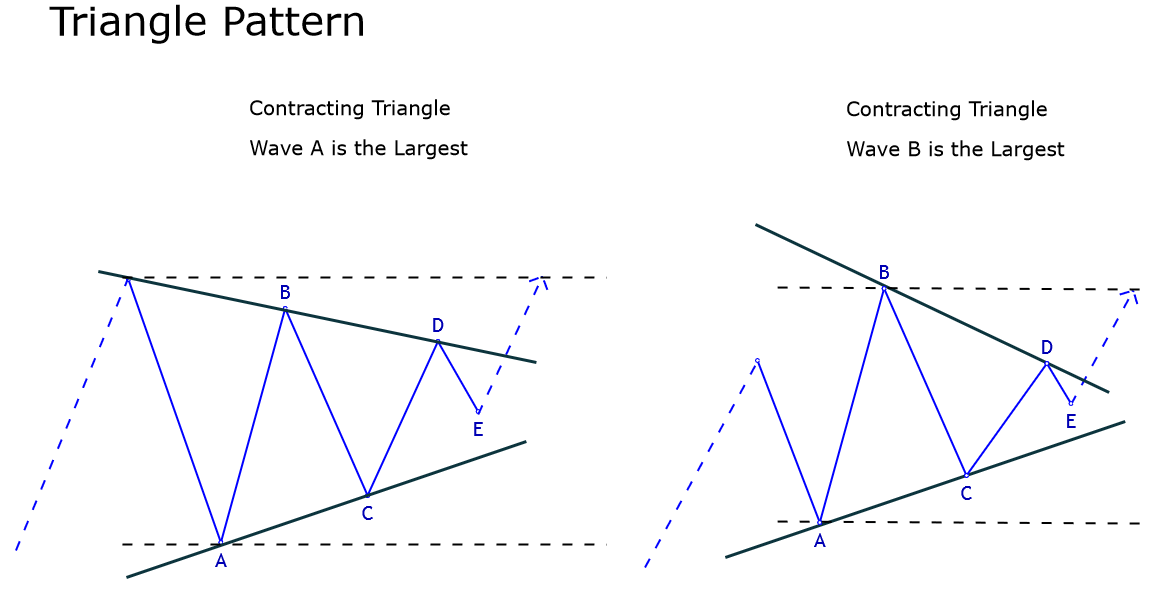
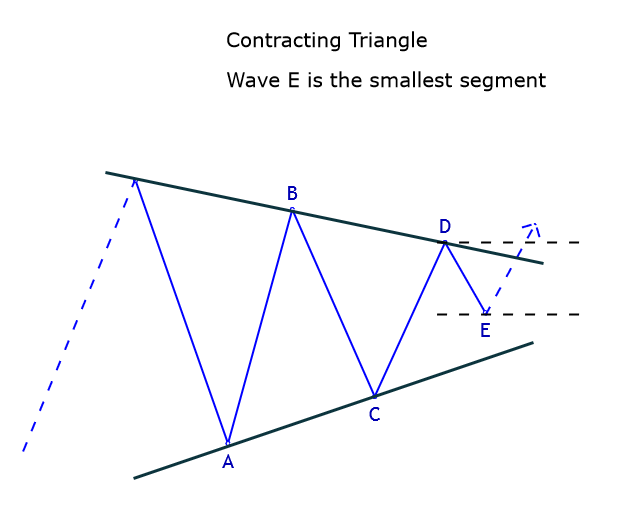
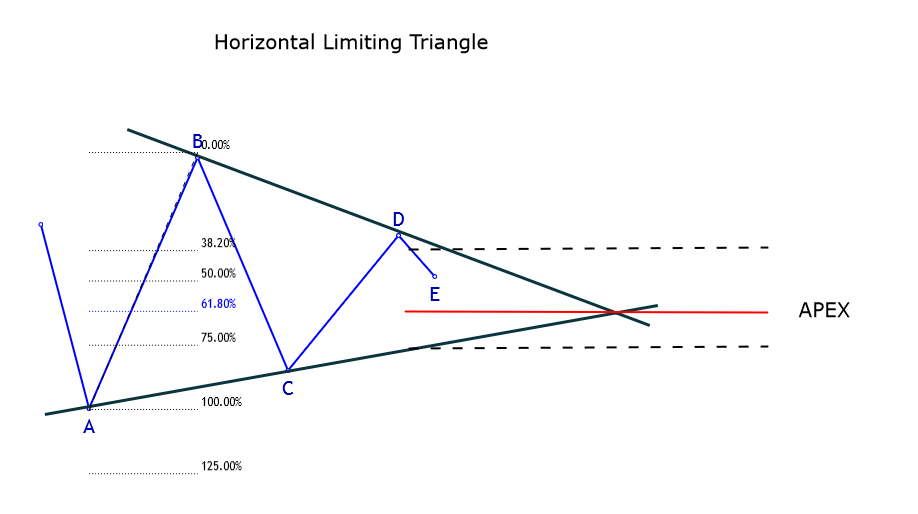
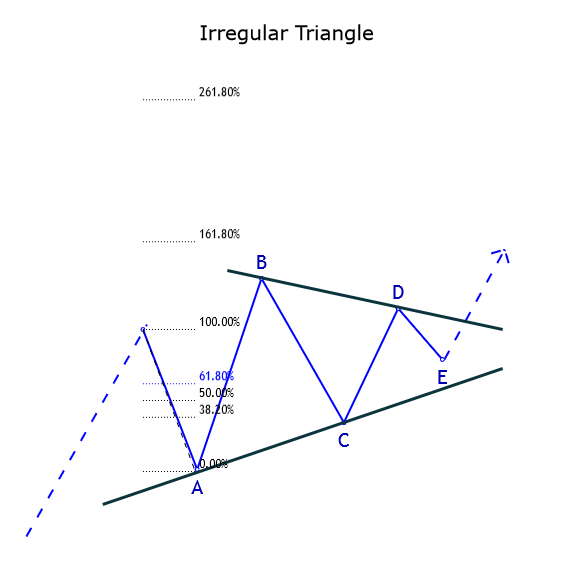
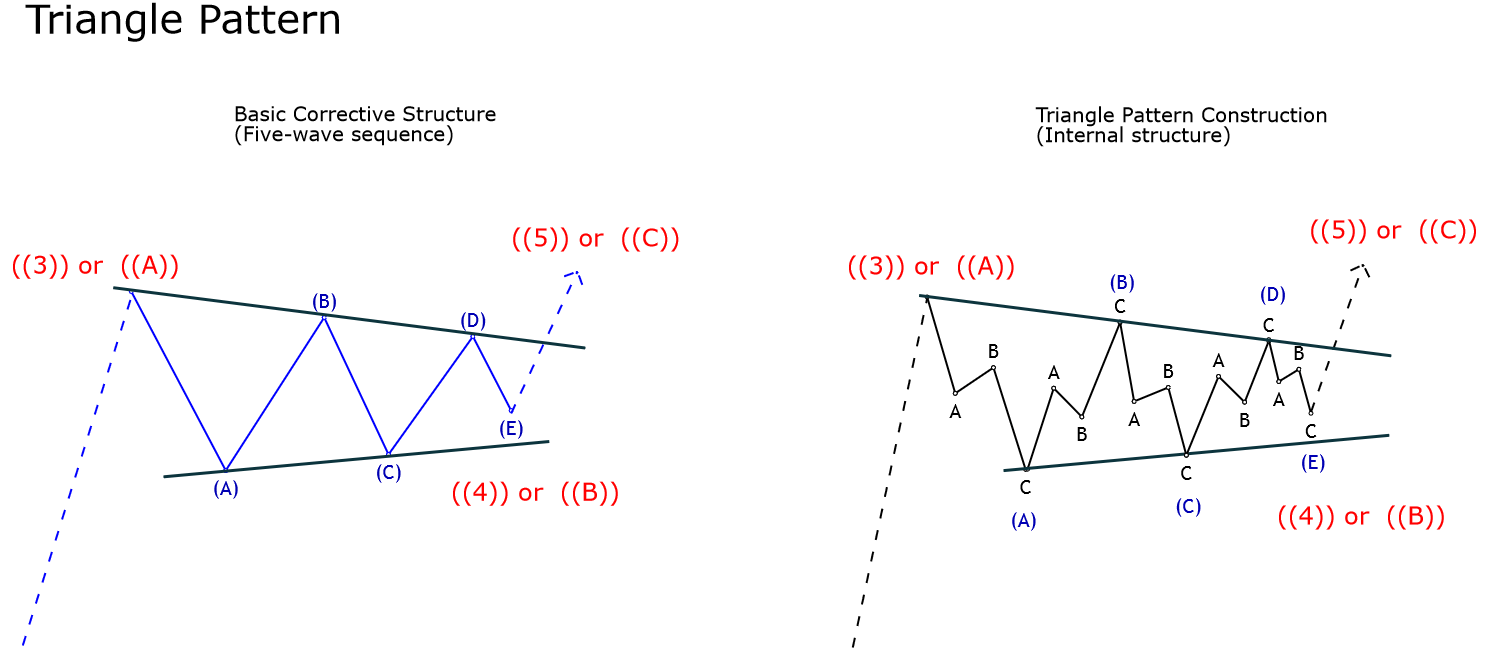
  5. Construction, an Elliott wave pattern, can be a flat, zigzag, triangle, etc.

So far, we have studied the characteristics of alternation in the first three aspects. 

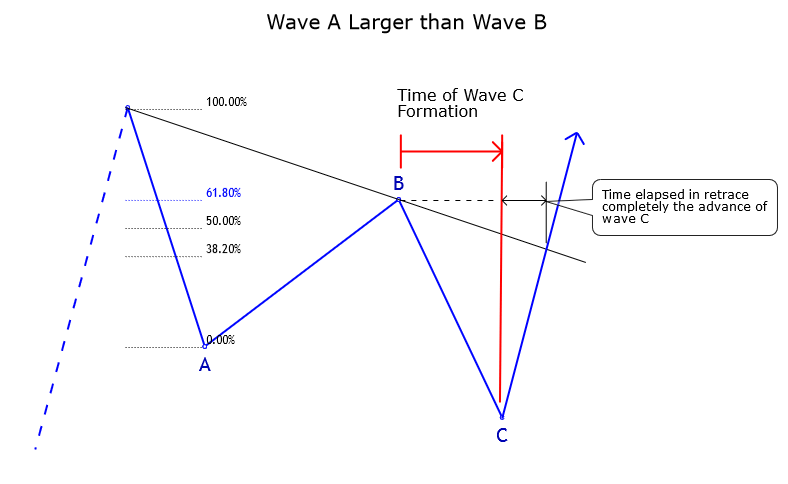
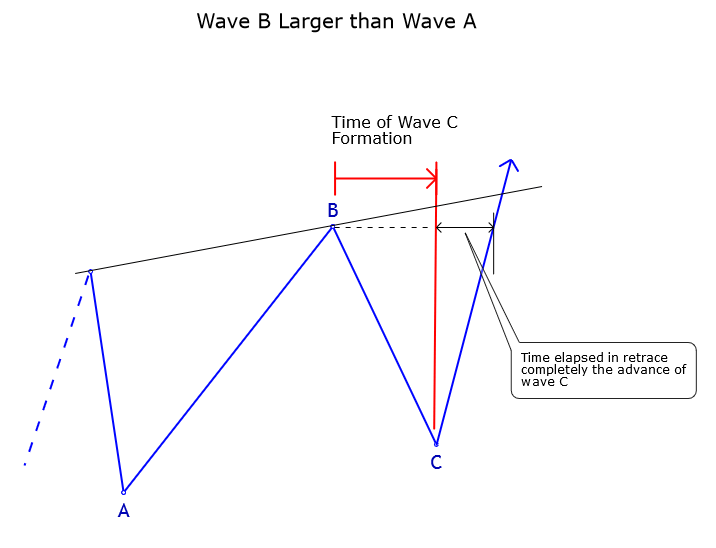
In impulsive structures, they can alternate in terms of time and price. However, in corrective structures, alternation in terms of price is usually not relevant. 

However, on alternation in time, in particular, one must verify the time taken by each phase of the corrective pattern, which in general will be very different from each other. Likewise, in terms of severity, if a corrective wave produces a deep retrace to the previous impulsive wave, likely, the next corrective wave will not show a deep retrace and vice versa.

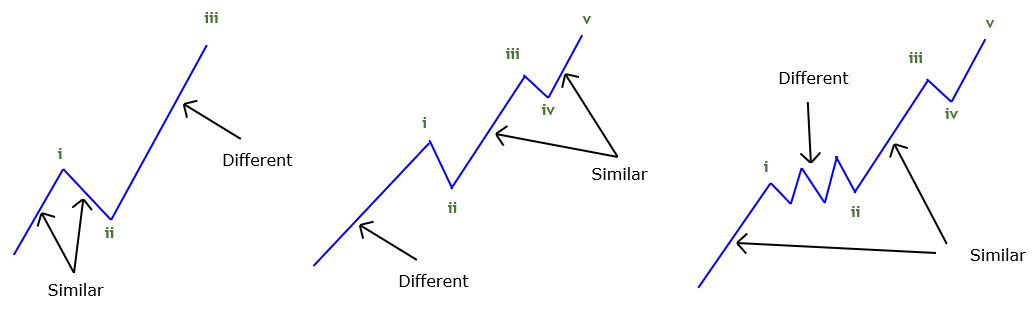
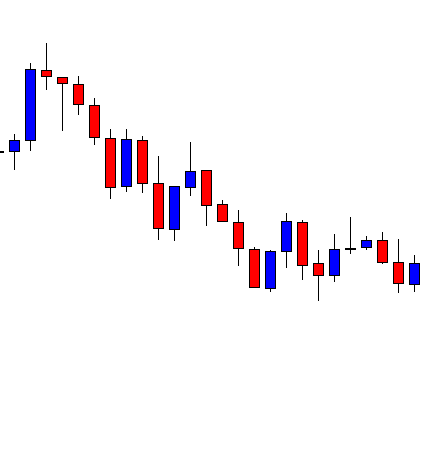
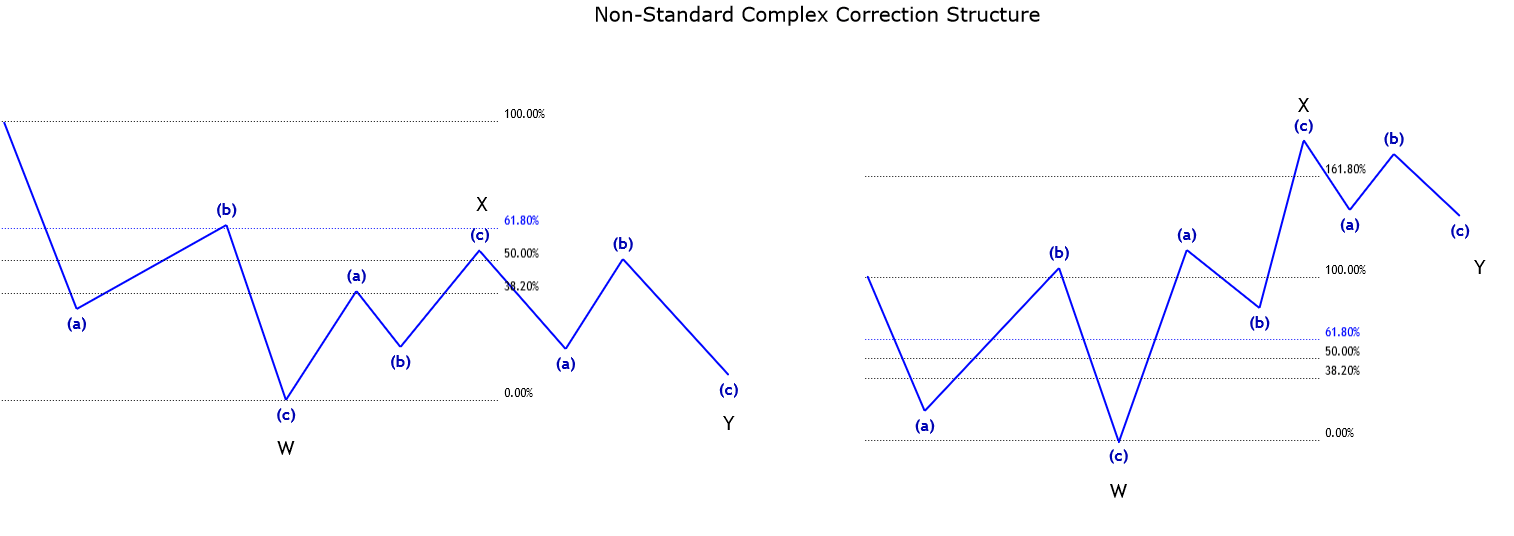
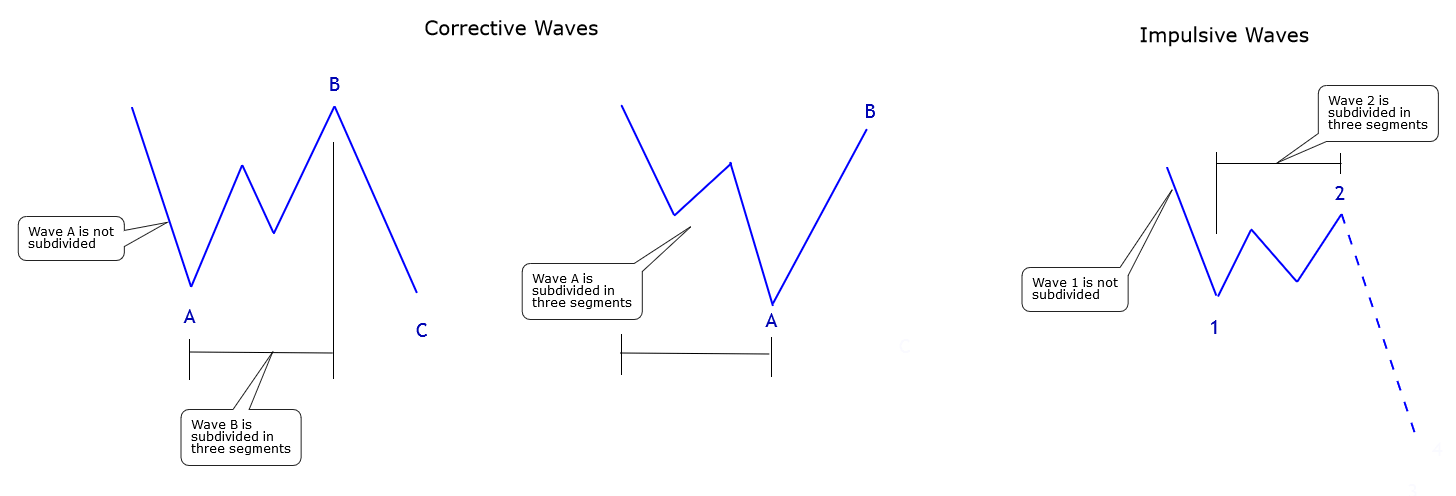
The next aspect that corresponds to the alternation principle is complexity or intricacy, which refers to the number of internal subdivisions that have an Elliott wave pattern, compared to the number of subdivisions that have the adjacent structure.

In practical terms, it will be useful for the analysis of poly-waves and multi-waves. In this way, it will be helpful for one wave to be subdivided and the other not. 

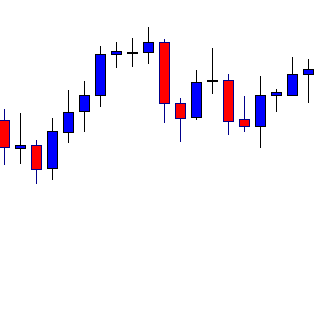
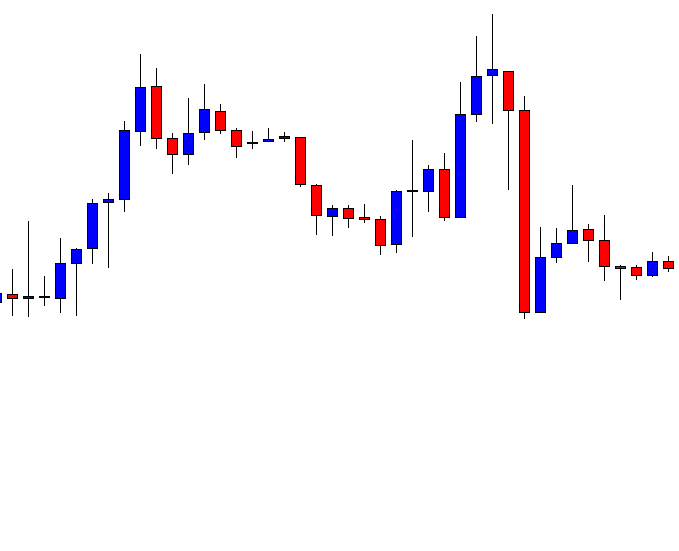
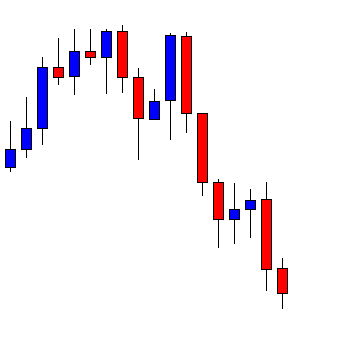
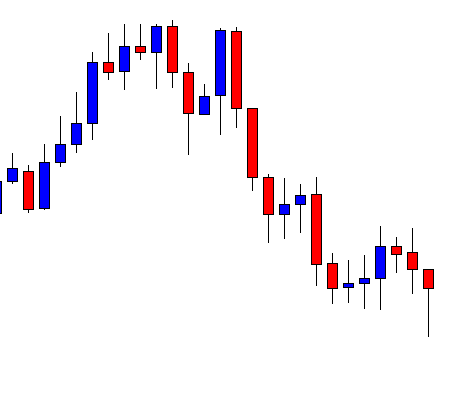
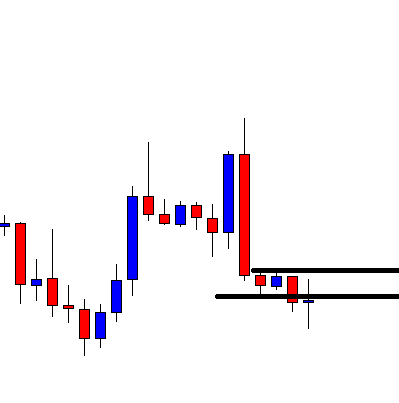
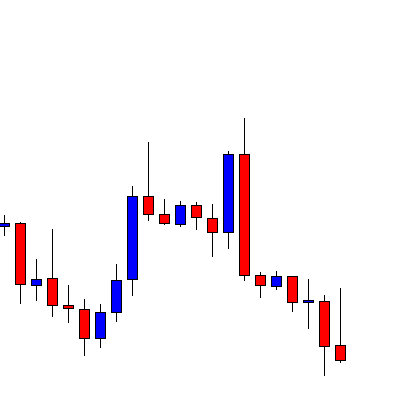
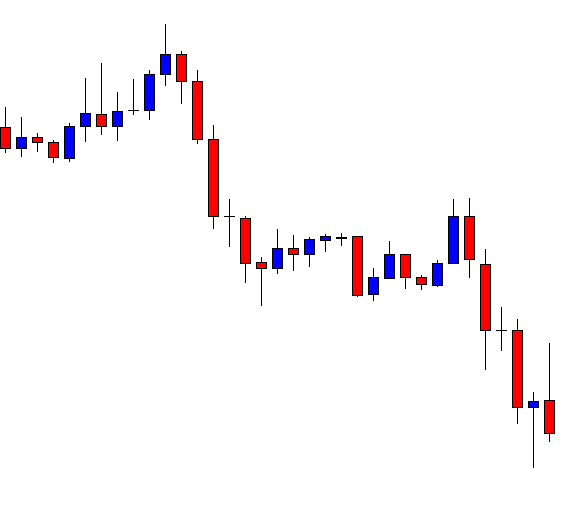
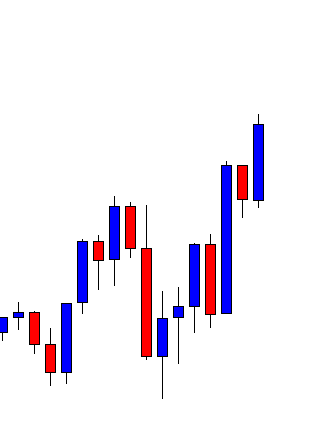
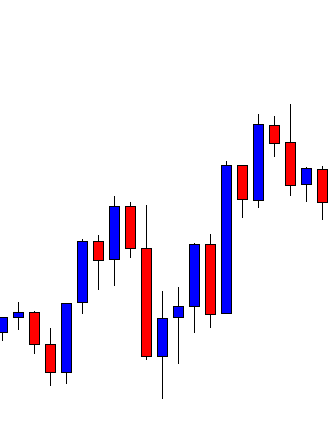
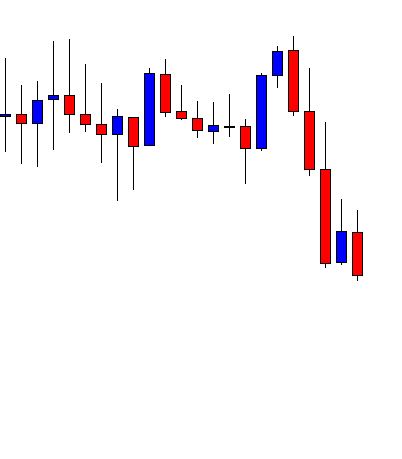
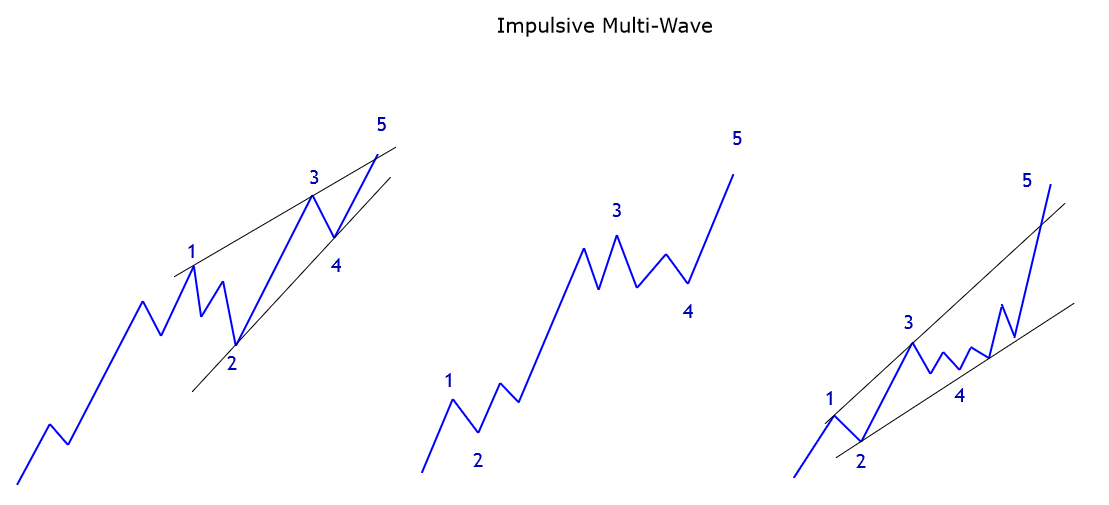
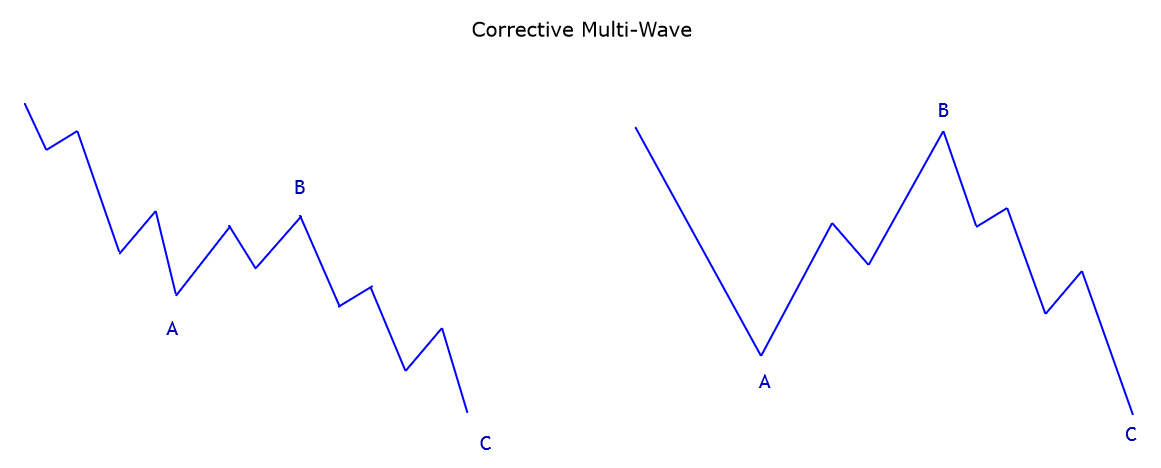
The following figure shows cases for impulsive and corrective structures.

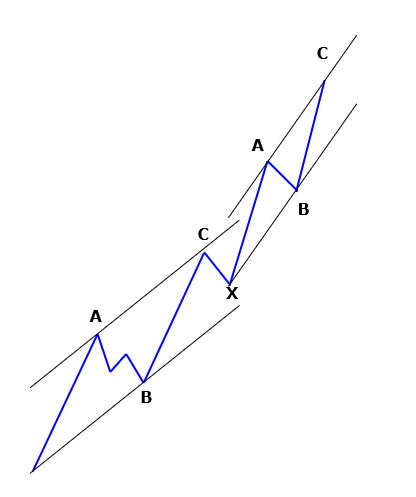
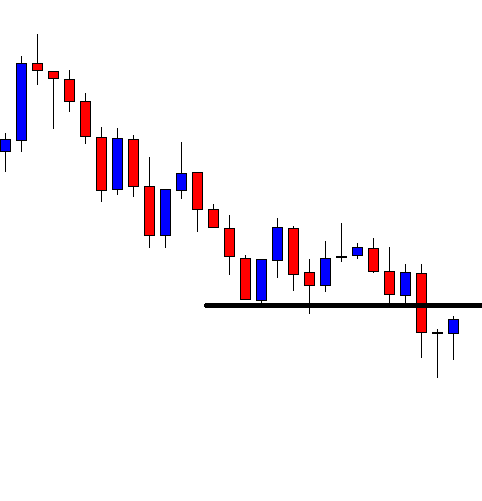
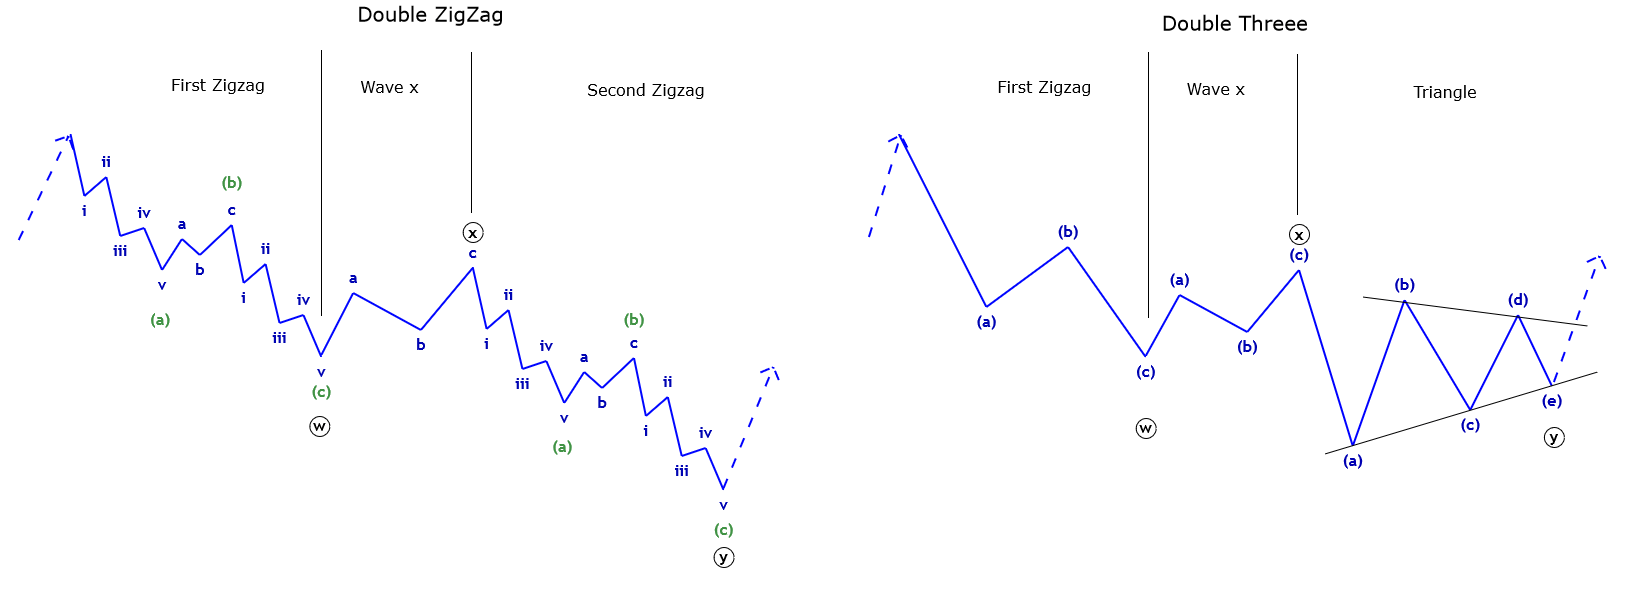
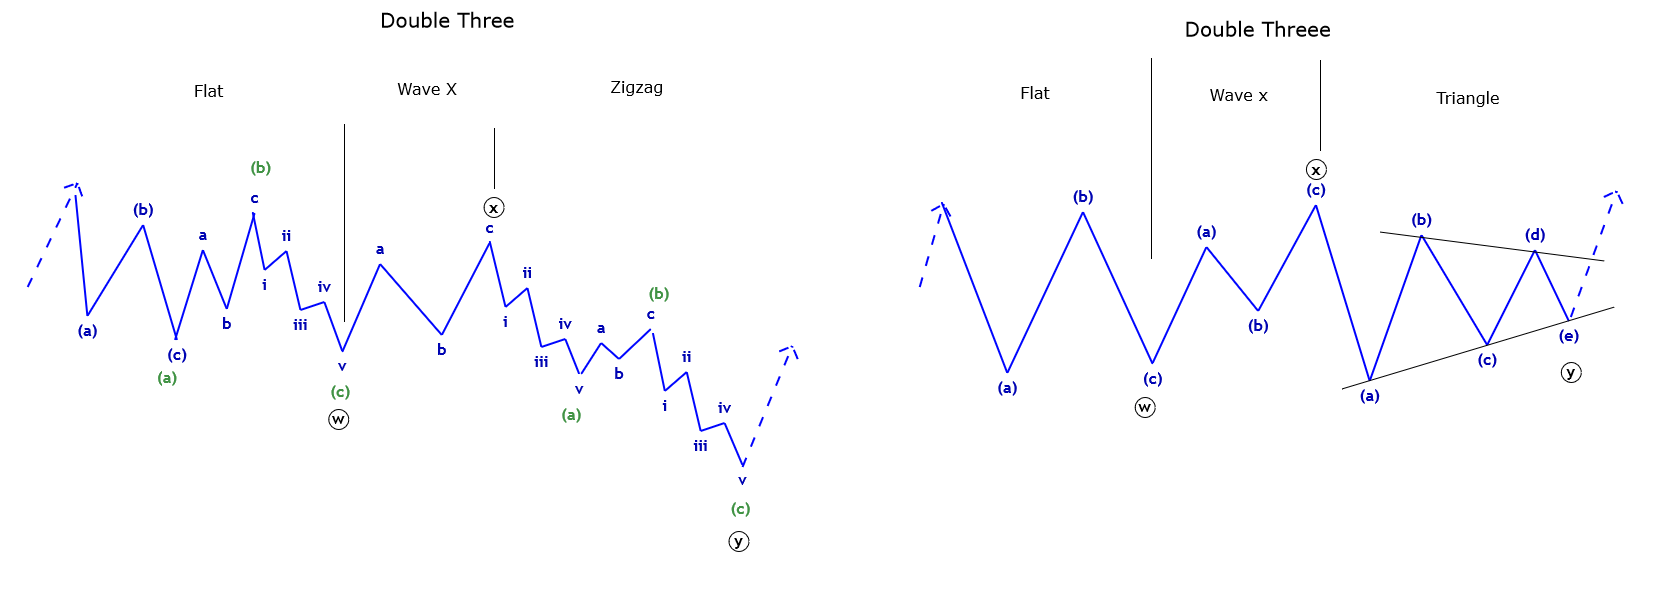
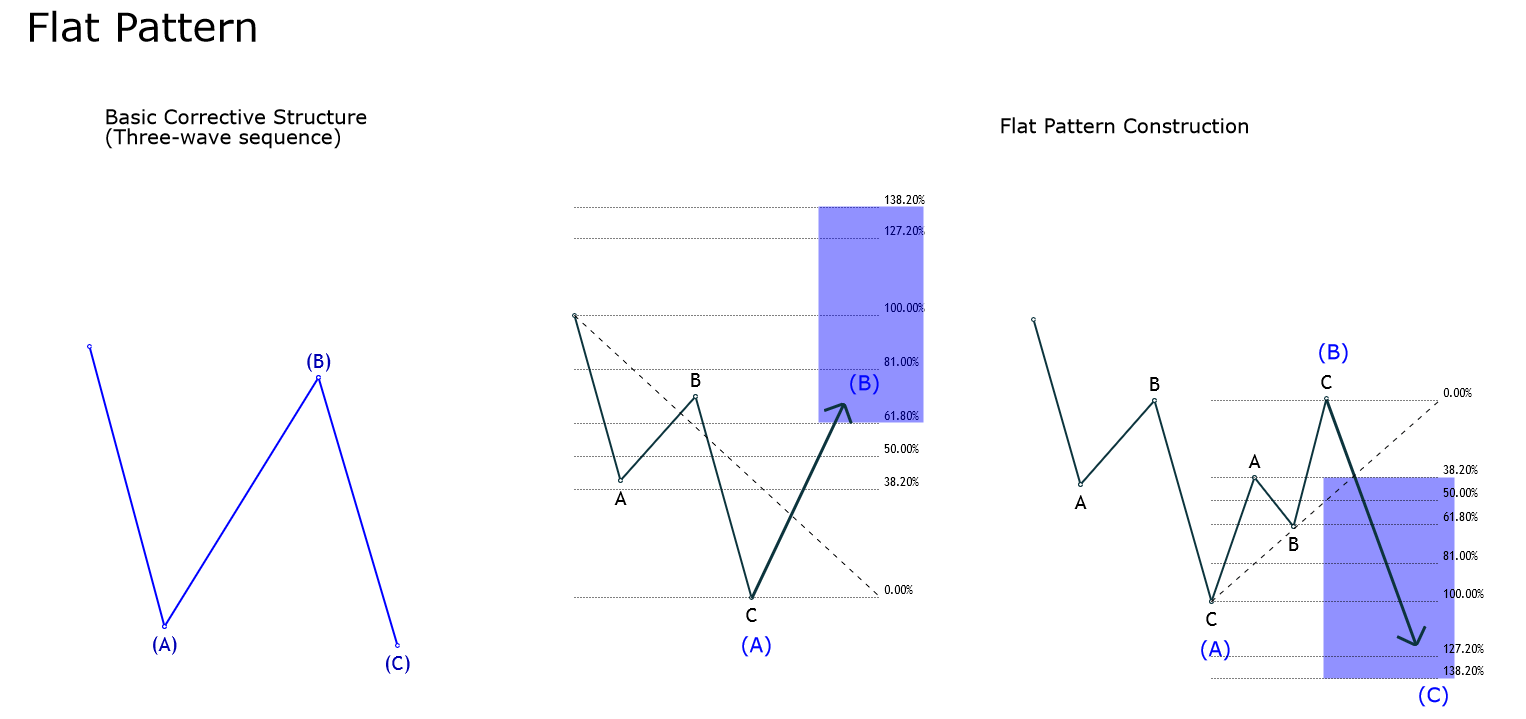
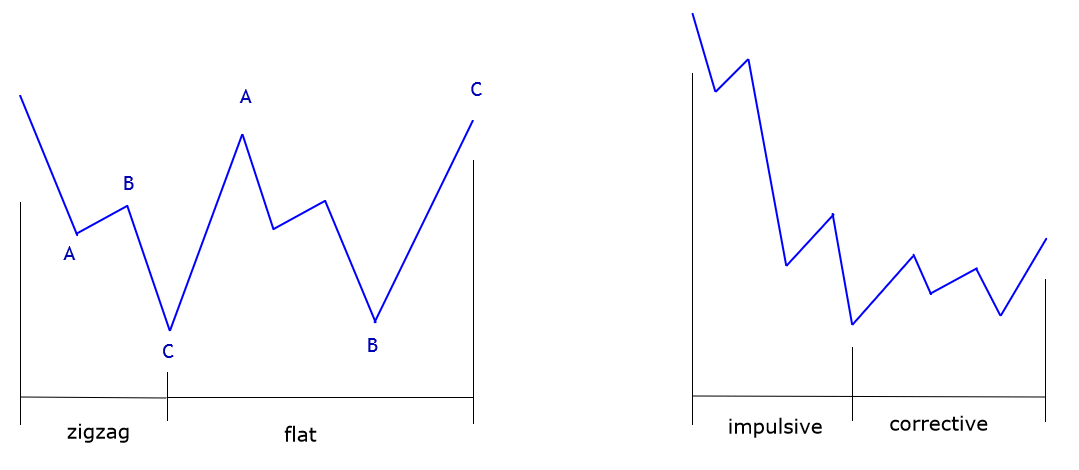
The alternation in terms of construction corresponds to the patterns that compose an impulsive or corrective structure. 

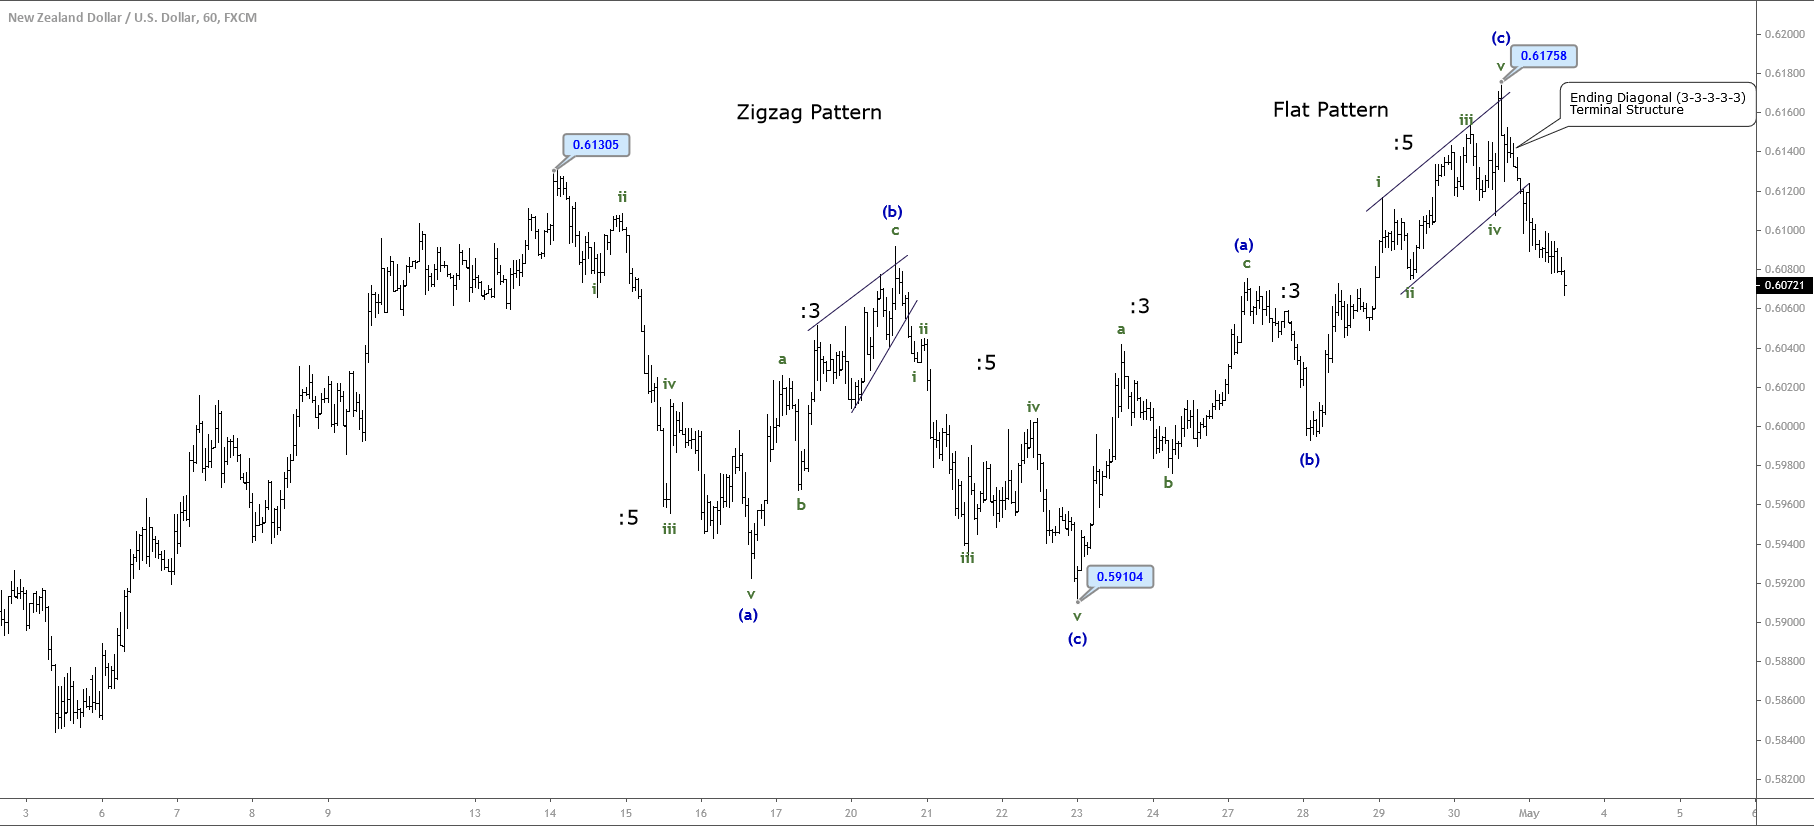
For example, in a corrective sequence in which the first movement is composed of a zigzag pattern, the next corrective move can be any structure, minus a zigzag. 

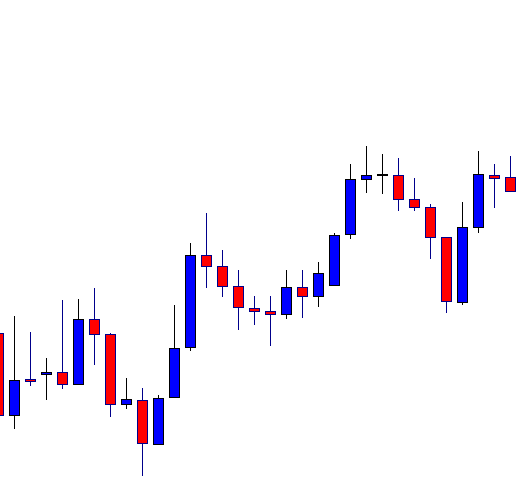
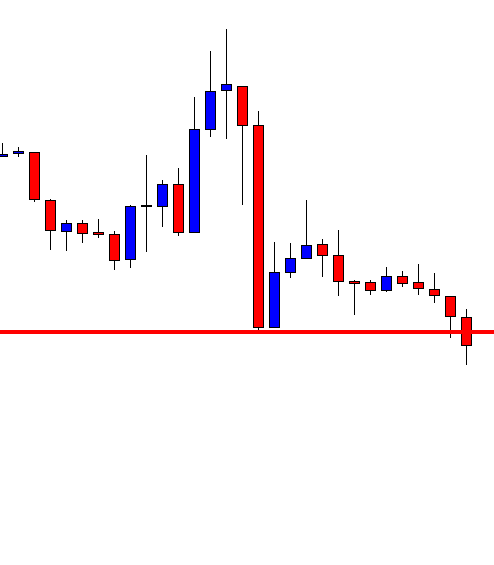
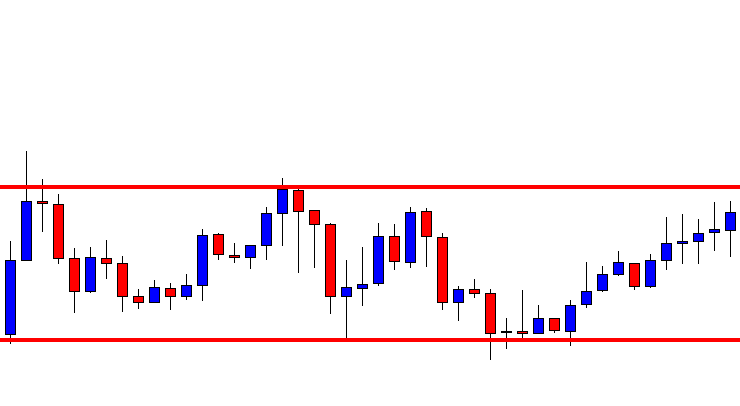
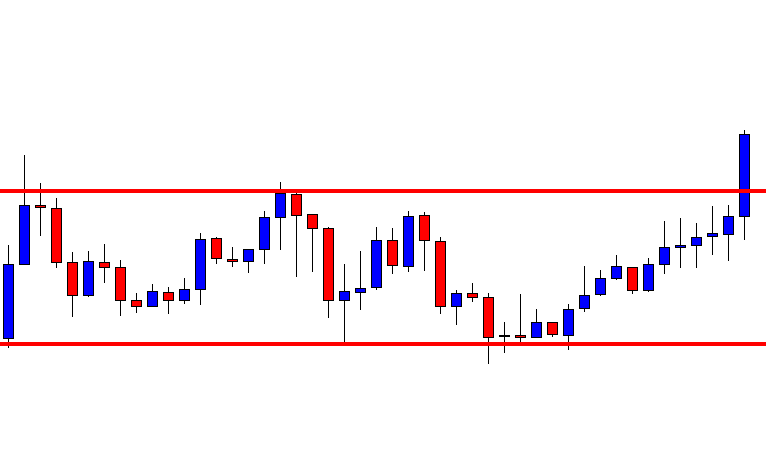
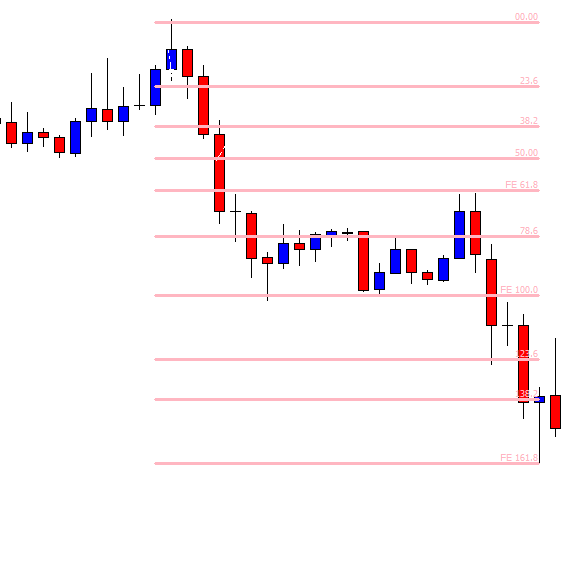
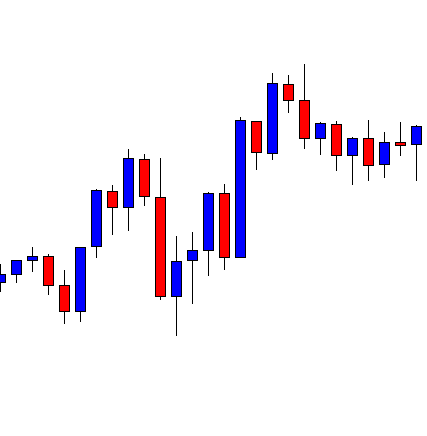
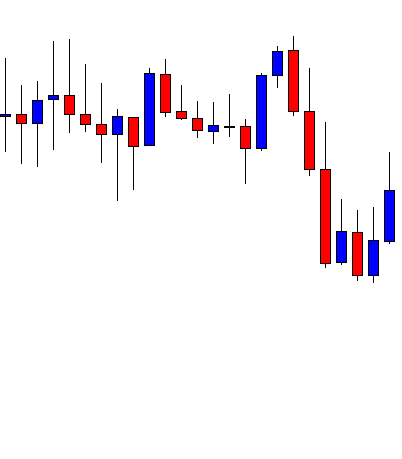
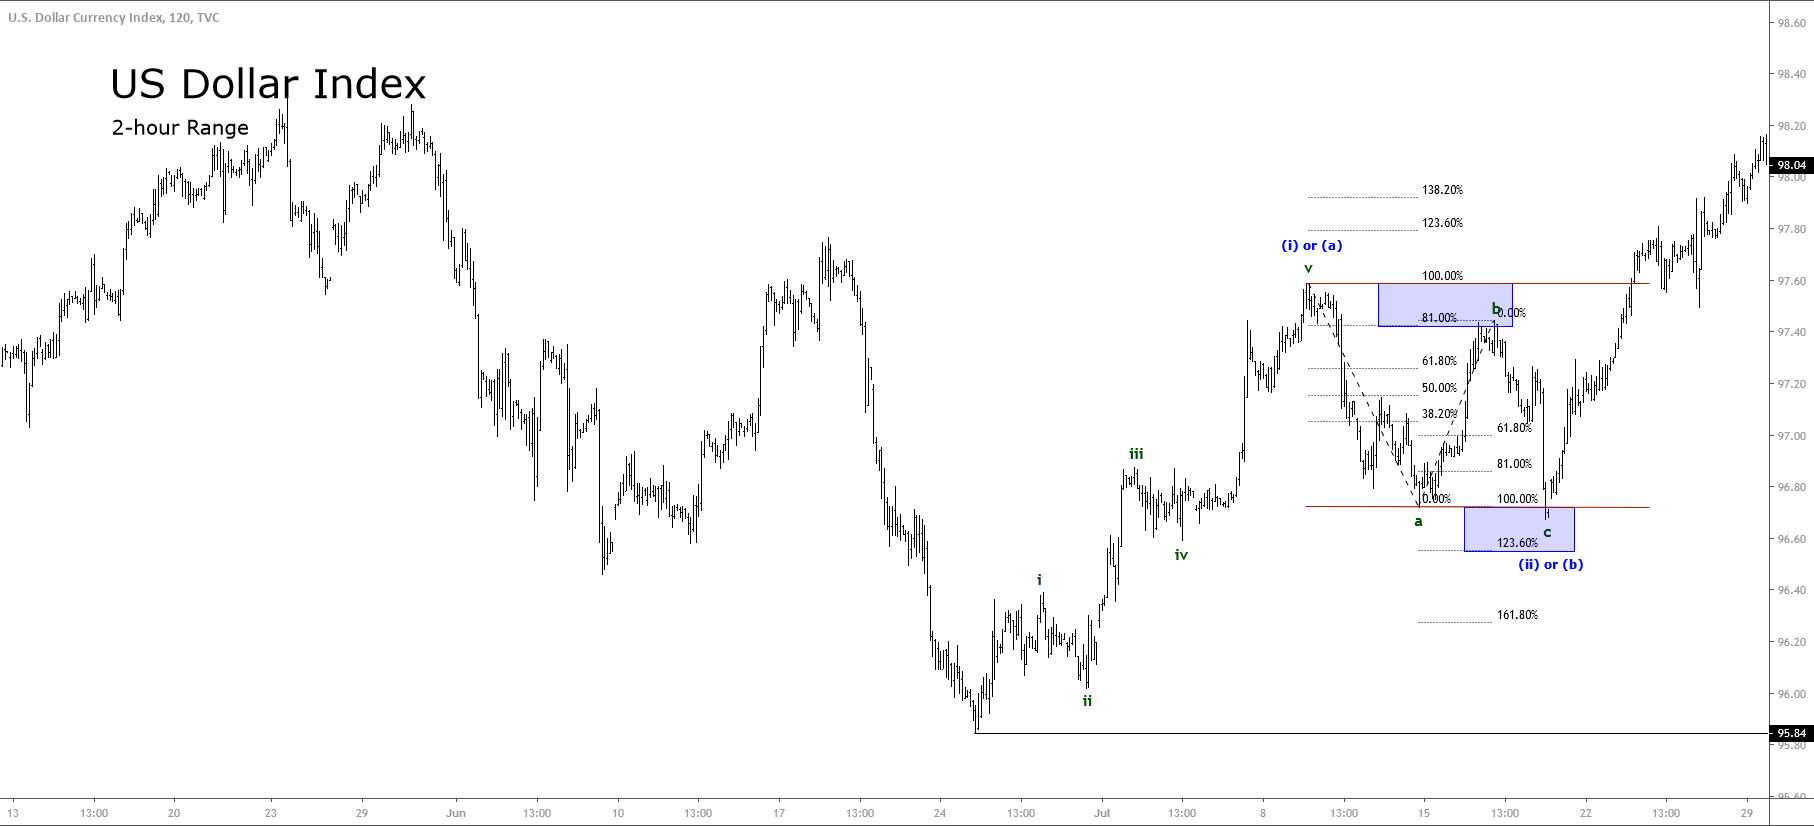
In this context, in the real market, a typical sequence is first the appearance of a zigzag and then a movement corresponding to a flat pattern, as shown in the following figure. Likewise, if the price action develops an impulsive structure, the next movement will correspond to a corrective structure of the same degree.


Extensions

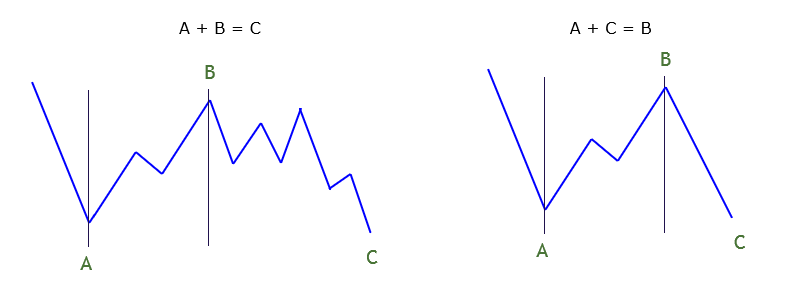
Usually, in wave analysis, the extension and subdivision concepts tend to be used interchangeably. However, Glenn Neely, in his work “Mastering Elliott Wave,” shows that both terms are independent.

On the one hand, the extension corresponds to the wave with the longest movement in favor of the trend. As we have seen in previous articles, the extended wave appears in a single wave, and this may be in the first, third, or fifth wave, but it will never be present in more than one simultaneously.

On the other hand, the term subdivision applies to the number of segments constituting a wave, which can be impulsive or corrective.

Thus, the extended wave will not necessarily be the one with the most subdivisions. Likewise, as the complexity of the wave under study increases, the level of subdivisions that constitute it will also increase.

Finally, as indicated by R.N. Elliott in his Treatise, the extended wave is a relevant factor in terms of the behavior of an impulsive wave, either by what the most complex corrective wave will be. It can also lead the wave analyst to avoid losses and obtain gains from its knowledge.

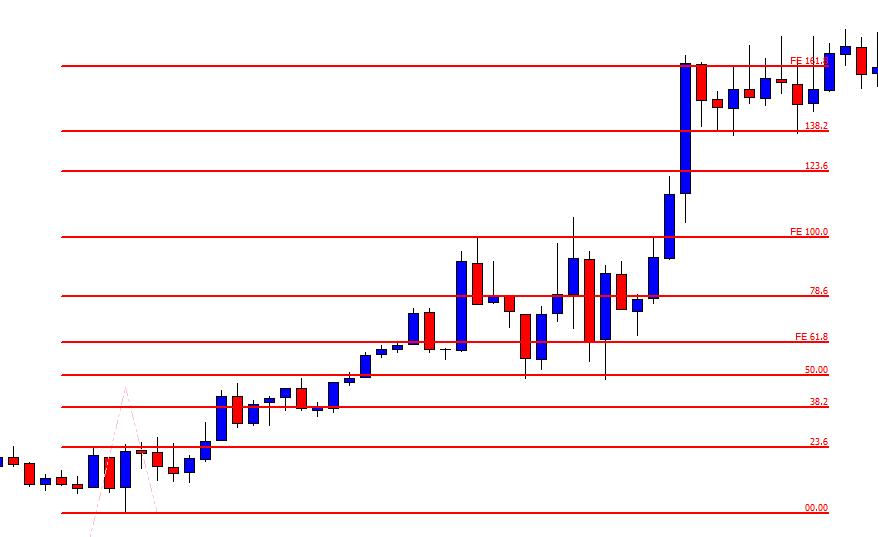
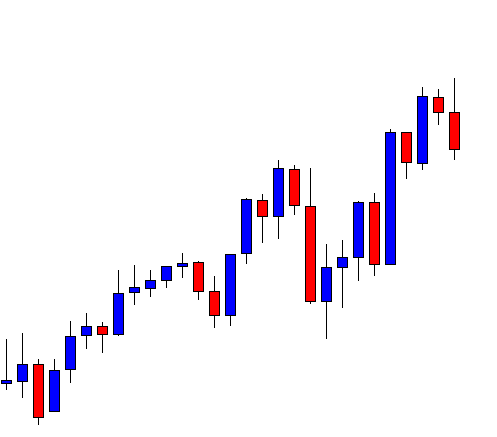
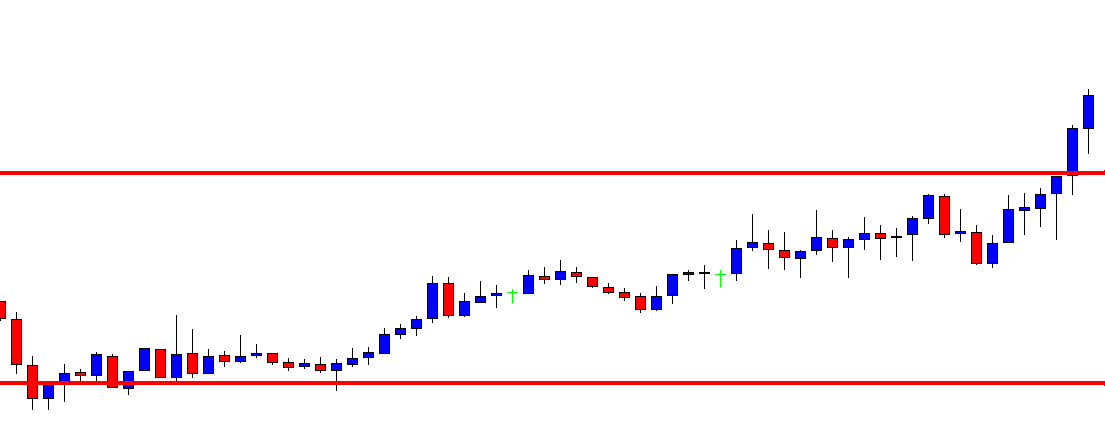
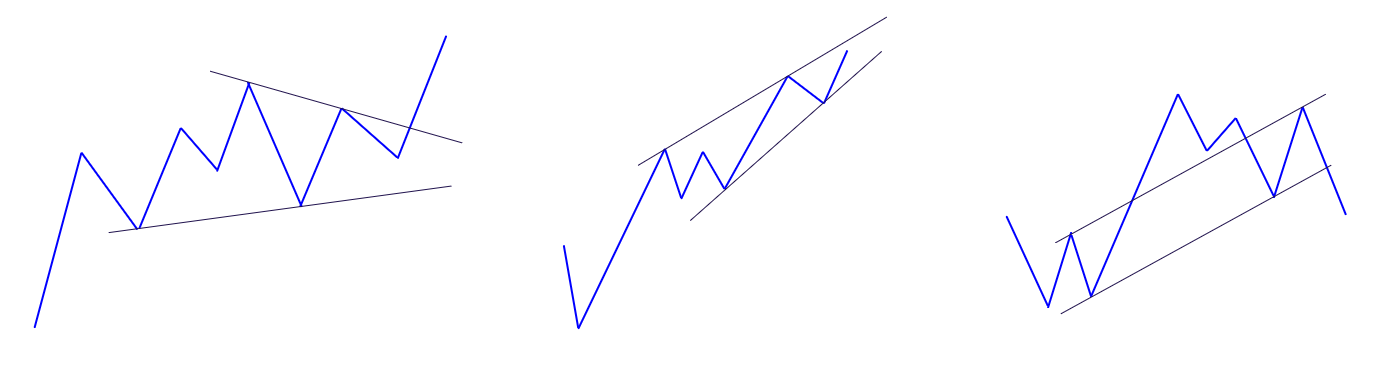
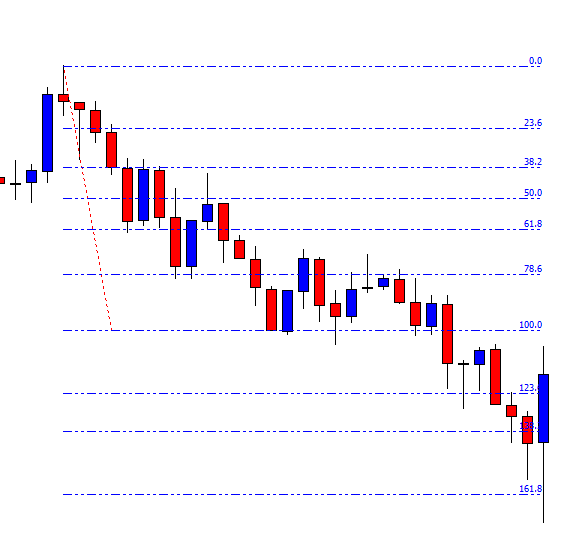
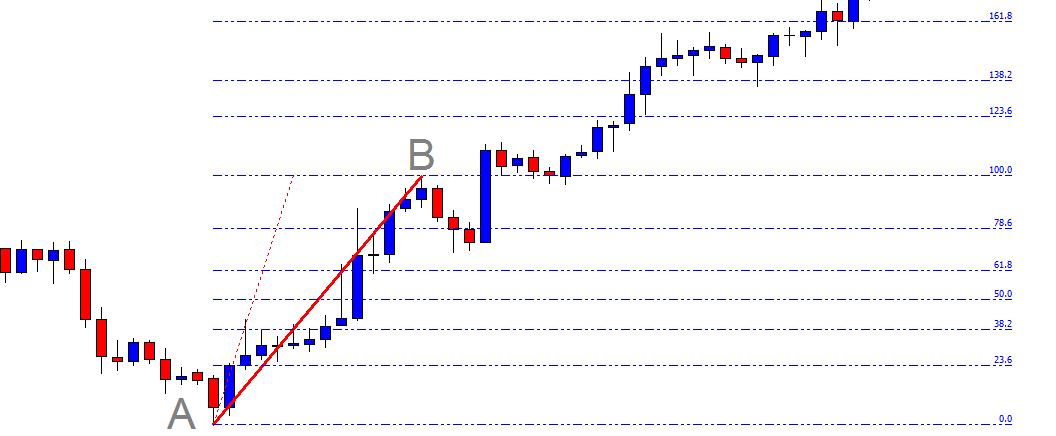
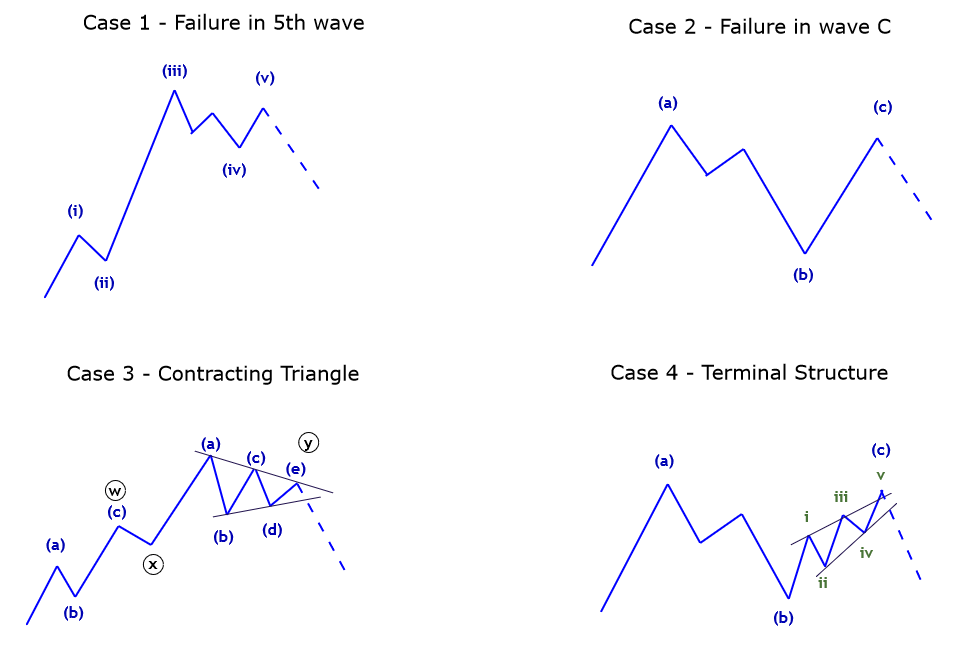
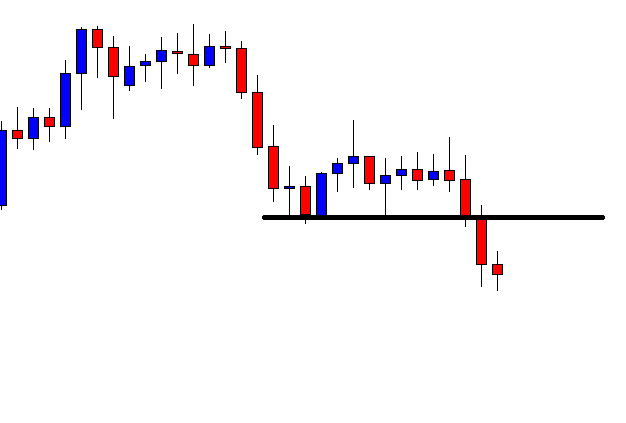
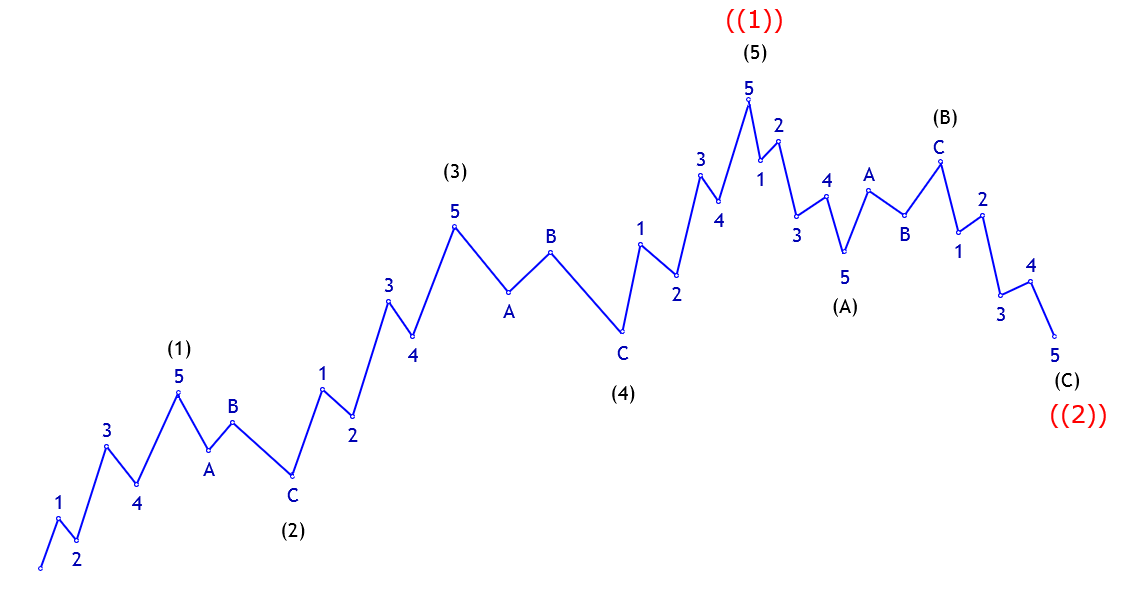
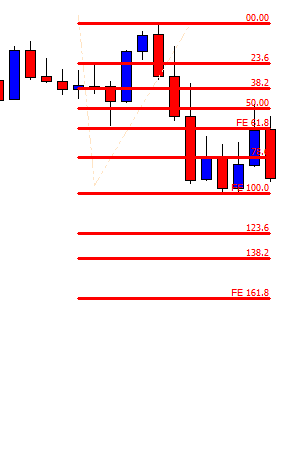
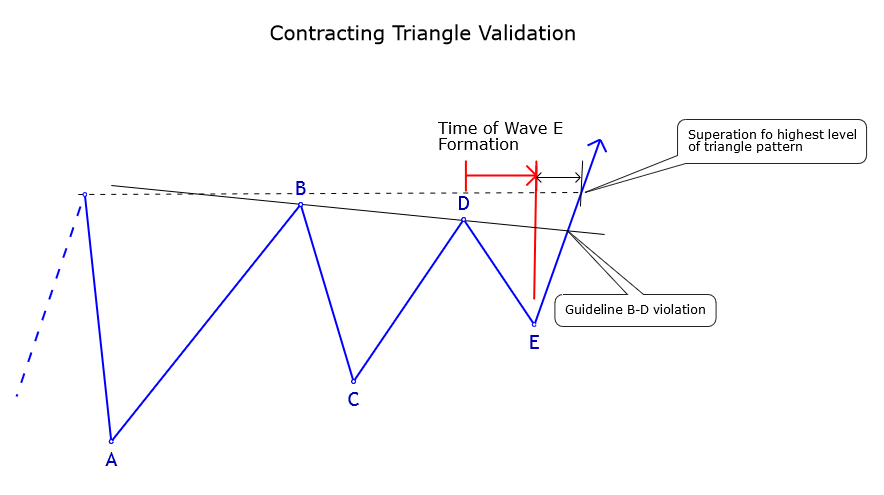
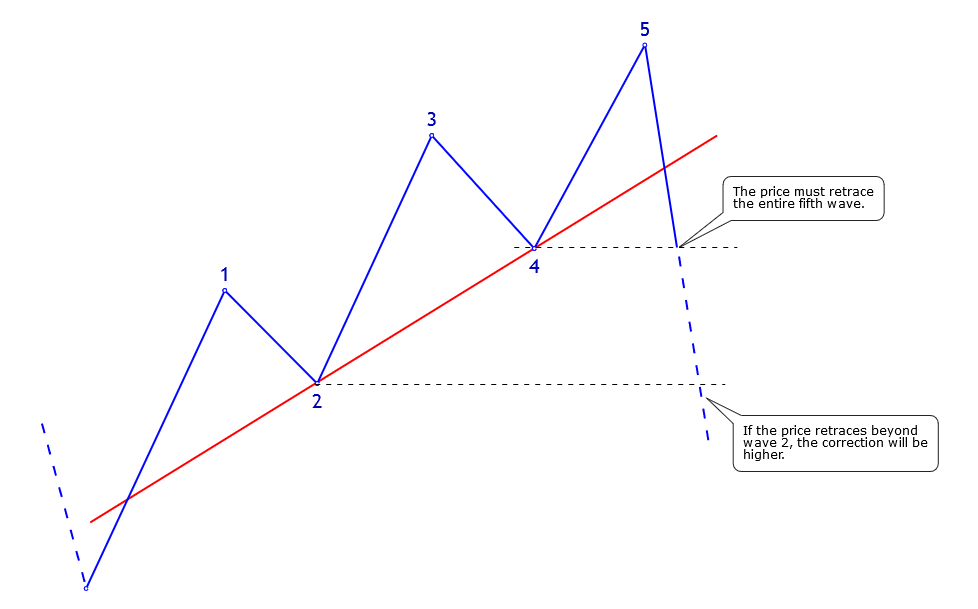
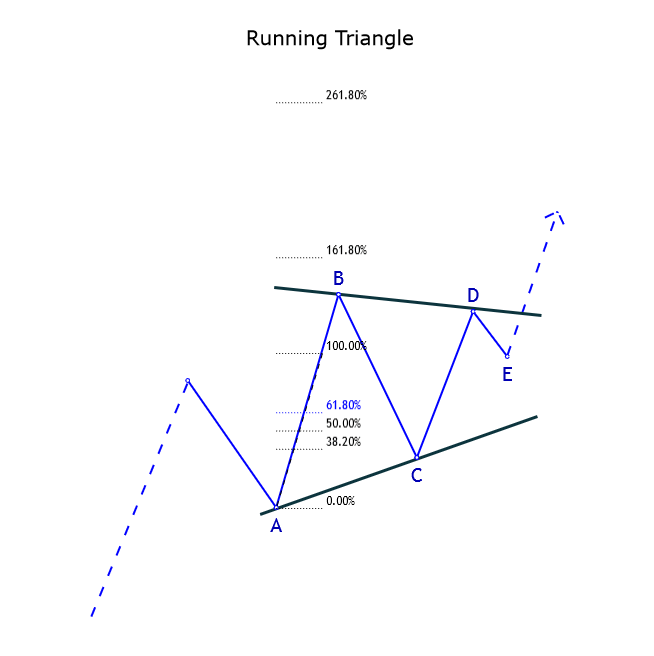
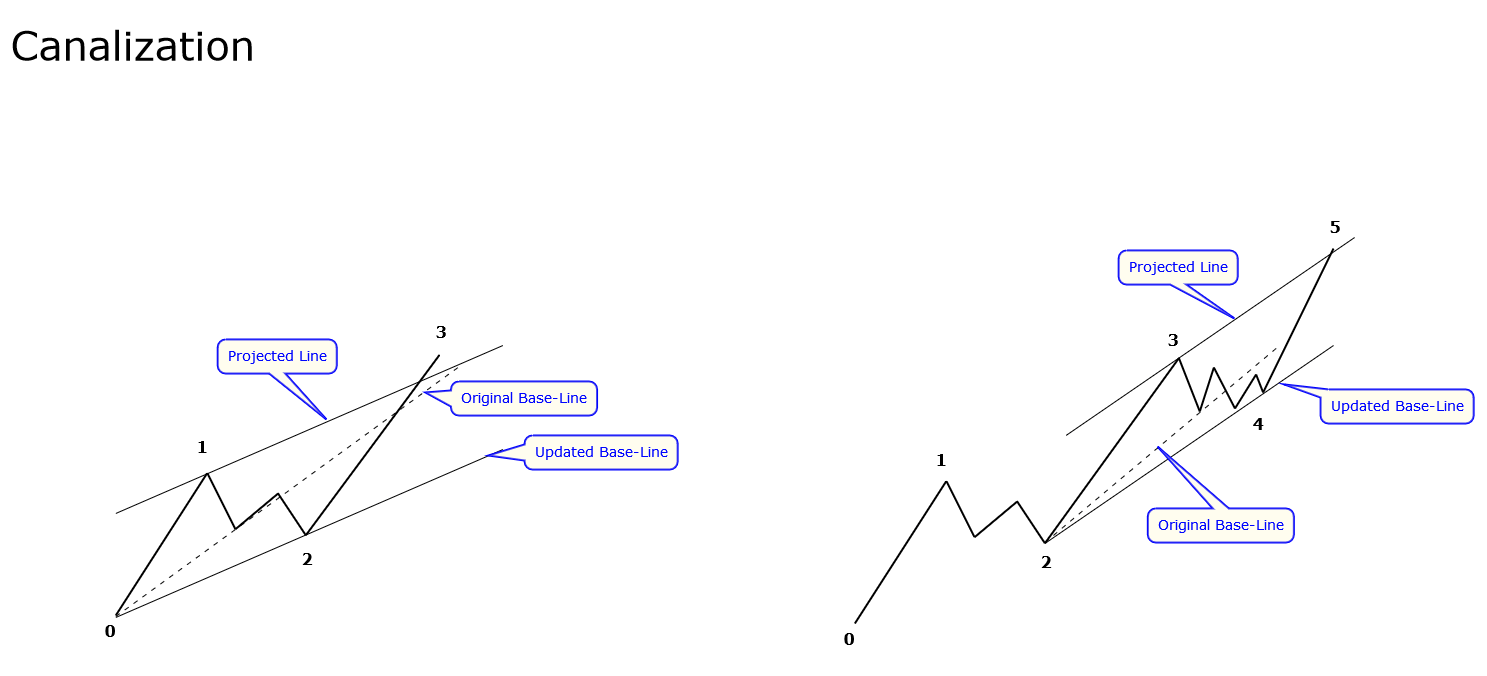
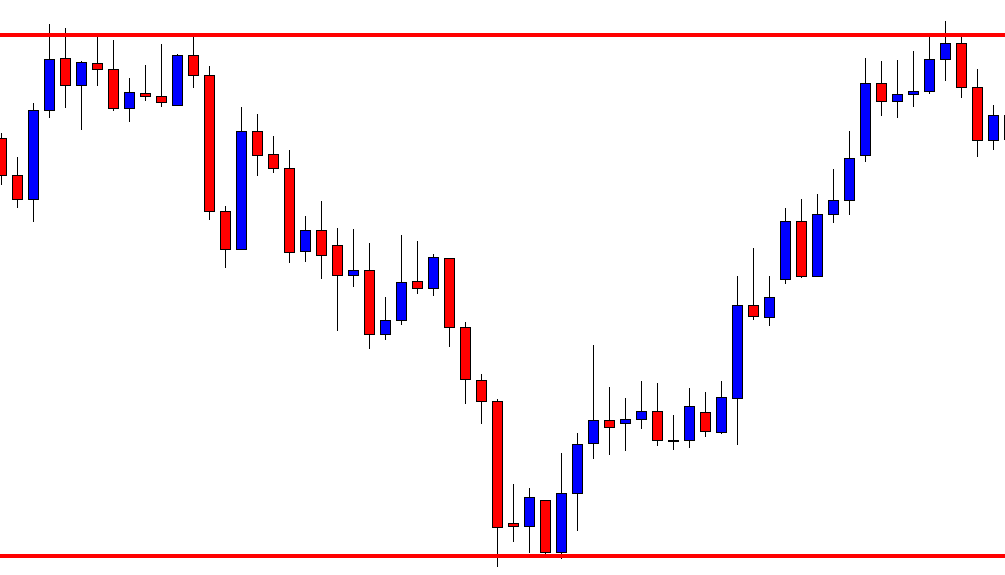
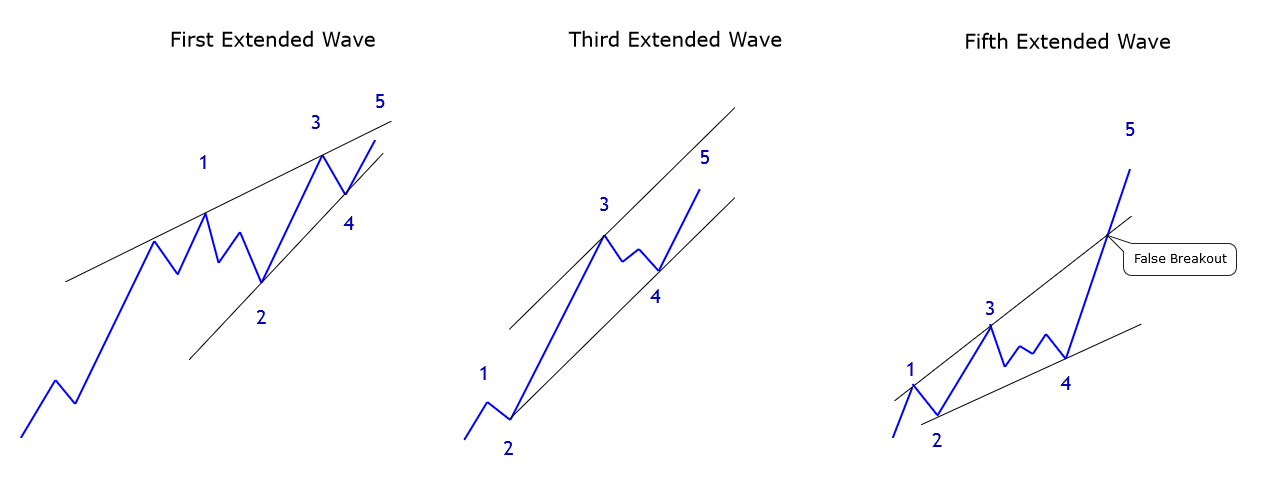
When the first wave is extended, the structural sequence has a wedge shape. In this series of waves, the ends of waves 1 and 3 and waves 2 and 4 are joined. Usually, the fifth wave will end up under the higher guideline. The structure shall be complete when the price action violates the lower guideline joining waves 2 and 4.

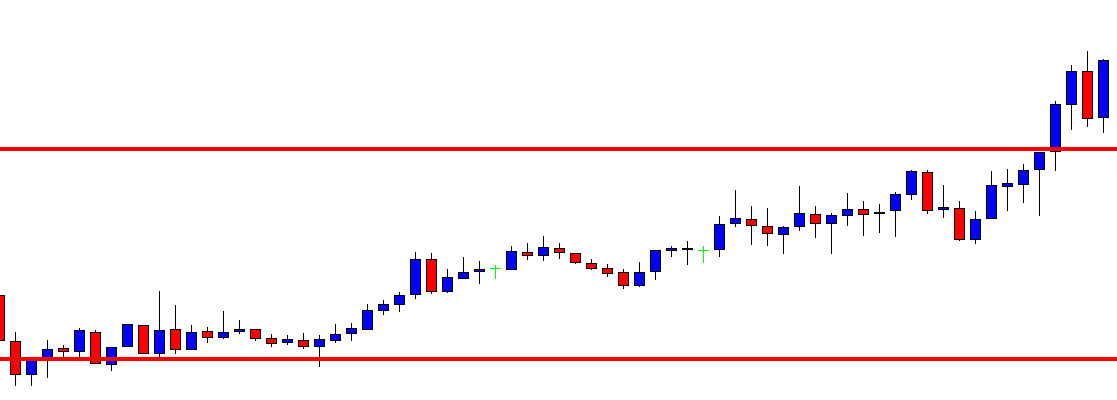
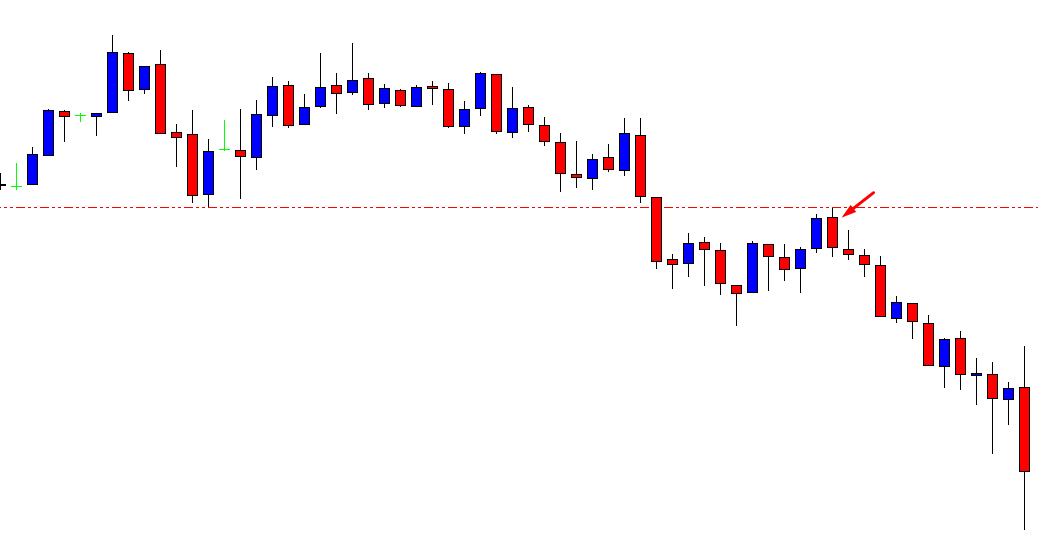
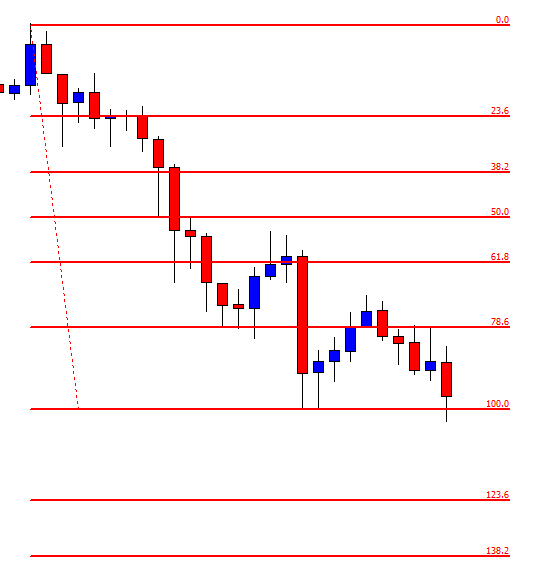
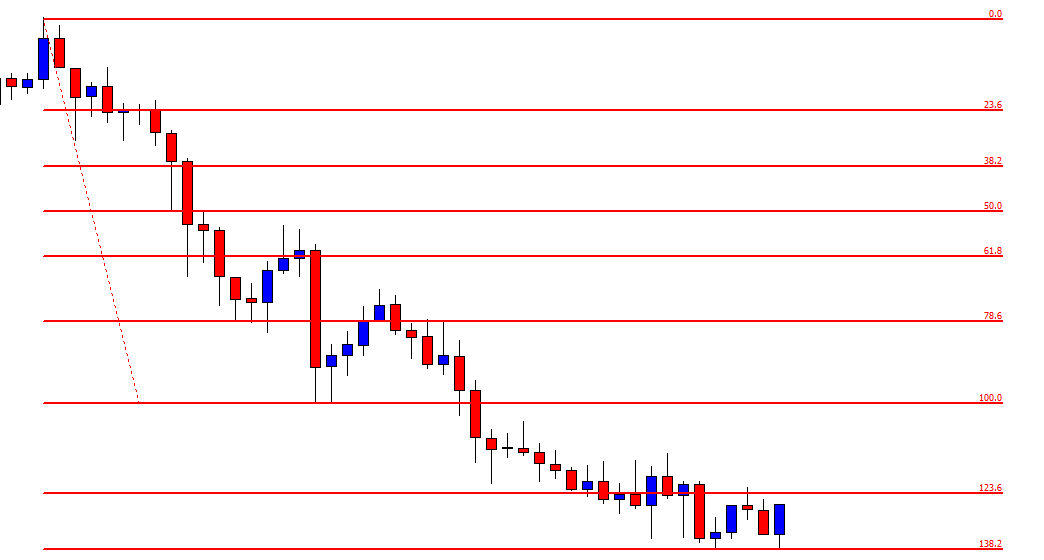
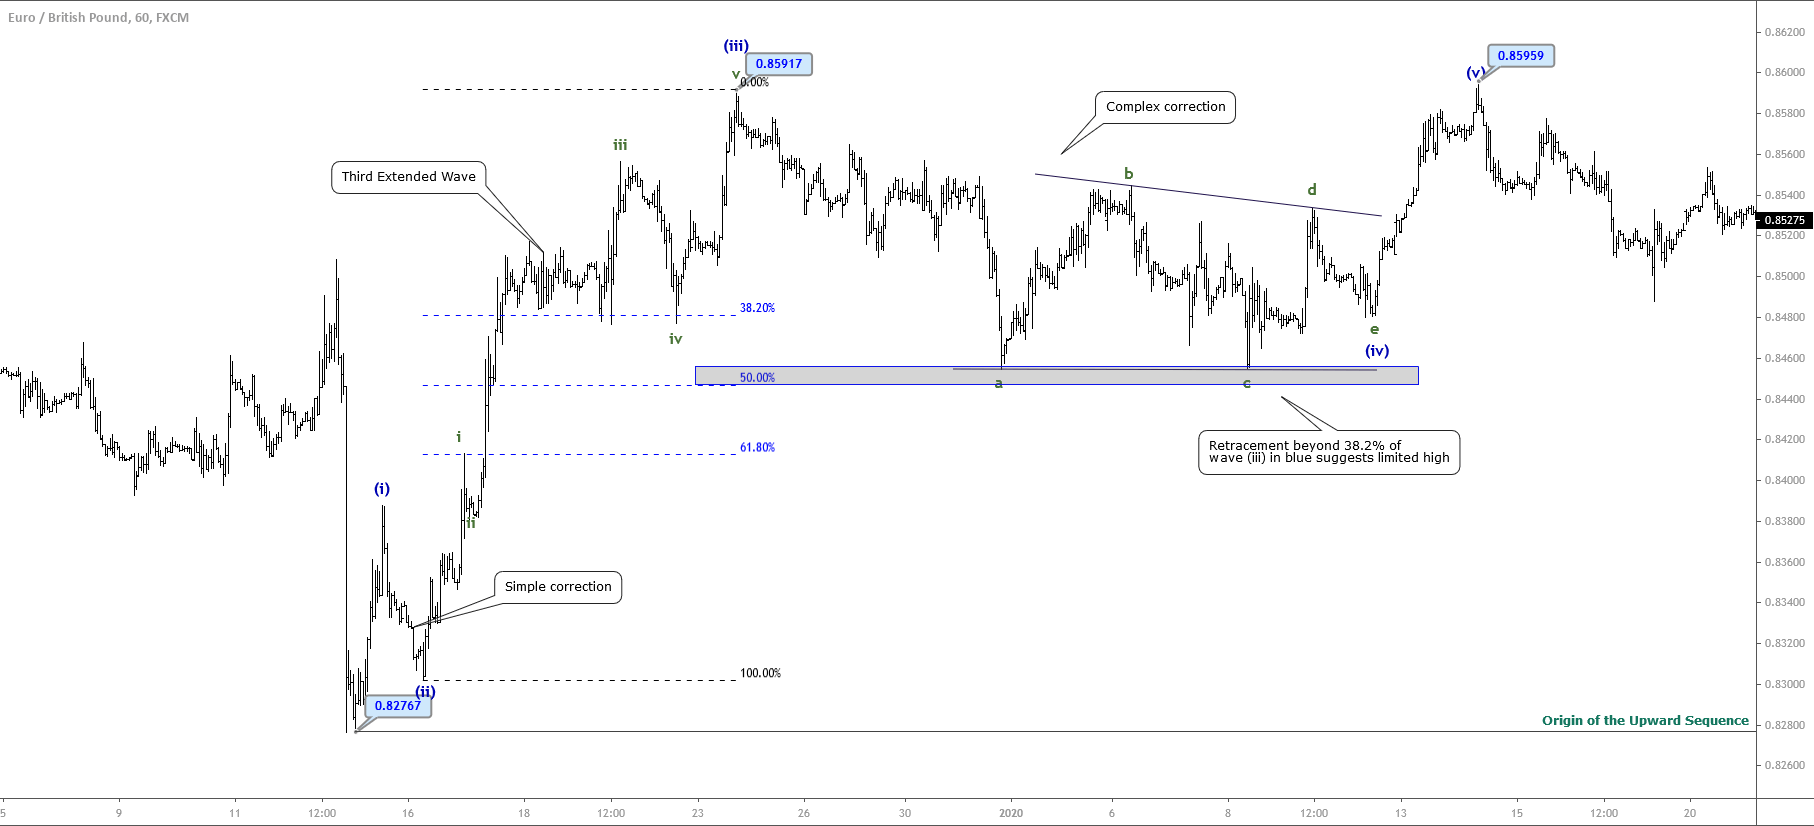
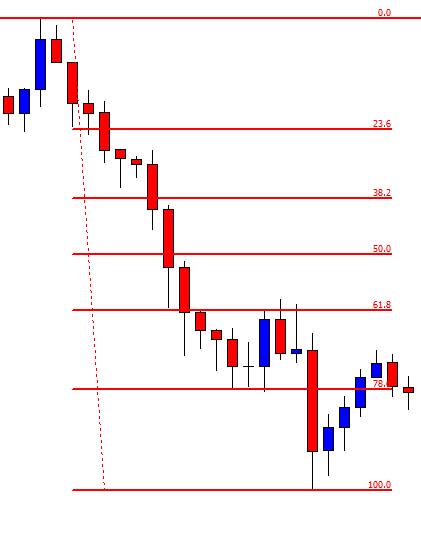
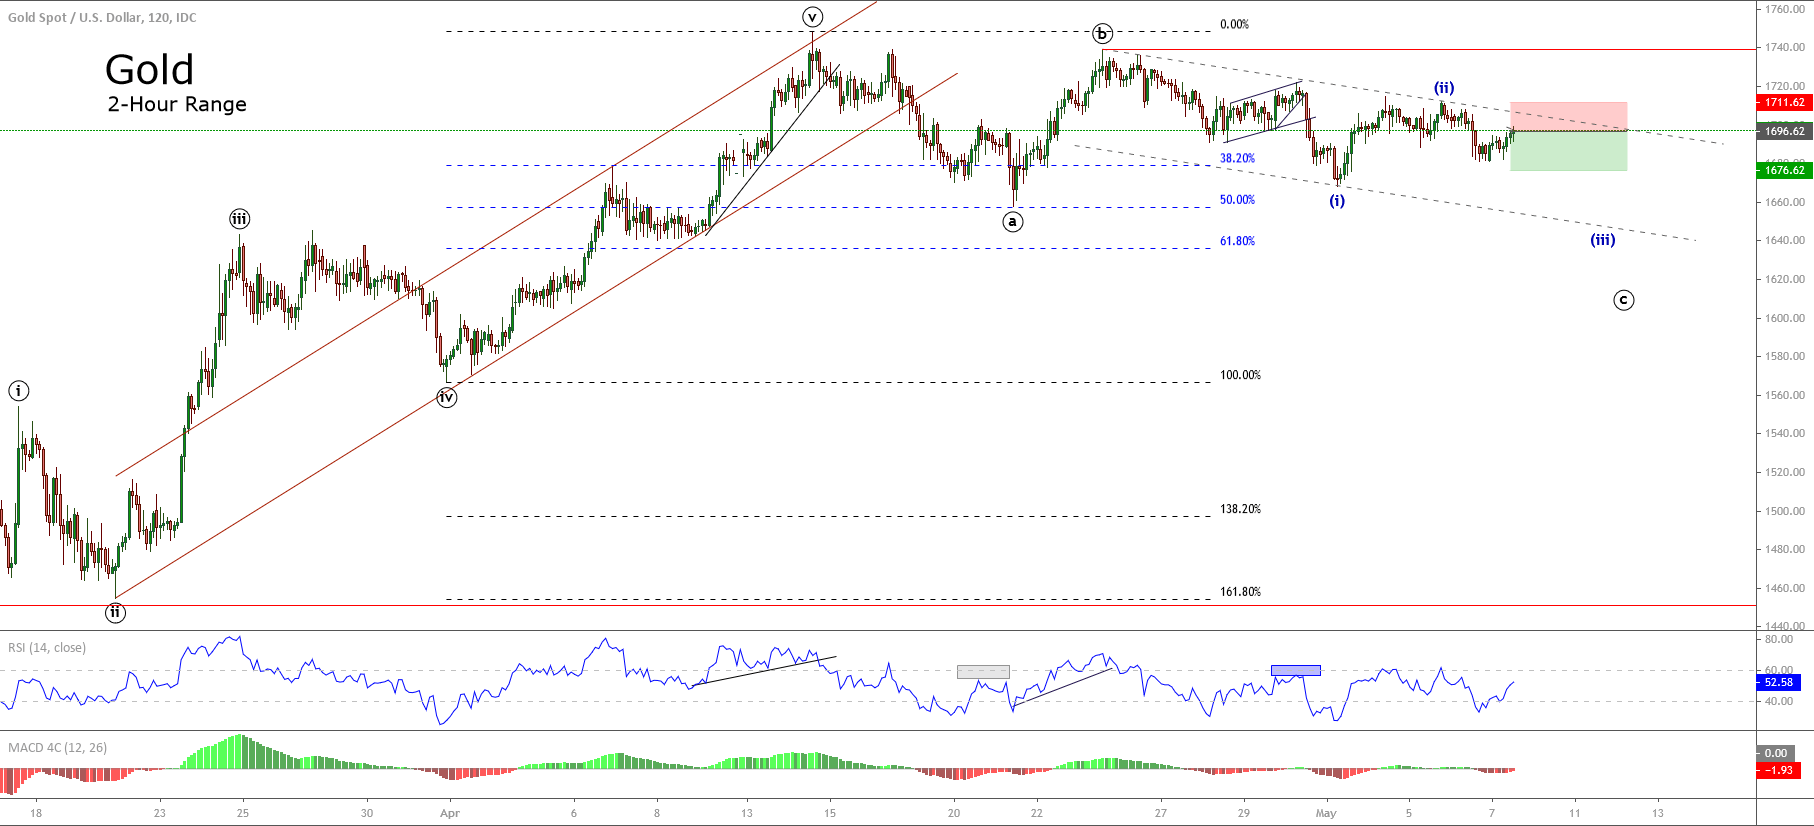
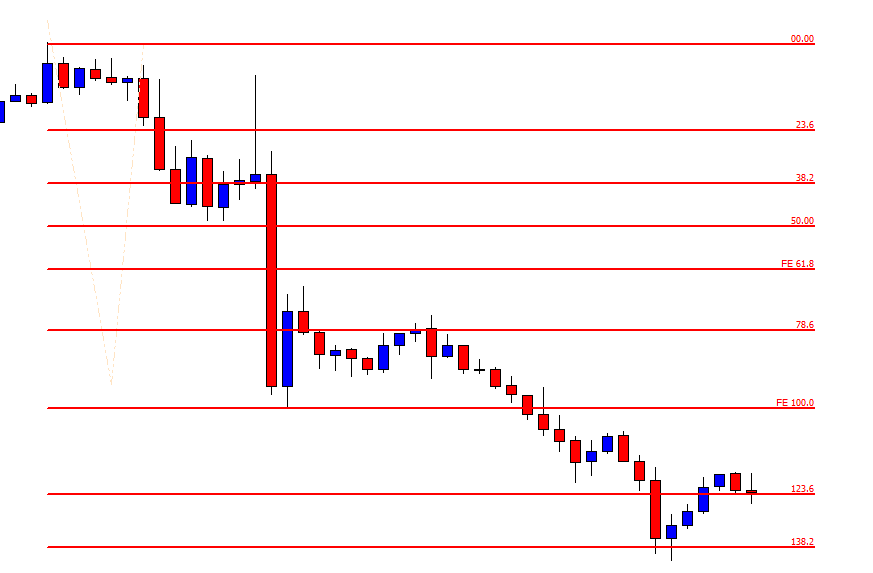
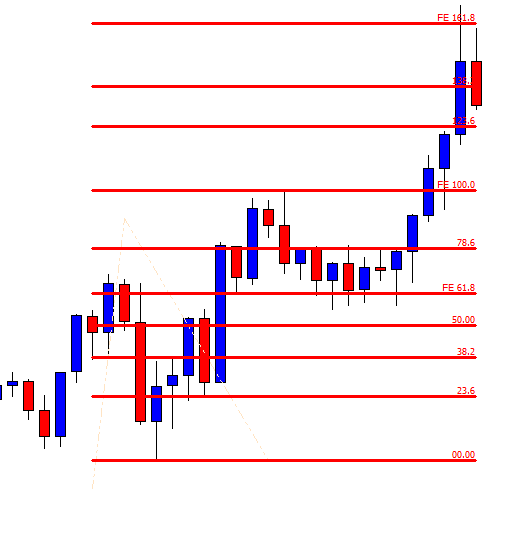
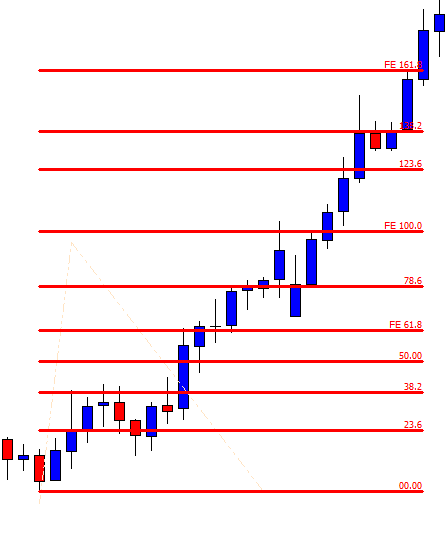
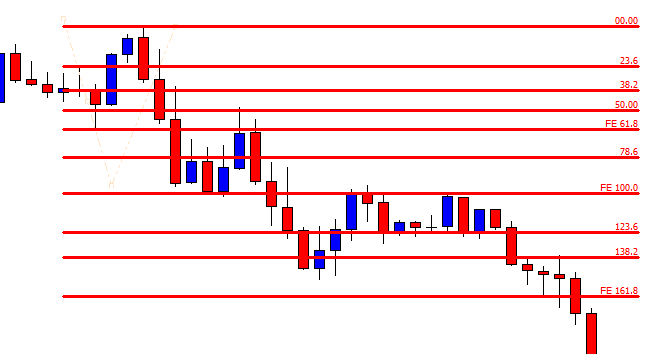
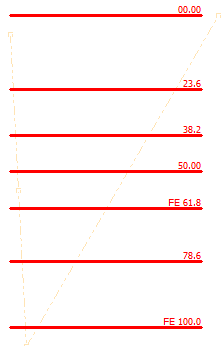
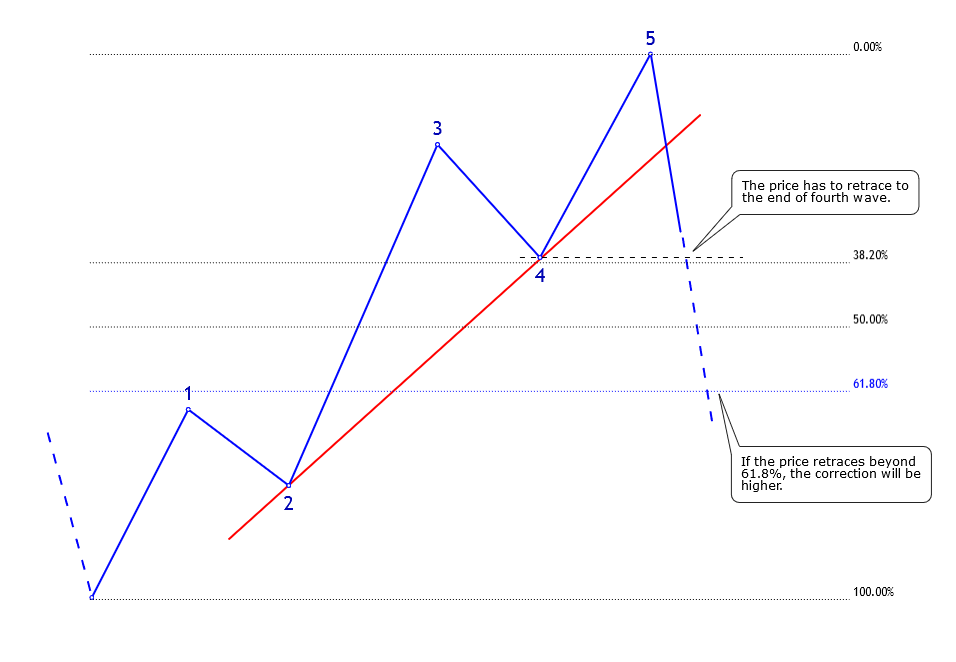
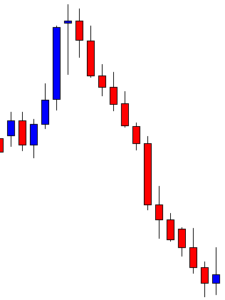
When the third wave is the extended one, the fourth wave should not retrace beyond 38.2% of the third wave advance. If the retrace extends beyond 38.2%, this would be indicative of a weakness in impulsive movement, and consequently, the fifth wave should not reach a new high.

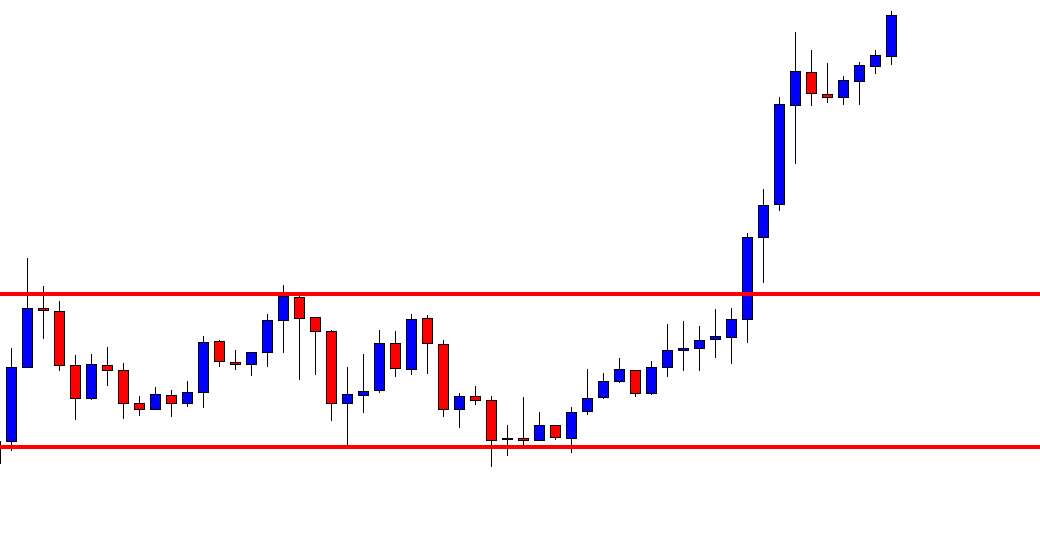
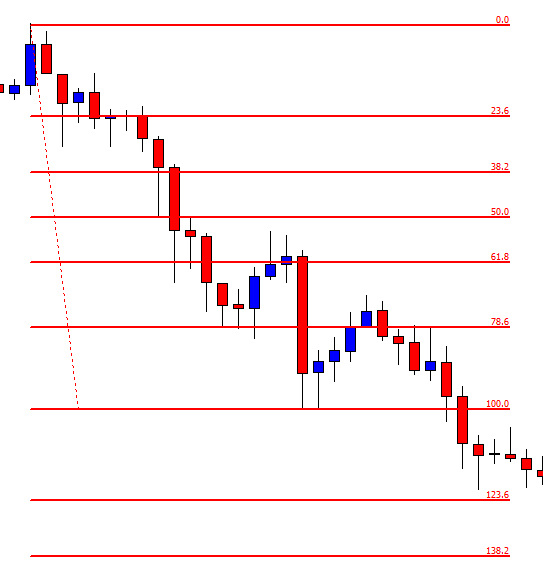
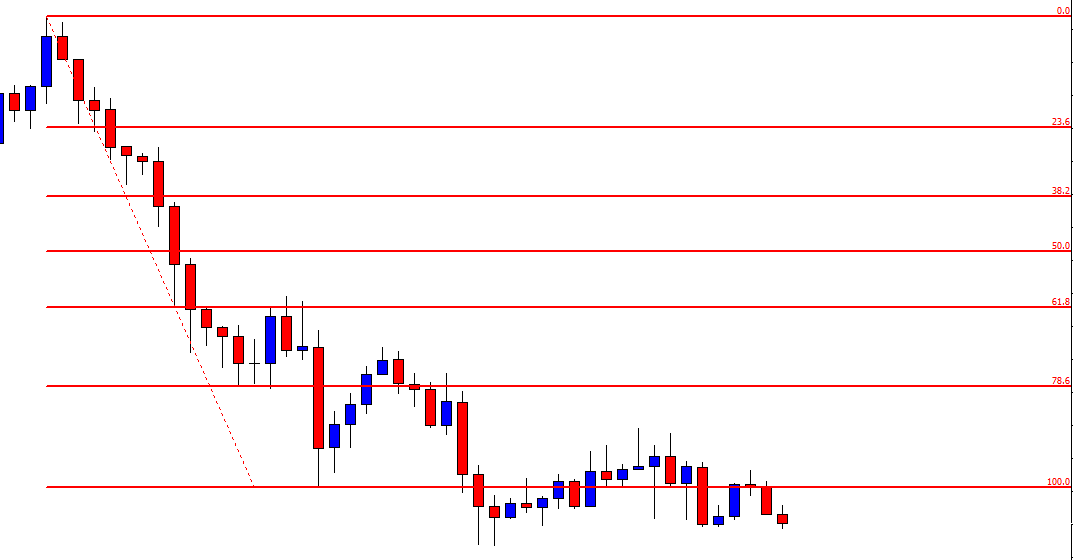
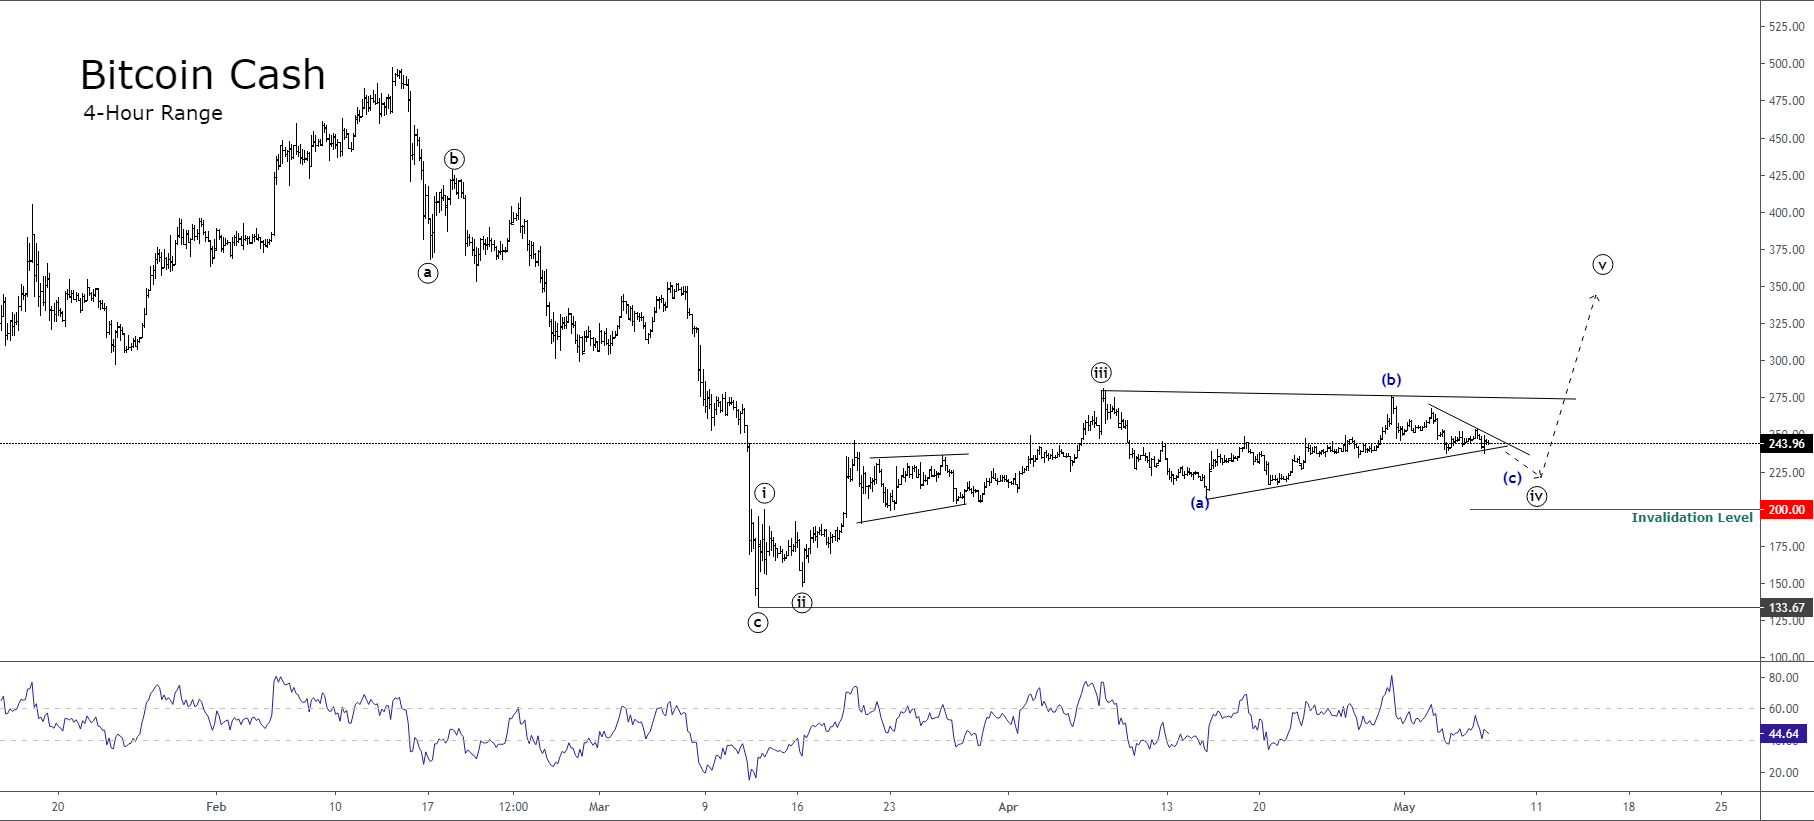
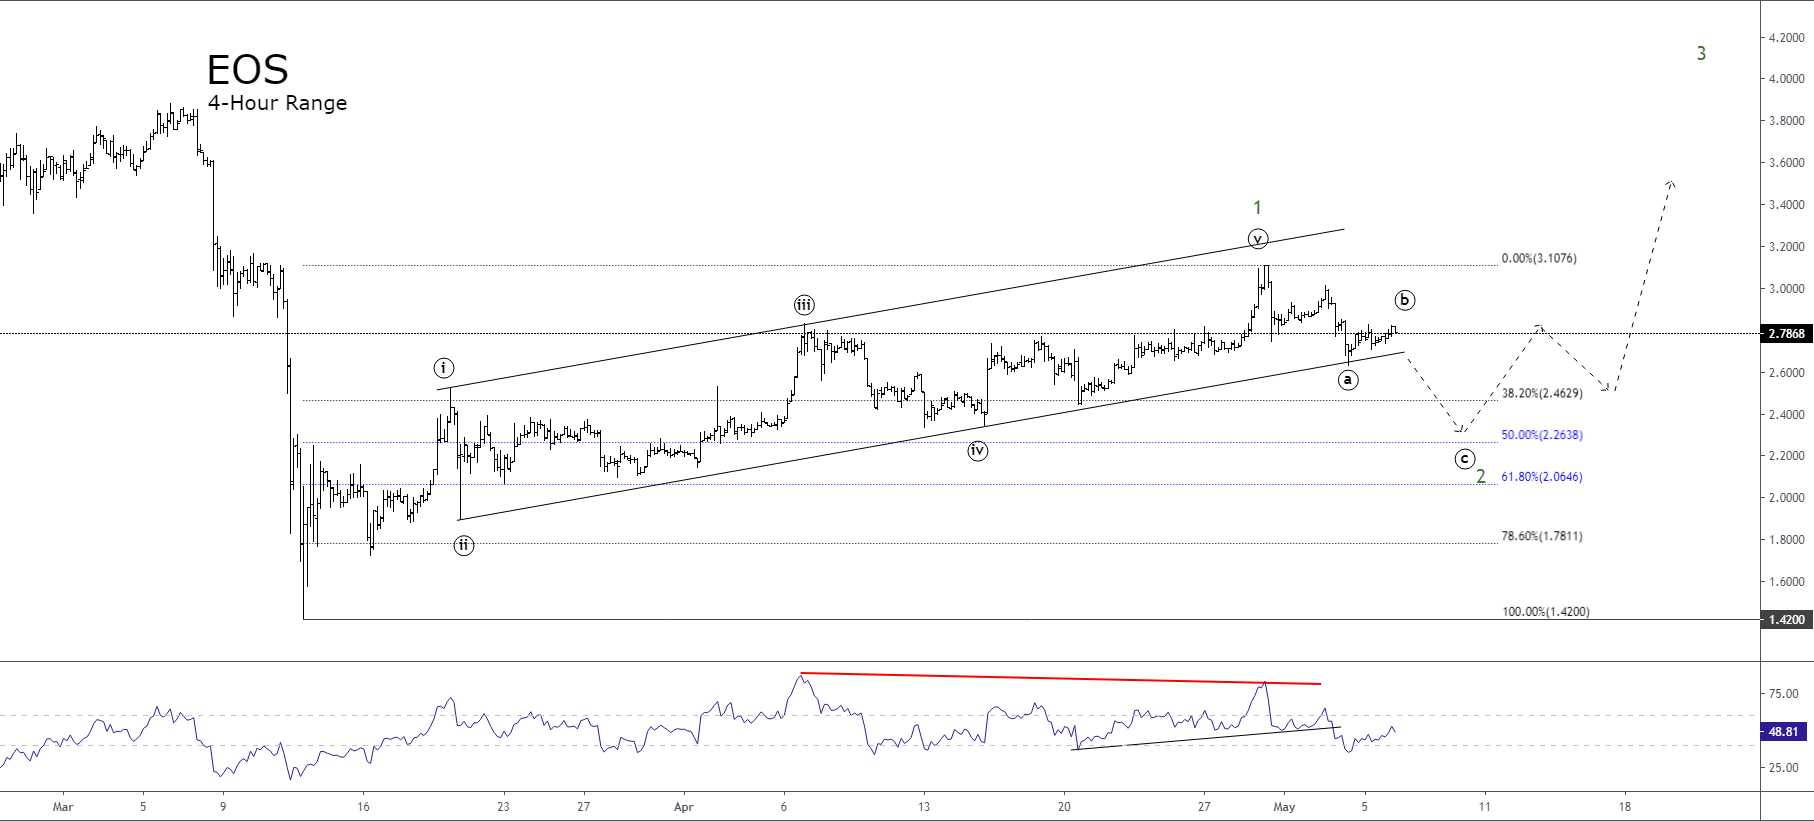
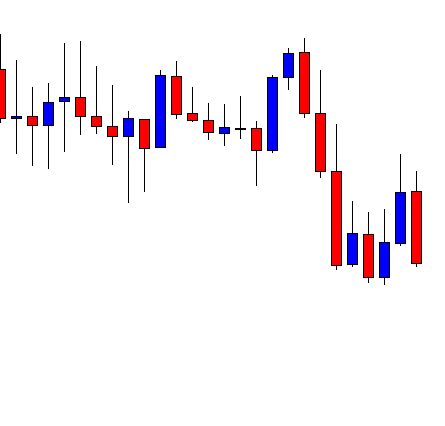
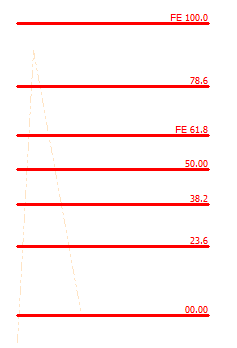
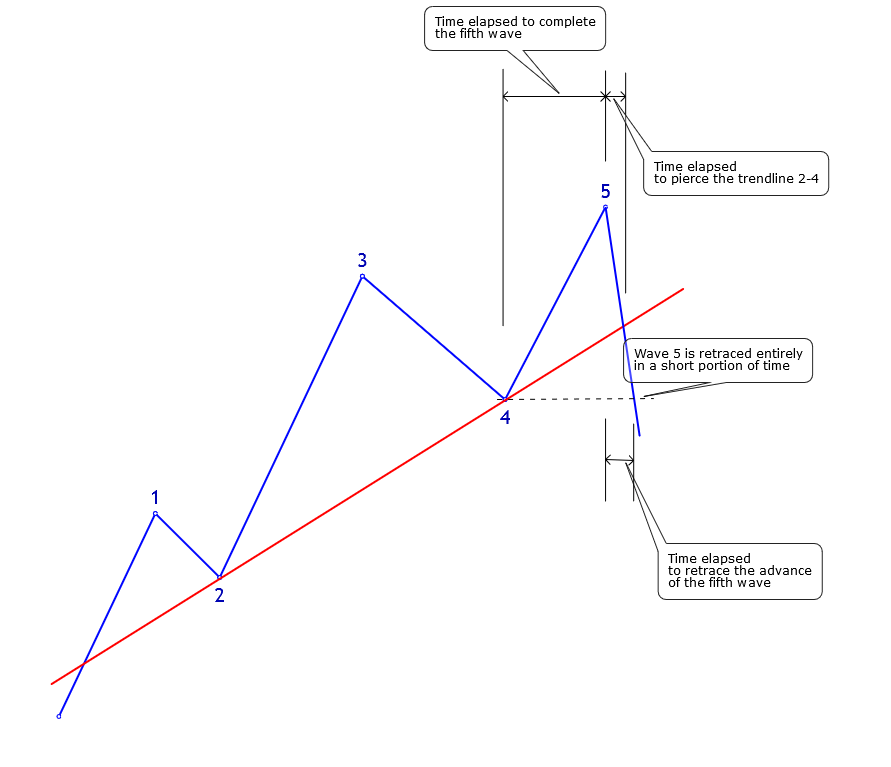
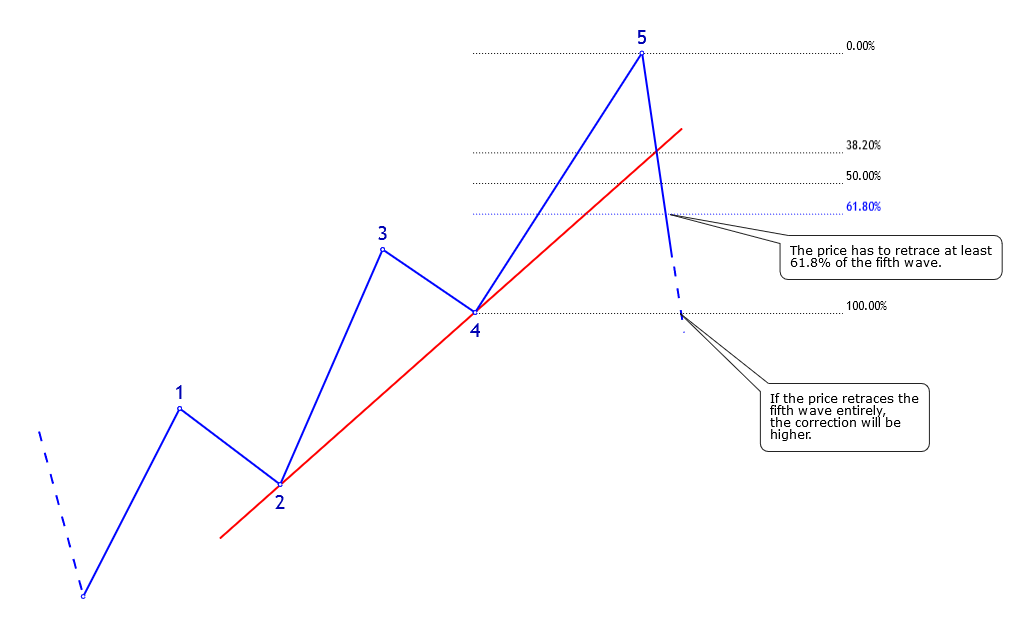
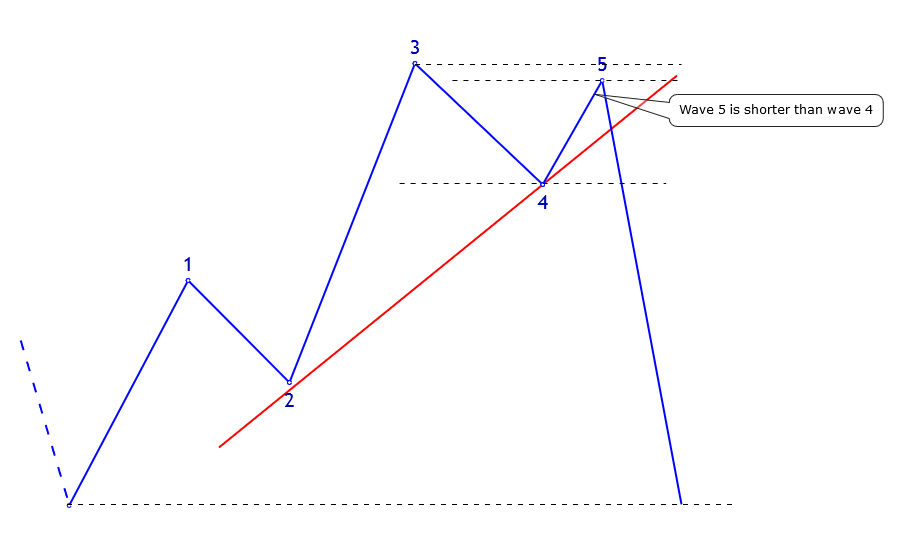
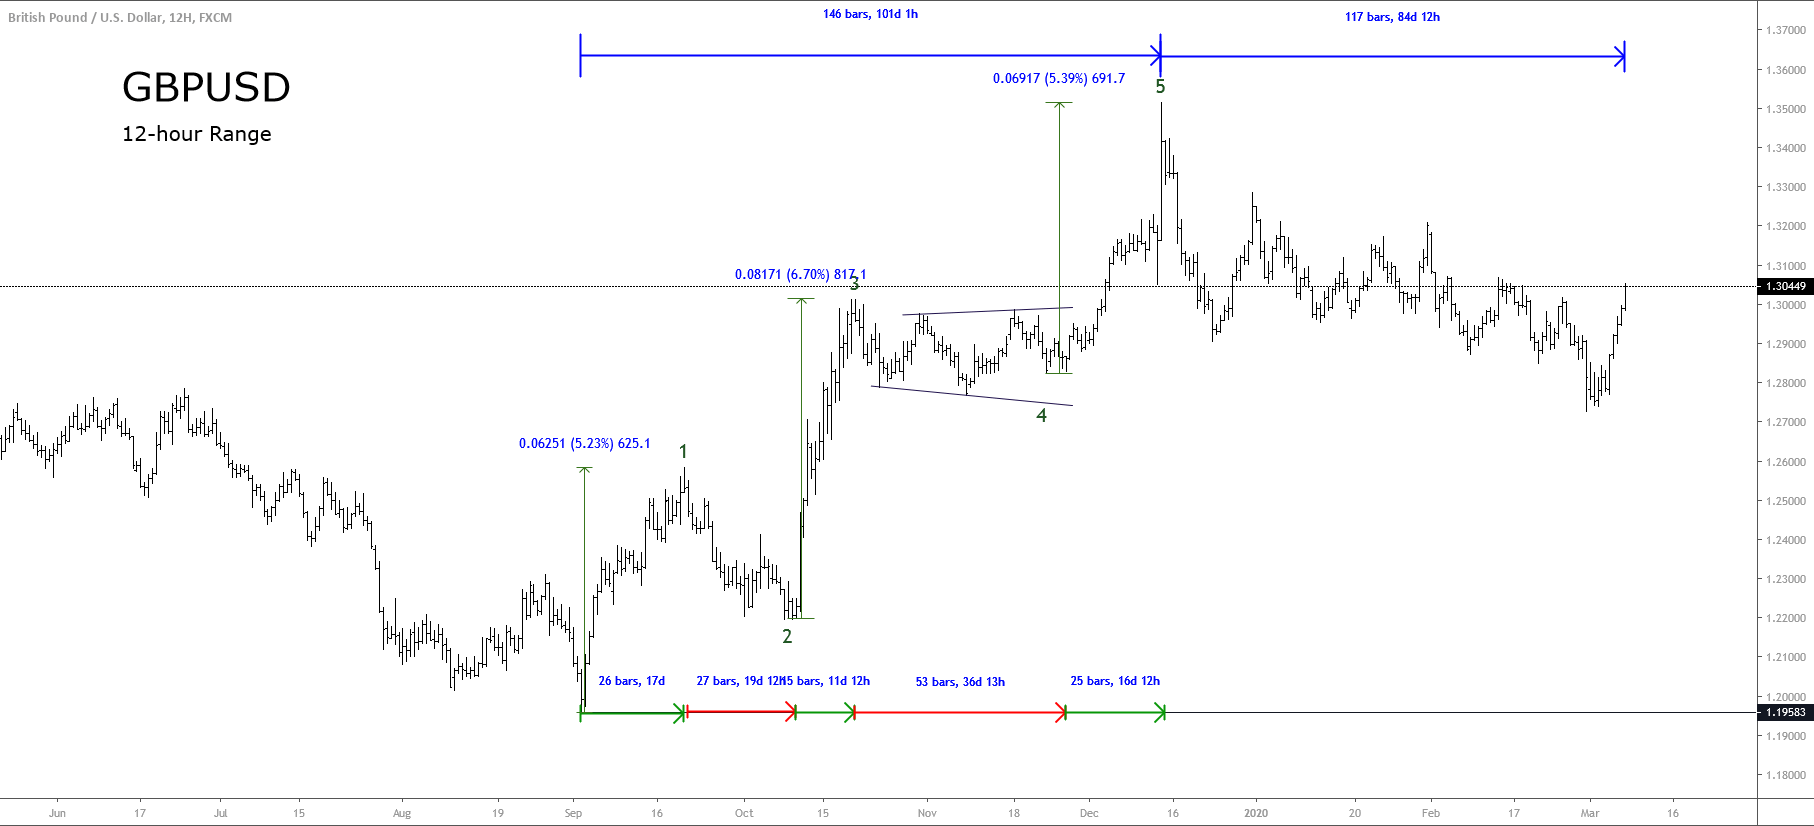
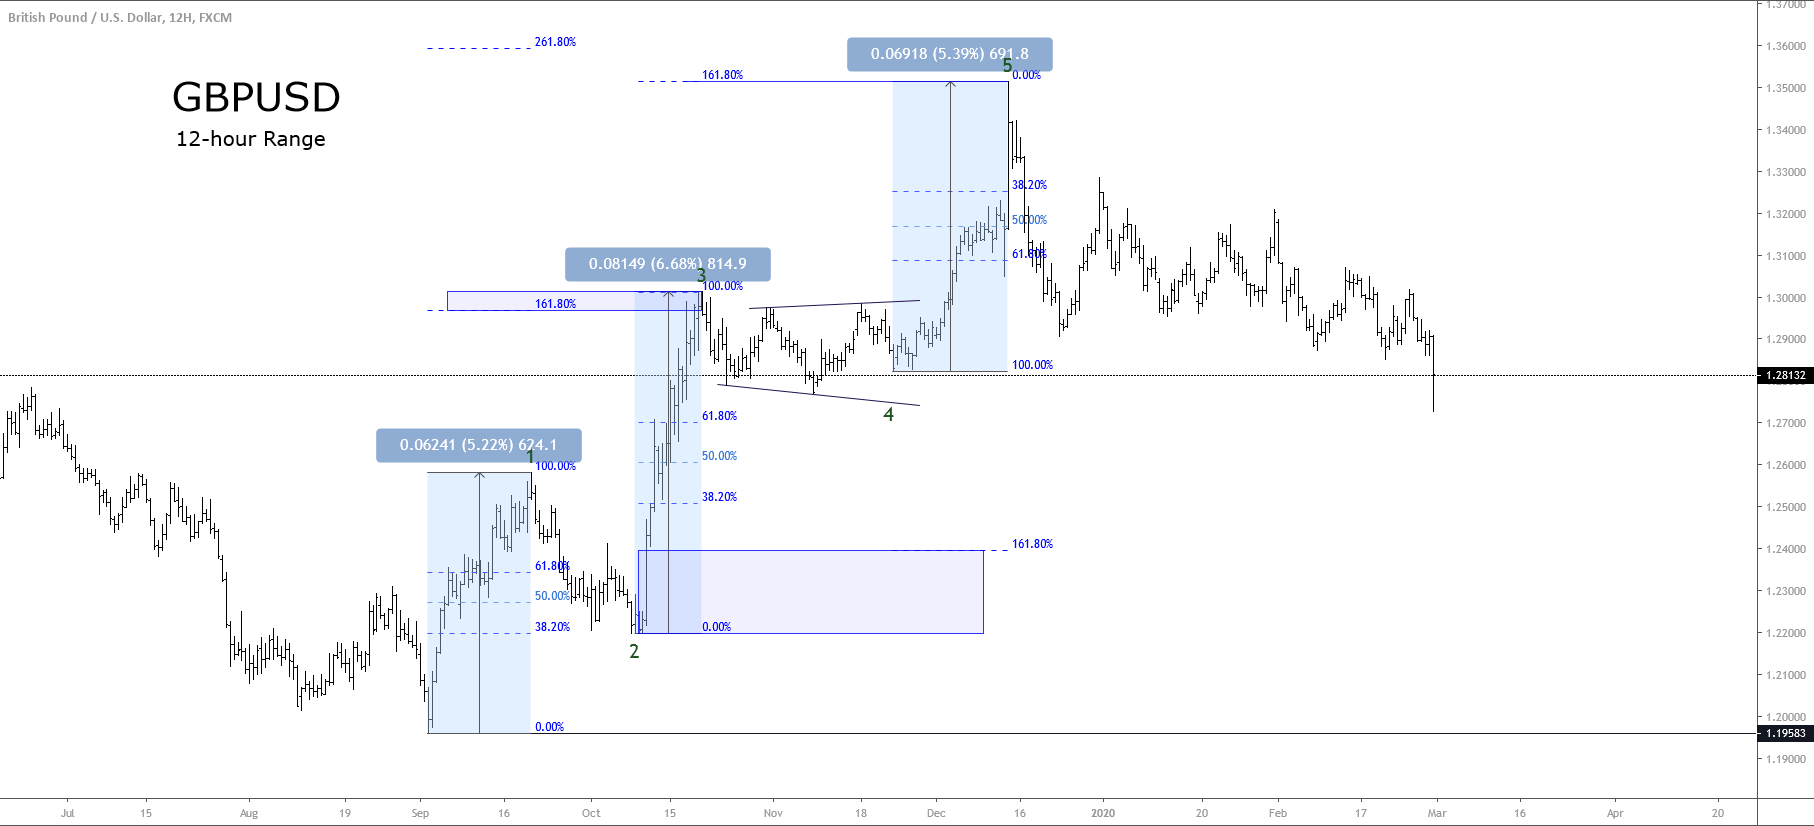
Finally, when the fifth wave is the most widespread, waves 1 and 3 may be similar, the third wave being slightly longer than the first and the fourth wave the most complex corrective wave compared to the second wave. The fifth wave will have the appearance of a false rupture of the directive that joins waves 1 and 3.

Conclusions

In this educational article, we have seen the importance of the principle of alternation in wave analysis, which can provide valuable information in the study of price action.

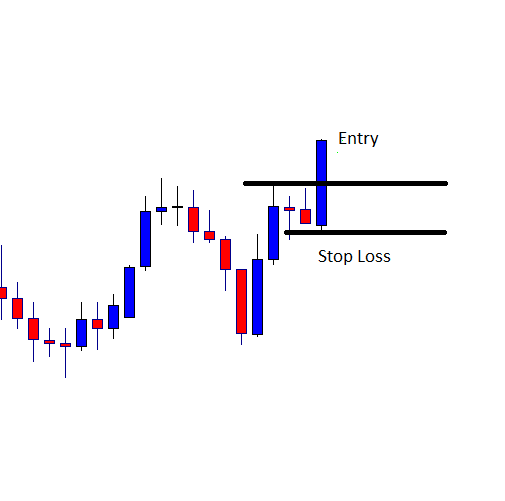
Also, knowledge of the alternation principle can help the wave analyst to identify which wave will be extended. In particular, when the analysts look to incorporate to the trend when it is in progress.

In the next educational article, we will study the process of wave counting and counting.

Suggested Readings

  • Neely, G.; Mastering Elliott Wave: Presenting the Neely Method; Windsor Books; 2nd Edition (1990).
  • Prechter, R.; The Major Works of R. N. Elliott; New Classics Library; 2nd Edition (1990).


Categories
Forex Daily Topic Forex Fibonacci

Fibonacci Trading: The Golden Ratio

Fibonacci trading is one of the most prolific trading methods, which is widely used by Forex traders. Retracement length, Fibo levels as well as reversal candle are three factors that Fibonacci traders need to pay attention to. In today’s article, we are going to demonstrate an example of a chart, which makes an excellent bearish move after having a retracement. The length of retracement, the most significant Fibo level, and the reversal signal all play their part in this example. Thus, fasten your seat belt and read through.

The chart shows that it makes a strong bearish move and makes a breakout at long-held support. The price heads towards the South, searching for its support. The sellers are to wait for the price to have a retracement.

The price starts having retracement. It produces a bullish inside bar followed by another bullish candle. The sellers are to wait for the price to find its resistance and produce a bearish reversal candle. However, the Fibonacci traders are to wait for the price to produce a bearish reversal candle at a very particular level, which is the 61.8 level.

The chart produces a bearish engulfing candle closing well below the last bullish candle. The Fibonacci traders must draw the Fibonacci retracement levels to find out which level produces this reversal candle. If this is the level of 61.8, the Fibo sellers are going to go short in the pair.

The highest high is the level of 0.00, and the lowest low is the level of 100.0. The price has a retracement and produces a bearish engulfing candle right at Fibo level 61.8. Usually, when the level of 61.8 works as support/resistance, it drives the price towards the level of 161.8. This means the price may head towards the South and hit the level of 161.8 next. Let us proceed to the next chart and see what the price does here.

The price hits 161.8 level. It makes an upward correction on its way. However, it reaches the level at last. The last candle shows that it breaches the level of 161.8. The price may head towards the South further.

The level of 61.8 is called the Golden ratio. It is a super significant level as far as Fibonacci Retracement is concerned. The buyers in a buying market and the sellers in a selling market wait for the price to produce a reversal candle/signal candle to go long/short in a pair. Yes, there some equations for the traders to know and obey to be able to trade with Fibonacci retracement. Once they learn them well, Fibonacci trading can make them a handful.

Categories
Forex Daily Topic Forex Fibonacci

Fibonacci Retracement: A Magic Trading Tool

Financial traders rely a lot on a tool called Fibonacci Retracement. This shows the percentage of retracement that the price makes after making a strong bullish/bearish move. The percentage of retracement is very significant to the traders. There are some particular levels, where the price reacts heavily and creates a new trend. Thus, financial traders use Fibonacci Retracement tool to measure retracement length and find the potential whether it is going to create a new trend or not. The Forex traders love using the Fibonacci Retracement tool as well. Once we know how to draw it on the chart accordingly, we find out that the currency pairs on almost all the timeframes obey the Fibonacci retracement ratio.

Leonardo Fibonacci, an Italian mathematician, identified a series of numbers such as 0, 1, 1, 2, 3, 5, 8. 13, 21, 34, 55, etc. Each number is the sum of the preceding two numbers.  These numbers produce some significant ratios, such as 23.6. 38.2, 50, 61.8. 78.6, 100, 123.6, 138.2, 161.8. These ratios and the Fibonacci sequence are found in nature as well. Thus, people love using the sequence ratios in their design and plan. At the end of the day, people run financial markets. They buy or sell at certain levels. Since Fibonacci ratios are much related to our nature and life, traders love using these ratios to help decide where to buy and where to sell.

As far as Fibonacci ratios are concerned, the 61.8 is considered as the golden ratio. It is found in flower petals, seed heads, pinecones, fruits and vegetables, tree branches, shells, spiral galaxies, hurricanes, fingers, animal bodies, reproductive dynamics, animal fight patterns, DNA molecule, etc.

In the financial/Forex market, the ratios are used by using a tool called Fibonacci Retracement. There are other Fibonacci tools, but this one may be the trader’s most favorite.

In a buying market, a trader draws his Fibonacci retracement levels from the lowest low to highest high.

The level of 00.00 is the lowest low, and the 100.00 is the highest high of a bullish wave. Traders are to wait for the price to make a bearish retracement. All these levels are significant, and the price reacts to these levels. However, the buyers pay more attention when the price is around 61.8 level to go long in a pair.

In a bearish market, it is just the opposite. Let us have a look at how it looks like.

Fibonacci Retracement levels help traders spout out the trend’s initiating point. Thus, it becomes easy for the traders to take entry with excellent risk-reward. In our forthcoming articles, we are going to demonstrate charts on different pairs, time frames to find out how the price reacts to different Fibonacci levels. Stay tuned.

Categories
Forex Elliott Wave

Understanding the Complexity in Wave Analysis – Advanced Level

Introduction

Financial markets are the result of human interactions where one party buys and the other sells. The results of these actions are reflected in a price chart. 

R.N. Elliott studied the interactions between these two forces that move the market. In his study, Elliott detected that specific patterns repeat themselves over time. He also identified that the price tended to move in impulsive and corrective movements.

Elliott recognized that as time progresses, the price develops movements that, in its basic unit, correspond to segments, those that have a low level of complexity. 

The complexity increases at an additional level as these segments complete a series of three or five movements, giving origin to the wave. 

Later, as a wave is completed, another movement emerges, giving course to a new wave. As this ordered sequence advances in time, the price forms structures that we could call as “poli-waves,” which Elliott defined in the form of patterns corresponding to a structure or wave of higher degree.

The interaction between different sequences of “poli-waves” or basic wave patterns, give origin to a more complex structure, which we can define as “multi-wave.” In turn, when a succession of 3 or 5 multi-waves completes, the price action creates a structure of a higher degree whose complexity level is higher. We can call this complex structure as “macro-wave.”

Multi-wave Construction

Multi-waves are complex structural series that is characterized by having at least one poly-wave in their internal structure. The type of waves can be impulsive or corrective.

Impulsive Multi-waves. They are structures in which one or several of their impulsive waves are poly-waves. Its training requirements are as follows:

  1. Of the three impulsive forward waves, only one must be a poly-wave; the other two can be simple movements.
  2. At least one of the two corrective waves can be a poly-wave, the other can be a poly-wave or a simple wave.
  3. The longer-lasting corrective wave 2 or 4 will occur just before or after the extended wave.

The following figure shows the different patterns of multi-waves of impulsive nature, being the second case, which corresponds to the third extended wave the most common.

Corrective Multi-wave. In the same way as multi-impulsive waves, the corrective multi-waves must contain specific requirements, which are described below.

  1. One or two of the waves that are divided into five waves in the longer pattern should be able to be subdivided as a poly-wave. If it has only one structure subdivided into five, it will be a Flat, while if it has two structures divided into five, it will be a zigzag pattern.
  2. The multi-wave B wave is likely a corrective poly-wave.

The following figure shows two types of corrective multi-waves.


Complex Multi-waves Construction

The complex multi-wave analysis does not differ from complex wave analysis composed of poly-waves. The difference is that complex multi-waves are composed of multi-wave groups and not poly-waves.

Macro-waves Construction

As the market develops, the structural series can be grouped as multi-waves and thus form a macro-wave

Impulsive Macro-waves. This type of structure is composed of a multi-wave in one of its three impulsive waves, while the other two will be a poly-wave. 

Corrective Macro-waves. Must contain at least one multi-wave, and another wave must be a poly-wave. If the structural series has two multi-wave, the complex structure will be a zigzag, and its formation has only one multi-wave, the corrective structure will be a flat pattern.

Conclusions

In this educational article, we have seen how, as time advances, the complexity of the waves also increases. 

However, the wave analysis whose level of complexity is higher, being it a multi-wave or macro-wave, must be realized in the same way to that studied in the wave analysis section corresponding to the intermediate level wave analysis. 

This situation leads us to conclude that the market behaves in a fractal way over time, and wave analysis does not change regardless of the proportion of time studied.

In the next educational article, we will expand on the concepts of alternation and extensions.

Suggested Readings

  • Neely, G.; Mastering Elliott Wave: Presenting the Neely Method; Windsor Books; 2nd Edition (1990).
Categories
Forex Elliott Wave

Complex Corrective Waves Analysis – Advanced Level – Part 2 of 2

Introduction

In the first part of the complex corrective wave analysis article, we presented two conditions that suggest the development of a wave x. 

The first condition considers whether the second compacted corrective wave retraces less than 61.8% from the first correction. The second condition occurs if the second corrective structure retraces more than 161.8% from the first correction.

Glenn Neely, in his work “Mastering Elliott Wave,” indicates that if the first condition occurs, then the market performs a complex correction with a small wave x. While for the second case, the price action develops a complex correction with a large wave X.

Condition 1 – Complex Correction with Small Wave x.

When the wave analyst identifies a non-standard wave, there is a high probability that the wave x is smaller than 61.8% of the previous corrective phase. This type of wave tends to take the form of an impulsive sequence. However, its internal details rule out this possibility.

The non-standard structural sequence or series may have various combinations, which are detailed below:

  1. Double zigzag (5-3-5-wave x-5-3-5)
  2. Double three (5-3-5-wave x-3-3-3-3-3)
  3. Double three (5-3-5-wave x-3-3-5)
  4. Double flat (3-3-5-wave x-3-3-5)
  5. Double three (3-3-5-wave x-3-3-3-3-3)
  6. Triple zigzag (5-3-5-wave x-5-3-5-wave x-5-3-5)
  7. Triple three (5-3-5-wave x-5-3-5-wave x-3-3-3-3-3)
  8. Triple three (5-3-5-wave x-3-3-5-wave x-3-3-3-3-3)

From the above list, the triangular formation likely corresponds to a contractive triangle. On the other hand, waves x can be other corrective waves without altering the entire structure. 

The wave analyst must take into account the application of the alternation principle. In particular, the x-wave will alternate with its preceding wave. For example, if the first compact wave corresponds to a zigzag, the x-wave will be a plane or a triangle.

The following figure shows two examples of complex corrective waves that accomplish thew first condition. In particular, the case corresponds to a double zigzag, and a double three consisting of a zigzag pattern and a triangle structure.

Condition 2 – Complex Correction with Large Wave X 

When the wave analyst detects a complex correction in which the wave X is larger than the previous correction in terms of price, the entire formation will be classified as double or triple three patterns.

This structural series can have various combinations, which are detailed below:

  1. Double three (3-3-5-wave X-3-3-3-3-3)
  2. Double three (3-3-5-wave X-3-3-5)
  3. Triple three (3-3-5-wave X-3-3-5-wave X-3-3-3-3-3)
  4. Triple three (3-3-5-wave X-3-3-5-wave X-3-3-5) 

In summary, the structural series of both conditions have been listed in the most likely order of occurrence.

As in the first condition, the following figure shows two cases of double three patterns.

Conclusions

So far, we have seen the different construction characteristics of complex corrective waves and how to differentiate each type of complex wave.

In particular, we saw the two main conditions that characterize complex corrective waves.

In the following educational article, we will present the conditions associated with each particular formation.

Suggested Readings

  • Neely, G.; Mastering Elliott Wave: Presenting the Neely Method; Windsor Books; 2nd Edition (1990).
Categories
Forex Elliott Wave

Complex Corrective Waves Analysis – Advanced Level – Part 1 of 2

Introduction

Complex corrective waves are groups of waves that do not have an internal structure subdivided into three or five waves. In general, complex corrections tend to appear in waves fourth or B. Moreover, these formations are divided into two categories standard and non-standard.

Standard Type

An impulsive or corrective Standard wave formation does not imply that it is formed by a series of three or five adjacent segments. Usually, one of its corrective waves will possess a greater number of internal subdivisions creating a more extensive structure in terms of time. This condition will create a context in which can verify the alternation principle.

If the standard complex wave is in an impulsive sequence, it may be in wave 2 or 4. Otherwise, if this complex wave appears in a corrective phase, it will be between waves A and B.

The following figure shows a simplification of standard complex waves in an impulsive sequence and a corrective structure.

Non-Standard Type

Complex corrections only occur if there are at least two corrective sequences compacted in their three-wave structure and separated by a corrective formation that acts as a connector between the two corrective patterns. This type of waves must be given under certain conditions; likewise, they must meet specific rules that occur only once the waves have been compacted.

Retracement Rules

If the wave analyst found a compact corrective pattern that confirms a retrace less than 61.8%, or greater than 161.8% by the next corrective wave, and then produces another corrective wave, then the wave analyst should analyze the corrective structure as says the specifications section.

If the grouping conditions commented previously don’t meet, then the corrective structure shall be standard. In this case, the wave analyst should work the corrective sequence in the same way as discussed in the section “Corrective wave analysis – Intermediate level.”

On the other hand, the extension or duration in the time of the corrective wave doesn’t affect its analysis. A complex corrective structure can last for days and even years without this changing its structure. In this context, the wave analyst must maintain order in the use of the labels of each formation.

Non-standard Complex Wave Specifications

The first principle of a complex corrective wave implies the existence of a wave X, which acts as a connector for two standard Elliott corrective wave formations. The wave analyst should keep in mind that this point is the key to understanding non-standard patterns.

There exist two conditions to recognize the behavior of waves x.

  1. The first condition indicating the development of a wave x occurs when two compact corrective waves of a higher degree are separated by an intermediate corrective wave, which may be standard or non-standard. The first corrective wave must experience a retrace of less than 61.8% from the intermediate wave. In general, the wave x (or intermediate wave) will have a lower level of complexity than the other two corrective structures.
  2. If the price action reveals three corrective waves compacted consecutively, so that the second correction is at least 161.8% higher than the first, then it is highly likely that the second corrective structure will be a wave x. In general, the three complex waves will have the same complexity level.

If the market develops one of the two conditions commented previously, the market has likely developed a non-standard corrective formation.

Conclusions

In this educational article, we discussed the fundamental principles of a complex corrective structure and the importance of wave compaction in identifying and analyzing wave structures. 

In previous chapters, we have seen how to recognize the principle of alternation in the analysis of both impulsive and corrective waves. In this sense, the wave analyst must take into account this concept, which will allow him to identify what will be the next most likely movement.

In particular, R.N. Elliott, in his work “The Wave Principle,” defines the alternation of corrective waves and their complexity as follows “if a corrective wave is simple, the following will be complex, and vice versa.” Within a complex corrective structure, the compacted corrective patterns that compose it will also alternate with each other.

In the next article, we will look at the construction of complex corrective waves according to each condition. 

Suggested Readings

  • Neely, G.; Mastering Elliott Wave: Presenting the Neely Method; Windsor Books; 2nd Edition (1990).
  • Prechter, R.; The Major Works of R. N. Elliott; New Classics Library; 2nd Edition (1990).
Categories
Elliott Wave Guide Forex Elliott Wave

Intermediate Level Elliott Wave Analysis Guide

We have finished the section that covers the Intermediate Level of the Elliott Wave Analysis based on the work of Glenn Neely. These concepts are described and include the following aspects.

1.- Introduction to Intermediate Wave Analysis. In this section, we present the concept of grouping waves and how to apply them in the real market.
2.- Motive Waves Analysis. This section, divided into three parts covers the following aspects:
– The first part presents the extension concept and its application in the real market.
– The second part extends the concepts of Alternation, Equality, and Superposition, and we identified how the price action follows these rules.
– The third part presents the canalization process.
3.- Corrective Waves Analysis. This part unfolded in five parts, includes the following concepts:
– The first part reviews the rules of construction of corrective formations and the flat pattern, including its variations.
– The second part presents how to analyze the zigzag pattern and its variations.
– The third part exposes the characteristics and rules of the triangle pattern.
– The fourth part discusses the contracting triangle, including its variations, rules, and target zones.
– The fifth part dedicated to expanding triangles presents its variations and rules.
4.- Validation Rules. This two-part section exposes the next principles:
– In the first part, we learn how to validate impulsive waves.
– The second part shows how to validate corrective waves.
5.- Simplification of Wave Analysis. This last section illustrates how the compaction process can help the wave analyst to ease its analysis.

Categories
Forex Elliott Wave

How to Simplify Wave Analysis – Intermediate Level

Introduction

How to simplify wave analysis can seem a confusing task. However, if we consider the concepts we have previously studied, the process may be more straightforward. 

Until now, we have studied concepts and principles such as types of waves, internal characteristics of each kind of pattern, wave channeling rules, price and time alternation, and wave validation criteria, among other aspects.

In this section, we will see procedures in which we will transform the complexity into a basic market structure.

Waves Compaction

Compaction is the analysis process in which a sequence of adjacent segments that make up an impulse or correction structure (5 or 3) is grouped. Given the dynamic nature of price action, any Elliott wave pattern, once completed, can be labeled as impulsive or corrective. Therefore, this technique cannot be applied, while Elliott’s formation is in progress.

Once an Elliott wave pattern has been completed, the structure of the series can be compacted, which will make as a basic structure. Then, the formation we will use as a base in the following process for the analysis and compaction can be repeated.

Regrouping

Regrouping is the process you perform after compacting waves. At this stage, the wave analyst will use the compacted wave as the base structure of the following wave group and thus construct a series of larger waves, which may be standard or non-standard.

Integration

Integration is the process in which the wave analyst uses short-term compacted waves to form larger wave structures to be included in long-term charts. For example, once a short-term wave pattern is completed, this structure can be transferred with its labels to the long-term (or higher degree) chart. 

This process can be useful for information references when comparing short-term and long-term graphs to obtain a more logical and accurate idea of the next market movement.

The Principle of Complexity

This principle is useful for the classification of subdivisions of an Elliott pattern. Its usefulness lies in the possibility of combining large scale patterns and determining the relative name of the degree of each segment.

In other words, when a wave advances in the short term, it is straightforward to identify each segment and thus identify and label wave pattern. As time progresses, this wave increases its complexity, and the process of compacting waves is required. Once the wave is compacted, another wave is completed on a higher degree. 

Consequently, the complexity tends to grow as the waves increase, and they combine to give way to new waves.

The principle of complexity may not be relevant in the short-term analysis. However, as the horizon of analysis increases, the usefulness of this principle becomes essential. In this respect, the Elliott guidelines identified at the same consecutive level, have the same degree.

The Concept of Degree

Until now, we have used the term Degree superficially referring to an ambiguous time horizon as short, mid, or long term. 

In Elliott wave theory, the degree is not related to a specific timeframe, for example, 15 minutes, an hour, 5-day, etc. It is related to the order in which the different wave patterns are completed. 

R.N. Elliott, in his Treatise “The Wave Principle,” states that both labeling and degrees are not the ultimate purpose of wave analysis, but are an instrument that allows keeping an order to be maintained within the analysis process.

A wave degree is determined by the wave compacting process from the short to the long-term. Once the short term wave has been completed, it will be a segment in a higher time range or greater degree.

R.N. Elliott defined the following degrees to classify the order of market movements.

  • Subminuette
  • Minuette
  • Minute
  • Minor
  • Intermediate
  • Primary
  • Cycle
  • Supercycle
  • Grand Supercycle

The different degrees are represented in increasing order in terms of temporal magnitude. 

On the other hand, Prechter & Frost, in their work “Elliott Wave Principle,” incorporated six additional degrees, as shown in the following table.

In practical terms, to have a reference to the temporality to be used in the analysis process, when Elliott developed wave theory, the smallest data time range available corresponded to the hourly graph. Consequently, the wave analyst can begin by assigning the Subminuette degree to the wave structures that are completed in this temporality and thus advance successively from there.

Conclusions

In this article, we have seen how a systematic process can simplify the process of wave analysis.

The wave analyst can simplify the market analysis helped by the use of the compaction process, which should be realized once completed a wave pattern. Later, by using grades and labels, the wave analyst will be able to maintain a simplified order in the study and, in turn, make a forecast of the next most likely market movement.

In the following article, we’ll start the advanced level of the wave analysis with the study of complex corrective waves.

Suggested Readings

  • Neely, G.; Mastering Elliott Wave: Presenting the Neely Method; Windsor Books; 2nd Edition (1990).
  • Prechter, R.; The Major Works of R. N. Elliott; New Classics Library; 2nd Edition (1990).
  • Prechter, R., Frost.A.J.; Elliott Wave Principle: Key to Market Behavior; New Classic Library; 10th Edition (2005).


Categories
Forex Elliott Wave

Validation Rules of Corrective Waves – Intermediate Level

Introduction

Contrary to the case of impulsive waves, corrections do not require a sequence of retracements. The confirmation of the corrective patterns depends on the lengths of waves A and B within the correction. 

The validation of a corrective structure is defined in two stages. If both stages are verified, then the wave analyst will be sure that the corrective formation is correct. It should be noted that there is the possibility that only one of the two stages is validated; this does not limit that the pattern being valid.

Flats and Zigzag Patterns

Case 1 – Wave A is Larger than Wave B

In this case, the wave analyst must draw a trendline linking the origin of waves A and the end of B.

The first stage will verify the authenticity of the corrective formation if the price action violates the trendline O-B within a period equal to or less than the interval of wave C formation.

In case the time-lapse is longer, then the price action could be developing a terminal structure, or wave 4 of wave C could be incomplete, or the corrective pattern analyzed is not correct.

If the analyzed pattern is correct, then the second stage must be revised. In this stage, the wave analyst must study time lapsed in the complete retracement of wave C, which must be in a time equal to or less than the time spent in the formation of the wave C.

Case 2 – Wave B is Larger than Wave A

In this case, the first stage would fulfill if the wave C undergoes a complete reversal in the same or shorter time when the time lapsed in the wave C construction. 

The second stage will fulfill if the price action exceeds the trendline O-B in a period less than or equal to the time that took the wave C formation.

Triangles

As we have seen in previous articles, there are two types of triangles, contracting and expanding. Unlike flat and zigzag patterns, where the first stage of validation consists of the violation of the trendline O-B, in the case of triangles, the trendline B-D violation is the one considered.

Contracting triangles are the easiest to validate after the violation of the trendline B-D. However, this does not happen in the same way in expanding triangles. 

In expanding triangles, validation comes determined through the “no confirmation.” That is, once the wave E finishes, the price action should not reverse the advance of wave E completely. 

Therefore, this retracement would discard out any possible violation of the guideline B-D, or it would take longer to reverse the advance of the wave E than the duration of the wave E.

Validation of a Contracting Triangle

As mentioned above, in the case of triangles, the guideline B-D is used instead of the line O-B. The first stage of validation of the contracting triangle pattern will occur if the price exceeds the line B-D for a period less than or equal to the time it took to construct the wave E.

The second stage is defined by the thrust that occurs after the wave E in a triangle, which should exceed the highest (or lowest) price achieved by the triangle. In turn, the thrust should finish within a time range that not exceeding 50% of the duration of the triangle.

Conclusions

In this educational article, we have seen that the criteria for validation of corrective waves differ from impulsive waves in terms of the conditions to consider for a valid pattern. 

Also, we reviewed the importance of validating each structure under analysis. That will help the wave analyst to verify if the pattern identified is correct or not. 

This knowledge will allow the analyst to facilitate the realization of forecasts on the potential next movement of the market.

In the next educational article, we will review some key concepts for the process of analyzing waves such as wave compaction, degrees, and introduce the concept of complexity in the wave analysis.

Suggested Readings

  • Neely, G.; Mastering Elliott Wave: Presenting the Neely Method; Windsor Books; 2nd Edition (1990).
Categories
Forex Elliott Wave

Validation Rules on Impulsive Waves – Intermediate Level

Introduction

In our previous articles, we have seen that impulsive waves have construction rules. However, some rules, or principles, allow the wave analyst to validate or confirm each guideline. These rules are divided into two groups, which we will detail in this educational article. 

First Rule – Validation of the Trend Line 2-4

This rule will apply once the impulsive pattern ends. The wave analyst must trace the trendline joining the end of waves 2 and 4. Then, the impulsive wave will be confirmed if the price action pierces the trendline 2-4 in the same or less proportion of time it took to form wave 5.

In case the fifth wave takes longer, the price develops a terminal structure or wave 4 that has not still ended, another possibility is the wave analyzed does not correspond to an impulsive formation, but to a corrective wave.

Second Rule – Retracement from the fifth wave

Within an impulsive wave, the wave analyst must recognize which the extended segment is. Depending on this factor, it will be possible to determine the level at which the price could fall, determined by the wave 2 and 4 price range within the momentum structure.

First Wave Extension

In this case, the retracement should go to the end of wave 4. However, if the price extends its retracement beyond the end of wave 4, then the impulsive wave will end up with a larger correction in terms of price and time.

Third Wave Extension

The price has to return to the fourth wave area of ​​the impulsive pattern and will generally finish near the end of that wave. If the retracement comprises more than 61.8% of the complete motive sequence, then the third wave would involve a higher degree impulse wave completion.

Fifth Wave Extension

When the extension appears in the fifth wave, the price should reverse at least 61.8% of that wave, although it might not retrace the complete wave. If the price retraces the complete progression of the fifth wave, then the retracement would complete a higher degree pattern.

In this case, the following could happen:

  1. The fifth wave extension pattern is part of a higher degree impulse, which is also a fifth wave extension, or
  2. The extension of the fifth wave is a wave C of a flat pattern or a zigzag.

Fifth Wave Failure

A fifth wave failure occurs when wave 5 of an impulsive sequence is shorter than wave 4 high. It generally occurs when the opposing trend is stronger than the initial impulsive movement trend. Consequently, if the wave analyst detects this type of failure, it should notice that the movement following the fifth wave is highly likely to reverse the forward movement of the impulsive movement completely.

On the other hand, if the motive movement was bullish, there should not be further highs until the price has fully retraced the impulsive bullish sequence. This affirmation is analogous if the impulse is bearish.

Conclusions

In this educational article, we have seen how to validate an impulsive sequence in terms of its correction. Also, we commented on the potential of the next path, respecting the fifth wave retracement and what is the extended wave in the impulsive sequence.

Likewise, we have seen the case of the failure in a fifth impulsive wave and what will be the impact in the next movement.

In the next educational article, we will see the process of validation of corrective structures.

Suggested Readings

  • Neely, G.; Mastering Elliott Wave: Presenting the Neely Method; Windsor Books; 2nd Edition (1990).


Categories
Forex Elliott Wave

Analyzing the Triangle Pattern – Intermediate Level Part 3

In the previous article, we expanded the ideas of the triangle pattern; in particular, we talked about the contracting triangle and its variations. In this last part dedicated to the triangle pattern, we will review the non-limiting triangle.

Non-Limiting Triangle

Non-limiting triangles do not differ much from limiting triangles. Both types of triangles must meet the minimum construction requirements. However, they will have the following characteristics:

– Channeling. In the case of the non-limiting triangle, the trend lines are not convergent but divergent.

1. Congestion occurs just at or near the apex of the convergence lines.

The wave analyst should note that the term “just or near the apex” refers to the end of wave E being close to the intersection of both trend lines and the extent of wave E to be measured in terms of the time spent in the triangle formation.

b. The triangle pattern is considered Non-Limiting if the measurement of time elapsed from its beginning until the end of wave E, and the apex occurs after 40% of the interval has passed.

c. There must be a post-thrust correction that must return to the apex area.

If the triangle met any of these three conditions, then the triangle will be said to be of the non-limiting type.

Post-Triangular Thrust

The distance of the thrust outside the limits of the non-limiting triangle does not have a specific restriction. However, it can reach the length equivalent to the longest segment of the triangle. 

Likewise, once reached this extension, there is a possibility that the price will continue in the original direction of the thrust.

Expanding Triangles

Expanding triangles are very frequent in complex corrections. It is characterized because as it progresses in its formation, each segment, or the majority, is larger than the previous one.

The rules that characterize the expanding triangles are described below:

  1. Wave A or Wave B will always be the smallest wave in the triangle.
  2. In most cases, the E wave will be the longest.
  3. Expanding triangles cannot be part of wave B of a zigzag pattern. Nor can they be part of an intermediate wave, that is, waves B, C, or D of a triangle of higher degree.
  4. In most cases, the E wave will be the longest and most complex segment of the triangle. This wave can be formed by a zigzag or by a complex correction.
  5. Generally, wave E will pierce the trend line joining the ends of waves A and C.
  6. Line B-D should act similarly to contracting triangles.
  7. The extension of the thrust of the expanding triangle must be less than the longest wavelength of the triangle.
  8. When comparing the length from wave E to wave A, it must be verified that each previous wave must be greater than or equal to 50% of the next wave.

The following figure shows the three most common types of expanding triangles, of which the irregular is the most likely to appear in the real market.


In expanding triangles also exists limiting and non-limiting triangles. However, in this type of formations, there is no post-triangular variation between one and the other. The difference lies in the wave position that the triangle holds, which can be “standard” or be part of a complex correction.

Limiting Expanding Triangle

The term “limiting” refers to whether the triangle is a fourth wave or a B wave. Its main characteristics are described below.

1. An expansive limiting triangle usually appears in wave B, particularly in irregular failures or in flat wave formations with failure in wave C.

2. The thrust outside the triangle is a minimum of approximately 61.8% of the structure, measured from its highest to the lowest level.

Horizontal Expanding Triangle

This variation rarely appears in the real market. However, this does not mean that there is no possibility of it showing up in real markets.

The main characteristics of a horizontal triangle are:

1. Wave A must be the smallest of the formation.

2. Waves B, C, D, and E y must each exceed the final point of the previous wave.

3. There is a possibility that wave E will exceed the guideline of waves A-C.

Irregular Expanding Triangle

This variation is more common, and its characteristics are as follows:

1. Wave B is smaller than Wave A, while the rest of the waves maintain their increasing characteristics.

2. The longer the duration of the pattern, the higher the chance that the guideline will tilt up or down.

Continuous Expanding Triangle

This expanding triangle has a bias due, on the one hand, because wave B is longer than wave A, and on the other hand, because wave C is the shortest. The E wave, meanwhile, can be more volatile or “violent” than the rest of the waves.

Non-Limiting Expanding Triangle

These types of triangles tend to appear in complex corrective formations, for example, in the first or last stage of a complex sequence. In this sense, in a complex corrective structure, the thrust will generate a wave X.

Finally, concerning the apex, it is located before wave A and must be produced before it reaches 20% of the construction time of wave A.

Conclusions

With this article, we have ended the standard corrective patterns defined by the Elliott wave theory. As we have seen in previous examples, expansive triangles also usually appear on waves 4 and B. However, this does not mean that they cannot appear on wave 2.

In the next educational article, we will see the process of validating impulsive structures.

Suggested Readings

  • Neely, G.; Mastering Elliott Wave: Presenting the Neely Method; Windsor Books; 2nd Edition (1990).


Categories
Forex Elliott Wave

Analyzing the Triangle Pattern – Intermediate Level Part 2

In our previous article, we saw that the triangle pattern is the most common of the three standard formations defined by R.N. Elliott. In this educational post, we will review the different types of variations of this corrective structure.

Contractive Triangle

Within the group of triangles, this formation is the most common of all. The minimum requirements of this structure are:

1. Once the contractive triangle is completed, the price must make a “thrust” that should be greater than or equal to 75% of the largest internal segment. On the other hand, this movement should not exceed 125% of the most extended triangle segment.

The following figure shows two cases. In the first, we see that wave A is the most extended segment of the contracting triangle after wave E is completed. The thrust can reach between 75% and 125% of wave A.

In the second case, we observe that wave B is the most extensive of the contracting triangle. Analogously to the previous case, we distinguish that the thrust made by the price should not be less than 75% nor greater than 125 of wave B.

2. In this type of triangle, the thrust must further exceed the highest (or lowest) end it reached during structure formation.

In other words, when the contracting triangle is about to be completed, two parallel lines should be drawn over the most extended segment, depending on which side the thrust is on, the price should touch the top or bottom line.

3. The E wave must be the smallest of all the segments of the triangle in terms of price.

As we observe in the following figure, the internal segment corresponding to wave E must be the smallest of all in terms of price, but not the time it takes for this movement to complete.

Limiting triangle

R.N. Elliott defined the limiting triangle as a formation that occurs in the waves fourth and B. Its name is because its completion must occur under specific conditions,

The completion of the limiting triangle in wave E must happen in the range of 20% to 40% before the apex point of the triangle.

Horizontal Limiting Triangle

1. The trendlines of the triangle must move in opposite directions.

In other words, when drawing the ends of the triangle corresponding to the end of waves A-C and B-D, the trendlines must correspond to a contracting triangle respecting the basic structure defined by Elliott.

2. The apex of the triangle must be within a range whose amplitude is 61.8% of the most extended segment of the triangle and whose center is the midpoint of that segment.

In the case of the previous figure, the most extended wave is wave B. However, this is analogous for the situation in which wave A or wave C is the longest in the triangle.

3. Wave D must be smaller than the internal leg corresponding to wave C. Likewise, the segment corresponding to wave E must be shorter than wave D.


Irregular Limiting Triangle

This type of triangle must perform a higher thrust and with greater speed than in the case of the horizontal triangle. The distinctive element of this formation is wave B, which must be longer than wave A. In general, its main characteristics are as follows.

  1. Wave B should not be higher than 261.8% of Wave A. Under normal conditions, it should be less than 161.8% of Wave A.
  2. Waves C, D, and E must be smaller than the previous wave.
  3. The trend lines of the triangle must have opposite directions.

Running Limiting Triangle

This type of wave can be confused with the Double Three corrective structure. Its main characteristics are:

  1. Wave B is longer than Wave A. It is also the largest segment of the triangle.
  2. Wave C is smaller than Wave B.
  3. Wave D is shorter than Wave C.
  4. Wave E is shorter than Wave D and is the smallest of the triangle.
  5. The thrust after the completion of wave E can become more extensive than wave B and even reach 261.8% of wave B.

Conclusions

In this educational article, we have examined the different variations of triangles and expanded their contracting variants. We must emphasize that its importance lies in the fact that this type of formations, in particular, the contracting triangle, is the most common of all triangular patterns. The knowledge of how triangles behave can provide the wave analyst with an advantage that would allow him to more accurately predict what the next market move would likely be.

In the next article, we will see the last part of the corrective formations. In particular, we will review the non-limiting triangles and their main characteristics.

Suggested Readings

– Neely, G.; Mastering Elliott Wave: Presenting the Neely Method; Windsor Books; 2nd Edition (1990).

Categories
Forex Elliott Wave

Analyzing the Triangle Pattern – Intermediate Level – Part 1

The triangle is a corrective pattern that has five internal segments. In this educational article, we will review how to analyze the triangle formation.

Triangles and their Characteristics

Within the set of corrective structures defined by R.N. Elliott, triangle formations are more complex to analyze compared to flat and zigzag patterns. This complexity occurs because there is no specific time span that marks the end of this structure.

Despite the complexity of the triangles, it is the most common Elliott pattern to find in the real market. The knowledge of this formation will help wave analysts to understand the price position within the market.

Construction Rules

The construction rules defined for the triangle pattern are detailed as follow:

– Triangles have five internal waves, regardless of the complexity of the inner segments.
– A complete three-wave corrective structure builds each part that makes up the triangle.
– The triangle can have a bullish or bearish inclination. However, its internal structure should not change.
– The triangle has six reference points of the same degree, the origin of wave A, and the end of waves A, B, C, D, and E. From these six extremes, the wave analyst should only channel four points through the contraction lines. The points to consider are the end of wave A with the end of wave C and the end of wave B with the end of wave D.
– The base-line of the triangle is the line that joins the end of waves B and D, and its function is similar to the guideline that joins waves 2 and 4 in an impulsive wave.

The following figure represents the construction model of the triangle pattern.

As can be noted, the triangle pattern tends to appear in a fourth wave or a wave B, in some exceptional cases, this pattern could appear in a second wave.

GBPUSD Consolidates in a Triangle Sequence

The next figure illustrates the GBPUSD pair in its 4-hour timeframe. In the chart, we observe that the Cable rallied since September 03rd when the price found its bottom at level 1.19589.

Once the GBPUSD pair moved in three waves identified in green, the fourth wave consolidated sideways, developing an expanding triangle.

The triangle pattern reveals the alternation principle in terms of time and price.

The GBPUSD pair alternated in terms of time being the triangle pattern more extended in comparison with the second wave. In the same way, the retracement developed by the second wave is sharp compared with the narrow correction realized by the fourth wave.

JP Morgan Consolidated in a Triangle Pattern

The chart below shows JP Morgan Chase & Co (JPM) in its log-scale 2-day timeframe. The ticker JPM developed a bullish impulsive sequence subdivided in five waves from early 2016 when the price found buyers at $52.50 per share.

In the same way, the third wave that was formed corresponds to an extended wave, which makes us conclude that the first and fifth waves will not be extended, and they will be similar in terms of price, time, or both. In this case, both waves are identical in terms of time.

On the other hand, we observe that JPM consolidated developing an expanding triangle pattern with a slight bearish bias. Besides this structural bias, the internal sequence is respected by the price action.

Also, we distinguish the wide extension of the triangular sequence, which moved from late February 2018 until mid-August 2019, when JPM ended its internal wave E labeled in green.

Once JPM completed its fifth internal segment, the price action continued its previous bullish trend and soared to record highs at $141.10 per share.

Conclusions

From the cases analyzed, we can verify the Genn Neely’s affirmation that suggests that “the triangle pattern is a common formation that appears in the market.”

Also, we verified how the alternation principle works in the real market, while a corrective wave is simple, the other will be complex.

Finally, according to the examples reviewed, the triangle pattern could appear independently of the market analyzed,  as on currencies, stocks, indices, etc.

In the next article, we will review the different variations of the triangle pattern.

Suggested Reading

  • Neely, G.; Mastering Elliott Wave: Presenting the Neely Method; Windsor Books; 2nd Edition (1990).
Categories
Forex Elliott Wave

How to Analyze the Zigzag Pattern – Intermediate Level

The zigzag pattern is a three-wave structure that has a limited number of variations. In this educational post, we’ll present how to analyze the zigzag pattern under an intermediate level perspective,

The Elliott’s Zigzag Pattern

R.N. Elliott, in his work The Wave Principle, described the zigzag as a corrective formation that follows an internal sequence defined by 5-3-5.

The wave analysis analyst should consider that corrective patterns are not easy to recognize while the structure is not complete; however, it results revealing and useful to make forecasts once the formation is complete.

Zigzag Construction

Glenn Neely, in his work Mastering Elliott Wave, describes the zigzag construction as follows:

  1. Wave A shouldn’t retrace beyond 61.8% of the impulsive wave.
  2. Wave B should retrace at least 1% of wave A, but shouldn’t exceed 61.8% of wave A.
  3. Wave C must finish at least slightly beyond the end of wave A.
  4. If wave B retraces more than 61.8% of wave A, thus the movement developed doesn’t correspond to the end of wave B. In this case, the move realized correspond to a segment of a complex wave B.

The following figure illustrates the steps of the zigzag pattern construction previously described.

Types of Zigzag

According to the extension of wave C, the zigzag pattern would be classified as normal, extended, or truncated.

Normal zigzag: In this case, wave C can reach between 61.8% to 161.8% extension of wave A. Concerning wave B, this segment doesn’t retrace more than 61.8% of wave A, and wave C shouldn’t extend beyond 161.8% of wave A.

Truncated zigzag: This formation is less frequent than the other two zigzag pattern variations. Further, wave C shouldn’t be lower than 38.2% of wave A, but not greater than 61.8% of wave A. 

Once wave C ends, the next path should retrace at least 81% of the entire zigzag formation. According to Neely, this pattern it is likely that appears in a triangle structure.

Extended zigzag: This variation is characterized by having a more prolonged wave C than the other two models, which surpasses the 161.8% of wave A, being similar to an impulsive sequence. 

Once completed the wave C, the next path tends to retrace at least 61.8% of wave C.

Canalization Process

To canalize a zigzag formation, the wave analyst should pay attention to wave A and the end of wave B. 

The canalization process begins with the trace of a base-line linking the origin of wave A with the end of wave B, then using this line, a parallel line is projected at the end of wave A.

If the wave analyst encounters a zigzag pattern, then the corrective formation could move inside the channel, violate it, but never move in a tangent way to the channel. If it occurs, then the corrective sequence may correspond to a complex correction.

Finally, once the price violates the base-line O-B, we can conclude that the zigzag pattern ended.

NASDAQ e-mini and its Zigzag Pattern

The following figure represents to NASDAQ in its 12-hour timeframe. The chart reveals the upward process that the technologic index developed in the Christmas rally of 2018 at 5,820.50 pts.

The impulsive bullish sequence completed its internal five-wave moves at 7,879.50 pts on April 24th, 2019, from where the price began to develop a corrective zigzag pattern.

As illustrated in the last figure, the wave (a) in blue looks as a five-wave structure that ended at 7,290 pts on May 13th, 2019. The second leg of the zigzag pattern advanced close to 61.8% of the wave (a), which accomplishes the requirement of zigzag construction.

The next bearish path, corresponding to wave (c) produced a second decline in five waves and dropped beyond the 61.8% and below 161.8% of (a) which lead us to conclude that the type of zigzag pattern is normal.

At the same time, we observe that the price didn’t violate the lower line of the descending channel. However, once NASDAQ soared above the upper line of the descending channel, the corrective structure ended, giving way to the next upward motive wave.

Conclusion

In this educational article, we reviewed the characteristics of the zigzag pattern and how the wave analysts can differentiate from another kind of corrective formation. 

At the same time, the Fibonacci tools represent a useful way to validate what structure develops the market. In this context, this knowledge will allow the wave analyst to identify potential zones of reaction, which would enable us to incorporate into the trend.

In the next article, we will review the triangle pattern and how to recognize its variations.

Suggested Readings

  • Neely, G.; Mastering Elliott Wave: Presenting the Neely Method; Windsor Books; 2nd Edition (1990).
  • Prechter, R.; The Major Works of R. N. Elliott; New Classics Library; 2nd Edition (1990).
Categories
Forex Elliott Wave

Corrective Waves Analysis – Intermediate Level – Part 1

Corrective waves are formations produced between two impulsive movements. In this educational article, we’ll see the standard corrective patterns defined by R.N. Elliott.

The Basic Structure

R.N. Elliott, in his treatise, defined corrections as a movement that develops against the trend built by motive waves.

Corrective formations characterize themselves by having three internal segments. Its analysis process tends to be more difficult than on motive waves, due to different variations that can arise while the movement is in progress.

However, the corrective structure will be clear once the formation completes its internal sequence. In this context, the wave analyst has to be patient as the price action advances.

Rules Construction

In simple words, if price action doesn’t endorse the rules of an impulsive wave, as commented in our previous articles (read more), then the market advances in a corrective structure.

The basic, or standard, corrective patterns defined by Elliott are as follows:

  • Flat (3-3-5)
  • Zigzag (5-3-5)
  • Triangle (3-3-3-3-3)

Similarly as the alternations on impulsive waves, corrective waves also alternate in terms of price and time.

Price: This kind of alternation applies only to the zigzag pattern. Wave A will alternate with B in terms of price; wave B will be a 61.8% or lower than the wave A length.

Time: The alternation in terms of time acquires more relevance. In particular, if the first segment elapses a specific length of time, the second leg will advance in a related 61.8% or 161.8% of the time spent by wave A.

Finally, the third segment will last similar to one of the previous sections or be 61.8 or 161.8% span of one of the two earlier waves.

Flat Pattern

The flat pattern is characterized by having an internal subdivision that follows a 3-3-5 sequence. The next figure shows its structure.

Likely, its most important characteristic is that among the standard corrective formations, this pattern has the broadest kind of variations.

The construction process and its basic rules are as follows:

Once price completes its first movement against the trend, and its form holds an internal three-segment subdivision, the recovery developed by the next sequence has to be, also formed by three internal waves that advance at least 61.8% of the first decline.
Finally, the price progression of the C wave must be over 38.2% greater than wave A.

The flat pattern has several variations defined in terms of the strength of its wave B, wave C, or both.

To understand what type of flat formation and its depth the market is developing, we should trace two parallel horizontal lines from the A wave extremes. Thus, based on the obtained evidence, we can conclude that:

  1. If wave B moves between 61.8% and 81%, the flat pattern develops a weak wave B. In this case, the wave C should be at least 61.8% of wave B.
  2. If wave B moves between 81% and 100%, then the flat pattern advances in a normal wave B. In this scenario, there are two options for wave C, the failure, and the extended wave C.
  3. Finally, if wave B extends over 100% to 127.2% of the A wave, then we are in the presence of a strong wave B. In this case, waves A and C should be similar in terms of price.

The U.S. Dollar Index and its Flat Pattern

The U.S. Dollar Index (DXY), in its 2-hour chart, shows the progression that price developed in five waves from June 25th, 2019 low at 95.84.

The five-wave sequence identified in green was completed on July 09th at 97.59, from where the Greenback began to retrace in three waves. The figure reveals that after having completed the first decline identified as wave “a” in green, DXY bounced slightly over 81% of wave a, which makes us conclude that the U.S. Dollar index runs in a potential normal flat pattern.

The next decline corresponds to wave c; the figure shows that once pierced slightly below the end of wave a, the price found fresh buyers at 96.67 completing the three-wave sequence of the flat pattern.

Conclusions.

In this educational article, we review the concepts of corrective waves and its rules of construction. Similarly, we presented how corrective waves alternate in terms of price and time. These new concepts of alternation add to the definitions given in our basic level article on corrective waves.

On the other hand, we presented the flat pattern that the Dollar Index has recently developed and how this formation did not achieve the Fibonacci levels as stated by Gleen Neely in his work “Mastering Elliott Wave.”

In the next article, we will present the zigzag pattern and its analysis process.

Suggested Readings

  • Neely, G.; Mastering Elliott Wave: Presenting the Neely Method; Windsor Books; 2nd Edition (1990).
  • Prechter, R.; The Major Works of R. N. Elliott; New Classics Library; 2nd Edition (1990).
Categories
Forex Elliott Wave

Intermediate Wave Analysis – Impulsive Waves – Part 3

Impulsive waves are characterized by their directionality; thus creating trends; however, how the wave analyst can recognize the stage of the trend? To answer this question, we will present the canalization process.

Canalization

Until now, we presented a set of rules that allow that wave analyst to identify which kind of structure the price action is creating. However, these rules do not provide any clue about its target area.

To aid in solving this question, R.N. Elliott, in his Treatise, introduced the use of channels to identify the potential target zone of the next path.

Channels are a useful tool to recognize if an impulsive sequence is complete, and to identify the potential ending points of waves in progress.

In motive waves, there exist two kinds of base-line of channels; these are base-line 0-2 and 2-4. The way to trace them is as exposes the following figure.

In the left-side figure, we observe the trace of the 0-2 line. The dotted line represents a preliminary 0-2 line that was violated by the price action. In this case, the wave analyst must update the base-line 0-2 until the confirmed end of wave 2.

Once the ending of the second wave and traced the base-line is validated, the wave analyst must project a line parallel to the 0-2  line at the end of wave 1, this channel will provide a potential target of the third wave.

Analogously, on the right-side figure, we distinguish the trace of base-line 2-4 and its projection at the end of wave 3. The channel projection will provide the potential end of the fifth wave.

The procedure for executing the canalization process is as described below.

Once the price has created the first impulse wave and, then, completed the second corrective wave, a base-line is projected linking the origin of the first impulse wave to the end of the second wave.

The base-line is then projected at the end of wave 1. This channel will provide the wave analyst with the potential target of wave 3.

When wave 3 is complete, the ends of wave 1 and 3 are joined, then a parallel line is projected towards the end of wave 2.

The projection of this channel will provide information about the possible end of wave 4.

Subsequently, once wave 4 is complete, the ends of waves 2 and 4 are joined, then the line parallel to the end of wave 3 is projected, this channel will provide the potential target of wave 5.

EURNZD – Channels Suggests a Five-Wave Sequence Completion

The following chart illustrates to EURNZD cross in its 4-hour timeframe. From the figure, we observe the rally developed by price action that began on January 24th, low at level 1.66642.

EURNZD made a first rally that boosted the price in five waves until 1.71764 level reached on last February 02nd. Once its first upward sequence has been completed, the price retraced in three waves.

The corrective process brought the price to find fresh buyers at 1.67854 on February 10th. The completion of waves (i) and (ii) allow us to trace the first channel in blue, from where the next path corresponds to wave (iii).

On the figure, we observe that the price extended its third upward sequence until 1.78755 level on March 02nd. Once this fresh higher high was reached, EURNZD started to consolidate in a fourth wave. The ending of this corrective structure drives us to trace the second upward channel in brown.

The upper-line breakout of the second ascending channel carried the EURNZD cross to complete its fifth wave that found resistance at 1.90725 level, reached on March 09th.

Once it peaked at 1.90725 level, the price action pierced the base-line of the second ascending channel, this movement could drive the cross to start a corrective sequence in the coming trading sessions.

Conclusions

In this article, we have seen how the use of channels can assist the wave analyst in the process of identifying impulse wave targets.

From the example exposed, we observed how the canalization process worked in the real market. It is essential to consider that the fifth wave can fail, and not surpass the upper-line of the ascending channel.

In this context, the wave analyst should consider the signals that can reflect the end of the five-wave sequence, for example, the base-line breakdown.

Suggested Readings

  • Neely, G.; Mastering Elliott Wave: Presenting the Neely Method; Windsor Books; 2nd Edition (1990).
  • Prechter, R.; The Major Works of R. N. Elliott; New Classics Library; 2nd Edition (1990).
Categories
Forex Elliott Wave

Intermediate Wave Analysis – Motive Waves – Part 2

In our previous article, we covered the main rules of impulsive waves. In this educational post, we’ll present a complimentary set of rules of the impulsive waves.

The Alternation Rule

The alternation rule, as defined by R.N. Elliott, is not an author’s invention, alternation exists from the beginning of the universe, and this is a principle that governs nature. In the same way that the day alternates with the night, bullish market alternates with the bearish.

This rule is the foundation of wave theory; without the alternation, the wave theory would not exist. This rule states, “when two consecutive waves are compared, one must be different from the other and both must also be unique in form.

The essential element that distinguishes the alternation in the wave analysis is time. In other words, this means that if a movement on one wave occurs a reduced time span, the next move should take place in an extensive period compared with the previous move.

In wave theory, we observe the alternation in the following characteristics:

  1. Price: it is the vertical distance that the market advances.
  2. Time: it is the horizontal distance elapsed in the market progress.
  3. Severity: this corresponds to the percentage that price retraces an impulsive movement.
  4. Complexity: corresponds to the number of segments that conforms to the wave sequence.
  5. Construction: corresponds to the type of formation that market develops, for example, flat, zigzag, triangle, etc.

The Equality Rule

  1. The extension rule says that in an impulsive sequence, one of three motive waves must be the most extended. When the wave analyst has identified the extended wave, then, can apply the equality rule that refers to the other two waves that are as follows:1. If wave 1 is extended, then the rule applies to waves 3 and 5.
  2. If wave 3 is extended, then the rule applies to waves 1 and 5.
  3. If wave 5 is extended, then the rule applies to waves 1 and 3.

The equality rule establishes that two of non-extended waves tends to be equal in terms of price, time, or both.

This rule is useful, especially when the third wave is the extended wave, and the fifth fails. However, it is not helpful when the first wave is extended or is a terminal formation.

Superposition Rule

The superposition principle can be used in two different ways depending on the kind of impulsive structure; it means if the motive wave corresponds to a trend movement or a terminal sequence.

If the price action develops a trend movement, then waves two and four will never overlap. In terms of its internal sequence, the motive wave will have a 5-3-5-3-5 sequence.

If the price action follows a terminal move, then wave four will penetrate the second wave area partially. The internal subdivision of this find of waves will follow a 3-3-3-3-3 sequence.

GBPUSD Pair Follows the Elliott Wave Principle

The GBPUSD pair in its 12-hour chart illustrates the Elliott wave principle in the real market.

In the figure, we observe how the GBPUSD pair follows the Elliott wave principle. Firstly, the motive wave has five internal segments that create an upward trend; the third wave is not the shortest, and as shown in the chart, the third move corresponds to the extended wave.

Once finished the five-wave sequence, it starts a corrective move in the opposite direction of the trend following a three-wave structure, which still seems in progress.

Following the alternation rule, we observe that the first wave advanced 625 pips in 17 days, while the third jumped 817 pips in 11 days. Finally, the fifth wave ran 691 pips in 16 days. These measurements enable us to observe that the GBPUSD comply with the extension, equality, and superposition rules.

At the same time, we observe that corrective waves also alternates between themselves. The second wave retraced the movement formed by the first wave in 16 days, while the fourth wave retraced the advances of the third wave during 36 days.

Conclusion

In this article, we extended the toolbox for the wave analysis process, from where rules as the alternation, equality, and superposition, add to the seven basic rules and extension defined in our previous educational post.

In our next educational post, we will present the canalization process, which will allow the wave analyst to understand the price action from the Elliott wave perspective.

Suggested Readings

  • Neely, G.; Mastering Elliott Wave: Presenting the Neely Method; Windsor Books; 2nd Edition (1990).
  • Prechter, R.; The Major Works of R. N. Elliott; New Classics Library; 2nd Edition (1990).
Categories
Forex Basic Strategies Forex Daily Topic Forex Price Action

Support, Resistance and Trade Management

-Support and Resistance are the two most important concepts in the financial market. Forex traders strongly rely on support and resistance, as well. Price action traders’ main weapon is support and resistance. In today’s article, we are going to demonstrate an example of how the price reacts to a major level of support and resistance. Let us get started.

Look at the chart. The price consolidates around the red-marked level, it finds its resistance there and makes a bearish move. After having a correction, it makes the new lowest low. This is now the sellers’ territory. Let us assume that there is no significant level, which may hold the price as support. Thus, we are not able to mark any level as support. The sellers are to wait for the price to consolidate and produce a bearish reversal candle to offer them short entry in this chart.

The price makes new lowest lows and heads towards the South with good bearish momentum. However, it seems that it may have found its support. It consolidates for a while around the red-marked level and produces a bullish engulfing candle. The buyers on the minor chart may get them engaged to keep an eye on the chart to go long above the highest high of the last candle. Let us find out what happens next.

The price heads towards the North. It consolidates and produces another bullish engulfing candle. It means the chart is now the buyers’ territory. This is where the game of support and resistance begins. You may have noticed that we have red-marked the level. This is the most significant level in this chart for the buyers. The price may consolidate and find its resistance in this chart before it reaches the red-marked level. However, this is where traders may make a decision concerning their long position. They may either close their whole trade or take partial profit.

The price keeps heading towards the North. It buyers are having a party here. They must not forget the red-marked level, though. Let us proceed to the next chart.

Look at the chart carefully. Do you notice that the price consolidates around the red-marked level, which is the swing high in this chart? It produces a bearish engulfing candle followed by another bearish one. The last candle on this chart comes out as a bullish inside bar. If the next candle comes out as a bearish engulfing candle, the sellers may drive the price towards the South. I am sure now you know where the sellers are to be careful with their trade management. Yes, they must take the red-marked support (swing low in this chart) into account to manage their short entries.

Categories
Forex Elliott Wave

Intermediate Wave Analysis – Motive Waves – Part 1

In our previous article, we presented the different standard Elliott wave formations, among which we highlight the impulsive sequence. In this educational post, we will look at the rules and principles to identify impulsive waves.

Understanding the Impulsive Waves

Impulsive waves are characterized by developing in a definite direction; this is which distinguishes a motive wave with a corrective sequence. The characteristics that must possess an impulsive structure are as follow.

  1. It must be built by five consecutive segments that follow a structure of a trend sequence or a terminal formation.
  2. Three of its five internal segments correspond to impulses in the same direction, which could be bullish or bearish. The other two moves will reverse one of the three impulsive segments moving in the main trend.
  3. Once the first impulsive movement ended, the price action must develop a smaller move in the opposite direction.
  4. The third segment moves in the same direction as the first impulsive movement. This movement cannot be of less magnitude than the first move.
  5. At the end of the third movement, the price develops a fourth segment, which pulls back the move of the third leg. This movement must never penetrate the region of the first impulsive movement.
  6. The fifth and last move is characterized by being longer than the fourth movement.
  7. When measuring and comparing the extension of waves first, third, and fifth, it can be observed that not necessarily the third wave will be the largest move; however, this segment cannot be the shortest of the three impulsive movements.

If the price action does not accomplish one of these rules, the market is not moving in an impulsive sequence. Rather, it advances in a corrective structure.

The Extension Concept

The extension is the main characteristic of motive waves, and it is used to describe the largest move of an impulsive sequence.

The basic rule to classify and identify a wave as an extension states that the largest wave must surpass the next largest move, at least by 161.8%.

The Use of Labels to Identify Sequences

Until now, we have used Intermediate Wave Analysis – Motive Waves – Part 1 labels them as W1, W2, and so on, to identify each segment. From now, we will use tags as 1, 2, 3, 4, and 5, to identify each movement.

Labels are a useful tool to aid the wave analysis process. The wave analyst should consider that, in R.N. Elliott’s words, the labels are not the end of the wave analysis, it is only a tool to maintain order in the analysis process.

It should be noted that according to the labeling process described by R.N. Elliott, we will use variations to differentiate degrees, which corresponds to the timeframe that belongs to each Elliott wave structure.

Example

To comprehend the structure of an impulsive wave and the extension concept, in the following chart, we observe the GBPUSD pair in its 12-hour timeframe.

The figure shows the impulsive advance developed by the Cable when the price found buyers at 1.1958 on September 02nd, 2019. The first motive wave, identified as “1” in green, resulted in a GBPUSD advancement of 624.1 pips, rising to 1.2582.

The third wave advanced over 814 pips or 6.68%. On the chart, we observe that wave 3 in green surpasses the 161.8% of the first wave. In the same way, the fifth wave gained 691.1 pips or 5.39%, which is similar to the first wave.

Concerning corrective waves 2 and 4, we observe that the second wave is shorter than the first move, and the fourth wave does not penetrate into the first wave region, which accomplishes the rules of construction of impulsive waves.

Furthermore, we observe that the third wave advanced beyond 161.8% of wave 1; similarly, the progression of the fifth wave is slightly lower than 161.8% of the third wave.

In consequence, GBPUSD shows the progress of a bullish five-wave impulsive sequence, with Cable having developed an extended wave in the third movement of the bullish cycle. Finally, once the fifth wave reached its end and the end of the bullish cycle, a three-wave movement in the opposite direction of the previous upward sequence will occur.

Conclusion

The impulsive movement is a structure that creates trends, which follows a five-wave sequence. The knowledge of its structure allows the wave analyst to understand the degree of the advancement of the prices and, in consequence, the potential next movement of the market under study.

In the next educational article, we will unfold additional concepts to understand the nature and rules of impulsive waves.

Suggested Readings

  • Neely, G.; Mastering Elliott Wave: Presenting the Neely Method; Windsor Books; 2nd Edition (1990).
  • Prechter, R.; The Major Works of R. N. Elliott; New Classics Library; 2nd Edition (1990).
Categories
Forex Daily Topic Forex Price Action

A Business of Glorious Uncertainty

Trading on the daily-H4 chart combination often brings more reward than our initial expectation. Typically, traders aim to earn 1R. However, it may even bring up to 5R. In today’s lesson, we are going to show an example of this.

This is a daily chart. The price heads down with good bearish momentum. The last candle is a spinning top. In a strong bearish daily trend, a spinning top does not suggest that the trend may change. However, the H4-daily traders’ strategy is different. They are to flip over to the H4 chart and wait for consolidation followed by a bullish breakout, to go long on the pair. Let us flip over to the H4 chart.

The H4 chart looks good. The chart produces two bearish candles consecutively. The buyers are to wait for a bullish engulfing candle closing above consolidation resistance to go long. The chart suggests that the buyers shall stick with the chart.

It consolidates more and produces a bullish engulfing candle. However, the candle closes within consolidation resistance. They are to wait for more. Look at the last candle. It seems like it is going to have a deep consolidation again.

This time the chart produces a bullish engulfing candle closing well above consolidation resistance. The buyers could trigger a long entry right after the candle closes and set the stop loss below the signal candle’s lowest low.

The trade does not go as per buyers’ expectations. It takes time to hit the target. However, the candle breaches through the take-profit level, closing as a strong bullish candle. The buyers may consider taking a partial profit and let the rest of the trade run. Let us find out what happens next.

This time the price heads towards the North with extreme bullish pressure. It travels about five times the distance of the buyers’ initial target. Assume, by taking partial profit, how much more a trader can earn. This is the beauty of trading on the daily-H4 combination. Since the daily chart is involved here, the price often heads towards daily support/resistance. This brings traders more profit if they deal with their trade accordingly. Another interesting point here to be noticed, despite producing an excellent bullish engulfing candle, the price does not head towards the North with good bullish momentum. On the other hand, once it hits the target level by producing another bullish Marubozu candle, it keeps going towards the North with extreme bullish momentum. This is why trading may be called a business of glorious uncertainty.