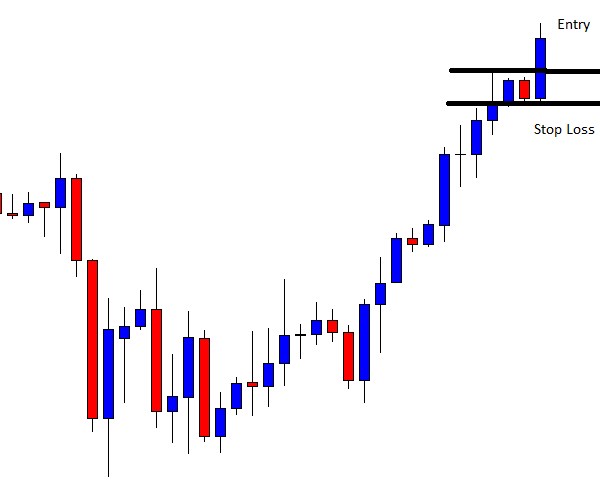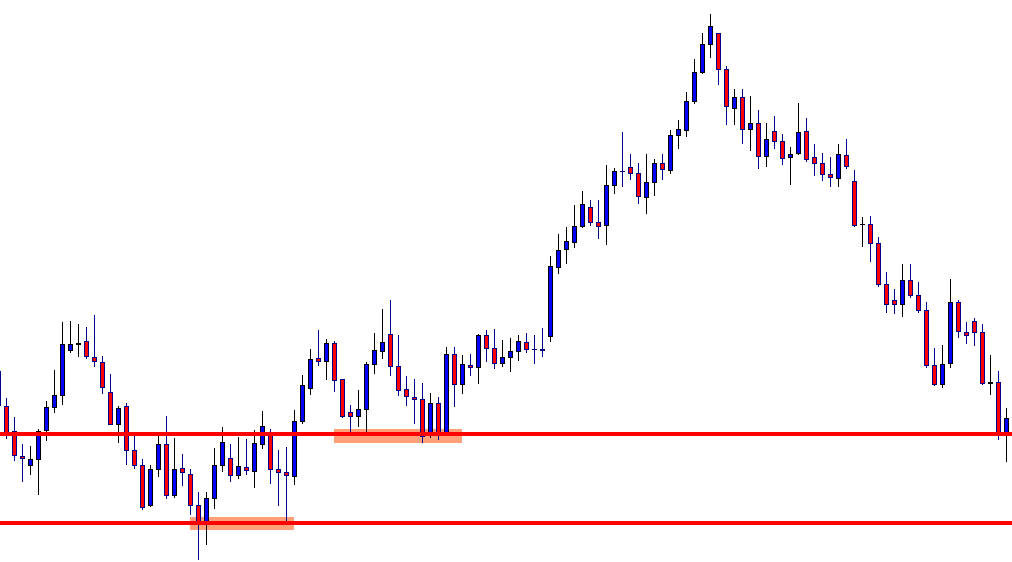
In today’s lesson, we are going to demonstrate an example where the chart produces a reversal candle at a Fibonacci level, but the price does not head towards the trend’s direction. It then makes a deeper correction. It finds its new resistance and heads towards the trend’s direction with good momentum. Let us now have a look.
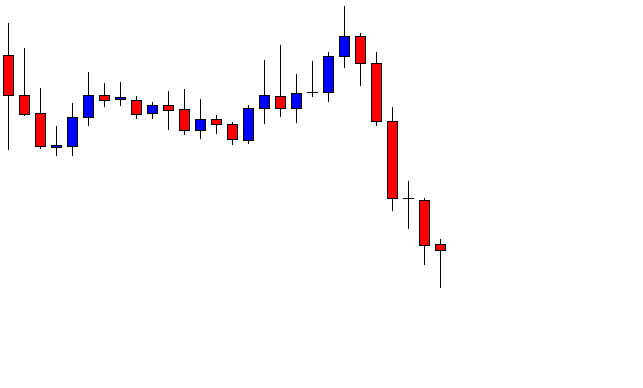
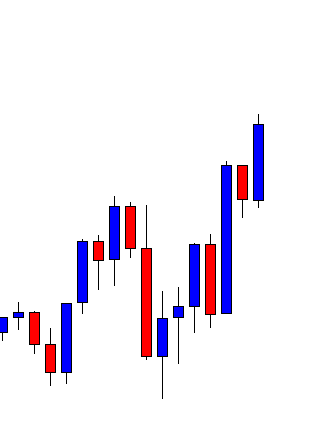
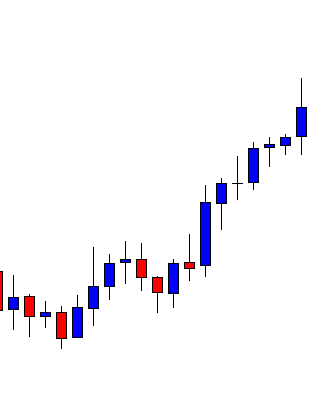
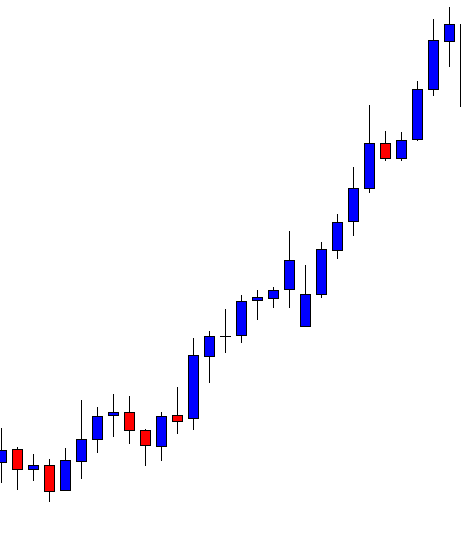
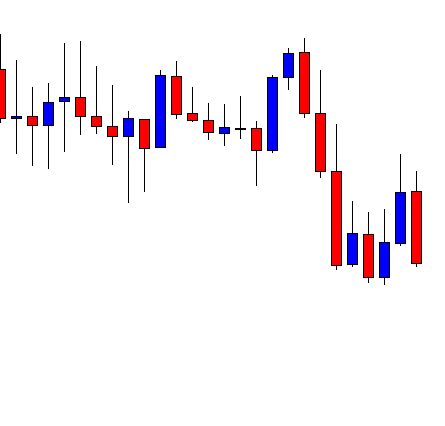
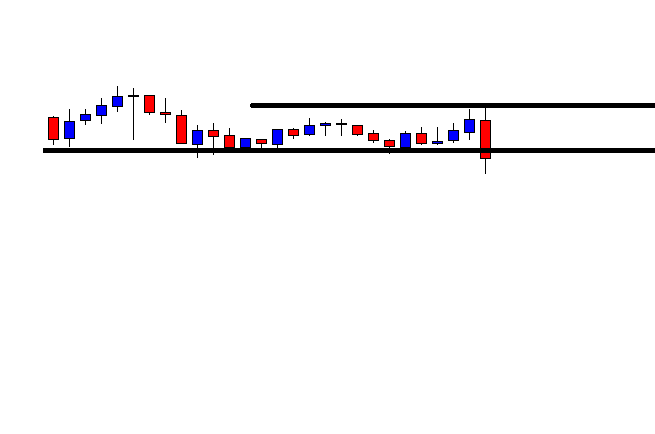
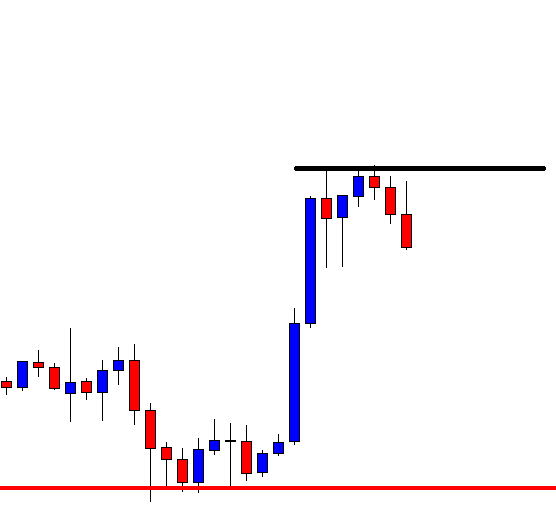
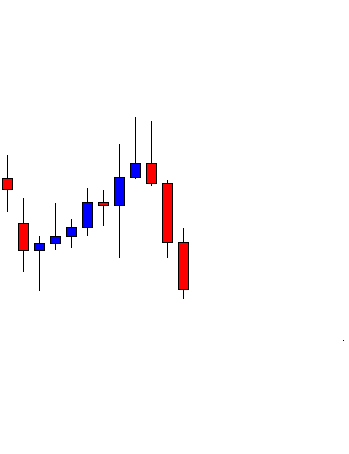
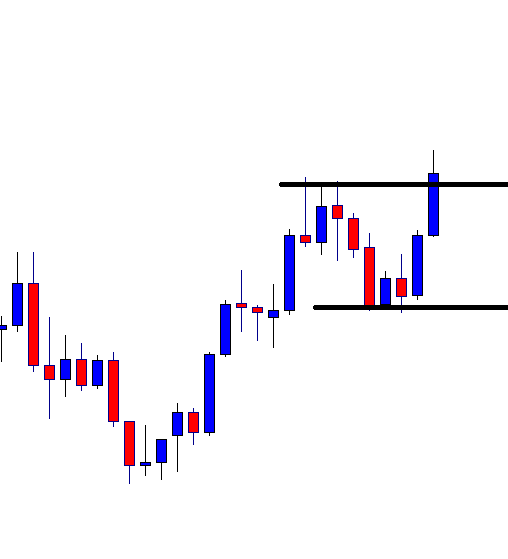
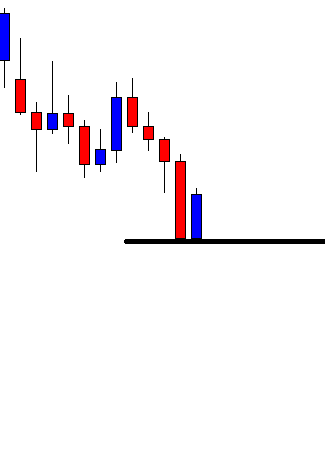
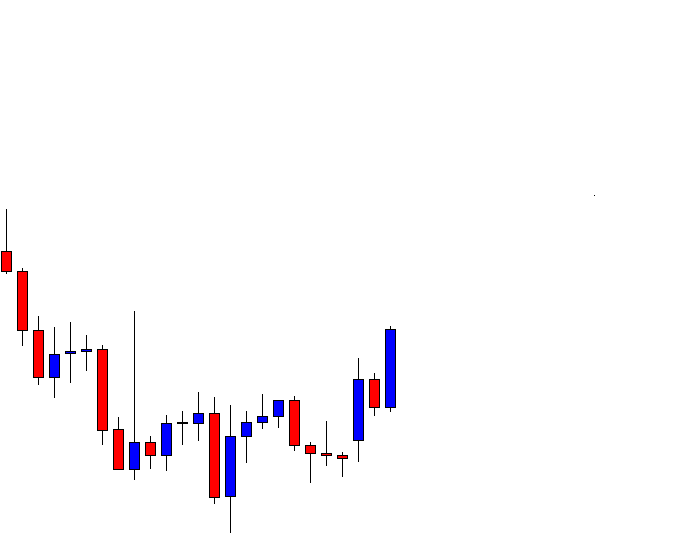
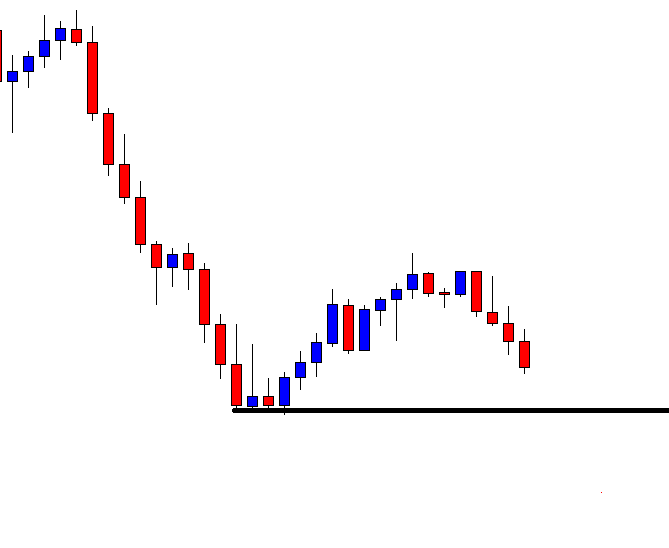
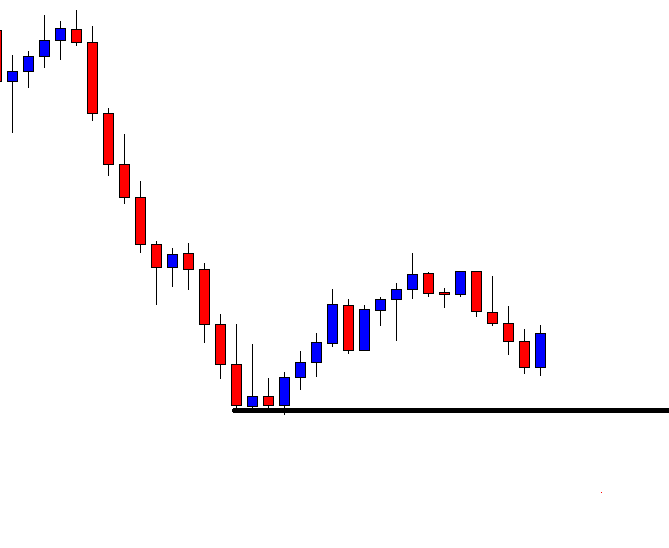
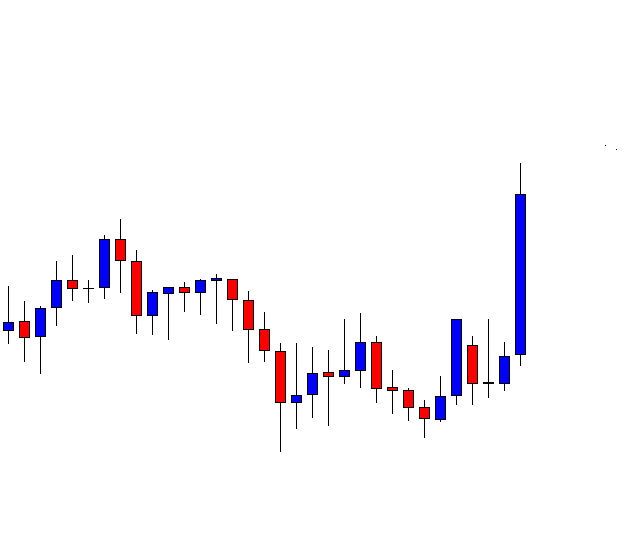
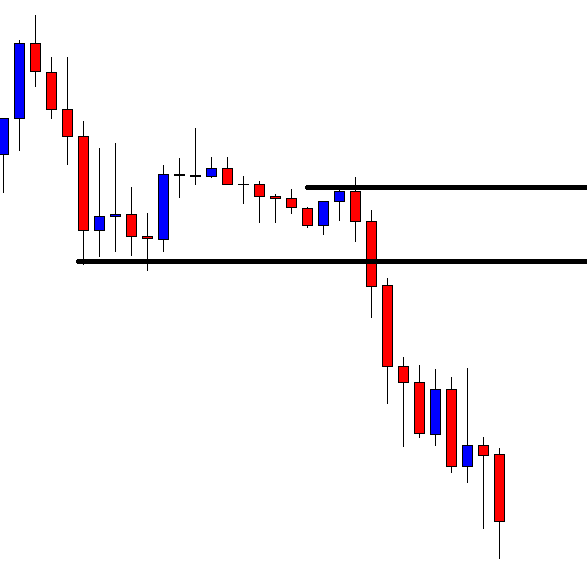
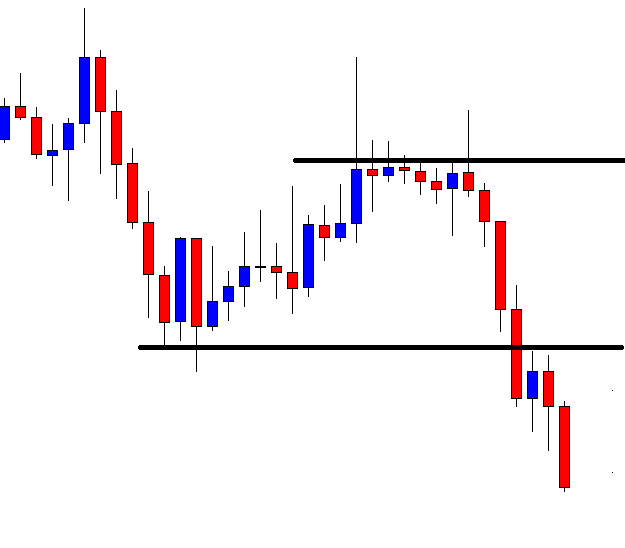
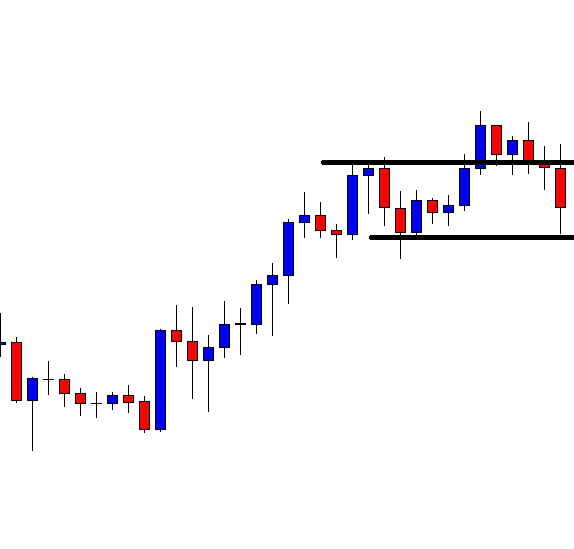
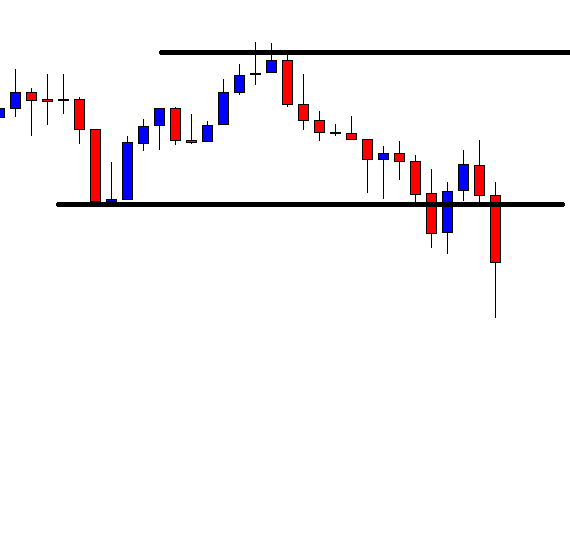
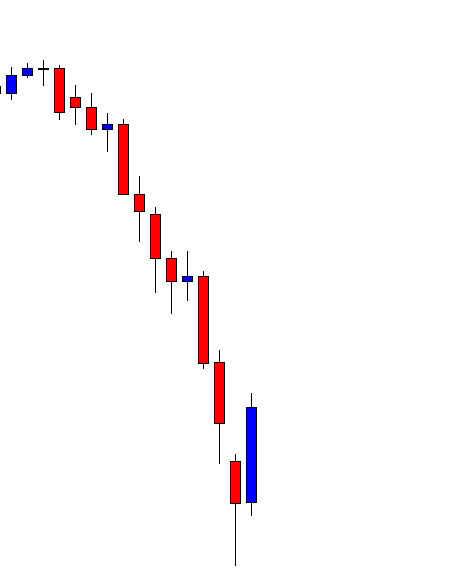
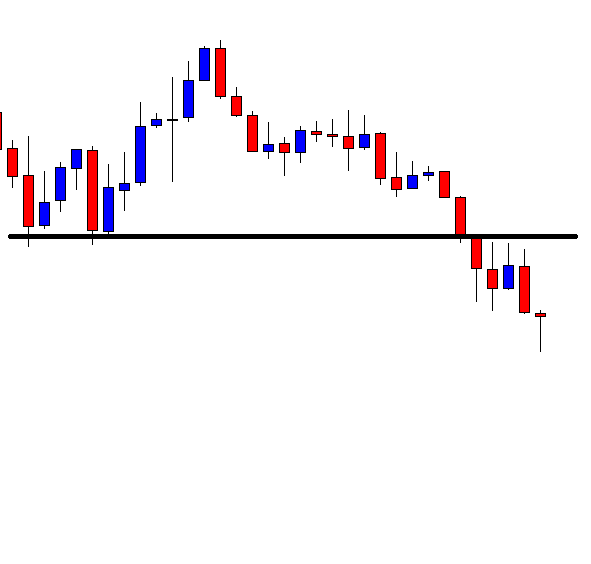
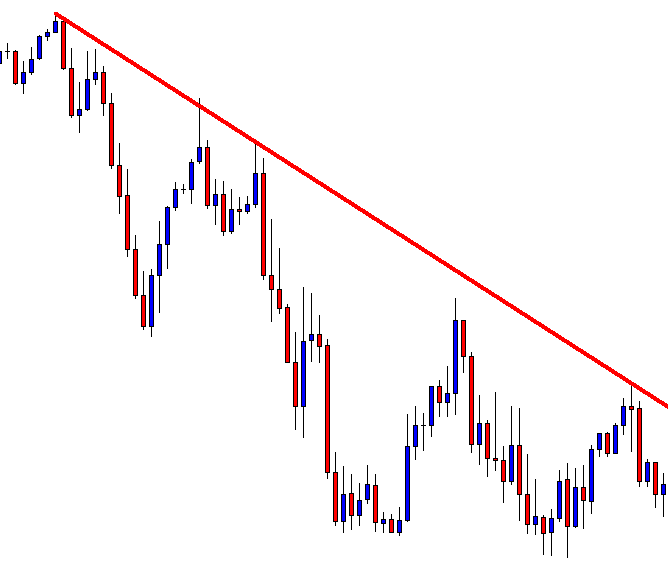
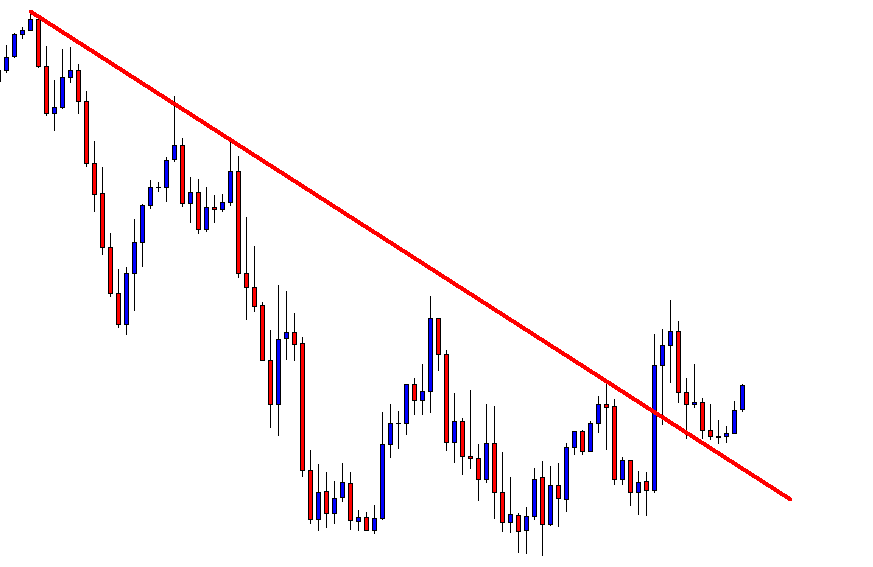
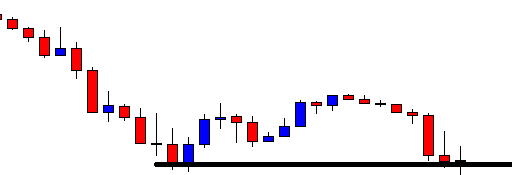
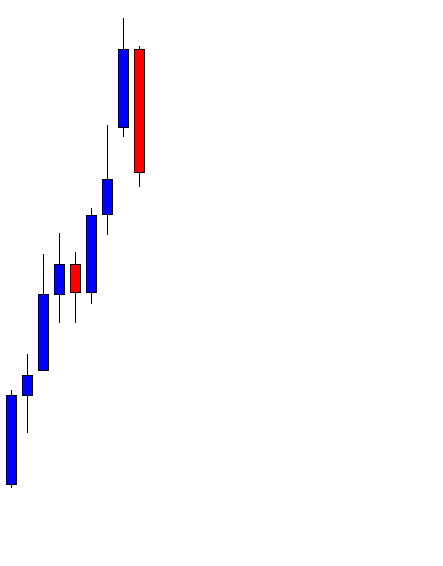
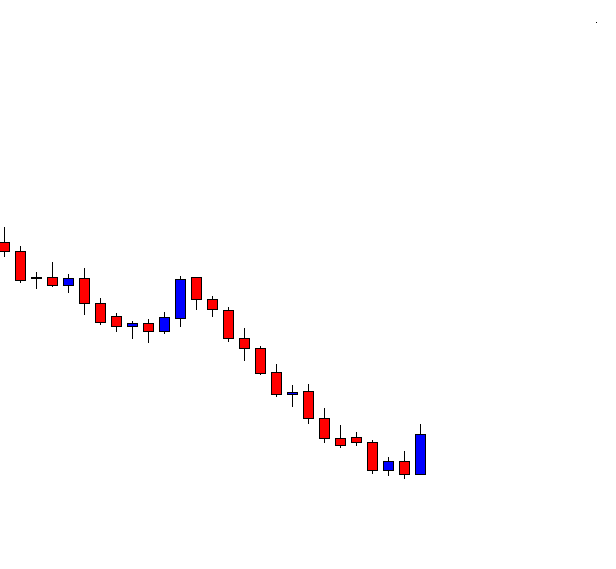
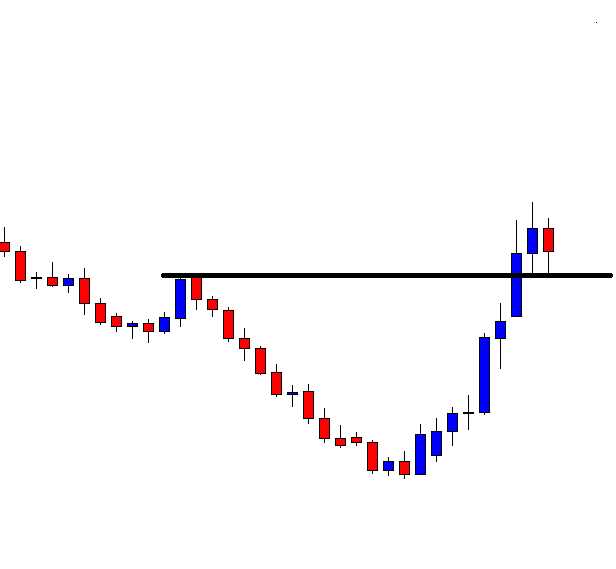
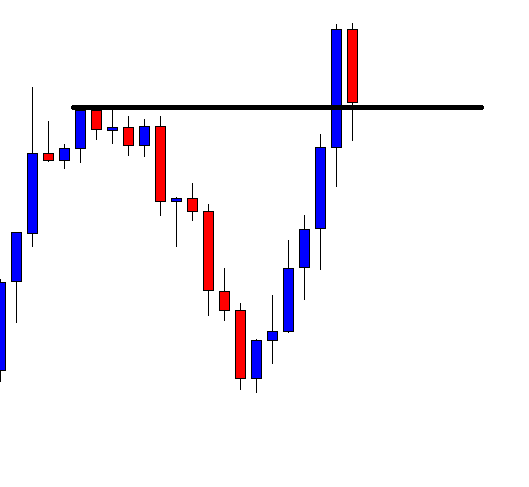
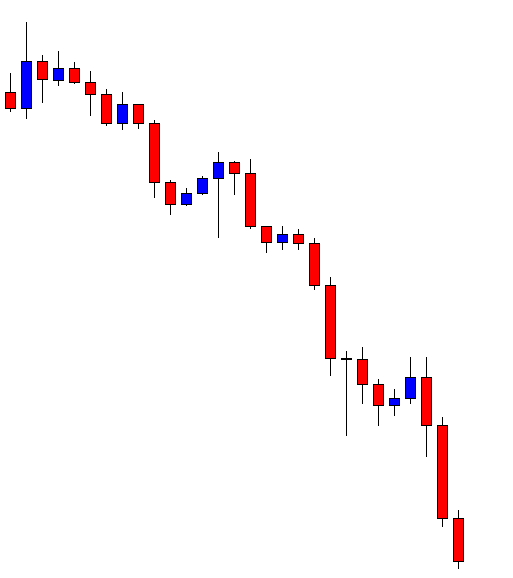
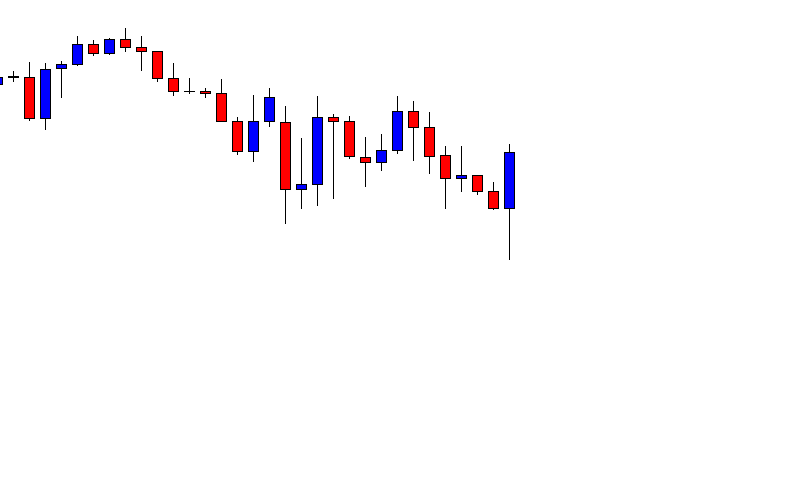
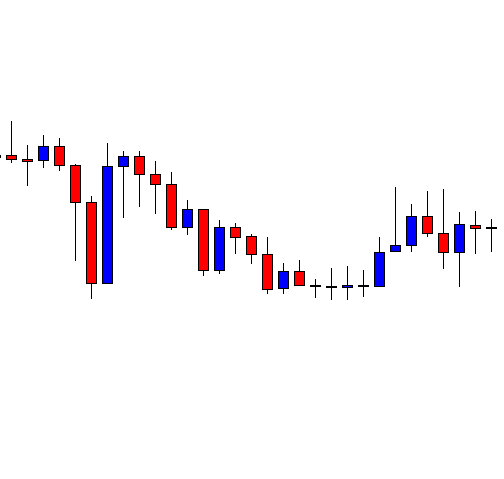
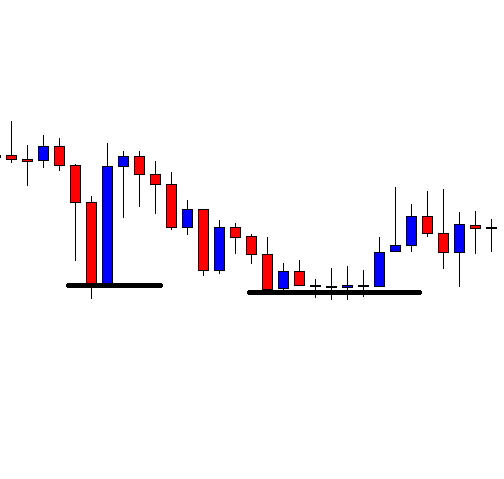
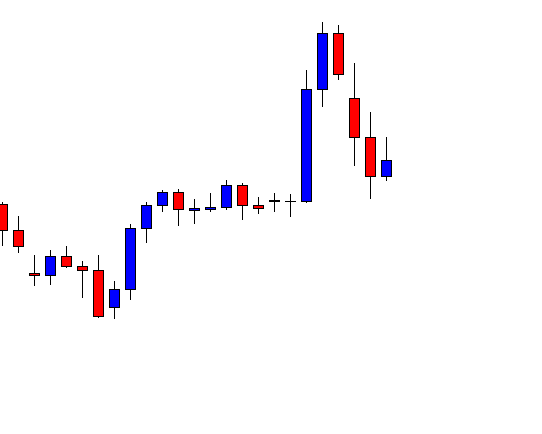
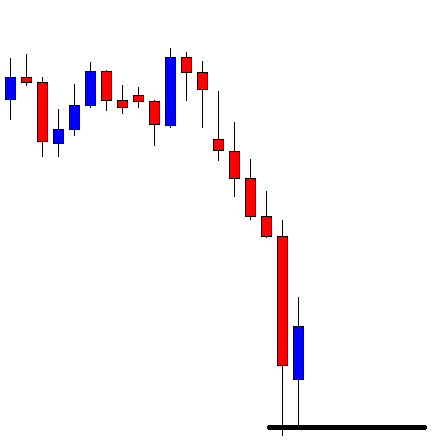
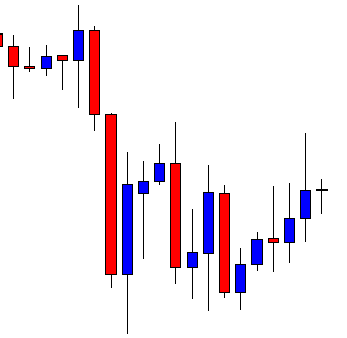
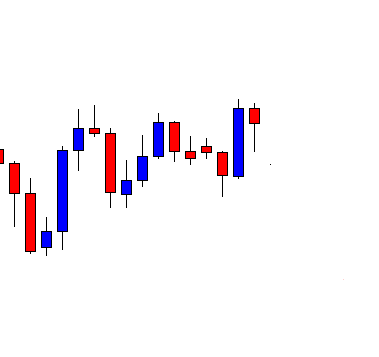
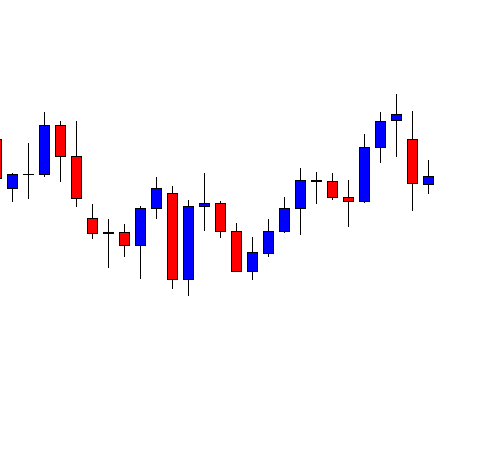
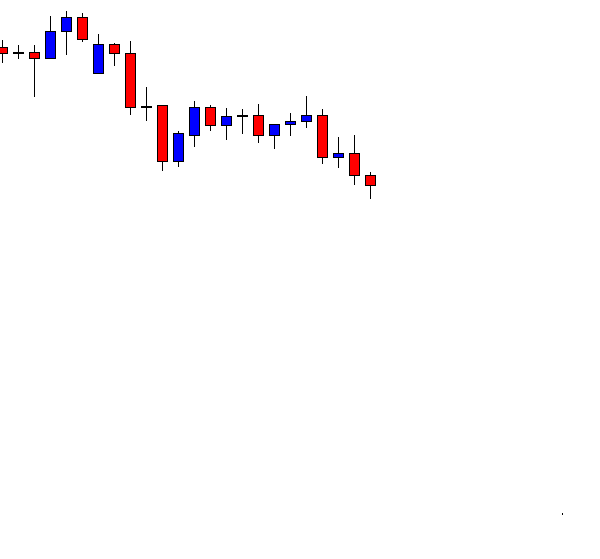
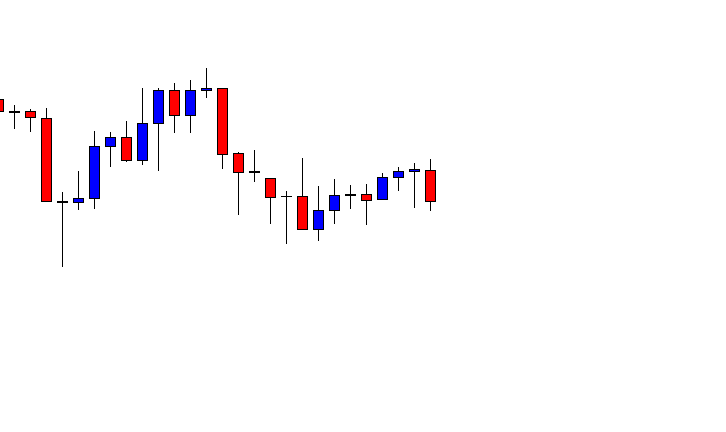
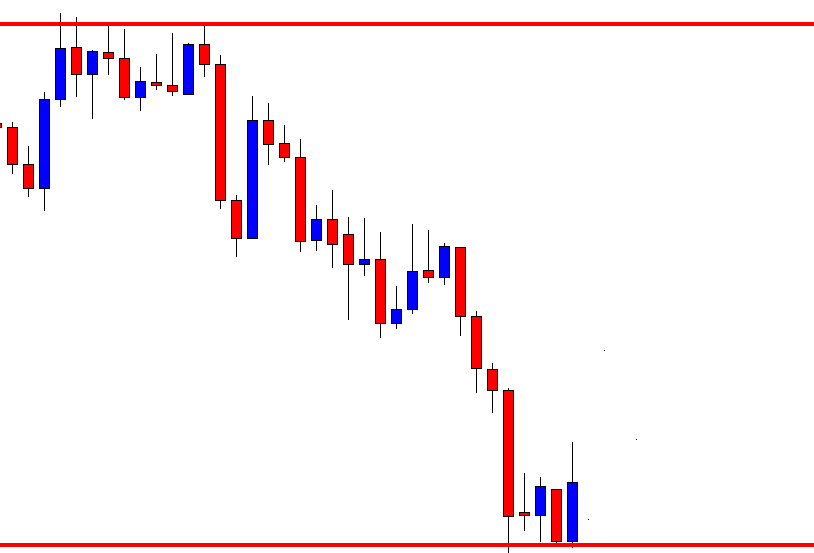
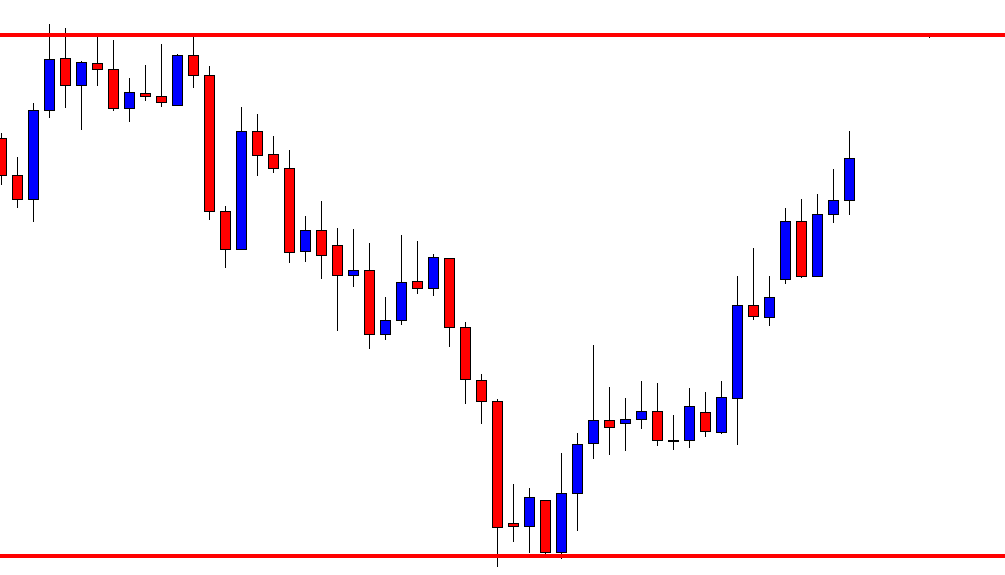
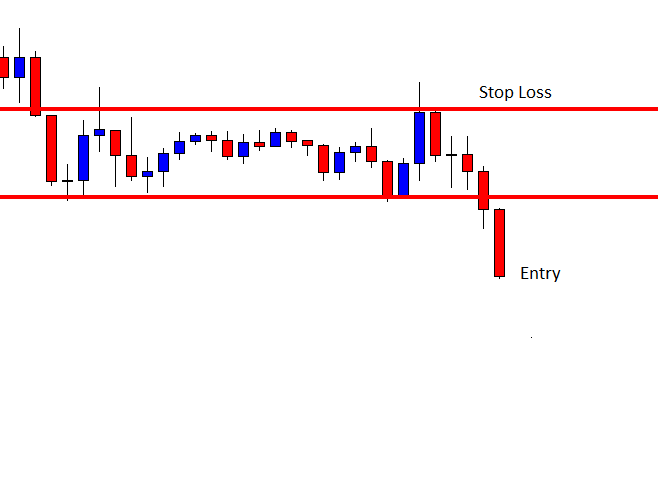
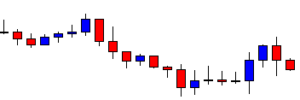
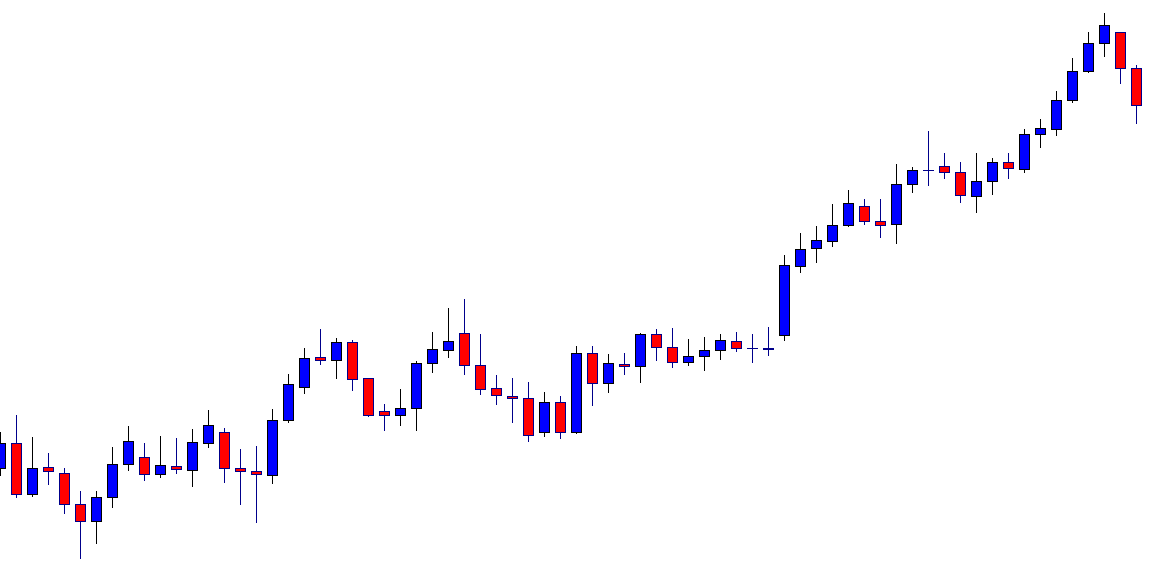
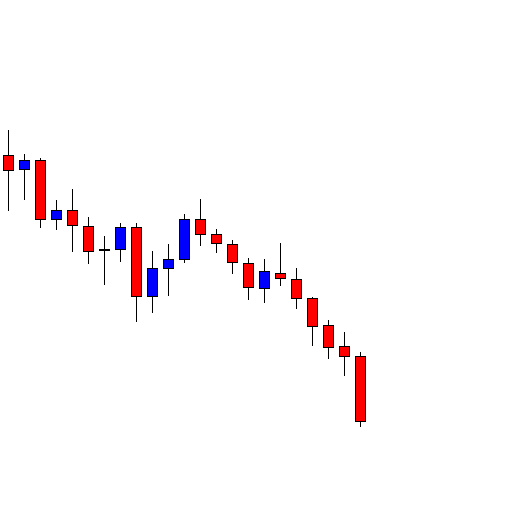
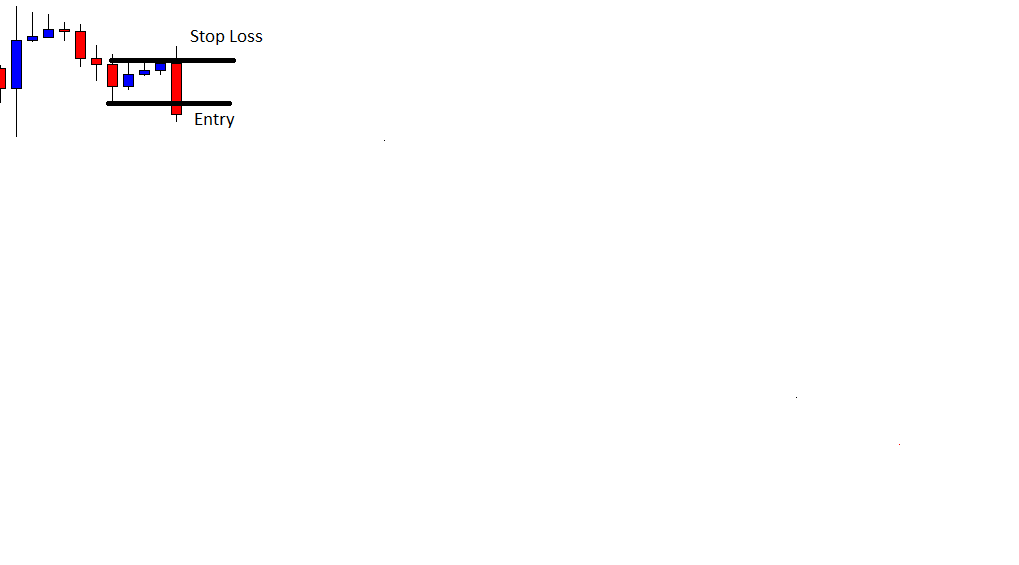
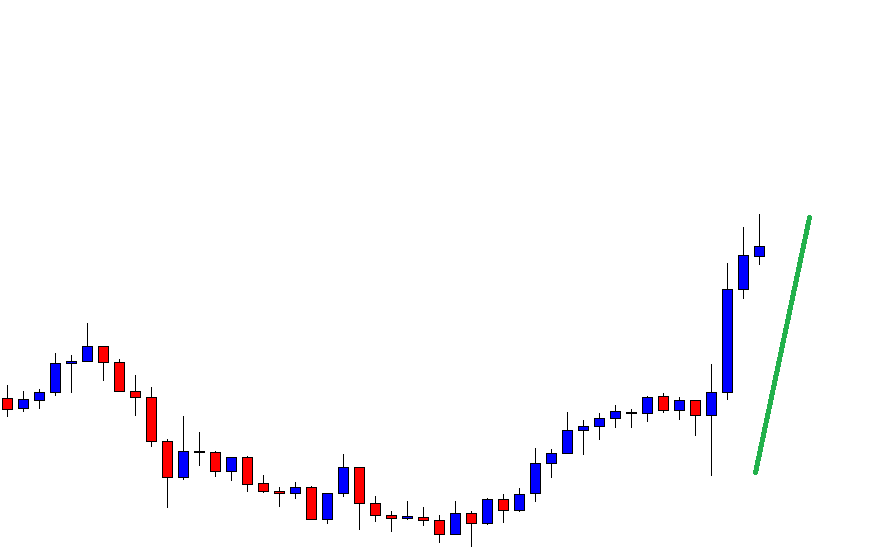
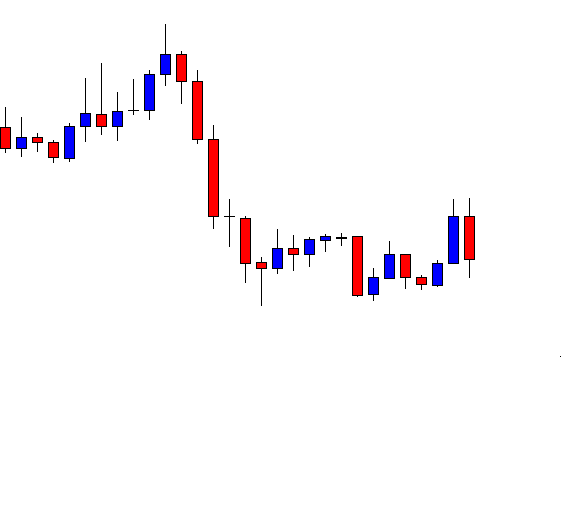
The price heads towards the South with excellent bearish momentum. It produces six consecutive bearish candles, four of them having solid long bearish bodies. The sellers are to wait for the price to make a bullish correction and to produce a bearish reversal candle at the value area. Let us proceed to the next chart.
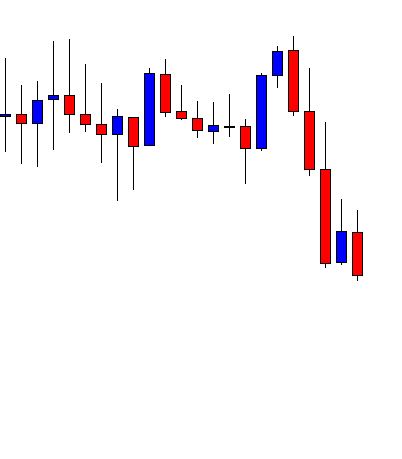
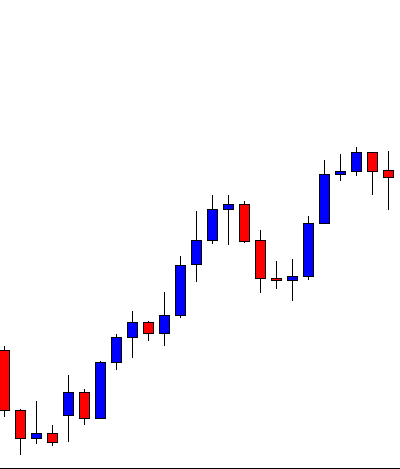
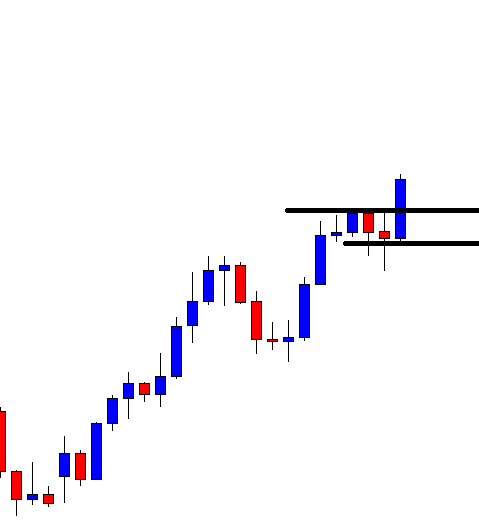
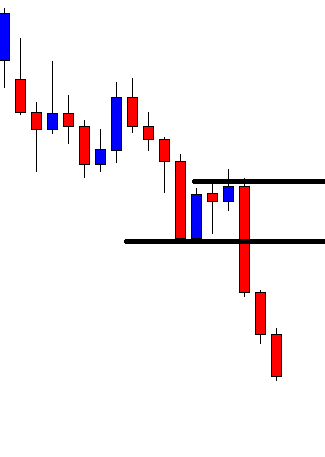
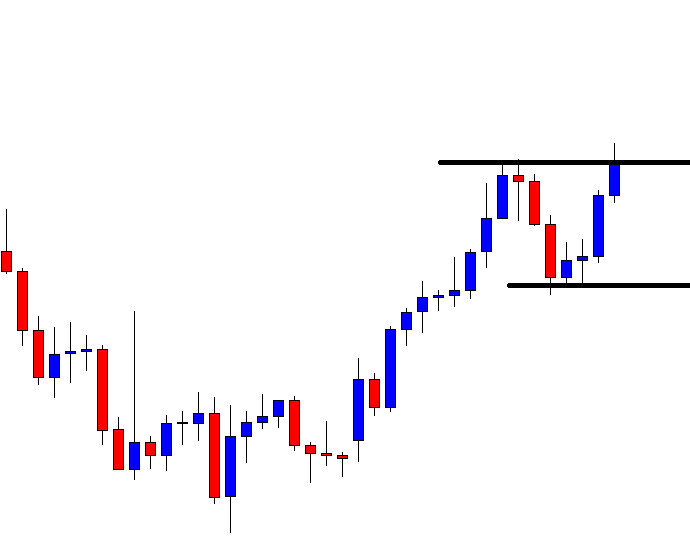
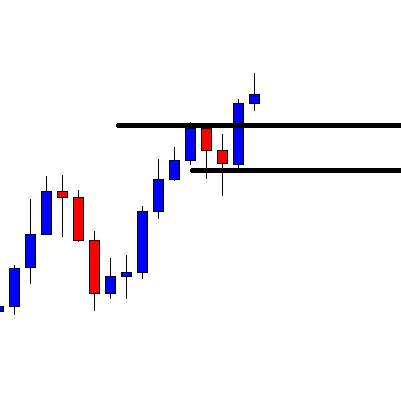
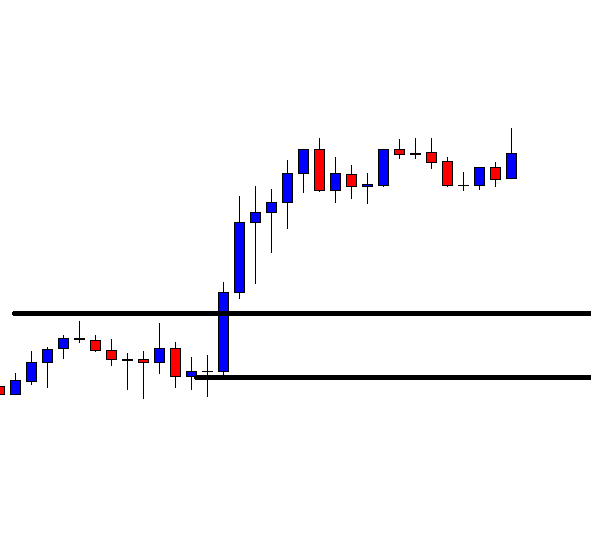
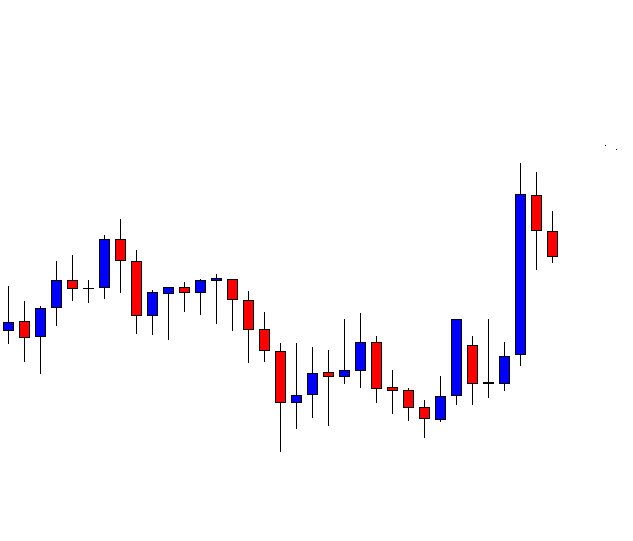
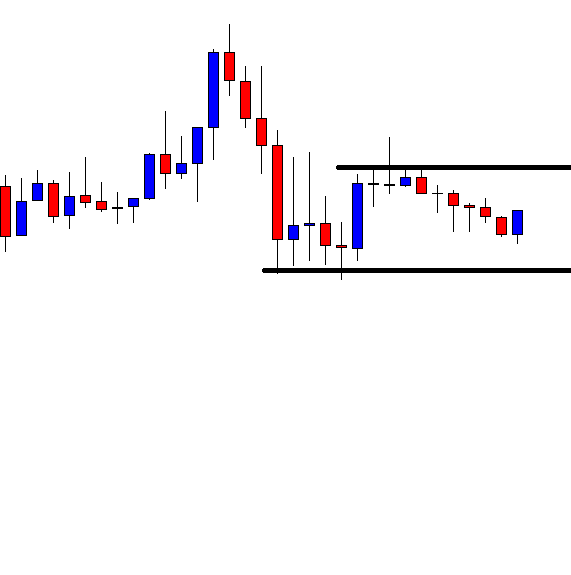
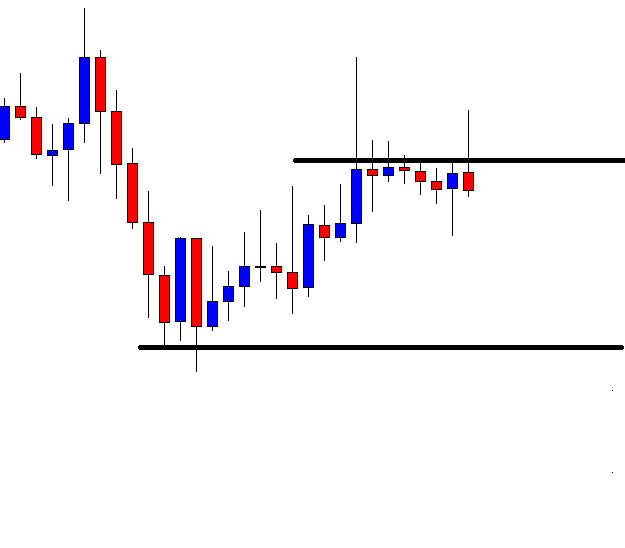
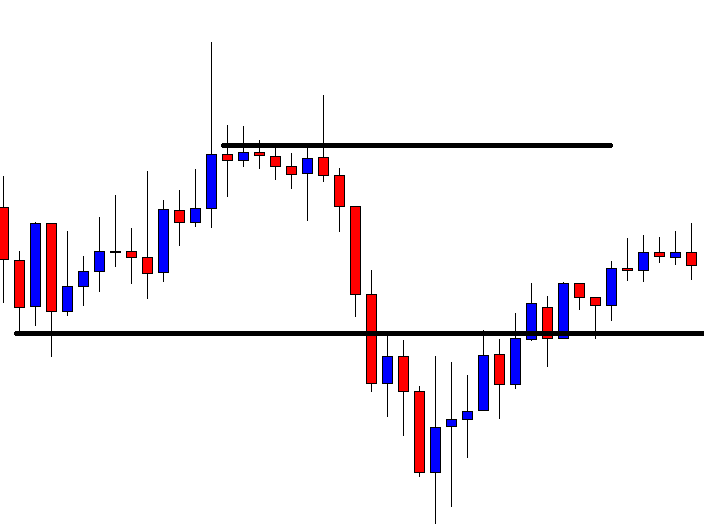
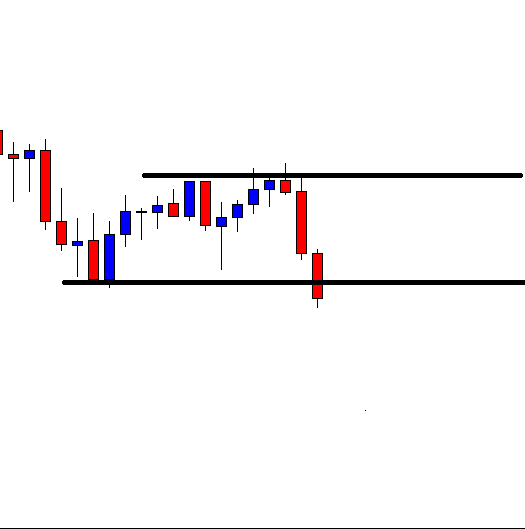
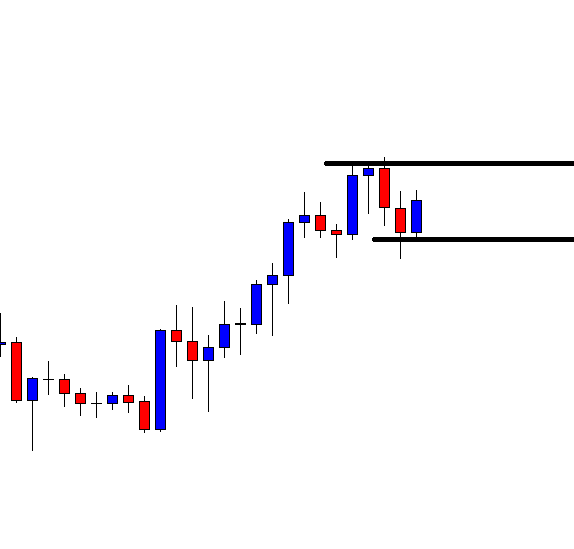
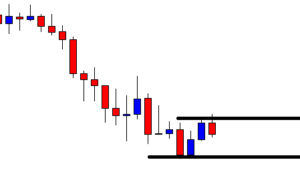
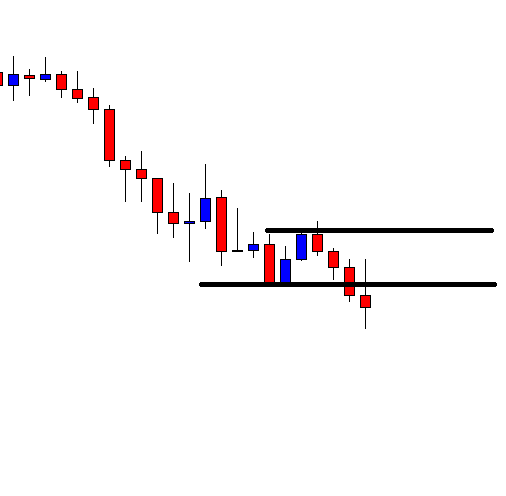
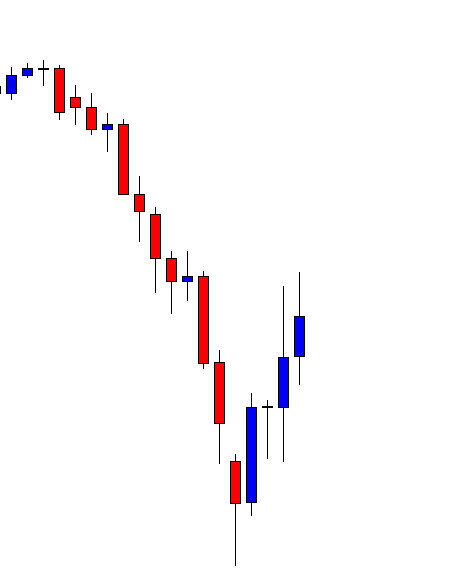
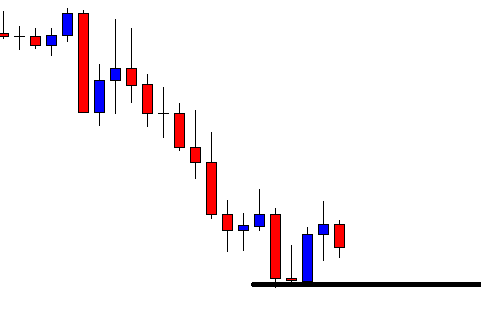
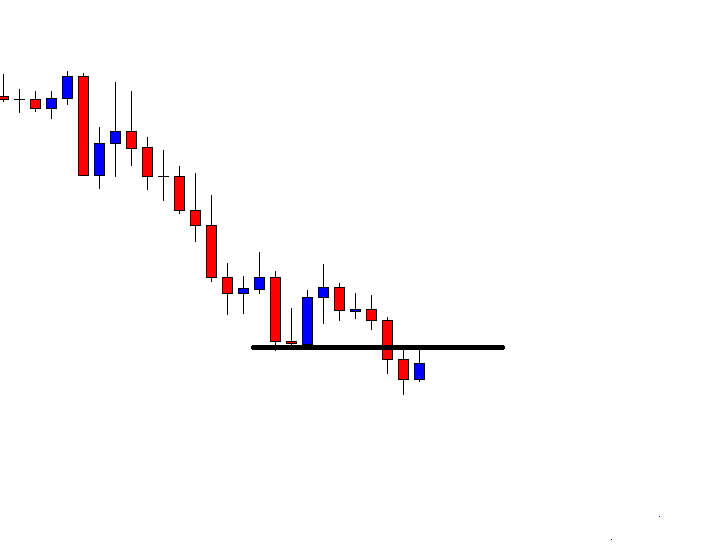
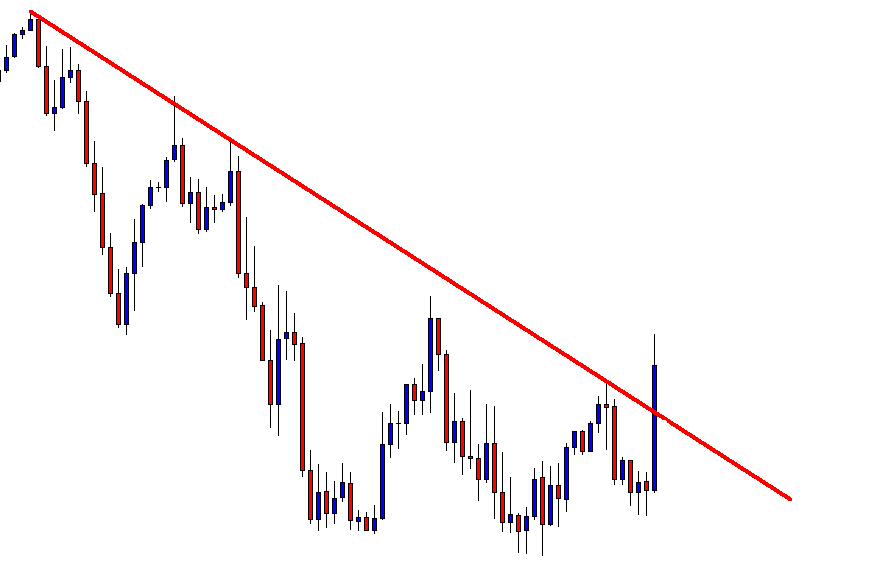
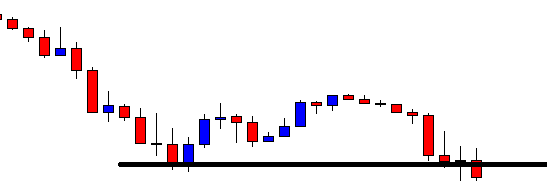
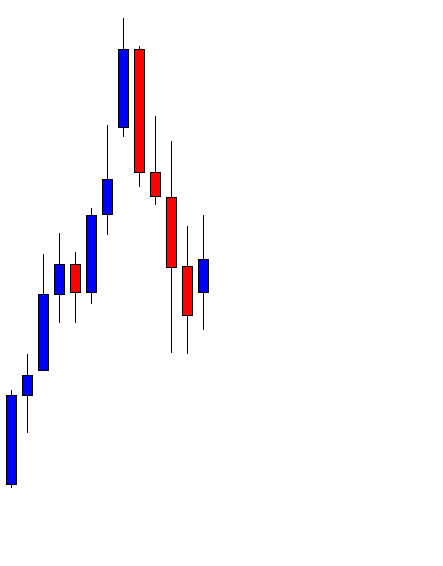
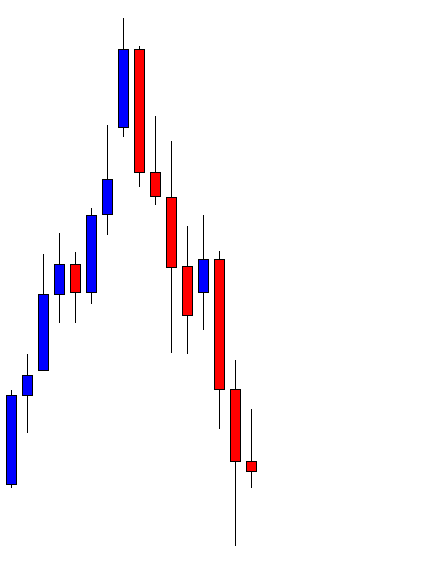
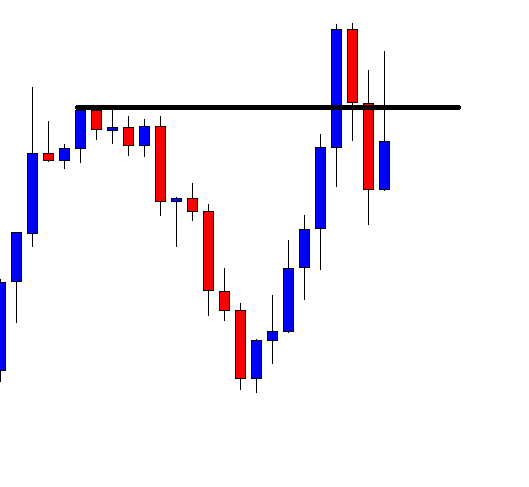
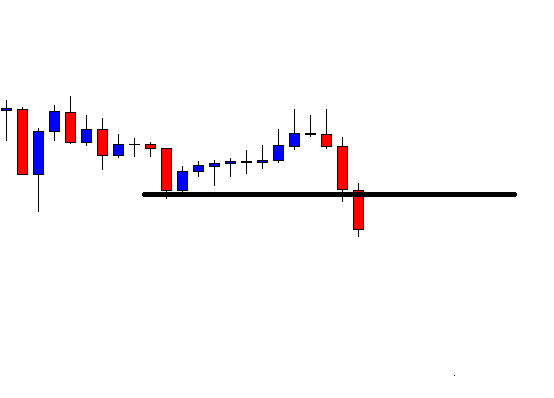
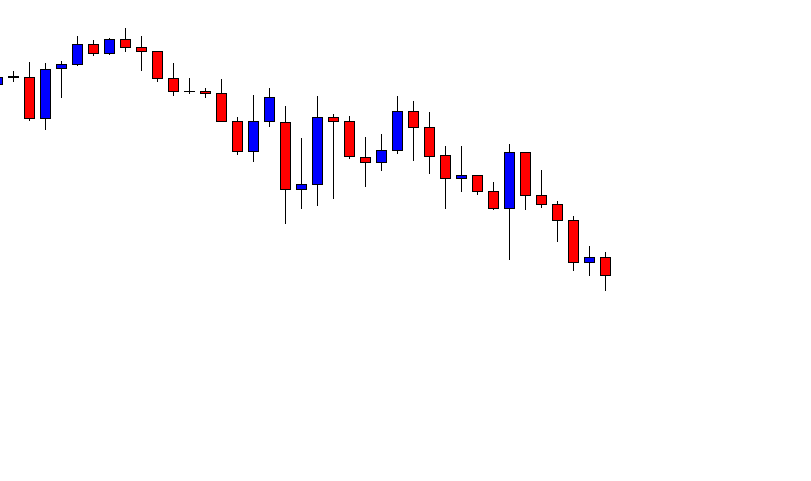
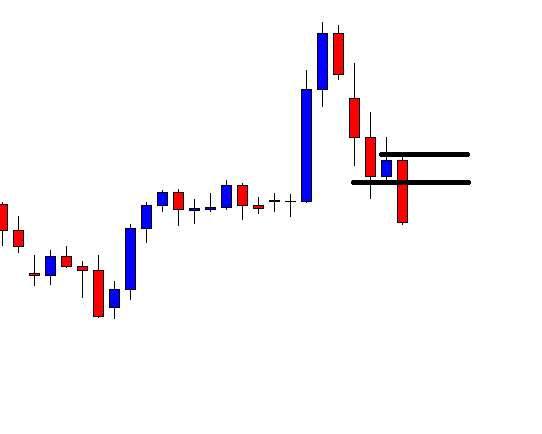
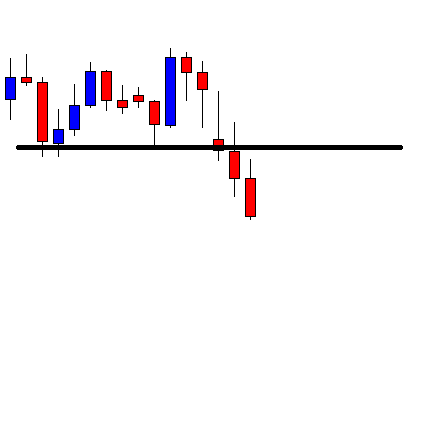
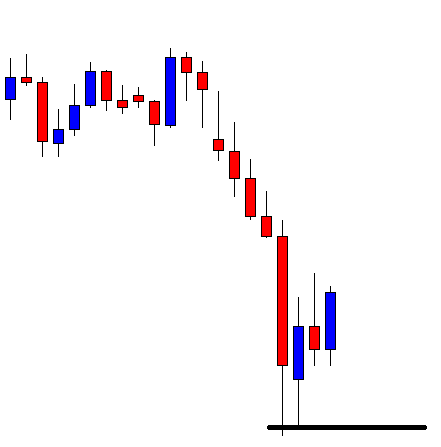
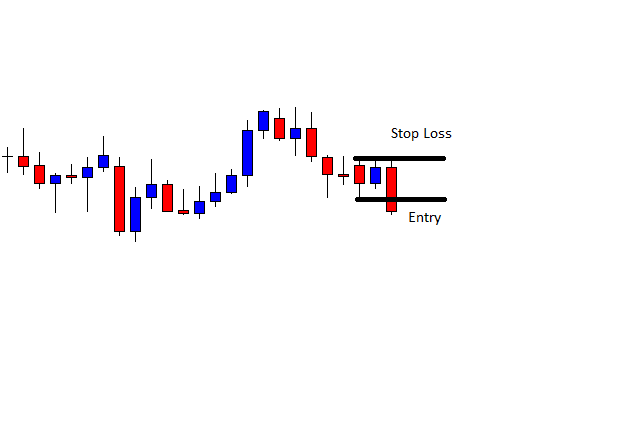
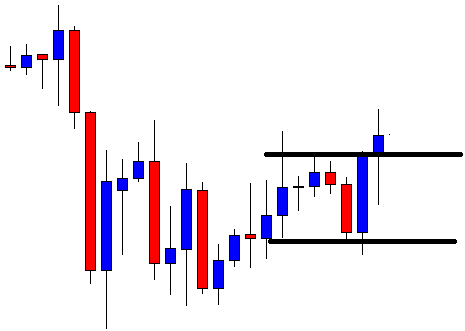
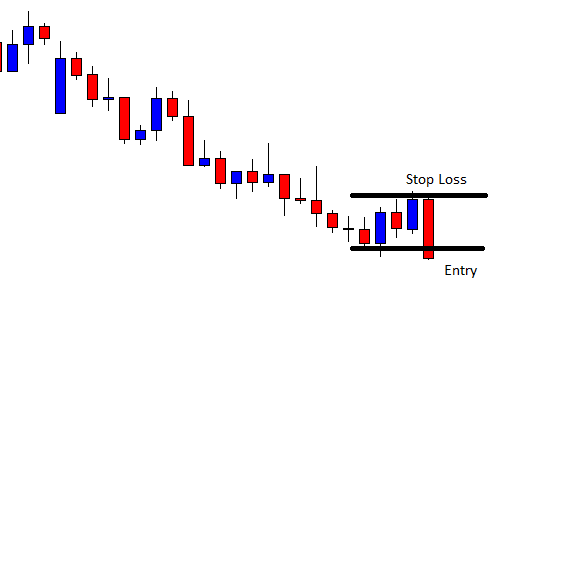
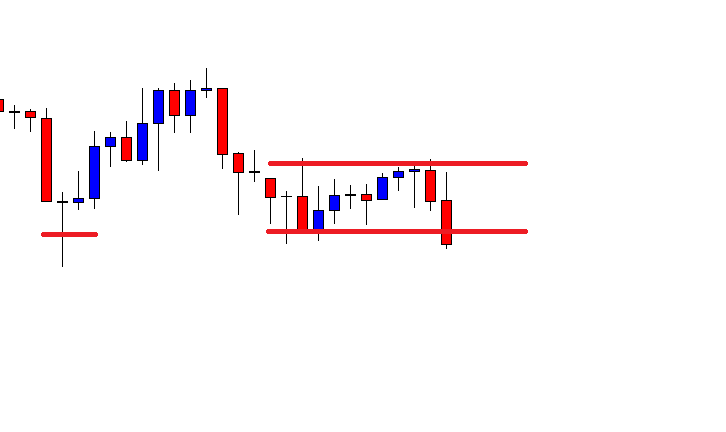
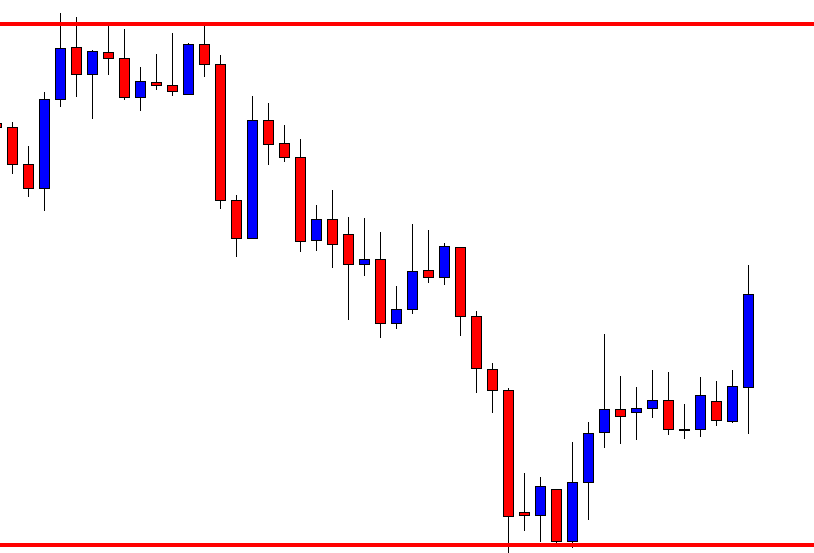
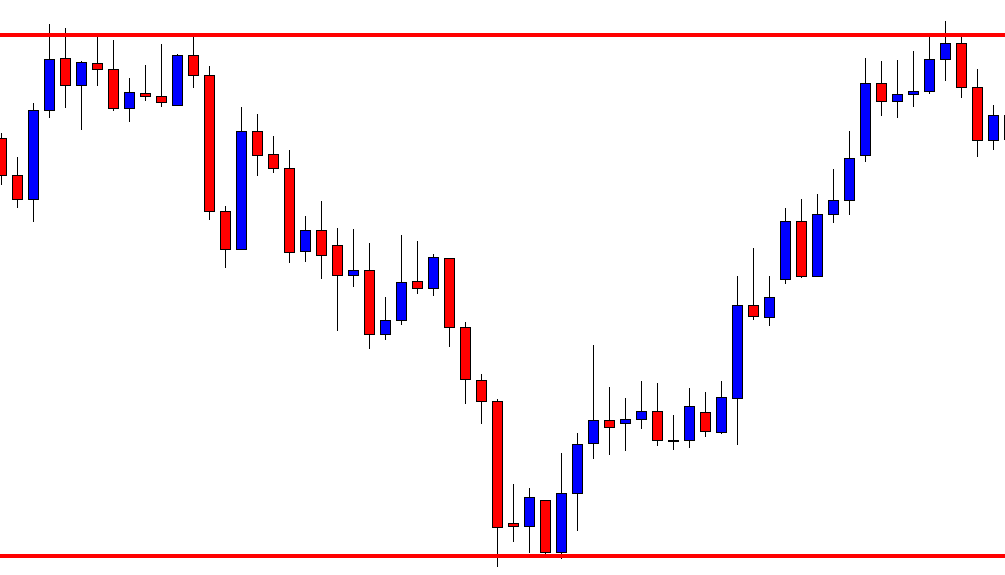
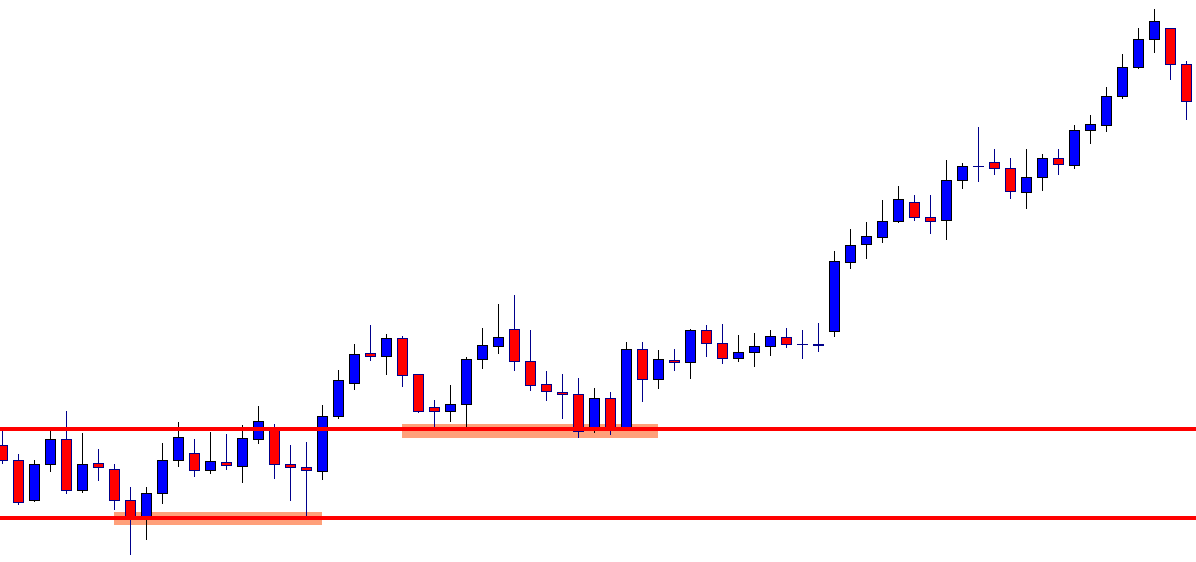
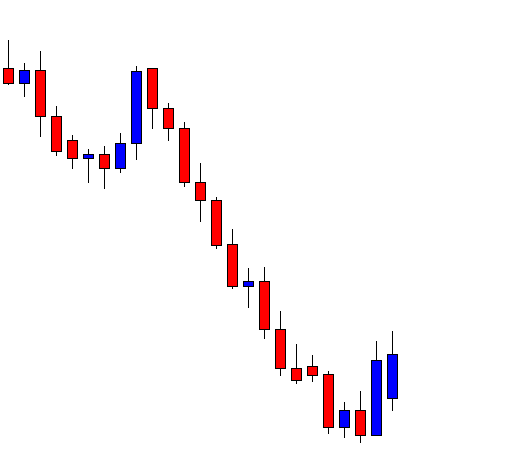
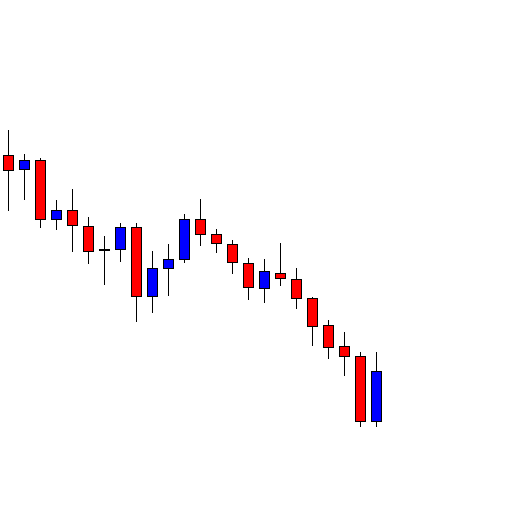
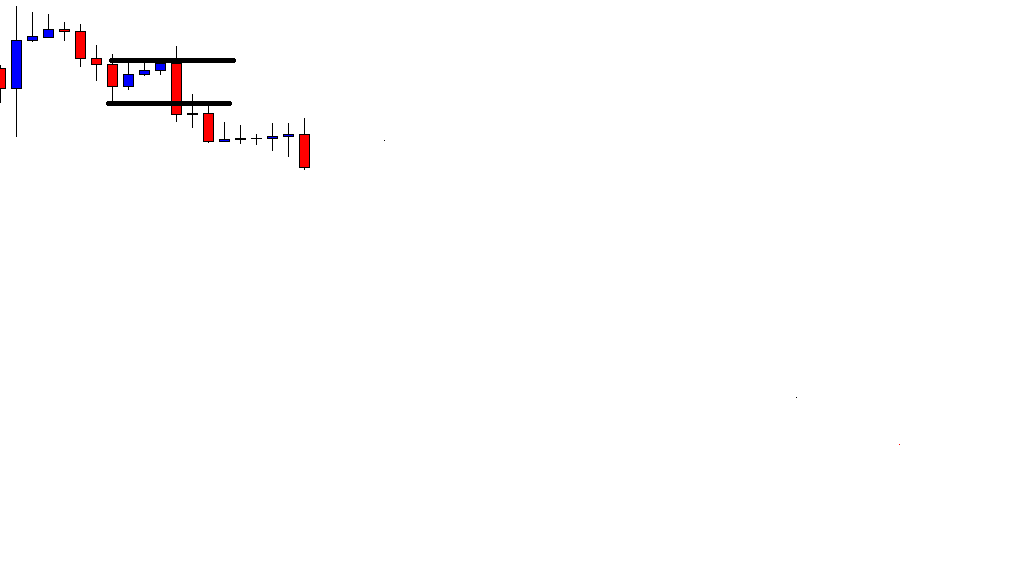
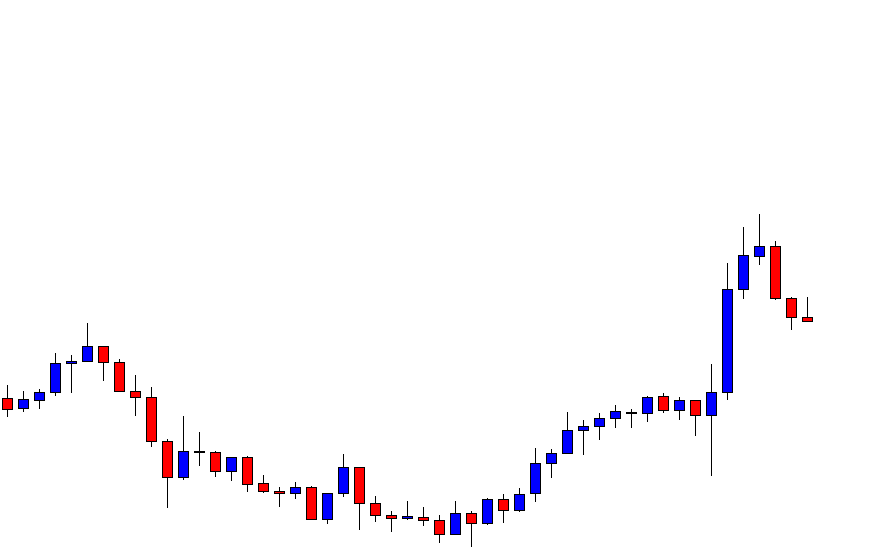
The price makes a bullish correction and produces a bearish engulfing candle. However, the price does not make a bearish breakout. It rather goes towards the North again. The last two candles come out as bullish candles. The price goes towards the North further for a deeper correction.
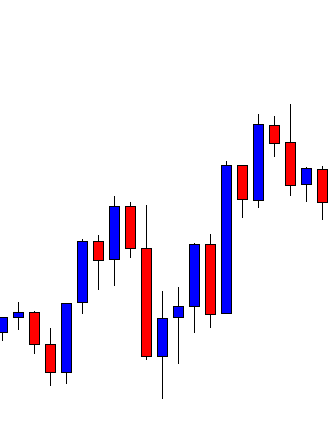
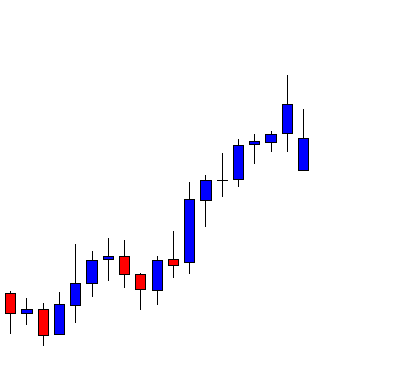
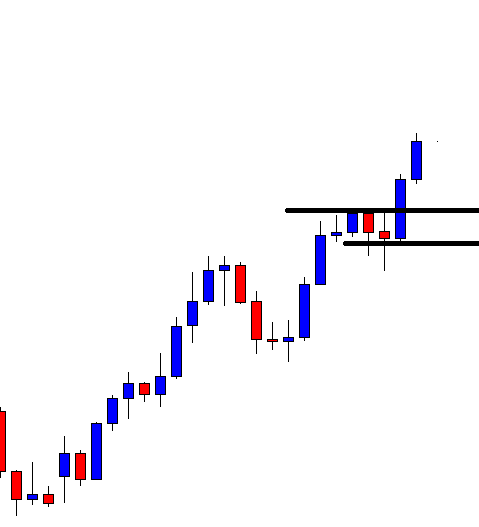
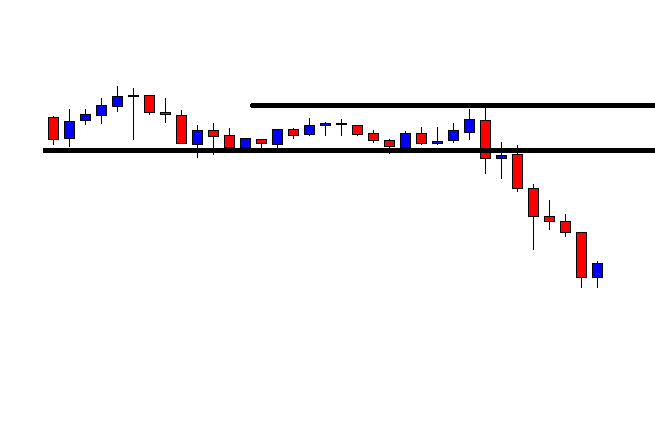
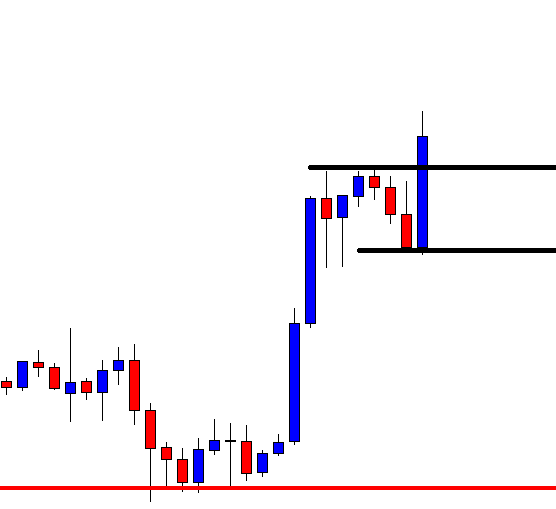
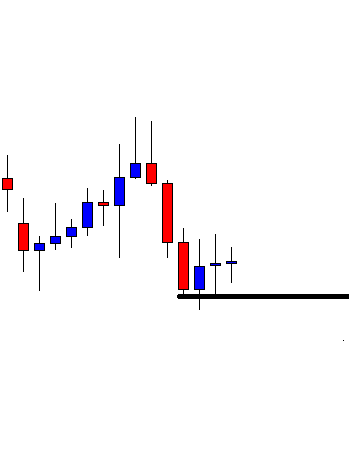
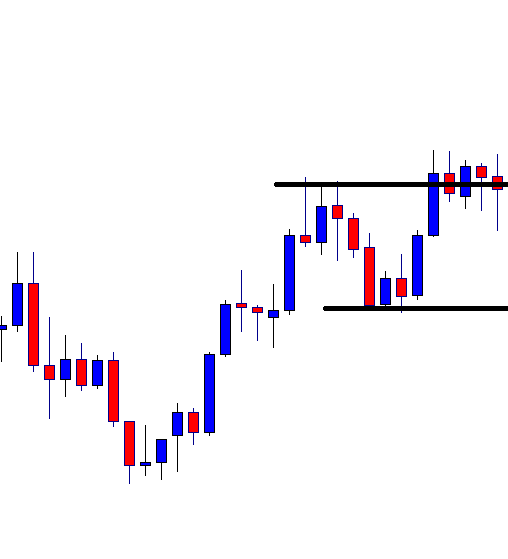
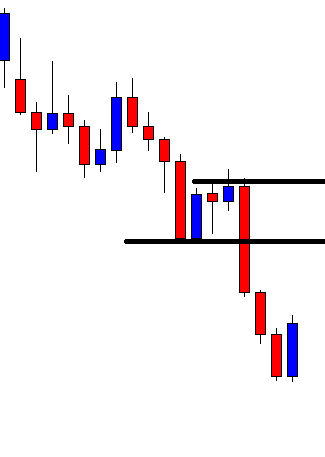
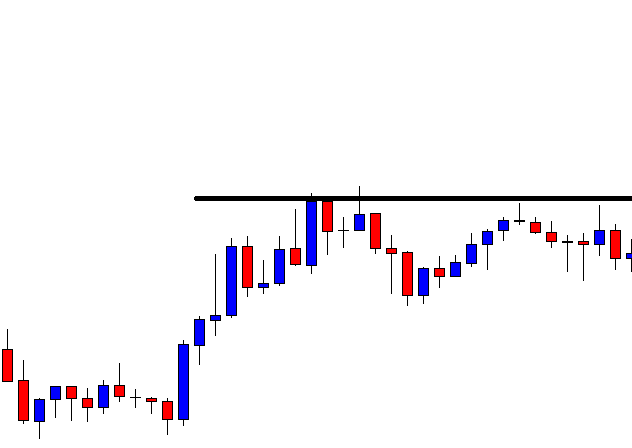
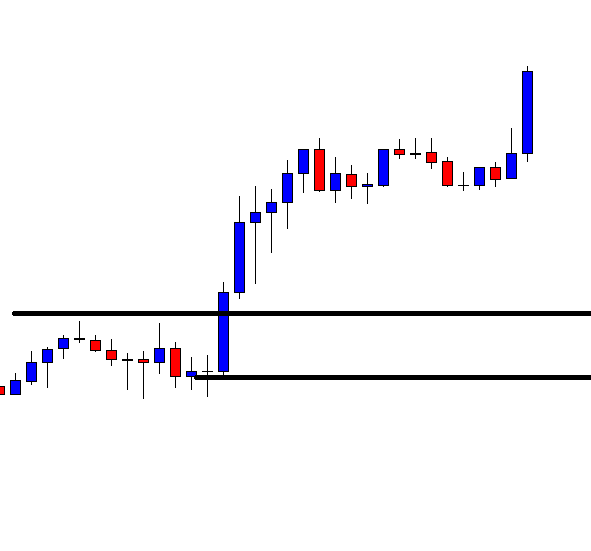
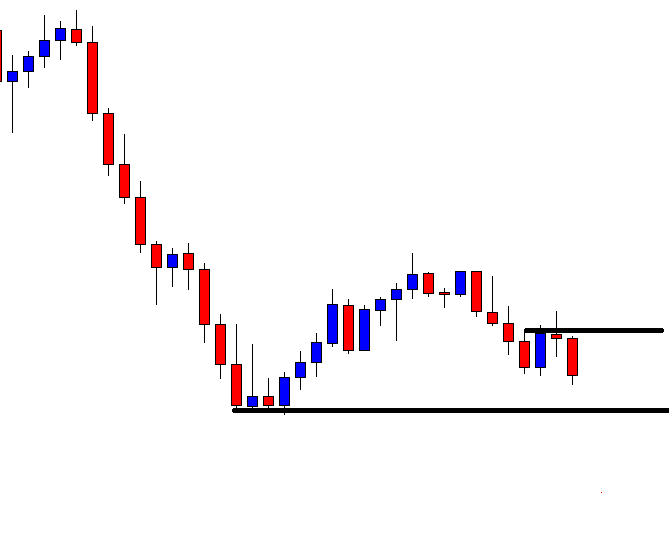
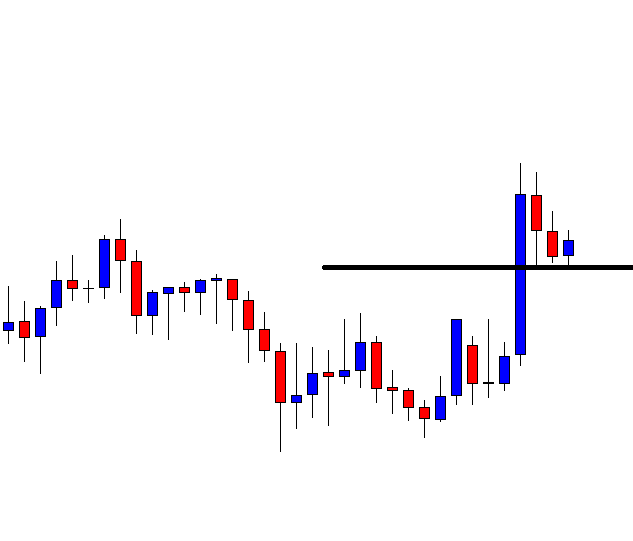
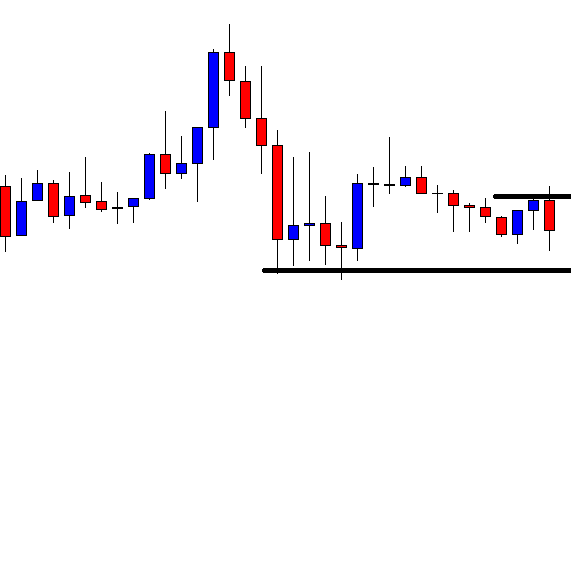
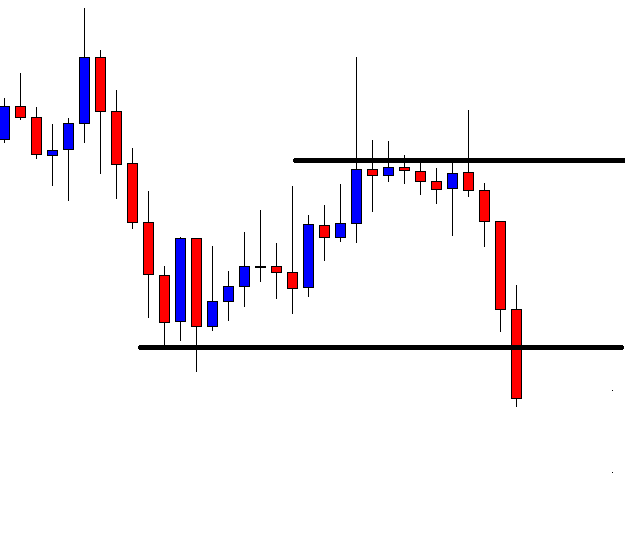
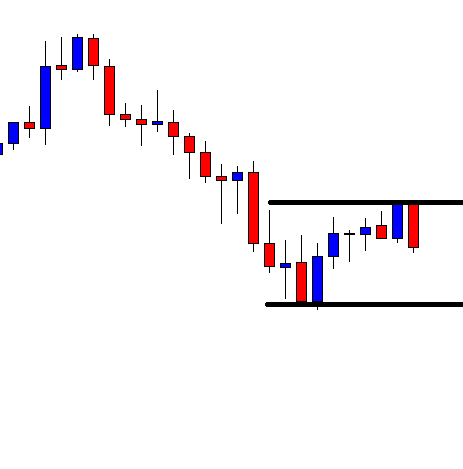
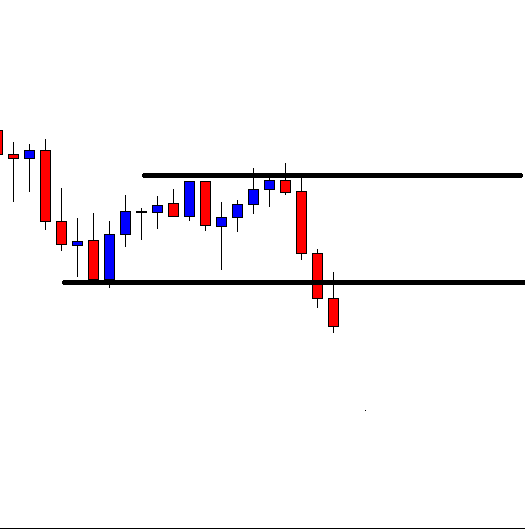
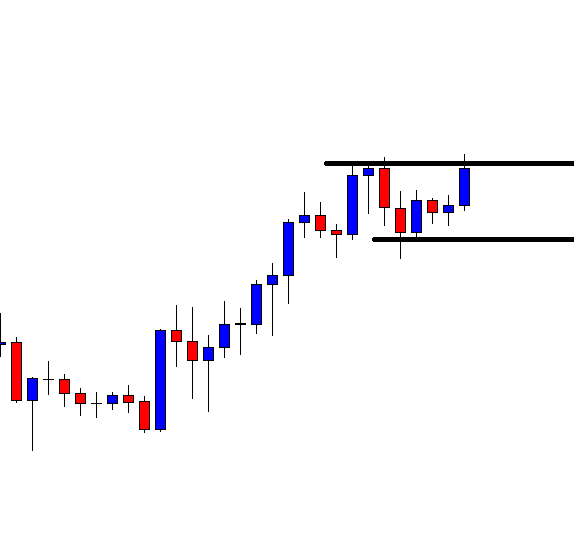
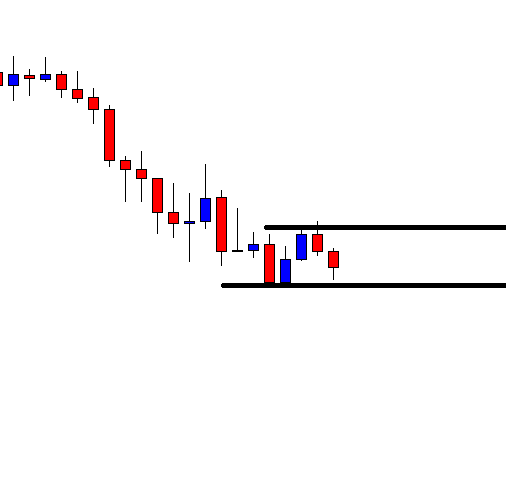
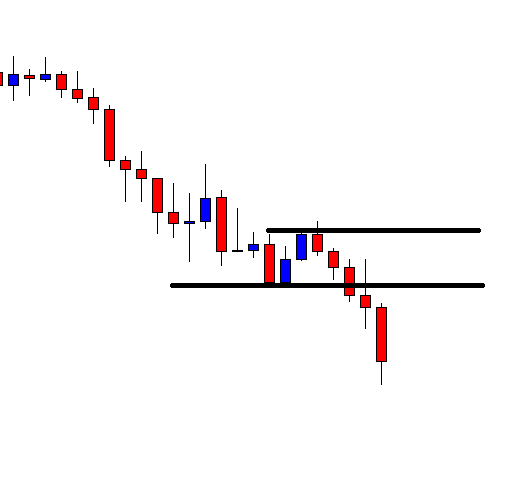
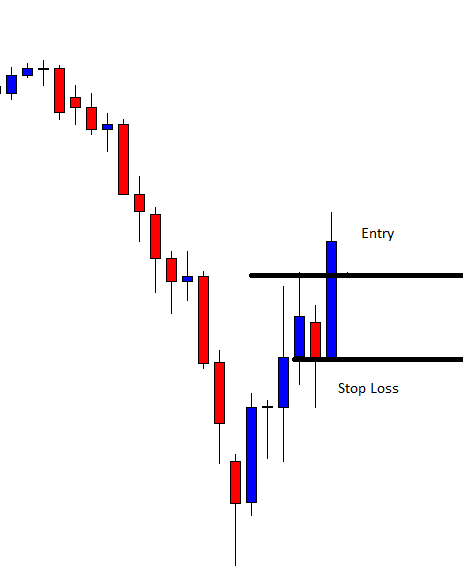
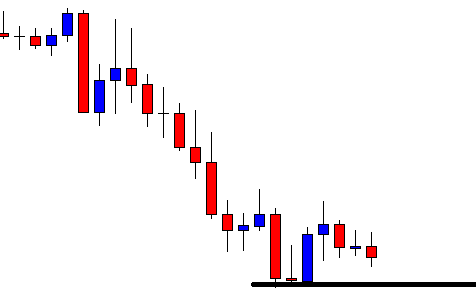
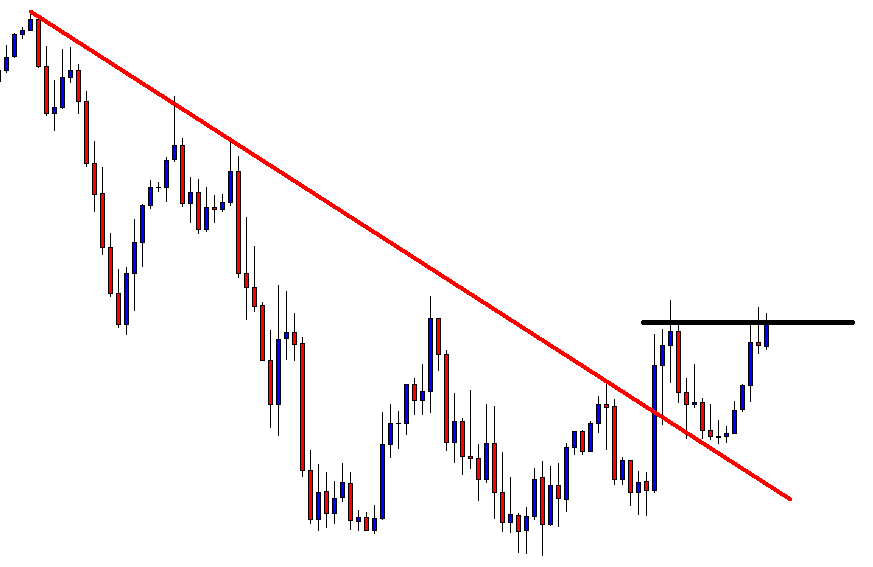
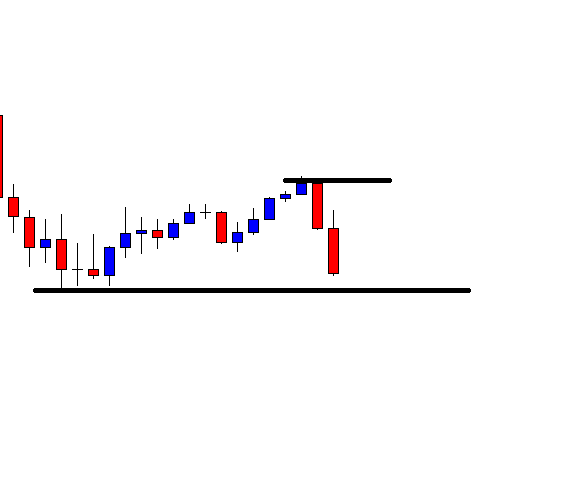
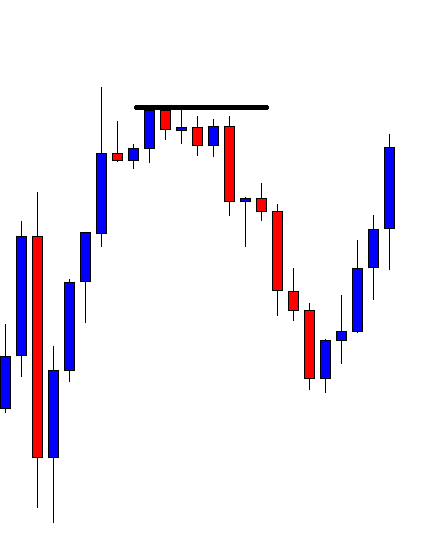
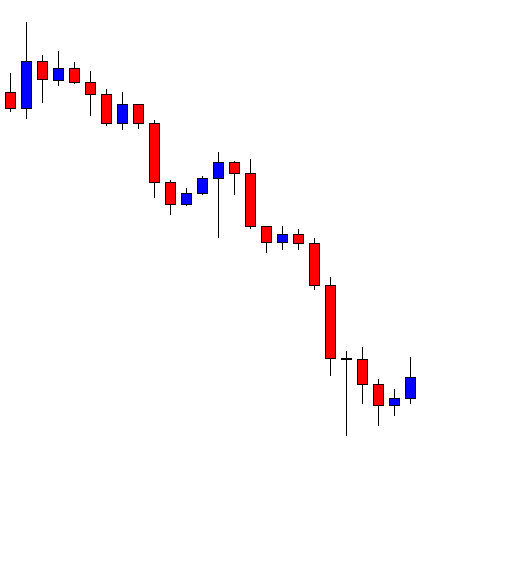
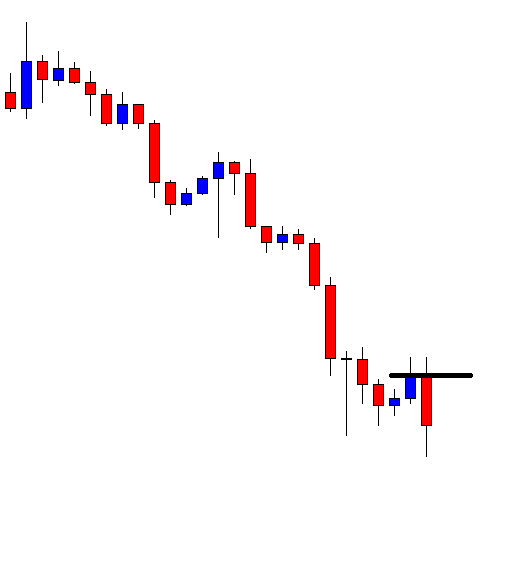
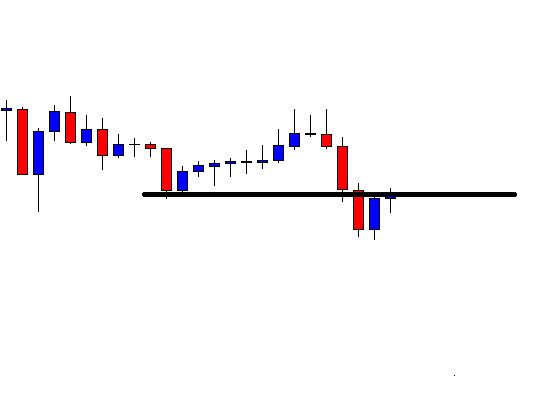
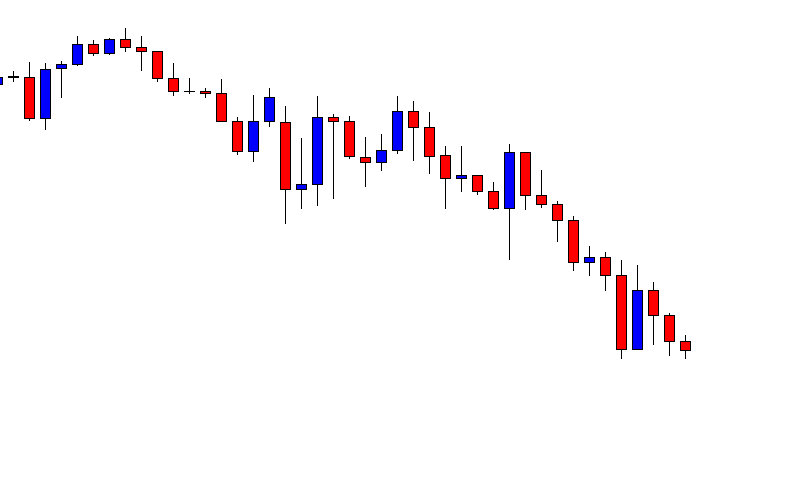
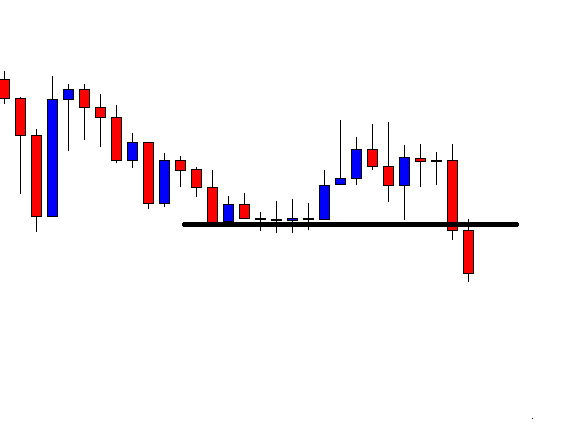
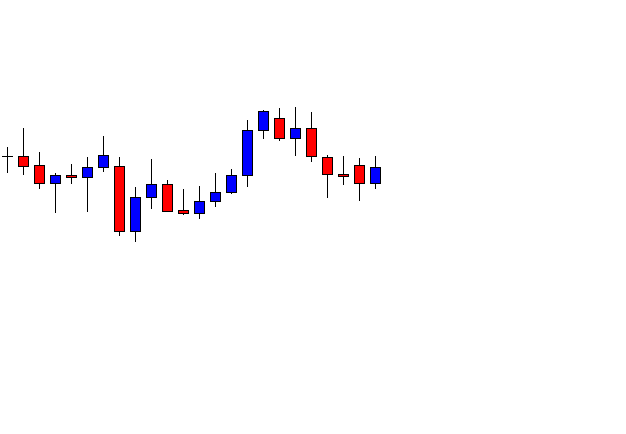
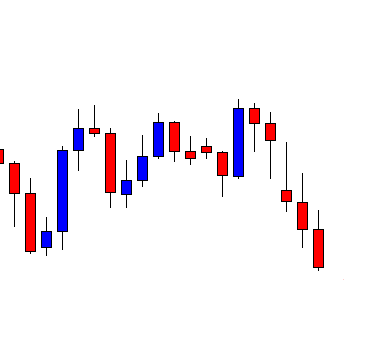
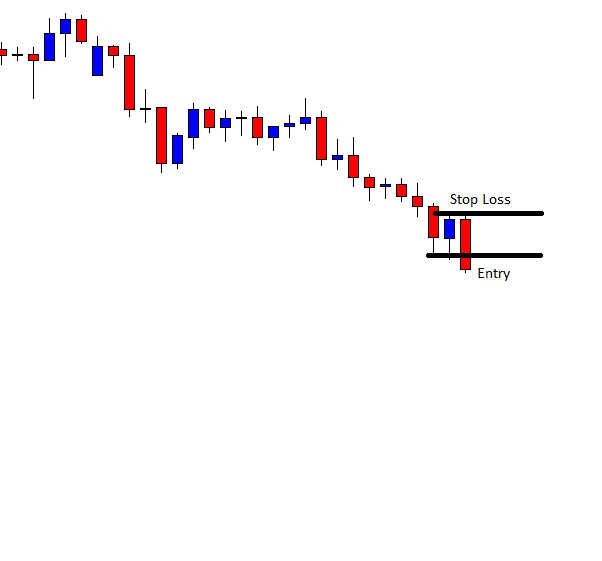
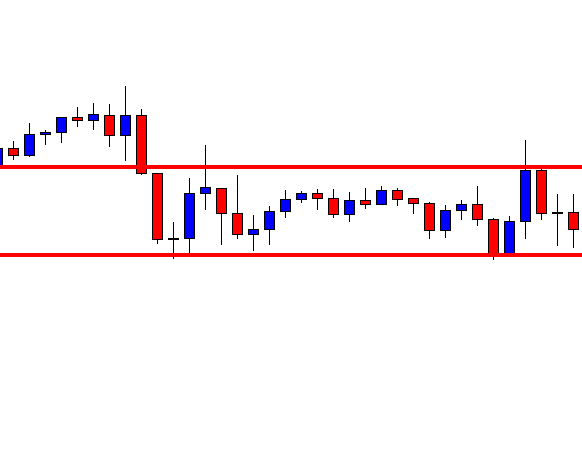
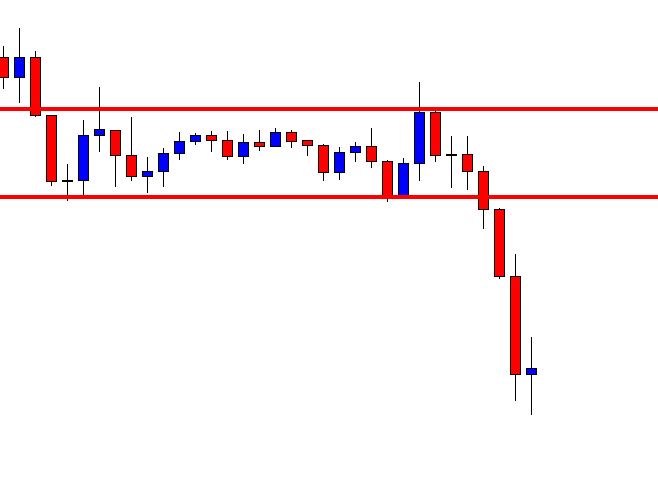
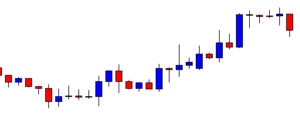
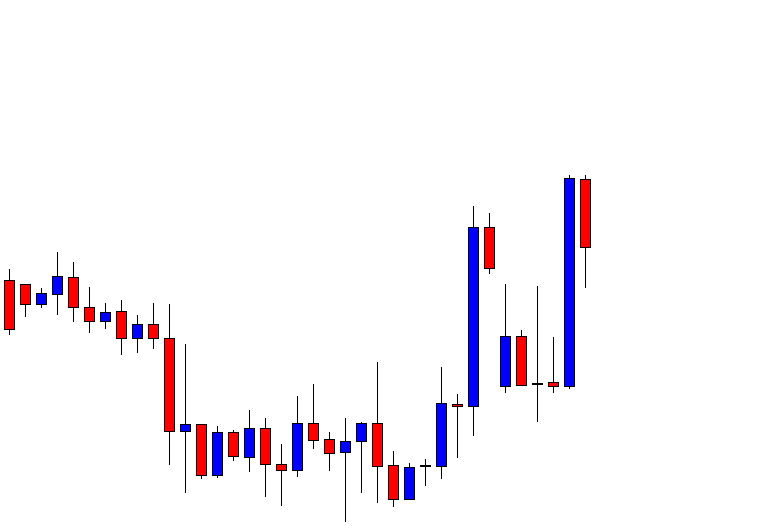
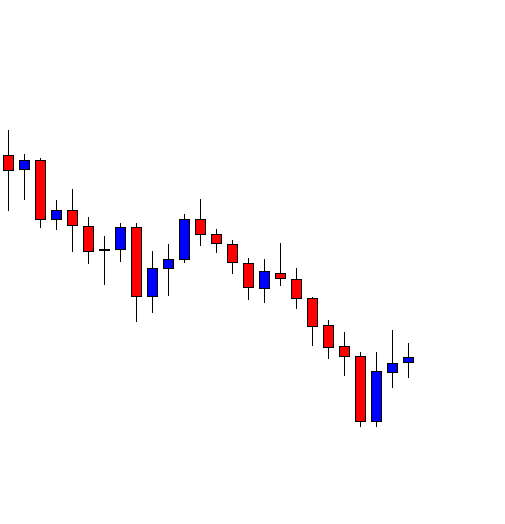
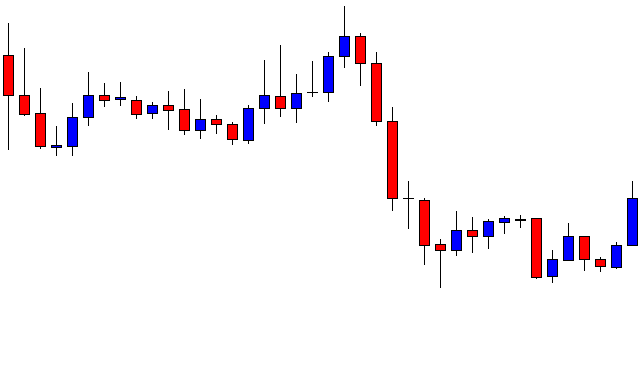
The chart produces a bearish Marubozu candle. The combination of the last two candles is called Track Rail. The Track Rail is one of the strongest reversal signal candles. The sellers may keep their eyes on this chart with attention. The Fibonacci traders may draw their Fibonacci levels to find out which level it is trending from.
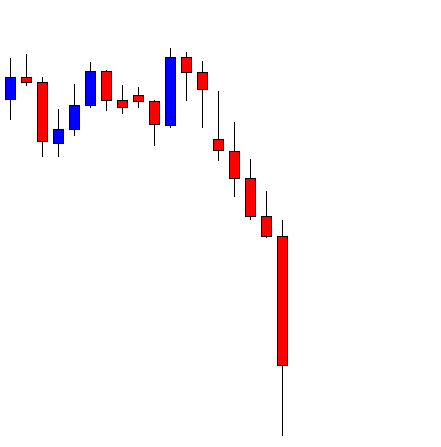
Let us proceed to the next chart to find out what the price does.
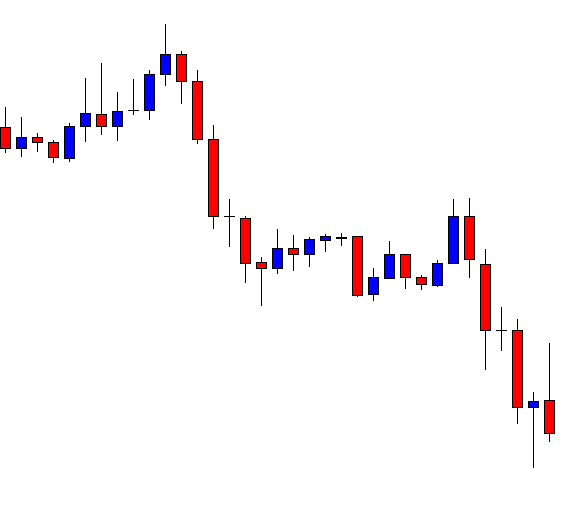
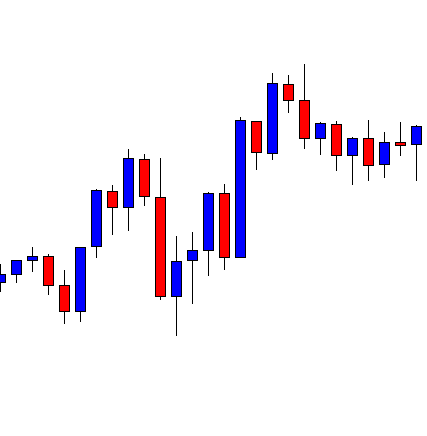
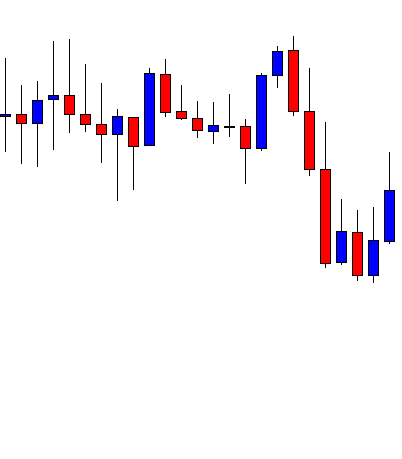
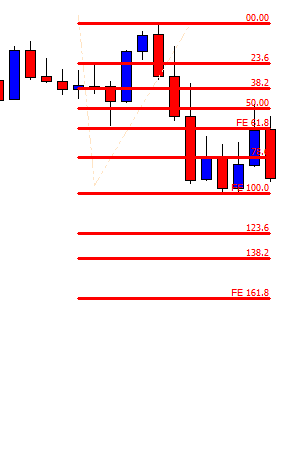
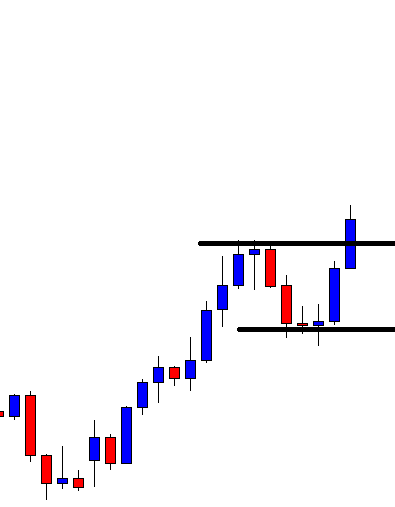
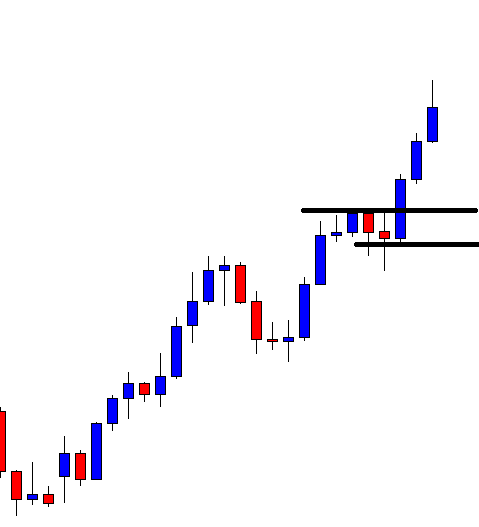
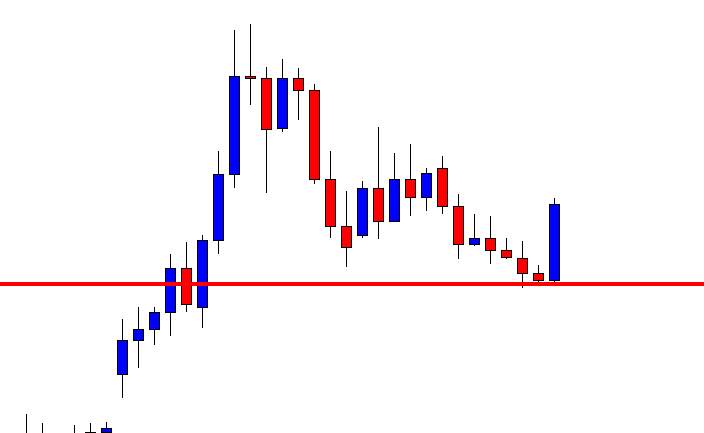
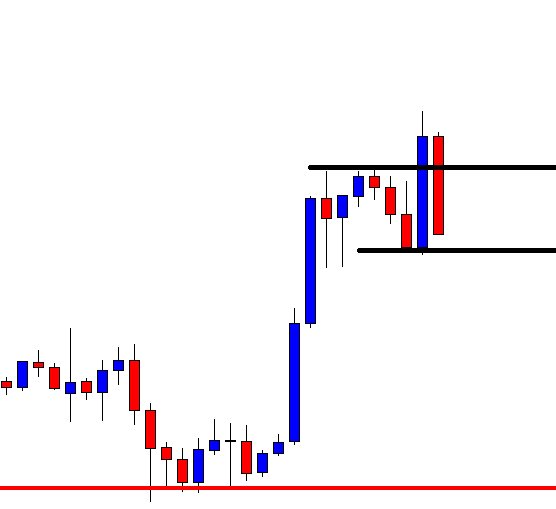
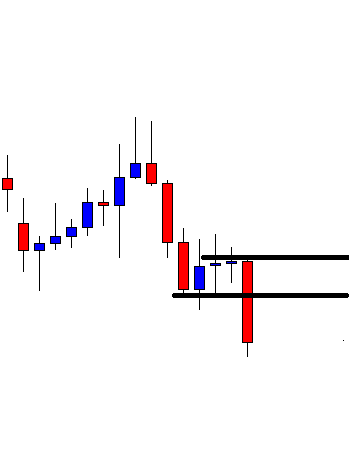
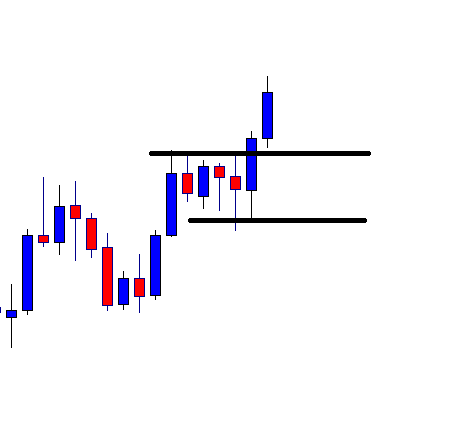
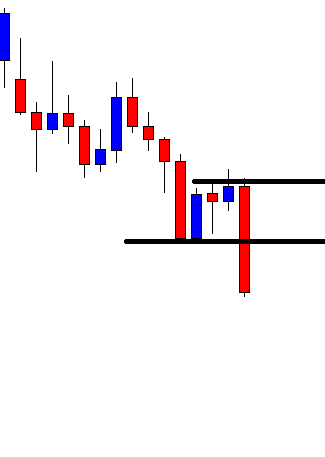
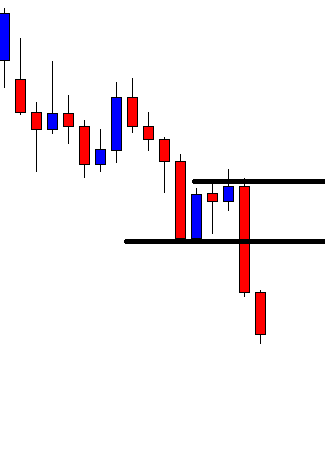
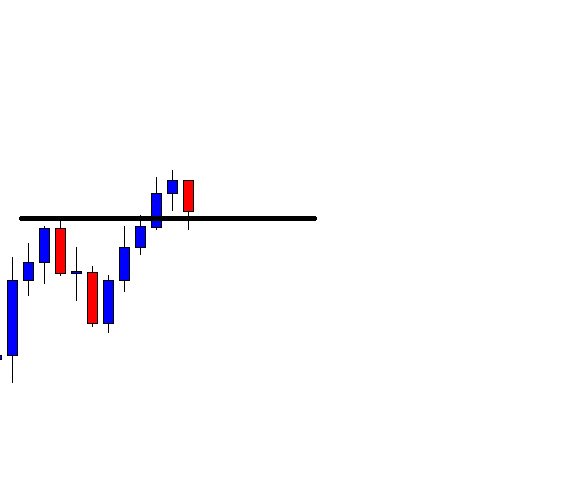
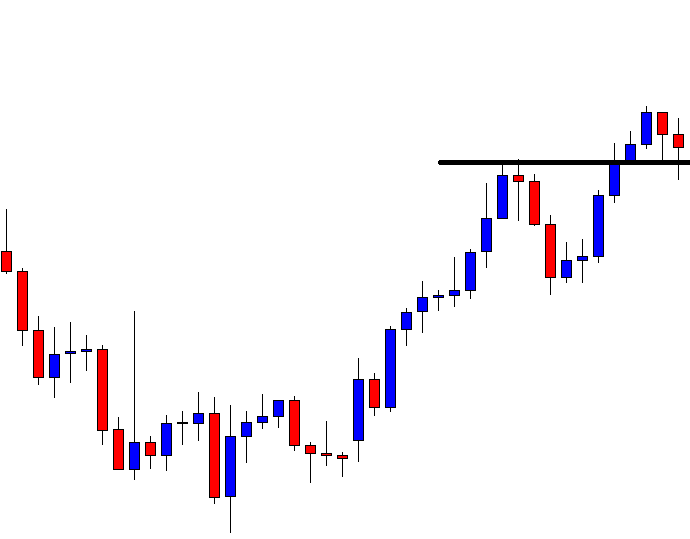
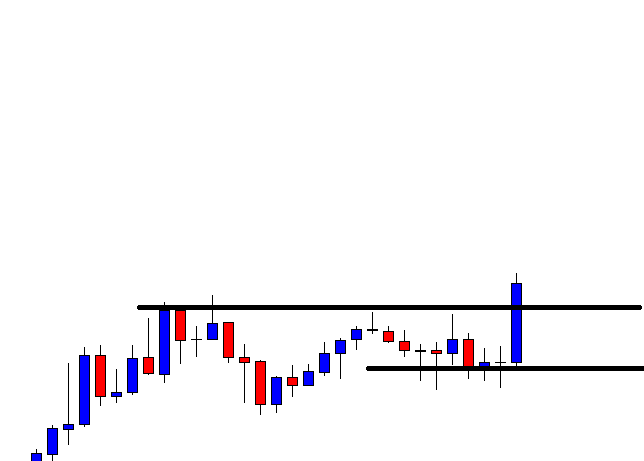
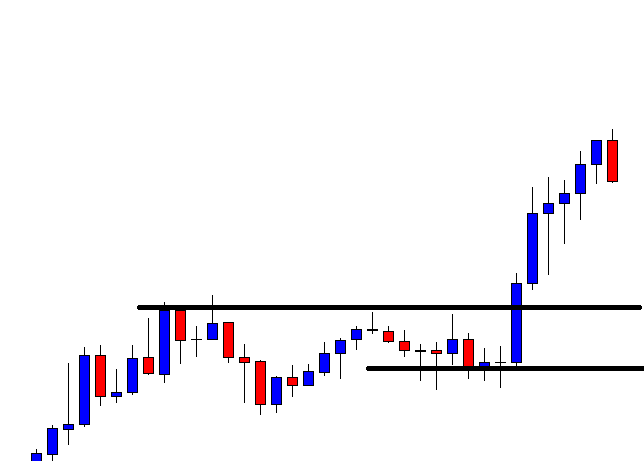
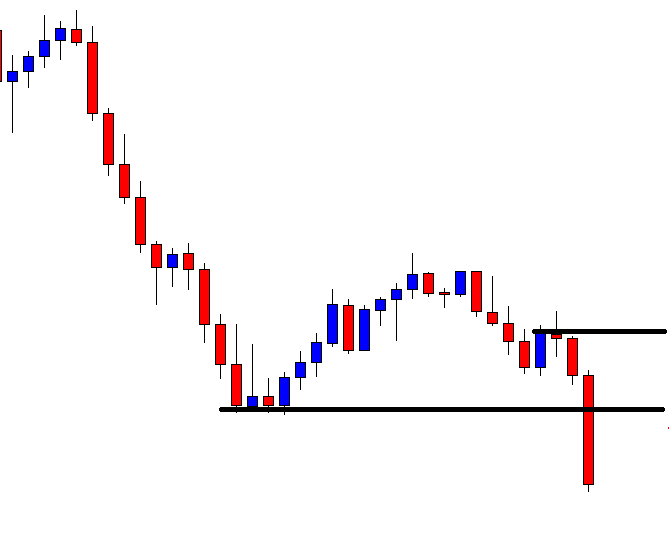
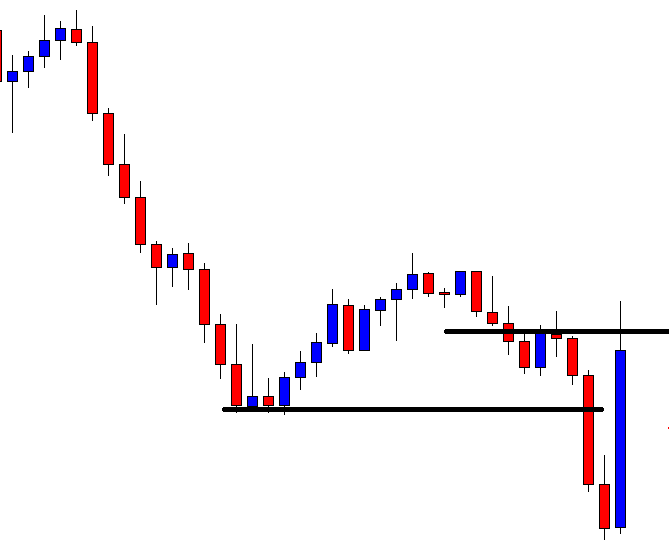
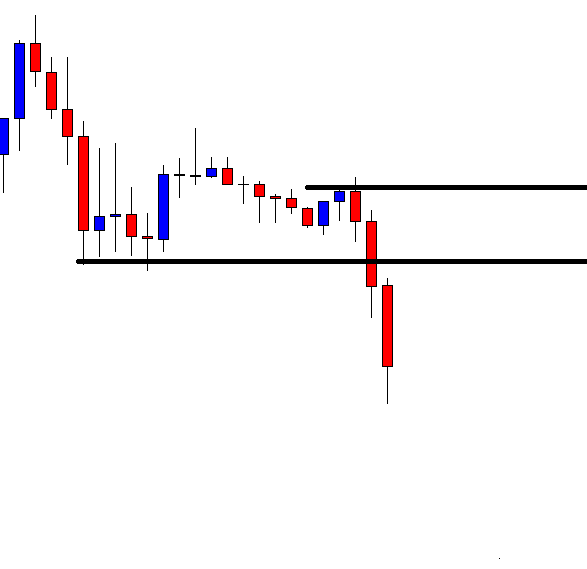
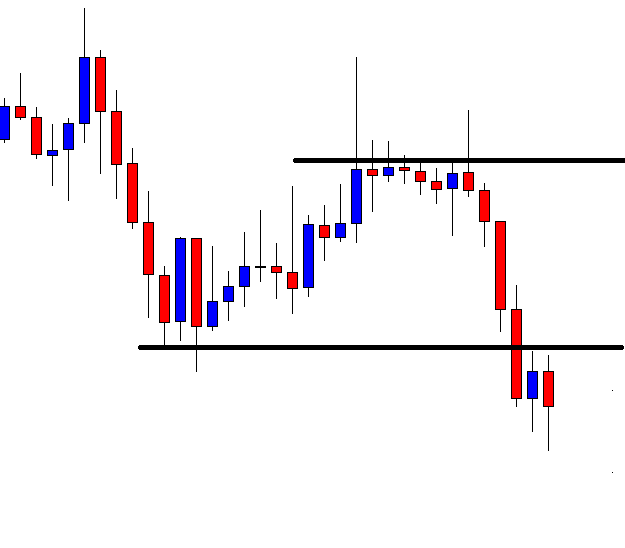
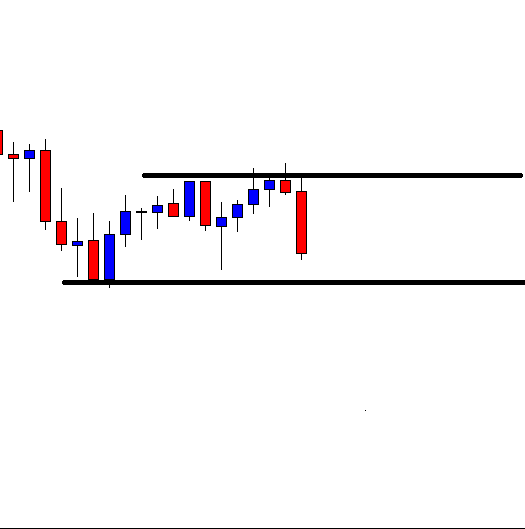
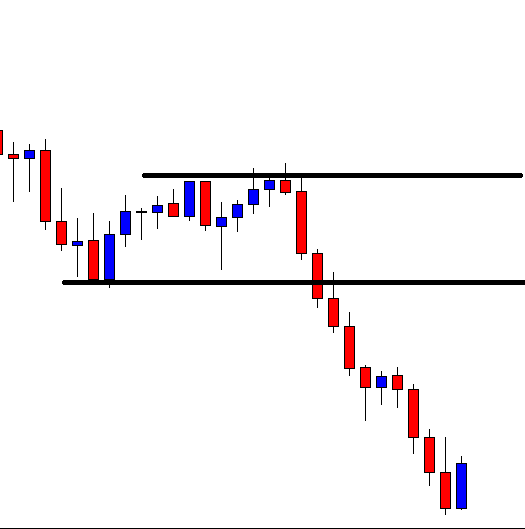
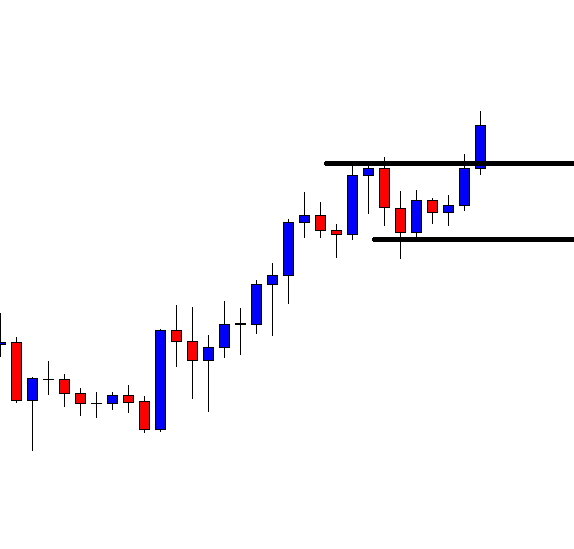
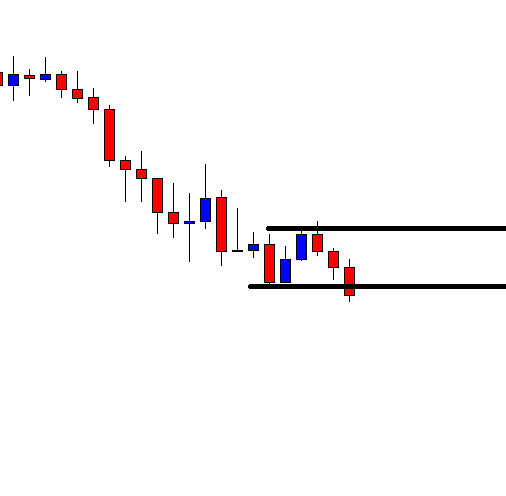
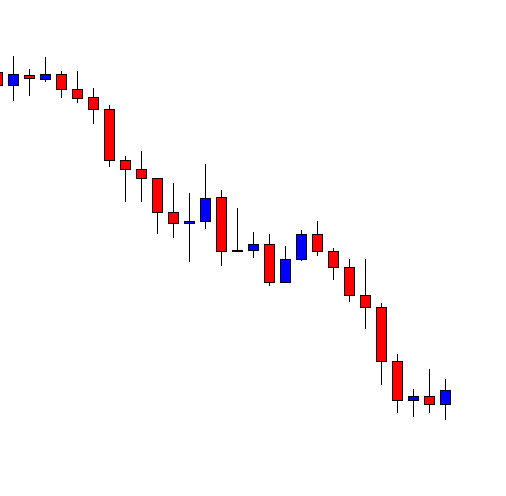
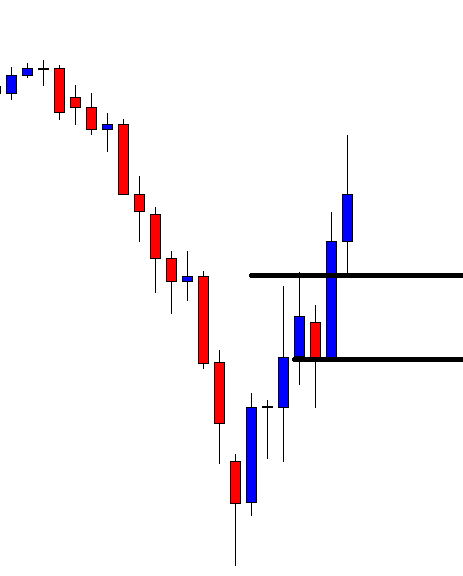
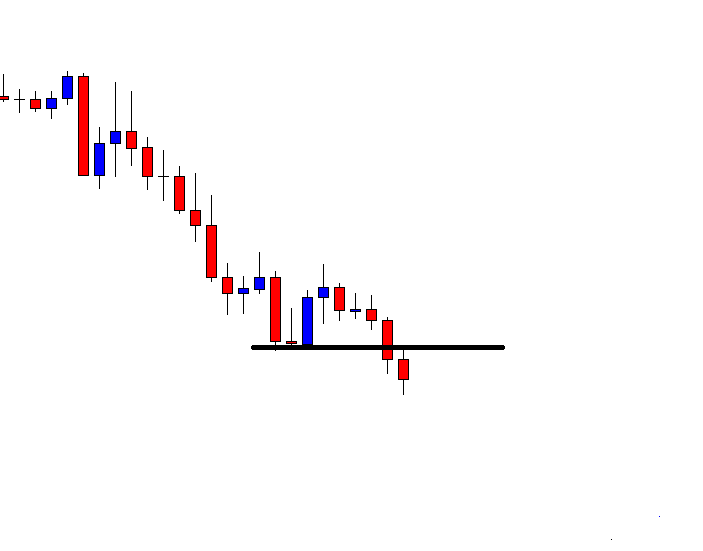
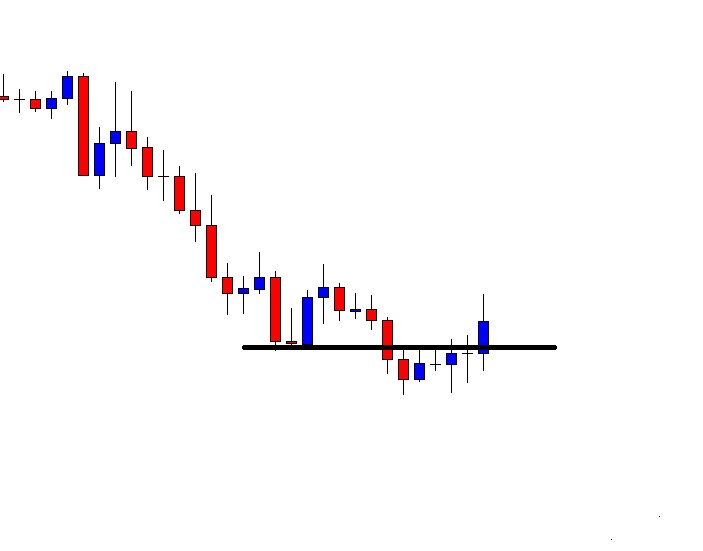
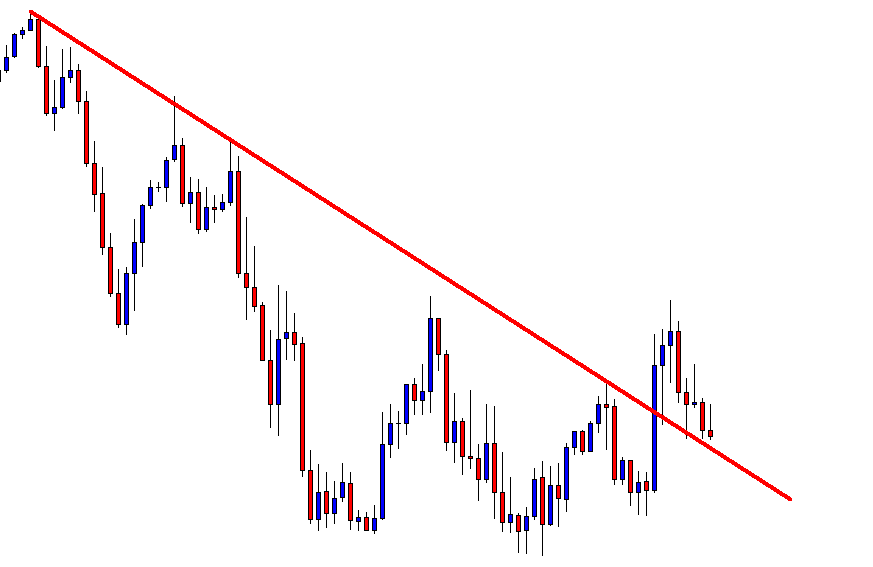
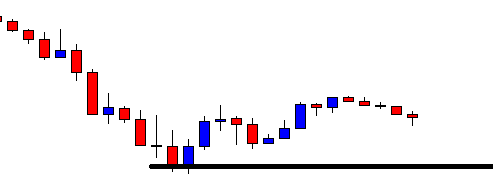
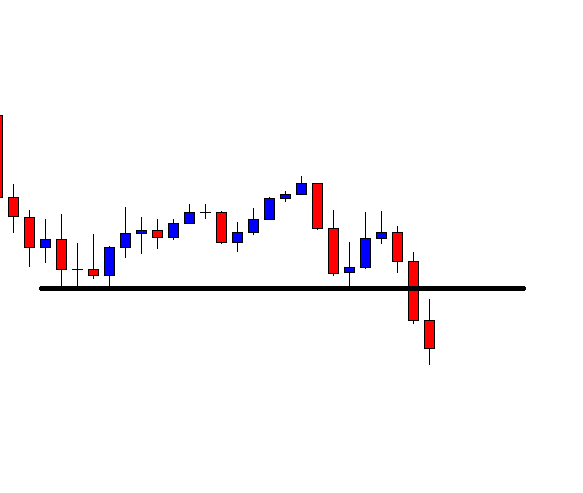
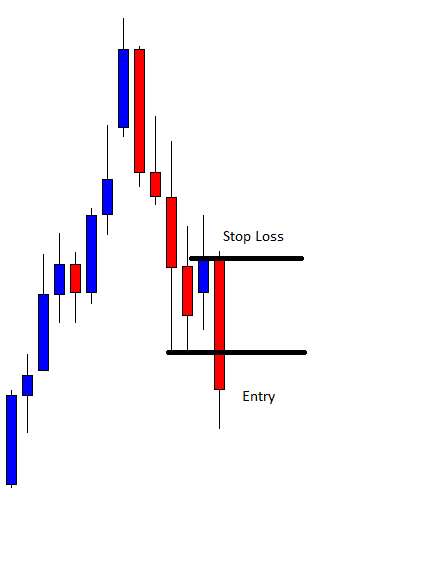
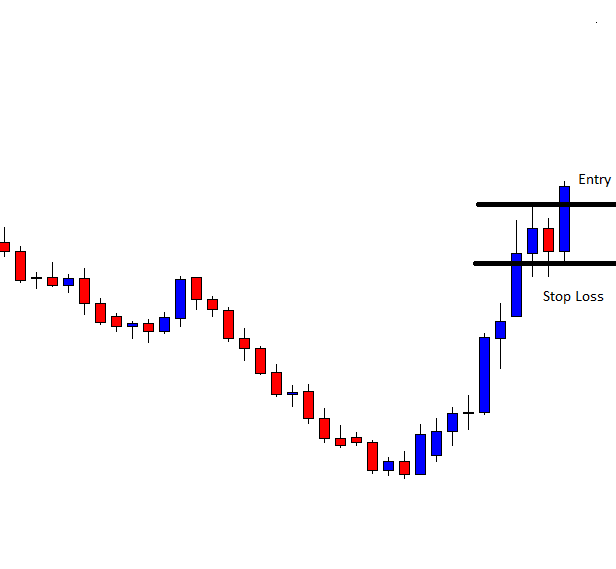
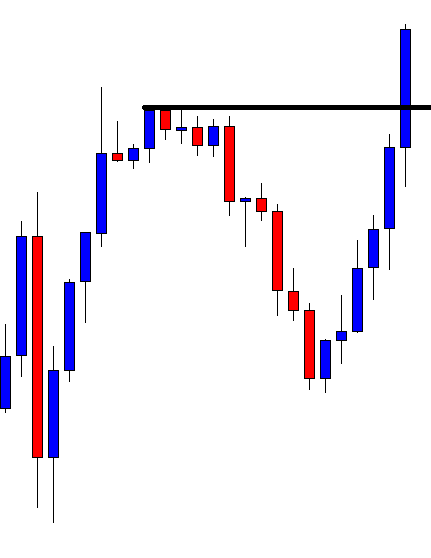
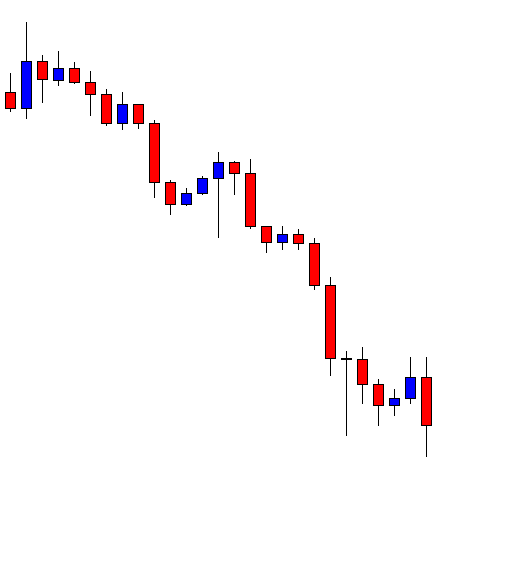
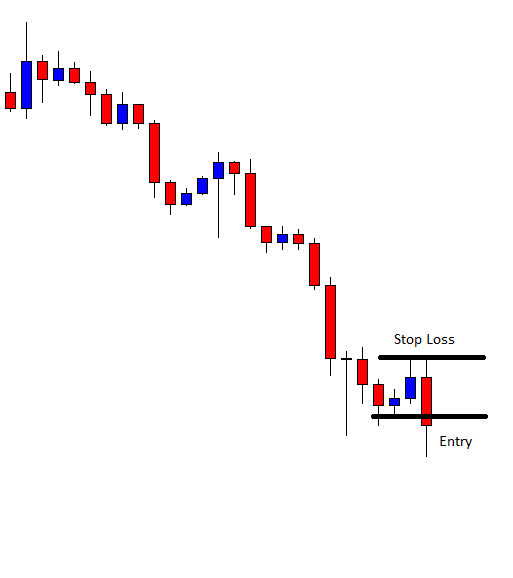
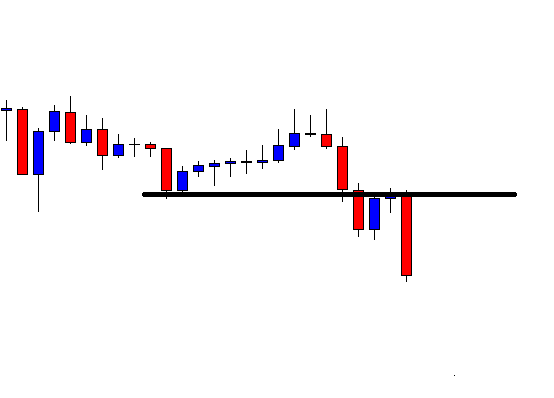
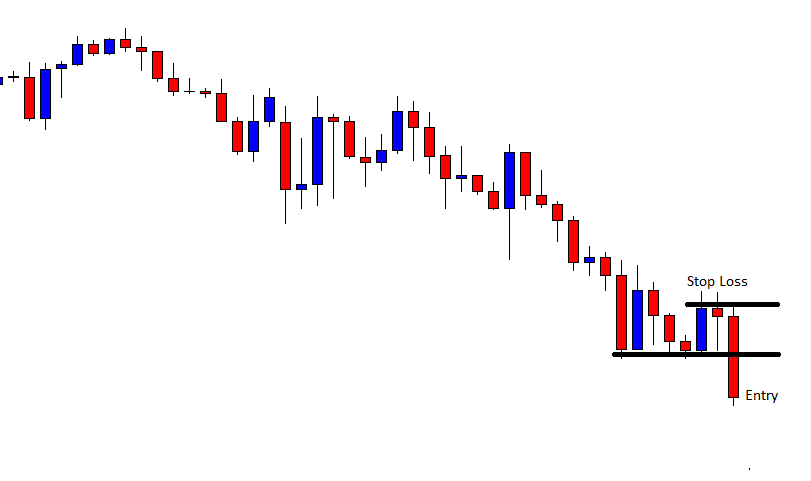
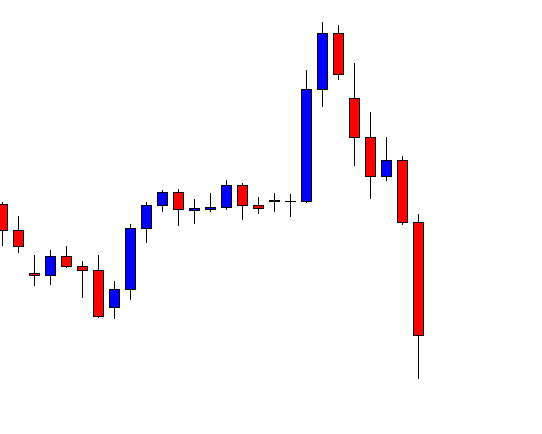
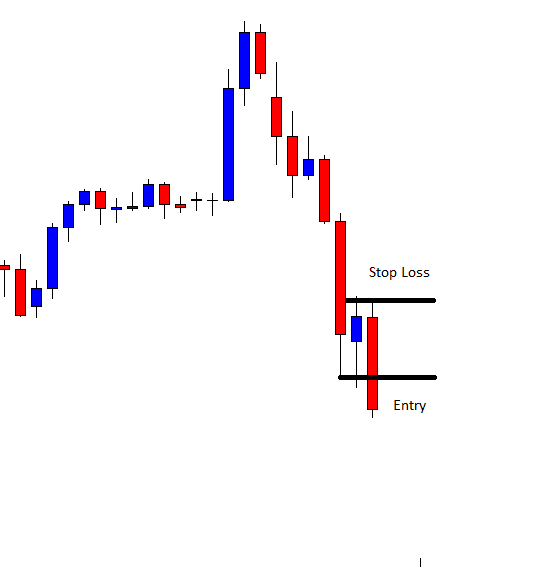
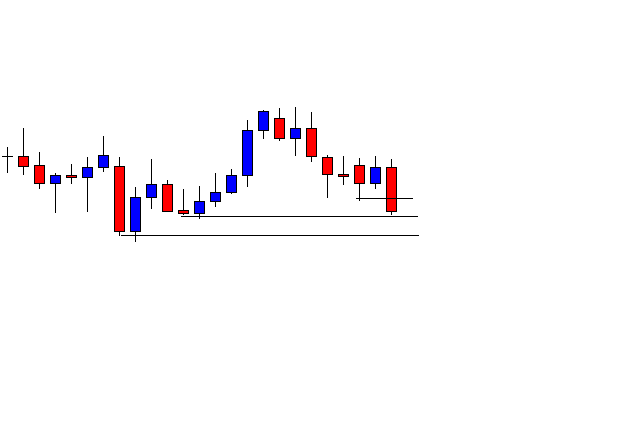
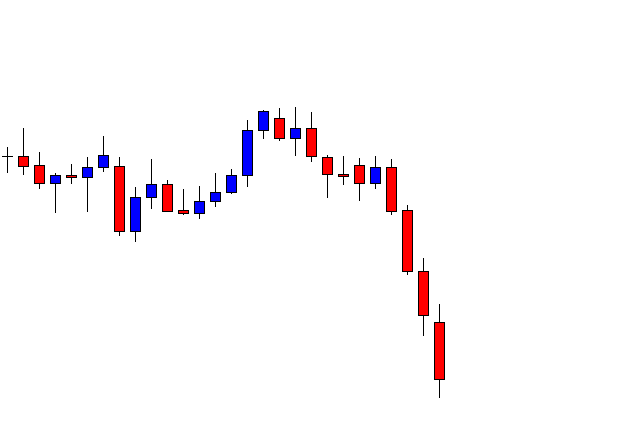
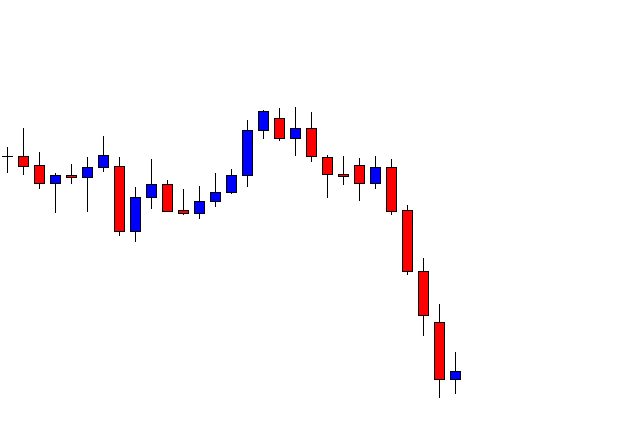
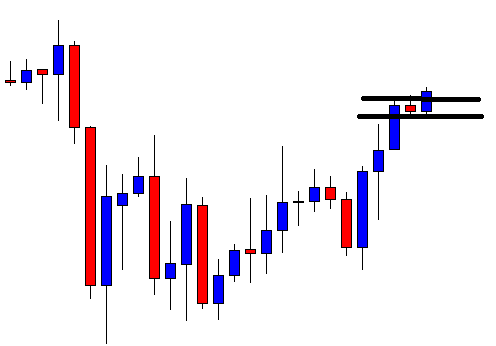
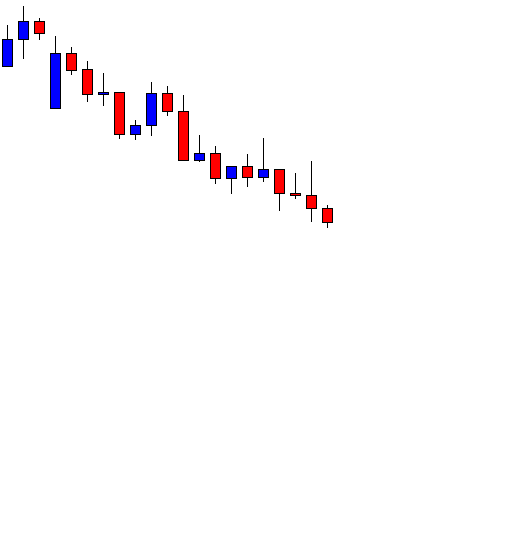
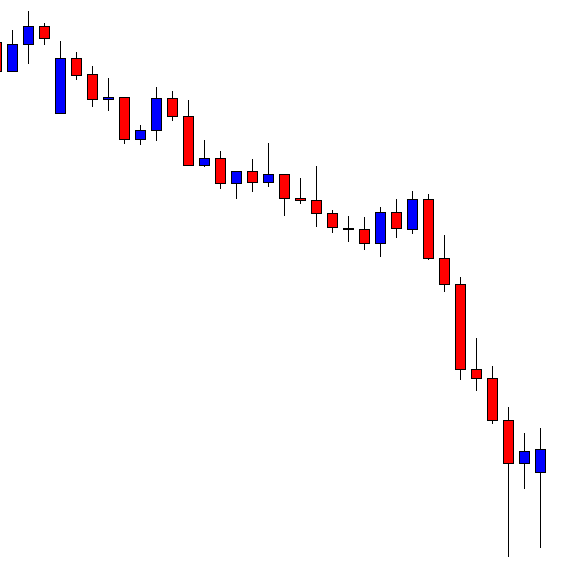
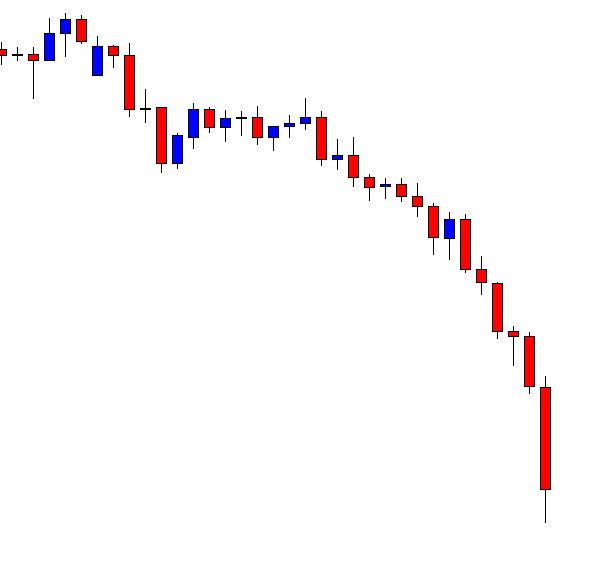
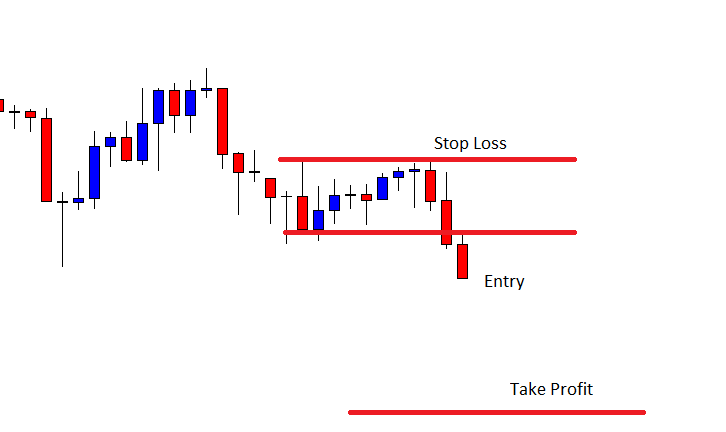
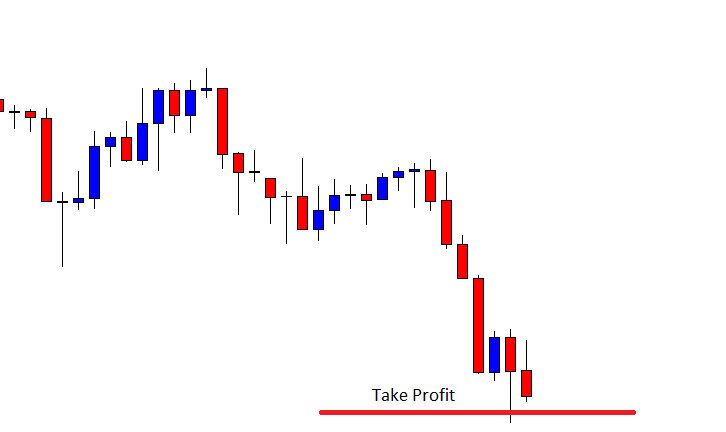
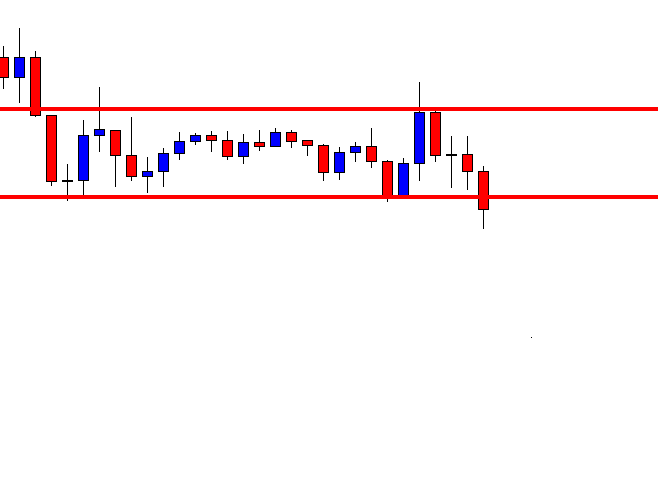
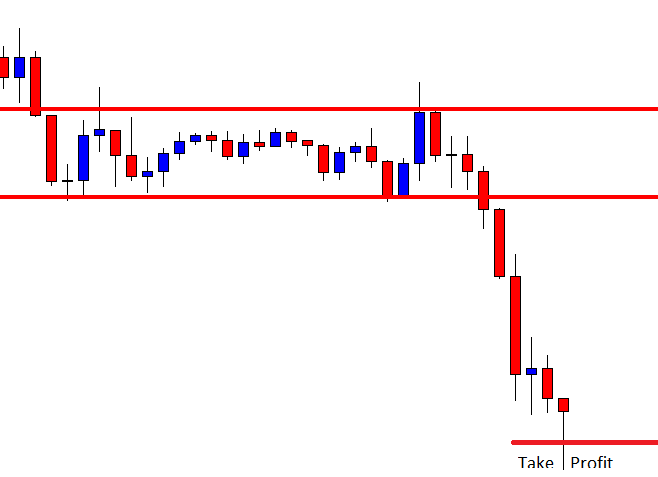
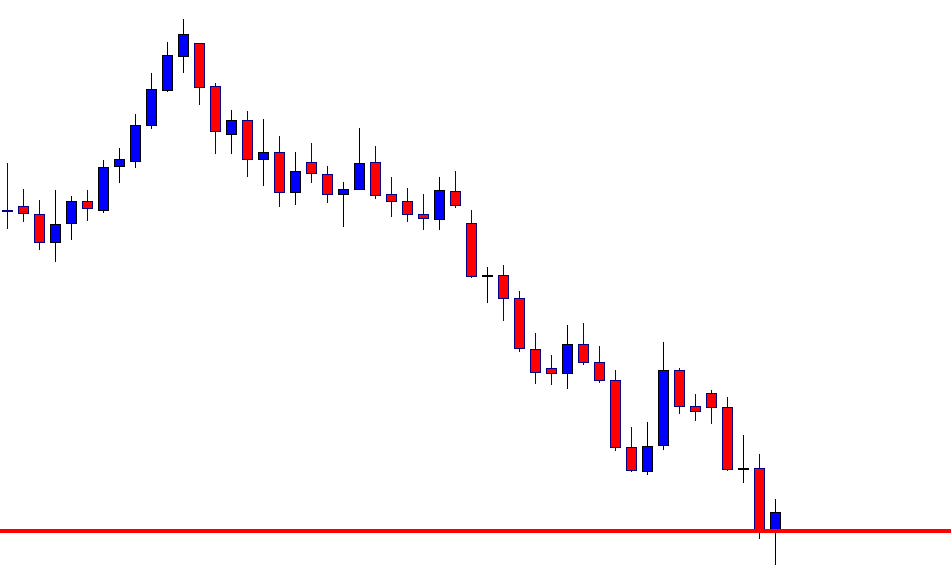
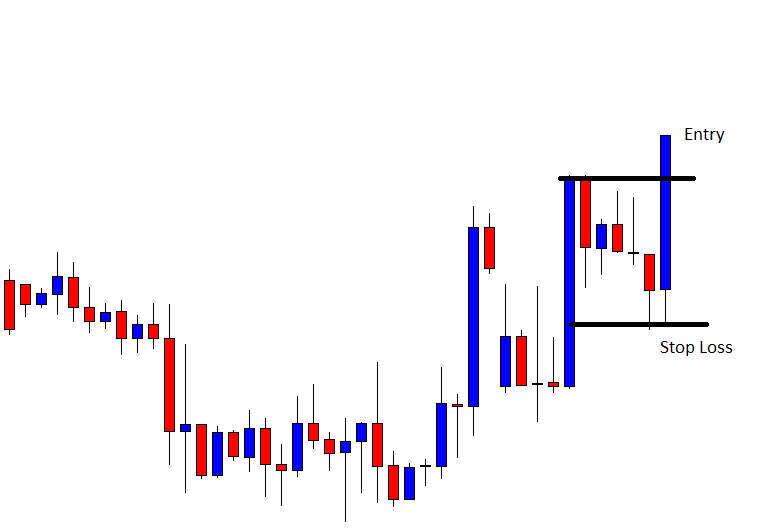
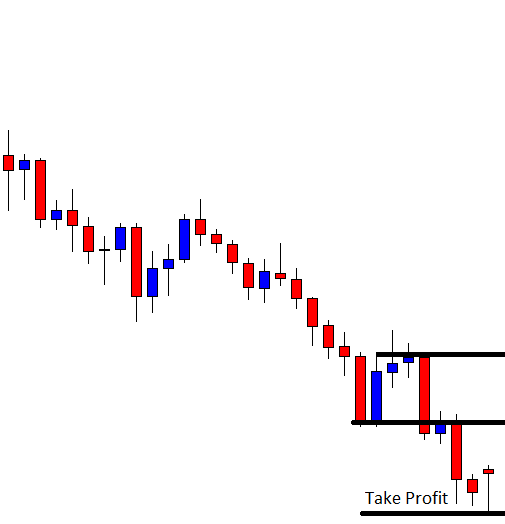
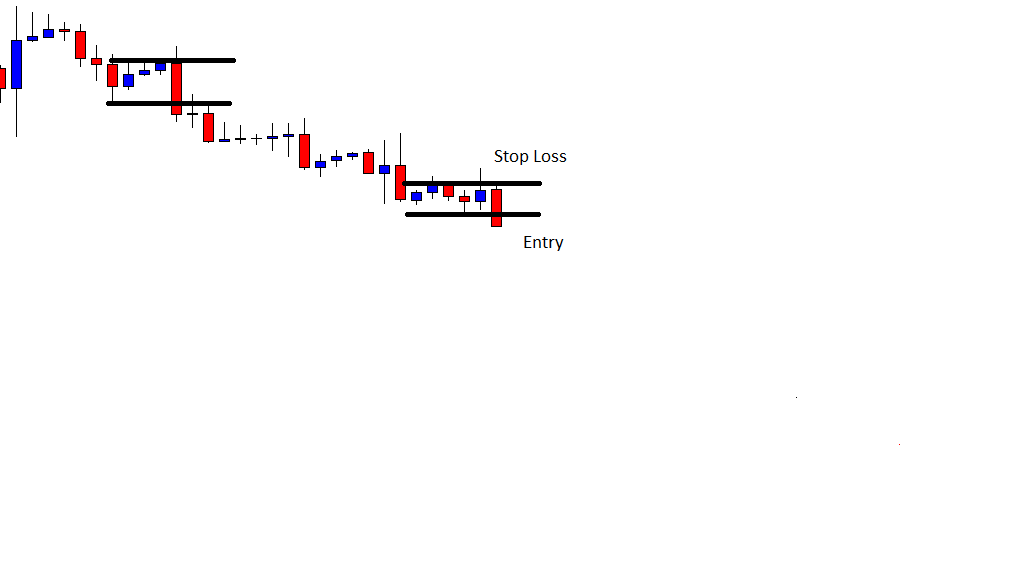
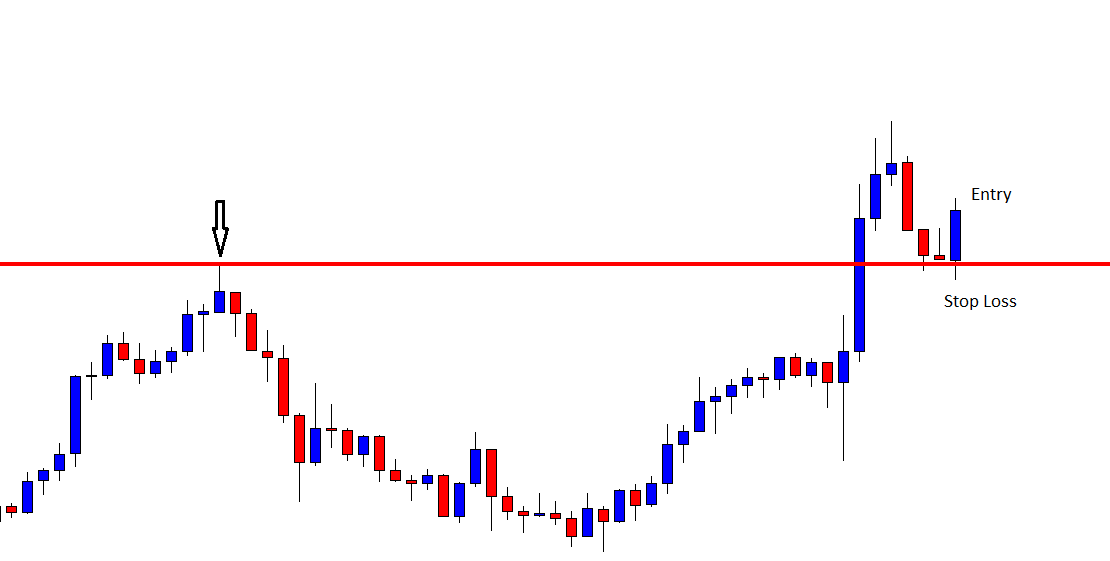
The chart produces another bearish candle and makes a breakout at the wave’s lowest low. The Sellers then take control of the pair and drive the price towards the South at an extreme pace. The last candle on this chart comes out as an inverted hammer. It suggests that the price may keep heading towards the South. However, do not forget that the chart produces a bullish Pin Bar as well, and the last candle closes within the level of support where the Pin Bar bounces off.
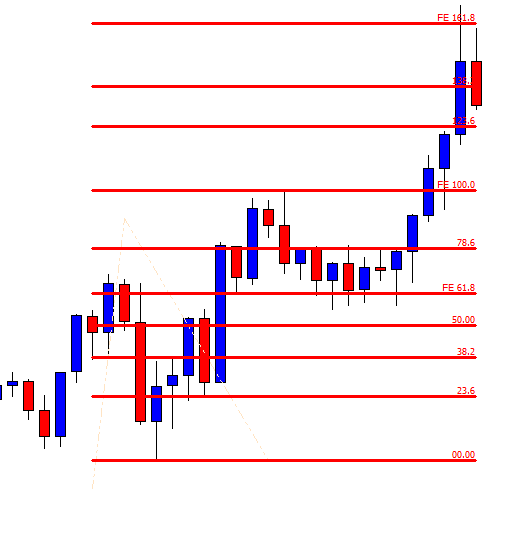
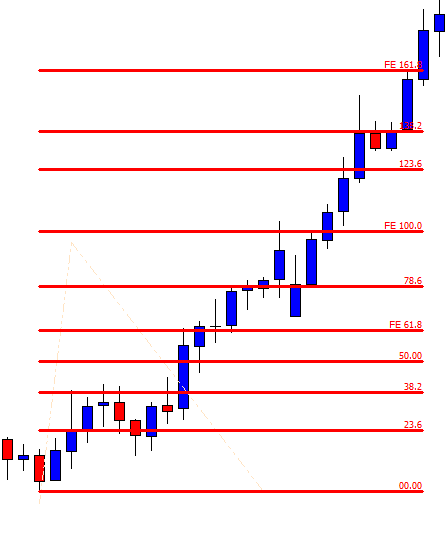
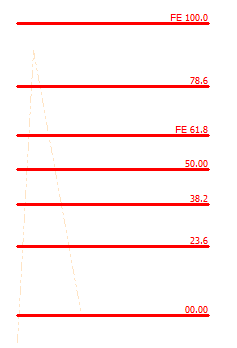
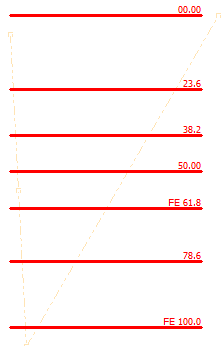
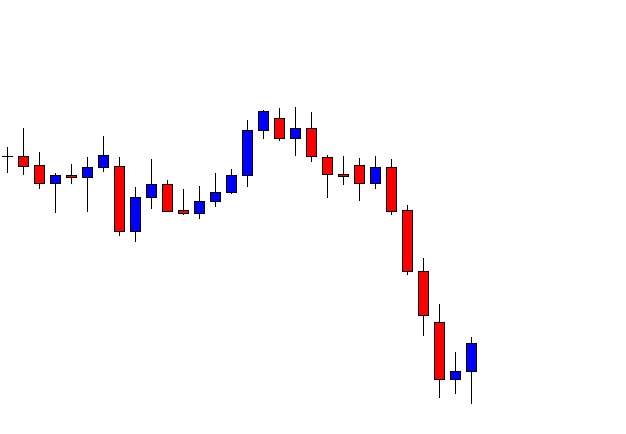
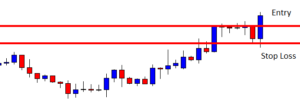
Anyway, let’s draw the Fibonacci level on the chart and see how the price reacts to some levels.
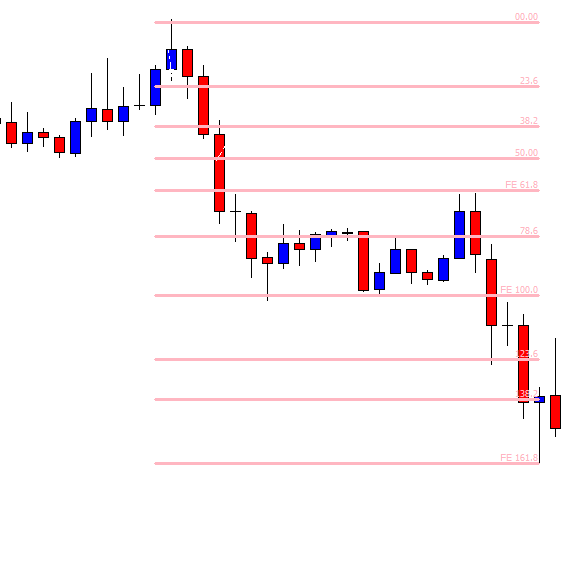
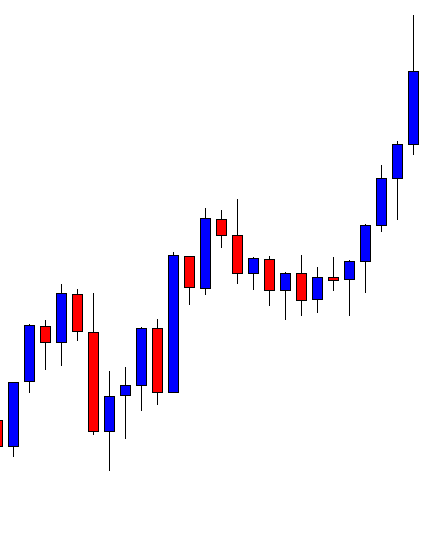
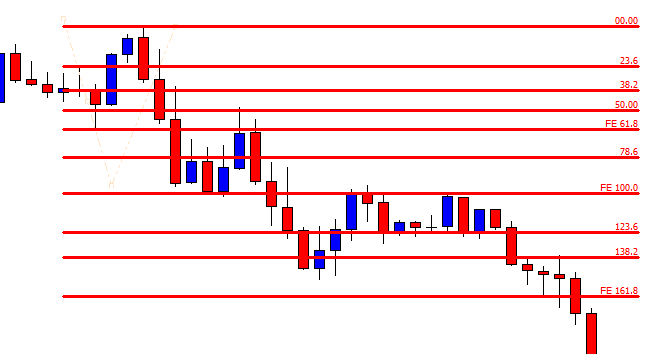
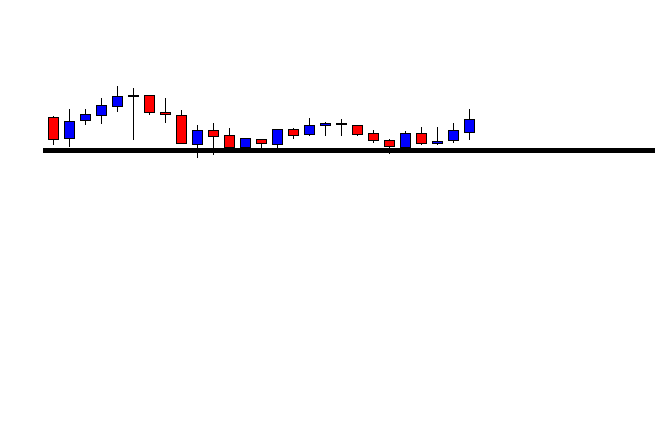
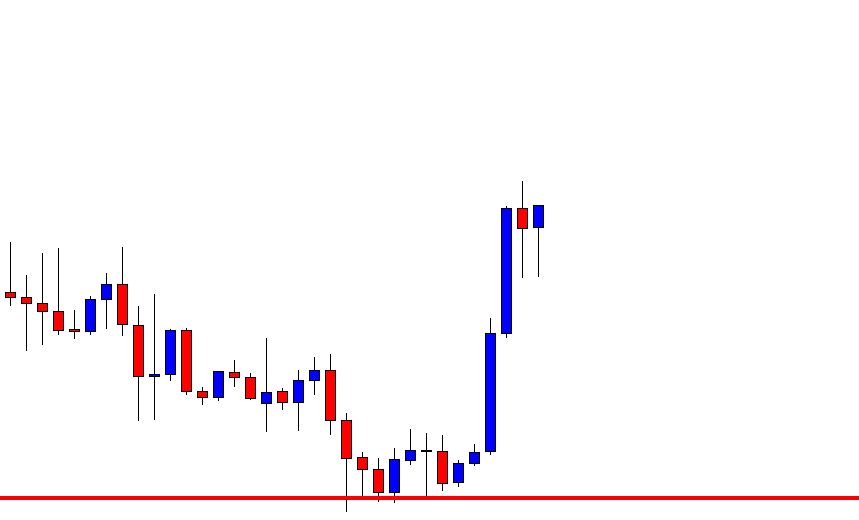
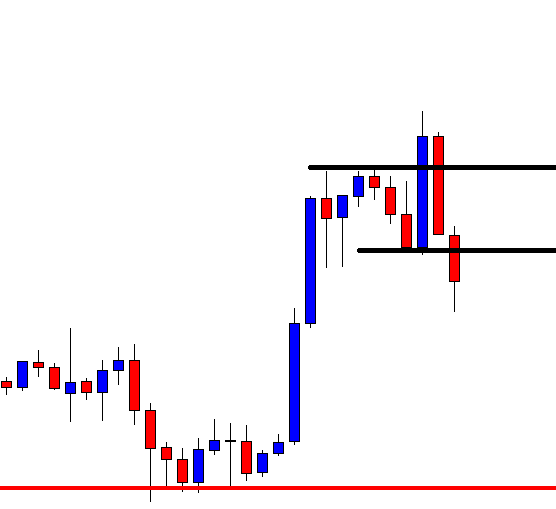
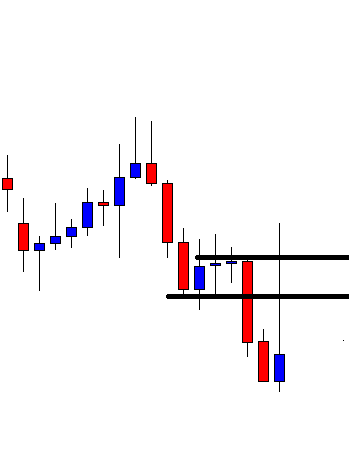
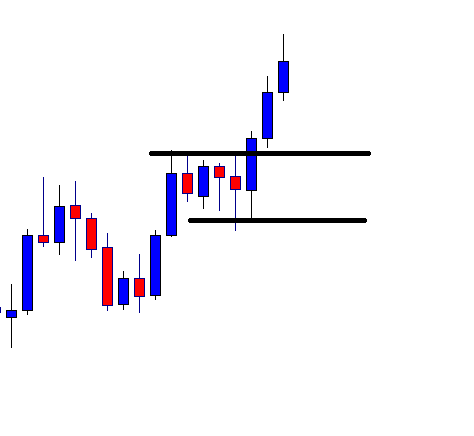
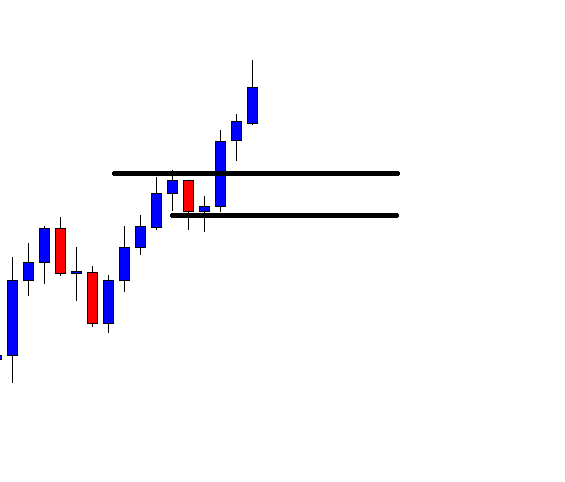
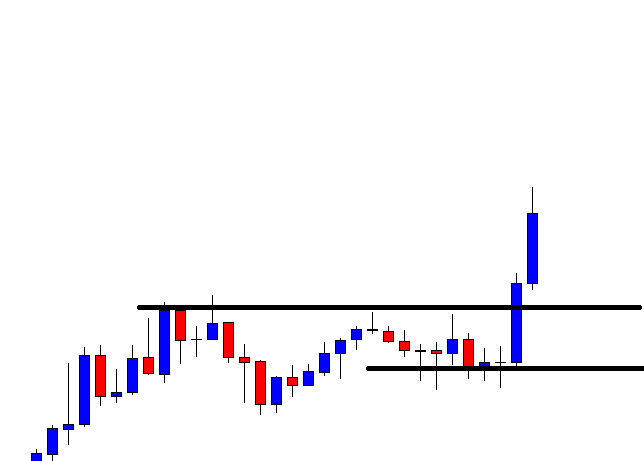
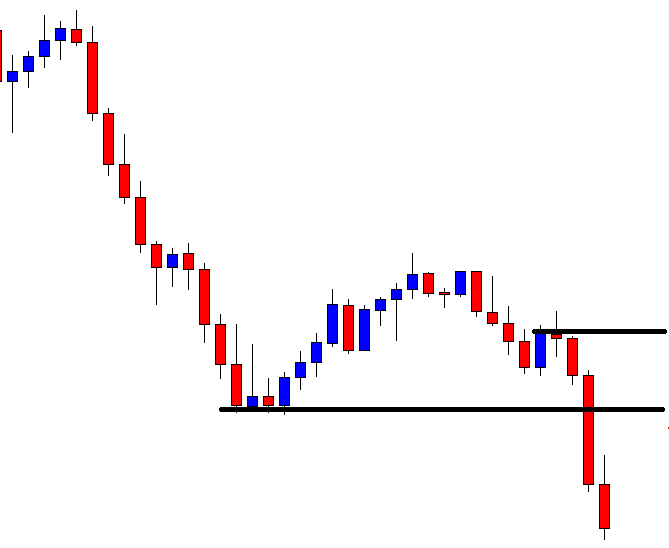
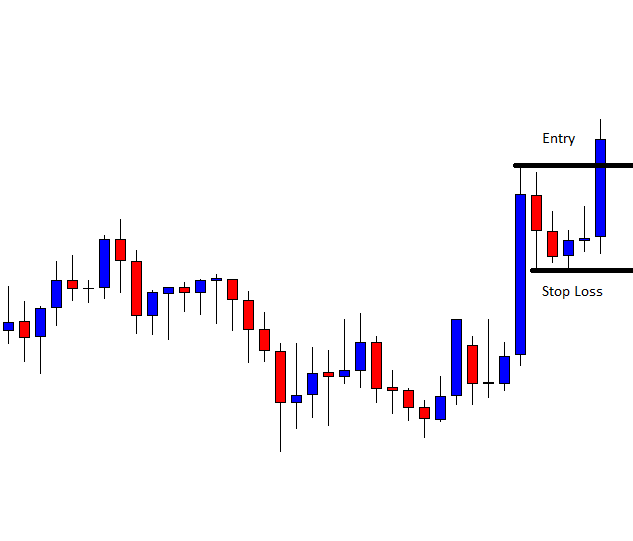
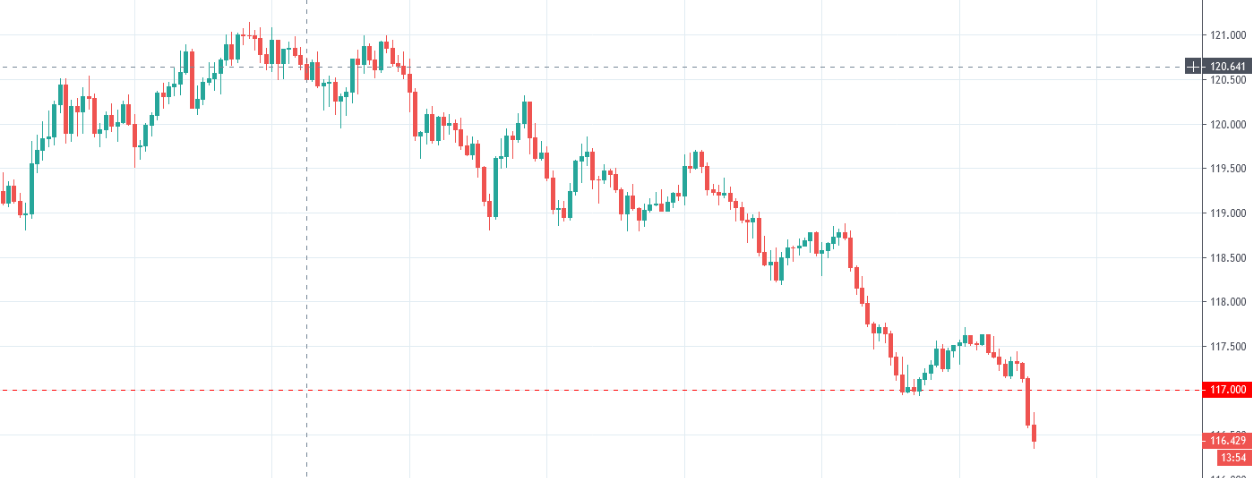
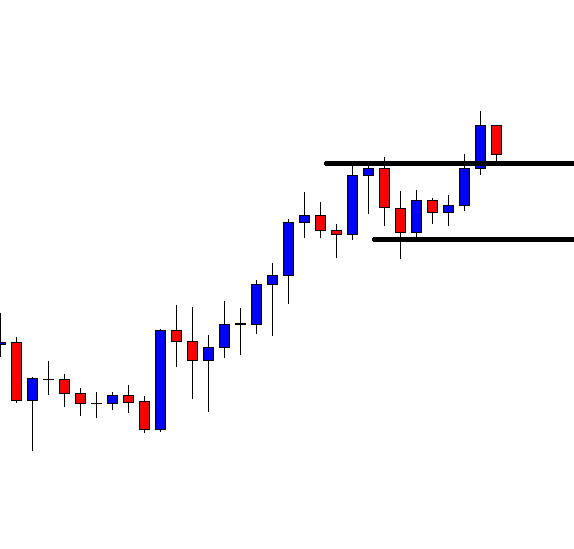
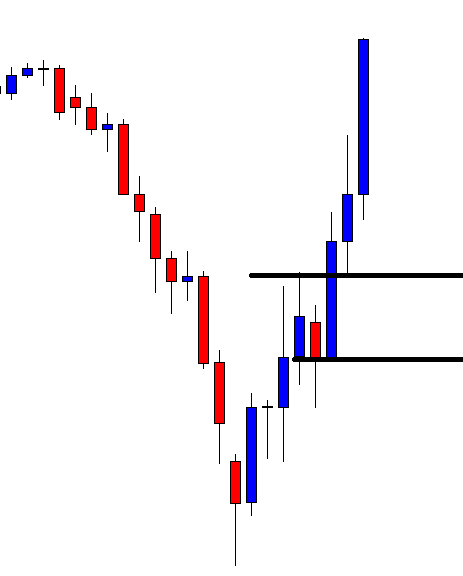
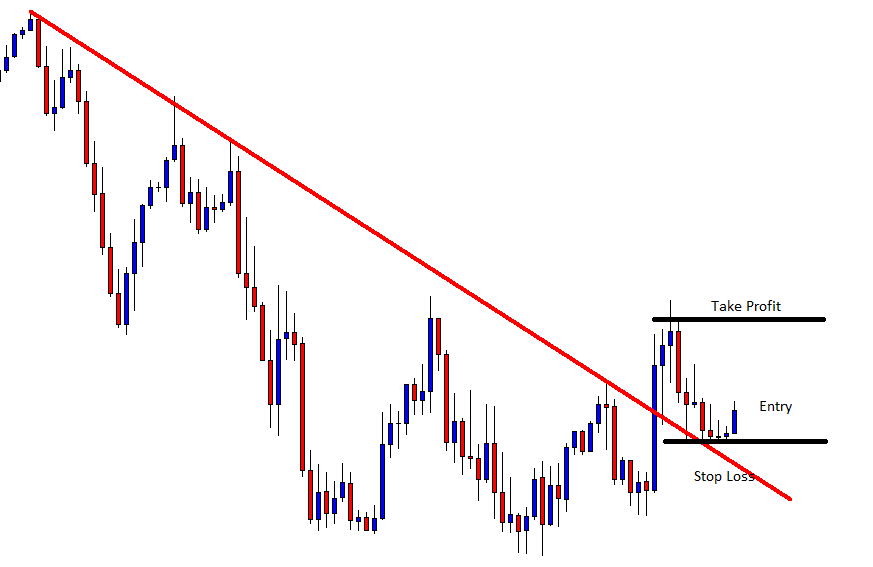
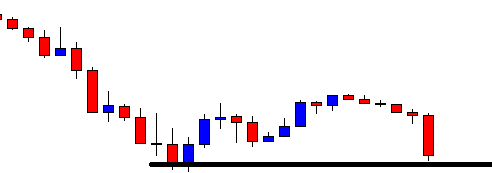
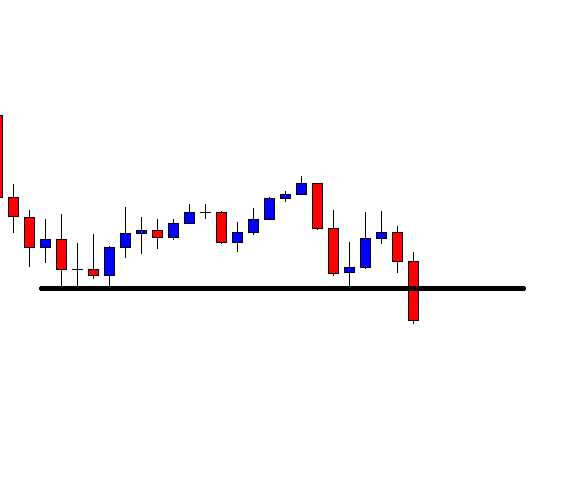
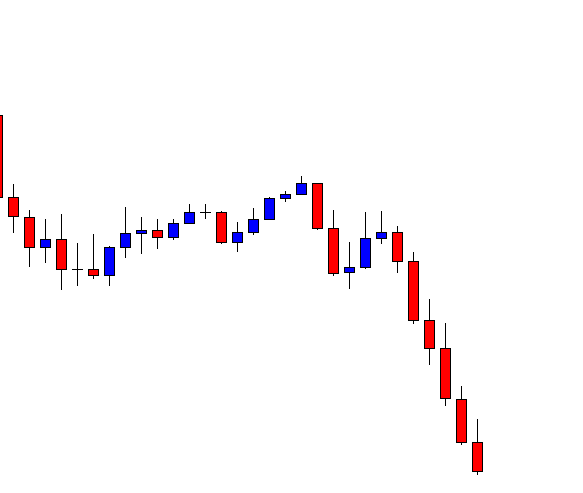
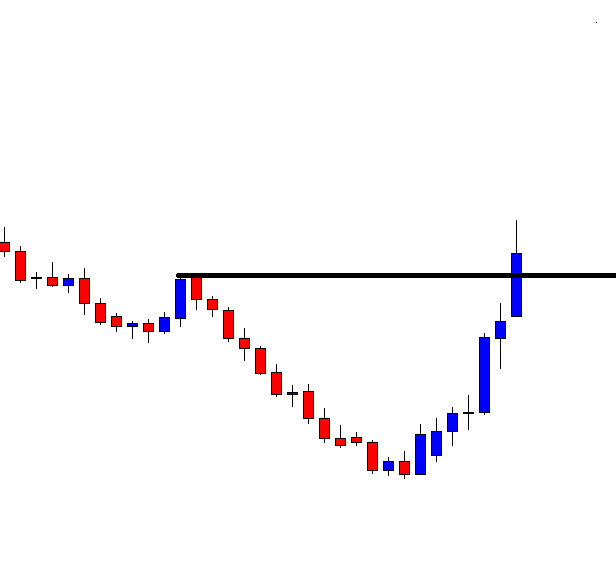
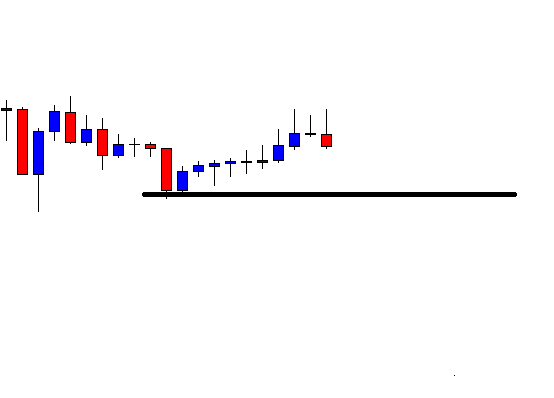
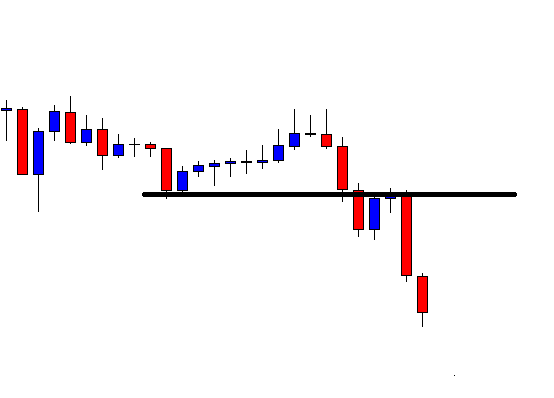
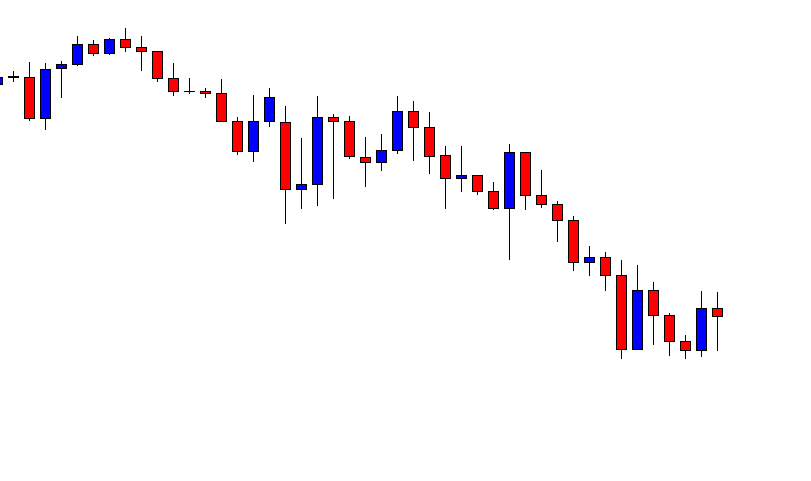
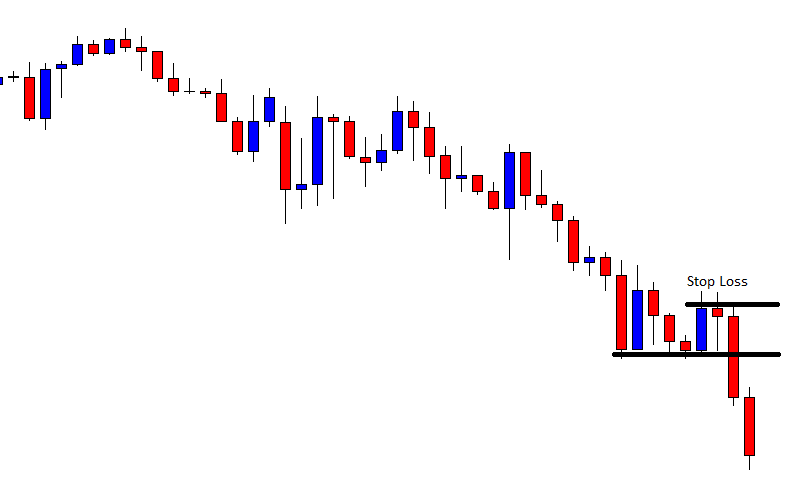
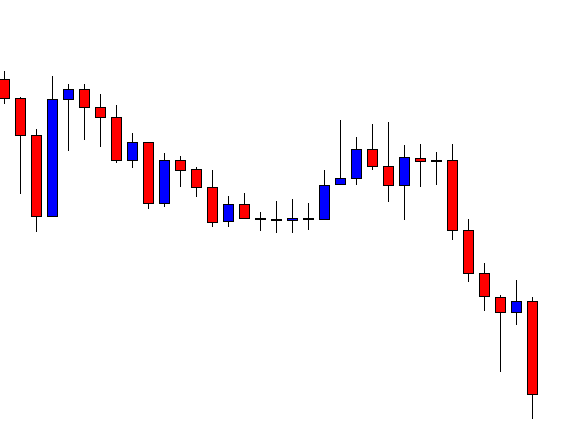
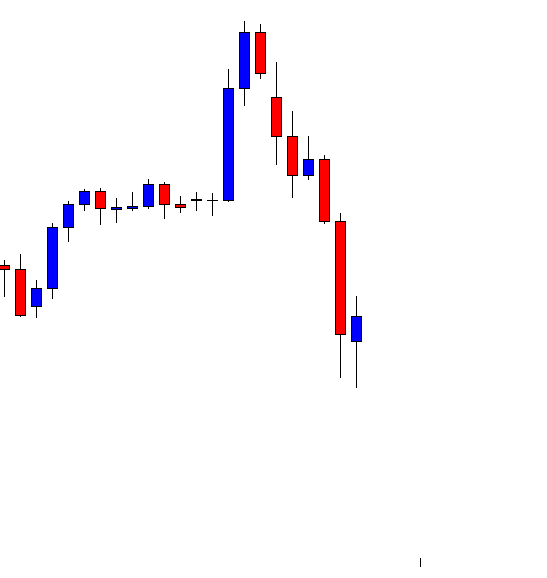
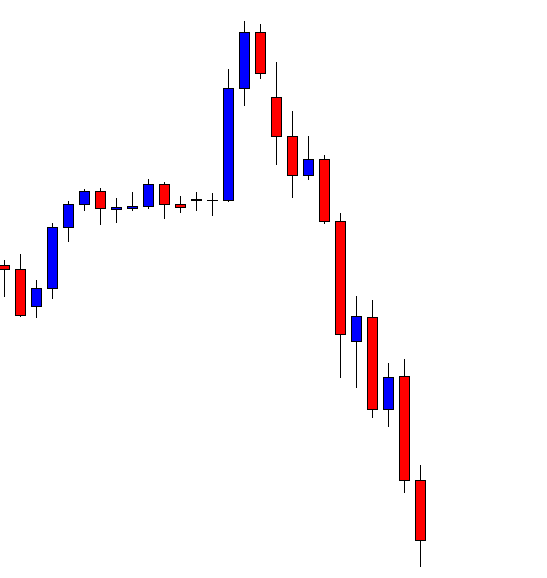
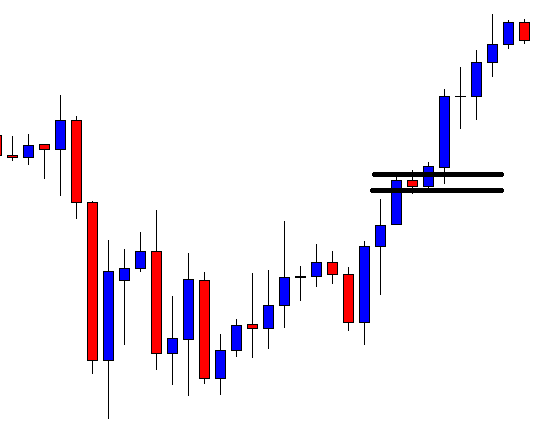
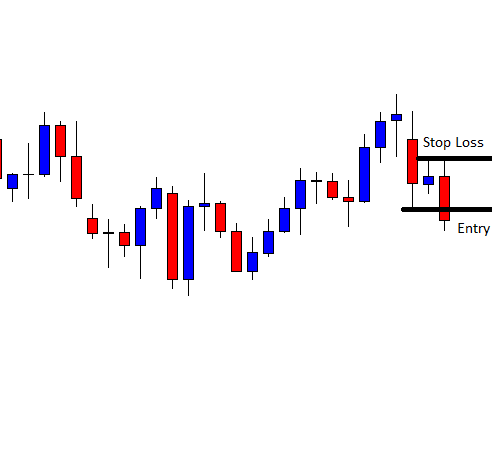
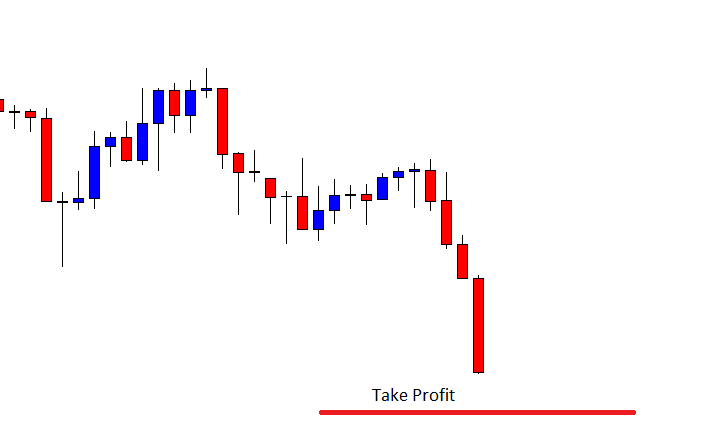
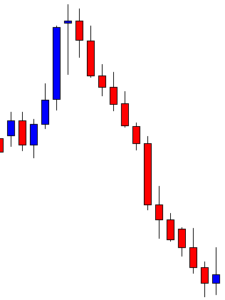
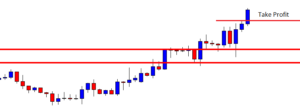
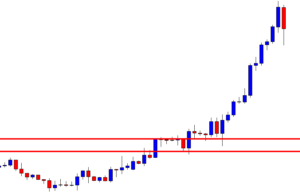
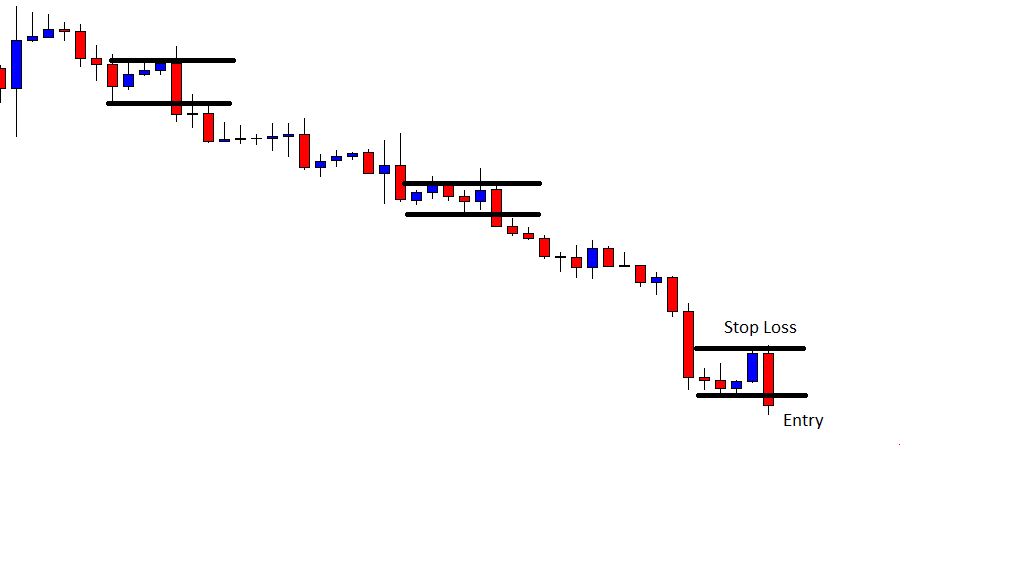
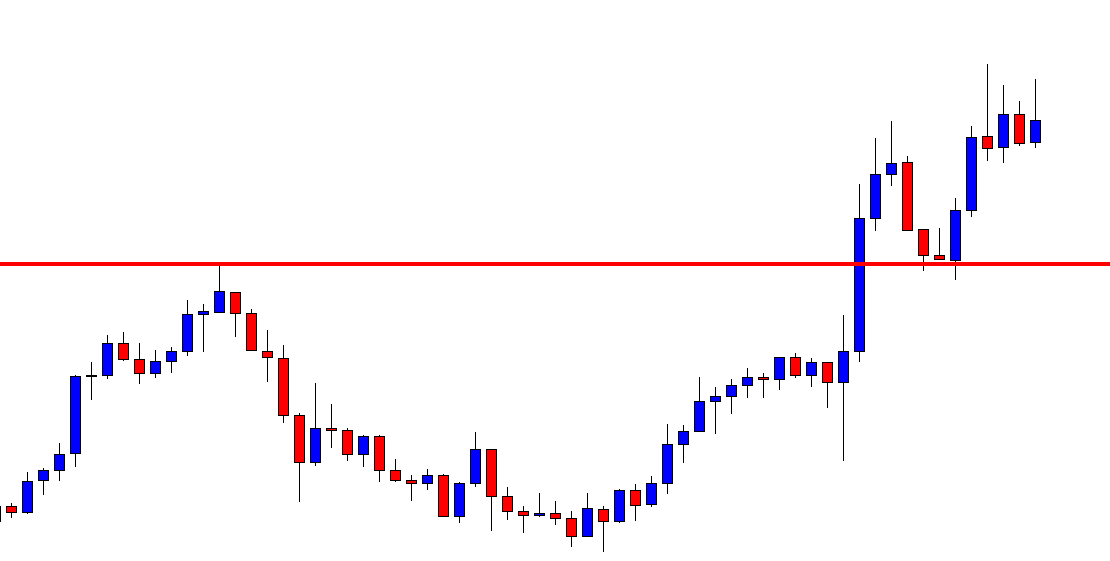
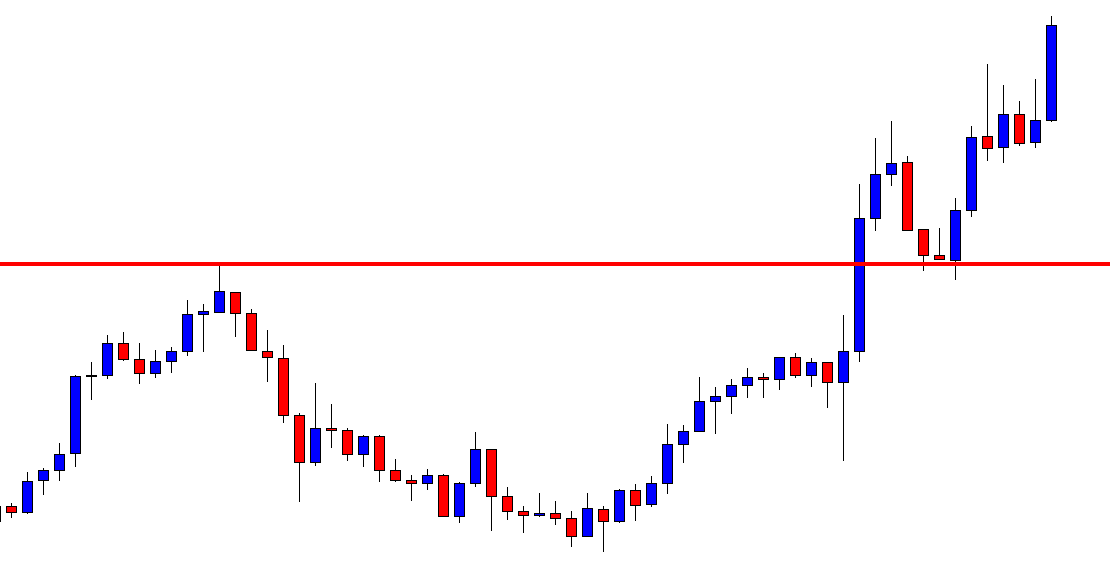
The chart gives us a clearer picture. At first, the price produces the bearish reversal candle at 78.6. The asset does not make a breakout. Instead, it goes towards the North and finds its resistance at 61.8. The level produces a bearish reversal candle followed by a breakout at the wave’s lowest low. The price then hits 161.8 level with ease.
If the price makes a breakout by trending from 78.6, it may not hit 161.8 level. The price usually reverses at 138.2 if it trends from 78.6. Stay tuned. We are going to study with some live examples on this soon.