In today’s lesson, we are going to show an example of a trade setup, which tests our psychology and ask us a big question. This situation is something that often happens with traders trading on the major pairs. We try to find out the answer to what we shall do in such a situation.
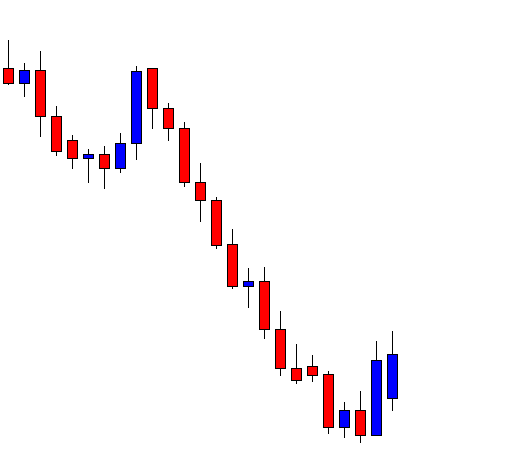
This is a daily chart. The price finds its support after being bearish for a long time. It produces a bullish engulfing pattern followed by another bullish candle. Using the daily-H4 combination, traders shall flip over to the H4 chart to get consolidation and a bullish reversal candle to go long above the last swing high. Let us flip over to the H4 chart.
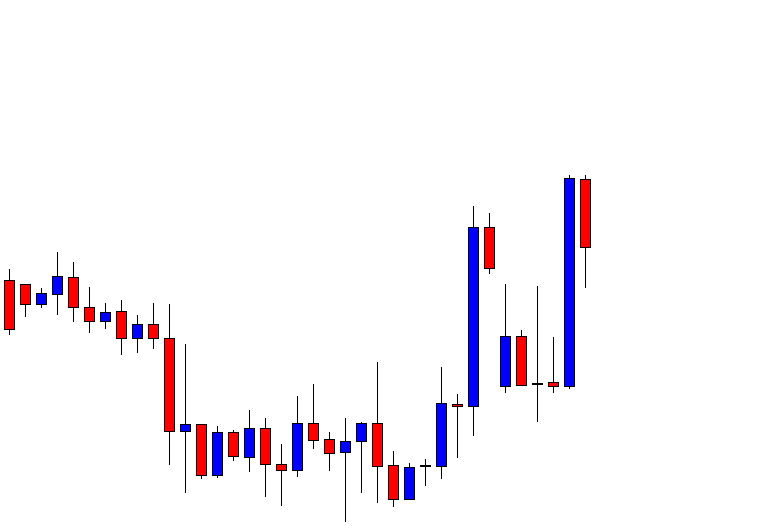
The H4 chart suggests that the buyers may take control soon. A massive bullish engulfing candle followed by an inside bar bearish candle may attract the buyers to go long upon getting another bullish engulfing candle. The buyers are to keep their eyes on this chart since the chart may produce the signal candle anytime.
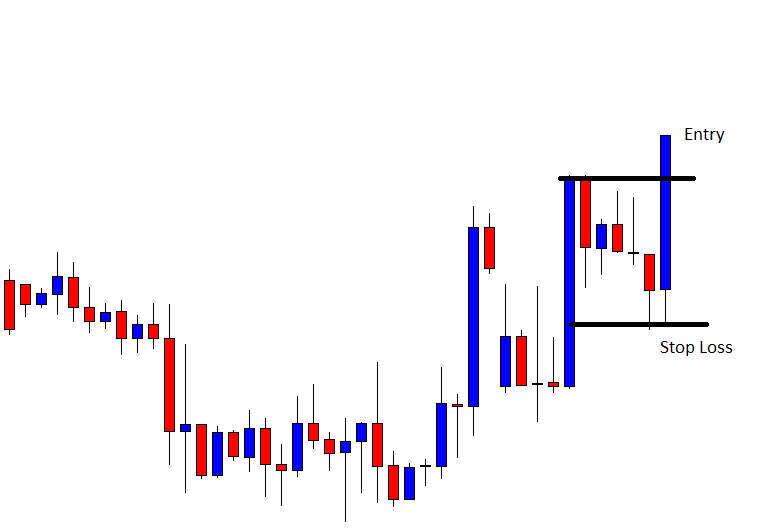
It does not produce the signal candle immediately. However, after a while, it produces a bullish engulfing candle closing above the last swing high. This is an A+ trade setup as far as the daily-H4 chart combination trading is concerned. The price makes a deep consolidation and produces the signal candle afterwards. This is what breakout traders love to see. A long entry may be triggered right after the last candle closes. Let us proceed to the next chart to find out what happens afterwards.

This must be painful for the buyers. The trade setup looks very good, but things have not been going as expected. The price comes back within the consolidation zone. This looks ominous for the buyers. Since this is an H4 chart, the buyers have the opportunity to look after their trade. They may ask themselves whether they should keep the entry or close it manually? I let you think about it for a minute.
If your answer is the buyers shall close the trade manually, you may not be right. The reason behind this is, once a trade is floating on a loss, traders shall leave it and let it finds its own way. If it hits the stop loss, let it hit it. Traders are to calculate this risk well before they take entry. If a trade is running on profit but acts unusual or gets sluggish at a significant level of support/resistance, that might be a different case. Although the chart suggests that most probably, the price is going to hit stop loss, the buyers shall hold the entry and concentrate on other pairs. If a trader wants to survive in this market for a long time, he must acquire this skill of getting over on a floating losing entry and concentrating on a new trade setup.