The ABC pattern is one of the traders’ favorite trading patterns for its lucrative risk-reward. It usually offers at least 1:2 risk-reward. In many cases, it offers even more. However, the price may sometimes find it hard to make a breakout at point B. That is where the ABC pattern traders must be patient and hold their nerves while trading on the minor charts. However, with major charts, it is a bit different. In today’s lesson, we are going to demonstrate an example of the ABC pattern trading on a minor chart.
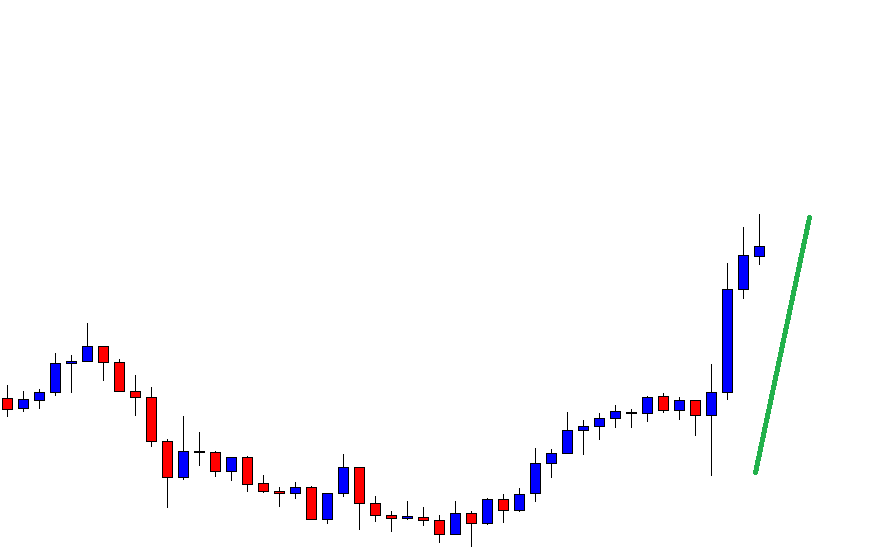
This is an H1 chart. The price heads towards the North with good bullish momentum after having consolidation for a long time. The ABC pattern traders are to wait for the price to make a downside correction and produce a bullish reversal candle at C point.
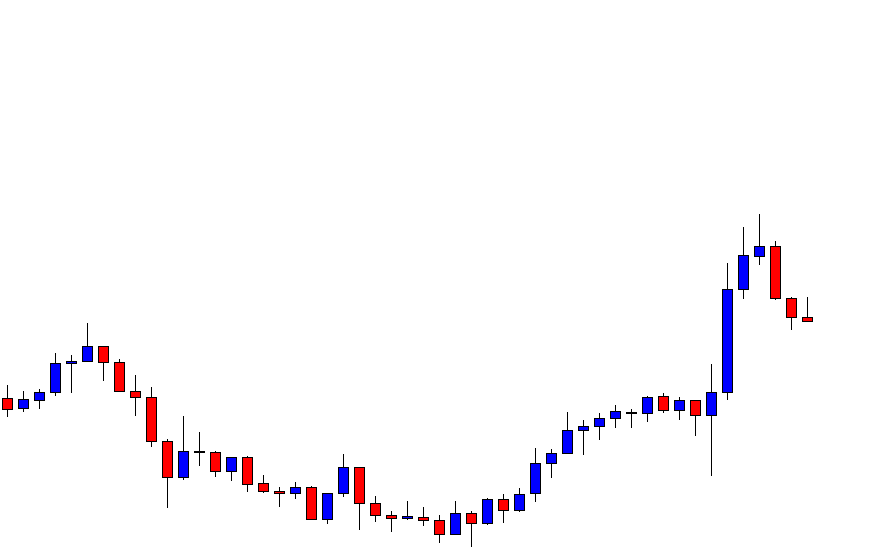
The price has been on a downside correction. It produces three consecutive bearish candles. The ABC pattern buyers shall keep their close eyes on the chart to get a bullish reversal candle.

The chart produces a bullish engulfing candle. This is an A+ bullish reversal candle. The ABC pattern traders have some drawing work to do before the price produces a reversal candle. We find this out in a minute. Can you guess where the chart produces the bullish reversal candle? Have a look at the chart below.
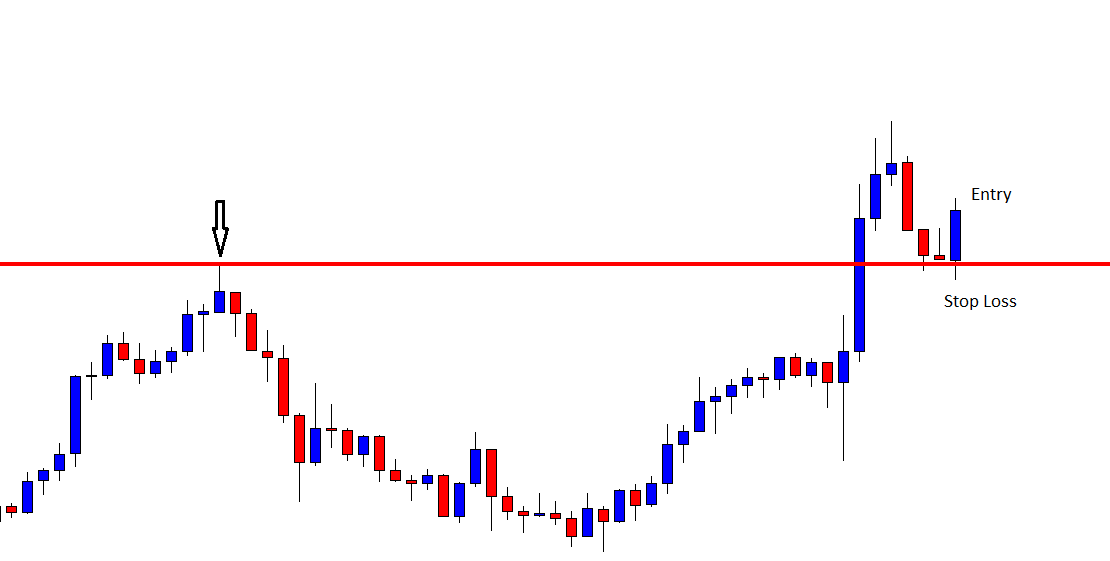
Do you notice that the price had a massive rejection at the same level earlier? The chart produces the bullish reversal candle at the flipped support. This is an ideal C point. The buyers may trigger a long entry right after the candle closes by setting stop loss below the signal candle. As mentioned, take profit may be set at least with 1:2 risk-reward.
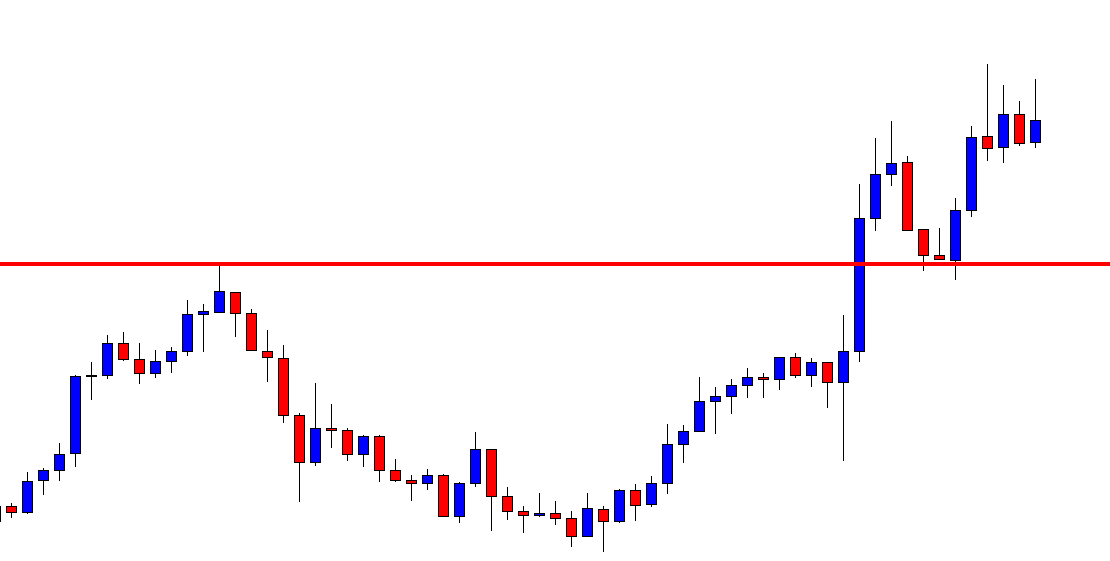
After triggering the entry, the price heads towards the North with good bullish momentum for three more candles. It then starts having consolidation around the last swing high (at point B). It often happens. The buyers must wait and hold their positions since the trade setup in on the H1 chart. The intraday ABC pattern traders must follow the rule “Set and Forget”. With the H4, the Daily, it is different though. Let us proceed to the next chart.
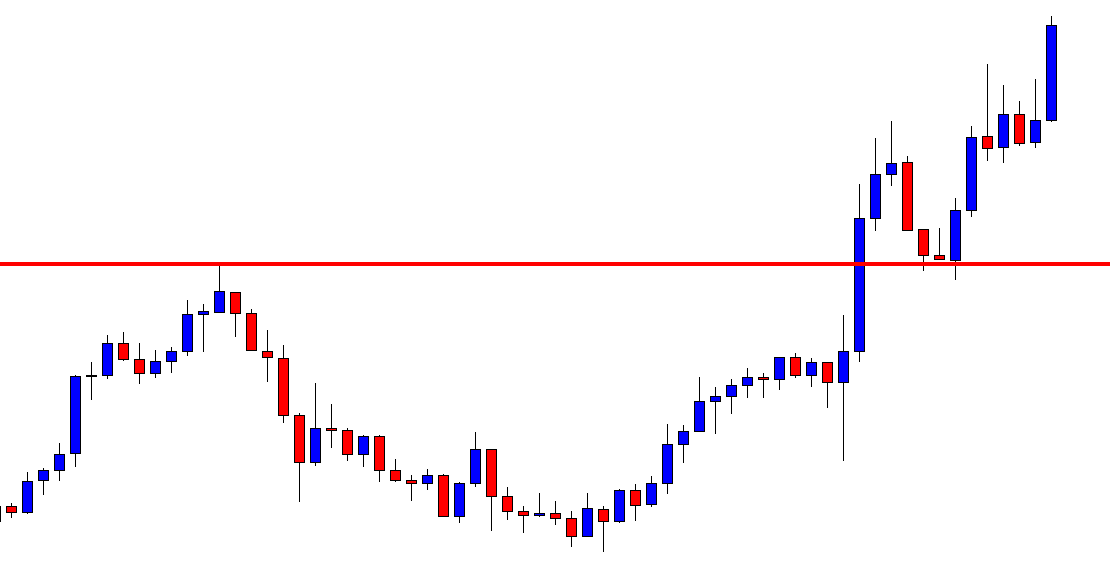
The chart produces another bullish candle and hits the target. The buyers’ have achieved their 2 R target. We must remember that when we trade on the ABC pattern, we adjust our target according to the chart. Intraday charts (5M, 15M, H1) usually makes a breakout at Point B. Thus, we let the trade run and decide its route. On the other hand, if an entry is taken on the charts such as the H4 and the daily based on the ABC pattern, we may consider taking at least 50% profit at Point B. This is where a little adjustment is needed if we trade based on the ABC pattern.