Categories
Forex Daily Topic Forex Fibonacci

Fibonacci Trading: A Reversal Candle is to be Followed by a Good Signal Candle

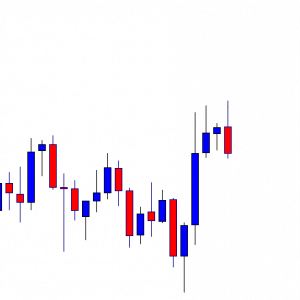
In today’s lesson, we are going to demonstrate an example of an H1-15M chart, which made a good bullish move upon producing a bullish reversal candle at a key Fibonacci level. The H1 chart produces an H1 bullish engulfing candle earlier, but the price does not head towards the North. It takes time then produces another bullish reversal candle. It then heads towards the North with good bullish momentum. We try to find out why it does not make a bullish move at the first attempt but makes it at the second.

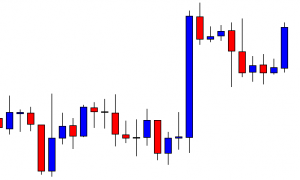
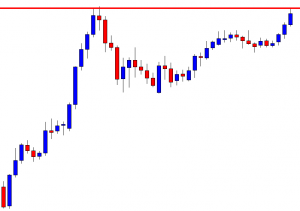
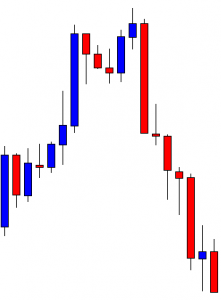
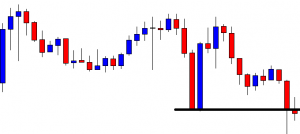
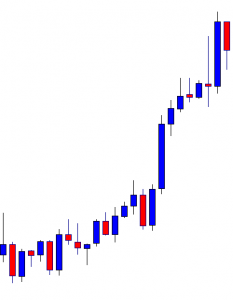
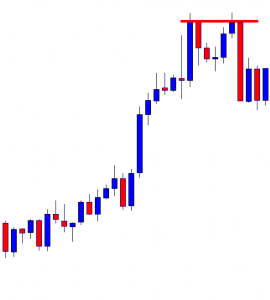
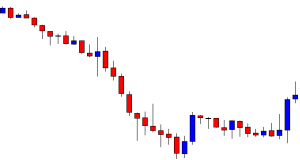
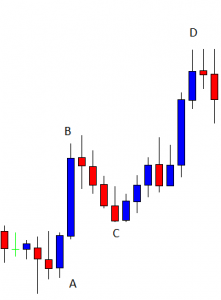
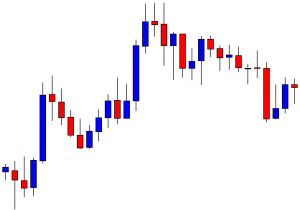
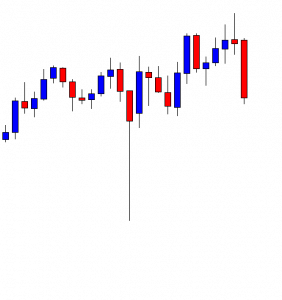
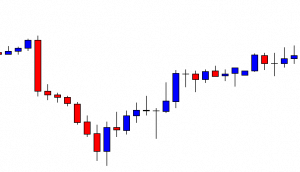
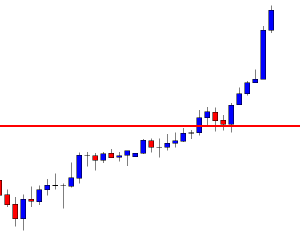
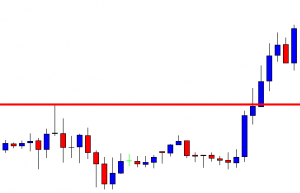
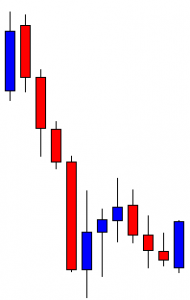
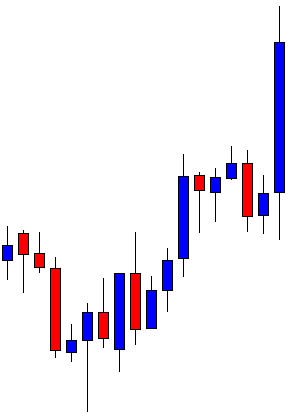
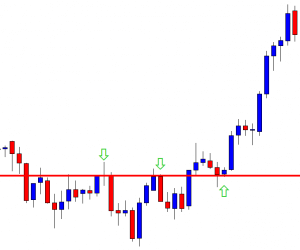
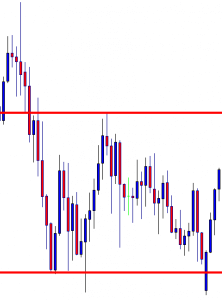
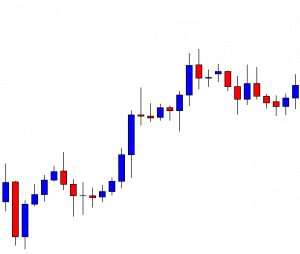
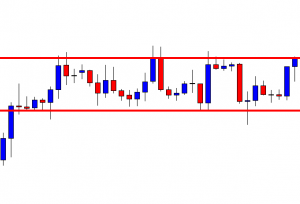
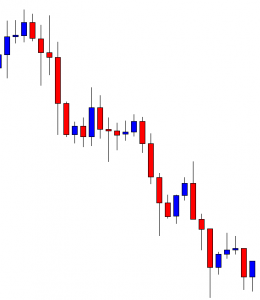
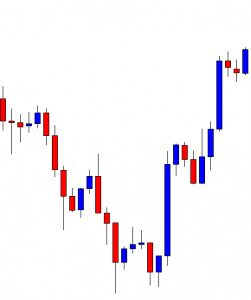
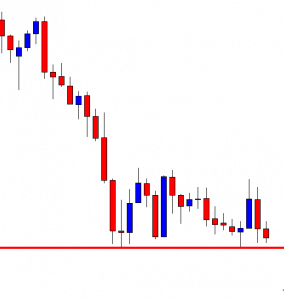
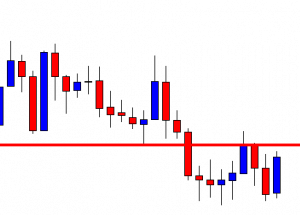
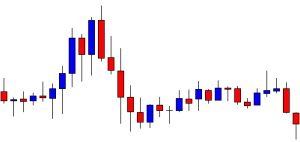
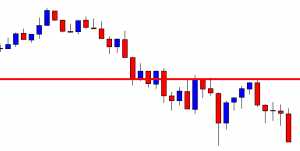
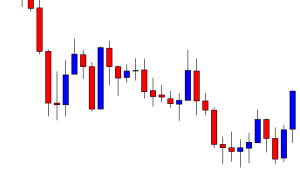
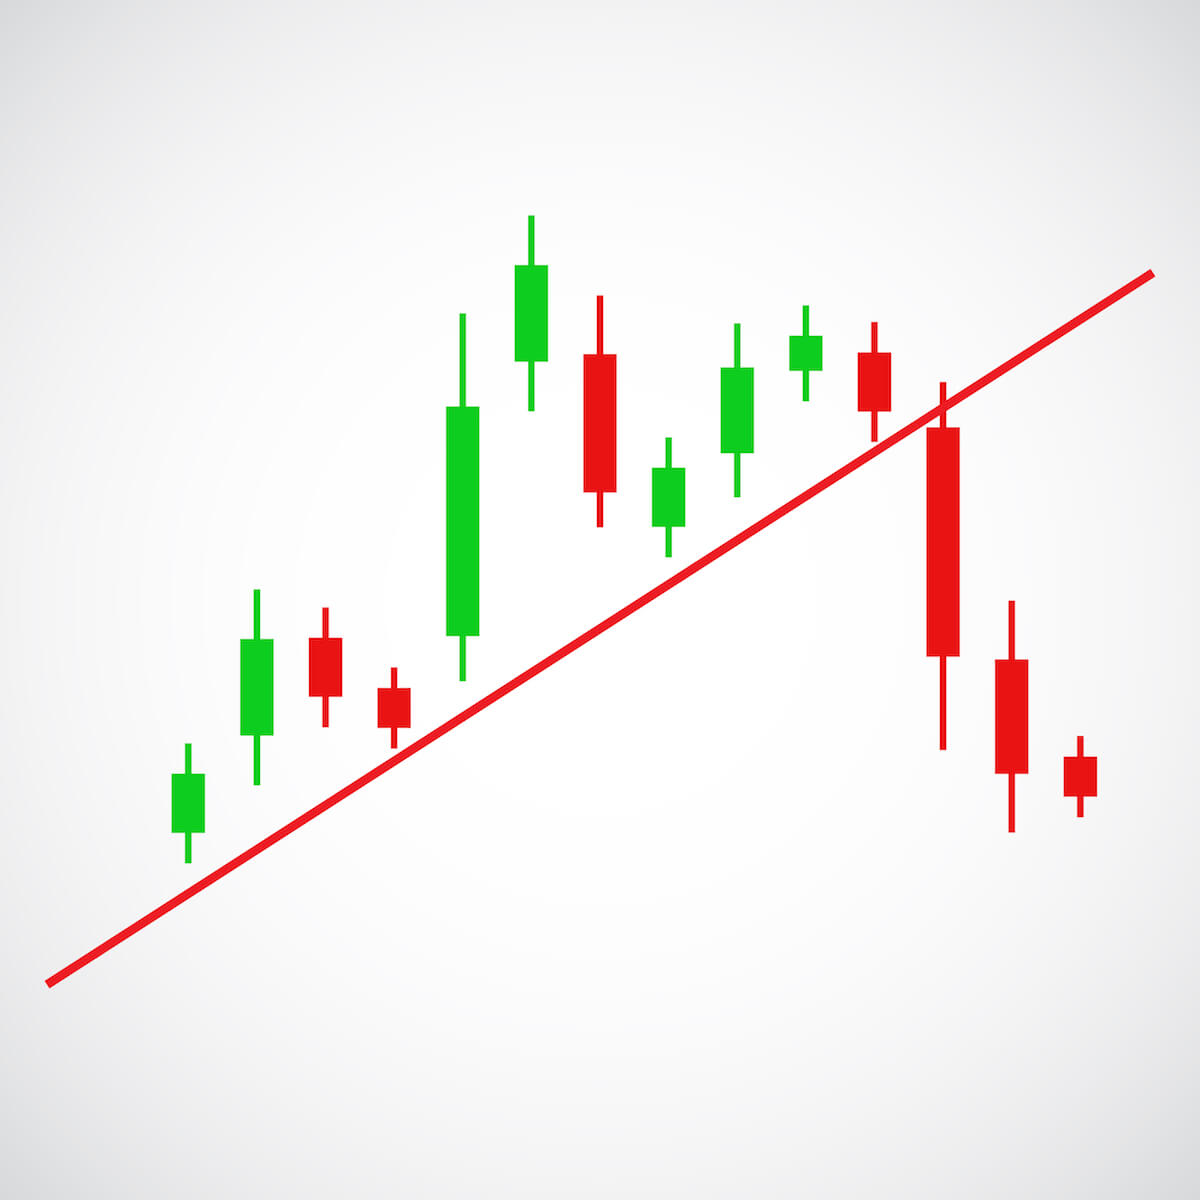
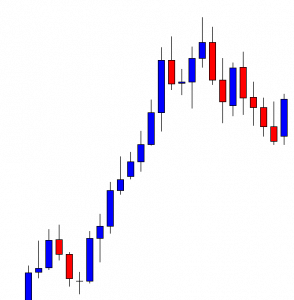
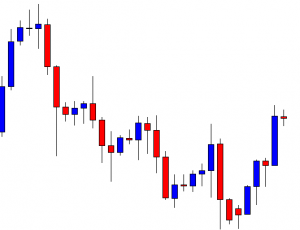
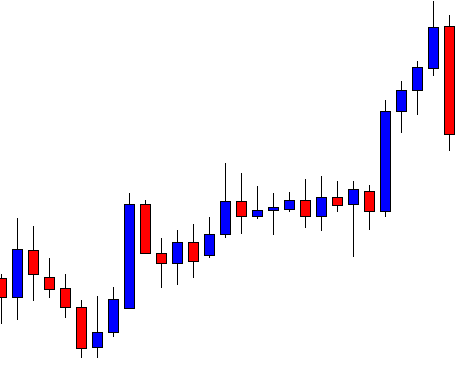
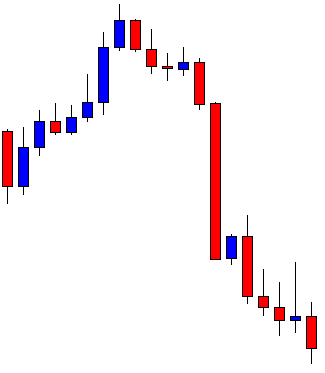
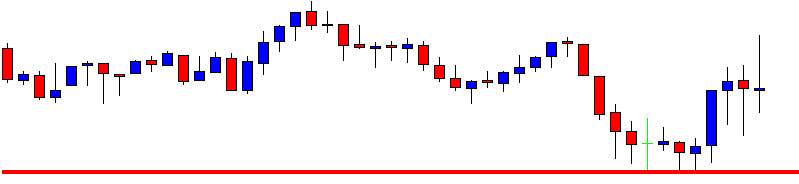
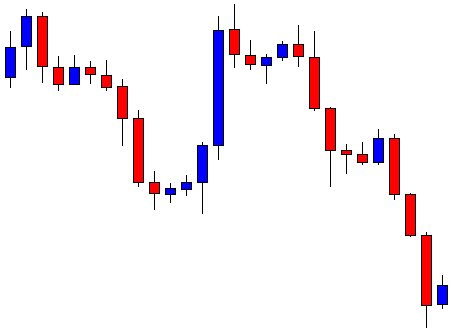
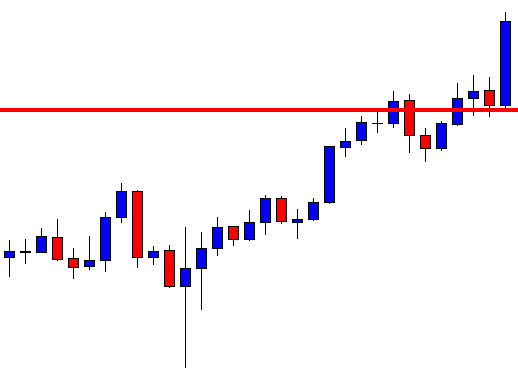
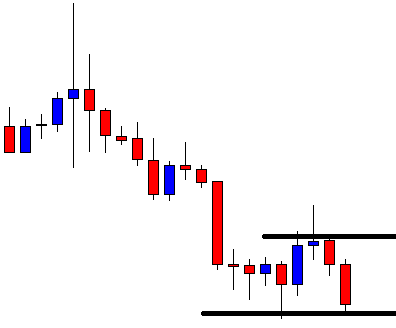
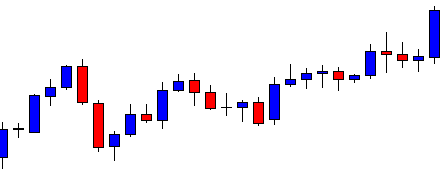
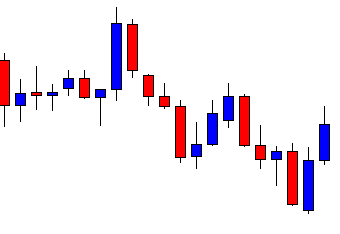
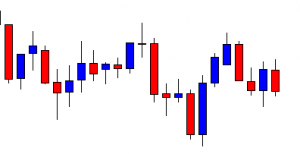
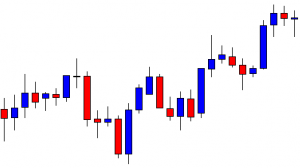
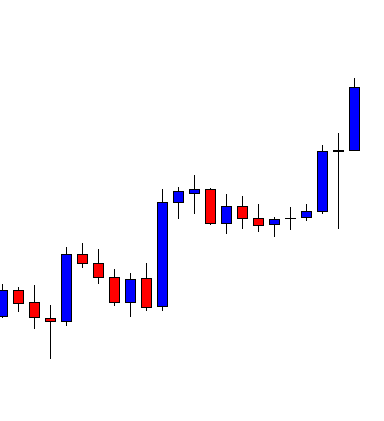
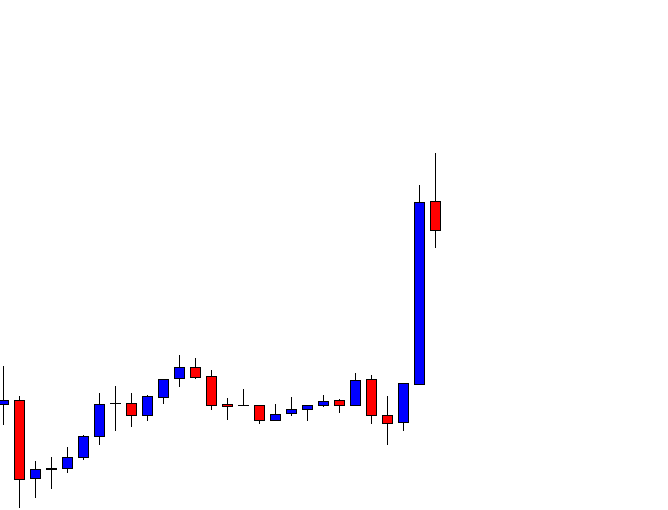
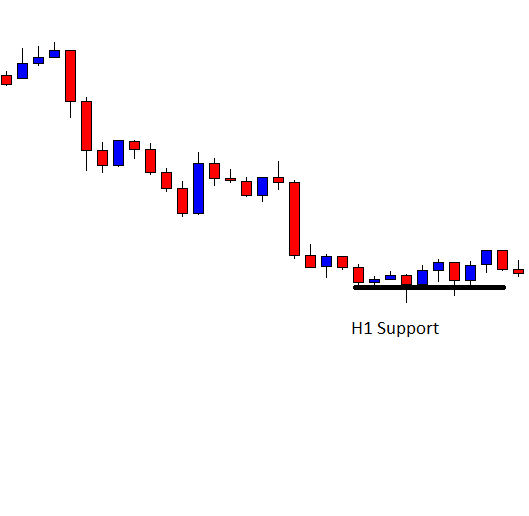
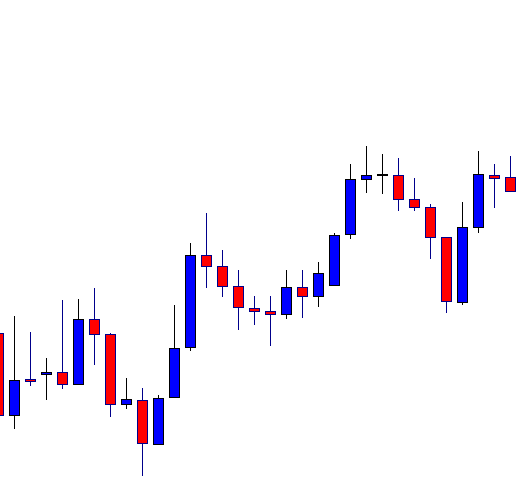
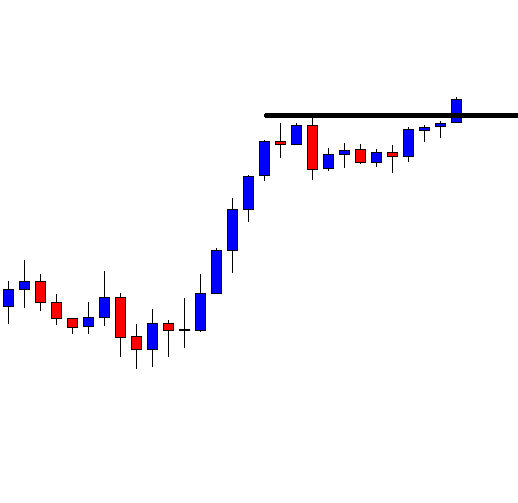
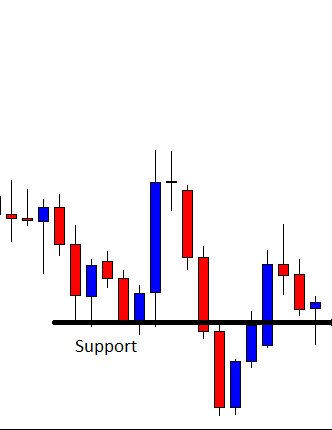
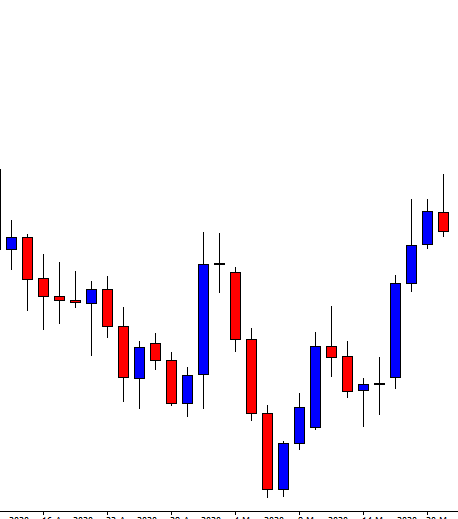
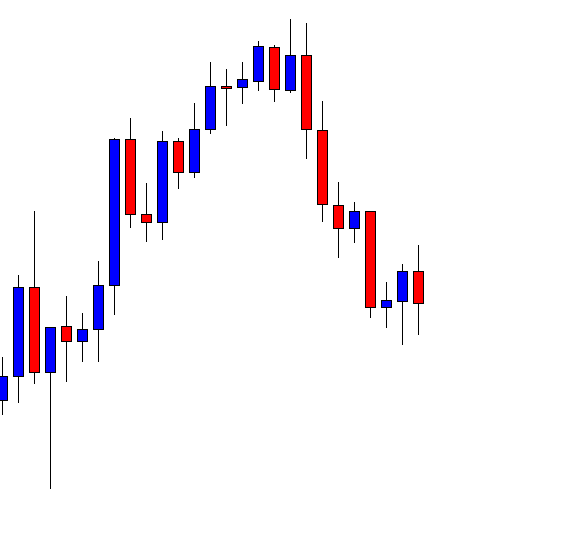
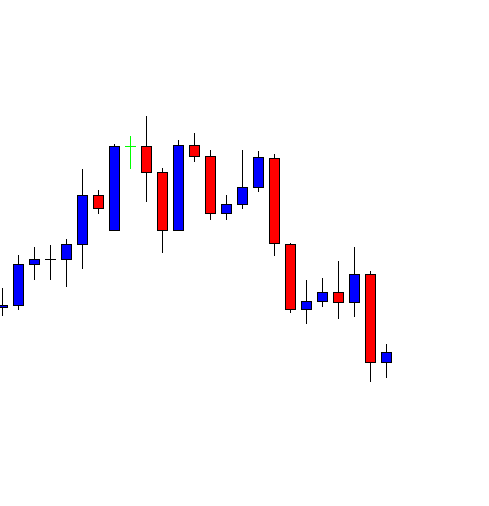
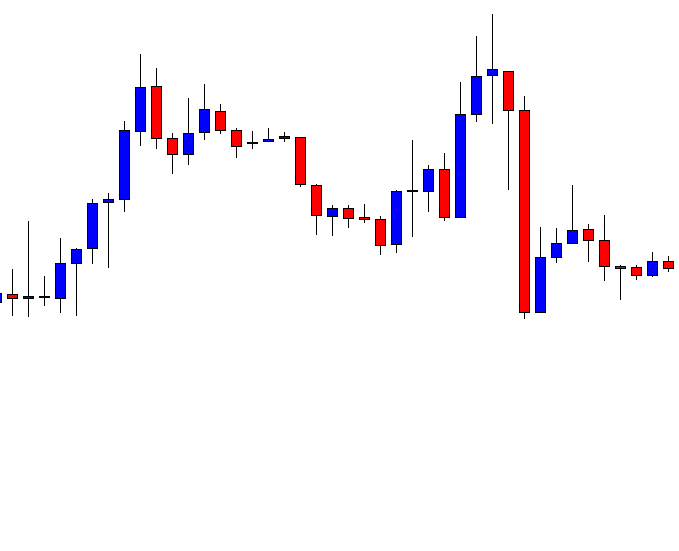
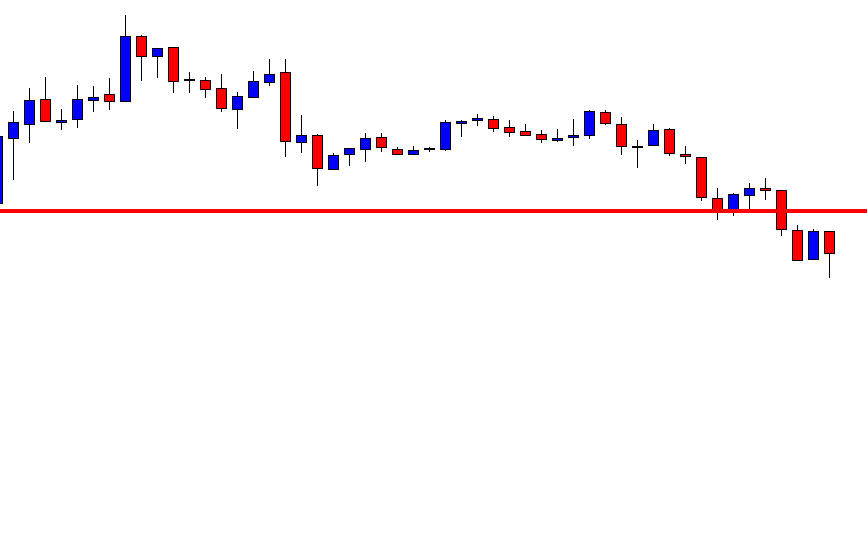
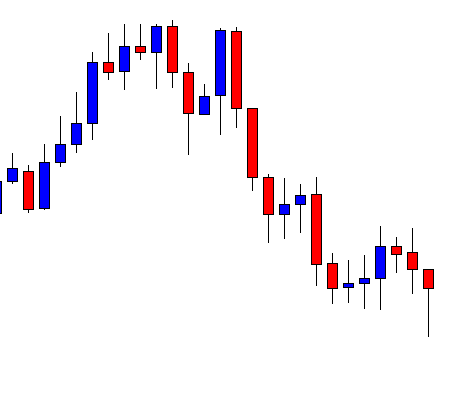
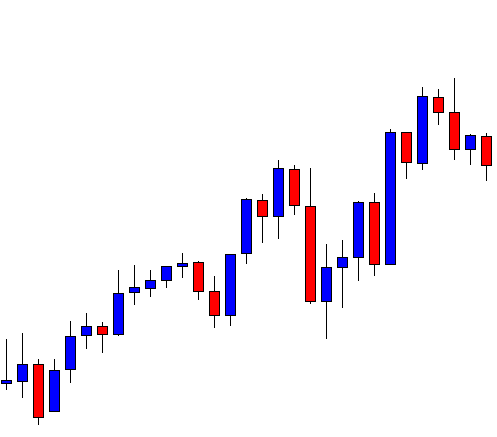
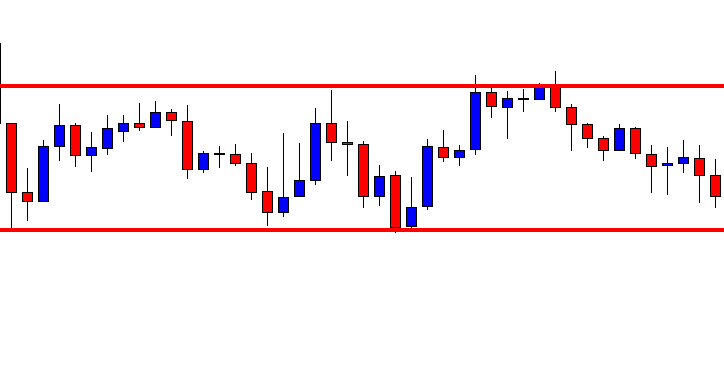
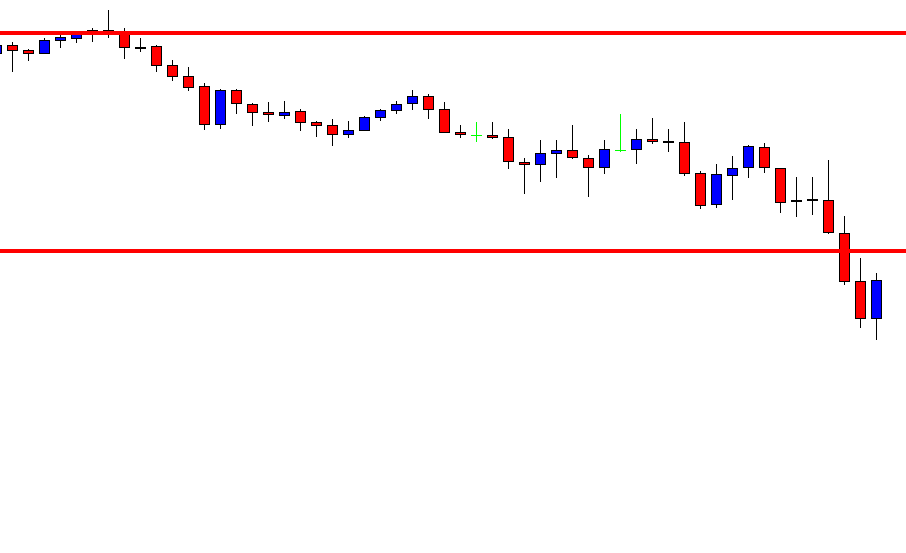
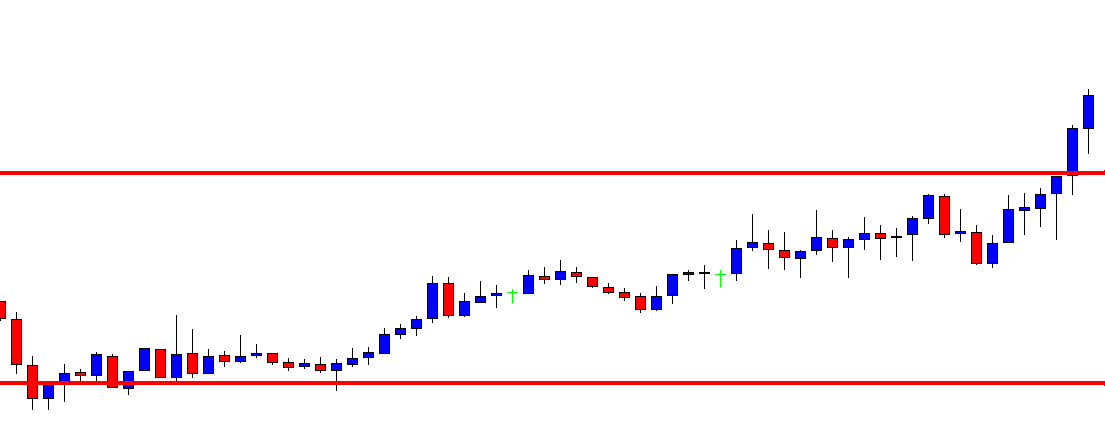
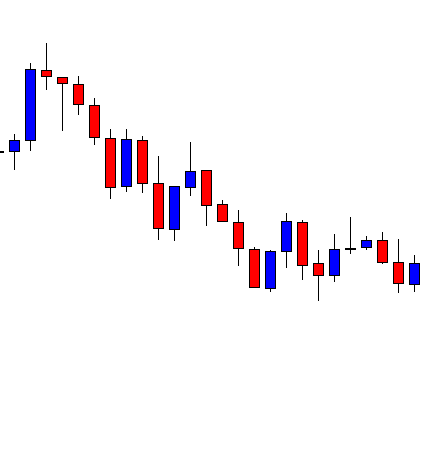
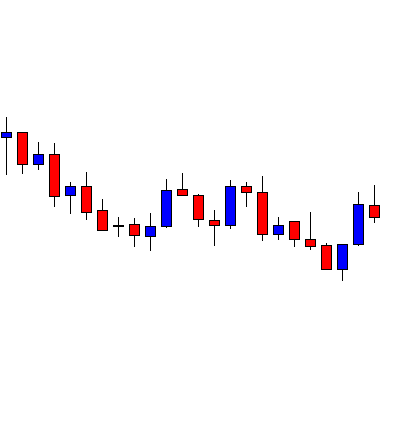
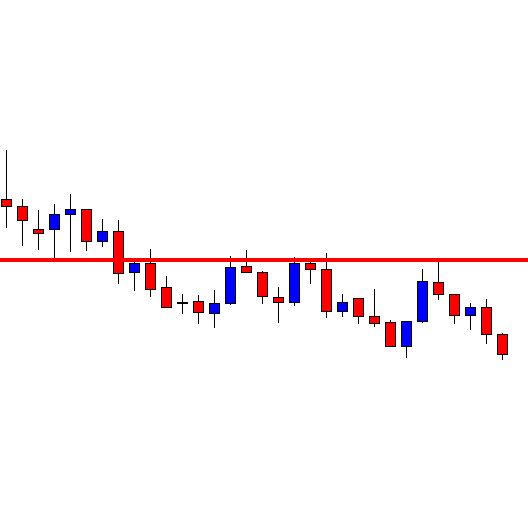
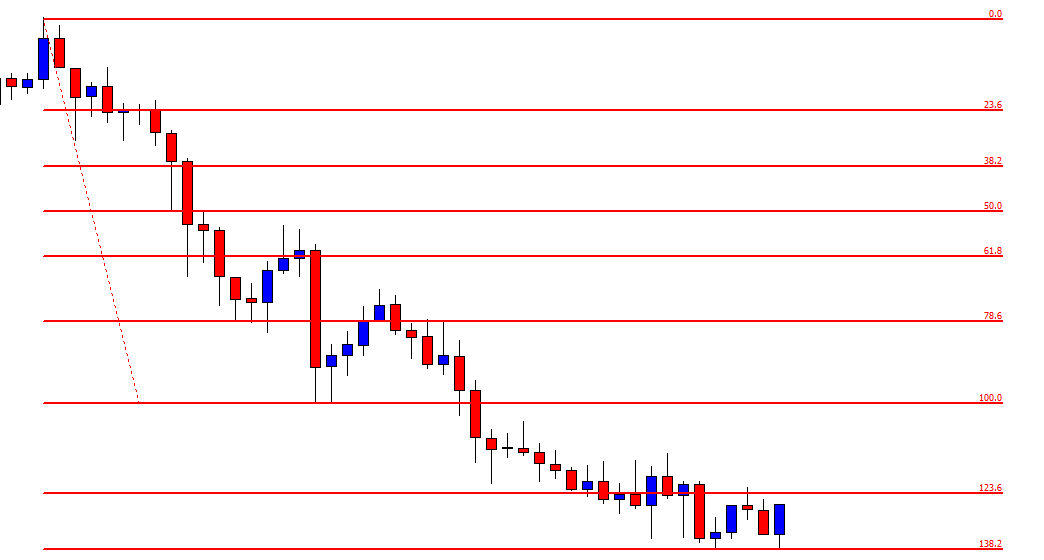
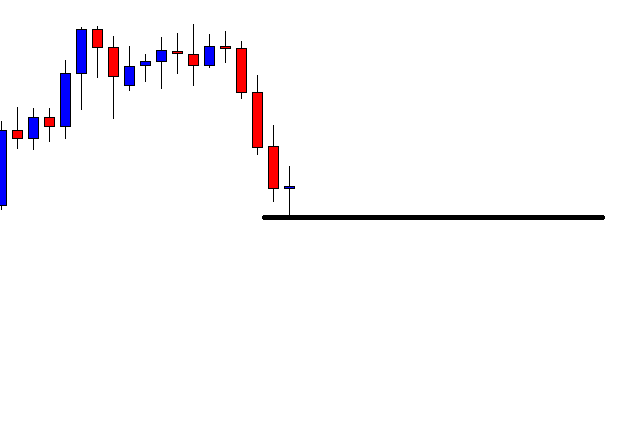
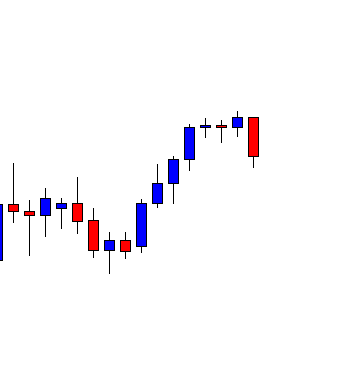
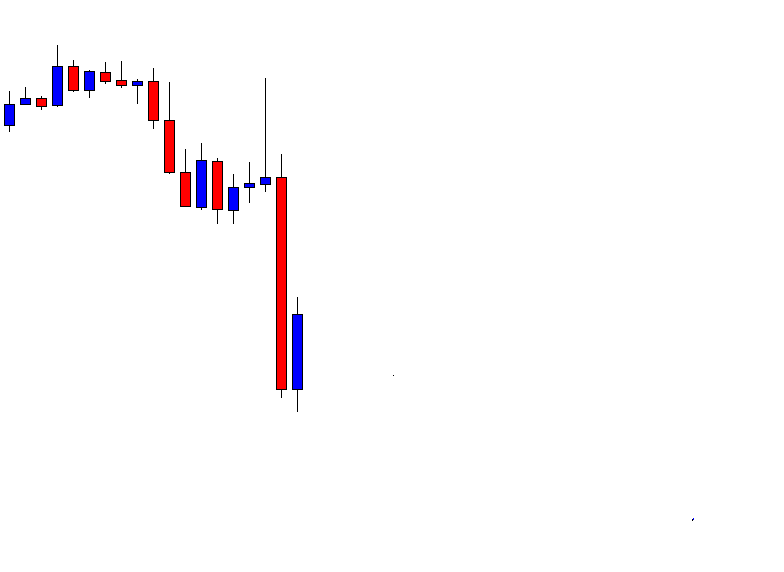
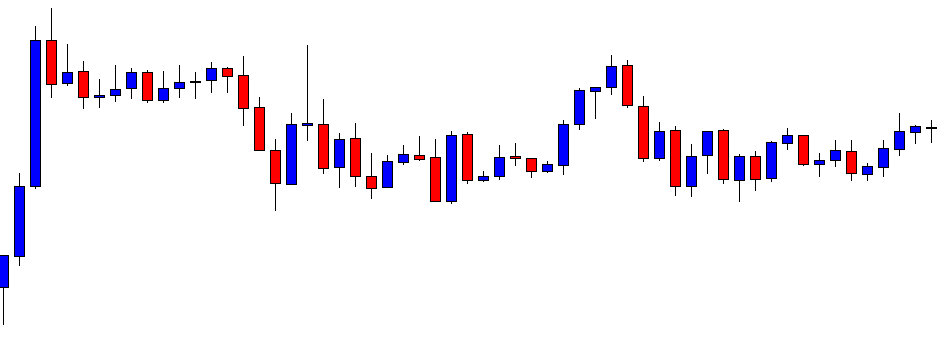
This is an H1 chart. The chart shows that the price makes a good bullish move and then makes a bearish correction. It consolidates for a while at a level of support and produces a bullish engulfing candle. The H1-15M combination traders may flip over to the 15M chart to trigger entry upon getting a 15M bullish candle. Let us find out what happens next.

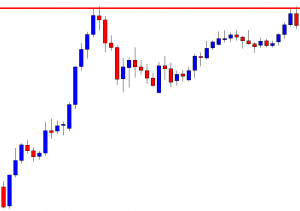
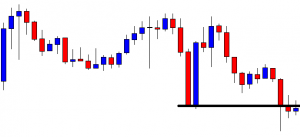
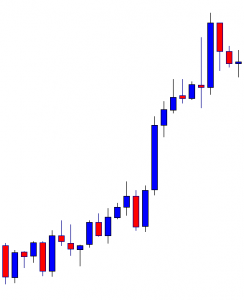
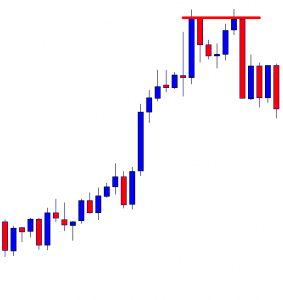
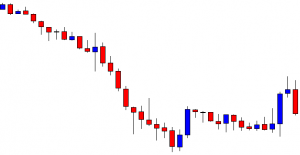
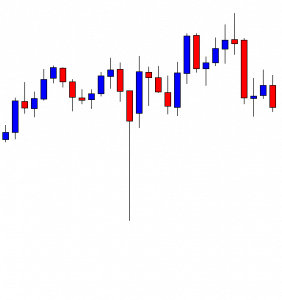
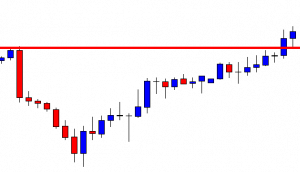
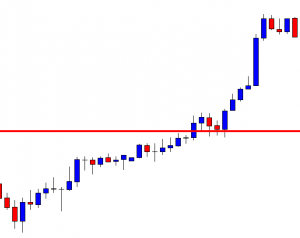
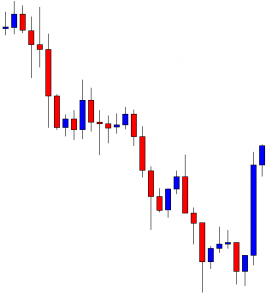
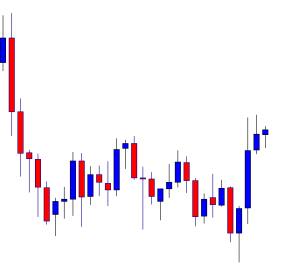
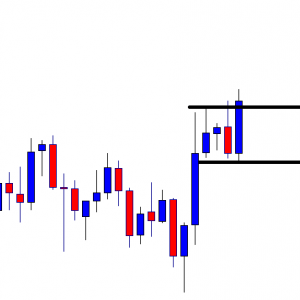
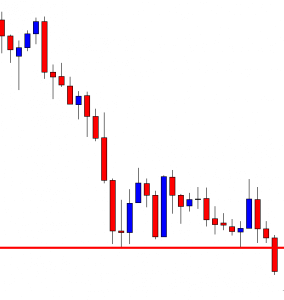
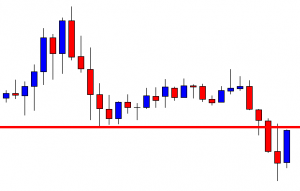
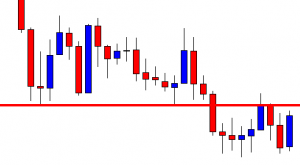
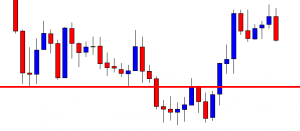
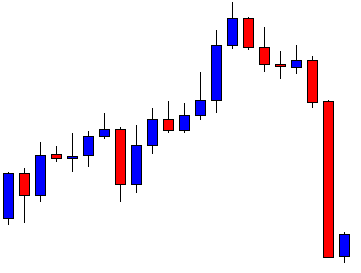
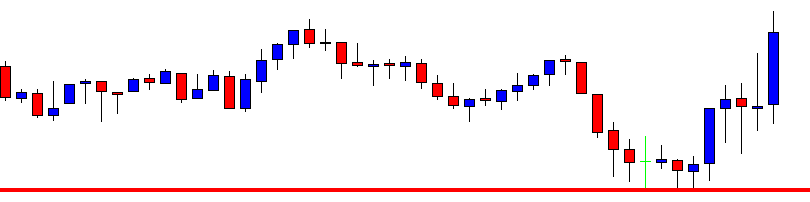
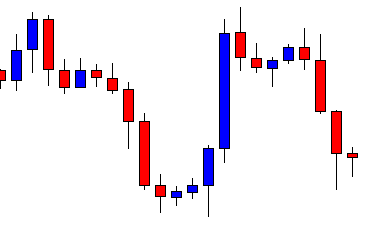
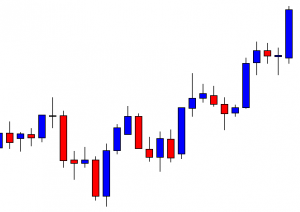
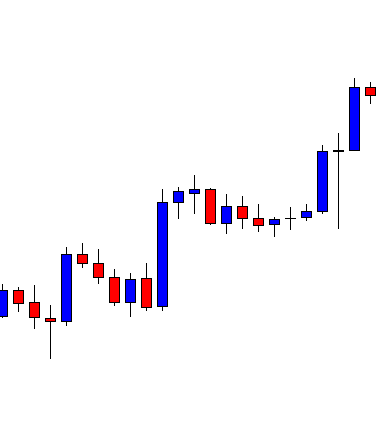
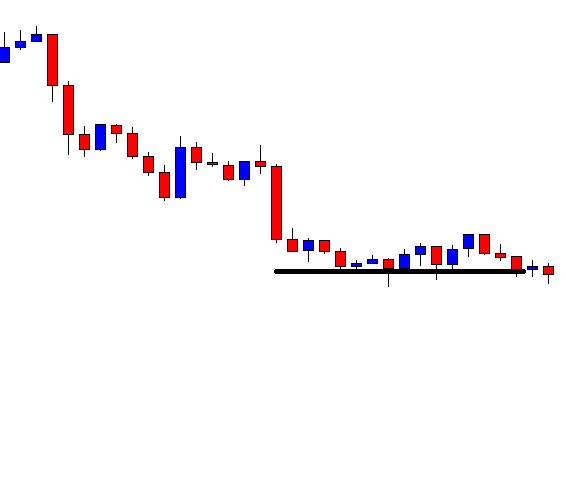
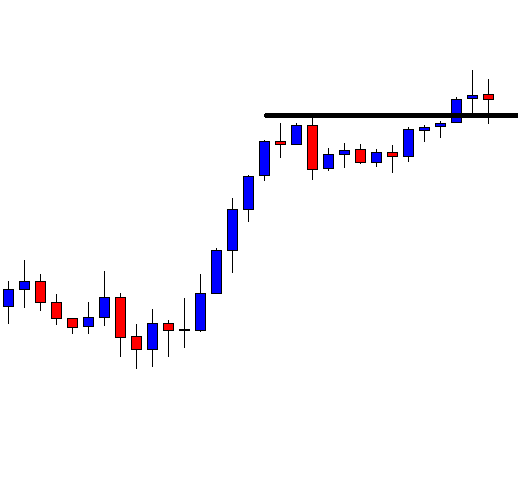
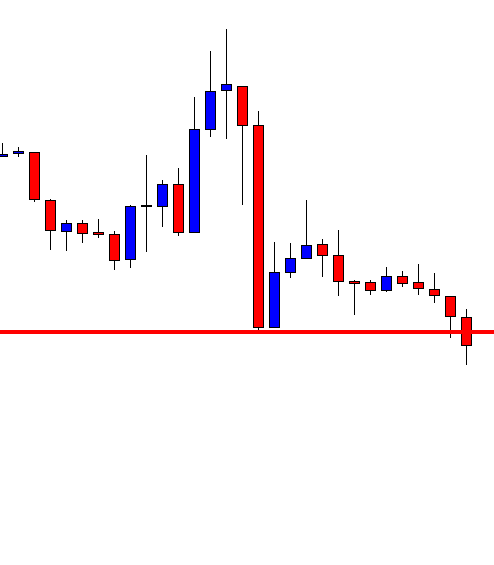
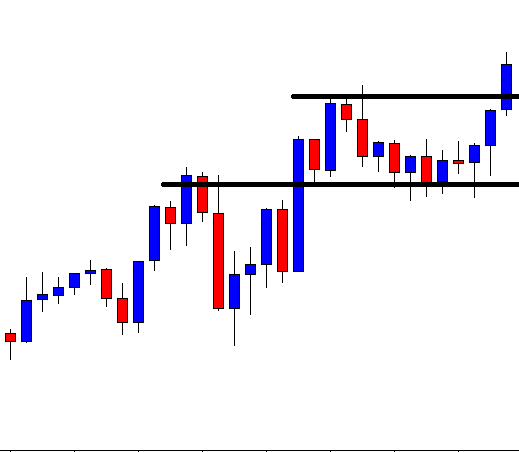
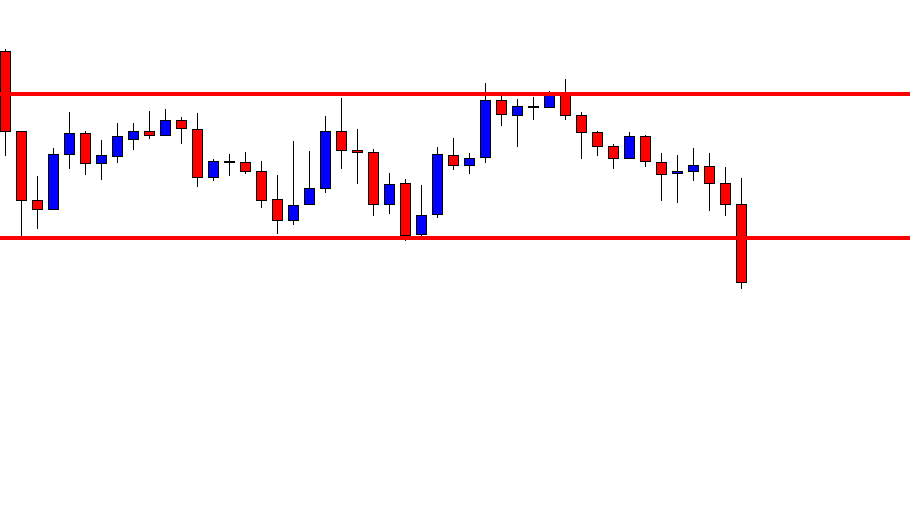
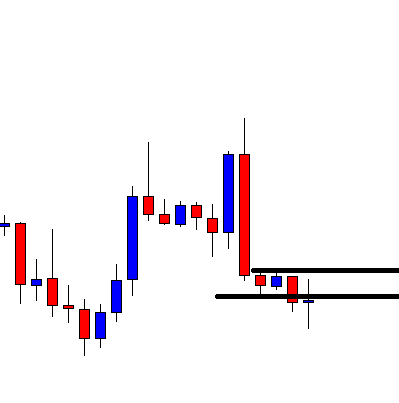
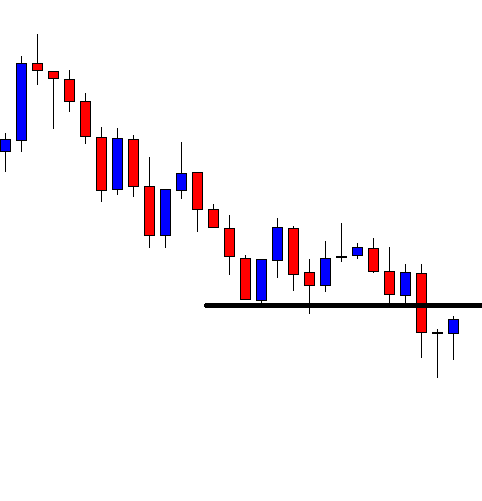
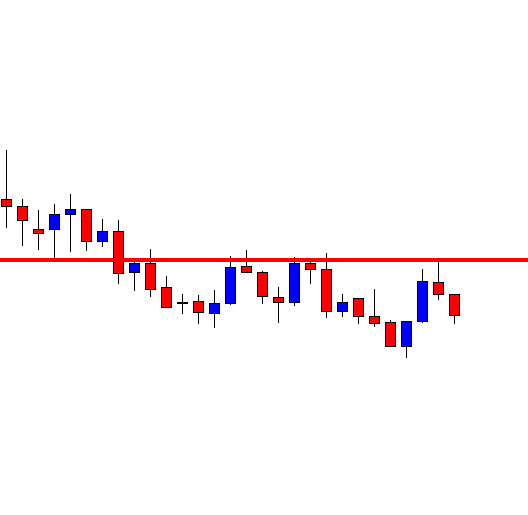
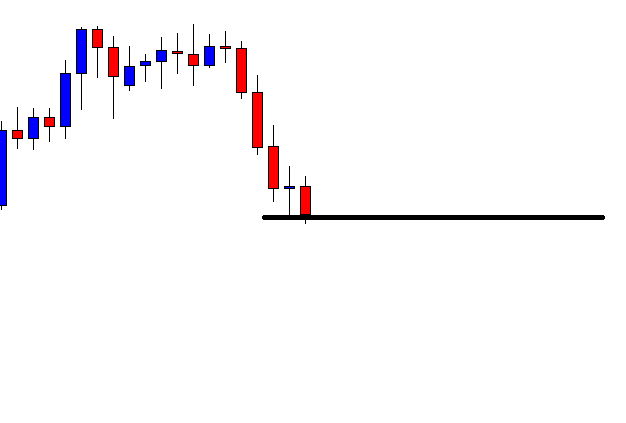
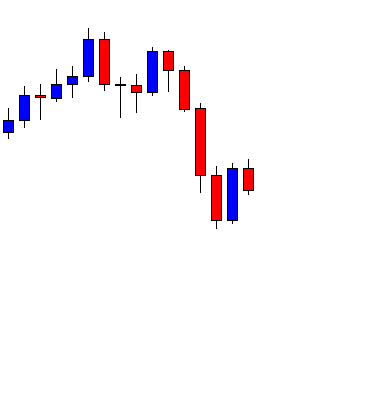
This is the H1 chart too. The chart shows that the price produces a bearish engulfing candle instead. We have not flipped over to the 15M chart yet. Let us find out how the 15M chart looks.

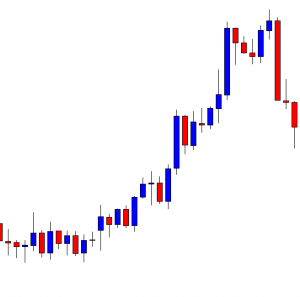
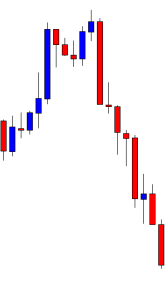
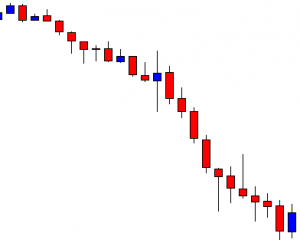
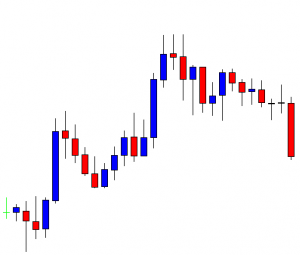
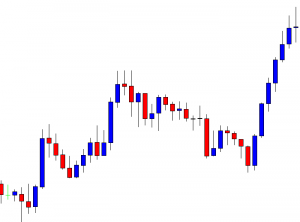
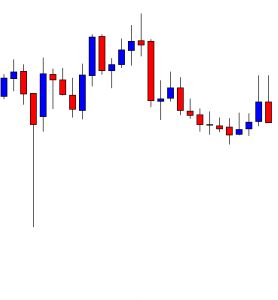
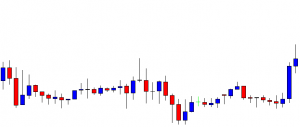
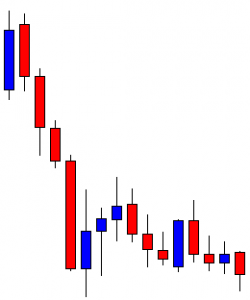
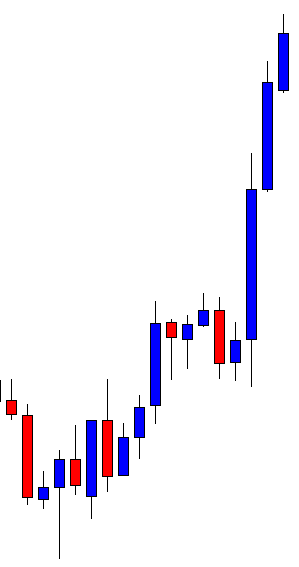
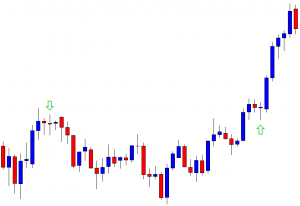
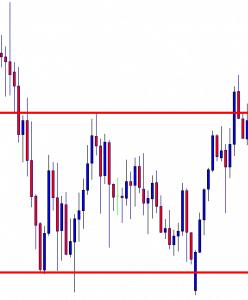
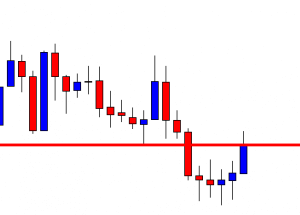
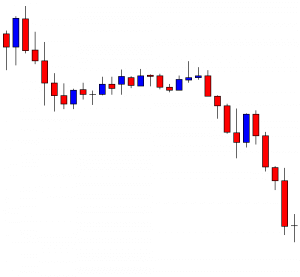
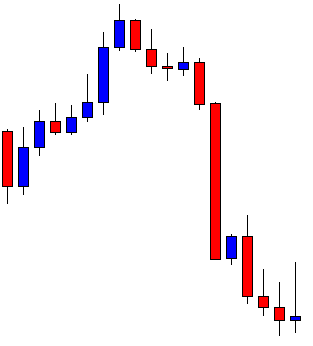
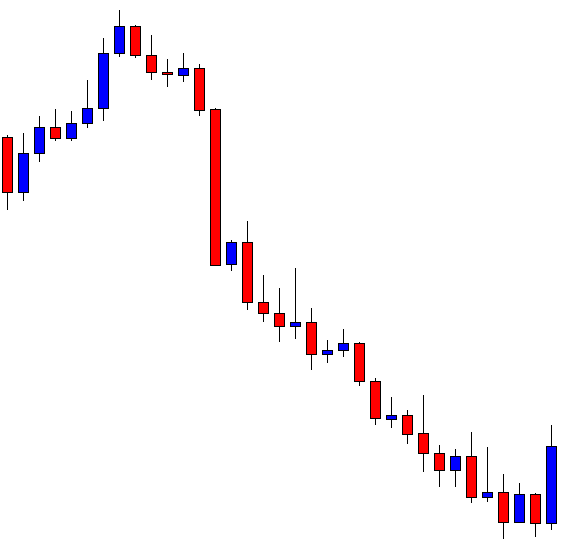
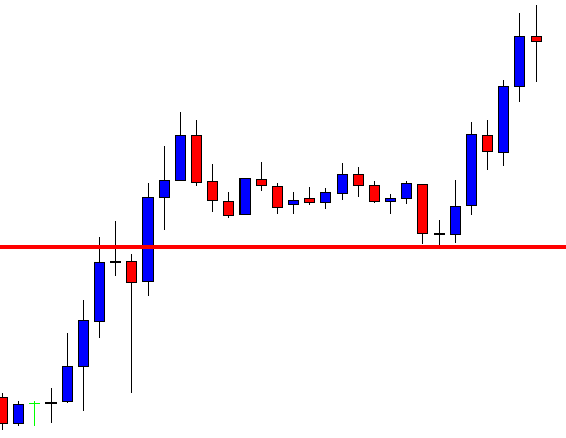
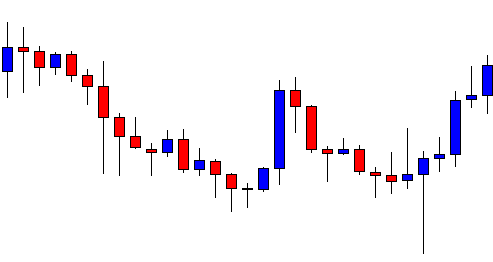
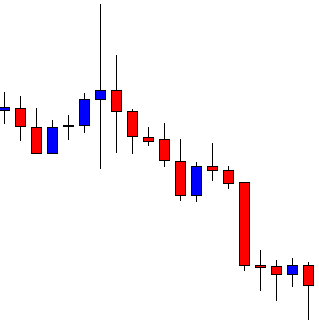
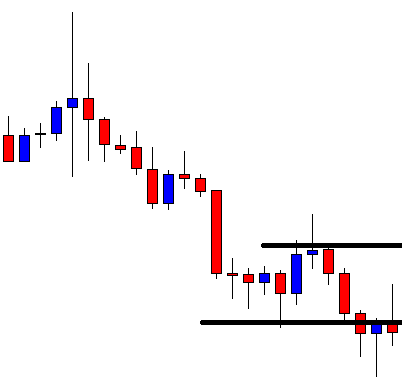
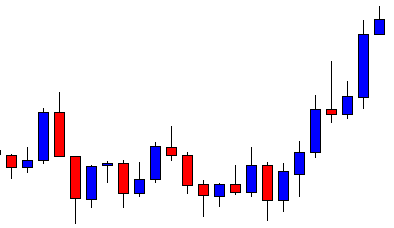
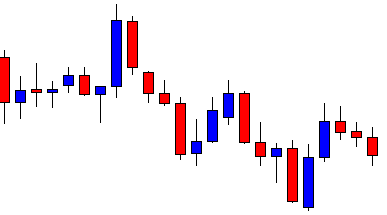
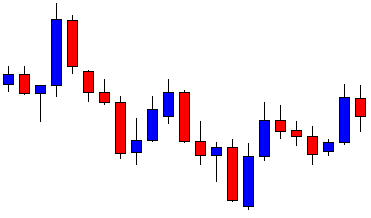
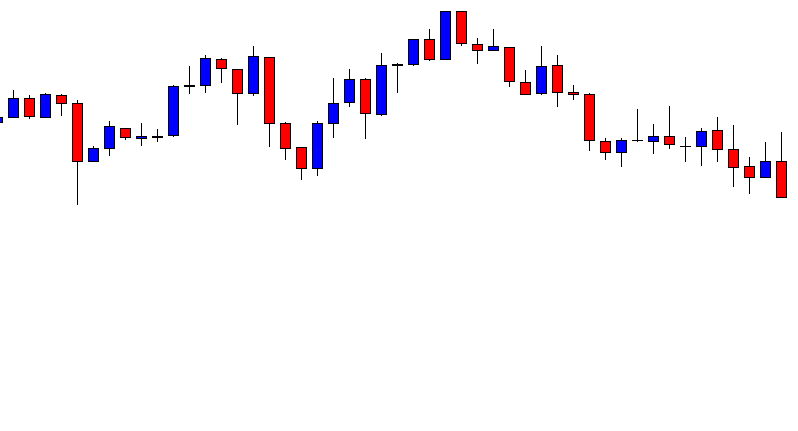
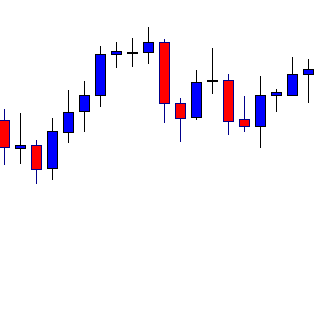
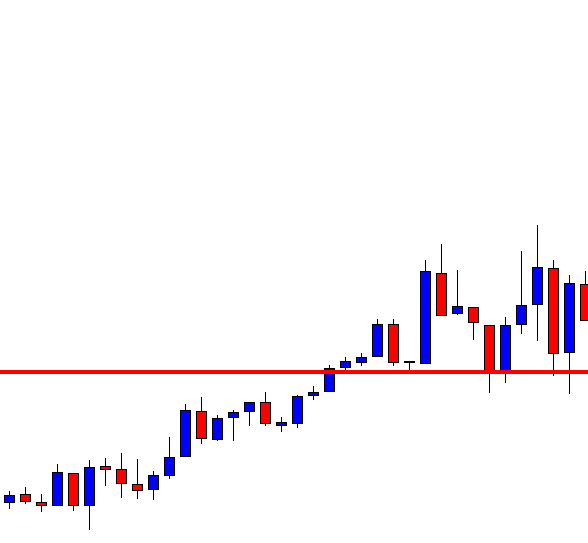
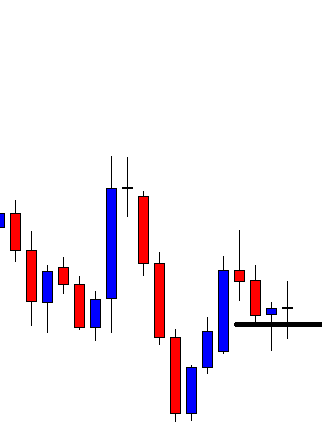
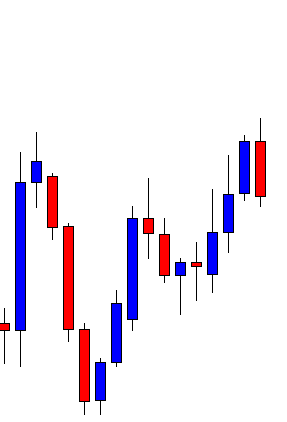
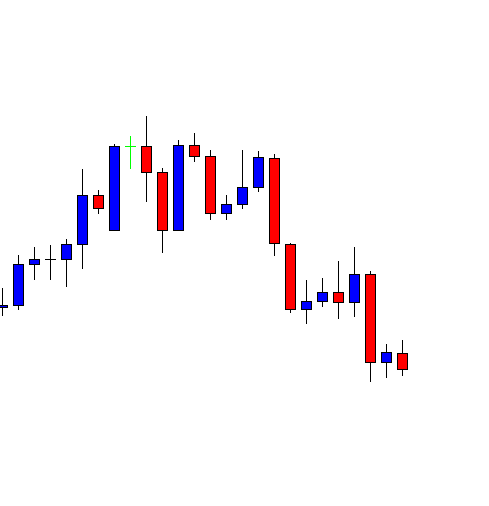
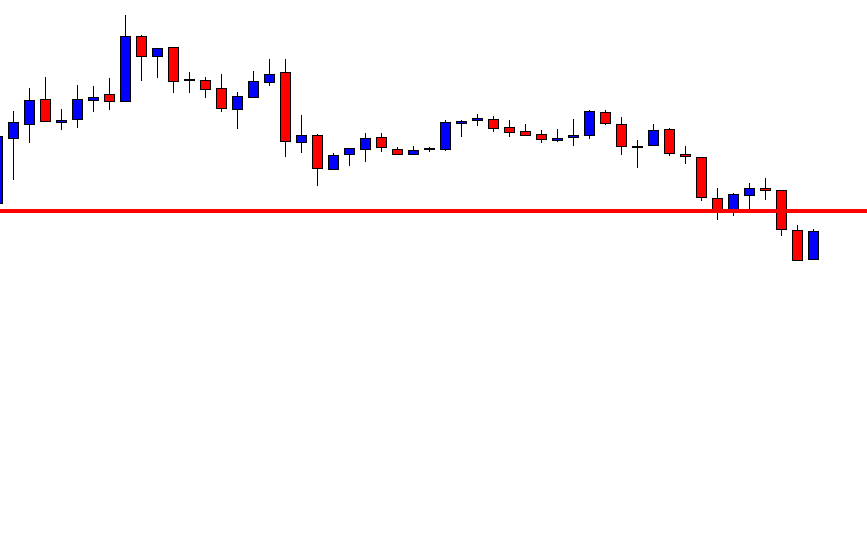
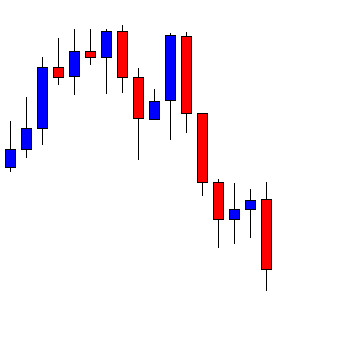
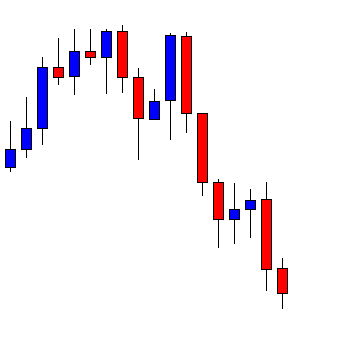
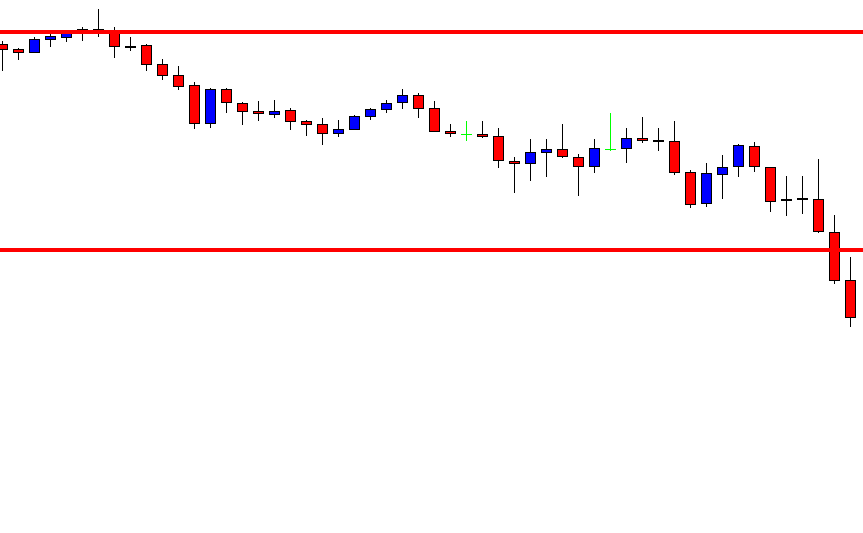
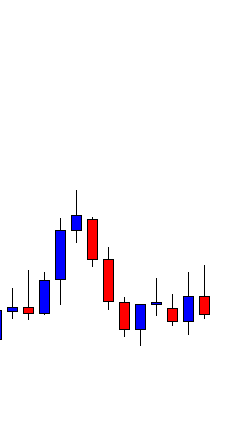
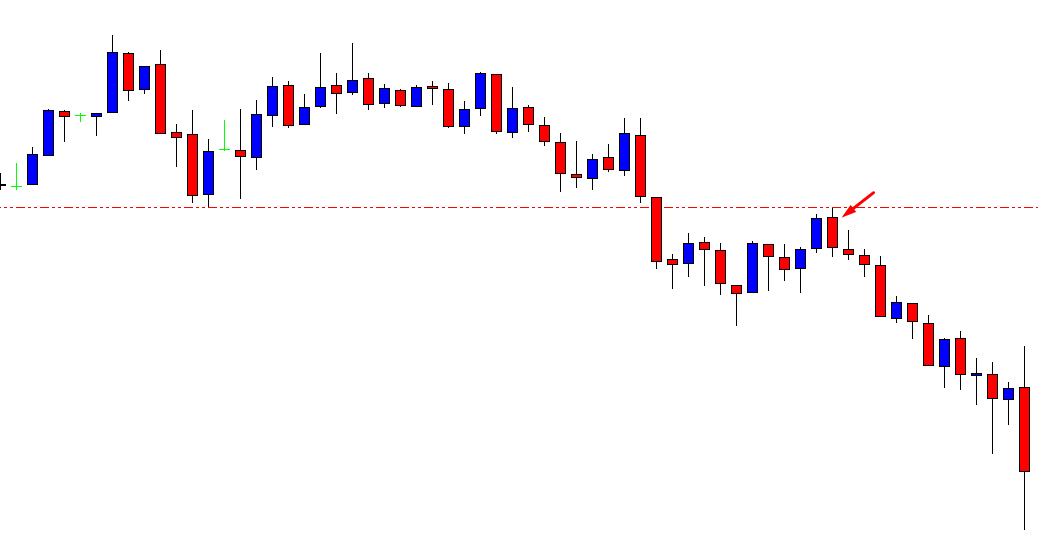
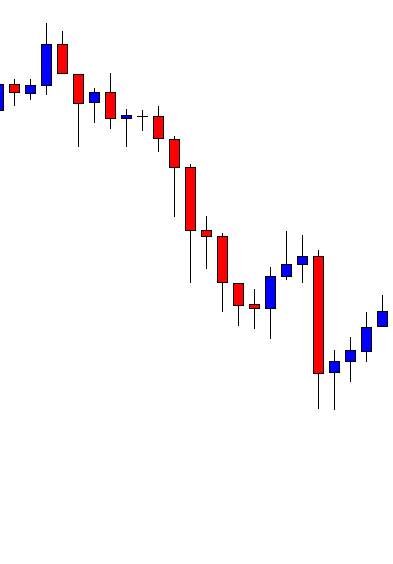
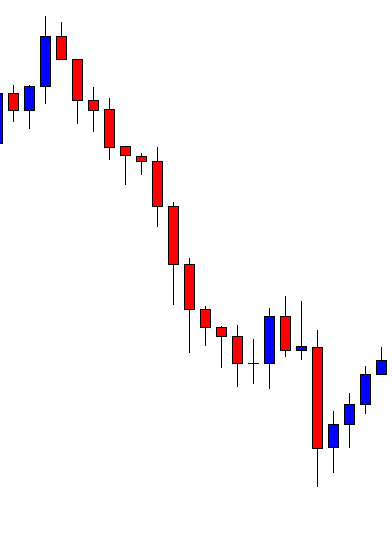
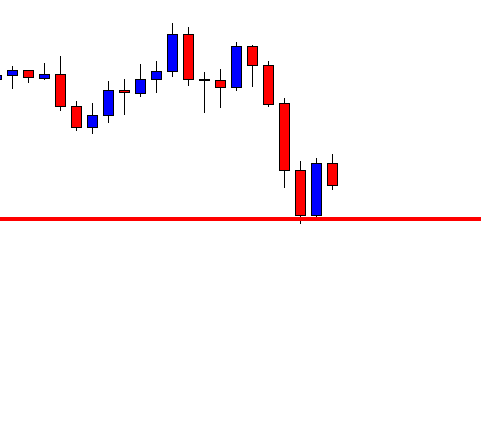
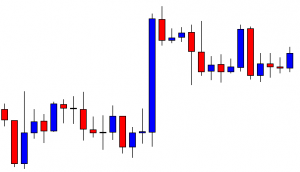
This is the 15M chart. The chart shows that the price does not produce any bullish candle closing ahead of the H1 bullish reversal candle. Thus, the price heads towards the South. The last candle comes out as a bearish engulfing candle in the 15M chart. It does not look good for the buyers anymore.

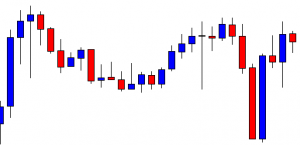
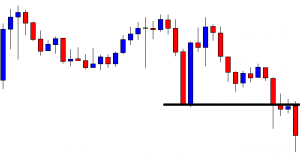
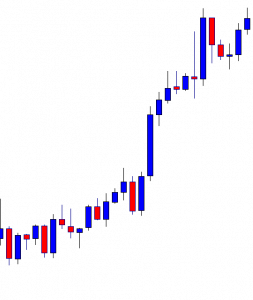
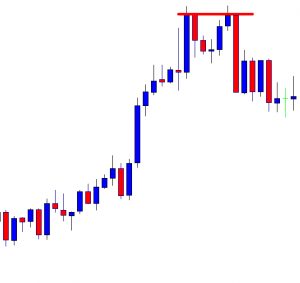
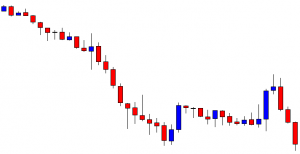
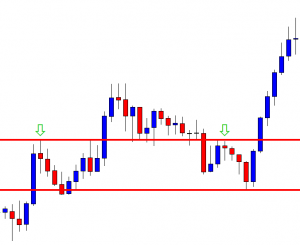
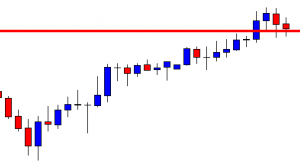
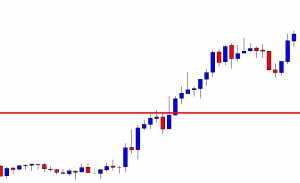
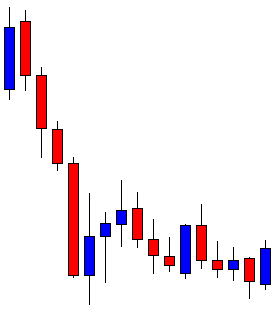
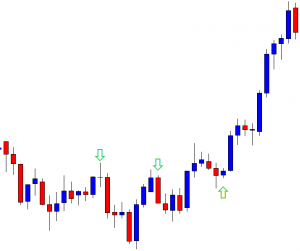
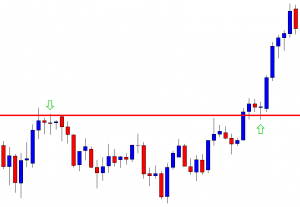
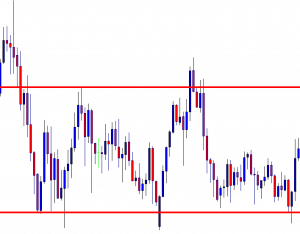
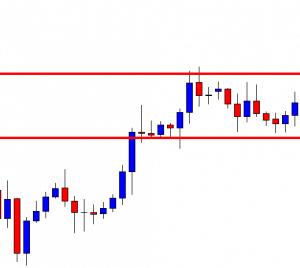
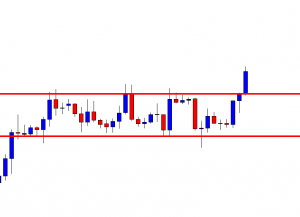
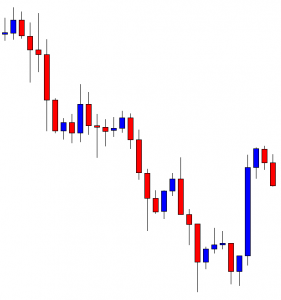
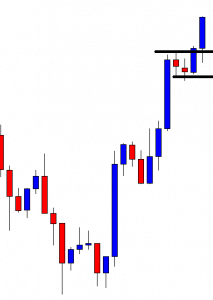
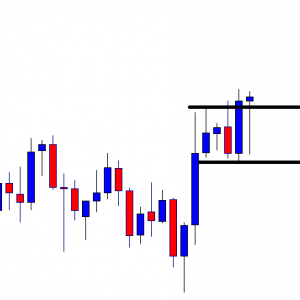
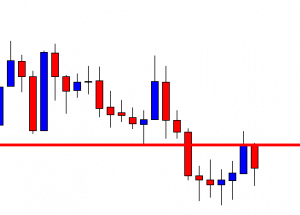
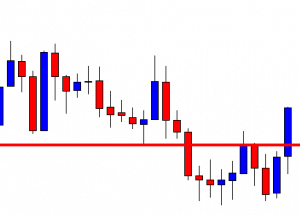
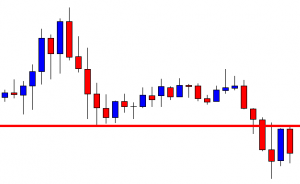
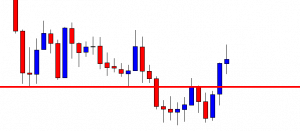
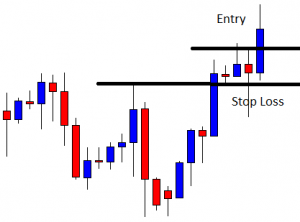
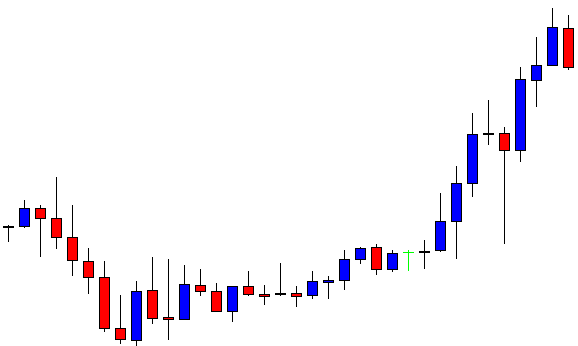
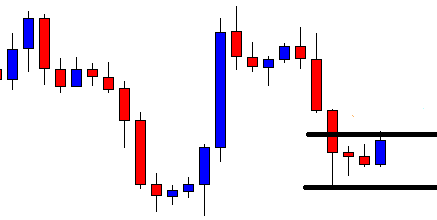
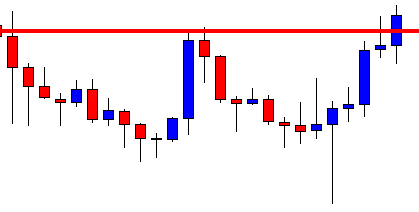
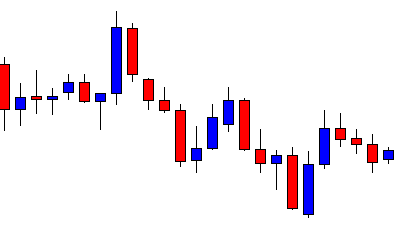
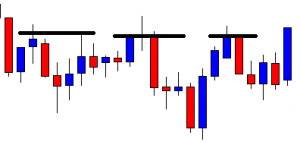
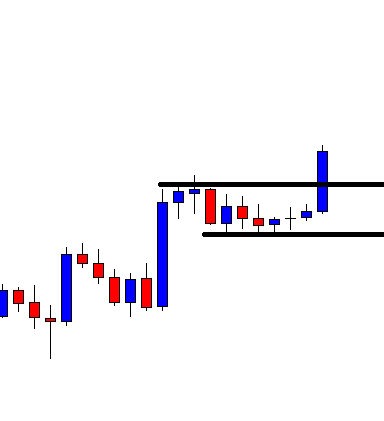
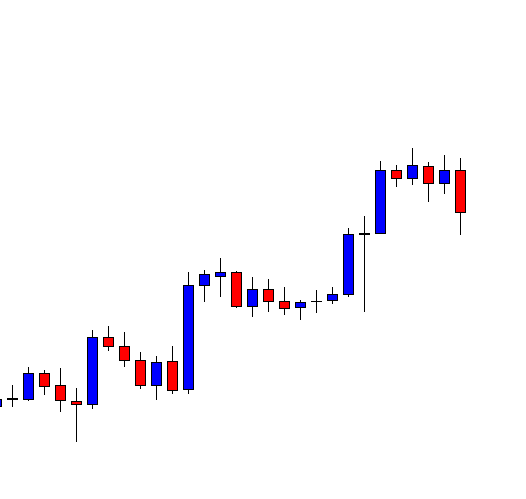
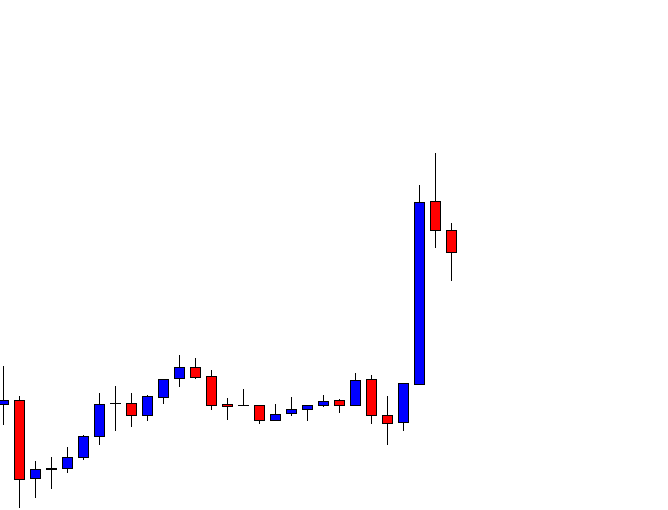
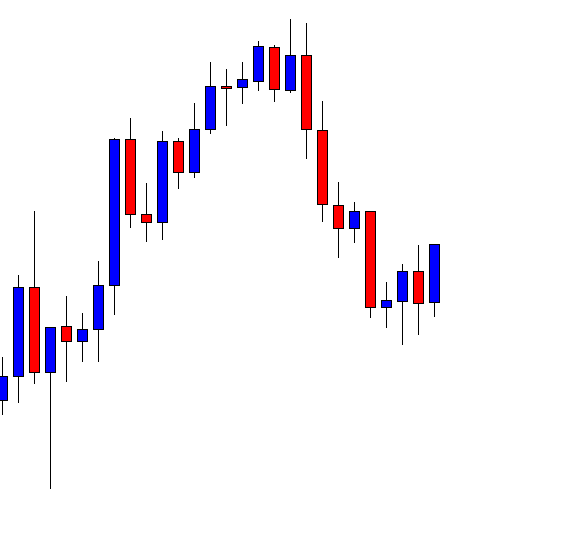
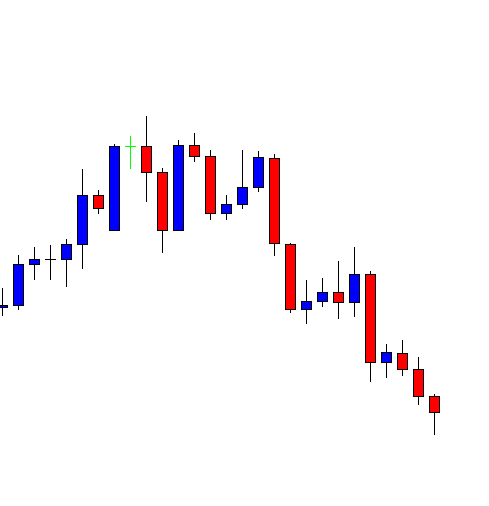
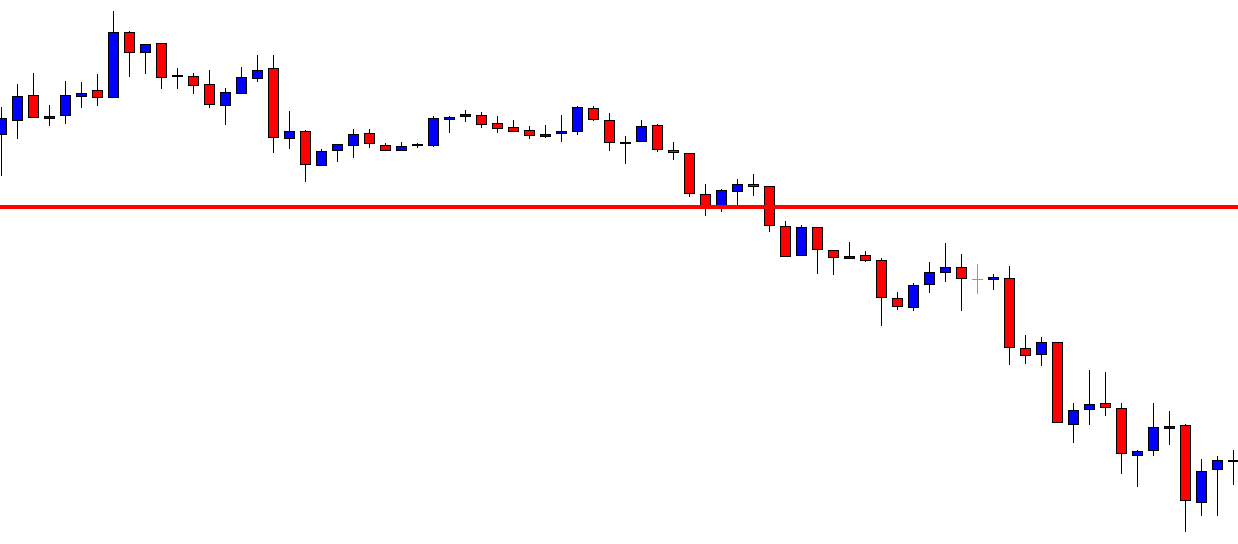
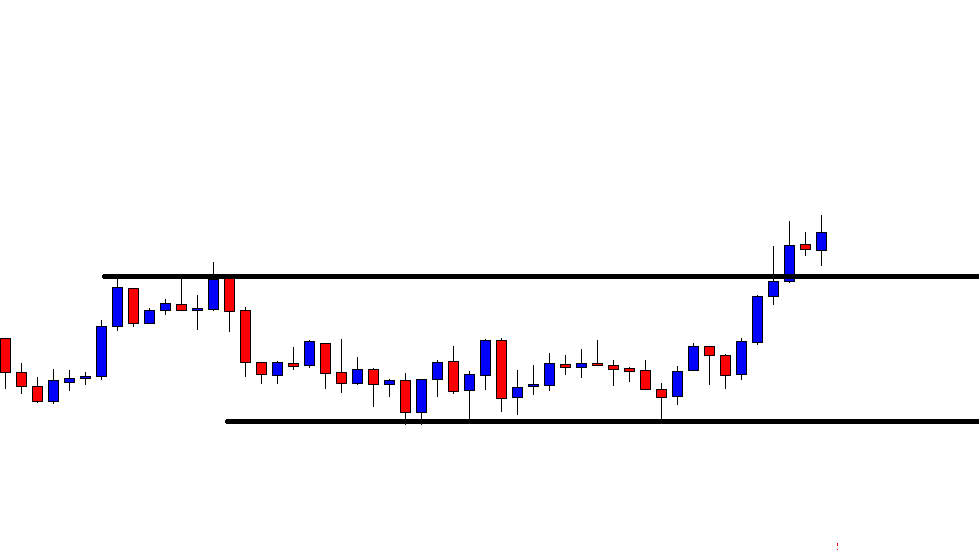
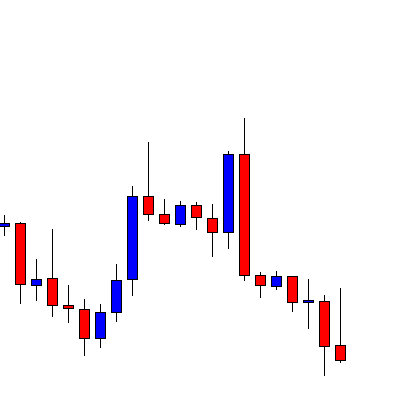
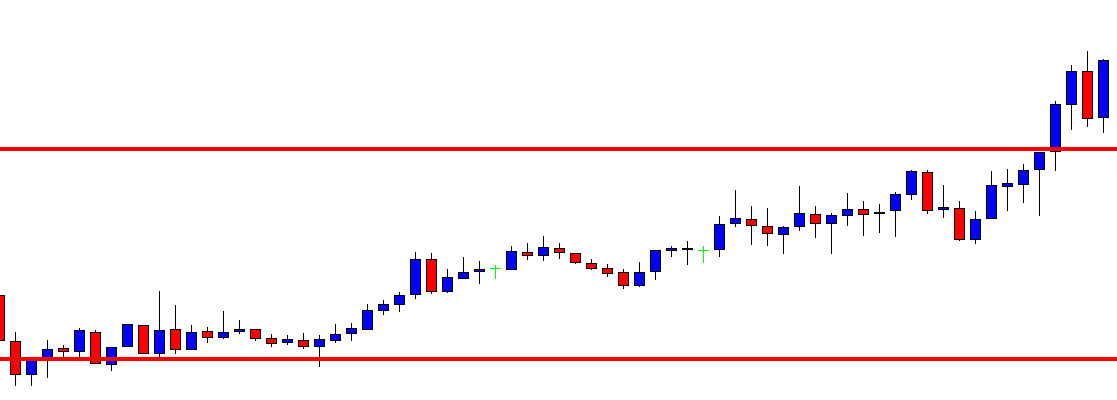
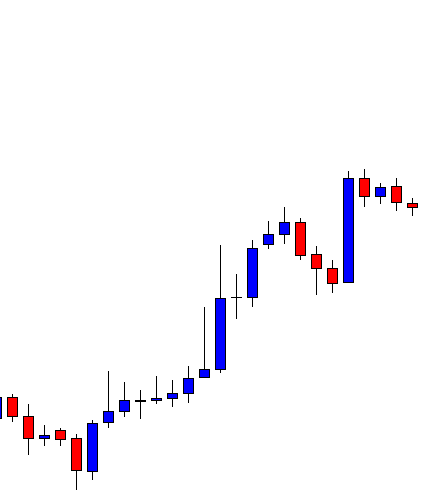
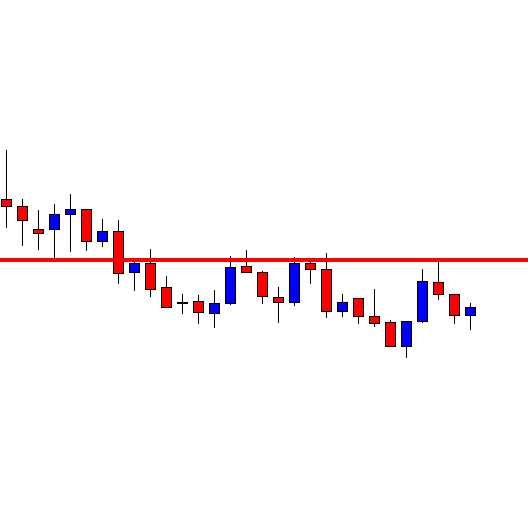
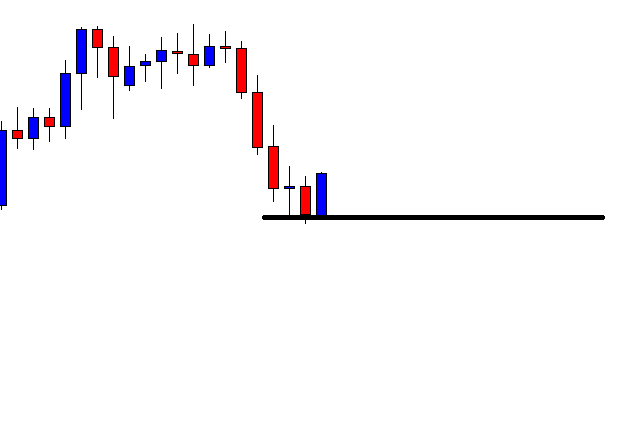
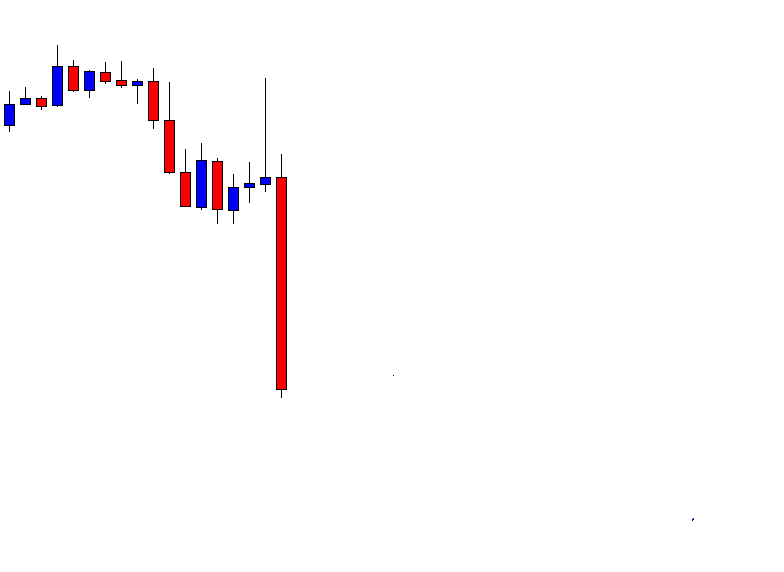
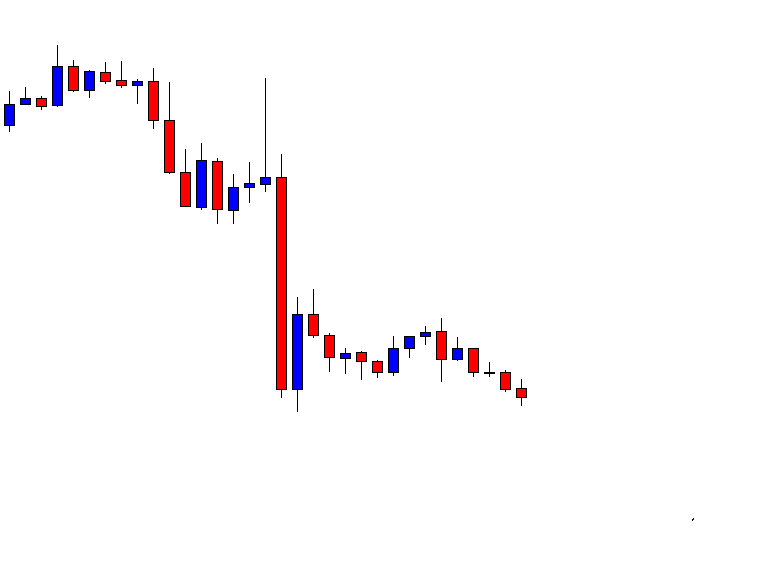
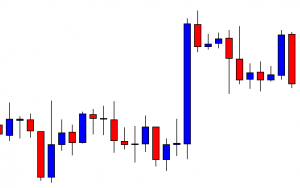
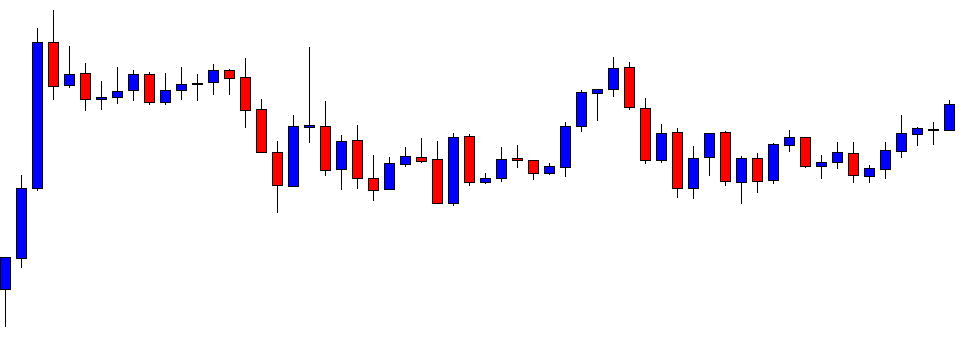
The price consolidates with more candles. The last candle comes out as a bullish engulfing candle again. The chart produces the candle at the same level. The combination traders may flip over to the 15M chart again to look for entry. Let us find out what the 15M chart produces this time.

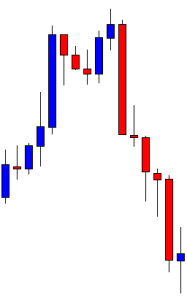
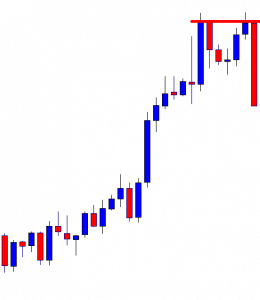
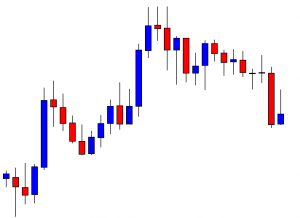
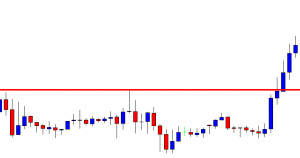
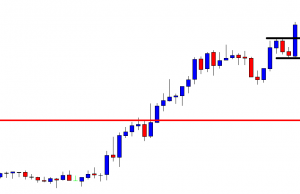
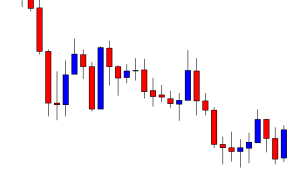
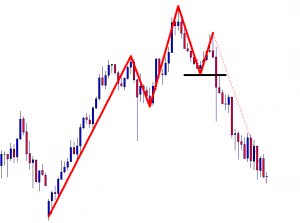
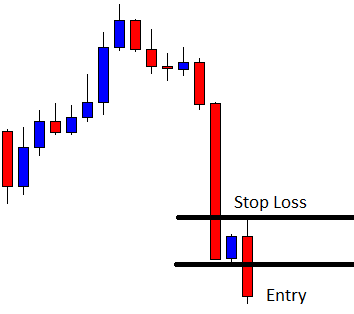
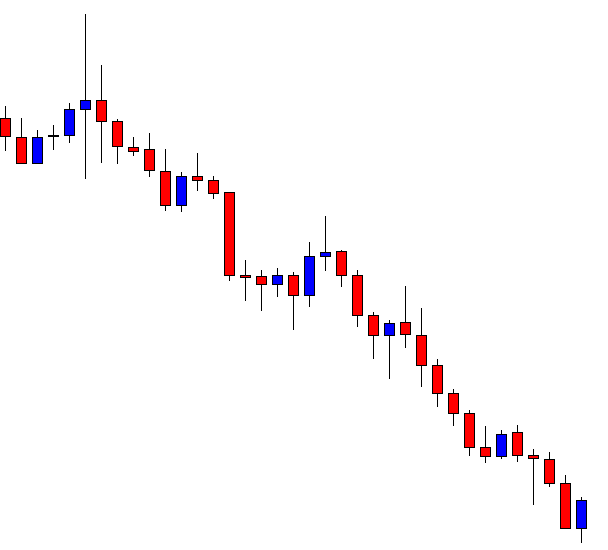
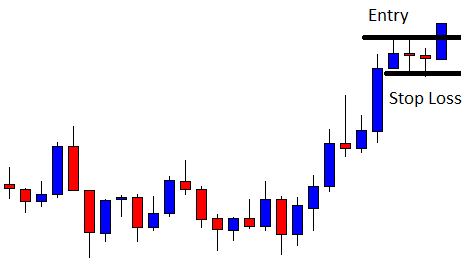
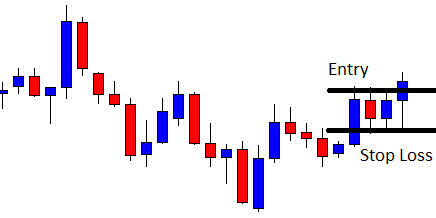
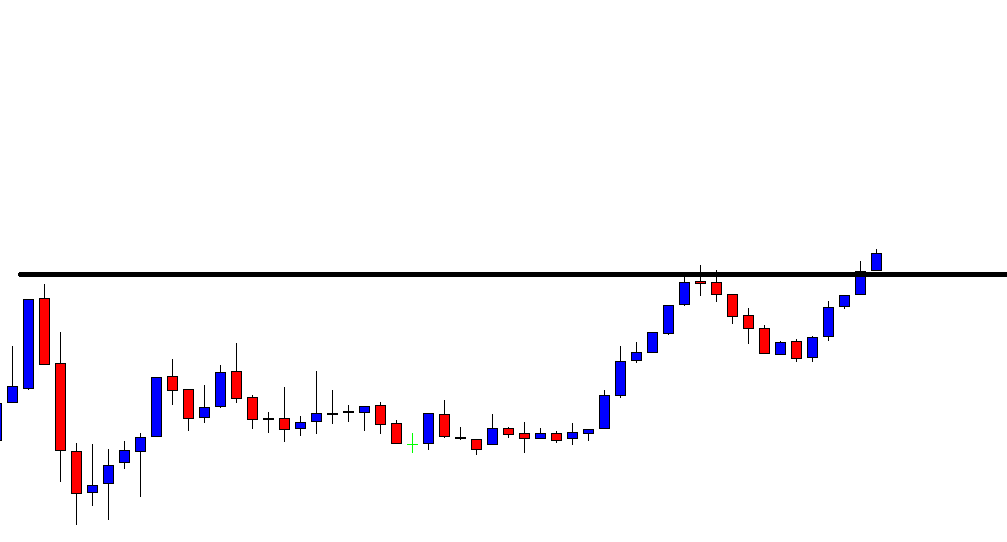
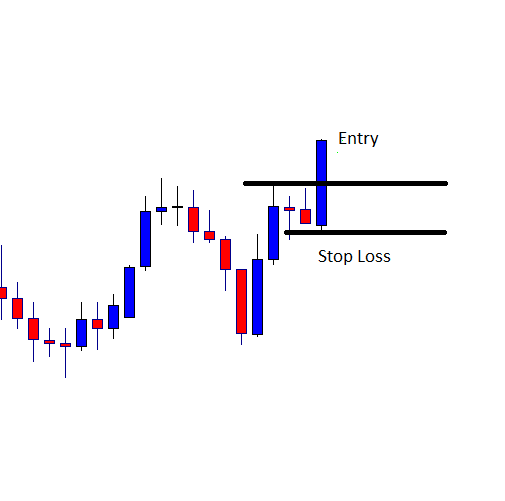
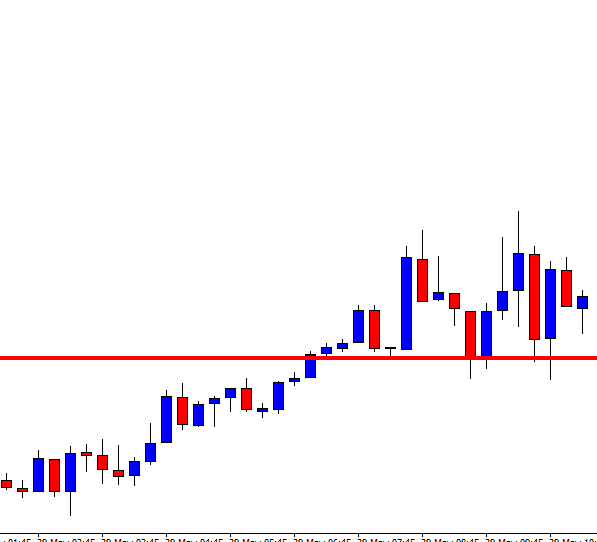
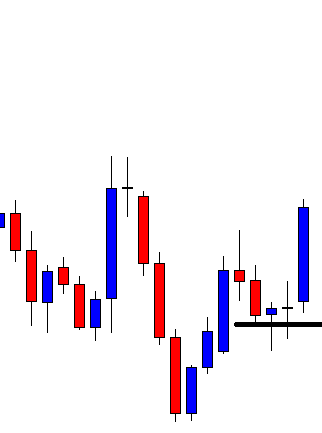
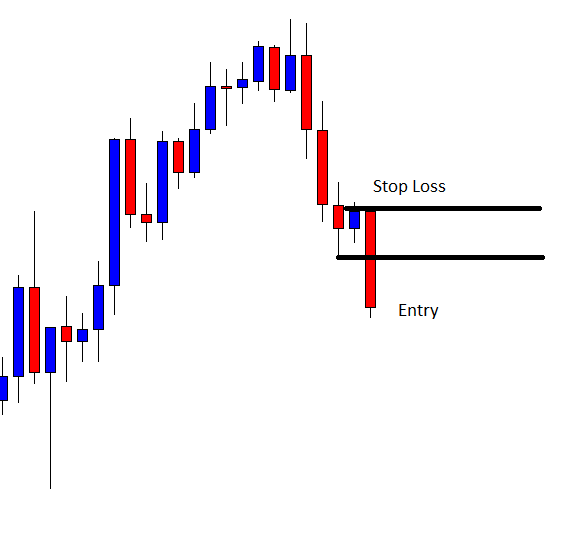
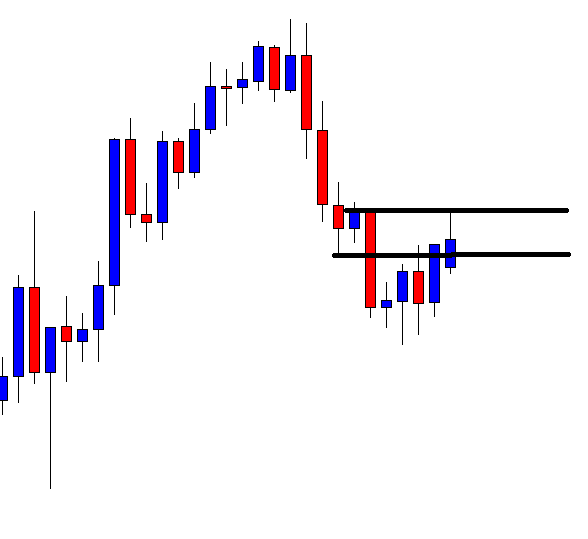
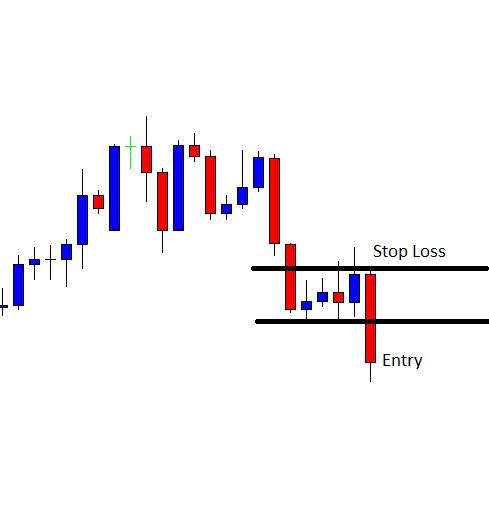
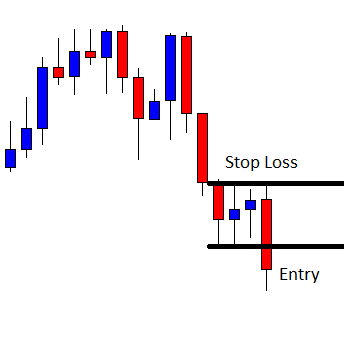
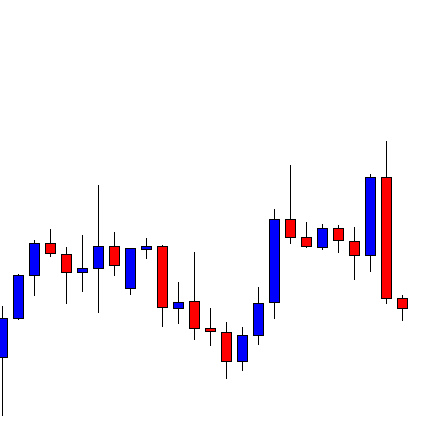
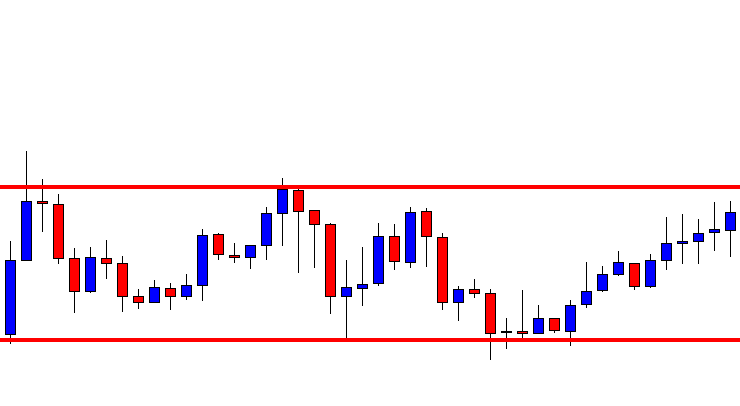
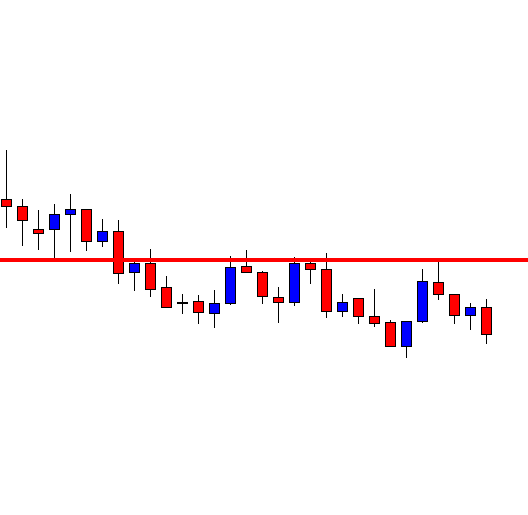
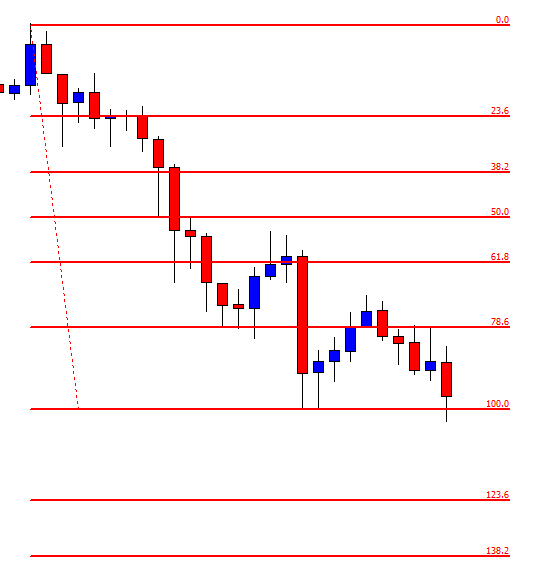
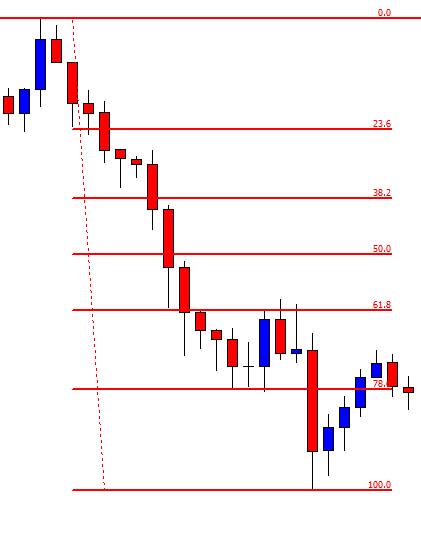
This is how the 15M chart looks. The buyers may wait for a 15M candle to close above the last H1 candle’s close. The chart suggests that the level of support is a strong one, which may push the price towards the North with good bullish momentum.

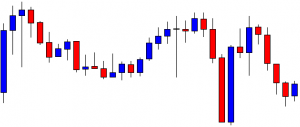
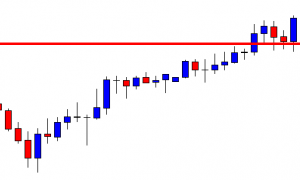
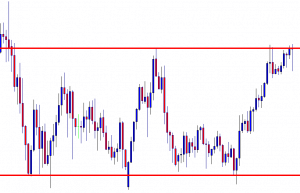
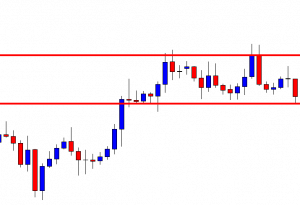
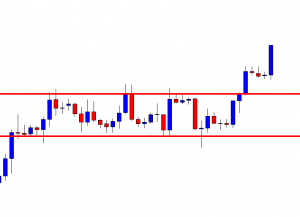
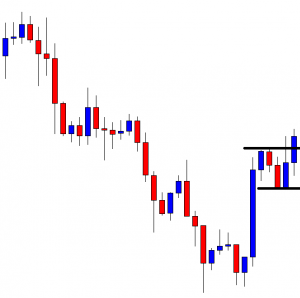
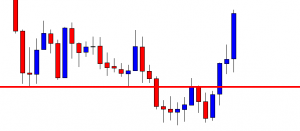
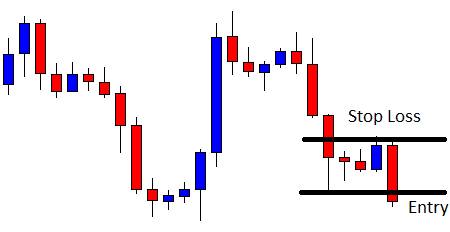
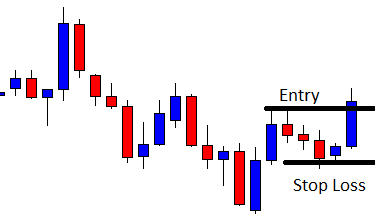
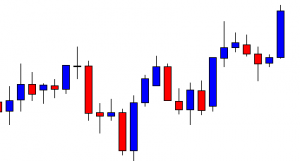
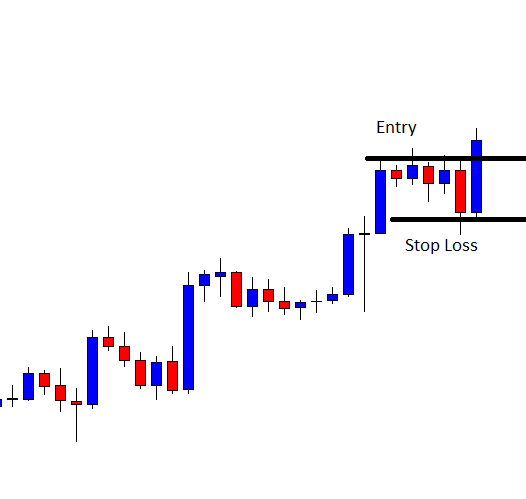
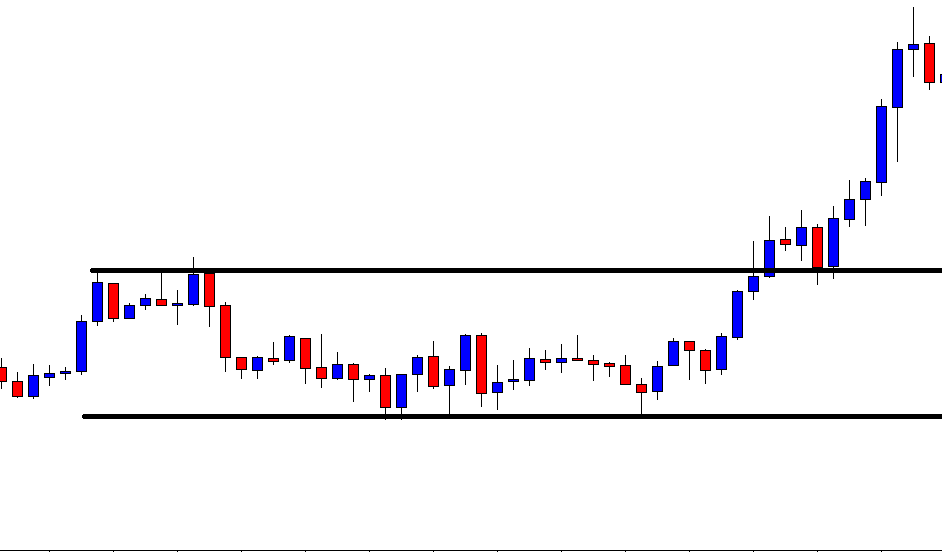
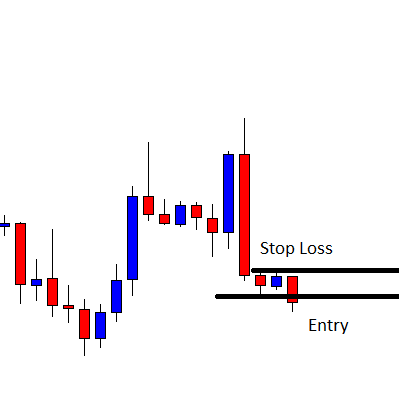
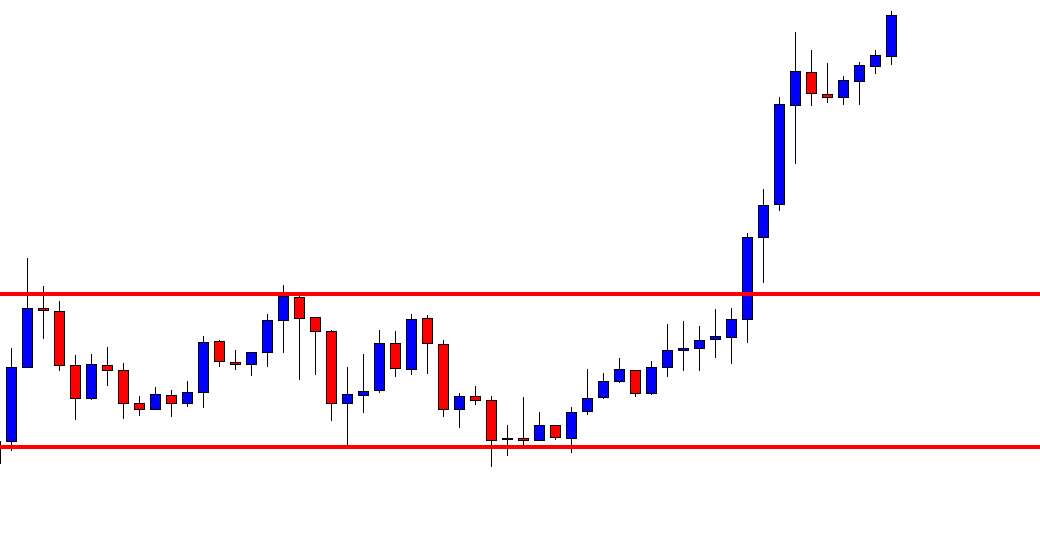
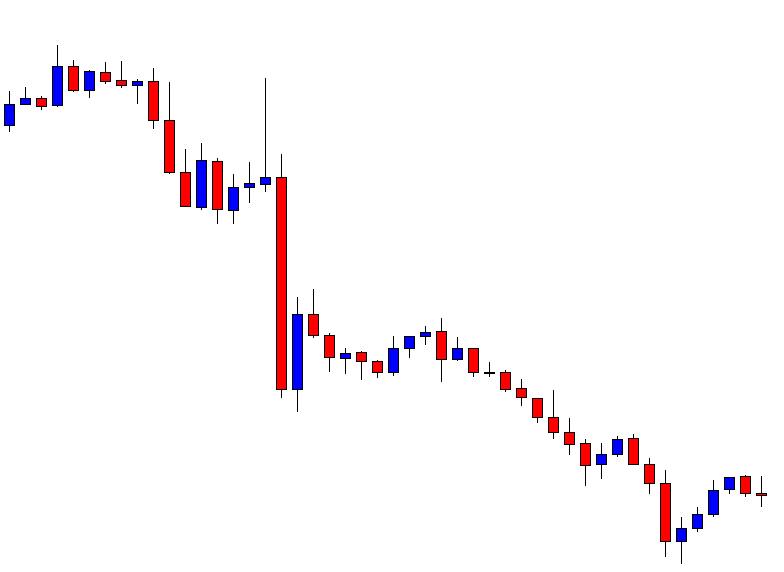
The last candle comes out as a bullish candle closing above the last H1 candle’s resistance. The buyers may trigger a long entry right after the candle closes by setting stop loss below the level of support. We find out the level take profit with the help of Fibonacci levels.

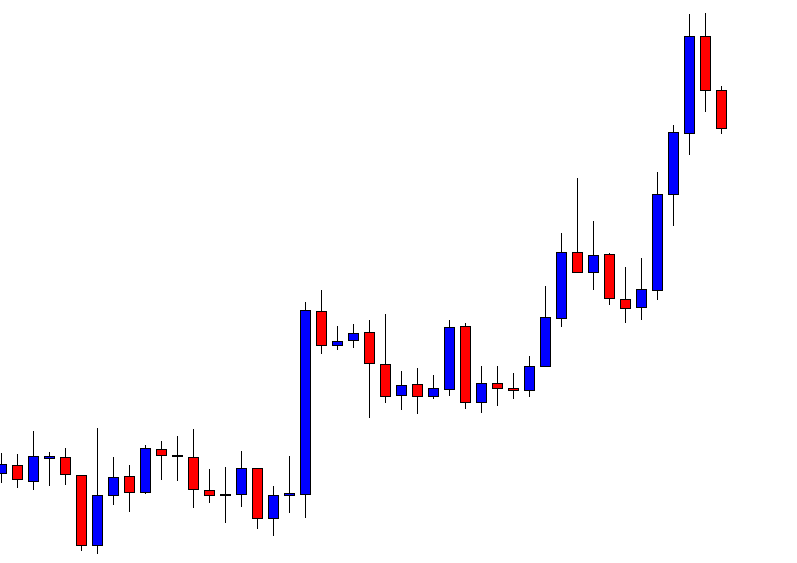
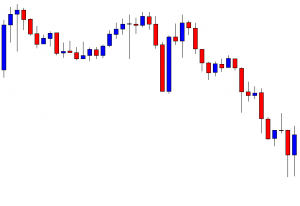
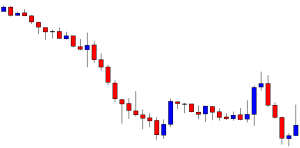
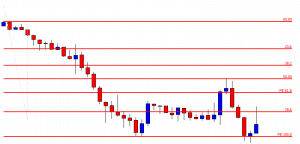
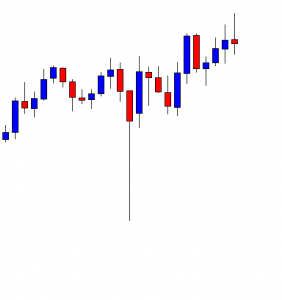
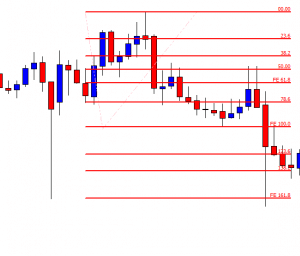
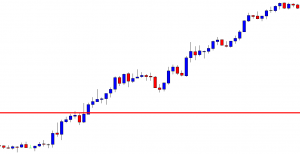
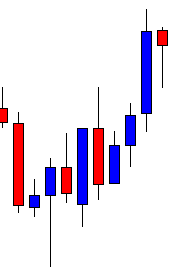
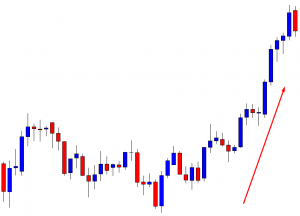
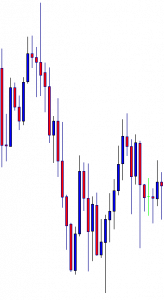
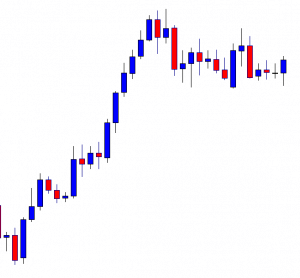
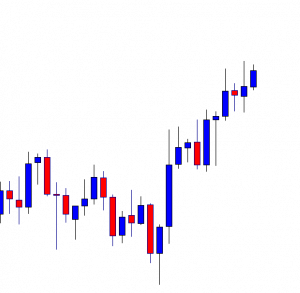
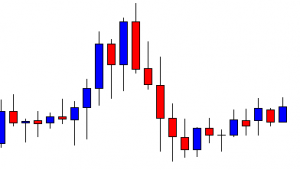
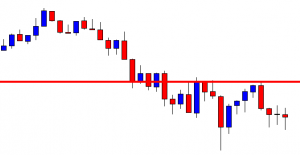
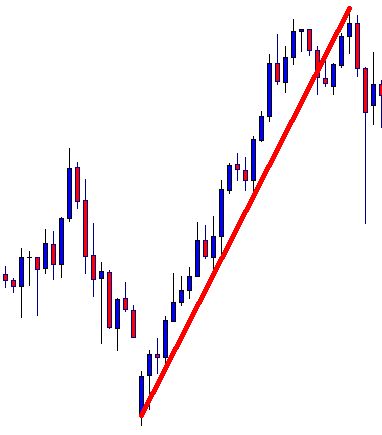
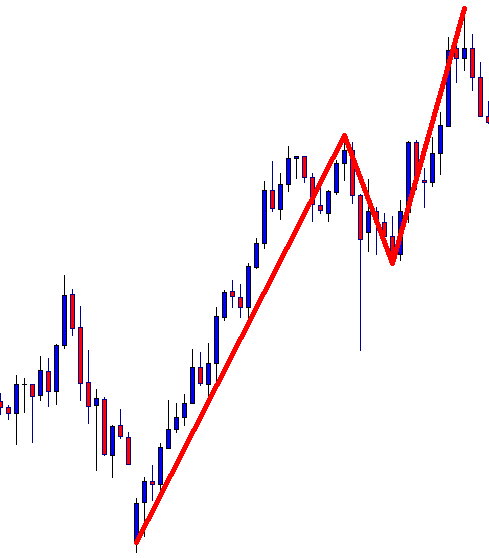
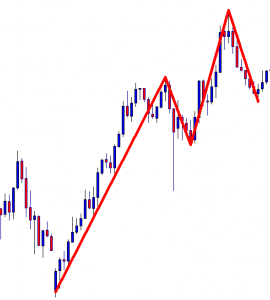
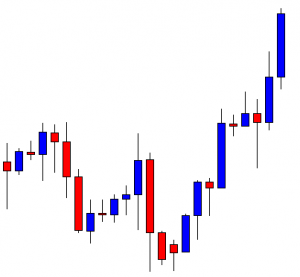
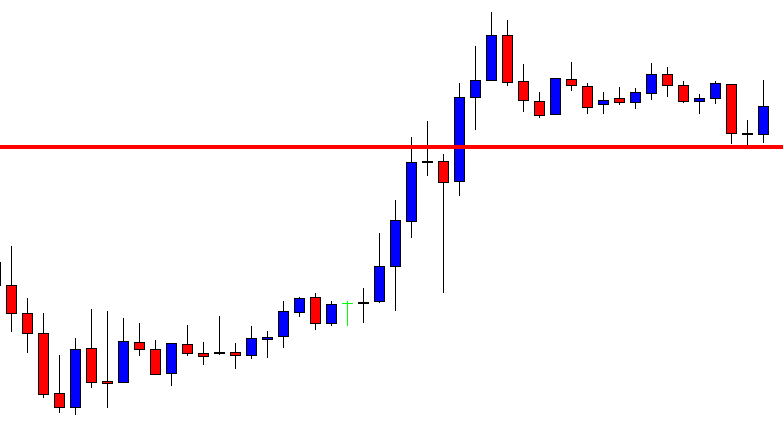
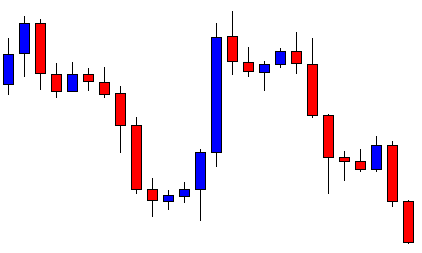
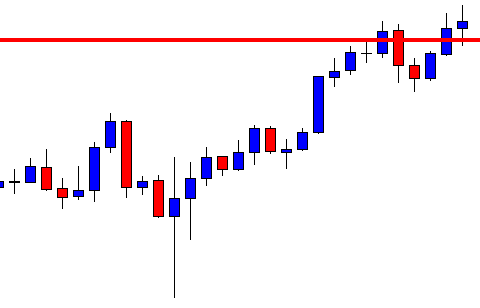
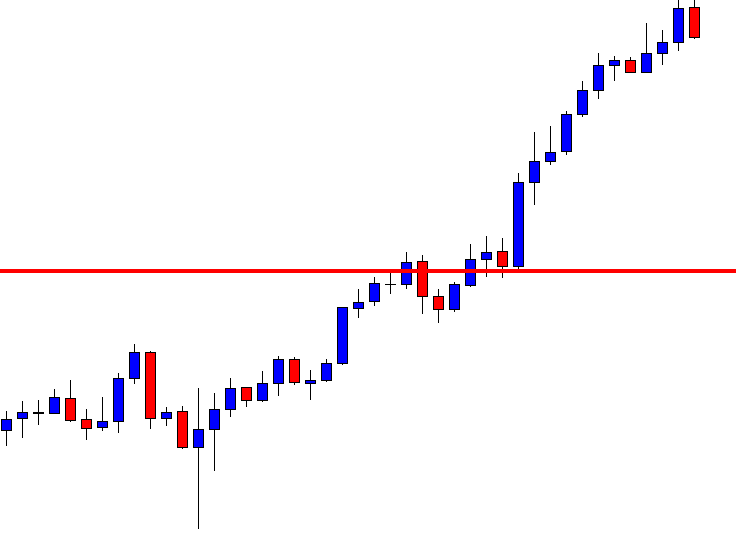
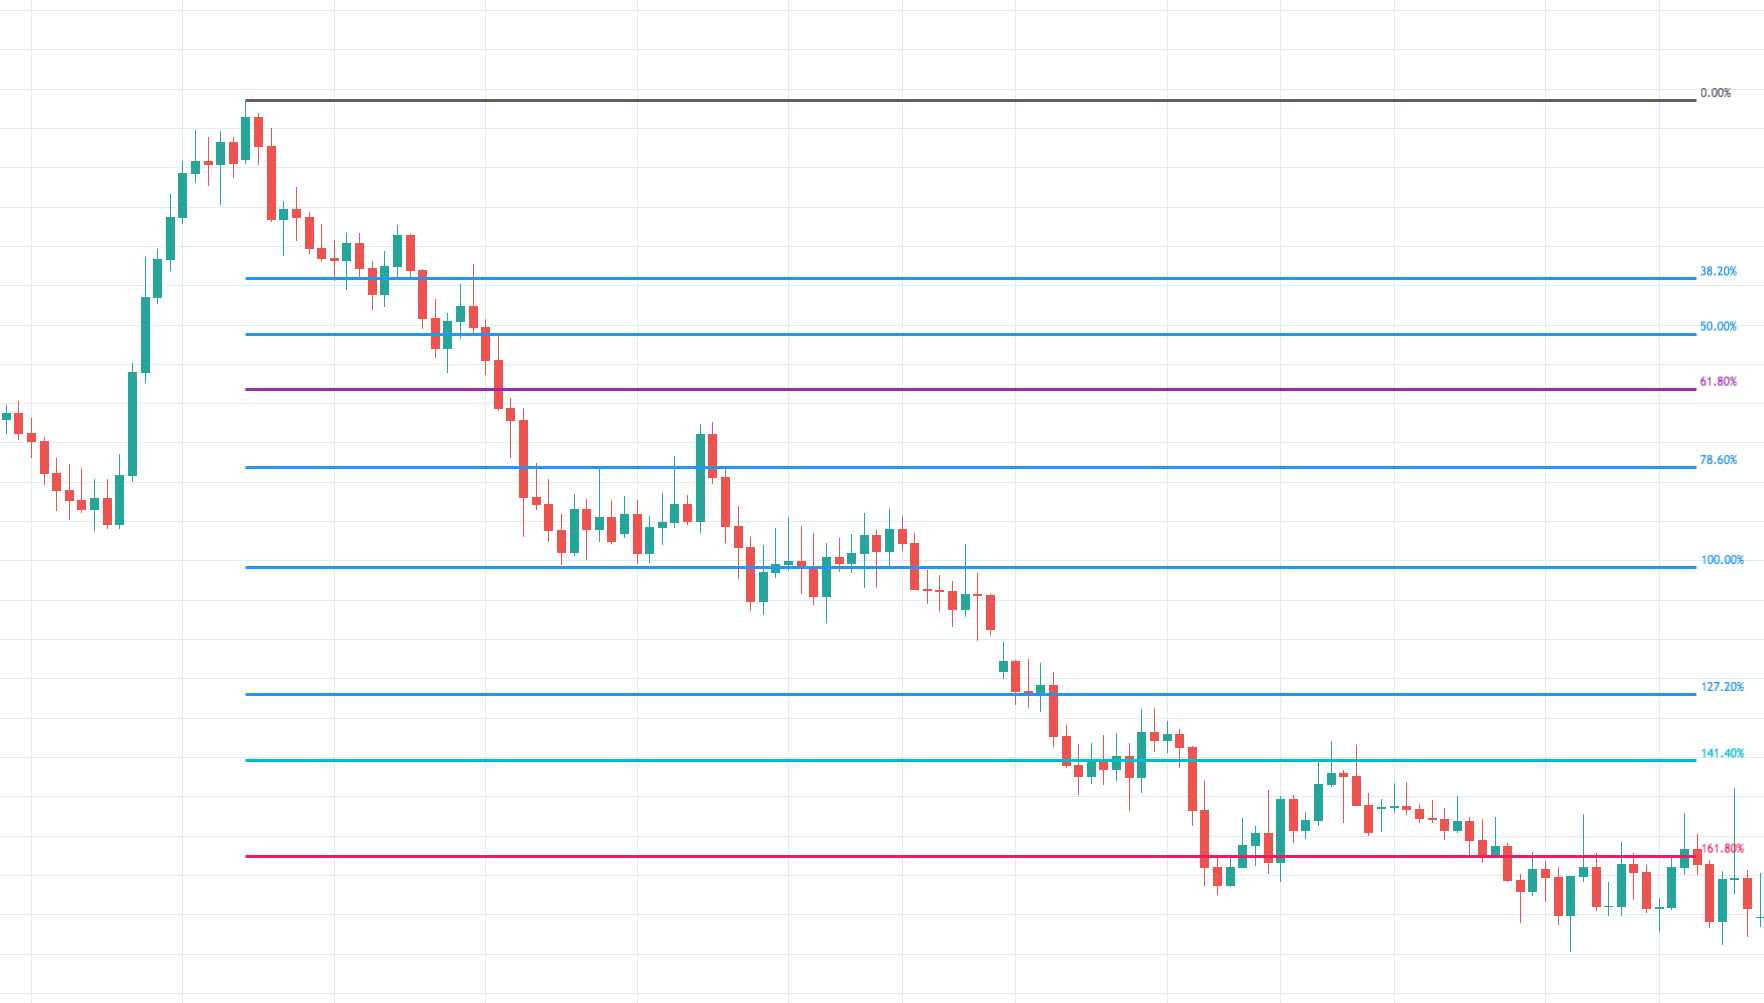
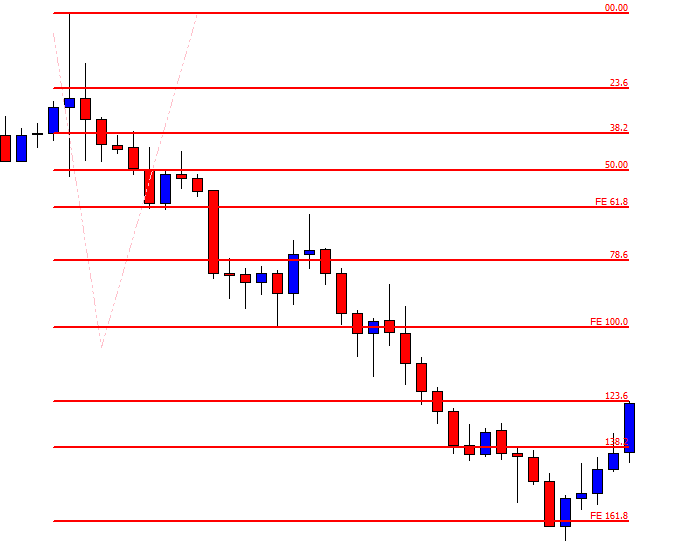
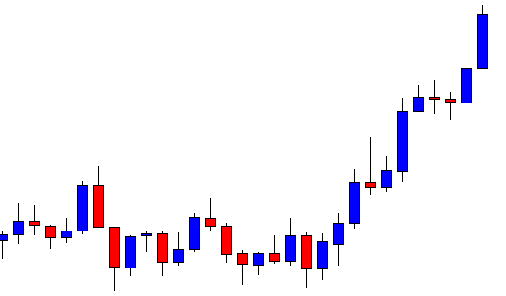
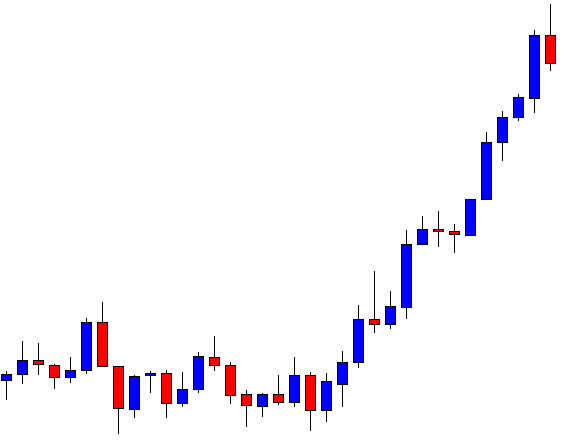
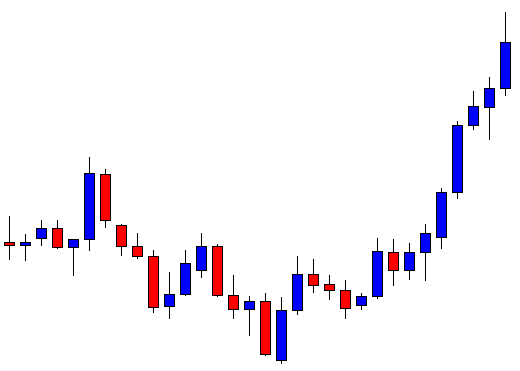
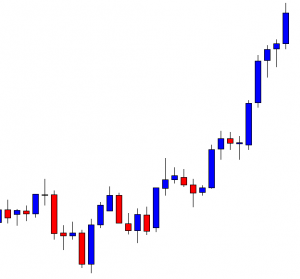
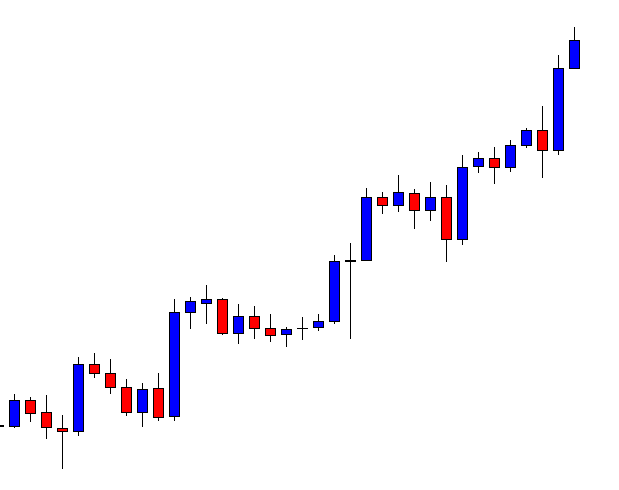
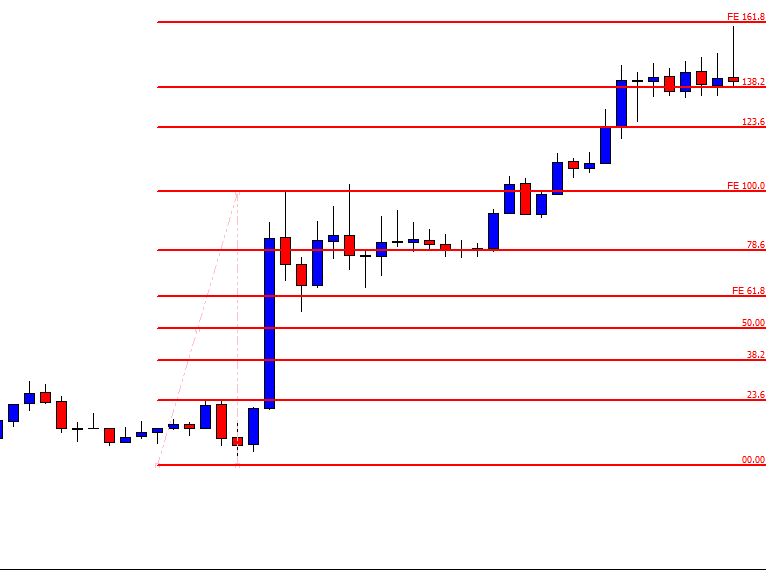
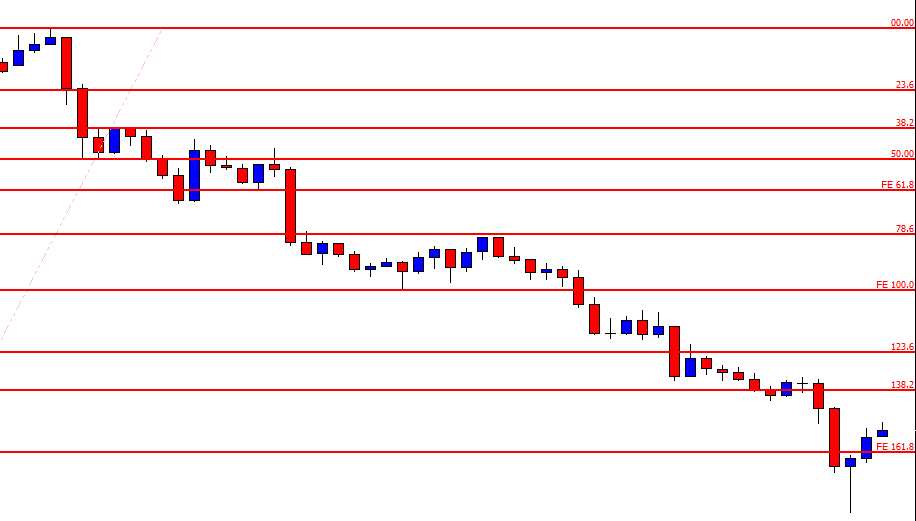
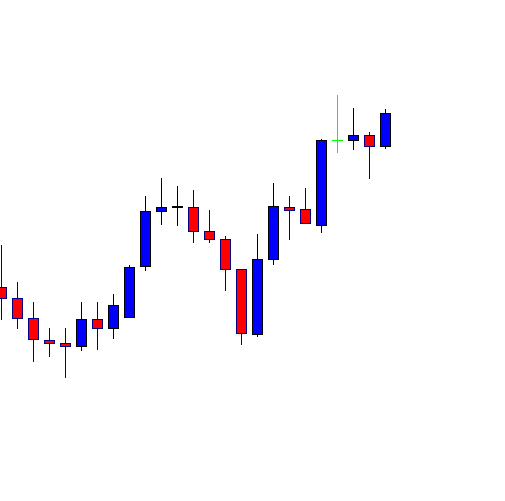
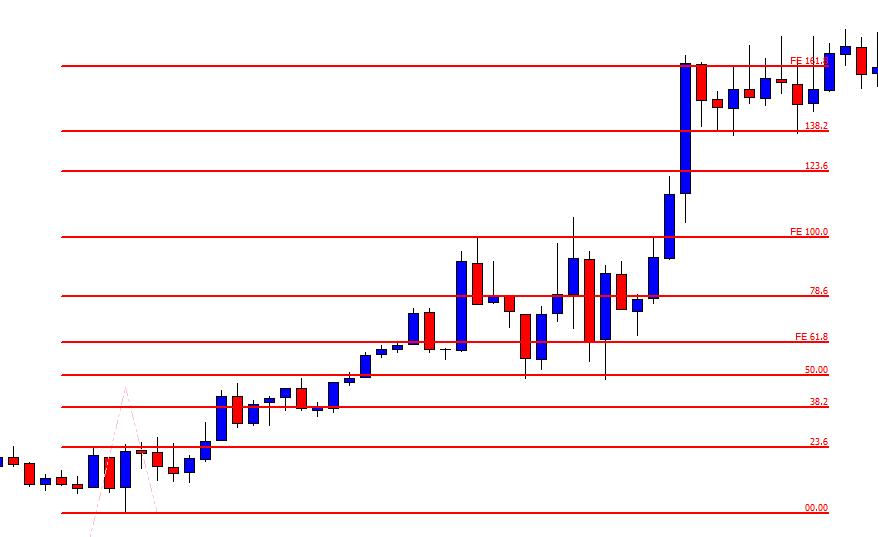
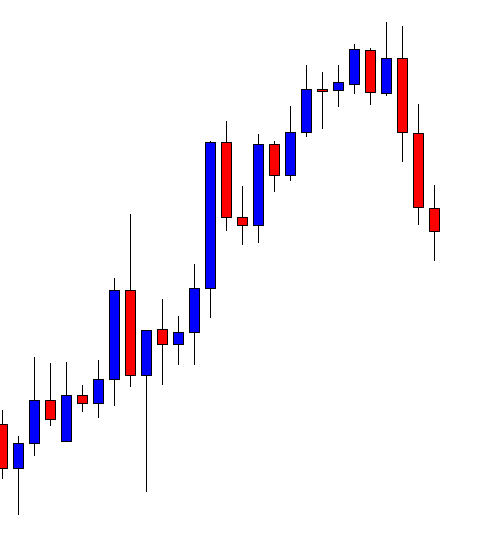
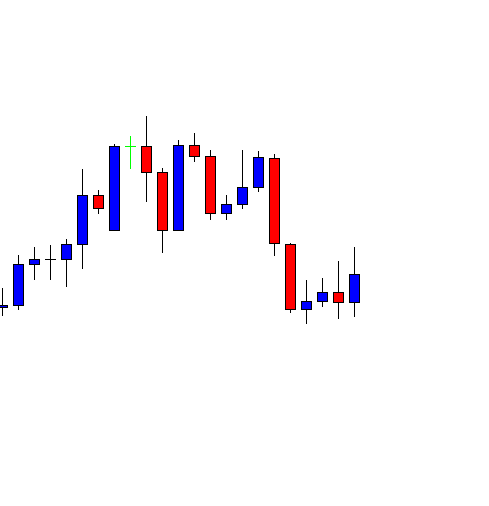
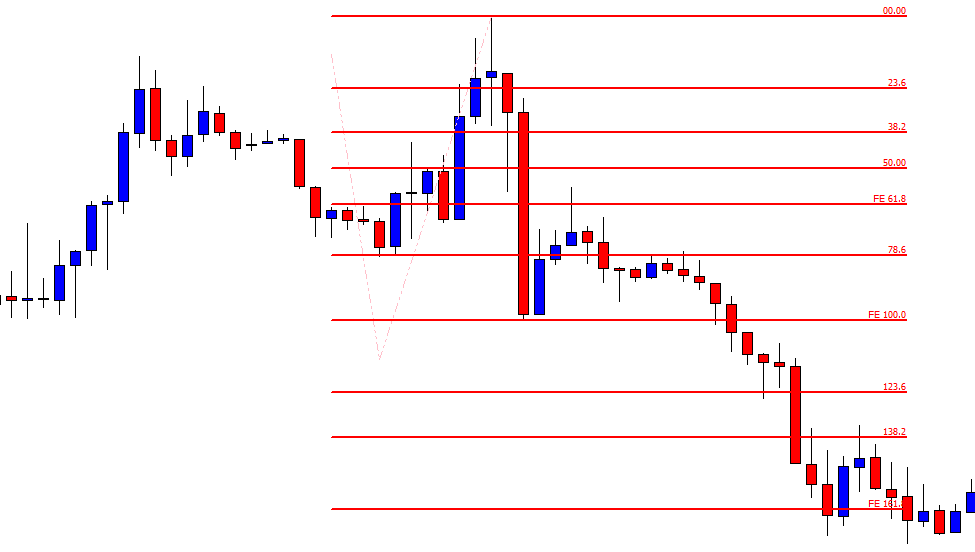
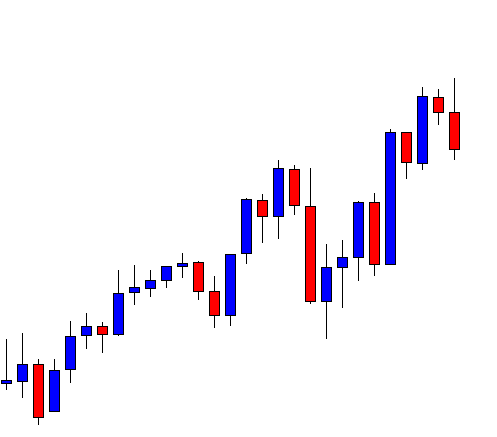
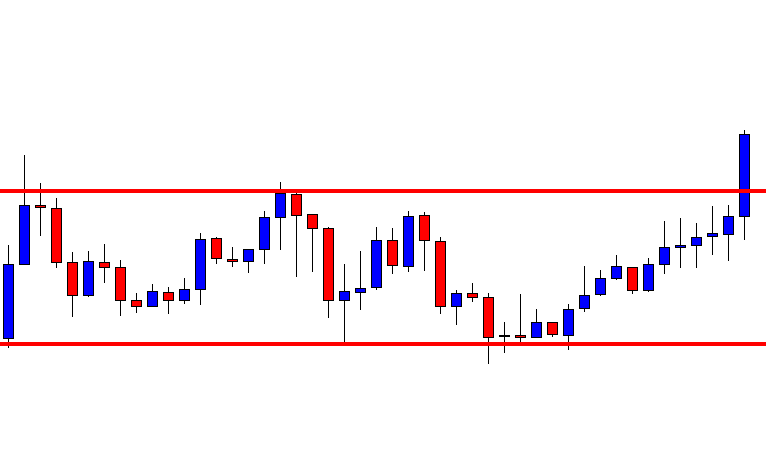
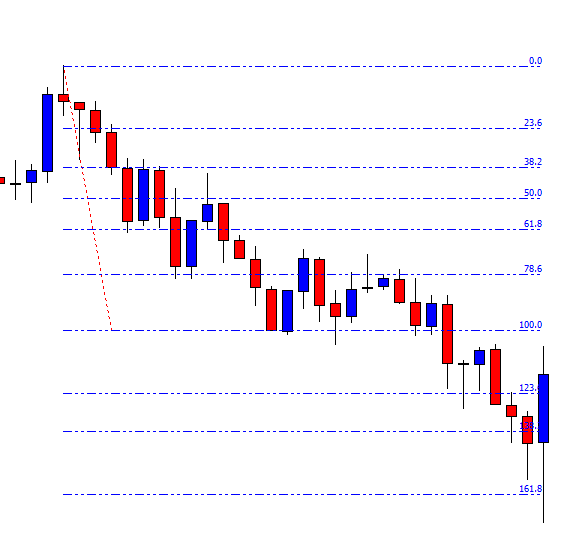
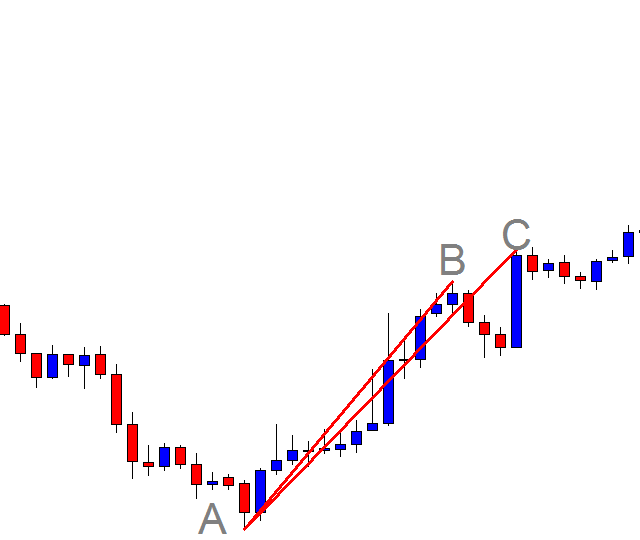
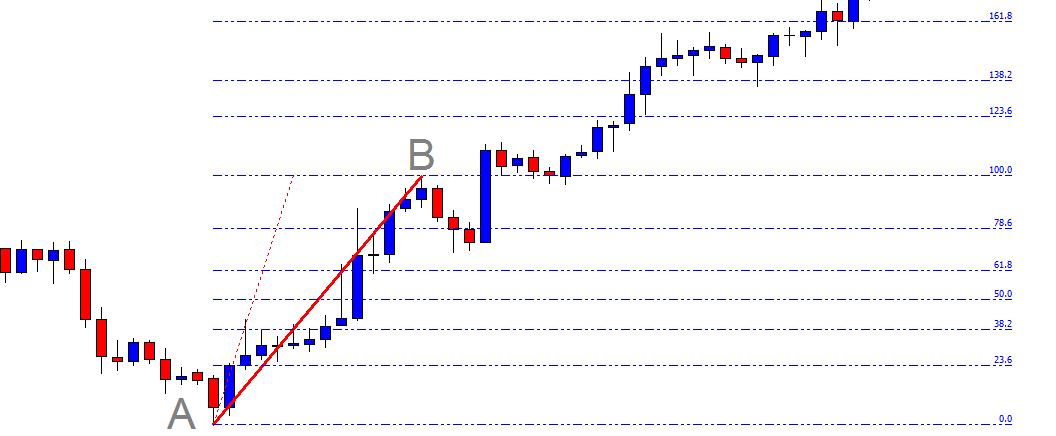
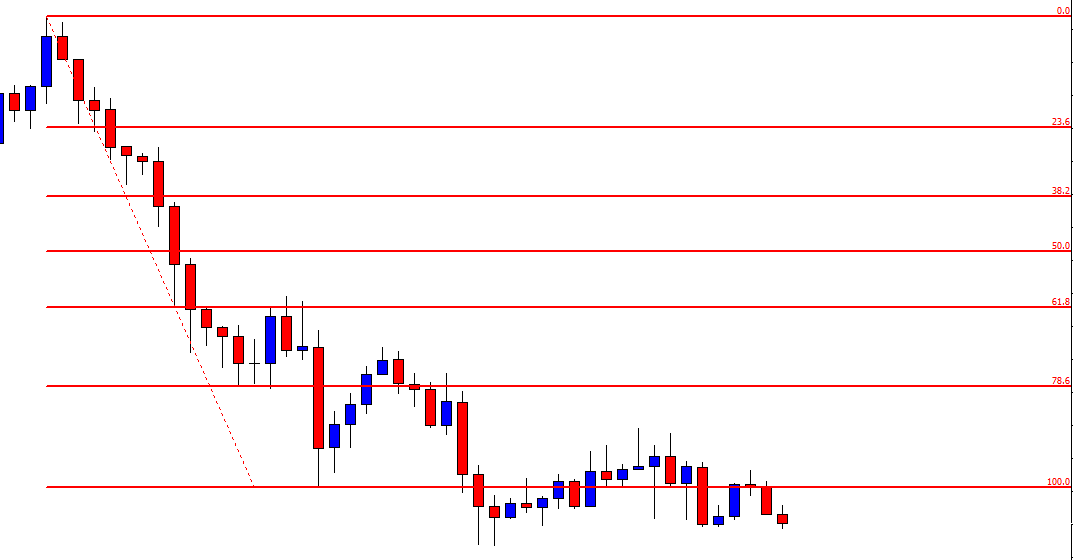
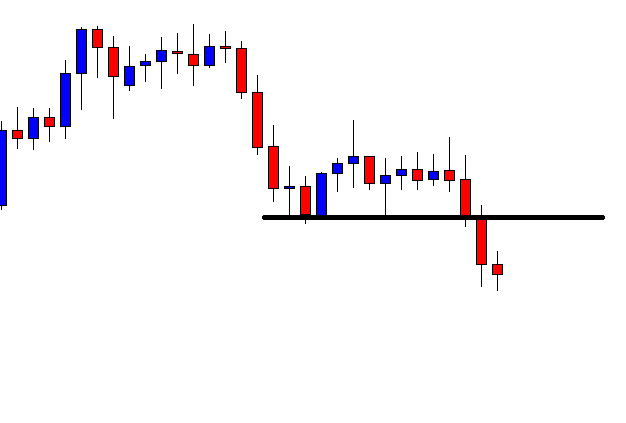
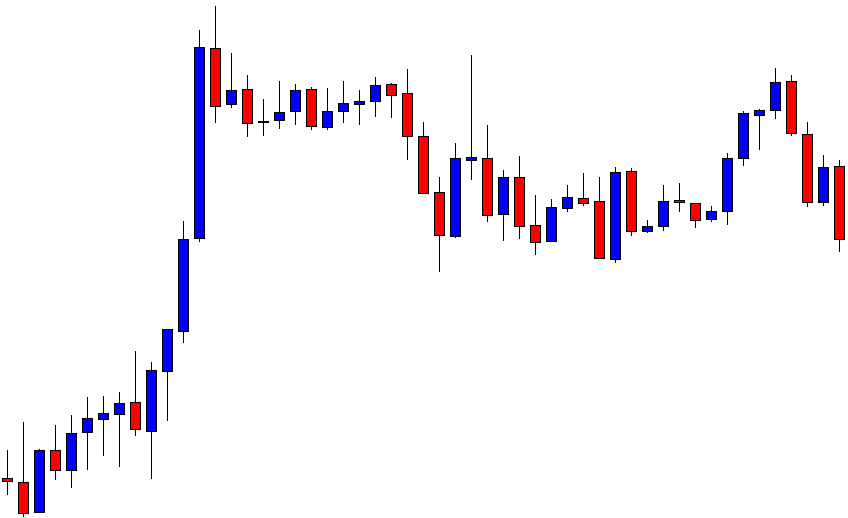
See how the price moves towards the North. The price makes a bullish move and makes a new higher high. It makes a bearish correction and then heads towards the North again. Let us draw the Fibonacci extension on the chart.

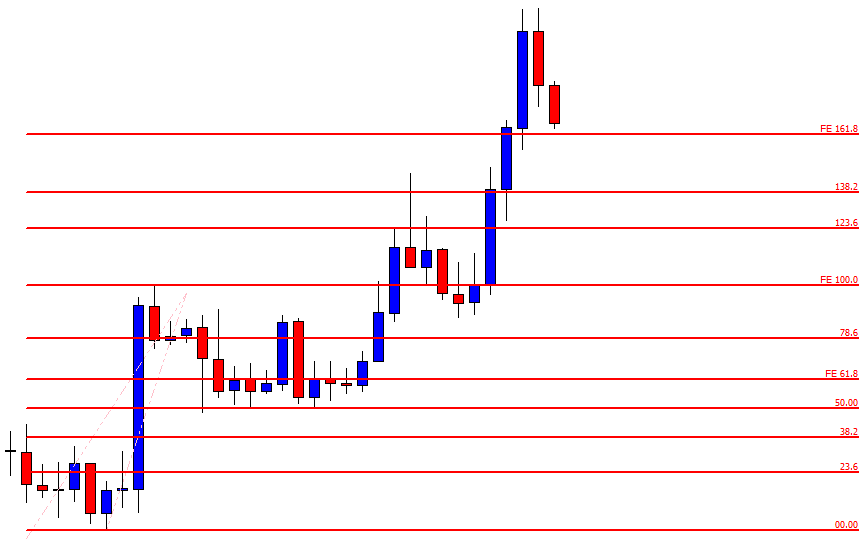
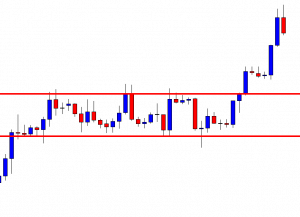
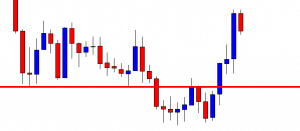
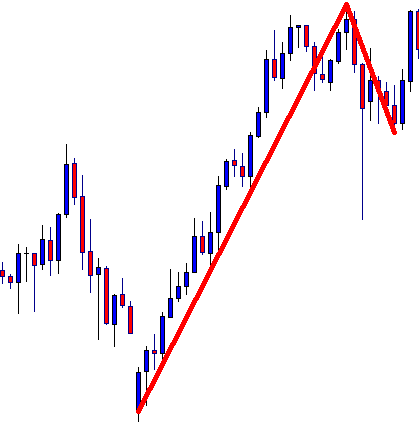
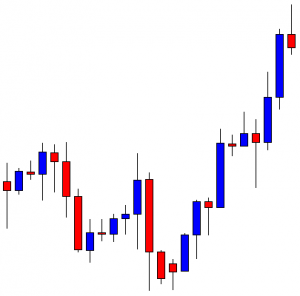
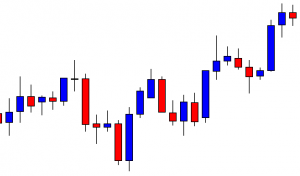
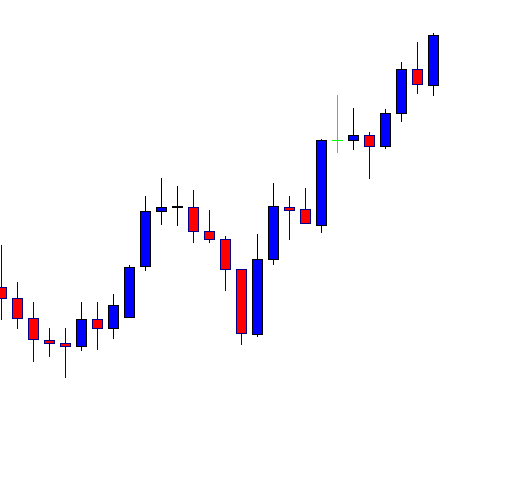
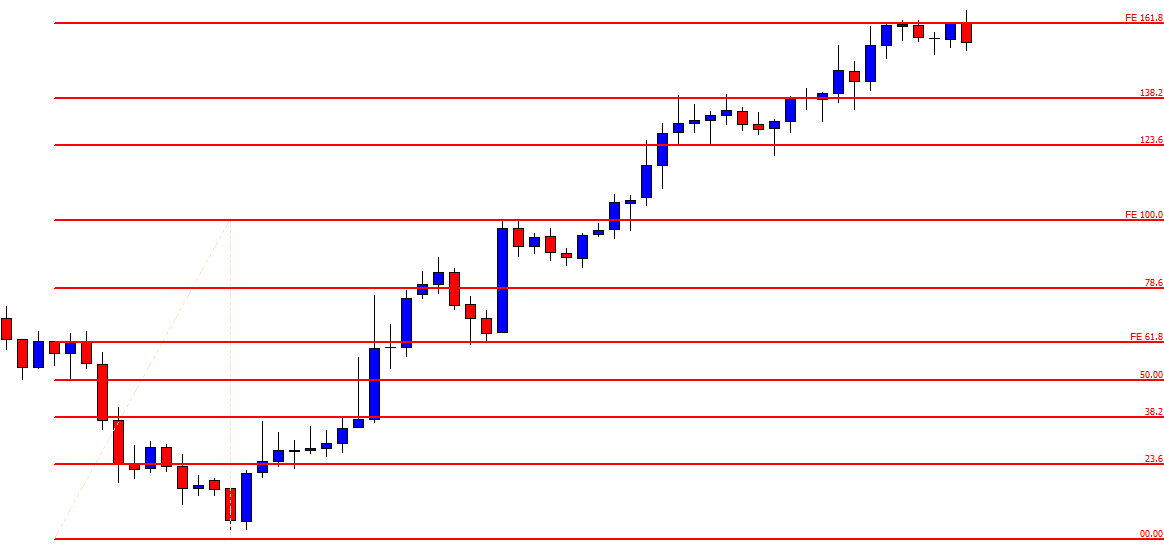
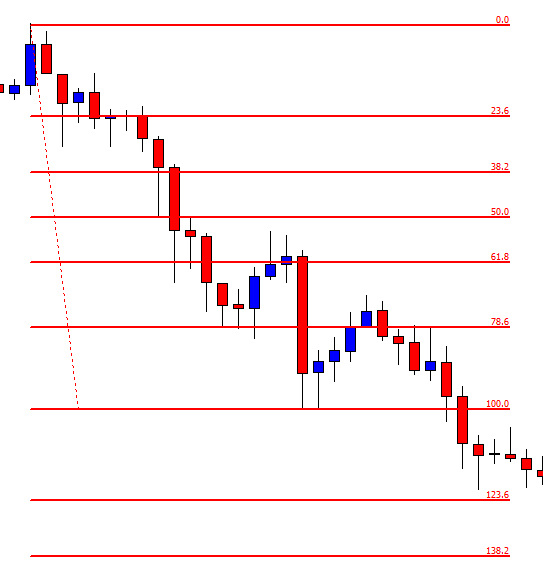
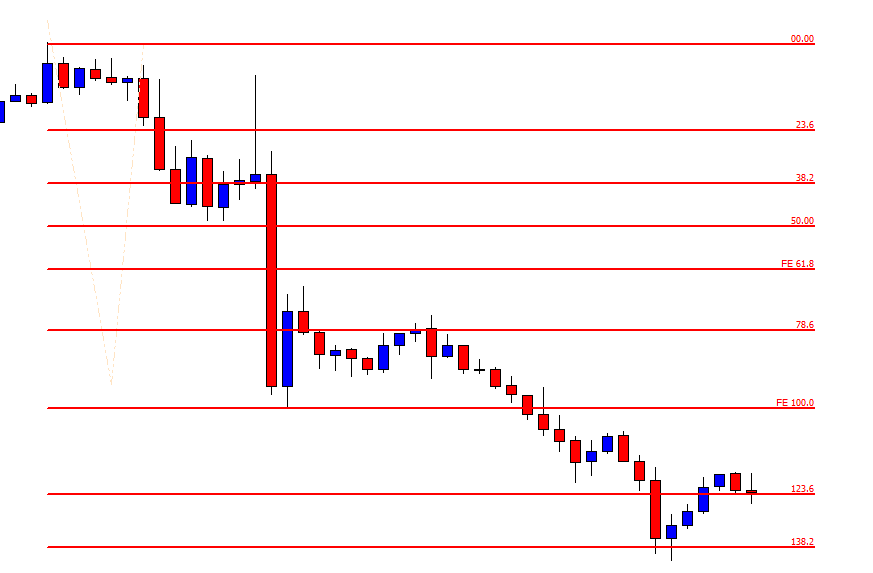
The Fibonacci level shows that the price hits 161.8%. It goes even further up. It makes a bearish correction before producing the last wave. The level of 100% works as a level of support.

We have seen how important it is that the 15M chart produces a bullish continuation candle to offer an entry. At the first reversal, the price does not head towards the North since the chart does not produce any 15M bullish continuation. On the second occasion, it produces  a bullish continuation, and the buyers find an opportunity to go long and push the price towards the magic Fibonacci level of 161.8%


Categories
Forex Daily Topic Forex Price Action

It Often Makes You Wait Longer Than You Want

In today’s lesson, we are going to demonstrate an example of a daily-H4 chart combination entry. The daily char produces a bearish engulfing candle at a significant level of resistance. It makes the daily-H4 chart combination traders flip over to the H4 chart to look for a potential entry. The H4 chart shows that the chart creates a double top. Simply, an ideal combination for the traders to go short on that chart. However, things do not go as smoothly as traders expect it to go in the Forex market. Let us find out what happens.

This is the daily chart. The chart shows that the price, after being bullish, has a rejection at the level of resistance marked with the red line. The price comes down and makes a bullish move again. If it makes a breakout, the buyers may push the price further up. On the other hand, sellers are to wait for the price to produce a bearish reversal candle to consider short opportunities. Let us find out what happens next.

The chart produces a bearish engulfing candle. Since it shows in the daily chart, the combination traders may flip over to the H4 chart to look for a short opportunity. A double top resistance and a bearish engulfing candle suggest the sellers may jump in here to drive the price towards the South further.

It is the H4 chart. The chart produces a double top and makes a breakout at the neckline. The combination traders are to wait for the price to consolidate and produce a bearish reversal candle to go short below consolidation support. The price consolidates here. However, considering consolidation length, it is better to skip such entry.

The price heads towards the South with extreme bearish pressure. It travels a long way to produce a bullish reversal candle. The sellers would love to get the reversal candle earlier though. Anyway, it is better late than never.

The chart produces a bearish engulfing candle closing well below consolidation support. The sellers may trigger a short entry right after the last candle closes by setting stop-loss above consolidation resistance with 1R.

The price heads towards the South with good bearish momentum and hits the target. It seems that the price may travel towards the South further. The point to be noticed here is that the chart consolidates after traveling a long way. It would give a better reward if it consolidated and produced the signal candle earlier. It makes the sellers wait for more as well. In the end, the sellers make a profit out of it but think how hard they are to concentrate on it to make it work for them.Traders’ life is not as easy as some people may think.

Categories
Forex Daily Topic Forex Price Action

Even a Fragile Breakout Makes the Price Move

In today’s lesson, we are going to demonstrate an example of a chart producing a double top and offering entry. The breakout does not look that promising though. However, the price heads towards the breakout direction and makes a long bearish move. Let us get started.

The chart shows that the price has a rejection at a level and makes a bearish move. Upon finding its support, it produces a bullish engulfing candle and heads towards the North. The chart produces a bearish inside bar around the level of double top resistance. It may attract the sellers to keep their eyes on the chart to go short upon a neckline breakout.

The price heads towards the South with good bearish momentum. The last candle comes out as a bullish inside bar. It is a sign that the chart may get choppy instead of making a breakout at the neckline. However, we never know. The sellers may keep patience and wait for a bearish breakout.

The price consolidates for a while and makes a bearish move. The last candle closes below the neckline. It is a kind of breakout that the sellers are waiting for, but it is a breakout. Let us wait and see what the price does here.

The chart produces a spinning top. The candle closes within the breakout level. Thus, it is a valid breakout. The sellers may wait for the chart to produce a bearish engulfing candle closing well below the last swing low. Let us proceed to the next chart.

Look at the last candle. The candle comes out as a bearish engulfing candle closing well below the last swing low. The sellers may trigger a short entry right after the last candle closes by setting stop-loss above the breakout level and take profit with 1R.

The price heads towards the South with excellent bearish momentum. It hits the target of 1R in a hurry too. This means the trade setup has worked for the sellers nicely. Considering the breakout factor, the trade setup is not an A+ trade setup. However, we may consider two important factors here.

  1. Double Top
  2. The signal candle.

These two factors are significant to make the price move. Yes, when an A+ momentum breakout goes with two of them, it gives us more chances to make a profit out of the trade. Today’s example shows that as long as it’s a breakout, upon the breakout confirmation, the price may head towards the trend direction with good momentum if the mentioned two factors meet all the requirements.


Categories
Forex Daily Topic Forex Price Action

To Hold It or Not?

In today’s lesson, we are going to demonstrate an example of an H4 chart offering entry after consolidation. The price does not head towards the breakout direction after triggering the entry as expected. It is Friday and the market is going to close. The question is whether we hold the position during the weekend or close the position. Let us find this out.

This is an H4 chart. The chart shows that the price heads towards the North with good bullish momentum. The last candle comes out as a bearish inside bar. The chart belongs to the buyers. The price may make a bearish reversal from here. The sellers must wait to get a strong bearish reversal pattern to go short in the pair.

The chart produces another bearish candle followed by a doji candle. The buyers may wait for the price to make a breakout at the wave’s highest high to go long in the pair.

The price heads towards the North but does not make a bullish breakout. If the chart produces a bearish reversal candle around the level, it may get bearish. On the other hand, the buyers may still be hopeful that they get a bullish breakout to push the price towards the North further.

The chart produces a bearish engulfing candle right at the double top resistance. It makes a breakout at the neckline as well. Thus, the sellers may keep their eyes on the chart to go short and drive the price towards the South.

The price consolidates for a while. It produces a bearish reversal candle, but it does not make a bearish breakout to offer a short entry. The last candle comes out as a bullish candle. Both the buyers and the sellers must wait and let the price decide to give them a direction.

The chart produces a bearish engulfing candle closing well below consolidation support. The sellers may trigger a short entry right after the last candle closes by setting take profit with 1R. Let us proceed to the next chart to find out how the trade goes.

The price consolidates again. The chart upon producing a bearish engulfing candle at a double top resistance and getting consolidation, it does not move towards the trend’s direction. The sellers do not expect that. However, this is how the market goes. The market is going to close within three hours. Do the sellers close the position?

It is an H4 chart. If it were other intraday charts such as the H1, 15 M, 5M, we may close the position. In this case, the reversal candle is an engulfing candle; the reversal pattern is a double top; the price consolidates accordingly, and the signal candle comes out as a bearish engulfing candle as well. Thus, considering these factors the sellers may hold the position.


Categories
Forex Fibonacci

Fibonacci Levels: How Much Does 50% Level Influence the Market?

In today’s lesson, we are going to demonstrate an example of a chart, in which the price makes a reversal from 50% Fibonacci level. We know if the price makes a reversal from 61.8%, it usually goes up to 161.8%; if it makes a reversal from 38.2%, it goes up to 138.2%. In both cases, traders get good risk-reward. Do you ever wonder what happens if the price makes a reversal from 50%? Let us find this out through an example.

The chart shows that the price heads towards the South with good bearish momentum. It produces two bullish candles and heads towards the South. Look at the last candle. It comes out as a bullish inside bar. It makes a bullish correction. However, the sellers may wait for a bearish engulfing candle to go short in the pair.

The price has been in a bullish correction. It produces some bearish reversal candles, but it does not create any bearish momentum. The last candle comes out with a little bullish body having a long upper shadow. Let us proceed to the next chart to find out what happens next.

The last candle comes out as a bearish engulfing candle. It is a strong sign that the price may head towards the South again. The sellers may flip over to the minor chart to trigger entry.

The price heads towards the South with extreme bearish pressure. The last candle comes out as a bearish Marubozu candle. It seems that the price may continue its bearish journey towards the South further. Let us find out what actually happens.

It does not continue its bearish journey. It finds its support. Upon producing a hammer, it heads towards the North with one more bullish candle. It seems that it may continue its bearish journey considering bearish engulfing candle as a reversal candle. Next, two candles come out as strong bearish candles too. What may be the reason that the price makes a bullish reversal here? Let us find this out with Fibonacci levels.

If we calculate, we find that the price makes a bearish reversal from Fibonacci 50% level. It then heads towards the South with extreme bearish momentum. However, it finds its support at the Fibonacci 100.00 level. Usually, this is what happens when the price trends from the 50% level. A question may be raised here whether we should take entry if the price trends from the 50% Fibo level. It depends on risk-reward. If it offers a good reward, then we may take an entry. In most cases, it does not offer a good reward; thus, we may skip taking those entries.


Categories
Forex Price Action

Price Action Trading: Factors that you should Remember

In today’s lesson, we are going to demonstrate an example of a chart offering an entry upon producing a bullish reversal candle followed by a breakout. The chart produces a bullish reversal candle earlier too, but that did not make the price move towards the North. We’ll try to find out why it does not head towards the North at its first attempt. Let us get started.

The chart shows that the price heads towards the North upon producing an ABC pattern. We may notice that we have four significant points here, such A, B, C, and D. The price most likely reacts at these levels again. Let us proceed to the next chart.

The price heads towards the South at a moderate pace. The last candle comes out as a bearish Marubozu candle. It seems that the price may remain bearish for a while. Let us proceed to the next chart to find out what happens next.

The chart produces an inverted hammer. It is a sign of a bullish reversal. However, considering point B, the price makes a bearish breakout at the level. Thus, the pair may continue its bearish move. The sellers may look for short opportunities in the minor chart.

The next candle does not make a bearish breakout. It comes out as a bullish candle. The last candle comes out as a Doji candle. Ideally, neither the bull nor the bear dominates in the pair. The sellers are to wait for the price to make a breakout at the last swing low. The buyers are to wait for the price to make a bullish reversal candle closing above consolidation resistance. Let us see what the price does.

The price comes down. It produces a bullish engulfing candle. Some sellers may have to encounter a loss here. Upon creating the bullish engulfing candle, the price heads towards the North with good bullish momentum. Now a few questions may be raised here.

  1. Why does the price not head towards the North but comes down?
  2. Why does the price not continue its bearish move but produces a bullish engulfing candle?
  3. Why does not price head towards the North at its second attempt?


Have a look at the chart below with some drawings in it.

At its first attempt, the price does not make a breakout at the level of resistance drawn. The price reacts at this level several times. Thus, this is a crucial level, which is to be counted by the buyers before taking long entries. The price finds its resistance here and makes a bearish move. It finds its support at the drawn line, where the price reacts to it earlier as well. The reversal candle comes out as a Doji candle, and the chart takes four candles to make the breakout. This is one of the reasons that the price does not continue its bearish move.

At its last attempt, it produces a bullish engulfing candle, the candle is produced at a key level, the price makes a breakout at the last swing low, and the breakout candle comes out as a strong bullish candle. These factors attract more buyers and make the price move towards the North with good bullish momentum. We need to remember such factors every time we take entries as far as price action trading is concerned.

Categories
Forex Daily Topic Forex Fibonacci

Tweezer Top/Tweezer Bottom and Fibonacci Levels

In today’s lesson, we are going to demonstrate an example of a Tweezer Top forming at a significant Fibonacci level. We’ll find out the impact of a tweezer top in the chart. Let us get started.

The chart shows that the price has a rejection at a level of resistance twice. At the second bounce, it produces a doji candle. A doji candle is not considered a strong reversal candle. If the next candle comes out as a bearish engulfing candle, the sellers may keep their eyes in the pair to look for short opportunities.

The next candle comes out as a bearish engulfing candle. It makes a strong statement that the bear has taken control. Double top support, along with a bearish engulfing candle, usually attracts more sellers to look for short opportunities.

The price consolidates and finds its resistance. The chart produces a bearish engulfing candle. The sellers may go short right after the last candle closes with 1R. Let us proceed to the next chart to find out how the entry goes.

The chart shows that the price heads towards the South with good bearish momentum. It hits 1R at a moderate pace. It finds its support again and heads towards the North to make a bullish correction. Look at the last two candles. The first candle comes out as a bullish candle, and the last candle comes out as a bearish candle, both having a long upper shadow. The combination of these two candles is called “Tweezer Top”. Tweezer Top is considered one of the strongest bearish reversal patterns. Those two upper shadows suggest that the price has a strong rejection at the level of resistance. The bearish body of the last candle suggests that the bear may take over. Another point we may consider whether it is produced at a significant level or not. By drawing the Fibonacci extension, we may find this out. Let us draw Fibonacci extension and find out how far the price travels towards.

We see that Tweezer Top is formed right at the 61.8% level. Usually, the 61.8% level drives the price towards the level of 161.8%. This is what happens here, as well. The price hits the level of 161.8% within the next candle.

We know how handy drawing Fibonacci level can be in trading. Especially, 61.8% and 38.2% level plays a very significant role in driving the price with good momentum. If we get a strong reversal pattern such as Tweezer Top or Tweezer Bottom, it adds more pressure. Thus, the traders do not have to wait long to achieve their target.

Categories
Forex Daily Topic Forex Price Action

Reversal Breakouts Offer a Lot

The trend is traders’ friend. Breakout is traders’ best friend. In today’s lesson, we are going to demonstrate an example of an H1 breakout, which makes a reversal even in the daily chart. Thus, the price heads towards the breakout direction with good momentum ending up offering an excellent reward. Let us get started.

The chart shows that the price makes a strong bearish move and finds its support. Upon producing a bullish engulfing candle, the price heads towards the North at a moderate pace. The price does not make a breakout at the last swing high. Thus, the chart is still bearish biased. Please note, the H1 chart does not show, but the daily trend has been bearish in this chart.

The chart shows that one of the candles breaches through the last swing high, closing well above the level. The last candle comes out as a bullish candle as well. It confirms the breakout. The buyers may wait for the price to consolidate and get a bullish reversal candle to go long in the pair.

The last two candles come out as bearish candles. The spinning top closes within the level of support. If the level produces a bullish engulfing candle, the buyers may go long in the pair.

The last candle comes out as a bullish engulfing candle closing well above consolidation resistance. The buyers may trigger a long entry right after the candle closes by setting stop loss below the level of support and by setting take profit with 1R.

The price heads towards the North with extreme bullish momentum. The way the chart looks, it seems it may continue its journey for a while. The chart shows that the buyers achieve their target within the next two candles after triggering the entry. Let us proceed to the following chart to see what the price does.

The last candle comes out as a bearish engulfing candle. It is produced at the second rejection as well. This means the chart forms a double top here. A double top resistance forming a bearish engulfing candle suggests that the price may make a bearish move here. However, if we calculate the length of the bullish move, it ends up being a very good one. This is what usually happens when the price makes a breakout at the last daily candle’s highest high when the daily chart is bearish and if the breakout takes place at the lowest low when the daily trend is bullish. Make sure the price consolidates and produces a strong reversal candle at the breakout level. If that happens, it often ends up offering an excellent reward in the end.

Categories
Forex Price Action

H1-15M Combination Trading: Consolidation Level May Vary

In today’s lesson, we are going to demonstrate an example of an H1-15 chart combination trading. The price makes a strong bearish move in the daily chart. Then, it is trapped within two horizontal levels. Next, it makes a bullish breakout and ends up offering an excellent entry. Let us get started.

This is the H1 chart. The chart shows that the price is trapped within two horizontal levels. Upon having a bounce, the price heads towards the North. The buyers are to wait for the price to make a bullish breakout at the level of resistance. Let us proceed to the next chart.

The chart shows that the price heads towards the North and trades above the level of resistance upon making a bullish breakout. The H1-15M chart combination traders are to wait for the price to consolidate and produce a bullish reversal candle to offer them a long entry.

Here it comes. One of the candles comes out as a bearish engulfing candle. However, the next candle comes out as a bullish engulfing candle closing above consolidation resistance. The H1-15M combination traders may flip over to the 15M chart to trigger a long entry.

This is how the 15M chart looks, and it looks very bullish. The buyers are to wait for a bullish candle to close above the last candles to trigger a long entry. As far as the recent price action is concerned, it may not take too long to produce a 15M signal candle.

The chart produces two bearish candles and consolidates. The last candle comes out as a bullish engulfing candle closing well above consolidation resistance. The buyers may trigger a long entry right after the last 15M candle closes by setting a stop-loss order below consolidation support and by a take-profit target with 1R. Let us find out how the trade goes.

The price heads towards the North with good bullish momentum and hits 1R in a hurry too. It keeps going towards the North. It may extend its bullish wave as well. Ideally, the price is to consolidate around the breakout level.

In this example, the price consolidates way above the breakout level. It often happens in the H1 chart. It does not mean that we do not get the opportunity to take an entry. Chart combination trading may help us take entries in such a situation. Once a breakout takes place (H1 chart), we are to wait for the price to consolidate and produce a reversal candle. Then, we are to flip over to the 15M chart and wait for the trend continuation to trigger entry.

Categories
Forex Daily Topic Forex Price Action

If Double Bottom/Top Does Not Offer Entry, Wait for Triple Bottom/Top

In today’s lesson, we are going to demonstrate an example of double bottom support, which does not end up producing entry. However, the price comes back to the level of support again, and upon producing a triple bottom, support offers a beautiful trade setup. Let us get started.

This is the daily chart. The price makes a strong bearish move and bounces off at a level of support. It produces a bullish inside bar and heads towards the North. The price comes back to the level of support again upon producing a bullish engulfing candle. The buyers may flip over to the H4 chart for the price to consolidate and produce a bullish engulfing candle to trigger a long entry.

We are still on the daily chart. The H4 chart does not consolidate or produce a bullish reversal candle. On the daily chart, the price comes down again and consolidates around the level of support. Both the buyers and the sellers are to wait for the price to see what it does. Does it produce a bullish reversal candle, or does it make a bearish breakout?

The chart produces a bullish engulfing candle at the level of support again. It has become a level of triple support. Thus, the buyers may be more interested in going long in the pair. The buyers may flip over to the H4 chart now.

This is how the H4 chart looks. The last candle comes out as a hammer. The buyers are to wait for a bullish engulfing candle to trigger a long entry. Let us proceed to the next chart to find out what the price does.

The price consolidates for four more H4 candles. At last, it produces a bullish engulfing candle closing well above consolidation resistance. It takes a long time to produce the signal candle, but it does just before the day ends. It is a valid signal. The buyers may trigger a long entry right after the last candle closes by setting take profit with 1R.

The price heads towards the North with good momentum and hits the target. The extreme bullishness of the signal candle makes the price hit the target in a hurry.

If we look back, when the chart produces the first bullish engulfing candle at the level of double bottom support, it does not end up offering an entry. When it bounces again at the same level of support, it ends up offering an entry. This is what may happen more often than traders think. If a buyer leaves the chart when it does not offer entry, he will lose the chance to make a profit from the trade setup that we have demonstrated here.

Categories
Forex Chart Basics

How to Guess Support/Resistance Level Well Ahead?

In today’s example, we are going to demonstrate an example of a fundamental character of support/resistance. We know the importance of support/resistance in trading. Thus, if we get a clue about spotting support/resistance well ahead, it comes out handy. Let us find out whether it is possible or not.

This is a daily chart. The chart shows that the price heads towards the North with good bullish momentum. It makes bearish correction and keeps resuming its bullish journey. With naked eyes, we see that the price finds its support at three points. Let us investigate the chart with some drawings on it.

We have spotted out three points where the price gets rejection twice. When the price makes a bullish move, at its second wave, it finds its support at the third arrowed point. It works with a simple equation. Can you guess what that is?

Let us draw a line. We see that the price gets rejection at the same level twice. It means it is a level of resistance when the price is bearish. The price breaches the level later and finds its support at the same level. It produces a bullish reversal candle and heads towards the North. Once the price makes a bullish breakout, the buyers shall wait for the price to make a bearish correction. If the level produces a bullish reversal candle, the pair may head towards the North by offering a long entry. This is what happens here. Let us see the same chart by zooming out.

This is the same chart. We have spotted out two significant points and spotted them with two arrows. I assume this time you guess what I am going to say. Yes, the price makes a bullish breakout and finds its support at the breakout level. This is the level, which is a level of resistance in this chart. Since it gets broken and the chart produces a bullish reversal candle, the buyers may go long in the pair again. Let us draw a line here.

See how the price reacts here. Upon producing a Morning Star, the price heads towards the North with good bullish momentum. The price makes even a stronger move this time.

The plan of a buyer should be eyeing on the level to get a bullish reversal candle where the price finds its resistance when it is bearish and vice versa. This makes traders’ life easy, and in the end, it helps them make a better trading decision.

Categories
Forex Chart Basics Forex Daily Topic Forex Price-Action Strategies

Spotting Out Support/Resistance is an Art

Support/Resistance levels are one of the most important factors in trading. In today’s lesson, we are going to demonstrate an example of adjustment in determining the support/resistance level.

Forex market gets volatile from time to time. It often produces spikes. Sometimes traders have to count those spikes to determine support/resistance level, and sometimes they do not have to do that. We try to learn when we have to count, and when we do not have to count those.

This is an H1 chart. However, any chart may look like this. If we are to draw support/resistance levels here, we may find out the two most significant points where the price bounces and where it gets a rejection from. Let us proceed to the next chart with those two lines.

Look at the level of drawn support. The price bounces at the level and produces a bullish inside bar. It comes back at the level and bounces twice. At the second bounce, it produces a long lower shadow and heads towards the North. We may skip counting the spike here and draw the level of support at where the price produces a bullish inside bar and bounces twice later.

Look at the level of resistance. This is where we have counted spikes since the price reacts at the level earlier. However, we may have to adjust it later. We will be able to find this out later as far as price action is concerned.

When the price comes back down, it breaches the level of support and produces a good bullish candle. However, there is a gap, and the price goes back within the previous level of support. Thus, we may still consider the drawn level as a significant level of support.

The price heads towards the North and breaches the level of drawn resistance. The price comes back within the drawn level again. The drawn level is still a significant level of resistance since the price reacts to it. However, we have a new highest high, which must be counted.

The price heads towards the South and reacts to the level of drawn support again. Upon producing a bullish inside bar, it heads towards the North again. Here are two questions.

  1. Where would you set your take profit level as a buyer?
  2. Do you have anything else to do here?

As a buyer, you may consider taking your profit at the previously drawn level. Here we have drawn the level of resistance with a little adjustment. Have you noticed it? Yes, this is what you have to do. Spotting out significant points and monitoring price action around them are two most important things to be able to make adjustments with the support/resistance level. To be able to trade accordingly, we often need to do this. Thus, we must learn the art of adjusting the support/resistance level.

Categories
Forex Price Action

Do Not Abandon a Chart with Choppy Price Action

In today’s lesson, we are going to demonstrate an example of a chart where the price gets caught within two horizontal levels and makes a bullish breakout. We try to find out what it has to offer and how the price action goes. Let us get started.

The price makes a strong bullish move. Upon finding its resistance, it is in a bearish correction. The buyers may eagerly wait to go long in a chart like this if the chart makes a breakout at the last highest high. The last two candles come out as bullish candles. It seems that the price may have found its support.

The chart shows that two lines may be drawn by using significant levels, where the price reacts several times. The buyers may eye on the price and hope that the chart makes a breakout at the level of resistance to offer them a long entry.

The chart shows that it does not make a breakout at the highest high. However, it gets rejection and makes another bearish move towards the level of support. Here is an interesting thing. The sellers may wait for the chart to make a breakout and offer them a short entry here since the level is a double top resistance.

The chart does not make a breakout, but it produces a long bullish engulfing candle. It gets rejected again and heads towards the South. Upon having a bounce, it heads towards the North. Two horizontal levels may be drawn, which is called horizontal channel or box channel. The price may go either way. Now, the buyers are to wait for a bullish breakout and go long in the pair.

After a long while, the chart makes a bullish breakout. The buyers may wait for the price to make a correction/consolidate and produce a bullish reversal candle to offer them a long entry.

The price makes a bearish correction and seems to have found its support. It produces a doji candle. The buyers may get ready to trigger a long entry. Some buyers may flip over to the smaller chart to trigger a long entry, and some may go long above the last highest high. Some may wait for a bullish engulfing candle closing above resistance. It depends on their trading strategy.

The chart produces a bullish engulfing candle closing above consolidation resistance. The price may head towards the North with good bullish momentum as far as the last candle’s attributes are concerned.

The price heads towards the North and hits 1R within the next candle. The last candle comes out as a bearish inside bar. It suggests that the price may consolidate and make a bearish correction. In the end, the buyers have made some green pips.

The market ranges most of the time. When it makes a breakout, it does not take too long to offer an entry. In today’s lesson, we have seen that the price makes us wait for a long. It takes a long time to make a breakout. Traders must keep their eyes on such charts and wait for the price to take a direction. In the end, even a choppy chart may end up offering a good entry too.

Categories
Forex Daily Topic Forex Price Action

Double Top or Double Bottom Often Offers More

In today’s lesson, we are going to demonstrate an example of a chart offering multiple entries upon producing the double bottom. We know the double bottom is one of the strongest bullish reversal patterns. When a chart produces a double bottom, price action traders keep their eyes on the chart to keep going long. Usually, a double top or a double bottom ends up offering multiple entries. Let us now have a look at today’s example of how it offers us multiple entries.

This is an H4 chart. The chart shows that the price heads towards the South with good bearish momentum. It makes a long bearish move too. However, look at the last candle in the chart. It comes out as a bullish inside bar, which is produced at double bottom support. The buyers are to wait for a breakout at the neckline and go long in the pair.

The chart shows that one of the candles breaches through the neckline level. The next candle comes out as a bullish candle. The buyers are to wait for the price to consolidate and produce a bullish reversal candle to go long in the pair.

Upon producing a bearish inside bar, the price produces a bearish candle. The last candle looks very bearish. However, the buyers must keep their eyes on the chart since it may produce a bullish reversal candle anytime as far as double bottom and neckline breakout are concerned.

The chart produces a bullish reversal candle followed by another bullish candle breaching through consolidation resistance. The buyers may trigger a long entry right after the last candle closes by setting stop loss below consolidation support and by setting take profit with 1R.

The price heads towards the North with good bullish momentum. It hits 1R within the next candle. The price consolidates and produces a bullish reversal candle closing above the last swing high. Do you notice anything here? Yes, this is another entry. The buyers may trigger a long entry right after the last candle closes. Let us have a look at the trade setup with two horizontal lines on the chart.

The price heads towards the North again and hits 1R within the next candle. It seems that the buyers are having a feast here. The way it has been going, they may wait for the price to consolidate again and produce another bullish reversal candle to offer them one more entry. In a word, this is a chart that is going to be closely monitored by the buyers until it produces a strong bearish reversal pattern such as a double top or a bearish engulfing candle on the daily chart (this is an H4 chart). Next time when you see a double top or bottom on a chart, keep eyeing on the chart to make full use of that.


Categories
Forex Price Action

How Market Tests You and What You May Learn from It

In today’s lesson, we are going to demonstrate an example of a daily-H4 chart combination trading, which has a good lesson to give us. Usually, daily-H4 combination traders look for a strong reversal candle in the daily chart. Then, they flip over to the H4 chart to trigger entry upon consolidation and a signal candle. We get all these in our today’s example, but the price acts a bit differently after triggering the entry. Let us proceed to find out what happens there.

It is the daily chart. The chart shows that the price produces a bullish engulfing candle at a level of support where the price bounces several times. The combination traders may flip over to the H4 chart now and wait for the price to consolidate and produce a bullish reversal candle.

This is how the H4 chart looks. It looks very bullish. The last candle comes out as a bullish candle closing within a level, where the price gets rejection twice. The pair may consolidate here.

The pair produces a bearish engulfing candle. This is a strong bearish reversal candle. However, the H4 buyers must not lose their hope since the last daily candle comes out as a bullish candle. They must wait with hope.

The next candle comes out as a bullish engulfing candle closing above the level of resistance. The buyers may go trigger a long entry right after the last candle closes by setting stop loss below consolidation support and by setting take profit with 1R. Typically, this is an ideal price action to go long for the daily-H4 chart combination traders. Let us proceed to the next chart to find out what happens next.

The next candle comes out as a bullish pin bar. Look at the lower shadow. The price is about to hit the stop loss. However, if the stop loss is set here accordingly, the entry is safe. Nevertheless, the last candle comes out as a surprise for the buyers. It has three lessons to give us. We will learn them in the conclusion. Meanwhile, let us find out how the entry goes.

The price then heads towards the North with a moderate pace and hits the target. The combination traders make some profit out of the trade. It is good. Let us now find out what those three lessons are.

  1. Look at the daily chart again. See the price consolidates within two horizontal levels. There are two resistances. It means the price does not have enough space to travel towards the North as far as the daily chart is concerned. It may have held some buyers in the H4 chart back to go long in the pair.
  2. Set your stop loss accordingly with some safety pips as well.
  3. Be patient. If a trade does not go according to your expectation, do not panic.


Categories
Forex Daily Topic Forex Price Action

Evaluate Whether the Chart Belongs to Your Strategy or Not?

In today’s lesson, we are going to demonstrate an example of an H1 chart, where the price makes a bearish breakout and produces a bearish reversal candle upon making a bullish correction. However, things do not go as the sellers would like. Let us find out what happens and what the reason may imply.

The chart shows that the price produces two bearish candles consecutively. The level of support seems to be a strong one. It may produce a bullish reversal candle and push the price towards the North. However, the sellers may wait for the price to make a bearish breakout at the level of support.

Here it comes. The next candle breaches the level of support closing well below the level. This is one good-looking breakout candle. The sellers are to wait for the price to consolidate or make a bullish correction to produce a short signal.

The price makes a bullish correction. The last candle closes within the breakout level. Please pay attention to the number of candles the chart uses to make the bullish correction. The chart takes five candles to complete the correction. It means the level of support has become H4 support. Let us proceed to the next chart.

The chart produces a bearish inside bar. This is a bearish reversal candle, of course. However, the question may be raised here whether the sellers take a short entry depending on the H1 chart or not? Let us assume that a seller triggers a short entry by setting stop-loss above the breakout level.

The next candle comes out as a bearish candle. However, the last candle comes out as a bullish engulfing candle. The level is H4 support now. Thus, the buyers may look to go long in the pair and drive the price towards the North. It does not look good for the seller. The price may hit stop loss.

The next candle comes out as a strong bullish candle closing well above the breakout level. The short entry has been wiped off. If we consider the sequence bearish breakout, bullish correction, bearish reversal candle at the breakout level, it seems perfect to go short in the pair. What goes wrong here? In the Forex market, any entry may go wrong. However, over here, the H1 sellers may miss the point that the support is not H1 support anymore. It is H4 support since the level of support holds five candles. This is why the H1 traders may skip taking the short entry in this chart. It often happens in combination trading that traders forget to calculate or synchronize the chart that they are trading at. However, to be successful in trading, traders must not miss this point.

Categories
Forex Daily Topic Forex Price Action

The H1-15M Charts Combination Trading: Watch Out for Signal Candle’s Attributes

Reversal candle’s attributes play a significant role in driving the price towards the trend. An Inside Bar is considered to be the weakest reversal candlestick. However, in combination trading, even an Inside Bar may create good momentum as a reversal candle. In today’s lesson, we are going to demonstrate an example of that.

This is an H1 chart. The chart shows that the price heads towards the South with good bearish momentum. The price has a bounce at a level of support and makes a bullish correction. The sellers are to wait for a bearish breakout at the lowest low of the wave.

The chart produces a bearish reversal candle that comes out as a bearish engulfing candle. The last candle comes out as a bearish candle as well. However, it has a long lower shadow.

The chart makes a breakout at the lowest low of the wave. The last candle comes out as a bullish engulfing candle, which is a strong bullish reversal candle. However, the sellers may still keep their hope. If the breakout level produces a bearish reversal candle, they are right on the track.

This is what the H1-15M combination traders are waiting for. It produces a bearish reversal candle. Now they have to wait for a 15 M bearish candle to go short in the pair. It is time for the combination traders to flip over to the 15M chart.

This is how the 15M chart looks. The sellers are to wait for the price to produce a bearish candle closing below the last 15M candle. Let us wait and see what the price does. Let us proceed to the next chart.

The last candle comes out as a bearish candle without having any lower shadow.

The sellers would love to see a candle like this every time as a signal candle.  The combination traders may trigger a short entry right after the last candle closes. Let us find out how the entry goes.

This is the H1 chart again. The price heads towards the South with extreme bearish momentum. The last candle comes out as a doji candle. The price hits 1R within two candles. Those who love letting their winners run, they may close their entry right after the last candle closes.

If we notice, the bearish reversal candle at the breakout level comes out as an Inside Bar. However, it creates a strong bearish momentum. It is because the 15M signal candle comes out as a strong bearish continuation candle. Thus, combination traders may focus more on the signal candle. Signal candle’s attributes are more important than the reversal candle’s attributes as far as chart combination trading is concerned.


Categories
Forex Price Action

One Minute Down, Next Minute Up

The Double Bottom is one of the strongest bullish reversal patterns. When the price gets its second bounce at the same level and makes a breakout at the last swing high, the pattern it produces is called the double bottom. In today’s lesson, we are going to demonstrate an example of a double bottom in the H1 chart. At the end of the wave, an interesting thing happens. Let us proceed and find out how the double bottom offers entry and what that interesting thing is.

This is an H1 chart. The chart shows that the price has its second bounce and produces a bullish engulfing candle. Since the same level of support produces a bullish engulfing candle at the second bounce, it is going to have a strong impact on the market if it makes a breakout at the last swing high.

Here is the level of resistance, which the buyers are going to wait for a breakout to go long in the pair upon breakout confirmation. The price reacted at the drawn level earlier as well. Thus, this has been a significant level. The last rejection signifies it more.

Look at the next candle. The candle comes out as a bullish Marubozu candle. The candle closes well above the level where the price had a rejection earlier. Some buyers may want to trigger a long entry right after the last candle closes. Some buyers may wait for the breakout confirmation to go long in the pair.

The next candle comes out as a spinning top with a tiny bullish body. The price closes above the last candle’s highest high. It confirms the breakout. The buyers may trigger a long entry right after the last candle closes since they have the breakout confirmation.

See how the price heads towards the North with good bullish momentum. The price hits 1R within one candle. The last candle suggests that the price may continue its move towards the North. Let us see what happens next.

The chart produces a bearish inside bar. It suggests that the price is still bullish. If the next candle comes out as a bullish engulfing candle, the price may resume its journey towards the North with good bullish momentum. However, many buyers may come out with their profit and wait for the next bullish reversal candle to go long.

The price gets choppy within two horizontal levels. The last candle comes out as a bearish engulfing candle. Do you notice anything interesting here? Yes, the chart produces a Double Top this time, and it produces a bearish engulfing candle at the second rejection. The sellers may want to go short if the price makes a breakout at the last lowest low. This is how things change in the Forex market. It is interesting, is not it?

Categories
Forex Harmonic

Head and Shoulders Often Comes with a Different Look

The Head and Shoulders formation is one of the most traded patterns in the financial market. It offers an excellent risk-reward, thus it is very fruitful if we understand and get well acquainted with it. A typical Head and Shoulders pattern that we usually see in the trading lesson is very easy to be spotted out. However, the financial market makes a lot of adjustments. Thus, the traders need to make some adjustments as well. In today’s lesson, we are going to demonstrate an example of a Head and Shoulder pattern, which is a bit different in its looks.

The price heads towards the North with good bullish momentum. It seems that it has found its resistance, where it has produced a double top. At its second rejection, it has produced a bearish engulfing candle followed by another bearish candle. Thus, we have drawn a line to show the lowest low and the highest high.

The price makes a bearish correction. It seems to have found its support. It has produced a bullish engulfing candle followed by another one. Let us assume this is the last wave’s lowest low.

The price heads towards the North and makes a breakout at the wave’s highest high. So far, it seems like an ABC pattern. However, the price produces another bearish engulfing candle followed by a bearish candle. It suggests that the price may head towards the South for a bearish move.

It makes a bearish move and seems to have found its support. The level of support produces three consecutive bullish candles. Let us draw another line here. Here is a question. Do you see anything here? If you do, you are well known with Head and Shoulder pattern. If you do not, you may have to study and work with your Head and Shoulder pattern more.

The price makes another bearish move upon producing two consecutive bearish candles. Some Head and Shoulder pattern sellers may want the price to go further down to have its support at the same neckline level. However, the price does not go towards the same neckline level. It makes a breakout at the very last lowest low. What do the sellers do here? Let us find the answer from the next chart.

The chart shows that the price heads towards the South with good bearish momentum. It may continue its move up to the first swing low from where the Head and Shoulder is initiated. The most important point here is the price gets bearish once it makes a breakout at the level of support drawn by the black line. This is the neckline of the Head and Shoulder. It may get difficult to find out since many sellers may wait for the price to have a bounce at the around the same level where the price produces its neck. As mentioned, this world is not perfect, neither the Forex market is. We often need to adjust in the market to trade. Today’s lesson is one of the examples of that.

Categories
Forex Price Action

Traders are to be Artists

In today’s lesson, we are going to demonstrate an example of the daily-H4 chart combination trading. The H4 chart offers a long entry. The chart’s breakout and level of support are to be spotted with some calculation. We try to learn those from today’s lesson.

This is the daily chart. The chart shows that the price makes a very strong bullish move. It then makes a bearish correction. At the correction, it produces a bullish engulfing candle once but continues its journey towards the South. The daily-H4 chart combination traders may have flipped over to the H4 chart upon having that bullish engulfing candle. Anyway, look at the last candle. It is a strong bullish reversal candle. The buyers may flip over to the H4 chart to go long in the pair.

This is how the H4 chart looks. The last candle comes out as a doji candle. The buyers are to wait for the price to consolidate and produce a bullish candle to trigger a long entry.

The chart shows that the price consolidates and produces a bullish engulfing candle. Let’s focus on those two drawn levels. We may not count the lower spike of that spinning top to draw the support line. We try to draw the line by using a flipped level that holds some candle’s wicks and bodies of all the candles. To draw the level of resistance, we count the spike of the spinning top (the last rejection) but skip some part of the upper shadow of a candle. Yes, it is not a bad idea to draw a breakout level by using spikes to some extent. In most cases, however, significant rejection, along with candles’ bodies, matters a lot. Let us assume that we trigger a long entry in this chart.

The price heads towards the North with good bullish momentum. The last candle does not hit the target of 1R, but the price is almost there. It seems that the buyers may not have to wait too long to achieve their target.

The last candle comes out as a bearish candle with a long upper shadow (the body is relatively thicker though). However, the upper shadow shows that the price hits the target. However, it is a bearish reversal candle because the body closes within the last bullish candle, suggesting that the price may continue its bullish move.

If we look back and study with the flipped H4 chart, we find that the buyers are to count some factors to draw consolidation support and resistance. They are to count some spikes and to skip some of those. As we know, trading is not science; it is an art. Thus, traders are to be artists. To be an artist (successful trader), one needs a lot of practice and experience.

Categories
Forex Price Action

Make Full Use of a Strong Reversal Candle

An engulfing candle makes a strong statement about the price reversal. The longer the body, the stronger the statement is. In today’s article, we are going to demonstrate an example of the daily-H4 chart combination trading, where the daily chart produces a bearish engulfing candle with a long bearish body. We find out what it has to offer to the sellers in the end.

The chart shows that the price produces a bearish engulfing candle having a tiny lower spike. The body of the candle is a long one closing well below the last bullish candle. This is one good-looking bearish engulfing candle. Since it is the daily chart, the daily-H4 chart combination traders may flip over to the H4 chart to look for short entries.

The above figure shows the H4 chart. We can see that the last candle comes out as a bullish inside bar. It means the price in the H4 chart may consolidate. The sellers are going to wait to get a bearish reversal candle to go short in the pair.

The last candle comes out as a bearish engulfing candle closing well below consolidation support. The sellers may trigger a short entry right after the last candle closes by setting stop-loss above consolidation resistance and by setting take profit with 1R. Let us now find out how the entry goes.

The next two candles come out as bearish candles. However, the price does not head towards the South as expected. Moreover, the last candle comes out as a doji candle having a long upper shadow. The sellers are to wait for the price to hit the target. The last candle does not convey a good message to the sellers.

Here it comes. The last candle hits the target of 1R. The reversal candle in the daily chart is a very strong one. Do the sellers get anything extra out of it? Let us proceed to the next chart to see what the price does in the chart.

The price makes a long bearish move. It heads towards the South upon having consolidation. The sellers can make a handful of pips by eying in the chart. One of the reasons may be the bearish reversal candle in the daily chart. As far as a candlestick pattern is concerned, an engulfing candle is the most reliable reversal pattern. When you get an engulfing candle like the one we have seen here, it does have a lot to offer. Okay, here is a question. What do you see in the H4 chart here? Yes, the last candle comes out as a strong bullish engulfing candle. This has a lot to offer to the H4-H1 chart combination traders. Therefore, if you are an H4-H1 combination trader, flip over to the H1 chart and make full use of it.

Categories
Forex Price Action

H1-15M Chart Combination Trading: Mind the Weekend

In today’s lesson, we are going to demonstrate an example of H1-15M chart combination trading. Usually, the H1-15M chart combination trading offers 1:2 risk-reward. However, in this example, the buyers may need to come out with their profit with 1:1 risk-reward. We find out why they shall do that so.

This is the H1 chart. The price heads towards the North with good bullish momentum. The price breaches the last swing high and continues its journey towards the North upon confirming the breakout. Look at the last candle. It comes out as a strong bearish candle. The buyers are to keep their eyes on the pair to get a bullish reversal candle to go long.

The price makes a long bearish correction. Look at the last candle in the chart. It comes out as a bullish candle. The combination of the previous three candles is not a morning star since the last candle does not close above the bearish candle. Nevertheless, the last candle comes out as a bullish engulfing candle. It is a strong bullish reversal candle. It is time for the buyers to flip over to the 15M chart.

This is how the 15M chart looks like. A bullish candle closing above the last candle’s body would be a good signal to go long in the pair. The buyers must keep their eyes in the chart. Let us proceed to the next chart to find out how it comes out.

Look at the last candle. This is one beautiful bullish engulfing candle closing well above the last candle’s wick. A signal candle like this attracts more buyers and usually brings good liquidity. The H1-15 chart combination traders may trigger a long entry right after the last candle closes by setting stop loss below the support level and by setting take profit with 2R. Let us now flip over to the H1 chart again to see how the trade goes.

The price heads towards the North with good bullish momentum. It hits 1R in a hurry. The last candle comes out as an inside bar, which is the weakest bearish reversal candle. In most cases, H1-15 chart combination trading offers 1:2 risk-reward. The question is whether the buyers keep holding the trade or not. I may mention that it is Friday and only three/four hours to go to shut down the market. I think now you know what buyers should do here. Yes, they should close the trade and come out with the 1R profit. The H1-15M chart combination traders should not keep holding their trade during the weekend. In some cases, it may bring them some extra pips. However, in many cases, it may hurt them badly.


Categories
Forex Price Action

Chart Combination Trading: Even an Inside Bar Has a Lot to Offer

An Inside Bar is considered the weakest reversal candle as far as candlestick trading is concerned. However, in today’s article, we find out the significance of a daily Inside Bar in the daily-H4 chart combination trading. Let us get started.

This is the daily chart. The chart shows that the last candle comes out as a bearish Inside Bar. The daily chart traders may still think that the chart is bullish biased. However, the daily-H4 chart combination traders are to flip over to the H4 chart and look for short entries since it is a bearish reversal candle after all.

The H4 chart looks to be tailor-made for the sellers. The chart produces a double top, and the price breaches the neckline. The last candle comes out as a doji candle. The price may consolidate now.

The chart produces another bearish candle closing within the same resistance. Then, it creates a bullish engulfing candle. Let us draw two lines here. The level of support looks very evident. However, the level of resistance still has a lot to prove.

The level of resistance produces a bearish reversal candle. To be precise, it creates a bearish engulfing candle, closing below the level of resistance. The sellers may trigger entry right after the last candle closes by setting stop-loss above the level of resistance and by setting take profit with 1R.

The price heads towards the South in the next candle as well. It seems that the sellers may not have to wait too long to achieve their target. Let us proceed to the following chart to find out how it goes.

As expected, the next candle comes out as another bearish candle. This time it has even a longer body. Look at the last candle. The candle comes out as a bullish inside bar. Technically, the chart is still bearish biased. Do not forget that for the H4-H1 chart combination trading, they may have to flip over to the H1 chart to go long in the pair. This is what we have just demonstrated in the daily-H4 chart combination trading.

To sum up the lesson, an Inside Bar may not be a strong reversal signal in the chart. For the chart combination traders, it is a bit different. As long as it is a reversal candle does not matter how weak it is. The combination traders may flip over to the counterpart and wait for consolidation and a signal candle to trigger entry.

Categories
Forex Price Action

Mark Significant Levels and Watch out Price Action around Them

In today’s lesson, we are going to demonstrate an example of the H4-H1 chart combination trading where the breakout takes place, but the traders have to be sensible to spot out the breakout. Let us get started.

This is an H4 chart. The chart shows that the price heads towards the North upon having its second bounce at the level of support. Look at the last candle. The candle comes out as a bullish engulfing candle since it closes well above the body of the last candle. Can you spot something out here?

The candle closes well above the level where the price had a rejection earlier. The price reacted around the same level before producing the last candle. If we draw a level by using the significant level, which has been working as the level of resistance, we see that the last candle breaches the level. This means the piercing may be considered a breakout. Let us now flip over to the H1 chart.

This is how the H1 chart looks. The chart shows that the last candle comes out as a Spinning Top. The H4-H1 buyers are to wait for the price to consolidate and to get a bullish reversal candle to go long in the pair. Let us wait and see what the price does.

The chart produces a bearish engulfing candle closing within the breakout level. Look at the last candle. The last candle came out as a long bullish engulfing candle. The buyers may get huge confidence about the earlier H4 breakout and trigger a long entry right after the last candle closes. Let us now find out how the entry goes.

The price heads towards the North with good bullish momentum. The last candle comes out as a bearish Inside Bar. This action suggests that the Bull may continue its run. It is a bearish reversal candle (the weakest one). Thus, the buyers may consider closing their entry. In the end, this comes out as an excellent trade setup.

If we concentrate on the breakout, it is to be found out by the traders. Without drawing the horizontal line, it would be difficult to found that out. Thus, mark the points that are significant and keep looking at our charts. It would help you find out breakout and make the trading decision easily. Some breakouts may not seem like a breakout without drawing lines on the chart. Thus, pick your drawing tool to mark significant levels with horizontal lines/trend lines/channels on your trading chart and watch out how the price reacts around them.

Categories
Forex Fibonacci

It is Not Always the Level, It is about the Zone

In today’s lesson, we are going to demonstrate an example of a chart where the price makes a strong move from the 61.8% Fibonacci level. However, in this example, things are slightly different. We know the world is not perfect; neither is the Forex market. Today’s lesson is going to show that. Let us get started.

The chart shows that the price makes a strong bearish move. After that, the price may have found its support. The last candle comes out as a bearish candle with a long lower shadow. The price may make a bullish correction and, then, a bearish breakout at the lowest low of the wave to offer a short entry.

The price makes its bullish correction. Upon producing a doji candle followed by a bearish Marubozu candle, it heads towards the South. The last candle closes within the level of support, where the price gets a rejection earlier. The sellers are going to eagerly wait for a bearish breakout.

The price makes a breakout at the lowest low of the wave, consolidates, and produces a bearish reversal candle. The sellers may trigger a short entry right after the last candle closes by setting Stop Loss above consolidation resistance. We talk about Take-profit in a minute. Let us find out how the entry goes.

The price heads towards the South with extreme pressure. It seems like the Bear is in a real hurry to hit the target. It produces only one bullish candle before the last one. The last candle comes out as a bullish inside bar. Typically, it suggests that the chart is still bearish biased. We find that out whether it really is or is it time for the sellers to come out with their profit. Let us draw Fibonacci levels.

Here it is. Despite producing an inside bar, the price heads towards the North for a bullish correction. It may change the trend as well. The reason for this is the price hits 161.8%. Typically, the price makes a reversal once it hits 161.8% of an existing trend when the trend starts from 61.8%. The question is whether the price really trends from 61.8% or not? If you closely look at the chart, the price does not hit 61.8%, but it trends from well below. Nevertheless, it trends from the zone of 61.8% to 78.6%. As long as the price trends from that zone, the Fibonacci traders consider that it trends from 61.8%. This is what makes the price behave as if it trends right from the  Fibonacci level of 61.8%. When it trends from there, we know where to set our Take Profit. Yes, it is to be set at 161.8%.

Categories
Forex Price Action

The Trend in a Bigger Frame is Traders’ True Friend

There is a saying in financial trading “Trend is traders’ friend.” Without any doubt, this is true. In a chart combination trading, a bigger timeframe’s trend plays an important role and helps traders a lot to go with an entry in its counterpart. Let us have a look through an example of how it works.

This is a daily chart. The chart shows that the price heads towards the North at a moderate pace. The last candle comes out as a bullish candle closing well above consolidation resistance. It means the daily traders may start eyeing to go long in the pair.  The daily-H4 combination traders may flip over to the H4 chart for the price to consolidate and produce a long signal.

This is the flipped H4 chart. The chart shows that the last candle comes out as a bullish candle with an upper shadow. The buyers are to wait for the price to consolidate now.

The price consolidates and produces a bullish candle breaching consolidation resistance. Here is a thing. The consolidation range is shallow. The consolidation range plays a significant role in determining the next move’s length. The length of consolidation here does not suggest that the next move will be a big one. The daily-H4 combination traders may trigger a long entry by setting stop loss below consolidation support and by setting take profit with 1R. Let us proceed to the next chart.

The price hits the target of 1R by the next candle. Concentrate on the last candle. The candle comes out as a bullish Marubozu candle. It suggests that the price may head towards the North further. Let us find out how far it goes.

The price heads towards the North with three more candles. This means it travels almost three times more length than the combination traders have anticipated. Can you guess what may be the reason for this?

The daily chart is in a strong bullish trend. The last daily candle breaches through consolidation resistance and makes a strong statement about its bullishness. That may have attracted the daily buyers to go long in the pair as well. This brings extra liquidity and helps the price head towards the North with extreme pressure. This happens most of the time in combination trading. If the bigger chart makes a breakout and has a solid trend, the price seems to head towards the trend’s direction at a good pace in the minor chart. The combination traders may keep this in their mind and make full use of this.

Categories
Forex Price Action

When the Same Chart Offers a Better Trade Setup

In today’s lesson, we are going to demonstrate an example of an H4 chart offering two entries. The first one does not create enough bullish momentum right after the breakout, but the second one does. Let us now get started.

The chart shows that after being bearish for a long while, the chart produces two bullish candles consecutively. The H4 traders may keep their eyes on the daily chart to get a daily bullish reversal. Then, consolidation followed by an H4 bullish reversal candle would be the signal to go long in the pair.

The price starts having a bearish correction. The buyers are to wait for a bullish reversal candle first to go look for a long opportunity. The price is at a significant level, where it reacted earlier several times. The reversal candle might be around the corner.

Yes, the chart produces a bullish Inside bar. It is not a strong bullish reversal candle, but it is a sign that the price may get bullish soon, considering other factors. Let us proceed to the next chart.

The next candle comes out as a bullish candle with a long bullish body having a tiny upper shadow. The buyers may trigger a long entry right after the candle closes by setting stop loss below consolidation support and by setting take profit with 1R.

The next candle comes out as a bearish inside bar. The buyers usually would love to see the price head towards the trend’s direction after triggering entry. It does not happen here. However, it does not look too bad.

What a surprise! The chart offers one more entry. Look at the last candle, which comes out as a bullish engulfing candle closing well above consolidation resistance. Some buyers may trigger another entry. Yes, it is a debatable issue whether traders should take multiple entries in the same pair. At least, if traders miss the first chance, they may consider taking entry here. Let us find out what the price does next.

The price heads towards the North with good bullish momentum. It hits the buyers’ target with ease. On the second occasion, the bullish engulfing candle forming right at consolidation support makes the pair very bullish. On the first occasion, the price does not get that bullish after the signal candle. On any day, the second signal is better than the first one. Some traders do not like taking multiple entries, which is fair enough. If a trader does not mind taking multiple entries, he may as well consider taking entry if it is a better trade setup than the last one with relatively a smaller lot than his usual trading lot.


Categories
Forex Price-Action Strategies

Do not Forget to Check the Daily Chart

In today’s lesson, we demonstrate an example of an H4 chart and try to evaluate its price movement after breakouts. The chart shows that the price makes three breakouts altogether. The first two breakouts do not create that much momentum towards the breakout, but the last one does. We try to find out the reason behind it.

This is an H4 chart. The chart shows that the price makes a bullish move and consolidates. It seems that the price has found its support since it has already produced a bullish engulfing candle. The buyers may go long in the pair above consolidation resistance.

The chart shows that consolidation resistance is a strong level of resistance where the price gets rejection several times. Since it is an H4 chart, three times rejections, on the same level, means that it is a daily level of resistance. Thus, an H4 breakout may not create that much momentum all the time.

The chart shows that the price after making a breakout consolidates for a long time again. It is because of the daily resistance factor. The daily candle confirms the breakout. Thus, the price in the H4 chart consolidates. Look at the last candle. This comes out as a bullish candle breaching consolidation resistance. Let us find out what happens next.

The last H4 bearish inside bar is the last candle of the day. It means the daily candle comes out as a bullish candle after the daily breakout, breakout confirmation, and daily reversal candle.

The price consolidates with one more candle to start the next trading day. A bullish reversal candle may push the price towards the North with good bullish momentum. Since the chart now belongs to the H4 traders as well.

Here it is. The chart produces a bullish engulfing candle closing well above consolidation resistance. The length of consolidation is shallow. However, the bullish reversal candle looks to be a perfect signal candle.

There she goes. The price heads towards the North with extreme bullish momentum. The last candle suggests that the price may continue its bullish journey. Let’s look at the last move. The price does not consolidate with enough depth, but it makes a strong bullish move. On the other hand, on the first two occasions, it consolidates well, but its breakout does not create good momentum. It is because, on the first two occasions, there is a daily resistance factor. The level of daily resistance makes the H4 traders wait for more. Once the price makes a breakout on the daily chart, it heads towards the breakout direction with good momentum. The H4 traders are to check the daily chart before taking entry. This is one more reason to check that one thoroughly.

Categories
Forex Price Action

Some to Take and Some to Skip

In today’s lesson, we are going to demonstrate an example of an H4 chart, which seems to be offering several entries. However, a trader has to be very calculative before taking an entry. Some entries are there to be taken, and some are there not to be taken. We would try to find out why we shall skip taking some entries. Let us get started.

This is an H4 chart. The chart shows that the price makes a strong bullish move and consolidates for a long time. The last candle comes out as a bullish candle breaching consolidation resistance. It usually a scenario of taking a long entry. Before taking an entry, we must calculate whether the price consolidates for more than a day or not. Over here, the price consolidates more than a day. It means the level of resistance becomes daily resistance. The breakout is not for the H4-daily combination traders to trigger a long entry.

The chart shows that the price heads towards the North. The buyers may wait for the price to consolidate and get a bullish reversal candle to go long in the pair. They must keep their eyes on the pair.

The chart produces a bearish inside bar. It may consolidate more and make a deeper consolidation. This is what the buyers are to hope for. Let us find out what the price does here.

The chart shows that the price consolidates for five candles altogether. The last bullish candle is the last H4 candle of that day. It means if the chart produces the next candle as a bullish engulfing candle, the buyers will have an opportunity to go long in the pair. Otherwise, they are to wait longer.

The last candle comes out as a bullish engulfing candle breaching consolidation resistance. The buyers may trigger a long entry right after the last candle closes by setting stop loss below consolidation support and by setting take profit with 1R.

The price consolidates again and produces a bullish engulfing candle. It seems the bull is going to dominate in the pair for a long time since it finds another level of support. When price trends like that, traders add more positions, and the price keeps trending relatively for a longer time.

Here it is. The price hits the target of 1R. They buyers grab some green pips. Yes, they wait for the price to hit the target. Some traders may take a partial profit out of it and let the rest of the trade run to grab more pips.

In this lesson, we have demonstrated that traders may take the second entry and skip the first one because of the daily resistance factor. Traders must calculate these things before taking entry.

Categories
Forex Price Action

Significance of Having the Belief in Your Analysis

In today’s lesson, we are going to demonstrate an example of H1-15 combination trading. The price trends from the level of 61.8%. Usually, when the price trends from the level of 61.8%, it does not take that long to make a breakout. However, in this example, we will demonstrate that it may sometimes take longer than our expectations. Let us get started.

The chart shows that the price makes a strong bullish move towards the North. The last candle comes out a bearish inside bar. It indicates that the price may make a bearish correction. The buyers are to wait for the price to produce a bullish reversal candle followed by a bullish 15M breakout at the highest high of the wave to go long in the pair. This is the plan of the game. Let us find out how it goes.

The next candle comes out as a bearish candle as well. The last bearish candle has a long lower shadow. It indicates that the chart may produce a bullish reversal candle anytime soon. The buyers are to wait here with patience.

As expected, the chart produces a bullish reversal candle. The candle comes out as a bullish engulfing candle. The H1-15M combination traders are to flip over to the 15M chart and wait for a bullish 15 candle breaching the wave’s highest high to trigger a long entry.

You may have noticed that the price has been within the level of resistance for several candles. It means the buyers are to keep their eyes on this pair for a long time. Look at the last candle. After so many hours of waiting, the 15M chart produces a bullish candle that closes above the level of resistance. The buyers may trigger a long entry right after the last candle closes. Let us flip over to the H1 chart with Fibo levels on and find out what happens here.

The Fibo level shows that the price trends from the level of 61.8%. This is one of the levels, which usually produces good momentum. In this example, it produces a good bullish momentum after the breakout, but it takes a long time to make the breakout. The H1-15 combination traders’ patience is tested here. The buyers who wait and keep the belief that it may end up producing the signal make money out of this setup in the end. It is not easy, but this is what trading is all about. Having a belief in analysis helps a trader be a better trader.

Categories
Forex Price Action

H1-15M Combination Strategy: Entry upon Consolidation and Fibo Targets

In today’s lesson, we are going to demonstrate an example of the H1 -15M combination trading strategy offering entry upon consolidation. We are going to integrate Fibonacci levels to see how far the price moves. This would give us an idea of how effective Fibonacci levels are to determine the stop loss and take profit level. Let us get started.

The H1 chart shows that the price makes a strong bearish move and finds its support. The black marked level is the level of H1 support here. The price moves towards the North with two candles and may have found its resistance. One of the candles comes out as a bearish engulfing candle. Traders are to wait for an H1 breakout followed by a 15M bearish reversal candle to go short in the pair. Let us see what happens here.

The chart produces one more bearish candle followed by a doji candle. It means the price consolidates in this chart. The next candle closes just below the level of support. Ideally, this is not a perfect breakout candle. However, the price consolidates and produces an H1 bearish reversal candle (the last candle). This is a signal that the price may get bearish and head towards the South. Let us flip over to the 15M chart.

The 15M chart shows that the last candle comes out as a bullish candle. Do not forget that H1 candle closes with a bearish body. Thus, a 15M bearish reversal candle (preferably engulfing candle) will push the price towards the South.

Look at the last 15M candle. It comes out as a bearish engulfing candle closing well below the last candle. This means the price may head towards the South with good bearish momentum. Let us proceed to the next chart with Fibonacci levels to find out how far the price heads to.

The price trends from the 78.6% level and reaches 161.8%. Usually, the 78.6% Fibo level drives the price towards the level of 138.2% with good momentum. It often reaches up to the level of 161.8% because of momentum. However, we may set our target at 138.2% if it trends from 78.6%. Another point you may have noticed is that we draw Fibonacci levels by using the lowest low, not the H1 support. These are two different things.

If the H1 chart makes a straight breakout, we may wait for a 15M reversal candle to take entry. If it consolidates and produces an H1 reversal candle, we may trigger entry if 15M chart produces a strong reversal candle closing well below the wave’s lowest low. Do some backtesting; you will see many charts where the price makes a move like this. Stay tuned. We will reveal more examples of this.


Categories
Forex Price Action

The Daily-H4 Combination Trading: Do Not Only Look for Reversal Candle

The daily–H4 combination traders are to wait for the daily chart to produce a reversal candle first to look for entry. Once the chart produces a daily reversal candle, traders are to flip over to the H4 chart; wait for consolidation and an H4 reversal candle to trigger an entry. We must not forget that if the daily chart is trending, the daily-H4 combination trading strategy may offer entry as well. In today’s lesson, we are going to demonstrate an example of that.

This is a daily chart. The pair produced a bullish engulfing candle and three more bullish candles followed. The daily-H4 combination traders are to keep their eyes on the pair right after it produces that bullish engulfing candle. Let us assume on the fourth day, we flip over to the H4 chart as well.

This is how that H4 chart looks. The chart shows that after making a bullish move, the price starts having consolidation. The last candle comes out as a bearish pin bar. It seems the chart may take time to produce a bullish reversal candle to offer a long entry. Then again, we never know. It may be just around the corner.

The char produces a good-looking bullish engulfing candle closing well above consolidation resistance. The buyers may trigger a long entry right after the last candle closes by setting stop loss below consolidation support and by setting take profit with 1R. Let us move to the next chart to see how the trade goes.

The price consolidates again. After producing such a good-looking signal candle, it seems a bit unusual. The last candle has a bearish body but it has a long lower shadow. Be patient and see what the price does next.

Look at the last candle. It comes out as a bullish engulfing candle. This is a strong sign that the price may head towards the North now. As far as the last candle is concerned, the price may not take too long to hit the target.

As expected, the price heads towards the North with good bullish momentum. It produces only one bearish candle before hits the target. As it seems, a bearish inside bar followed by a bullish engulfing candle may push the price towards the North further. Anyway, the buyers have achieved their 1R here with ease.

The message we get from today’s lesson is that if the daily chart is trending, we may keep an eye on the H4 chart to take entries with the trend as well. If it produces a reversal candle, we may look for entries too. However, we must not look for short entries if the last daily candle is bullish and vice versa.

Categories
Forex Price Action

The H1-15M Combination Trading: Waiting for an H1 Reversal Candle Ensures Better Reward

The H1 reversal candle plays a significant part in the H1-15M chart combination trading. If the traders wait to get an H1 reversal candle, by using candle’s lower low/higher high, they get a better risk-reward. In a bearish market, a trader needs to wait for an H1 bearish reversal candle after the breakout. In a bullish market, he needs to do the opposite. In today’s lesson, we are going to demonstrate an example of a bullish market where the H1-15M chart combination offers an entry upon producing an H1 bullish reversal candle. Let us get started.

This is an H1 chart. The chart shows that the price heads towards the North with good bullish momentum. The price, then upon finding its resistance, has been in a bearish correction. It consolidates around a level and heads towards the North. The buyers are to keep their eyes on the chart with a hope that it may make a bullish breakout.

The chart shows that the last candle makes a bullish breakout closing well above the last highest high. The buyers are to wait for the chart to produce an H1 bullish reversal candle followed by a 15M bullish candle to trigger a long entry. Let us keep watching the chart to get that H1 bullish reversal candle.

The chart shows that it produces two doji candles. It means the price has been in bearish correction at the minor charts. An H1 bullish reversal candle at the breakout level would be the ‘getting ready’ signal to go long in the pair.

Look at the last candle. The last candle comes out as a bullish candle forming at the breakout level. The buyers are waiting for the chart to produce such a candle. They may flip over to the 15M chart now. Let us flip over to the 15M chart.

The last candle comes out as a bearish inside bar. Since the H1 candle closes as a bullish candle, so a 15M bullish candle is the signal to trigger a long entry. Let us proceed to the next chart.

Here it is. The chart produces a bullish Pin Bar. The buyers may trigger a long entry right after the last candle closes. Traders may set their stop loss below the H1 bullish reversal candle’s lowest low, which is below the red-marked level. To set take profit, they may use Fibonacci levels. If the price trends from 61.8%, it usually goes up to the level of 161.8%. Let us find out how this one goes.

Yes, the price heads towards the level of 161.8% with good bullish momentum. If we flip over to the 15M chart right after the breakout, we would take entry by setting stop loss below 00.00%. By waiting for an H1 reversal candle, we may set the stop loss below 38.2%. This ensures a better risk-reward. On the other hand, if we always wait to get an H1 reversal candle after the breakout, we may not get it all the time. Thus, we end up being offered less number of entries in the H1-15M chart combination trading.


Categories
Forex Daily Topic Forex Price Action

The Levels You Need to Pay Extra Attention

Support and Resistance are the two key factors of Forex trading. The good thing is in most cases time these levels can be guessed well earlier. By drawing support/resistance levels where the price reacts earlier,   we can spot those levels. This helps a trader set his stop loss, take profit and make a trading decision. In today’s lesson, we are going to demonstrate an example of how the previous levels where the price reacts earlier play a significant part as far as support/resistance is concerned.

Look at the chart carefully. The price makes a strong bearish move and makes an upside correction. The chart produces a spinning top followed by a bearish engulfing candle. If we consider the existent trend and candlestick pattern, it is a short signal. The question is whether it really is a short signal or not. Look at the next chart.

At the correction, one of the candles breaches through a level. This level was a level of support earlier. After being bearish, the level should work as a level of resistance. It does not. The price breaches through the level. In fact, it may work as a level of support again. If it produces a bullish reversal candle, the buyers are going to take control here.

The level seems to hold the price as a level of support. It produces two a bullish pin bar and a doji candle. If it produces a bullish engulfing candle here, the price may get bullish and head towards the North.

The chart produces a bullish engulfing candle closing well above the wave’s highest high. Let us calculate whether the buyers should go long here or not. The price makes a bullish move breaching a significant level. The price makes a bearish correction and the breakout level works as a level of support. As far as price action trading is concerned, traders may trigger a long entry right after the last candle closes.

As expected, the price heads towards the North with good bullish momentum. It gets the buyers 1R already. The last candle comes out as a bearish inside bar. The price may reverse now. However, there is still a 40% possibility that the price continues its bullish move. Let us assume that the buyers close the trade and cash in some profit.

If we consider the whole scenario, the market seems bearish in naked eyes. When we draw the significant level, it gives us a clearer picture of the breakout and correction. We, then realize that the market is actually bullish. A long entry at the pullback gets the buyers some green pips. This is what Support and Resistance (significant levels) do.

Categories
Forex Psychology

Do Not Let Your Losing Trade Chase You

Trading depends a lot on a trader’s mindset. It does not matter theoretically how strong a trader is. If he does not know how to deal with trading pressure accordingly, he will never be a successful trader. One of the biggest issues in trading is encountering losing trades. It diverts the traders’ mindset, which makes him make more mistakes and lose money in the end. We mostly choose winning trade setup in our trading lessons. However, we sometimes chose a trade setup that encounters a loss as a part of our trading psychology lesson. In today’s lesson, we are going to demonstrate a losing trade.

This is a daily chart. The price heads towards the North upon producing a C point. Look at the last candle. It comes out as a bearish engulfing candle producing right at the level, where the price had a rejection earlier. The H4-daily combination traders may flip over to the H4 chart to go short in the pair.

This is the H4 chart. The chart shows that the price heads towards the North with good bearish momentum. The sellers are to wait for the price to consolidate and produce a bearish engulfing candle to go short in the pair.

The chart produces a bullish inside bar. It seems that the chart may produce a short signal for the sellers soon. The H4-daily combination sellers must keep their eyes on the chart.

The last candle comes out as a bearish engulfing candle closing well below consolidation support. The sellers may trigger a short entry right after the candle closes. This looks like an A+ trade setup. It seems that the sellers do not have to wait too long to earn their profit.

Things do not go according to the sellers’ expectations. The chart produces a spinning top followed by a bullish engulfing candle. Some sellers may want to close their entry with some losses here. Let us assume that we let our trade run. Then, here comes the last candle. It looks good for the sellers again.

The chart produces a bullish engulfing candle again. This must be annoying for the sellers. Let us assume that we keep holding the position with the hope that it goes towards the South and hits Take Profit.

It does not. It hits Stop Loss instead. An A+ entry ends up being a losing trade. If you keep thinking about a losing trade (with your proven strategy) and do not look to find out new entry, it means a losing trade chases you much more than it should. You really have to find out a way to avoid it.

Categories
Forex Price Action

The H4-Daily Combination Strategy: Do not Get Carried Away

In today’s lesson, we are going to demonstrate an example of an H4-daily chart combination trading. The lesson has an important message to remember for the H4-Daily combination traders. Let us get started.

The chart shows that the price produces a double top and heads towards the South with good bearish momentum. The daily candle closes as a bearish Marubozu candle having no lower shadow at all. The next trading day starts with a Spinning Top. It seems that the H4 chart starts having consolidation. The last H4 candle comes out as a bullish engulfing candle. This looks good for the sellers that the price is having consolidation after making a good bearish move. However, the H4-Daily combination traders must not forget one thing that the signal is to be produced within the next two candles. Otherwise, it becomes daily support.

The fifth H4 candle of the day comes out as a bearish engulfing candle. The candle closes well below consolidation support. The sellers may trigger a short entry right after the last candle closes by setting stop-loss above consolidation resistance and by setting take profit with 1R.

The next candle comes out as a bullish inside bar after triggering the entry. The sellers would love to get a long bearish candle here. However, a bullish inside bar suggests that the bear still holds the key. Let us proceed to the next chart.

The next candle comes out as a bearish engulfing candle. This looks extremely good for the sellers now. The price finds another resistance. This attracts sellers to add more short positions. Anyway, the H4-Daily combination traders are to wait for the price to hit their 1R take profit.

The price takes two more candles to hit the target. I would say that the price hits the target at a moderate pace here. Anyway, the H4-Daily combination strategy offers entry, and the trade setup works well for the sellers.

The message this lesson has is that we must not get carried away with bullish or bearish move followed by consolidation. The H4 chart is to produce a trade signal within the next day. If it does not, that chart does not belong to the H4-Daily combination trading strategy.  If it does, then the H4-Daily combination traders may trigger an entry.

Categories
Forex Fibonacci

How to Use Fibonacci Levels in the H1-15M Combination Trading

In today’s lesson, we are going to demonstrate an example of an H1 chart offering an entry. We find out how Fibonacci levels and 15-min chart help us take the entry. Let us get started.

This is an H1 chart. The chart shows that the price after making a strong bearish move has been making an upward correction. The chart produces a Shooting Star and creates a bearish momentum. However, the sellers are to wait for the chart to make a breakout at the lowest low of the wave. Let us proceed to the next chart to find out what the price does next.

The price keeps driving towards the South and makes a breakout at the lowest low. The breakout candle has a long lower shadow, but it closes well below the level of support. The H1-15M combination traders may flip over to the 15M chart now.

This is how the 15M chart looks. The last candle comes out as a bullish candle. The sellers are to wait for a bearish reversal candle to go short in the pair. They must concentrate hard on the chart. It is waiting time for the sellers.

The 15M chart produces a bearish reversal candle. The candle has a long lower shadow but has a thick bearish body. Moreover, the H1 chart makes a breakout, so a 15M bearish reversal candle means a lot to the sellers. The sellers may trigger a short entry right after the last candle closes. There is another equation, which we will reveal in a minute. Let’s now find out how the trade goes.

The price heads towards the South with good bearish momentum. The 15M chart shows that it consolidates now and then. The H1 chart should look much more bearish than this. Ok, here is the equation we have pointed out a bit earlier. Let us draw Fibonacci levels and find out how it may help us set our stop-loss and take-profit levels.

The Fibonacci levels show that the price trends from the level of 61.8%. It makes a breakout at the level of 100.0 and heads towards the level of 161.8. When the price trends from 61.8%, it creates an extra momentum. This is what this example shows, as well. With Fibonacci, we know where to set the take-profit level. Yes, it is to be at 161.8%. With stop-loss, you may set it above 61.8% if you are too defensive a trader. If you want to be too tight with your stop loss, you may set it between 78.6% to 100.0%. The first one offers less risk-reward, but it has a higher winning percentage. On the other hand, the second one offers excellent risk-reward but has less winning percentage. The choice is yours.

Categories
Forex Daily Topic Forex Price Action

Double Top-Engulfing Combination and Trade Management

In today’s lesson, we are going to demonstrate an example of daily-H4-combination trading. The trade setup starts with a double top, and the trend-initiating candle comes out as a bearish engulfing candle. The price consolidates and produces another bearish engulfing candle closing below consolidation support. We find out what happens next and how we may manage the trade to get the best result out of it.

This is an H4 chart. The chart shows that the price produces a double top. At the second rejection, the reversal candle comes out as a bearish engulfing candle and drives the price towards the South with good bearish momentum. Upon finding its support, it consolidates for a while and produces another bearish engulfing candle. We know what the daily-H4 combination traders are to do here.

The daily-H4 combination traders may trigger a short entry right after the last candle closes by setting stop-loss above consolidation resistance and by setting take profit with 1R. Let us proceed to the next chart to find out what the price does after triggering the entry.

The next candle comes out as a bearish candle as well. It looks good for the sellers. It seems the price may not take too long to hit the target of 1R. Let us proceed to the next chart.

It does not look good for the sellers now. The last candle comes out as a bullish engulfing candle. It suggests that the price may get bullish and hit the stop loss. Since this is an H4 chart, traders are to manage their trades according to the candlestick. The entry is carrying a loss now. Traders have three options here.

  1. They may close the whole entry
  2. They may let the whole trade run
  3. They may close 50% of the entry

It depends on an individual trader how he likes to manage his trades. Some traders may want to keep the whole trade, and some may want to close the whole trade. There is a saying that cut your losses short and let your profit run. Thus, we may manage the trade by closing half of it and let the rest of it run. This is how we earn or lose 50% of the initial target. Let us see how it goes now.

The chart produces a spinning top and heads towards the downside. The last candle comes out a hammer, but it hits the target of 1R. This means the trade setup brings profit for the sellers. It may have gone another way round. Thus, in such a situation, taking out half of the trade offers us less profit but less loss as well in the end. It does not always happen. However, when it does, we may consider managing the trade by doing it so.

Categories
Forex Price Action

The H1-15M Breakout Trading: Concentrate on Breakout and Reversal Candle

In today’s lesson, we are going to demonstrate an example of a trade setup based on the H1-15M chart combination. Usually, the straighter the first move, the better it is.  However, the price sometimes consolidates in the first arm as well. Such consolidation makes a move look weak and may hold us back from eyeing on the chart. We try to find out whether we should skip eyeing on such a chart or not.

This is an H1 chart. The chart shows that the price makes a bullish move. Then, it produces a bearish inside bar followed by a bullish engulfing candle. The H1-15M buyers may flip over to the 15M chart to get a 15M bullish reversal candle to trigger a long entry. However, those two bearish H1 candles suggest that the 15M chart does not produce any bullish reversal candle after the H1 breakout. The price starts having a bearish correction instead.

The chart makes its bullish move, followed by a bearish correction. The bullish move does not look that impressive. It consolidates before making the bearish correction. Many traders may skip eyeing on this chart to go long in the pair. Ideally, the H1-15M combination trading requires an H1 breakout followed by a 15M bullish reversal to offer a long entry. Let us proceed to the next chart to find out what the price does here.

The price finds its support and heads towards the North. The last candle closes above the level of resistance. This is an H1 breakout. The H1-15M combination traders are to flip over to the 15M chart to trigger a long entry. Let us flip over to the 15M chart first.

This is how the 15M chart looks right after the H1 breakout. If the price comes back to the breakout level, and the level produces a 15M bullish reversal candle, the buyers may trigger a long entry.

The 15M chart produces a bearish engulfing candle closing within the breakout level. The next candle comes out as a bullish engulfing candle. The H1-15M buyers may trigger a long entry right after the last candle closes by setting stop loss below consolidation support and by setting take profit with 1R.

The price never looks back before hitting 1R. It heads towards the North at a very good pace. Consolidation and bullish reversal candle come out exactly the buyers would want to get. Do not forget that the first bullish move does not look that impressive. The breakout and 15M chart’s price action attract the buyers to go long here, though. This is what we are to look for in the H1-15M combination trading. It is good if the price makes a strong move in the first arm. However, if it does not, we may still eye on the chart to see whether it makes an H1 breakout and offers us an entry by producing a 15M bullish reversal candle.

Categories
Forex Daily Topic Forex Price Action

The H1-15M Combination Trading in a Bearish Market

In today’s lesson, we are going to demonstrate an example of the H1-15M combination trading strategy offering a short entry. In one of our previous lessons, we demonstrated an example of a long entry. Let us see how it ends up offering us the entry.

This is an H1 chart. The chart shows that the price gets caught within two horizontal levels. The chart shows that the price after getting the last rejection has been heading towards the South. The sellers are to wait for a bearish breakout to go short in the pair.

Here it comes. The last candle breaches the level of support closing well below it. The H1-15M combination traders may flip over to the 15M chart to get a bearish reversal candle for triggering a short entry. Let us flip over to the 15M chart.

This is how the 15M chart looks. As expected, the last candle comes out as a bearish candle. If the next 15M candle comes out as a bearish candle closing below the last candle, the sellers may trigger a short entry. If the chart consolidates, the sellers are to wait for a 15M bearish reversal candle to take the entry. Let us find out what happens here.

The chart produces a bullish corrective candle. The sellers are to wait for a bearish reversal candle to go short in the pair. Usually, if the price makes a correction, it goes towards the breakout level and produces a reversal candle there. Let us find out where it produces a bearish reversal candle for the sellers.

The chart produces a bearish engulfing candle closing below consolidation support. The sellers may trigger a short entry right after the last candle closes. Stop Loss and Take Profit are to be set according to the H1 chart. Stop Loss is to be set above H1 horizontal resistance before the breakout, and Take Profit is to be set with 1R. Let us now find out how the entry goes.

This is the H1 chart. We see that the price heads towards the South with good bearish momentum and hits the target of 1R with ease. After producing the 15M bearish reversal candle, the price never looks back but goes towards the trend’s direction. This is what usually happens in the H1-15M combination trading. The price heads towards the trend’s direction without wasting time.

Do a lot of backtesting in your trading chart to find out some entries based on the H1-15M chart. Then, do some demo trading with the strategy before going live. It will help you be a better trader.


Categories
Forex Daily Topic Forex Price Action

When a Double Top and an Engulfing Candle Comes Together

In today’s lesson, we are going to demonstrate an example of a chart where the price heads towards the downside upon making a double top. At the second rejection, the chart produces a bearish engulfing candle. Usually, a combination of these two does not usually go wrong. The price does not make a deep consolidation afterward. However, it still heads towards the South with good bearish momentum. Let us have a look at how it happens.

This is a daily chart. The chart shows that the last candle comes out as a Shooting Star. The daily –H4 combination traders may consider it as a bearish reversal candle and flip over to the H4 chart.

The H4 chart shows that the price produces a double top. At the second bounce, the reversal candle comes out as a bearish engulfing candle. This combination may attract the sellers to look for short entries upon consolidation and getting bearish reversal candle.

The chart produces a bullish candle. It finds its resistance and produces a bearish engulfing candle closing below consolidation support. The sellers may trigger a short entry right after the last candle closes by setting stop-loss above consolidation resistance and take profit with 1R. Here is an equation that we may think about that. The price does not make a deep consolidation. Since the price is bearish upon a double top and an engulfing candle, most probably, it will make a strong bearish move. However, if you are in doubt, leave it out. Let us proceed to the next chart to find out what happens.

The next candle comes out as a doji candle. The price heads towards the Stop Loss, but it does not hit, though. It looks good for the sellers since the candle closes below the breakout level. Let us proceed to the next chart to find out what the price does.

The chart produces a long bearish candle and hits the target of 1R. Shallow consolidation may hold the price back a little to hit the target in a hurry. However, in the end, the sellers make some green pips with a combination of a Double Top and an Engulfing candle.

This trade setup does not meet all the requirements for combination breakout trading. The trend starts from a Double top resistance along with a bearish engulfing candle; it continues its bearish journey with more candles even after a shallow consolidation. This is what a combination of a Double Top/Bottom along with an engulfing candle can do. Thus, be keen on a chart if a trend starts with a combination of these two.

Categories
Forex Daily Topic Forex Price Action

The H1-15M Combination Trading Has a Lot to Offer

In today’s article, we are going to demonstrate a combination strategy. The combination is made of the H1 and the 15M chart. Since these two are busy intraday charts, thus a trader can find a good number of entries with this strategy. Let us now proceed and find out how it works.

The above image displays the H1 chart. The chart shows that the price gets caught within two horizontal levels. At the last bounce, the chart produces a bullish engulfing candle and heads towards the North. The sellers may wait for the chart to produce a bearish reversal candle at the level of resistance. On the other hand, the buyers are to wait for a breakout at the level.

The bull wins. A good-looking bullish candle breaches through the level of resistance, closing well above the level of resistance. Some traders may trigger a long entry right after the last candle closes. Some may initiate their long entries by setting limit order above the level of resistance. Every strategy has some advantages as well as disadvantages. Anyway, we are going to flip over to the 15 M chart to trigger an entry.

This is how the 15M chart looks. The last candle closes as a bullish candle too. This suggests that the bull has taken control. The H1-15M combination traders are to wait for the price to consolidate and produce a 15 M bullish candle to offer them a long entry.

The chart produces a bearish engulfing candle followed by a bullish engulfing candle. The buyers (H1-15M combination traders) may trigger a long entry now. The stop loss is to be set below the level of new support (breakout level), and take profit may be set with 2R. Let us proceed to the next chart to find out what the price does after triggering the entry.

This is the H1 chart. The chart shows that the price heads towards the North with good bullish momentum. The buyers achieve their 1R with ease. The point we may notice that the price never even comes back to the breakout level again after triggering the entry.

By using the H1-15M strategy, traders can get an excellent risk-reward. It offers a high winning percentage as well. In most cases, the price heads towards the trend’s direction with good momentum. On the contrary, the 15M chart may not always consolidate and produce the signal candle. Thus, traders may not get as many entries as they would like. However, since it is the H1-15M combination, it still offers a good number of entries per week in major pairs.

Categories
Forex Fibonacci

Fibonacci Trading: How Fibonacci Levels Give Clues to the Traders

In today’s Fibonacci lesson, we are going to demonstrate an example of a chart, which makes a bearish move. We dig into the charts and find out how we can take an entry based on Fibonacci levels and how the levels may help us giving clues to execute our plan. Let us get started.

The above figure shows an H1 chart. The chart shows that the price makes a bearish move at a moderate pace. It seems that the price finds its support. It has been having consolidation around the level of support having bounces three times. The last candle in this chart comes out as a bullish Marubozu candle. This may push the price towards the North. However, the sellers may still have the hope that they may get a bearish breakout here. Let us proceed to the next chart to find out what the price does.

The chart produces a bearish engulfing candle breaching the level of support. The pair trades for two more candles after the breakout. An important point is to be noticed here that the price is having an upside correction after the breakout. Sometimes price keeps trending after a breakout, whereas sometimes price makes the correction. Fibonacci levels have an important role to play in this. Thus, if we use Fibonacci levels, we are able to find out whether the price trends or makes correction well ahead. Let us now find out how we take the entry. We are to flip over to the minor chart. Since this is an H1 chart, we may flip over to the 15 M chart to trigger the entry.

Look at the arrowed candle. The candle comes out as a bearish Marubozu candle forming track rail. The candle is formed right at a flipped resistance. A short entry may be triggered right after the arrowed candle closes. The chart also shows how the price heads towards the South after the signal candle. Let us now see the H1 chart with Fibonacci levels.

The chart shows that the price trends from 78.6% level. Thus, it may reverse at 138.2%. It hits 161.8% here. However, we may set our target at 138.2% if the price trends from 78.6% to be safe. The Stop Loss may be set here above 100.0 Fibonacci level.

These are the things we must remember when we trade a chart trending from a 78.6% level.

  1. The price may make a reversal at 138.2.
  2. If the price trends from 78.2%, it most probably makes a correction after the breakout. Otherwise, it does not give a good risk-reward as well.


Categories
Forex Fibonacci

Determining Higher Highs or Lower Lows to Draw Fibonacci Levels

Fibonacci levels are obtained by using higher highs or lower lows. A chart may have many higher highs/lower lows. Thus, Fibonacci levels can be obtained at different levels. A trader may find it difficult to spot out the levels where the price may react. In today’s lesson, we are going to see how different higher highs may lead us to having Fibonacci levels where the price does not react.

This is an H1 chart. The price heads towards the North with good bullish momentum before making a bearish correction. The point can be used to draw Fibonacci levels. The price then makes another bullish move and makes a new higher high. Some traders may want to use the last higher high to draw their Fibonacci levels. To make it clear, look at the chart below.

Some traders may use AB, while some others may use AC to draw Fibonacci levels. These two arms point out Fibonacci levels at different levels. Let us assume that we draw our Fibonacci levels by using AC.

The chart shows that the price after making the last higher high has started having a bearish correction. The buyers are to wait for the price to come at 78.6% level and make a breakout at the level of 100.0 to offer them a long entry. If the 78.6% is breached, 61.8% may do the same and offer them an entry as well. Let us proceed to the next chart to find out what happens next.

The price does not even come at 78.6%. It heads towards the North and makes a breakout at the level of 100.0. The price then never looks back. It hits the level of 161.8% in a hurry. The Fibonacci buyers do not find an entry here since the price does not trend from a 78.6% level. It trends way above the level of 78.6%.

Let us draw the Fibonacci levels with AB arm.

If we draw Fibonacci levels by using AB, we see that the price trends from 78.6% level. One candle breached through the level, but the next candle closes well above the level of 100.0. The buyers may set their target around 138.2% since it trends from 78.6%. However, it goes up to 161.8%.

To sum up the lesson, Fibonacci traders are to be well calculative at the time of selecting the first arm. With AC, there is no correction. The price trends towards the North straight. With AB, the price makes a correction and then makes another bullish move. Usually, a straight arm works well and provides accurate Fibonacci Fibonacci levels. Over here, we have seen that AB provides the Fibonacci levels, where the price reacts and help the buyers take a trading decision.


Categories
Forex Price-Action Strategies

Price Action Trading: Dealing with Daily Chart’s Support/Resistance

In today’s price action lesson, we are going to demonstrate an example of a daily chart where the price reacts to support and resistance. We will dig into the chart and find out what message it has to offer us.

The chart shows that the price heads towards the North upon producing a bullish track rail pattern. The next candle comes out as another bullish candle. However, the price finds its resistance. The level has been working as a level of resistance where the price has rejection twice already. Look at the last candle on the chart. It comes out as a bearish inside bar. However, the level is now triple top resistance. Intraday sellers may look to go short in the pair and drive the price towards the South.

As expected, the pair produces another bearish candle. The last swing low offers enough space for the sellers to go short in the pair. Thus, they may still go short in the pair and drive the price towards the South further. The daily sellers are to wait for the price to consolidate and produce a bearish reversal candle to offer them a short entry. Let us see what happens next.

The chart produces a bullish inside bar. The sellers on the daily chart may go short if the next daily candle comes out as a bearish reversal candle. They are to keep this chart on their watch list.

The next candle comes out as a bearish engulfing candle. This means the sellers on the daily chart may go short in the pair and drive the price towards the last swing low as far as price action trading is concerned. If the next daily candle breaches the level of support (last swing low), they may keep holding the position to grab more pips. Let us find out what happens next.

The next candle comes out as a bearish candle closing within the last swing low though. The sellers make some green pips. It might be time for them to close the trade since the candle closes within the level of support. If the candle closes below the level of support, it would surely be a different ball game for the sellers.

Intraday traders obey Support/Resistance on the daily chart a lot. Thus, daily support/resistance plays a significant role in the Forex market to make a reversal/correction/consolidation. Thus, if we take entry even based on the daily chart, we must count those to manage our entries.

Categories
Forex Fibonacci

Fibonacci Trading: Be sure whether the Level is Held or Breached

Breakout plays a very vital role in the Forex market. Traders use breakout, breakout levels to make a trading decision. Fibonacci traders are to make sure whether a particular level is breached or it holds the price to make a better trading decision. In today’s lesson, we are going to demonstrate an example where Fibonacci traders may need to concentrate more to be sure about the Fibonacci level from where the price trends. Let us get started.

This is an H1 chart. The chart shows that the price makes a strong bearish move. It makes an upside correction followed by a strong bearish move again. The price has been having an upside correction again. Fibonacci traders are to draw the Fibonacci levels in the chart to find out where the price makes a bearish reversal and how far it may go up to.

Here are the levels. The chart shows that the price produces a bearish engulfing candle and heads towards the South with good bearish momentum. The question is whether the price trends from 78.6% or 61.8%. It is a vital issue since the price heads towards either 138.2% or 161.8% based on these two levels. If we concentrate on the chart, we see one of the bullish candles closes above the 78.6% level. However, the price comes back within the 78.6% level with the next candle. This means the H1 chart does not make a bullish breakout at 78.6%. The sellers may plan their entries to go short up to 138.2% in this chart. Let us proceed to the next chart to find out what price does.

The price breaches the 100.0 level and trades below for several candles. The sellers may wait for a bearish reversal candle and go short in the pair as long as they are satisfied with the risk-reward factor. Usually, it is best if the price goes back to the 100.0 level and produces a bearish reversal candle around the level as far as the risk-reward ratio is concerned. However, it may be produced anywhere between 100.0% to 123.6%. The sellers with different strategies may set their stop loss at different levels, but their last take profit level is to be set at 138.2 %. Let us proceed to the next chart to find out what the price does next.

The chart shows that the price hits 138.2%. As expected, it has been roaming around the level. It seems that the price may have found its support around 138.2% level, and it may make a bullish reversal. The sellers with Fibonacci levels have completed their mission with perfection.

Categories
Forex Fibonacci

Fibonacci Trading: When Momentum is Lacking

Traders wait for the price to trend from 61.8% Fibonacci level. This is what attracts more traders to trade, which generates good momentum. When the price trends from 61.8% level, it usually goes up to 161.8%. Since the price gets enough space to move, it offers better risk-reward. This is another reason that Fibonacci traders love to trade in a chart when the price trends from 61.8%. However, the Forex market is uncertain. We may see that the price does not head towards 161.8% with good momentum upon trending from 61.8% from time to time. In today’s lesson, we are going to demonstrate an example of this.

This is an H1 chart. The chart shows that the price heads towards the South with good bearish momentum. Upon producing a strong bearish candle, it starts having a bullish correction. Fibonacci traders shall get themselves ready by drawing Fibo levels on the chart to find out potential short opportunities in the pair.

Here it is. The chart shows that the price breaches 78.6% level and trades above the level for two more candles. This means the price is in 61.8% zone. If the price trends from here, it may go towards 161.8% level. Yes, it would be better if the price goes towards the North and trends right from the level 61.8%. Nevertheless, the sellers still are to count the move from 61.8% zone. The chart produces a bearish engulfing candle followed by a doji candle. Since the reversal candle comes out as a bearish engulfing candle forming from 61.8% zone, some sellers may trigger a short entry (some may wait for the price to breach the last lowest low). Let us proceed to the next chart to find out what the price does.

The price heads towards the South and it makes a breakout at the last swing low as well. The pair may get more short orders now. However, the price does not head towards the South. It seems that 161.8% level is far away for the price to reach. It does not usually happen but this is how the Forex market runs. It does not always run on a single equation. A question may be raised here what does a trader do with his entry? Since it is an H1 chart based entry, it must be left behind and let it decide its fate by setting Stop Loss and Take Profit accordingly.

Categories
Forex Daily Topic Forex Price Action

Spot the Chart Accordingly before Triggering for an Entry

In today’s lesson, we are going to demonstrate an example of a chart, which may entice traders to take entry more than once. Some traders may get themselves engaged in taking entry. We find out why we price action traders skip taking those entries. Let us get started.

This is an H4 chart. The price makes a strong bearish move by producing three consecutive Marubozu bearish candles. The last candle comes out as a doji candle. The price may consolidate now. The sellers are to wait for a strong bearish reversal candle upon consolidation to go short in the pair. Let us proceed to the next chart.

The chart produces a bearish Marubozu candle again. As a reversal candle, it is a strong one. However, the price has not consolidated well. It has produced the bearish reversal candle upon having a shallow consolidation. Moreover, the last candle does not close below the level of support. Thus, the sellers may skip taking the entry but wait for the right time to come. The chart still looks good for the sellers.

The chart produces a bullish engulfing candle. The price may make a deeper consolidation this time. The sellers may keep their eyes on the chart again to go short in the pair. Let us proceed to the next chart to find out what happens next.

The price makes a deeper consolidation. Upon finding its resistance, it makes a bearish move. It seems that the price may make a breakout here. A question may be raised here whether the sellers on the H4 chart shall take the entry or not? We find out the answer in a minute. Meanwhile, let us proceed to the next chart.

The next H4 candle closes well below the level of support. The pair trades below the breakout level for one more candle as well. However, the sellers on the H4 chart may skip taking the entry. The reason behind that is the chart takes more than six candles (a day) to make the breakout. This level of support is a daily level of support now. Thus, the sellers may take the trading decision as far as the daily chart is concerned. If they take their trading decision by observing the H4 chart, it may not be that fruitful. The risk-reward may not be a good one. It may not end up being a daily breakout, but the price may come back in. Or, the daily chart may produce a bullish corrective candle next day, which makes the price hit the H4 sellers stop loss. Thus, in such cases, they might have to take losses only because the pair belongs to the daily chart. Thus, for better trading, traders shall take a closer look before taking entry on a chart to determine whether it favors their trading chart.

Categories
Forex Chart Basics Forex Daily Topic

Chart Combination Traders: Do Not Forget to Calculate This

In today’s lesson, we are going to demonstrate an example of the Daily-H4 chart combination, which may end up producing a trading signal. We find out soon whether it produces a trading signal or not in the end. Let us get started.

This is the daily chart. The chart shows that the price makes a strong bullish move. It seems that the price has found its resistance. The last candle comes out as a bearish engulfing candle. This suggests that the sellers in the intraday charts may get themselves engaged to look for short opportunities in the pair. Let us flip over to one of the major intraday major charts, the H4 chart.

The chart shows that the price makes a strong bearish move and produces a bullish engulfing candle followed by a bearish inside bar. However, the daily candle ends up being a bearish engulfing candle, thus the H4 sellers have an upper hand than the buyers.  Let us proceed to the next chart with some drawings in it.

The price bounces off at the red marked level. The sellers are to wait for the price to make a breakout at the level of support to go short in the pair. The last candle in this chart comes out as a bearish inside bar. The price may head towards the level of support and make the breakout. However, the sellers may have to wait since an inside bar is not a strong reversal candle. Let us find out what happens next.

The price heads towards the South and bounces off several times at the level of support. It does not make the breakout though. The last candle comes out as a bullish engulfing candle too. A bullish engulfing candle at the level of support indicates that the buyers may get themselves engaged in buying soon. Moreover, there are six H4 candles after that bearish engulfing daily candle (A trading day contains six H4 candles). The level of support has become daily support now. Thus, the H4 sellers must wait for the daily chart to produce another bearish candle before going short in the pair.

It is often seen that if an H4 candle breaks a daily support/resistance, the price does not head towards the breakout direction in a hurry. It often consolidates around the level, which sometimes makes traders lose money. The same thing shall be maintained in the H4-H1 chart combination as well. If an H1 candle does not make a breakout (after an H4 reversal candle) within next four H1 candles, the support resistance becomes H4 support/resistance. Traders shall wait for upcoming H4 candles to give them the price direction and trade.

Categories
Forex Fibonacci

Fibonacci Levels Help Traders Make Better Trading Decision

In today’s lesson, we are going to demonstrate a chart where the price makes a strong bearish move from a Fibonacci level. It has two messages, which we will find out soon. Let us get started with the chart’s price action.

The chart shows that the price makes a strong bearish move. The last candle comes out as a long bearish candle, which states that the sellers dominate over the buyers. Traders may want to wait for the price to make a bullish correction to go short in the pair with more aggression.

The chart produces a bullish inside bar. The sellers are to keep their eyes on the pair to get a bearish reversal candle to go short. It seems that the pair may produce a strong bearish reversal candle (the signal candle) soon.

The chart produces a bearish inside bar, which is not the sellers’ favorite to go short. The price makes a little bearish move and heads towards the North again. Look at the last candle in the chart. It comes out as a bearish engulfing candle, which is one of the strongest bearish reversal candles.

As expected, the bearish engulfing candle drives the price towards the South. The sellers on the minor chart are going short. Thus, the price is about to make a breakout at the last swing low on the chart as well.

The price makes a breakout at the last swing low and heads towards the South further. Then, it produces two bullish candles in between but continues its bearish journey again. The price may have found its support since it produces four consecutive bullish candles. The price may continue its bearish journey, or it may make a bullish reversal. The bull looks good here. Let us draw Fibonacci levels and see whether it gives us a clue about the trend continuation or a reversal.

The chart produces a bullish inside bar right at 138.2 level. Please note that the price makes its bearish move from 78.6 level. The level of 78.6 has a strong relation with 138.2. If the price trends from 78.6, it often makes a reversal at 138.2. This is what happens here.

To sum up, if we learn the art of using Fibonacci levels and understand how a level is related to others, it becomes easy for us to take trading decisions such as entry, exit, and taking a partial profit. In the end, it makes us prolific traders.