Categories
Crypto Market Analysis

Daily Crypto Review, August 6 – ‘Ethereum Is a Ponzi Scheme’ – Adam Back; ETC Suffers Yet Another 51% Attack

The cryptocurrency market ended up mostly in the green, with (of course) a few exceptions. Bitcoin is currently trading for $11,665, which represents an increase of 3,46% on the day. Meanwhile, Ethereum gained 1.6% on the day, while XRP gained 1.41%.

 Daily Crypto Sector Heat Map

When talking about top100 cryptocurrencies, Band Protocol gained 36.21% on the day, making it the most prominent daily gainer. Travala.com (24%) and Bancor (22.19%) also did great. On the other hand, Nexohas lost 21.32%, making it the most prominent daily loser. It is followed by The Midas Touch’s loss of 8.47% and THORChain’s loss of 7.70%.

Top 10 24-hour Performers (Click to enlarge)

Bottom 10 24-hour Performers (Click to enlarge)

Bitcoin’s dominance level has increased since we last reported, with its value currently at 61.48%. This value represents a 0.31% difference to the upside when compared to yesterday’s value.

Daily Crypto Market Cap Chart

The cryptocurrency market capitalization has increased since we last reported. Its current value is $353.48 billion, which represents an increase of $12.09 billion when compared to the value it had yesterday.

_______________________________________________________________________

What happened in the past 24 hours?

_______________________________________________________________________

_______________________________________________________________________

Technical analysis

_______________________________________________________________________

Bitcoin

The largest cryptocurrency by market capitalization continued its move towards the upside after a few days of indecisiveness and consolidation. Bitcoin saw a slight increase in volume, which brought the price above the $11,460 resistance level and up to $11,820. However, the move stopped there (for now), and Bitcoin is currently consolidating above the $11,460 level, testing it as support.

BTC traders should look for an opportunity to make a trade when BTC confirms or fails to confirm its position with $11,460.

BTC/USD 4-hour Chart

Technical factors:
  • Price is currently above its 50-period EMA, as well as its 21-period EMA
  • Price is near its top B.B
  • RSI is elevated (62.37)
  • Volume is increasing
Key levels to the upside          Key levels to the downside

1: $11,460                                 1: $11,090

2: $11,630                                 2: $10,855

 3: $12,000                                 3: $10,505

Ethereum

Ethereum seems to be back on its steady upwards path, which began on July 21. The second-largest cryptocurrency by market cap rose steadily throughout the day, trying to reach past the $415 resistance. While the price did not yet reach this mark, it did increase slightly, supported by the 21 and 50-period moving averages.

Traders should look for a trade opportunity within the range ETH is currently in.

ETH/USD 4-hour Chart

Technical Factors:
  • Price is above its 21-period EMA and its 50-period EMA
  • Price is slightly above its middle B.B. (20-period SMA)
  • RSI is elevated (60.26)
  • Descending volume
Key levels to the upside          Key levels to the downside

1: $415                                     1: $362

2: $496                                     2: $340

                                                  3: $302

Ripple

XRP experienced sideways movement on low volume throughout the day. The third-largest cryptocurrency by market capitalization was trading near the top of its triangle formation, unable to break it yet. However, the decreasing volume, as well as the price approaching the 80% mark of the formation, indicate a move which will take XRP out of the triangle formation. While it is too early to speculate, XRP seems to have a better chance of breaking to the upside.

Traders can look for an opportunity to trade when XRP breaks its triangle formation.

XRP/USD 4-hour Chart

Technical factors:
  • Price is above its 21-period and 50-period EMA
  • Price is below the middle B.B. (20-period SMA)
  • RSI is neutral (55.62)
  • Low volume
Key levels to the upside          Key levels to the downside

1: $0.32                                    1: $0.285  

2: $0.3328                                2: $0.266

                                               3: $0.245


Categories
Forex Market Analysis

Daily F.X. Analysis, August 06 – Top Trade Setups In Forex – A Day Before NFP! 

It’s going to be a busy day from a news perspective, especially for the GBP pairs. The Bank of England is scheduled to publish its Monetary policy with bank rates. Although economists are not expecting BOE to change interest rates, the MPC Asset Purchase Facility Votes is expected to change. Nine out of nine members have voted to increase the asset purchase program to accommodate the economy.

Economic Events to Watch Today  


EUR/USD – Daily Analysis

The EUR/USD closed at 1.18640 after placing a high of 1.19048 and a low of 1.17927. The EUR/USD once again saw a bullish movement after a brief U.S. dollar recovery attempt earlier this week. Despite worsened coronavirus cases in some Eurozone nations, the bloc’s outlook remained much more optimistic than the U.S. outlook.

While the advances in the Euro have slowed, the EUR/USD pair has continued to trend higher over the past week. EUR/USD pair climbed slightly from 1.1656 to 1.1778 last week. After U.S. Dollar attempted to recover, the pair EUR/USD saw a brief dip at the beginning of this week. However, the EUR/USD pair is eventually rising again as the U.S. dollar’s weakness persists. Whereas, the potential for advances in the currency pair was limited as coronavirus concerns rose on Sunday.

The Euro remained broadly appealing overall. Throughout the coronavirus pandemic, the E.U. and the European Central Bank have handled the crisis well compared to other major economies like the U.K. & U.S.

As a result, Euro’s losses in response to a rebounding U.S. dollar have been limited. The Euro and U.S. dollar has a negative correlation, and the Euro often gains from the U.S. dollar weakness. It means that the rally of the EUR/USD pair is set to continue even a rise in worsening coronavirus cases’ concerns.

The Euro appeal was also down after Spain saw a surge in coronavirus cases, and speculations arose that the Eurozone could face fresh lockdowns in Spain to support the Eurozone economy. On the U.S. dollar front, the greenback attempted recovery earlier this week; however, the gloomy outlook persisted and kept investors from mounting much of a recovery rally in the currency.

The number of coronavirus cases in the United States has increased to its highest, and the U.S. government and Federal Reserve have only taken mixed action to limit the virus spread and protect the U.S. economy. Attempts to push further stimulus have been stuck in U.S. Congress, and Federal Reserve may become more dovish.

On the data front, at 12:15 GMT, the Spanish Services PMI fell short of expectations of 52.3 and came in as 51.9. The Italian Services PMI for July came in as 51.6 against the expectations of 51.6 and supported Euro.

At 12:50 GMT, the French Final Services PMI for July dropped to 57.3 against the expected 57.8 and weighed on Euro. At 12: 55 GMT, the German Final Services PMI dropped to 55.6 against the forecasted 56.7. The Final Services PMI for the whole bloc fell to 54.7against the forecasted 55.1and weighed on EURO.

From US Side, the ISM Non-Manufacturing PMI rose in July to 58.1 from the expected 55.0 and supported the U.S. dollar. Though the data was against the movement of EUR/USD pair, however, pair still moved in the upward direction.

Daily Technical Levels

Support Pivot Resistance
1.1802 1.1854 1.1915
1.1740 1.1968
1.1688 1.2029

EUR/USD– Trading Tip

The technical side of the EUR/USD remains mostly the same as it’s trading with a bullish bias around 1.1880 level. On the higher side, the EUR/USD pair may find resistance at 1.1909 level, and the closing of candles below this level can keep bearish pressure on EUR/USD. A bullish breakout of this level can extend the buying trend until 1.2050. Today, the EUR/USD is likely to find support at 1.1800 level.


GBP/USD – Daily Analysis

The GBP/USD closed at 1.31133 after placing a high of 1.31614 and a low of 1.30528. The pound rose on Wednesday to remain on course for a third-straight weekly gain against the U.S. dollar and ignored weaker than expected economic data ahead of the Bank of England meeting on Thursday. On Wednesday, the Final Services PMI in July came in as expected 56.5 points and indicated expansion in the services sector in the U.K.

This Thursday, the focus will be on the Bank of England’s monetary policy decision and Andrew bailey’s speech. The central bank of England is anticipated to keep interest rates unchanged but will roll out its forecasts on a range of economic measures, including Inflation, GDP, and unemployment. In recent weeks, debates have been under discussion about the BoE’s cutting of rates below zero, but Thursday’s meeting is unlikely to offer detailed insight.

The NIRP (Negative Interest Rate Policy) has been under active review at the Bank of England, but it seems like a little too early for the central bank to make any decisive move. Some analysts expect that the Bank of England will prefer to hold off on using a negative interest rate until the EU-UK relationship for 2021 gets cleared.

On the U.S. front, the ADP Non-Farm Employment Change dropped to 167K from the expected 1200K in July. It means that the U.S. government introduced 167K jobs only while that weighed on the U.S. dollar and added strength to the GBP/USD pair gains.

However, in July, the Final Services PMI rose to 50.0 from expected 49.6, and the ISM Non-Manufacturing PMI rose to 58.1 from expected 55.0. This showed an expansion in America’s services sector in July and gave support to the U.S. dollar that weighted on additional gains in GBP/USD pair.

Another reason for the rise in GBP/USD pair was the weakness of the U.S. dollar. The ever increasing numbers of coronavirus cases dampened the prospects for a swift economic recovery in the U.S. and forced investors to continue dumping the greenback. This, coupled with the delay in the U.S. fiscal stimulus package’s announcement and further pressurized the U.S. dollar.

The U.S. dollar was so under pressure that even the goodish rebound in the U.S. Treasury bond yields failed to support the U.S. dollar.

Apart from this, the rising number of coronavirus cases in the U.K. and the renewed fears of no-deal Brexit as both sides were lagging in the progress of securing a deal, held investors to place any aggressive bullish position in the GBP/USD pair ahead of BoE monetary policy.

Daily Technical Levels

Support Pivot Resistance
1.3060 1.3111 1.3166
1.3005 1.3217
1.2954 1.3271

GBP/USD– Trading Tip

The GBP/USD is trading at 1.3085 level, holding right below the triple top resistance area of 1.3101 level while the bullish breakout of 1.3105 can drive more buying in the GBP/USD pair. On the higher side, the GBP/USD may find resistance at 1.3175, while support can be found around 1.3056 and 1.3022 level. Let’s keep an eye on 1.3125 to extract a bearish bias in the GBP/USD pair today. A bearish breakout of 1.3050 can drive more selling until 1.3005.


USD/JPY – Daily Analysis

The USD/JPY pair was closed at 105.592 after placing a high of 105.871 and a low of 105.318. Overall the movement of the USD/JPY pair remained bearish throughout the day. The USD/JPY pair extended the decline on the back of the weaker U.S. dollar across the board and bank of Japan governor Kuroda’s speech telling that Japan’s economy will improve in the second half of the year.

The Bank of Japan Governor Haruhiko Kuroda warned that in order to contain the spread of public health measures were re-introduced, then the economic activity could be significantly constrained. He also affirmed that Japan was not slipping into deflation and that the central bank would continue with its efforts to achieve the inflation target of 2%. Kuroda again assured that the Bank of Japan will be ready to ramp up the monetary stimulus without hesitation if needed to aid the economy through the pandemic crisis.

Kuroda also said that Japan’s financial system was quite safe and stable and countered the fears that the banking sector would fall out from COVID-19. He also warned that if pandemic prolonged longer than expected, there will be risks to Japan’s financial stability.

He said that Japanese and overseas economies would gradually improve from the second half of this year despite extremely high uncertainties. But the pace of improvement is likely to be moderate as the preventive measures to control the virus spread has its effects on economic activity.

On the other hand, the greenback was the worst performer in the currency market on Wednesday. It was so under pressure that it could not benefit from the latest round of economic data that showed an improvement in the Service Sector of the U.S. The rebound in the U.S. Treasury yield also could not support the U.S. dollar. The U.S. Dollar Index (DXY) was testing the 92.60 level lowest since last week.

On the data front, the ADP Non-Farm Employment Change showed that the U.S. created 167,000 jobs in July against the estimated 1200K. This weighed on the U.S. dollar and added further in the losses of the USD/JPY pair.

On Wednesday, U.S. President Donald Trump said that big jobs were coming on Friday. However, private payroll data by ADP reported on Wednesday that just 167,000 jobs were created in July.

 The Trade Balance from the U.S. fell in line with the expectations of -50.7B. The Final Services PMI rose to 50.0 points in July than the expectations of 49.6 and supported the U.S. dollar. At the same time, the ISM Non-Manufacturing PMI also rose to 58.1 points from the forecasted 55.0 and came in favor of the U.S. dollar.

However, USD bulls did not cheer the positive data, and the U.S. dollar remained under stress on Wednesday to post losses on the day.

On the US-China front, China’s ambassador to Washington said that China did not want to see a Cold War break out between China and the U.S. He suggested that both countries need to work to repair their relations that were under extraordinary stress.

Daily Technical Levels

Support Pivot Resistance
105.3100 105.6000 105.8800
105.0300 106.1700
104.7400 106.4500

USD/JPY – Trading Tips

The USD/JPY is trading with the bearish sentiment, especially after violating the 38.2% Fibonacci support level of 105.650. On the lower side, the USD/JPY may find support at 105.078 level, which is extended by the 61.8% Fibonacci retracement level. A bearish breakout of 61.8% level can drive more selling until the next support area f 104.200. The current market price of USDJPY is staying below 50 EMA, which extends resistance at 105.650 level. Let’s consider selling below 105.650 level today. Good luck! 

Categories
Forex Fundamental Analysis

Exploring The ‘GDP From Utilities’ Forex Fundamental Indicator & Its Impact On The Market

Introduction

The Utility sector is the safe-haven sector for investors during economic slowdowns. The volatility of the Utility Sector is very low compared to any other market, be it currency, stocks, or any other financial market. Understanding the nuances involved with the GDP from the Utility Sector can help us identify money flow patterns during slowdowns and growth periods.

What is GDP from Utilities?

Utility Sector

As per the Bureau of Economic Analysis Department of Commerce: The Utility Sector comprises of industries that provide the following utilities: electricity, natural gas, water, and steam supply, sewage removal. Hence, the Utilities Sector deals with the most necessary commodities for the functioning of modern-day society. It deals with the most indispensable resources.

Functioning of societies without electric power is impossible.

One research even shows if electricity was not available for two weeks, 50% of survey members stated they could not survive. Water, Sewage systems, natural gas are all pillars for conducting our social life. Hence, these basic amenities produce profits; they are part of public service and hence are heavily regulated.

Within the sector itself, specific activities associated with utilities also vary. Electric power includes generation, transmission, and distribution. So some companies may only focus themselves on the sub-categories within the Utility sector.

Water supply includes treatment and distribution. Steam supply includes provision and distribution. Sewage removal consists of the collection, treatment, waste disposal through sewer systems, and sewage treatment facilities.

How can the GDP from Utility numbers be used for analysis?

Utilities generally give its investors stable and consistent dividends. It is relatively less volatile compared to other equity markets. During times of recession, the non-essential goods and services sectors take the worst hit while Utility Sector the least. As utilities are a necessity, their performance is consistent in the long run.

Typically investors buy utilities as long-term holdings for their dividend income and portfolio stability. During recessions, where the Central Authorities cut interest rates to stimulate the economy, investors flock to Utility stocks as a more secure alternative. When economic growth is restored, investors may find better alternatives than utility sectors.

Since this sector is heavily regulated, raising rates to increase revenue for the companies. The infrastructure required to run utility services are expensive and require high capital to maintain and upgrade over time. Hence, Utility providing companies have debts in their balance sheets, taken for maintenance and continuity. Hence, these industries are susceptible to interest rate fluctuations, as interests on their debts vary accordingly.

Consumers also have an impact on the Utility sector. Since many states let consumers choose their utility provider, the competition forces companies to keep competitive prices, that overall decreases their profits. Long-term power purchase agreements or water supply contracts can also incur dent on profits for companies when utility generation costs increase over time.

It is also crucial to know the growth of the Utility Sector is also a function of population and industrialization. Developing economies observe a rise in new factories, and industries would require higher utility services. The contrast in the sector’s economic size would be apparent while contrasting underdeveloped and developed economies.

Capitalization of utility services can lead to monopoly or resource control to private industries to their advantage for profits. Overall, we also must consider that utility services are to be accessible to all classes of people. Hence, regulation by the government is essential to keep it affordable for the lower sections of society.

The regulation also ensures that sustainable development is kept as a priority over profits. As the generation of electricity from fossil fuels like coal, and water supply from underground water, both of which are exhaustible. Therefore, revenue-wise, Utility Sector is not a significant contributor. In the United States, it contributed about 1.6% of value to GDP for the year 2018 and 2019.

Impact on Currency

The GDP from Utilities is a low impact indicator compared to the Broader measures like GDP Growth Rates and Real GDP. GDP from Utilities does not paint the full picture of the economy but tells us the direct contribution of the Utility Sector to the overall GDP. It is useful for long-term investors as a safe-haven during economic slowdowns.

Still, for the International Currency Markets, it does not serve as a useful indicator. It is a proportional and lagging indicator. Higher GDP from Utilities will impact the economy and its currency positively. Contrarily, low GDP from utilities will have a negative impact.

Sources of GDP from Utilities

GDP from Utilities Announcement – Impact due to news release

The Utility sector is an important part of any country as it consists of essential products that are consumed by people daily. Water, gas, electricity are some of the products of the Utility sector. Naturally, they play a vital role in economic and social development. Governments are responsible for ensuring access to service under an accountable regulatory framework.

Utilities are one of the key stakeholders in the economic development team. This industry is also important because all business requires these essential services to operate. Therefore, its contribution to the GDP is increasing year by year. When it comes to fundamental analysis of the currency, investors consider the nominal GDP as an indicator of the economy’s growth.

In today’s example, we will examine the impact of GDP on the value of a currency and see the change in volatility because of its news release. The below image shows the first-quarter GDP data of Hong Kong, where we see a big drop in the value from the previous quarter. Let us find out the reaction of the market to this data.

USD/HKD | Before the announcement

Let us first examine the USD/HKD currency pair to analyze the impact of GDP on the Hong Kong dollar. In the above price chart, it is clear that the market is moving within a ‘range’ where the overall trend is up. Before the news announcement, the price is at the bottom of the ‘range,’ which means there is a high chance of buyers getting active from this point. Aggressive traders can ‘long’ positions as the market is expecting weak GDP data for the first quarter.

USD/HKD | After the announcement

After the news announcement, the price rises by a few pips, and the market moves higher by little. As the GDP data was very bad, the rose higher, which resulted in the weakening of the currency. But this did not bring the kind of weakness and bearishness expected, as the GDP had dropped by more than 5%. This means the new release had the least impact on the currency pair.

EUR/HKD | Before the announcement

EUR/HKD | After the announcement

The above images represent the EUR/HKD currency pair, where we see that before the news announcement, the price has broken out of the small ‘range’ that was formed few hours before the news release. Until the breakout is confirmed, one should not consider buying the currency pair as the news announcement could lower the price and make this a false breakout.

After the news announcement, the market moves lower and volatility increases to the downside, resulting in the Hong Kong dollar’s strengthening. We witness an opposite reaction from the market in this currency pair, where the currency gains strength after the news release. This means the market has already priced in weak GDP data and reacted positively to the GDP data. We recommend using technical indicators to confirm the breakout and then take ‘long’ positions.

AUD/HKD | Before the announcement

AUD/HKD | After the announcement

The above images are that of AUD/HKD dollar, where we see that before the market is moving within a ‘range’ before the news announcement where the price is currently in the middle of the ‘range.’ Another thing we notice is that the overall trend of the market is up, which means we need to be cautious before taking a ‘sell’ trade in the currency pair.

After the news announcement, we see that the price marginally moves higher and closes with a slight amount of bullishness. This means the GDP did not impact the currency pair adversely and minimal effect on the pair. One could take a ‘short’ trade after price moves below the moving average.

Categories
Forex Market Analysis

Daily F.X. Analysis, August 05 – Top Trade Setups In Forex – Advanced NFP In Focus! 

We have a series of low and medium impact events coming ahead, and the focus will be on the Eurozone’s Services PMI, U.S. Advance NFP, and U.S. ISM non-manufacturing events. The U.S. events are forecasted to be negative but positive data may drive selling trend in gold; let’s brace for it.

Economic Events to Watch Today  


EUR/USD – Daily Analysis

The EUR/USD pair was closed at 1.18024 after placing a high of 1.18057and a low of 1.17211. Overall the movement of the EUR/USD pair remained bullish throughout the day. The EUR/USD pair climbed to 1.1800 level from 1.17200 level on Tuesday after the U.S. Dollar Index fell by 0.1% to 93.45 level. However, the U.S. dollar index spent most of the day in positive territory but failed to keep its gains. The U.S. Treasury yields were lower on Tuesday, and the equity prices were high that weighed on the U.S. dollar. The 10-year U.S. Treasury bond yield was down to 0.513% level, the lowest level since March.

The weakness in the U.S. dollar was the main driver of the EUR/USD pair on Tuesday. On the data front, the IBD/TIPP Economic Optimism rose to 46.8 from the expected 45.3 and supported the U.S. dollar. The Factory Orders from June were also increased to 6.2% from the forecasted 5.1% and supported the U.S. dollar.

From the European side, the French Government Budget Balance showed a deficit of 124.9 B in June as compared to the deficit of 117.9 B in May. At 12:00 GMT, the Spanish Unemployment Change came in as -89.8K against the forecasted 19.5K and supported EUR. At 14:00 GMT, the Producer Price Index for June surged to 0.7% against the expected 0.6% and supported EUR.

The European side’s macroeconomic data came in favor of the EUR/USD pair and took its prices above the 1.1800 level. Meanwhile, on Tuesday, the U.S. Congress Senate Democratic leader Chuck Schumer said that talks with the White House were finally moving in the right direction. However, they still were far apart on some issues. The gap between the two parties was about priorities and scale. Even though the difference was also mentioned, investors cheered the news that the talks were heading in the right direction and boosted their mood.

The equity prices rose, and the U.S. dollar suffered as the issuance of new stimulus weighed on the U.S. dollar. The weakness of the U.S. dollar ad rise in equity prices gave a push to EUR/USD pair. This Wednesday, the market will release the final versions of its July Services PMI for most major economies that are mostly expected to suffer upward revisions from preliminary estimates. E.U. will also reveal Retail Sales data for June. While the U.S. will release the ADP survey on private employment for July and the Non-ISM Manufacturing PMI. Traders will keep a close watch on both releases.

Daily Technical Levels

Support Pivot Resistance
1.1707 1.1752 1.1808
1.1651 1.1853
1.1605 1.1909

EUR/USD– Trading Tip

The EUR/USD shows another round of buying to trade at 1.1810 level. A recent breakout of the 1.1800 level is likely to lead EUR/USD prices further higher until 1.1849 and 1.1910 level. However, the support may be found around 1.1795 and 1.1760 area. Bullish bias will be stronger over the 1.1820 breakouts. The RSI and MACD are holding in the bullish zone while the 50 periods EMA is also suggesting potential for a bullish trend continuation today.


GBP/USD – Daily Analysis

The GBP/USD pair was closed at 1.30701 after placing a high of 1.31079 and a low of 1.29810. Overall the movement of GBP/USD pair remained flat throughout the day. The pair GBP/USD reached a lower level of 1.2980, but it recovered from that level to settle once again around 1.3070 level in the late session. The decline and the later recovery was once again about the U.S. dollar as investors continued to ignore U.K. news and focused on USD news.

The U.S.’s macroeconomic data about factory orders in June rose to 6.2% from the anticipated 5.1% and supported the U.S. dollar that kept the GBP/USD pair under pressure.

However, the U.S. Senate Democratic leader’s latest statement that both Republicans & Democrats were moving in the right direction regarding the U.S. stimulus package weighed on the U.S. dollar. The U.S. Dollar Index dropped to 93.4 level, and the U.S. Treasury yield for a 10-year bond also dropped. Whereas, the equity prices rose that weighed further on the U.S. dollar.

On the other hand, the lack of progress in trade talks between the E.U. & the U.K. has shifted the attention to other economies. As the kingdom has started talks with the United States, that has shown little progress.

Furthermore, Toshimitsu said on Tuesday that Japan’s foreign minister would visit the U.K. this week to meet his counterpart to wrap up talks over a free-trade agreement between both countries.

However, earlier on the day, UK PM Boris Johnson announced another round of stimulus focused on the home construction and infrastructure to boost the economy. The suggested investment of around 900 million pounds out of 360 million pounds will be allocated towards delivering 26,000 new homes on brownfield land.

The demand for Sterling was also cooled down after the latest lockdown was imposed in the London area amid the resurgent coronavirus cases.

Meanwhile, considering the possible delay at the customs union’s border after leaving the E.U.’s single market, the U.K. government issued a letter in writing to pharmaceutical companies urging them to stockpile medicine for next year.

The health department advised firms to stockpile six weeks’ worth of supplies for the end of the Brexit transition period. However, the pharmaceutical industry has already warned earlier this year that COVID-19 had used up entirely some supplies.

Besides, the Boris Johnson’s government was resurrecting a plan to turn a 15 mile stretch of motorway into a contraflow system to be prepared for delays at Britain’s border with the European Union in early next year.

Moreover, China’s ambassador to the United Kingdom said that China wanted the UK to be a friend, but if the U.K. wants to make China a hostile country, then it will have to bear the consequences. This statement was followed by the move from PM Boris Johnson in which he announced plans to ban equipment purchases from the Chinese telecommunication group Huawei on espionage concerns. There was no reason for a directional move in the GBP/USD pair, and that is why the currency pair remained flat throughout the day on Tuesday.

Daily Technical Levels

Support Pivot Resistance
1.2863 1.2908 1.2978
1.2792 1.3024
1.2747 1.3094

GBP/USD– Trading Tip

The GBP/USD is trading at 1.3085 level, holding right below the triple top resistance area of 1.3101 level while the bullish breakout of 1.3105 can drive more buying in the GBP/USD pair. On the higher side, the GBP/USD may find resistance at 1.3175, while support can be found around 1.3056 and 1.3022 level. Let’s keep an eye on 1.3125 to extract a bearish bias in the GBP/USD pair today. A bearish breakout of 1.3050 can drive more selling until 1.3005.


USD/JPY – Daily Analysis

The USD/JPY pair was closed at 105.716 after placing a high of 106.193 and a low of 105.635. Overall the movement of the USD/JPY pair remained bearish throughout the day. 

The pair USD/JPY dropped on Tuesday amid the progress in a new stimulus package from the U.S. Congress. The U.S. Dollar Index was down by 0.20% on Tuesday at 93.4 level, and the U.S. treasury yield was also down to its multi-month low of 0.51%.

The U.S. Senate Democratic leader Chuck Schumer said that negotiations with the White House were finally moving in the right direction, but they still were far apart on some issues. He said that the difference between the two parties on the U.S. Stimulus package was about priorities and scale.

Investors ignored the differences part of the statement and focused more on the progress in talks part, and hence, the U.S. dollar suffered. The USD/JPY dropped below 106 level as the cost of supporting the U.S. economy through its struggles to contain the pandemic was under discussion.

At the beginning of the day, Japan published Tokyo Inflation data for July, which rose to 0.4% from the estimated 0.2% and supported the Japanese Yen. The Monetary Base from japan also rose to 9.8% from the forecasted 7.1% and supported the Japanese Yen. Japan’s stronger than expected data weighed on the USD/JPY pair and dragged it below 106 level on Tuesday.

On the US-China front, to assess China’s efforts to fulfill the promises made in the bilateral trade agreement signed in January, the U.S. & China have agreed to conduct high-level talks on August 15. The relations between the U.S. 7 China have been deteriorated because of many issues, including the coronavirus outbreak, Hong Kong, and human rights abuses in western China. The only matter for mutual concern between both countries seems to be like the trade deal and assessed in mid-August.

Moreover, Satya Nadella, the Chief Executive of Microsoft Corp., has signed an agreement to take over the U.S. operations of the TikTok app. The Microsoft Corp. and the Chinese parent company of TikTok, named ByteDance Ltd., had a deal on Tuesday that would allow Microsoft to run TikTok operations in Canada, US, Australia, and New Zealand. This agreement satisfied both companies & their shareholders and the two governments that are under bitter competition for technological clout.

On the other hand, this Wednesday, Japan will release the final July Bank Services PMI, and the Bank of Japan’s Governor Kuroda will give a speech about central banking in the coronavirus era. From the U.S., the ADP Non-Farm Employment Change and ISM Non-Manufacturing PMI will be key to watch.

Daily Technical Levels

Support Pivot Resistance
104.80 105.25 105.55
104.50 106.00
104.05 106.30

USD/JPY – Trading Tips

The USD/JPY trades with a bullish sentiment around 105.950 level, having completed 61.8% Fibonacci retracement at 106.063. The pair is forming a bearish engulfing candle below 106.406 level, the level that worked as a support for USD/JPY in now it’s working as a resistance. On the higher side, next USD/JPY may find resistance at 106.650, while support stays at 105.250. The MACD and RSI both are suggesting bullish bias in USD/JPY pair today. Let’s consider staying bullish over 105.550 level today. Good luck! 

Categories
Crypto Market Analysis

Daily Crypto Review, August 5 – XRP Drops by 6% Despite Fundamentals Booming

The cryptocurrency market had a day without much movement. Bitcoin is currently trading for $11,166, which represents a decrease of 1.52% on the day. Meanwhile, Ethereum lost 2.66% on the day, while XRP lost 6%.

 Daily Crypto Sector Heat Map

When talking about top100 cryptocurrencies, Band Protocol gained 15.33% on the day, making it the most prominent daily gainer. The Midas Touch (13.97%) and Kava.io (12.79%) also did great. On the other hand, Quant has lost 15.75%, making it the most prominent daily loser. It is followed by Ampleforth’s loss of 14.84% and MCO’s loss of 11.32%.

Top 10 24-hour Performers (Click to enlarge)

Bottom 10 24-hour Performers (Click to enlarge)

Bitcoin’s dominance level has increased since we last reported, with its value currently at 61.17%. This value represents a 0.37% difference to the upside when compared to yesterday’s value.

Daily Crypto Market Cap Chart

The cryptocurrency market capitalization has decreased slightly since we last reported. Its current value is $341.39 billion, which represents a decrease of $6.78 billion when compared to the value it had yesterday.

_______________________________________________________________________

What happened in the past 24 hours?

_______________________________________________________________________

_______________________________________________________________________

Technical analysis

_______________________________________________________________________

Bitcoin

The largest cryptocurrency by market cap had a slow day, with its price being locked in a range bound by The $11,460 resistance and $11,090 support. Bitcoin continuously retested its immediate support, but the lack of volume and pressure towards the downside brought nothing to the BTC bears. Bitcoin’s downside is also guarded by the 50-period moving average, which is sitting right under $11,090.

BTC traders should look for an opportunity to make a trade when BTC breaks $11,460 or falls below $11,090.

BTC/USD 4-hour Chart

Technical factors:
  • Price is currently above its 50-period EMA, but below its 21-period EMA
  • Price is near its middle B.B (20-period SMA)
  • RSI is neutral (47.67)
  • Volume decreasing
Key levels to the upside          Key levels to the downside

1: $11,460                                 1: $11,090

2: $11,630                                 2: $10,855

 3: $12,000                                 3: $10,505

Ethereum

Ethereum has a slow day as well, with its volume normalizing and volatility fading. The second-largest cryptocurrency by market capitalization oscillated between $401 and $380 over the course of the day. The cryptocurrency seems like it will be trading within the range bound by $415 and $362 for some time now.

Traders should look for a trade opportunity within the range ETH is currently in.

ETH/USD 4-hour Chart

Technical Factors:
  • Price is above its 21-period EMA and its 50-period EMA
  • Price is currently at its middle B.B. (20-period SMA)
  • RSI is elevated (57.69)
  • Descending volume
Key levels to the upside          Key levels to the downside

1: $415                                     1: $362

2: $496                                     2: $340

                                                  3: $302

Ripple

XRP experience a day with a bit more volatility than Bitcoin and Ethereum, with its price dropping down to below $0.3 levels. While the move to the downside seems to be stopped by the 21-period moving average for now, XRP will certainly move somewhere (more likely to the downside. On top of that, XRP has formed a triangle formation, which gives us a possible time estimate of its next move.

Traders can look for an opportunity to trade when XRP breaks the triangle formation.

XRP/USD 4-hour Chart

Technical factors:
  • Price above 21-period and the 50-period EMA
  • Price is below the middle B.B. (20-period SMA)
  • RSI is neutral (54.18)
  • Average volume
Key levels to the upside          Key levels to the downside

1: $0.32                                    1: $0.285  

2: $0.3328                                2: $0.266

                                               3: $0.245


Categories
Forex Market Analysis

Daily F.X. Analysis, August 04 – Top Trade Setups In Forex – Profit Taking In USD Continues! 

The fundamental side of the market continues to be muted due to a lack of economic events. Therefore, we still need to keep an eye on COVID19 updates, U.S. China trade war issues, and today’s technical levels.

Economic Events to Watch Today  


EUR/USD – Daily Analysis

The EUR/USD pair was closed at 1.17626 after placing a high of 1.17966 and a low of 1.16956. Overall the movement of the EUR/USD pair remained flat yet bearish throughout the day. The EUR/USD exchange rate fell by -0.2% on Monday as Euro failed to gain against the U.S. dollar despite stronger than expected Eurozone Manufacturing PMI for July but did not remain there and reverted to the same level it started its day with. Investors have become more hopeful that the Eurozone’s economy could be on the road to recovery as Manufacturing PMI showed an expansion in the industry throughout Europe.

The Eurozone economy showed a positive start to the third quarter, with production growing at the fastest rate for over two years fueled by an encouraging surge in demand. The growth of new orders outperformed the production and hinted that August would see further output gains. The business confidence has also been restored due to the improvement in the order book. However, Euro traders were cautious on Monday as the number of coronavirus cases continues to grow throughout Europe. Consequently, markets became cautious that the second wave of the virus could severely compromise the bloc’s economy.

On the data front, at 12:15 GMT, the Spanish Manufacturing PMI for July exceeded the expectations of 52.6 and came in as 53.5 to support single currency Euro. At 12:45 GMT, the Italian Manufacturing PMI for July rose to 51.9 from the expected 51.3 and supported Euro. At 12:55 GMT, The French Final Manufacturing PMI also exceeded the expectations of 52.0 and rose to 52.4 and supported Euro. At 12:55 GMT, the German Final Manufacturing PMI for July was expected to release as 50.0 but came in as 51.0 and supported Euro. At 13:00 GMT, the Final Manufacturing PMI from the whole bloc also rose to 51.8 points against the forecasted 51.1 and supported single currency Euro.

All data related to PMI from main European countries came in favor of EUR/USD and pushed it to the high near 1.1770 but failed to reverse the pair’s direction as the market sentiment was against EUR/USD pair.

On the other hand, from the U.S. side, the final Manufacturing PMI came in short of expectations of 51.3 as 50.9 and weighed on the U.S. dollar. It indicated that manufacturing activity in the U.S. in July was not very impressive as it was expected.

However, at 19:00 GMT, the ISM Manufacturing PMI came in favor of the U.S. dollar when it exceeded the expectations of 53.6 and came in as 54.2. It showed that manufacturing activity in the U.S. was expanded in July. As the ISM Manufacturing PMI was the highlighted data of the day, and as it came in favor of the U.S. dollar, the U.S. dollar gained traction and caused a decline in the prices of EUR/USD pair. 

Daily Technical Levels

Support Pivot Resistance
1.1686 1.1730 1.1762
1.1654 1.1806
1.1610 1.1837

EUR/USD– Trading Tip

The EUR/USD has bounced off the previously suggested support level of 1.1708 level, and now it’s trading at 1.1765 area. On the hourly timeframe, the EUR/USD continues to form bullish candles, which suggest a slight bullish bias among investors despite profit-taking in the U.S. dollar. Now strong support stays at 1.1705. On the higher side, the EUR/USD may find support at 1.1796 level.


GBP/USD – Daily Analysis

The GBP/USD pair was closed at 1.30756 after placing a high of 1.31125 and a low of 1.30044. Overall the movement of GBP/USD pair remained flat yet slightly bearish throughout the day. The pair GBP/USD pair was dropped in the earlier session on Monday on the back of profit-taking in the U.S. dollar, but the pair reverted back to its same level in the late closing session.

On Monday, the European Union showed a willingness to compromise to rescue troubled Brexit talks by softening its demand that Britain heeds E.U. rules on state aid. Brussels said that it could go for a compromise entailing a dispute-settling mechanism on any state aid granted by the U.K. to its companies. It means Brussels will no longer oblige London to follow bloc’s own rules from the outset.

The E.U. countries have long demanded so-called “Level Playing Field” guarantees from the U.K. if it requires the free selling of goods in the bloc’s lucrative single market of 450 million people after Brexit’s transition period ends. However, PM Boris Johnson and his government have refused to be bound by E.U. state aid rules, labor laws, or environmental standards as Brexit’s essence was to let Britain decide alone on its regulations.

The other significant sticking point of the negotiations was fishing rights in sea channels between the E.U. and Britain. The bloc has previously signaled that it was willing to compromise in that field if London shifted as well from its demands. Though the negotiations have not proven fruitful yet they have brought the sides closer in some other aspects and have made the E.U. cautiously optimistic about chances for an overall deal.

Meanwhile, the U.K. Prime Minister Boris Johnson said that the trade negotiations were in good progress with Japan. However, tensions with the bloc remain the same. The fishing industry urged the government to guide as the Brexit transition period was near to end without the sector’s definitions.

On the data front, at 13:30 GMT, the Final Manufacturing PMI for July came in line with the expectations of 53.3 and showed an expansion in the manufacturing sector of the U.K. At 18: 45 GMT, the Final Manufacturing PMI for July dropped to 50.9 points from the forecasted 51.3 and weighed on the U.S. dollar. At 19:00 GMT, the ISM Manufacturing PMI in July advanced to 54.2 from the forecasted 53.6 and supported the U.S. dollar. In June, the Construction Spending also dropped by -0.7% from the projected 1.0% and weighed on the U.S. dollar. The ISM Manufacturing Prices in July rose to 53.2 against the anticipated 52.2 and supported the U.S. dollar.

The primary highlighted data ISM Manufacturing PMI came in favor of the U.S. dollar and weighed heavily on the GBP/USD pair that it started posting losses. The Pound traders will look forward to releasing the monetary policy decision by the Bank of England this week on Thursday. The bank’s statement about the negative interest rate decision and plans to help the economy through the pandemic will be observed to find fresh clues of the GBP/USD pair’s movement.

Meanwhile, the pair will follow the U.S. dollar and related events, including the ISM Non-Manufacturing PMI, that is scheduled to release on Wednesday. Apart from that, any progress in Brexit trade deal talks would also benefit/weigh the GBP/USD pair this week.

Daily Technical Levels

Support Pivot Resistance
1.2863 1.2908 1.2978
1.2792 1.3024
1.2747 1.3094

GBP/USD– Trading Tip

The GBP/USD is trading at 1.3065 level, having completed the 50% Fibonacci retracement at 1.3060 level. On the higher side, the Sterling can find resistance at 1.3105. In the daily timeframe, the Cable has formed a Doji pattern, which is followed by a solid bullish trend at 1.3100 level, and it has the potential to drive bearish bias in the pair. Let’s keep an eye on 1.3125 to extract a bearish bias in the GBP/USD pair today. A bearish breakout of 1.3050 can drive more selling until 1.3005.

USD/JPY – Daily Analysis

The USD/JPY pair was closed at 105.947 after placing a high of 106.470 and a low of 105.578. Overall the movement of the USD/JPY pair remained bullish throughout the day. The USD/JPY pair rose to its highest level since July 24 at 106.47 Monday, but it started to decline afterward and presented a hammer-like candle.

The broad-based U.S. dollar strength at the starting day of the week provided a boost to USD/JPY pair. The rising U.S. Treasury bond yields helped the greenback continue to outperform its rivals, and the U.S. Dollar Index advanced to 94.00. The U.S. Treasury bond yield gained almost 5% on the day.

On the data front, at 4:50 GMT, the Prelim GDP for the second quarter from Japan came in as -0.6% against the expected -0.7% and supported Japanese Yen. At 4:55 GMT, the Prelim GDP Price Index for the year remained flat with the expectations of 0.9%. At 5:30 GMT, the Final Manufacturing PMI from Japan rose to 45.2 points against the forecasted 42.6. Better than expected macroeconomic data from Japan gave strength to the Japanese Yen that ultimately weighed on the USD/JPY pair in the earlier session.

From the U.S. side, the ISM data at 19:00 GMT showed that the economic activity in the U.S. manufacturing sector expanded at a stronger pace than expected in July. The ISM Manufacturing PMI rose from 52.6 to 54.2 and surpassed the forecast of 53.6.

The ISM Manufacturing Prices for July also increased to 53.2 against the forecasted 52.2 and the previous 51.3 and supported the U.S. dollar. The Wards Total Vehicle Sales from the U.S. surged to 14.5M in July from the previous 13.1M and the expected 14.0M. It also supported the U.S. dollar that ultimately pushed the USD/JPY pair on the upside.

On the other hand, the U.S. lawmakers are finding it difficult to reach a consensus for the U.S. coronavirus aid package. The Republicans are in favor of $ 1 trillion, while Democrats want to offer a package worth $3 trillion. This difference of opinion has caused a delay in the announcement of the U.S. recovery package. The delayed package announcement has made investors cautious, and they are keenly waiting for it to place bets on it.

However, on coronavirus front, the worldwide cases reached 18 million so far with major cities on renewed lockdown restrictions to control the spread. It raised the safe-haven appeal that pushed the Japanese Yen and kept checking on additional gains of the pair USD/JPY.

The coronavirus expert in White House said that the U.S. was in a new phase of the outbreak with infections extraordinarily widespread in both rural & urban areas. On the vaccine front, a mass vaccination campaign from the Russian health authorities was under preparation stage against the virus, and it will start in October. The media of Russia has quoted that doctors and teachers will be the first to receive the vaccine.

In response to this, the U.S. Dr. Anthony Fauci gave critic comments and said that he hoped that Russia and China were testing the vaccine before directing them to anyone. He said that the U.S. should have a safe and effective vaccine by the end of the year. He added that there would be no vaccine so far ahead of the U.S. that the U.S. will have to depend on other countries to get the vaccine. On the US-China front, President Trump threatened to ban the TikTok app in the United States that raised the fears for a halt of a phase-one trade deal and kept the market sentiment soar.

Daily Technical Levels

Support Pivot Resistance
104.80 105.25 105.55
104.50 106.00
104.05 106.30

USD/JPY – Trading Tips

The USD/JPY trades with a bullish sentiment around 105.950 level, having completed 61.8% Fibonacci retracement at 106.063. The pair is forming a bearish engulfing candle below 106.406 level, the level that worked as a support for USD/JPY in now it’s working as a resistance. On the higher side, next USD/JPY may find resistance at 106.650, while support stays at 105.250. The MACD and RSI both are suggesting bullish bias in USD/JPY pair today. Let’s consider staying bullish over 105.550 level today. Good luck! 

Categories
Forex Fundamental Analysis

What Does ‘Exports by Category’ Data Indicate About A Nation’s Economy?

Introduction

Export is an essential component of a country’s balance of trade. International trade is the heart of the FOREX market that constitutes the fundamental moves in currency pairs. The imbalance in various country’s balance of trade is offset by equal and opposite volatility in currencies. Hence, understanding the macroeconomic dynamics of trade relations, compositions, and how they are tied to currency values can deepen our fundamental analysis.

What are Exports by Category?

Export: It is the sale of domestically produced goods or services to the foreign market. If goods manufactured within the nation are sold to customers outside the country’s borders, it is referred to as an export. On the other hand, imports are the purchase of foreign goods or services by a country. Generally, a country exports a particular commodity because it either efficiently manufactures or is more capable than the importing country.

A country like Canada, which has abundant oil reserves, can export to countries like China, which has a massive demand for its industrial economy. Similarly, China may export electronics to other countries like the United States, as they have a competitive edge in that domain. Exports bring domestic currency into the country in exchange for produced goods and services. Imports bring in goods and services into the country and send out the domestic currency. Hence, countries must maintain a “balance” in its international trade to keep currencies in an equilibrium.

How can the Exports by Category numbers be used for analysis?

If a country’s exports exceed its imports, it is said to have a trade surplus or a positive balance of trade. On the contrary, if a country’s imports exceed its exports, it is said to have a trade deficit or negative balance of trade. Imports signify consumption, and exports signify production. In a perfect world, the trade balance would be zero, meaning a country would produce equal to what it consumes. In reality, the balances are skewed and change from time to time.

When a country exports, it accumulates wealth. Many developing economies like China have increasingly depended on exports for their economic growth. By investing heavily in optimizing its industries and resources, many developing economies could export goods at a lower price to developed economies. A trade surplus (exports exceeding imports) is generally seen as beneficial to the economy. Prolonged periods of trade surplus, drains the international market of that country’s currency, thereby increasing its valuation against other currencies.

When a currency valuation appreciates imports become cheaper as more goods can be procured per unit of currency. In general, a trade surplus is seen as beneficial, but it may not always be the case. For instance, a country might increase its imports of construction materials to develop its cities and state infrastructure. During this time, it may have a trade deficit, but later once the work is done, its exports may improve beyond its previous highs and pay off for the years it maintained a deficit.

Countries export and import in millions and billions of dollars. When a country exports goods, it does so in large quantities, and the corresponding transaction would also be significant. Such transactions amongst countries with different currencies need to be exchanged. Such exchanges in the international FOREX market occurring for fundamental reasons sets off the equilibrium.

By the natural market forces through demand and supply, currencies will come to a new equilibrium. The movement in currency values through such fundamental moves is accompanied by speculative transactions from investors and traders worldwide. Approximately 20% of all FOREX transactions occur for pure fundamental reasons while remaining occurs for speculative purposes.

Understanding the portfolio of exports a country has can help us get a fundamental idea about the underlying goods and service exports that influence currency moves. For instance, Australia depends heavily on Iron Ore exports (approximately 20%). The Iron exported is sold mainly to China and Japan. If business activity in China reduced because of some reason, a decrease in demand would reduce exports for Australia, followed by a corresponding drop in AUD currency value.

The below image depicts how AUD value against USD follows Iron Ore prices. Hence, countries that depend on fewer exports experience higher volatility than countries with a more diverse portfolio of export and imports.

Impact on Currency

The ‘Exports by Category’ is not an economic indicator but is an essential statistic to understand the country’s trade relations. The composition of exports of a country does not vary significantly every month as exports and imports are based on trade agreements and business contracts that generally last years at a stretch. Exports by Category can be used to identify which goods and services are potential influencers for currency volatility. Hence, overall it is an essential requisite for fundamental analysis but not an economic indicator.

Economic Reports

For the United States, the Census Bureau tracks all the import and export statistics on its official website. The international trades categorized based on trade partners and Categories of goods and services are also available.

Sources of Exports by Category

The Census Bureau’s International Trade Data, the Export & Import by Trade Partner, Foreign Trade has all the necessary details. Consolidated reports of Exports by Category for most countries is available on Trading Economics.

Exports by Category News Release – Impact on the Currency Market

We know that Exports is an important fundamental driver of an economy, that can significantly impact a nation’s currency. Digging deep into Exports, we can widen the heading into Exports by Category and Exports by country. In other words, the result of the two is reflected in the Exports data.

Exports by Category, not being an economic indicator, barely has any impact on the currency of an economy. Moreover, the data is based on trade contracts, due to which the numbers do not change often. Nonetheless, let us combine the Export by Category and Exports data to study the volatility change in the currency market.

Exports Report – USD

Exports by Category – United States

According to the reports, the US’s exports dropped by USD 6.6 billion from the previous month, reading USD 144.5 billion in May 2020. Looking at the Exports by Category data, all the top five categories saw a decline in Exports.

EURUSD – Before the Announcement

Below is the price chart of EURUSD on the 4H timeframe. Before the release of the Exports by Category (Exports), we see that the market is consolidating, and there is no clear trend as such. However, the market is slightly leaving lower highs and lower lows, indicating EUR weakness and USD strength.

EURUSD – After the Announcement

On the day of the news release, it is seen that the price showed bullishness in the beginning. However, it got rejected by the sellers by the end of the day.

In the following days, we can see that the market broke out from the consolidation and began to trend north, implying USD weakness and EUR strength. There certainly would be several factors to it, but one of the accountable factors can be the disappointing numbers projected by the Exports.

USDJPY – Before the Announcement

Prior to the release, we can see clearly that the USDJPY market was crashing down. However, it saw bullishness in the last week of June.

USDJPY – After the Announcement

The USDJPY price saw feeble volatility on the day the news was released. In hindsight, the market dropped and continued the predominant downtrend. This indicates that the USDJPY has negatively affected post the Exports by Category numbers.

GBPUSD – Before the Announcement

Before the report on Exports by Category, the GBPUSD market was in an evident downtrend, as represented by the trendline.

GBPUSD – After the Announcement

A day before the numbers were reported, the price aggressively broke above the trendline, indicating a reversal.

When the news released, the price tried going higher but was pushed right back down by the sellers. However, subsequently, the market did change direction and began to trend north.

Thus, it can be concluded that the market did not have an immediate effect on the prices but did have an expected outcome in the short-term. Cheers!

Categories
Crypto Market Analysis

Daily Crypto Review, August 4 – BTC Establishes Itself Above $11,000; Altcoins Taking Over The Market

The cryptocurrency market ended up in the green today, with Bitcoin establishing its place above $11,000 and most altcoins gaining substantial value. Bitcoin is currently trading for $11,350, which represents an increase of 1.86% on the day. Meanwhile, Ethereum gained 4.8% on the day, while XRP gained 6.87%.

 Daily Crypto Sector Heat Map

When talking about top100 cryptocurrencies, MCO gained 41.91% on the day, making it the most prominent daily gainer. Ocean Protocol (28.92%) and Energy Web Token (22.88%) also did great. On the other hand, Ampleforth has lost 12.73%, making it the most prominent daily loser. It is followed by Aave’s loss of 6.32% and Celsius’ loss of 3.80%.

Top 10 24-hour Performers (Click to enlarge)

Bottom 10 24-hour Performers (Click to enlarge)

Bitcoin’s dominance level has decreased since we last reported, with its value currently at 60.80%. This value represents a 0.82% difference to the downside when compared to Friday’s value.

Daily Crypto Market Cap Chart

The cryptocurrency market capitalization has increased since we last reported. Its current value is $347.17 billion, which represents an increase of $9.74 billion when compared to the value it had yesterday.

_______________________________________________________________________

What happened in the past 24 hours?

_______________________________________________________________________

_______________________________________________________________________

Technical analysis

_______________________________________________________________________

Bitcoin

The largest cryptocurrency by market capitalization confirmed its position above $11,000 in the past 24 hours (at least in the short term) Its price kept slowly going up until it hit a (possibly) new resistance level of $11,460. The price then took a small dive but returned to sideways movements. Bitcoin is in a good spot to create a move that will lead it towards (or above) $12,000 in the near future.

BTC traders should look for an opportunity to make a trade when BTC breaks $11,460 or falls below $11,090.

BTC/USD 4-hour Chart

Technical factors:
  • Price is currently above its 50-period EMA, but below its 21-period EMA
  • Price is between its bottom B.B. and its middle B.B (20-period SMA)
  • RSI is neutral (51.35)
  • Volume increased
Key levels to the upside          Key levels to the downside

1: $11,630                                1: $11,090

2: $12,000                                2: $10,855

                                                 3: $10,505

Ethereum

Ethereum continued pushing towards the upside, pretty much unaffected by the “flash crash” that brought its price down from $415 to $320. The second-largest cryptocurrency by market capitalization is moving upwards and having the 21-period and 50-period moving averages as support. The price is currently just below $400.

Ethereum traders should look for an opportunity in a pullback, which will most likely happen after the current move towards the upside.

ETH/USD 4-hour Chart

Technical Factors:
  • Price is above its 21-period EMA and its 50-period EMA
  • Price is currently between its top B.B. and its middle B.B. (20-period SMA)
  • RSI is elevated (63.95)
  • Above-average volume
Key levels to the upside          Key levels to the downside

1: $340                                    1: $302

2: $362                                    2: $289

                                                 3: $278

Ripple

XRP was also one of the altcoins that made significant progress towards the upside in the past 24 hours. The third-largest cryptocurrency by market cap recovered from the “flash crash” quickly and hurled upwards, reaching past the $0.31 resistance level (now support) once again.

XRP traders can look for an opportunity in the range between $0.31 and $0.32.

XRP/USD 4-hour Chart

Technical factors:
  • Price above 21-period and the 50-period EMA
  • Price is between the top B.B. and the middle B.B. (20-period SMA)
  • RSI is elevated (66.85)
  • Elevated volume
Key levels to the upside          Key levels to the downside

1: $0.32                                    1: $0.285  

2: $0.3328                                2: $0.266

                                               3: $0.245


Categories
Forex Fundamental Analysis

‘Imports by Country’ – How Crucial Is It To Know About This Fundamental Forex Driver?

Introduction

Currency values are critical for international trade and vice-versa. The exchange rates are directly influenced by changes in import and export composition, quantity, and prices. The volatility of a currency is directly associated with the country’s import and export relations with other countries. Understanding how international trade affects currencies in the forex market is paramount for fundamental analysis.

What are Imports by Country?

A country’s trade balance (net exports and imports) is critical for currency valuation. The Balance of Trade refers to the required balance to exist between the total monetary value of a nation’s exports and imports. It is key to currency valuation. When a country exports, domestic currency comes into the country in exchange for the sale of products. When a country imports, the currency goes out in exchange for purchasing goods outside the country. Hence, a balance of exports and imports to maintain a healthy economy.

It is often necessary to understand a nation’s export and import composition to grasp its ties with other countries. Countries’ dependency on goods and services from other nations induces leverage and power for the exporting countries. For example, the United States imports 20% of all its goods from China. If China were to cut-off all its exports to the United States, that would dramatically impact the United States economy and its currency. Hence, the categorization of imports based on country and goods gives us an idea of the underlying relationships between currencies.

United States Imports by Country 

Source: Trading Economics
How can the Imports by Country numbers be used for analysis?

Today’s global world is one that is tightly interconnected and has complex links amongst countries. Understanding trade composition helps us in identifying where to look for volatility. For instance, the United States only imports about 2% of its products from India. If, for some reason, the import prices changed from India in either direction or completely stopped, it would not impact the trade balance significantly.

Hence, categorization based on countries helps us understand the dependencies a particular country has. Heavy dependence on a limited set of countries, especially for primary resources like energy and food, is not suitable for the economy. During times of a natural disaster in the exporting country will affect the dependent countries also.

A country that solely depends on its trade relations with fewer countries is likely to see more volatility in currency valuation. The more diverse the portfolio of a country in terms of its international trade partners, the more robust the currency is. Hence, currencies like the AUD, CAD are more volatile currencies because their exports are heavily dependent on fewer markets, unlike the EUR and USD.

Imports and Exports by country and category of products are equally essential to understand a nation’s currency volatility. For instance, Australia’s heavy dependency on coal and iron ore exports to china and japan induces volatility in AUD currency in correlation with coal and iron ore prices.

The Imports by country is not an economic indicator but is a prerequisite for understanding macroeconomic analysis of currency pairs. Currency valuations are primarily affected by trade relations a country has. It is not frequent for a country to change its import composition by country often, but it has a significant impact on the currency when it does.

Imports form only one half of the equation. Overall to understand the macroeconomic dynamics, both exports and imports have to be taken into account. Also, currency value change has a direct effect on imports and exports. When the Domestic currency appreciates imports are cheaper and profit margin increases for importing companies but hurts exporters as they receive fewer dollars than before. When the domestic currency depreciates, imports get hurt while exporters benefit. Some countries competitively peg their currency lower during export and higher during import. This phenomenon is sometimes referred to as “currency wars.”

Changes in import and export composition as a result of trade agreements or tariffs imposed has a more direct impact on companies that constitute the import and export goods and services. Hence, stock prices of companies are more sensitive to import and export data.

Impact on Currency

Imports categorized based on countries is for segregation and analysis purposes only. It is not an economic indicator in itself. Still, it is essential to understand the existing trade partners of a country to know which currencies are being exchanged for what goods. Imports and Exports both make up the balance of trade, which helps to analyze currency valuation.

Hence, Imports categorized by country are although useful, changes in the composition are necessary for a macroeconomic picture but does not induce volatility in itself. Any change in composition would have already been announced in news reports that would be priced into the market. It is useful at the starting point for establishing currency analysis, but it is neither an economic indicator nor induces any volatility in currencies.

Economic Reports

For the United States, The Census Bureau tracks and consolidates import and export composition on its official website. It releases monthly data ranking countries with which it had exports and imports. It details all the goods and services that are exported or imported from the partner countries.

Sources of Imports by Country

Census Bureau’s Trade highlights reports are available here. We can find a consolidated listing of “Imports by country” of most countries on Trading Economics.

Imports by Country News Release – Impact on Price Charts

Imports by Country is an important piece in analyzing the “Trade” and “Imports” fundamental indicators. It alone is not an economic indicator but is one of the components that make up a fundamental indicator. Precisely, the balance of trade is the economic driver that references the data obtained from Imports and Exports. Extending further, the data from Imports is acquired from factors like Imports by Country and Imports by Category.

Imports by Country alone does not pump up the volatility of the market. Also, the report is released during the release of the Imports data.

Imports Report – Untied States

United States Imports by Country

The USA is the second-largest importer in the world. The imports of the USA are China, the European Union, Euro Area, Canada, Mexico. For the May data, the overall imports dropped from $200.9 billion to $199.1 billion. Imports from China and Canada increased the previous month, but the rest saw a slight decline.

NZDUSD – Before the Announcement

In the below chart of NZDUSD, on the 4H time frame, we can see that the market is in an uptrend. It made a high to 0.65815. Since then, the price has been retracing.

NZDUSD – After the Announcement

On the day of the report announcement, the NZD showed strength, while USD showed weakness. However, the volatility and volume remained average. In the following days, the bullishness remained intact. In fact, after consolidating for a while at the resistance, the price made a new high. Thus, we can conclude that the Imports by Country indirectly did affect the USD price.

AUDUSD – Before the Announcement

From the price chart of AUDUSD, we can see that the price action is similar to that of NZDUSD. Before the announcement of the news, the market was in a strong uptrend.  After making a high to 0.69845, the prices have been pulling back down.

AUDUSD – After the Announcement

During the announcement of the news, the market volatility was unchanged. However, in the subsequent sessions, the market reacted negatively on USD, and the price touched the recent high and even made a higher high. The market perhaps did react as expected to the new, but in the later weeks.

USDCHF – Before the Announcement

Before the announcement of the news, the market was in a pullback phase of a downtrend.

USDCHF – After the Announcement

On the announcement day, the volatility of the market was feeble. The price pushed to the downside but with low volume that is typically seen during the announcement of major news events.

In the following trading days, the predominant downtrend continued where the price made a new low from 0.93828. This down move could be due to several factors; however, there could be a slight effect on the Imports by Country report. Cheers!

Categories
Forex Market Analysis

Daily F.X. Analysis, August 03 – Top Trade Setups In Forex – Manufacturing PMI In Highlights

On the news front, the eyes will be on the series of low impact economic events from Europe and the U.S., but they are hardly likely to drive any major price action today. We should be focusing on the technical side of the market.

Economic Events to Watch Today  


EUR/USD – Daily Analysis

The EUR/USD pair closed at 1.17756 after placing a high of 1.19085 and a low of 1.17613. Overall the movement of the EUR/USD pair remained bearish throughout the day. The EUR/USD pair rose above 1.1900 level on Friday, highest since September 2018, after progress in a new European stimulus package. However, the upward rally was reversed after the oversold condition, and profit-taking helped the U.S. dollar recover some ground.

The Euro has enjoyed 11% jump against the U.S. dollar since ay benefiting from the U.S. currency’s weakness and Europe’s decisive joint stimulus package to combat the coronavirus. EUR/USD pair ended July with its best monthly performance in a decade.

Euro hit 1.1900 level on Friday, and on May 18, the day just before the game-changing E.U. Stimulus plan was proposed, it was traded at 1.0800 level. The gains were also because of the more successful pandemic response by the European Union than the United States.

However, on Friday’s data front, the French Consumer Spending for June increased to 9.0% from the expected 6.9% and supported the Euro. At 11:45 GMT, the French Prelim CPI for July raised to 0.4% from the projected -0.1% and supported Euro. At 12:00 GMT, the Spanish Flash GDP for the quarter came in as -18.5% against the expected -16.0%. At 13:00 GMT, The Italian Prelim GDP for the quarter came in as -12.4% against the expected -15.0%.

The CPI Flash Estimate for the year was raised to 0.4% from the expected 0.3% and supported Euro. For July, the Italian Prelim CPI dropped to -0.1% from the expected 0.1% and weighed on Euro. The Prelim Flash GDP for the whole bloc in the second quarter was dropped to -12.1%from the expected -12.0%. The Italian Retail Sales for the whole bloc rose to 12.1% against the expected 0.8% in June. Most data from the European side favored local currency, which is why the EUR/USD pair crossed the 1.1900 level. However, the pair could not remain there for long as investors started to take profits off their positions, and the pair began to decline.

On the other hand, the U.S. dollar was a little strong because its oversold condition was priced at the month-end, and traders took profits out of it. On the data front, the U.S.’s economic docket remained depressive and mixed that made traders confused.

The Personal Spending for June raised to 5.6% from the expected 5.3%, and the Chicago PMI in July also raised to 51.9 from the expected 44.0 and gave a boost to the U.S. dollar. However, the Personal Income in July dropped to -1.1% against the expected -0.8%and weighed on the U.S. dollar.

The improved confidence in the bloc’s prospects due to its handling of pandemic and issuance of the massive E.U. stimulus package has limited the negative effects of euro strength. Some analysts believe that the Euro will attract “significant” safe-haven flows in the coming months. The Euro has become a stronger currency recently due to fundamental improvement in the structure of Europe. Politically and financially. However, the fall in EUR/USD pair on Friday was all because of profit-taking and correction.

Daily Technical Levels

Support Pivot Resistance
1.1768 1.1782 1.1795
1.1755 1.1809
1.1740 1.1822

EUR/USD– Trading Tip

The EUR/USD fell sharply from 1.1908 level to test the double bottom support level of 1.1745 level. On the hourly timeframe, the EUR/USD extends to form neutral candles, which suggests indecision among investors despite a strong support level of 1.1745. On the higher side, the EUR.USD may find support at 1.1796 level. 


GBP/USD – Daily Analysis

The GBP/USD pair closed at 1.30847 after placing a high of 1.31701 and a low of 1.30702. The movement of the GBP/USD pair remained flat but slightly bearish throughout the day.

After posting gains for ten consecutive days, the GBP/USD pair declined for the first time in 10 days on Friday. The pair rose above 1.31700 level, the highest since March 2020, at the ending day of the month. However, the pair GBP/USD did not stay there for long and dropped to post losses on the day after technical buying in the U.S. dollar started.

The surge in GBP/USD in the earlier session was due to the worries that the ever-increasing number of coronavirus cases could undermine the U.S. economic recovery. The concerns were escalated after the advanced US GDP report on Thursday that showed that the U.S. economy was collapsed by 32.9% during the second quarter.

This made greenback weak, and the more dovish statement further pressurized it on Wednesday from FOMC. Besides, the difference of opinion of Republicans & Democrats to reach a deal ahead of the expiry of some earlier provision on Friday weighed on the U.S. dollar.

In an earlier trading session on Friday, the U.S. dollar’s weakness gave a push to the GBP/USD pair above 1.31700 level; however, the oversold condition of the U.S. dollar and the profit taking by investors in late session dragged down the pair and turned gains into losses.

On the data front, the Nationwide House Price Index from Great Britain for July rose to1.7% from the expected -0.2% and supported the GBP/USD pair. On the U.S. front, the Core PCE Price Index for June came in line with the expectations of 0.2%. Personal Spending in June rose by 5.6% from 5.3% of expectations and supported the U.S. dollar. The Chicago PMI also rose to 51.9 from the expected 44.0 and supported the U.S. dollar. The better than expected PMI and Personal Spending data from the U.S. gave strength to the U.S. dollar that dragged the GBP/USD pair on the lower side.

On coronavirus front, the COVID-19 situation in the U.K. remained under control as the increasing number of cases made the government impose restrictions on around 4.3M people in northern England. On Brexit front, On Friday, Britain and E.U. have planned more trade negotiations until October 02, less than a fortnight before a summit where the E.U. hopes to approve Britain’s agreement.

It’s been more than four years since Britain voted to leave E.U., and after torturous divorce talks, both sides are negotiating all aspects of their future relations, from trade to security to transport from 2021 onwards.

On the Sino-UK front, both countries’ relation has not improved after the U.K. canceled the extradition treaty with Hong Kong.

Next week’s main event will be the Super Thursday as the Bank of England is set to release its monetary policy statement and leave the interest rates on hold at 0.1% and the quantitative easing program at 745 billion pounds. The focus will be on the statement released by the bank and any unexpected announcement that will make it “Super.”

The Governor of Bank of England, Andrew Bailey, will give a press conference speech ad provide details on the current economic situation and growth prospects. Any BOE help to the government in lowering the borrowing cost and support the recovery will be beneficial for GBP/USD pair. Furthermore, the views about the concept of negative interest rates by Bank of England will also hold importance in investors on the coming Thursday.

Daily Technical Levels

Support Pivot Resistance
1.3078 1.3092 1.3114
1.3056 1.3128
1.3042 1.3149

GBP/USD– Trading Tip

The GBP/USD is trading at 1.3088 level, having completed the 50% Fibonacci retracement at 1.3060 level. On the higher side, the Sterling can find resistance at 1.3105. In the daily timeframe, the Cable has formed a Doji pattern, which is followed by a solid bullish trend at 1.3100 level, and it has the potential to drive bearish bias in the pair. Let’s keep an eye on 1.3125 to extract a bearish bias in the GBP/USD pair today. A bearish breakout of 1.3050 can drive more selling until 1.3005.


USD/JPY – Daily Analysis

The USD/JPY pair was closed at 105.876 after placing a high of 106.053 and a low of 104.184. Overall the movement of the USD/JPY pair remained bullish throughout the day. After falling for six consecutive days, the USD/JPY pair dropped on Friday and broke its 6-days bearish streak amid mixed U.S. data.

In an earlier trading session on Friday, the USD/JPY pair dropped to its lowest since March 2020 near 104.00 level amid the better than expected Japanese macroeconomic data.

At 4:30 GMT, the Unemployment Rate from Japan for June dropped to 2.8%from the expected 3.0% and supported the Japanese Yen. At 4:50 GMT, the Prelim Industrial Production for June increased to 2.7% from the anticipated 0.9% and gave strength to Japanese Yen.

At 10:00 GMT, the Consumer Confidence from Japan came in line with the expectations of 29.5 for the month of July. The Housing Starts for the year in June dropped as expected to -12.8%. The strong Japanese Yen weighed on the USD/JPY pair and dragged the pair near the 104.00 level. However, the USD/JPY pair’s losses faded away after the release of U.S. economic data.

The macroeconomic data released by the U.S. on Friday was although mixed, but traders cheered the positive data and gave strength to the U.S. dollar. Another reason behind the U.S. dollar surge was profit-taking and correctness as the U.S. dollar was oversold in the market from the previous ten days.

At 17:30 GMT, the Core PCE Price Index for June from the U.S. came as projected by 0.2%. In June, personal spending exceeded the expectations of 5.3% and came in as 5.6% and supported the U.S. dollar. The Employment Cost Index for the quarter dropped to 0.5% from the forecasted 0.6%. The Personal Income for June also dropped to -1.1% from the forecasted -0.8%.

At 18:45 GMT, the Chicago PMI rose to 51.9from the anticipated 44.0 and gave strength to the U.S. dollar. However, at 19:00 GMT, the Revised UoM Consumer Sentiment remained flat with expectations of 72.5, and the UoM Revised Inflation Expectations dropped in July to 3.0% from May’s 3.1%.

Investors followed the U.S.’s positive data and gave a push to the U.S. dollar on Friday that leads to the upward trend of the USD/JPY pair.

The U.S. Dollar Index stretched higher with the initial reaction to the mixed U.S. data and helped the pair to move further on the upside. The DXY posted small gains near 92.97 levels on Friday. The U.S. Treasury bond yield for ten years was down by 1% on the day.

On the US-China front, the United States strengthened its economic pressure on China’s Xinjiang province on Friday, after imposing sanctions on a powerful Chinese company, and two officials for human rights abuses against Uighurs/ Muslims and other ethnic minorities.

U.S. Secretary of State Mike Pompeo called the said human rights abuses by the Chinese Communist Party in Xinjiang province, China, against Muslim minorities as the stain of the century.

This move came in a week after U.S. President Donald Trump shut the Chinese consulate in Houston on the back of allegations that it was a spy hub. In response, the U.S. consulate in the south-western city of Chengdu in China was also closed in revenge on similar grounds of the fast spread of the virus in the U.S. Early on Thursday, Japan will publish Retail Trade data that is expected to fell by 6.5% compared to the earlier year. The U.S. investors will look forward to GDP data for the second quarter.

Daily Technical Levels

Support Pivot Resistance
104.80 105.85 105.55
104.50 106.00
104.05 106.00

USD/JPY – Trading Tips

The USD/JPY trades with a bullish sentiment around 105.950 level, having completed 61.8% Fibonacci retracement at 106.063. The pair is forming a bearish engulfing candle below 106.406 level, the level that worked as a support for USD/JPY in now it’s working as a resistance. On the higher side, next USD/JPY may find resistance at 106.650, while support stays at 105.250. The MACD and RSI both are suggesting bullish bias in USD/JPY pair today. Let’s consider staying bullish over 105.550 level today. Good luck! 

Categories
Crypto Market Analysis

Daily Crypto Review, August 3 – More than $1 Billion Positions Liquidated; Crypto Market Booming Despite the “Flash-Crash”

The cryptocurrency market had quite a weird weekend in terms of price performance. The market and most of its cryptocurrencies had a “flash crash,” but quickly recovered to a price slightly below the previous highs. Bitcoin is currently trading for $11,160, which represents a decrease of 6.59% on the day. Meanwhile, Ethereum lost 4.04% on the day, while XRP gained 1.03%.

 Daily Crypto Sector Heat Map

When talking about top100 cryptocurrencies, Loopring gained 17.24% on the day, making it the most prominent daily gainer. Terra (14.69%) and Synthetix Network (13.73%) also did great. On the other hand, Ampleforth has lost 20.21%, making it the most prominent daily loser. It is followed by The Midas Touch’s loss of 18.78% and Quant’s loss of 15.89%.

Top 10 24-hour Performers (Click to enlarge)

Bottom 10 24-hour Performers (Click to enlarge)

Bitcoin’s dominance level decreased since we last reported, with its value currently at 61.62%. This value represents a 1.29% difference to the downside when compared to Friday’s value.

Daily Crypto Market Cap Chart

The cryptocurrency market capitalization increased since we last reported. Its current value is $337.43 billion, which represents an increase of $9.65 billion when compared to the value it had on Friday.

_______________________________________________________________________

What happened in the past 24 hours?

_______________________________________________________________________

_______________________________________________________________________

Technical analysis

_______________________________________________________________________

Bitcoin

The largest cryptocurrency by market capitalization spent the weekend crashing down to $10,555 and then recovering from the drop. After the price going up all the way up to $12,000, Bitcoin suddenly dropped to $10,555, which liquidated $1 billion of positions. However, the price quickly recovered and went over $11,000. It is still unsure if the price will end up being above this support level, but it is more likely that BTC will remain above, rather than fall below it.

BTC traders should look for a trade opportunity when BTC bounces from $11,000 or falls below it.

BTC/USD 4-hour Chart

Technical factors:

  • Price is currently below its 50-period EMA and its 21-period EMA
  • Price is between its bottom B.B. and its middle B.B (20-period SMA)
  • RSI is neutral (47.02)
  • Volume increased (descending)

Key levels to the upside          Key levels to the downside

1: $11,630                                1: $11,090

2: $12,000                                2: $10,855

                                                 3: $10,505

Ethereum

Ethereum acted pretty much the same as Bitcoin over the weekend, with its price reaching a major high of $415, and then plummeting down to $320 before recovering to $380 levels. While the current price is considerably lower than the $415 high, but Ethereum made insane gains over the course of the week and month.

Ethereum traders should look for a trade opportunity after the cryptocurrency decides its price direction.

ETH/USD 4-hour Chart

Technical Factors:

  • Price is above the 50-period EMA and the 21-period EMA
  • Price is between its top B.B. and its middle B.B (20-period SMA)
  • RSI is elevated (61.44)
  • Above-average volume (descending)

Key levels to the upside          Key levels to the downside

1: $340                                    1: $302

2: $362                                    2: $289

                                                 3: $278

Ripple

XRP spent the weekend reaching the resistance level of $0.32, which it could not pass over, and then dropping towards the downside. The third-largest cryptocurrency reached a low of $0.241 before bouncing back to above $0.285 level, where it currently is consolidating (and rising slowly).

XRP traders can look for an opportunity in the range between $0.285 and $0.31.

XRP/USD 4-hour Chart

Technical factors:

  • Price above 21-period and the 50-period EMA
  • Price is between the top B.B. and the middle B.B. (20-period SMA)
  • RSI is elevated (63.79)
  • Elevated volume (descending)

Key levels to the upside          Key levels to the downside

1: $0.32                                    1: $0.285  

2: $0.3328                                2: $0.266

                                               3: $0.245


Categories
Forex Fundamental Analysis

Does The ‘Import Prices’ News Announcements Impact The Forex Price Charts?

Introduction

Import and exports make up a country’s trade balance that primarily drives currency value and economic growth. The two-way feedback between imports and exchange rates is critical to understand and how the trade balance affects currency value. Understanding changes in import prices can help us deepen our understanding of macroeconomic fundamentals of every country.

What is Import Prices?

Import prices are the cost at which foreign goods are purchased in the international market. Import prices are measured through import price indexes. Import price indexes measure the change in prices paid for goods imported to the domestic country. The import price index figures for a reference period relate to the prices of goods that have come into the country during the period.

Import prices are essential to a country’s trade balance. A country’s trade balance is the difference between its total exports and imports and is an economy’s major composition.

How can the Import Prices numbers be used for analysis?

The international market always tends to stay in an equilibrium of currencies. When a country’s currency is flooded into the forex market, its relative value falls against other currencies. On the contrary, when a particular currency leaves the international market and goes into the country, the deficit increases its value against other currencies. Hence, excess reduces value, and scarcity increases value.

In this sense, when a country imports goods and services, it does so by paying out or sending out its domestic currency into the international market. When a country exports a good or service, it sends out the product in return for dollars coming into the country. Hence, overall the total worth of exports and imports should be balanced to maintain the currency’s current value.

When a country imports more than it exports, it faces a trade deficit, and as a result, its currency value falls relative to other currencies. When imports exceed exports, it means the country is a net consumer of goods and services in the global economy. It is negatively contributing to global economic growth. When a country exports more than it imports, it faces a trade surplus, and as a result, its currency rises relative to others. When a country is a net exporter or provider, it is contributing positively to global economic growth.

In general, countries prefer to maintain a trade surplus, but may intentionally maintain a trade deficit by importing, to increase their exports and overall economic growth in the future. Countries in today’s modern world have increasingly become dependent on international trade for both imports and exports.

Countries that do not have a competitive edge in specific sectors prefer to import goods and services from other corners of the world where they may be more efficiently produced and are cheaper. Businesses rely on importing raw materials or intermediate goods for producing finished goods and services, or even consumption.

A strong currency will favor imports as more goods can be procured for a unit of currency. Prolonged deficits (imports exceeding exports) devaluate the currency, which is not suitable for the economy. Hence, countries’ central authorities closely monitor the import and export price changes to draw out policies or reforms if needed to ensure a trade balance. In a crude sense, a country’s exports are its income, and imports are its expense. Increasing imports and declining exports ultimately drive a country into a debt trap.

Import prices are useful for negotiating future trade contracts, tracing global price trends for certain goods and services, predicting future prices, and domestic inflation. It is also used to deflate trade statistics published by the government. Import price also helps the central authorities to decide which and how much of a fiscal or monetary lever is to be used to manage exchange rates.

Import prices are especially valued in the bond markets because of its direct impact. As importing prices become too high, it deteriorates the importing company’s profit margin, ultimately decreasing corresponding bond prices. Hence, bond prices decrease when import prices substantially increase. On the other hand, when import prices decrease, the profit margin for companies increases, and correspondingly the bond prices also rise, seeing the increased margin.

Impact on Currency

The currency markets are always focused on macroeconomic indicators and do not focus on indicators that focus on specific parts of the economy. However, import prices affect trade balance, bond markets, and even stock markets. The overall net import and export figures and trade balance reports constitute more precedence than the individual import prices report for the currency markets. Hence, it is a low-impact indicator in the currency markets and can be overlooked for other macroeconomic indicators.

On an absolute basis, significant increases in import prices for prolonged periods, deteriorate currency, and economic growth. In practice, multiple forces act for and against such figures, and import prices alone are insufficient to determine currency’s future direction.

Economic Reports

In the United States, the Bureau of Labor Statistics publishes monthly import prices as part of its “Import/Export Indexes (MXP).” It is released every month around the second week for the previous month on its official website.

Sources of Import Prices

The Bureau of Labor Statistics Import/Export Indexes (MXP) is primarily used. It is also categorized into subtables by End-Use, NAICS (North American Industry Classification System), Harmonized System, and Origin. Consolidated Import prices for most countries is available on Trading Economics. The World Bank also maintains international trade data in terms of import value and export value indexes.

Import Prices – Effect on Price Charts

Import Prices is an important element in understanding the trade balance of an economy. However, it alone cannot affect the economic condition of a nation. It is combined with the Export Prices, and the difference between the two is what makes it vital.

Coming to the currency market, the Import Prices report mildly affects the volatility of a currency. If immediate volatility on the time of release is not observed, it could be reflected in the short term.

Import Prices Report

The below report represents the Import Prices of the US for the month of June. According to the data released on July 15, the Import Prices increased by 1.4% month-on-month, after a decline of 0.8% the previous month. Also, it beat the forecasted value of positive 1.0%.

Historical Impact Prices Report

Impact Level

The US Import Prices released by the US Department of Labor has a moderate impact on the currency market (USD).

USDJPY – Before the Announcement

Below is the price chart of USDJPY on the 15mins time frame. Before the report was released, the market was in a strong downtrend representing USD weakness.

USDJPY – Before the Announcement

When the news was released during the open if the New York session, the trading volume considerably increased, and the price continued to move south. However, later in the session, the prices reversed in favor of USD. This indicates that the market did have an impact on the report.

USDCHF – Before the Announcement

Before the news announcement, the volatility of the market was feeble. The price which was inclined down initially, but had begun to move switch direction during the release of the news.

USDCHF – After the Announcement

When the Import Prices news report was announced, the volatility was moderate in the beginning but reduced later in the day. The price which was showing bullishness prior to the news continued with the same sentiment. Thus, traders can follow their strategy without any hesitation as the news barely induce high volatility.

AUDUSD – Before the Announcement

Before the announcement of the report, the market was in an evident uptrend making higher highs.

AUDUSD – After the Announcement

Right when the report was announced and the North American session began, the market reversed direction from an uptrend to a downtrend. However, the price failed to make a higher high. The volatility increased significantly, which can be seen from the volume indicator.

The Import Prices is an essential indicator in as it is a factor of calculation for fundamental drivers. As we saw, even though this indicator did not really bring in volatility in the market, it indirectly does significantly affect the currency prices when combined with other drivers. Cheers!

Categories
Forex Fundamental Analysis

Imports by Category – Comprehending This Forex Fundamental Driver!

Introduction

Understanding the portfolio of an economy’s exports and imports can help us track down the fundamental moves in currencies. Tracking imports and exports can help speculators ride the fundamental wave of currency value change in their favor. Imports and Exports are critical components of a nation’s trade balance. The deeper our understanding of these dynamics, the better will be our understanding of macroeconomic trends.

What are Imports by Category?

Imports: They are the goods or services purchased that were produced outside the domestic country. Imports are purchased goods or services from foreign markets. Imports are required for many reasons and inherently constitute a nation’s trade balance. In importing, foreign goods or services come into the country while domestic currency goes out into the international market. A country in general imports when it is more efficiently produced or is cheaper in other countries. It may also import when the nation is unable to produce or meet the required demand.

A country will have numerous corporations that would have requirements for foreign goods or services, and hence the country’s valuation of imports would be in millions and billions. Hence, while importing millions and billions of domestic currency goes into foreign markets where currencies are exchanged for various reasons. Suppose a country wants to import goods or services from another country. It generally pays it in the exporting country’s currency. Hence, during export, currency comes into the country, and products go out, and during imports, the currency goes out, and products come in.

How can the Imports by Category numbers be used for analysis?

When a country’s imports exceed its exports, it is said to have a negative trade balance or trade deficit. Based on the geographical location, technological and business setups, different nations will have a competitive edge in different sectors. For instance, countries like Venezuela, Canada, or Middle Eastern countries are naturally sitting on abundant oil reserves. Hence, it will export oil to countries that do not have such reserves.

Companies may often require raw materials that are more cheaply available from other countries. For instance, companies in the United States might import electronic goods from China, which is cheaper. Hence, such companies may put up bulk order imports and trade takes place. Hence, what a country needs it may import and what it produces it can export.

The international market is decentralized and operates through free-market forces that keep economies in natural equilibrium. Currency exchanges can take place for genuine business transactions or speculative purposes also. When exchanges occur for purely business reasons, we call them fundamental moves in the currency pairs. These fundamental moves give currency their volatility along with speculation from investors.

Understanding a country’s Imports by the Category of products can help us track the fundamental moves. When significant transactions related to import or export takes place, it induces volatility into the currencies. During a considerable import, the international market is flooded with importing the country’s currency, and due to supply exceeding demand, the currency value falls.

On the other hand, when a country exports a massive volume of goods, the corresponding transaction would withdraw a large sum of that country’s currency out of the international market. When demand exceeds the supply, the currency value appreciates. Scarcity appreciates value and oversupply reduces value. Hence, a country must maintain a “balance” in its trades, i.e., the monetary value of all its imports and exports should ideally cancel off. In reality, it is not so, and this imbalance in different country’s trade balance gives currencies the volatility which traders are always looking to capture.

Understanding the economy’s portfolio of imports can help policymakers also in identifying exceeding dependencies in other countries. Too much reliance on foreign countries for goods or services is not suitable for the economy. The more a country is dependent on other countries, especially for basic needs like energy and food, the less it has control over its economic growth and currency valuation.

Countries that depend on fewer categories of imports and exports have more concentrated risk in terms of currency volatility. Countries like AUD and NZD show more volatility in general than currencies like USD and EUR because of the diverse portfolio of exports and imports of the latter currencies.

Impact on Currency

Imports by Category of goods or services is not an economic indicator, but it is necessary to facilitate an understanding of international trade balance amongst currencies. It directly does not impact any currency volatility but is a requisite to base trade analysis amongst currency pairs. Changes in imports by Category does not frequently change as most trade agreements are made for multiple years on end. Any changes in trade composition in terms of Category will be priced through leading economic indicators and news releases.

Economic Reports

In the United States, the Census Bureau tracks the import and export data categorized by trade partners and products. The lists are ranked based on trade volume, deficits, and surpluses, etc. Monthly and year-to-date data are two types listed for all its trade partners.

Sources of Imports by Category

We can find the Census Bureau data on its Top Trading Partners. We can find the percentage of statistics consolidated for most countries for imports by Category on Trading Economics.

Imports by Category News Release – Effect on the Price Charts

Both Exports and Imports are fundamental indicators that vaguely impact the forex market. The Imports report is calculated by considering the Imports by Category and Imports by Country. Reliable results are obtained when they are combined. Thus, to analyze the impact of Imports by Category, we shall be taking into account the Imports number as well.

Level of Impact

The Imports by Category report released by the Australian Bureau of Statistic has minimum to negligible impact on the value of the Australian dollar.

Imports data – AUD

The Imports report published on July 02, 2020, stood negative 6%, beating the previous number -10%. Even though the numbers are not up to the mark, they have recovered to a great extent from the previous month’s readings.

From the below chart ranging from 2016 to 2020, the Australian Imports hit a new low to -10% for the May report. However, it shot up 4% higher the following month.

Imports – Australia

Below is the Imports by Category for the top five categories in imports. We can see that four out of five categories saw a drop from the previous report.

AUDUSD – Before the Announcement

Focusing on the left side of the chart, we can see that the market is in an uptrend and is currently consolidating.

AUDUSD – After the Announcement

On the day of the report release, the impact in the volatility of the currency was insignificant. However, later through the month, the Australian dollar got stronger and continued its uptrend. This indicates that, despite the disappointing number overall, the AUD saw strength as the number beat the previous month report by a significant margin.

AUDCAD – Before the Announcement

Before the news released, the market was in a range for an entire month.

AUDCAD – After the Announcement

On the day of the announcement, the market tried to inch above the top of the range but failed. However, in the subsequent trading sessions, volatility picked up, and the price made a higher high. Hence, we can, to an extent, conclude that the AUD had a positive impact on the Imports by Category numbers.

AUDJPY – Before the Announcement

In the below chart of AUD/JPY on the 4H time frame, we can see that the market is in a strong uptrend. It made a high to around 77.000. The prices were in a pullback phase, the whole month of June.

AUDJPY – After the Announcement

On the day of the report announcement, the market barely had any impact in terms of volatility. That said, in the following weeks, the price rallied up to the previous high of 77.000, indicating AUD strength.

Therefore, we can conclude that the Australian dollar had a feeble effect during the news release day but did have a positive impact on the report in the subsequent trading sessions. Cheers!

Categories
Forex Fundamental Analysis

What Should You Know About ‘Export Prices’ & Its Relative Impact On The Forex Market

Introduction

Exports and Imports are vital components of a country’s Trade Balance that directly affects currency value. Careful balancing of export and import prices is necessary for maintaining currency value. Understanding how export prices affect the overall trades, domestic businesses, and ultimately currency value can help us build a more accurate fundamental analysis.

What are Export Prices?

Export prices are the selling price on the products and services to be sold in the international market. It is the price of goods and services that are domestically produced and sold to foreign countries. Hence, it is the prices fixed on goods and services which is intended for sale by the exporter in the overseas market.

In the United States, the Export prices are measured as part of the “U.S. Import and Export Price Index.” Export price and Import price both together form a sort of “net” price that helps us understand whether we are exporting more and gaining, or importing more and losing.

How can the Export Prices numbers be used for analysis?

In today’s modern world, many nations have opened themselves up for international trade. It is quite common for foreign brands to compete with local brands in many countries. Globalization has led to rapid growth for the global economy. Exports and Imports are two essential elements of a country’s trade balance. Imbalance in trade creates a deficit or surplus that directly affects the country’s currency.

Increased exports and reduced imports mean more goods and services go out of the country, and currency comes in. When currency comes in, the foreign demand for currency increases, and thereby currency value goes up. If exports bring more currency into the country than imports send out, the country experiences a trade surplus, which is good for the economy and currency.

Increased import over export indicates more dollars are spent and go out in importing products and services than dollars coming in for the goods sent out. When the international market is flooded with a currency due to increased imports, its currency value falls against other currencies. In such a situation, a country is said to have a trade deficit. Export prices can rise for the following reasons:

Increased production cost

As the manufacturing or cost of the raw materials increases, it eats away the company’s profit margin. To avoid this, companies may translate these increased production costs to the end consumer by pricing their goods higher.

As companies not only have to compete with fellow local businesses, they need to compete with companies from other countries. An increase in prices through production cost inflation may put the country at a disadvantage and lose sales in the international market. Hence, even though export prices increased, the sales volume will decrease negating the effect. It generally does not work in favor of the country and its currency.

Increased demand

As demand for a particular good or service increases, the company may raise its prices to compensate for the limited supply. Price increase as a result of increased demand is always beneficial for the company, country, and currency. Export and import prices are used for many purposes, and some of which are:

  • Based on changes in export and import prices, we can predict future prices and domestic inflation.
  • We can evaluate currency values and exchange rates based on overall exports and imports for a given pair of countries.
  • It can be used as a reference for setting up other trade agreements and price levels.
  • It can also be used for identifying global price trends for any specific product or service.
  • They can be used to deflate or devaluate trade statistics.

Export prices are specifically more critical for developing economies, as through exports, they primarily achieve their growth. Export-led growth has benefitted developing economies to create wealth and developed countries to get goods at much lower prices in the international market.

Change in currency value also affects export and import prices. Weak domestic currency brings in more currency during exports while making it harder to import as they become relatively more expensive. A strong currency hurts exporters while it favors imports as more goods can be purchased per unit of currency.

Hence, we observe countries undergo “trade wars.” Trade war means countries intentionally devalue their currencies during exports and peg it higher during imports in their favor. Such tactics are regularly used by China, and seeing these other countries also do the same. Competitively devaluating or valuating domestic currency higher to make trades favorable to their countries is referred to as a Trade war. Hence, any increase in export price should solely happen through an increase in demand, as that is the only way the economy benefits in the long run.

Impact on Currency

Export prices alone do not provide us with a complete picture of a country’s trade balance. The overall export minus import price is what determines the overall currency value. Hence, for currency markets, the export prices alone do not provide the necessary insight. Therefore, it is a low impact indicator. But on an absolute basis, an increase in export prices is good for the economy and the currency and vice-versa.

Economic Reports

In the United States, the Bureau of Labor Statistics (BLS) publishes monthly export prices as part of its “Import/Export Price Indexes” at 8:30 AM around the middle of the month. It is reported in percentage changes compared to the previous month and is also reported by categorizing based on end-use.

Sources of Export Prices

We can find the Export Price as part of the Import/Export Price Indexes and end-use versions. We can find consolidated statistics on export prices for most countries on Trading Economics.

Export Prices – Impact Due To News Release

Export prices is an important fundamental indicator in analyzing other economic drivers. When it is combined with the Import Prices, the trade balance is obtained, which plays a vital role in the foreign exchange market. The trade balance is also a fundamental indicator that heavily impacts the currency of a country. Thus, traders always keep an eye on the release of the trade balance report.

Coming to Export Prices, it alone does not induce much volatility relative to that of the trade balance. However, since the trade balance is dependent on the Export Prices and Import Prices, traders do keep a watch on these data releases to get insights on the overall output of the trade balance.

Export Prices Report

Before is the latest report on Export Prices, which came out to be 1.4%. The Export Prices were expected to rise by 0.8%, but the actual number beat the forecast.

USDCAD – Before the Announcement

Before the announcement of the Export Prices data for the month of June, we can see that the market was in a fresh downtrend making news lows every step of the way.

USDCAD – After the Announcement

The news was published during the open of the New York session. It is seen that, right on the announcement of the data, the USD prices collapsed against the Canadian dollar. With the release of the report and the open of the New New York market, the market volatility was boosted.

In this case, we see that the market followed the direction of the overall trend. Thus, traders can take advantage of the volatility due to news and market open and trade based on their analysis. However, they should ensure that the report is within the normal range and not an outlier. During abnormal values, a trader may better off stay away from the related currency, and its pairs.

NZDUSD – Before the Announcement

A day before the release of the Export Prices report, the market was in an uptrend, signifying NZD strength and USD weakness.

NZDUSD – After the Announcement

Once the news was out, the volatility of the market remained the same, despite the open of the US market. This clearly implies that NZDUSD was stayed non-impacted with the Export Prices report. However, in the subsequent day, the market reversed its direction from an uptrend to a downtrend.

GBPUSD – Before the Announcement

On the day of the announcement of the data, the market was in a strong bullish movement. And the time of release, the price was trading right at the supply area.

GBPUSD – After the Announcement

Once the board released the report, the price aggressively turned around and shot south. The reason for the down move can be accounted for the supply region, while the increased volatility could be due to the news and the open of the North American markets. Cheers!

Categories
Crypto Market Analysis

Daily Crypto Review, July 31 – Binance Debit Cards Now in Europe; XRP Whales Started Buying?

The cryptocurrency market mostly traded sideways as Bitcoin still continues its fight for $11,000. Bitcoin is currently trading for $11,065, which represents a decrease of 0.43% on the day. Meanwhile, Ethereum gained 4.76% on the day, while XRP gained 2.04%.

 Daily Crypto Sector Heat Map

When talking about top100 cryptocurrencies, Chilliz gained 29.75% on the day, making it the most prominent daily gainer. Bancor (14%) and VeChain (12.22%) also did great. On the other hand, Ampleforth has lost 45.57%, making it the most prominent daily loser. It is followed by Flexacoin’s loss of 8.58% and Quant’s loss of 8.06%.

Top 10 24-hour Performers (Click to enlarge)

Bottom 10 24-hour Performers (Click to enlarge)

Bitcoin’s dominance level decreased slightly since we last reported, with its value currently at 62.91%. This value represents a 0.75% difference to the downside when compared to yesterday’s value.

Daily Crypto Market Cap Chart

The cryptocurrency market capitalization increased slightly since we last reported. Its current value is $328.13 billion, which represents an increase of $3.04 billion when compared to the value it had yesterday.

_______________________________________________________________________

What happened in the past 24 hours?

_______________________________________________________________________

_______________________________________________________________________

Technical analysis

_______________________________________________________________________

Bitcoin

The largest cryptocurrency by market capitalization spent the day fighting for $11,000 yet again. The sideways movement ranged from the support of $10,855 to a little above $11,090 resistance level. While it is still unsure of whether Bitcoin will end up above or below $11,000, the rally from the $9,000 levels has been extremely successful. As for the short-term future of Bitcoin, it is still unsure, as some analysts call for an immediate correction while others predict a price increase to $11,500 levels.

BTC traders should look for a trade opportunity when BTC bounces off of $10,855 or falls below it.

BTC/USD 4-hour Chart

Technical factors:

  • Price is currently above its 50-period EMA and its 21-period EMA
  • Price is between its top B.B. and its middle B.B (20-period SMA)
  • RSI is elevated (60.82)
  • Volume increased (descending)

Key levels to the upside          Key levels to the downside

1: $11,090                                1: $10,855

2: $11,630                                2: $10,505

                                                 3: $10,015

Ethereum

Ethereum broke off from its period of stagnation and moved towards the upside. The second-largest cryptocurrency by market cap moved to $340 before being stopped. ETH is now consolidating just above the previous consolidation phase.

Ethereum traders should look for a trade opportunity after the cryptocurrency moves back below $324 or if it makes another move towards the upside.

ETH/USD 4-hour Chart

Technical Factors:

  • Price is above the 50-period EMA and the 21-period EMA
  • Price is at the top B.B.
  • RSI is elevated (66.5)
  • Above-average volume (descending)

Key levels to the upside          Key levels to the downside

1: $340                                    1: $302

2: $362                                    2: $289

                                                 3: $278

Ripple

XRP spent its day mostly trading sideways, but also gaining in value slightly. The third-largest cryptocurrency by market cap failed (so far) to break the $0.2454 level completely, but it has approached that event considerably. If, however, XRP doesn’t break the resistance level soon, it might fall back and retest the support level of $0.235.

XRP traders can look for an opportunity when the cryptocurrency breaks its ranging moves to either side.

XRP/USD 4-hour Chart

Technical factors:

  • XRP in a mid-term descending trend (though it broke the trend in the short-term)
  • Price above 21-period and the 50-period EMA
  • Price is between the top B.B. and the middle B.B. (20-period SMA)
  • RSI is elevated (61.84)
  • Elevated volume (descending)

Key levels to the upside          Key levels to the downside

1: $0.245                                  1: $0.235  

                                                2: $0.227

                                               3: $0.214


Categories
Forex Market Analysis

Daily F.X. Analysis, July 30 – Top Trade Setups In Forex – GDP Figures In Focus 

Later today, the focus will remain on the German Prelim GDP and Advance GDP figures from the U.S. both of the events are expected to perform worse than before as the data represents the lock-down period’s economic activity. So most of it is already priced in. However, the U.S. Jobless claims will remain in the highlights. Jobless Claims figures are expected to rise again, perhaps due to the second wave of COVID19 in the U.S.

Economic Events to Watch Today  


EUR/USD – Daily Analysis

TheEUR/USD pair was closed at 1.17897 after placing a high of 1.18061 and a low of 1.17124. Overall the movement of the EUR/USD pair remained bullish throughout the day. EUR/USD pair rose above the 1.180 level on Wednesday amid the Federal Reserve’s decision to keep the rates unchanged at 0.0%-0.25%.

The concerning picture painted by the Federal Reserve about the resurgence of COVID-19 that was already hurting consumption and jobs weighed more on the U.S. dollar. According to Fed Chair Jerome Powell, Fed showed full commitment to use all of its powers and tools to support the economy. He also said that economic development was highly dependent on the coronavirus, and the rates will remain near zero until the economy improves towards recovery.

The Fed’s decision and a statement from Fed’s Chair Powell further weighed on the U.S. dollar that was already under pressure from the past few days. The U.S. Dollar Index fell 0.44% to 93.17, the lowest level since June 2018. The fall of the U.S. dollar below two years lowest level helped the EUR/USD pair to post gains.

The greenback has suffered on expectations that the Fed will continue its ultra-loose monetary policy for years to come and speculate that it will allow inflation to run higher than it has previously indicated before raising interest rates. This all came as the U.S. was facing a continuous rise in coronavirus cases as U.S. deaths from virus surpassed 150,000 on Wednesday, a number higher than all countries and nearly a quarter of the world’s total numbers.

The pair EUR/USD rose above 1.180 level amid the fresh weakness of the U.S. dollar. However, the European side’s macroeconomic data also helped the EUR/USD pair in sustaining its gains.

At 11:00 GMT, the German Import Prices for June rose to 0.6% against the expected 0.5% and supported Euro that added in the upward trend of currency pair.

Furthermore, the Executive of the European Union said on Wednesday that it had agreed to buy a limited supply of the COVID-19 medicine redeliver from the U.S. drugmaker Gilead to address Europe’s short-term needs patients. They also hoped to be able to order more later.

The E.U. Commission agreed to pay about 63 million euros to buy enough doses to treat about 30,000 patients. The anti-viral is the only drug so far authorized in the E.U. to treat patients with the virus’s severe symptoms. However, nearly all available supplies have already been bought by the U.S.

Daily Technical Levels

Support Pivot Resistance
1.17 1.18 1.18
1.17 1.19
1.16 1.19


EUR/USD– Trading Tip

The technical side of the EUR/USD remains mostly the same as it’s trading at 1.1770 level, holding above resistance become support level of 1.1755. On the hourly timeframe, the EUR/USD continues to form higher high and higher low pattern suggestings odds of bullish trend continuation. A bearish breakout of 1.1755 can drive more selling until 1.1702 level. On the higher side, the resistance can stay at 1.1788 and 1.1880.


GBP/USD – Daily Analysis

The GBP/USD pair was closed at 1.29953 after placing a high of 1.30132 and a low of 1.29118. Overall the movement of GBP/USD pair remained bullish throughout the day. The GBP/USD pair rose for the 9th consecutive day and maintained its bullish streak and crossed the 1.30 level. The currency pair rose to its multi-months’ highest level since the first week of March amid the broad-based U.S. dollar weakness.

The U.S. dollar struggled against the six major currencies and dropped to 2 year’s lowest level at 93.17 on Wednesday after the announcement of an interest rate decision by Federal Reserve. Fed kept its rates unchanged near zero and vowed to keep them at the same level until the economy shows improvement.

 Furthermore, the Fed Chair Jerome Powell said that the current economic downturn was severe, and continued fiscal and monetary support will be necessary for recovery. He added that the Fed would remain committed to using its full range of tools to support the economy.

The rising number of coronavirus cases in the U.S. has weighed on America’s economy and the U.S. dollar. Traders have become more concerned that the world’s top economy could be headed for a severe contraction this year.

The death toll in the U.S. reached 150,000 on Wednesday, and it raised the concerns that the economy will take a long time to recover that weighed further on the U.S. dollar. The weak U.S. dollar gave a push to GBP/SUSD pair’s prices above 1.200 level.

On the British Pound front, the Pound rose today after U.K. Mortgage Approvals & Net Lending to Individuals. At 13:30 GMT, the M4 Money Supply by the U.K. for June dropped to 1.0% from the expected 2.2%. The Mortgage Approvals improved to 40K from the projected 35K in June, and the Net Lending to Individuals in June also rose to 1.8B from the expected -0.4B and supported Sterling.

Better than expected macroeconomic data from the U.K. gave strength to British Pound and helped GBP/USD pair to post gains on Wednesday.

Meanwhile, Brexit has remained in focus this week after the London School of Economics warned that both Brexit and the Covid-19 pandemic could severely compromise the U.K. economy.

The U.K. was close to securing a continuity trade deal with Japan that will mirror that of the E.U. pact that Britain will no longer be a part of next January. Both sides are seeking to secure a continuous trade deal once Brexit implemented on January 1.

On Thursday, U.S. dollar investors will be looking ahead for the US GDP figure for the second quarter that is expected to fall by -34.1%; any figure closer to it will be good for the U.S. dollar. The investors will also await the release of the latest U.S. Initial Jobless Claims for July.

However, most people will likely prefer not to invest in the U.S. dollar because of increased external and domestic pressure on American’s economy.

Daily Technical Levels

Support Pivot Resistance
1.2863 1.2908 1.2978
1.2792 1.3024
1.2747 1.3094

GBP/USD– Trading Tip

The GBP/USD is also forming a higher high and higher low pattern, which suggests odds of a bullish trend in the GBP/USD pair. The Cable is likely to find support at 1.2970, which is extended by the upward trendline on the hourly timeframe. Above this, the next resistance can be found around 1.30095, along with support at 1.2970 and 1.2945.


USD/JPY – Daily Analysis

The USD/JPY pair was closed at 104.920 after placing a high of 105.241 and a low of 104.771. Overall the movement of the USD/JPY pair remained bearish throughout the day. On Wednesday, USD/JPY pair continued its bearish streak for the 5th day and fell below 105.00 level amid Fed’s decision to keep interest rates near zero.

Federal Reserve Chairman Jerome Powell warned the U.S. faced the most severe economic downturn and said that the economy’s path was extraordinarily uncertain. He said that the increased number of virus cases and the renewed measures to control it have started to weigh on recent weeks’ economic activity. Powell also said that recovery would need help from both fiscal and monetary policy.

The Federal Reserve vowed to keep the rates unchanged as the pandemic still persists and poses considerable economic outlook risks. The rates will remain near zero until the economy was on track to achieve its maximum employment and price stability goals. The U.S. dollar came under renewed pressure after releasing the monetary policy statement and interest rate decision and caused the USD/JPY pair to drop below 105.00 level.

Despite better than expected U.S. macro-economic data, the U.S. dollar remained under pressure and continues to post losses on the day.

At 17:30 GMT, the Goods Trade Balance for June showed a deficit of 70.6B against the expected deficit of 75.5B and supported the U.S. dollar. The Prelim Wholesale Inventories came in as -2.0% against the expected -0.4% and supported the U.S. dollar. At 19:00 GMT, the Pending Home Sales for June increased to 16.6% against the expected 15.6%and supported the U.S. dollar. The U.S. Dollar index fell to its two years lowest level on 93.17, and the U.S. Treasury yields were little changed with a 10-year note holding below 0.60%.

Meanwhile, President Trump said on Wednesday that his administration was allowing for banning the Chinese-owned social media giant TikTok on the back of fears that it could be weaponized to spy Americans.

The U.S. Treasury Secretary Steven Mnuchin also backed this comment and said that Committee on Foreign Investment in the U.S. was also studying the app’s national security risk. He added that TikTok was under serious evaluation, and by this week, a recommendation will be made to the president regarding the app.

On coronavirus front, the U.S. coronavirus fatalities exceeded 150,000 as seven states, including California and Florida, broke new daily death records. Fears for the potential growth of the infections increased in the Midwest area, including Indiana, Colorado, Ohio, and Wisconsin, because of the fast spread of the virus in the U.S.

Early on Thursday, Japan will publish Retail Trade data that is expected to fell by 6.5% compared to the earlier year. The U.S. investors will look forward to GDP data for the second quarter.

Daily Technical Levels

Support Pivot Resistance
104.80 105.25 105.55
104.50 106.00
104.05 106.30

USD/JPY – Trading Tips

The USD/JPY trades with a selling bias around 105.526 level, trading within a downward channel that immediately generates resistance at 106.120. On the lower side, the USD/JPY may find support at 105.375 level, and closing of candles below 105.375 can open further selling bias until 104.850. Overall the pair is forming lowers low and lowers high pattern, which signifies selling sentiment among traders. The RSI and MACD suggest selling signals; for instance, the RSI is holding below 50, and the MACD is staying below 0. Today, let’s look for buying trade above 105.200. Good luck! 

Categories
Crypto Market Analysis

Daily Crypto Review, July 30 – Bitcoin Confirmed as Better Hedge than Gold? BTC fighting for $11,000

The cryptocurrency market mostly traded sideways as Bitcoin was fighting to regain $11,000. Bitcoin is currently trading for $11,065, which represents an increase of 1.2% on the day. Meanwhile, Ethereum gained 0.33% on the day, while XRP gained 0.45%.

 Daily Crypto Sector Heat Map

When talking about top100 cryptocurrencies, Travala.com gained 21.78% on the day, making it the most prominent daily gainer. Digitex Futures (16.68%) and Aave (11.94%) also did great. On the other hand, Ampleforth has lost 35.64%, making it the most prominent daily loser. It is followed by Aurora’s loss of 10% and iExec RLC’s loss of 8.31%.

Top 10 24-hour Performers (Click to enlarge)

Bottom 10 24-hour Performers (Click to enlarge)

Bitcoin’s dominance level increased slightly since we last reported, with its value currently at 63.66%. This value represents a 0.35% difference to the upside when compared to yesterday’s value.

Daily Crypto Market Cap Chart

The cryptocurrency market capitalization increased since we last reported. Its current value is $325.17 billion, which represents an increase of $4.246 billion when compared to the value it had yesterday.

_______________________________________________________________________

What happened in the past 24 hours?

_______________________________________________________________________

_______________________________________________________________________

Technical analysis

_______________________________________________________________________

Bitcoin

The largest cryptocurrency by market capitalization had another slow day, where it tried to pass $11,000 and consolidate above it. However, while it has passed the threshold, BTC hasn’t confirmed its position above it, making the $11,000 mark uncertain. The $10,855 support level is, on the other hand, a strong support that has been confirmed.

BTC traders should look for a trade opportunity when BTC bounces off of $10,855 or falls below it.

BTC/USD 4-hour Chart

Technical factors:

  • Price is currently above its 50-period EMA and its 21-period EMA
  • Price is between its top B.B. and its middle B.B (20-period SMA)
  • RSI is elevated (62.24)
  • Volume increased (descending)

Key levels to the upside          Key levels to the downside

1: $10,855                               1: $10,505

2: $11,090                               2: $10,015

3: $11,630                                3: $9,870

Ethereum

Ethereum spent its day consolidating above the $315 level, finding support at the 21-period moving average. The second-largest cryptocurrency by market cap ensured its position above $302 (at least in the short-term). Its future movement will most likely be determined by Bitcoin’s next move.

Ethereum traders should look for a trade opportunity after the cryptocurrency breaks its consolidation phase.

ETH/USD 4-hour Chart

Technical Factors:

  • Price is above the 50-period EMA and the 21-period EMA
  • Price is under the middle B.B. (20-period SMA)
  • RSI has normalized (56.41)
  • Above-average volume (descending)

Key levels to the upside          Key levels to the downside

1: $340                                    1: $302

2: $362                                    2: $289

                                                 3: $278

Ripple

Unlike Bitcoin and Ethereum, the third-largest cryptocurrency by market cap maintained high volume and tried to make a move that would break its current ranging position. XRP first moved to the upside, trying to break $0.2454, but failed to do so, which triggered a reaction from XRP bears. The cryptocurrency then made an attempt to break $0.235 to the downside but failed in doing that as well, therefore “locking” XRP in a range between the two resistances.

XRP traders can look for an opportunity when the cryptocurrency breaks its ranging moves to either side.

XRP/USD 4-hour Chart

Technical factors:

  • XRP in a mid-term descending trend (though it broke the trend in the short-term)
  • Price above 21-period and the 50-period EMA
  • Price is between the top B.B. and the middle B.B. (20-period SMA)
  • RSI is elevated (65.63)
  • Elevated volume

Key levels to the upside          Key levels to the downside

1: $0.235                                  1: $0.227 

2: $0.245                                  2: $0.214

                                               3: $0.205


Categories
Forex Signals

USDJPY Bearish Bias Below Downward Trendline – Update On Signal!

Today in the early European trading session, the USD/JPY currency pair extended its previous day bearish moves and dropped further below 105.00 level, mainly due to the broad-based U.S. dollar weakness. The worries triggered U.S. selling bias that the second wave of COVID-19 cases in the United States could ruin the recovery in the world’s biggest economy.

The U.S. Treasury bond yields also declined and weighed on the U.S. dollar. On the other hand, the concerns about intensifying US-China relations extended some additional support to the safe-haven Japanese yen, which exerted an additional burden on the currency pair. Apart from this, the (BOJ) Deputy Governor Masayoshi Amamiya commented that the central bank was prepared to ease its monetary policy exerted some pressure on JPY and extended support to the pair. At this particular time, the USD/JPY currency pair is currently trading at 104.94 and consolidating in the range between 104.81 and 105.25.

The fears that the second wave of COVID-19 cases could undermine the U.S. economic recovery still hovering all over the market and kept the U.S. dollar bulls on the defensive. As per the latest report, the number of confirmed coronavirus cases in the Arizona state increased by 2,107 to a total of 165,934, while the death toll increased to 3,408, and the current hospitalization dropped to 2,564. Apart from this state, the number of confirmed coronavirus cases in the Florida state rose to a total of 441,977, while the deaths toll rose to 6,240, and the hospitalization decreased to 9,023 according to Florida’s Department of Health statement. Almost 4 U.S. states reported records high for one-day coronavirus deaths on Tuesday. The cases in Texas passed the 400,000 marks. However, these fears have exerted significant pressure on the market trading sentiment and made the U.S. dollar weak as well.

As in result, the broad-based U.S. dollar failed to gain any positive traction on the day and reported losses as the United States crisis of virus could break hopes for a quick economic recovery, which kept the investors cautious. However, the losses in the U.S. dollar kept the currency pair bearish. Whereas, the Dollar Index, which tracks the greenback against a basket of six other currencies, was down 0.2% at 93.507.

Across the Pound, the currency pair’s losses could also be associated with Bank of Japan (BOJ) Deputy Governor Masayoshi Amamiya comments that the central bank was prepared to ease its monetary policy further without hesitation if necessary, in the face of the coronavirus pandemic. It also added, “Global economy expected to recover only if wave 2.0 stops slowly.” As well as, they cleared that Japan’s business sentiment has started to show signs of recovery after dropping to a worse level.

However, the risk-off market sentiment was further bolstered by the latest disappointment over the much-awaited fiscal package’s lack of progress. The House Speaker Nancy Pelosi and the White House Chief of Staff Mark Meadows recently ruined expectations of U.S. policymakers delivering a much-awaited fiscal package soon. He said that the Republicans and Democrats still had a difference over the stimulus. However, these uncertainties extended some additional support to the Japanese yen’s as safe-haven status.

Apart from this, the recent escalation of diplomatic tensions between the U.S. and China also exerted some downside pressure on the risk sentiment and contributed to the currency pair’s declines. Although, traders are expected to avoid placing any strong bets ahead of the highly-anticipated FOMC decision.


The USD/JPY trades with a selling bias around 104.926 level, trading within a downward channel that provides an immediate resistance at 105.120. On the lower side, the USD/JPY may find support at 104.575 level, and closing of candles below 104.575 can open further selling bias until 104. Overall the pair is forming lowers low and lowers high pattern, which signifies selling sentiment among traders. The RSI and MACD suggest selling signals; for instance, the RSI is holding below 50, and the MACD is staying below 0. Today, let’s look for selling trade below 104.858.

Entry Price – Sell 104.858
Stop Loss – 105.258
Take Profit – 104.458
Risk to Reward – 1:1
Profit & Loss Per Standard Lot = -$400/ +$400
Profit & Loss Per Micro Lot = -$40/ +$40
Fellas, now you can check out forex trading signals via Forex Academy mobile app. Follow the links below.
iPhone Users: https://apps.apple.com/es/app/fasignals/id1521281368
Andriod Users: https://play.google.com/store/apps/details?id=academy.forex.thesignal&hl=en_US

Categories
Forex Fundamental Analysis

The Impact of ‘Youth Unemployment Rate’ News Release On The Forex Price Charts

Introduction

Youth unemployment is toxic to economic growth. It has long and short-term impacts on the economy that are concerning. With economies struggling to achieve growth and being vulnerable to the economic crisis, youth unemployment has become a more significant threat to growth than ever. Understanding the root causes and possible solutions to youth unemployment can help secure our future economic growth.

What is Youth Unemployment Rate?

Youth Unemployment Rate is the percentage share of the young labor force that is jobless. While the upper and lower limit of age categorizing youth varies across regions, the United Nations categorize people between the age of 15-24. Some countries extend the upper limit to the mid-thirties also.

Youth unemployment is a situation where young people who are actively seeking, willing, and able to work are unable to find a job. Youth unemployment rates generally tend to be higher than the adult rates in all countries across the world. Youth makes up roughly 17% of the world population, and more than 85% of them live in developing countries.

How can the Youth Unemployment Rate date be used for analysis?

Youth Unemployment is caused by many factors, the primary among them being:

Skill Gap

The first and primary root cause of youth unemployment is the gap between the traditional education system and current market skill requirements. The current knowledge acquired through graduation, or any degree is not tailored to the disruptive technological society. With technologies changing so rapidly, the education systems should also be updated to take these changing times into account and provide relevant knowledge.

Employment Regulations

With so many laws protecting employees through labor acts and minimum wage policies, companies are pickier in hiring. Also, companies do not want to invest their earnings into new youth training for months and then reap benefits. Hence, companies are offering part-time jobs or contract hiring work that youth has no choice but to take. During economic downturns, employment protection plans protect employees and leave the contract workers vulnerable. Hence, during economic downturns and downsizing, youths are the first to be laid off.

Public Assistance

Many countries provide income support and assistance initiatives to youth until economic conditions improve. While such programs are good or bad for the youth remains debatable, some say it creates dependence on such programs. Keeping the youth unemployed even longer through such programs will further throw them off the career track.

The effects of youth unemployment are worse than we imagine them to be!
Lost Generation

Unemployed youth are often referred to as the lost generation. They are called so not only for the productivity lost but also for the direct and indirect impact it has on the youth and their families. As the saying goes, “a good start is half-race won,” similarly, a lousy start is also half-race lost. Youth unemployment has said to affect earnings for twenty years.

The hierarchical structure of corporations and late employment of youth puts them on the back seat in the career race, making it very hard for them to catch up with their peers in terms of earnings, position, and skill. Since they have not been able to build up their knowledge and skill during the period of unemployment, there is a substantial decrease in lifetime earnings.

Mental Risk

If a job is hard to find for youth, they often lower their job requirements. More often, they compromise and do jobs that they do not like, and it has an impact on their happiness, job satisfaction, and mental health. It is also reported that unemployed youth are more isolated from the community.

Political unrest

In modern times, political tensions and anti-social behaviors have been attributed to long periods of youth unemployment. The youth who do not have any productive work to engage in are succumbing to such anti-social activities and hooliganisms more, lately.

Increased Public Spending

As more and more youth remain unemployed, benefits payment increase to accommodate the youth. Hence, more of the tax revenues are spent on providing support. Decreased spending inhibits the government from allocating funds where it is needed to assist economic growth.

Decreased Innovation

As youth remains unemployed, the divergent and out-of-box ideas are missed out in the companies. Youth brings energy, dynamism, fresh perspectives onto the table with each passing generation. As innovation decreases, companies die out, thus affecting the economy in the long-run.

Incarceration

An idle mind is the devil’s workshop. If more youth remains unemployed, vulnerability to incarcerating activities increases, youth suicides also rise when unemployment is rampant in youth.

Impact on Currency

The Youth unemployment rate is an economic factor that affects the long-term progress of the economy more severely than the short-term. As seen, it has multi-layered negative impacts in terms of earnings on the youth and also on their families.

For the currency markets, the unemployment rate factors in the youth unemployment rate. Hence, youth unemployment is a low-impact coincident indicator that is more useful for the central authorities to make policy-based decisions.

Economic Reports

In the United States, the Bureau of Labor Statistics (BLS) publishes employment and unemployment statistics in their employment situation report every month. The report classifies it further based on age, sex, industry, etc. It is released on the first Friday at 8:30 AM Eastern Standard Time.

Sources of Youth Unemployment Rate

The United States Bureau of Labor Statistics publishes monthly employment and unemployment reports on its official website. Youth unemployment monthly and annual reports are available. The Organization for Economic Cooperation and Development (OECD) also maintains youth unemployment data on its official website.

Consolidated reports of youth unemployment rates across the world can be found in Trading Economics. World Bank also maintains records of Youth Unemployment Rates.

Youth Unemployment Rate – Impact Due To News Release

Youth Unemployment refers to unemployed persons looking for a job but cannot find the age range defined by the United Nations. This age group currently stands between 15-24 years. Youth unemployment rates tend to higher than the adult rates in almost every country. Forex traders look at general unemployment figures, which are the sum of unemployed persons across all ages and take a currency position based on the numbers. They do not consider the individual components of unemployment data as it does not provide a complete picture.

We will be analyzing be the latest youth unemployment figures of Australia and witness the change in volatility due to the news release. Looking at the below graph, we can say that youth unemployment increased in May by 2% compared to April. Even though the data is not very encouraging, let us determine the market’s reaction to this data.

AUD/USD | Before The Announcement

The above image shows the 15-minute timeframe AUD/USD chart before June 18, 2020. No trends have been established and shows no significant volatility.

AUD/USD | After The Announcement

The above image shows the highlighted candle that represents the news announcement. As the youth unemployment rate came in unfavorable to AUD, there is a significant bearish movement in the pair. The bearish move has happened because of the simultaneous release of the employment change and aggregate unemployment rate reports alongside.  Both the reports underperformed, driving the AUD value further down. The unemployment rate is a high impact indicator and has magnified the effects of youth unemployment figures.

AUD/EUR | Before The Announcement

The above image shows the 15-minute timeframe of AUD/EUR pair where AUD gained momentum till June 18 but only to fall back to its previous normal by 11:00 AM.

AUD/EUR | After The Announcement

The above image highlights the news candle, where we can see the biggest bear candle with the longest down wick throughout the range. The bearish pressures from unemployment rates and employment change have helped put the selling pressure on AUD against EUR.

AUD/JPY | Before The Announcement

The above image is a 15-minute timeframe AUD/JPY chart. No potential trends have started till 11:00 AM of June 18, 2020.

AUD/JPY | After The Announcement

The above image highlights the news candle showing the combined effect of the youth unemployment rate, unemployment rate, and employment change. All three reports did not favor AUD, leading in the biggest bear candle with a long wick showing high sell pressure on AUD against JPY.

Final Words

The charts could be very misleading for novice traders to make them think that the youth unemployment rate has induced such volatility. Unemployment rates and employment changes are closely watched statistics and major indicators. It is essential to understand that all the volatility for AUD against major currencies was induced through the two major indicators and not the youth-unemployment rate.

Even if the youth-unemployment rate had come in favor of AUD, it would have been overshadowed by the bearish sentiment induced from unemployment rates and employment change reports. Hence, the youth unemployment rate is a low-impact indicator that is overlooked for the broader indicators, as mentioned.

Categories
Forex Market Analysis

Daily F.X. Analysis, July 29 – Top Trade Setups In Forex – FOMC in Focus! 

On the news front, the focus will be on the FOMC and Fed policy decision which is expected to be 0.25%. Since no change in rate is expected, there’s is likely to be a neutral sentiment in the market. Besides, the investors will also focus on the Pending Home Sales from the U.S. which is expected to have dropped sharply. The dollar can stay weaker on this news.

Economic Events to Watch Today  


EUR/USD – Daily Analysis

The EUR/USD pair was closed at 1.17166 after placing a high of 1.17734 and a low of 1.16984. Overall the movement of the EUR/USD pair remained bearish throughout the day.

After rising for eight consecutive days, the EUR/USD pair dropped on Tuesday and posted losses for the day as the U.S. dollar rose marginally across the board but remained under pressure ahead of the Fed meeting.

The U.S. Dollar Index was also up on Tuesday and posted a high of 94.0. The recovery in the greenback could be because of correction after losing ground significantly over a few days. Or the recovery could also be because of the rising hopes of the U.S. stimulus package and the economic recovery hopes associated with it.

The Republicans made a proposal on Monday for a stimulus package worth about $1 trillion. The Senate Republicans plan to issue another round of stimulus checks of $1200 while it also cut the emergency unemployment benefit from $600 to $200 per week.

More than 100 billion dollars were allocated to reopen schools in the presented proposal of coronavirus relief fund by Republicans. The proposal is yet to be approved by the Democrats. On the data front, the Spanish Unemployment Rate was decreased to 15.3% from the expected 16.6% and supported Euro. From the American side, at 18:00 GMT, the S&P/CS Composite-20 Housing Price Index for the year was also dropped to 3.7% from the expectations of 4.1%. At 19:00 GMT, the C.B. Consumer Confidence from America dropped to 92.6 in July from 94.0and weighed on the U.S. dollar.

However, the EUR traders ignored the macroeconomic data on Tuesday, and the pair EUR/USD continued to follow the improved U.S. dollar movements.

A two-day Federal Reserve meeting started on Tuesday, during which investors expected reaffirmation on the outlook. Though no monetary policy changes were expected, traders were speculating about a change in emphasis in the Fed’s forward guidance at the meeting.

On the other hand, the bearish correction in EUR/USD pair on Tuesday was due to the rise in its prices for eight consecutive days. The trend in the EUR/USD pair was still positive, and even a sharper slide could have been normal.

On the previous day, the pair EUR/USD posted the highest daily close since June 2018 near 1.1780 level, confirmed that both single currencies had a solid momentum. And despite falling and posting losses on Tuesday, the pair EUR/USD continued to hold just below 1.18 level, which shows that it has a key multi-year trend resistance.

Daily Technical Levels

Support Pivot Resistance
1.1686 1.1730 1.1762
1.1654 1.1806
1.1610 1.1837

EUR/USD– Trading Tip

The EUR/USD is trading at 1.1728 level, holding above resistance to become a support level of 1.1715. On the hourly timeframe, the EUR/USD was previously forming highers high and highers low pattern, but now the recent cycle seems to change the trend. A bearish breakout of 1.1715 can drive more sales until the 1.1683 level. On the higher side, the resistance can stay at 1.1780.

GBP/USD – Daily Analysis

The GBP/USD pair was closed at 1.29316 after placing a high of1.29526 and a low of 1.28379. Overall the movement of GBP/USD pair remained bullish throughout the day. The GBP/USD pair extended its previous day’s gains and maintained its bullish streak for the 8th consecutive day on Tuesday amid improved market mood on vaccine hopes. The U.S. Dollar struggled on Tuesday after hopes of a COVID-19 vaccine boosted the risk sentiment. As in result, the greenback suffered as markets inclined towards riskier assets. The positive news about vaccine development supported the risk sentiment.

The pharma firms worldwide are working on treatment and vaccine development that provides multiple routes to success. Companies like Moderna, Pfizer, and AstraZeneca were all pushing to get their vaccines across the line.

Meanwhile, the U.S. Dollar was also supported ahead of the 2-days Federal Reserve meeting that started on Tuesday. Though no change in interest rate is expected, the traders were cautious to know about the statement of meeting to find more clues about the U.S. economy.

However, the release of S&P/Case-Shiller Home Price Indices for May fell below the forecast of 3.9% to 3.7%. It is because investors have become concerned about America’s economic recovery from the coronavirus pandemic.

The Richmond Manufacturing Index was released at 18:59 GMT as 10 for July against the expectations of 5 and supported the U.S. dollar. However, the C.B. Consumer Confidence also dropped to 92.6 from the forecasted 94.0 and weighed on the U.S. dollar that eventually added in the currency pair gains.

From the GBP side, the Pound was benefited from a stronger than expected CBI Distributive Trades Survey that rose to 4% from the expected -37% and gave hopes to investors that the British economy could be on the road to recovery.

Meanwhile, the Sterling traders were cautious after Prime Minister Boris Johnson warned of the possible signs of the pandemic’s second wave in parts of Europe. This raised concerns that the U.K. could also suffer from a second wave of coronavirus in the month ahead. The London School of Economics has also reported that Brexit could prove a double-shock to the economy. As a result, GBP traders remained cautious as UK-EU post-Brexit trade talks continue despite a lack of progress.

The GBP/USD pair traders will look forward to the Fed’s interest rate decision and the statement of the meeting. If fed in notably downbeat in s monetary policy statement, the GBP/USD pair would edge higher as concerns about the global economy grow.

The Brexit developments will also drive the GBP/USD pair in the coming days of the week as there will be a lack of macroeconomic data until next week. If the talks between the E.U. & U.K. show any progress, then Sterling would rise.


Daily Technical Levels

Support Pivot Resistance
1.2863 1.2908 1.2978
1.2792 1.3024
1.2747 1.3094

GBP/USD– Trading Tip

On the 4 hour chart, the GBP/USD has completed 23.6% retracement at 1.2927 level, and closing below this level has the potential to lead GBP/USD prices towards 1.2910, which marks 38.2% Fibonacci retracement level. On the lower side, the GBP/USD pair can find support at 1.2810 and 1.2765 level. Conversely, the resistance stays at 1.2975. Let’s consider taking buying trade over 1.2760 until 1.2860 level today.  

USD/JPY – Daily Analysis

The USD/JPY pair was closed at 105.073 after placing a high of 105.684 and a low of 104.954. Overall the movement of the USD/JPY pair remained bearish throughout the day. The USD/JPY pair extended its bearish trend and losses on Tuesday amid U.S. dollar weakness and struggled with 105 level. The haven was on the bid, which supported the Japanese Yen and caused a decline in the USD/JPY pair.

The rising numbers off coronavirus cases in the U.S. and the Federal Reserve Interest Rate decision event were the market’s dominating sentiment. Meanwhile, the U.S. stimulus negotiations and mixed earnings reports sent the investors to the sidelines.

The greenback managed to correct some of its oversold conditions during the past sessions; however, the USD/JPY pair remained still on the bearish path on Tuesday. The reason behind it was that background picture containing the concerns about the spread of coronavirus, and the ongoing US-China tensions did not change.

The U.S. Senate Republicans revealed the new coronavirus aid proposal that will need Democrats’ support. The package would include another round of $1200 in direct payments to individuals and a reduction in federal unemployment benefits from $600 to $200 per week and also more than $100 billion for reopening schools.

In remarks, Nancy Pelosi, a white house speaker, criticized it and called it a “pathetic” offer that was not enough to support the country.

On the data front, Japan published the June Corporate Service Price Index, which improved to 0.8% from 0.5% in May. On the U.S. side, the Richmond Manufacturing Index raised to 10 from the expected five and supported the U.S. dollar. The S&P/CS Composite-20 HPI dropped to 3.7% from the expected 4% and weighed on the U.S. dollar. The C.B. Consumer Confidence also dropped to 92.6 from the expected 94.0 and weighed on the U.S. dollar.

The poor than expected Consumer Confidence and HPI data added further losses in the USD/JPY pair on Tuesday. Furthermore, despite the prospects of a prolonged U.S. recession, the U.S. dollar will favor any breakdown in the market confidence due to its dominance in the global payment system. On JPY front, the currency is sensitive to geopolitical news in the Asian region, and with the ongoing conflict between U.S. & China, JPY is set to remain firm for the time being. JPY was the third worst-performing currency this month after the USD and Canadian Dollar.


Daily Technical Levels

Support Pivot Resistance
104.80 105.25 105.55
104.50 106.00
104.05 106.30


USD/JPY – Trading Tips

The USD/JPY trades with a selling bias around 105.526 level, trading within a downward channel that provides an immediate resistance at 106.120. On the lower side, the USD/JPY may find support at 105.375 level, and closing of candles below 105.375 can open further selling bias until 104.850. Overall the pair is forming lowers low and lowers high pattern, which signifies selling sentiment among traders. The RSI and MACD suggest selling signals; for instance, the RSI is holding below 50, and the MACD is staying below 0. Today, let’s look for buying trade above 105.200. Good luck! 

Categories
Crypto Market Analysis

Daily Crypto Review, July 29 – BTC consolidating under $11,000; XRP Skyrocketing

The cryptocurrency market mostly traded sideways after major breakthroughs in the past ten days. Bitcoin is currently trading for $10,880, which represents a decrease of 2.76% on the day. Meanwhile, Ethereum lost 3.38% on the day, while XRP gained 2.42%.

 Daily Crypto Sector Heat Map

When talking about top100 cryptocurrencies, Aave gained 20.59% on the day, making it the most prominent daily gainer. iExec RLC (20.52%) and THORChain (19.48%) also did great. On the other hand, Ampleforth has lost 16.44%, making it the most prominent daily loser. It is followed by Digitex Futures’ loss of 12.01% and HedgeTrade’s loss of 11.28%.

Top 10 24-hour Performers (Click to enlarge)

Bottom 10 24-hour Performers (Click to enlarge)

Bitcoin’s dominance level decreased since we last reported, with its value currently at 63.31%. This value represents a 1.02% difference to the downside when compared to yesterday’s value.

Daily Crypto Market Cap Chart

The cryptocurrency market capitalization skyrocketed and now confirmed its position above the $300 billion mark. Its current value is $320.93 billion, which represents a decrease of $0.06 billion when compared to the value it had yesterday.

_______________________________________________________________________

What happened in the past 24 hours?

_______________________________________________________________________

_______________________________________________________________________

Technical analysis

_______________________________________________________________________

Bitcoin

The largest cryptocurrency by market capitalization had a rather slow day, unlike the past days, which passed in BTC making significant gains. The volume is slowly fading away while the price is trying to find resistance. Bitcoin fell under $11,000 and is currently consolidating above the $10,855 support level. However, it is still unsure if Bitcoin will stay above it or fall under.

BTC traders should look for a trade opportunity when BTC breaks $10,855 to the downside or $11,090 to the upside.

BTC/USD 4-hour Chart

Technical factors:

  • Price is currently above its 50-period EMA and its 21-period EMA
  • Price is between its top B.B. and its middle B.B (20-period SMA)
  • RSI is elevated (69.73
  • Volume greatly increased (descending)

Key levels to the upside          Key levels to the downside

1: $10,855                               1: $10,505

2: $11,090                               2: $10,015

3: $11,630                                3: $9,870

Ethereum

Ethereum also had a slow day, while its price drop reflected Bitcoin’s drop (percentage-wise). The second-largest cryptocurrency by market capitalization is trying to consolidate around the $315 mark, while its volume is fading. Ethereum has strong support at $302, which might get challenged shortly.

Ethereum traders should look for a trade opportunity after the cryptocurrency is done with consolidating.

ETH/USD 4-hour Chart

Technical Factors:

  • Price is above the 50-period EMA and the 21-period EMA
  • Price is at the middle B.B. (20-period SMA)
  • RSI is elevated (58.66)
  • Extremely high volume (descending)

Key levels to the upside          Key levels to the downside

1: $340                                    1: $302

2: $362                                    2: $289

                                                 3: $278

Ripple

Unlike Bitcoin and Ethereum, the third-largest cryptocurrency by market cap had quite a good day, which brought its price above $0.227 and $0.235 resistance levels. XRP made a move, which was sparked by an influx of buyers. The move is still not over, and XRP is fighting to stay above $0.235, though that is unlikely unless the cryptocurrency pushes its price towards the $0.245 level.

XRP traders can look for an opportunity in pullbacks after the bullish move.

XRP/USD 4-hour Chart

Technical factors:

  • XRP in a mid-term descending trend (though it broke the trend in the short-term)
  • Price above 21-period and the 50-period EMA
  • Price is above the top B.B.
  • RSI is in the overbought territory (73.69)
  • Elevated volume

Key levels to the upside          Key levels to the downside

1: $0.235                                  1: $0.227 

2: $0.245                                  2: $0.214

                                               3: $0.205


Categories
Forex Market Analysis

Daily F.X. Analysis, July 28 – Top Trade Setups In Forex – U.S. C.B. Consumer Confidence In Focus! 

On the news front, the U.S. will be releasing C.B. Consumer Confidence during the New York session. C.B. Consumer Confidence is expected to drop from 98 to 94, and it can weigh dollar prices. Simultaneously, the Spanish Unemployment Rate will be in focus during the European session to determine price action in the Euro pairs today.

Economic Events to Watch Today  


EUR/USD – Daily Analysis

The EUR/USD pair was closed at 1.17511 after placing a high of 1.17812 and a low of 1.17447. Overall the movement of the EUR/USD pair remained bullish throughout the day. The EUR/USD pair extended its gains and raised for the 7th consecutive session on Monday to reach 22 months’ top level. The EUR/USD [air even crossed the 1.1700 marks and touched the high of 1.17812 on Monday, the highest since September 2018.

The move was attributed to the U.S. dollar’s weakness as a combination of the sentiment in the risk complex plus the persistent selling of the U.S. dollar in favor of other safe have assets kept the greenback under heavy pressure.

The U.S. Dollar Index fell to 2 years low near 93.60 level and weighed heavily on greenback that ultimately helped EUR/USD pair to grow on the chart for the 7th consecutive session.

On data front at 13:00 GMT, the M3 Money Supply for the year dropped in June to 9.2% from the expected 9.5% and weighed on Euro. The Private Loans for the year also fell in June to 3.0% from the anticipated 3.2% and weighed on Euro. The German Ifo Business Climate, however, was improved to 90.5 points from the expected 89.2 points in July.

In July, the improvement in German Ifo Business Climate could be attributed to the new stimulus package by E.U. commission that was agreed by all E.U. states in 4 days E.U. Summit with some alterations. This improvement in Business Climate for the largest economy of Europe gave strength to local currency and added in the EUR/USD currency pair’s gains.

The sharp surge in EUR/USD pair towards levels last seen in September 2018 above 1.1700 level, confirmed that both single currencies had a solid momentum. USD has a negative momentum triggered by the strong selling bias after the fears of U.S. economic recovery and mounting coronavirus cases. At the same time, EUR has a positive momentum after the E.U. states agreed on a Europe Recovery Fund worth 750 Billion euros. On Wednesday, the Federal Reserve will announce its decision about the monetary policy. Though no change is expected, the comments about the growing concerns on U.S. economic recovery would be key.

Daily Technical Levels

Support Resistance

1.1684     1.1816

1.1601     1.1865

1.1552     1.1948

Pivot Point: 1.1733

EUR/USD– Trading Tip

The EUR/USD is trading at 1.1728 level, holding above resistance to become a support level of 1.1715. On the hourly timeframe, the EUR/USD was previously forming highers high and highers low pattern, but now the recent cycle seems to change the trend. A bearish breakout of 1.1715 can drive more sales until the 1.1683 level. On the higher side, the resistance can stay at 1.1780.


GBP/USD – Daily Analysis

The GBP/USD pair was closed at 1.28793 after placing a high of 1.29025 and a low of 1.27755. Overall the movement of GBP/USD remained bullish throughout the day. The GBP/USD pair extended its gains and maintained its bullish streak for the 7th day amid broad-based U.S. dollar selling bias.

The pound surged to nearly five months high level against the U.S. dollar and reached above 1.2900 marks on Monday, but the signs that Brexit negotiations have delayed could prompt bearish bias to rise further.

The decline in the U.S. dollar continuously supported the rally in the GBP/USD pair. The greenback continued to decline that started last week. It was unable to find support because of worries about the economic recovery in the U.S. and rising expectations about more stimulus from the Federal Reserve.

Furthermore, the macroeconomic data on Monday from the U.S. showed that Core Durable Goods Orders in June dropped to 3.3% from the 3.5% of expectations and weighed on the U.S. dollar. However, the Durable Goods Orders for June raised to 7.3% against the expected 7.0% and supported the U.S. dollar.

On Brexit front, the E.U. and U.K. wrapped up their last round of negotiations in London last Thursday but failed to find a solution on key sticking points, including access of E.U. vessels to fish British waters that have so far muted the progress. The E.U. chief negotiator Michel Barnier has emphasized that talks between E.U. & U.K. needed to be completed by October to ratify a potential deal would be lengthy.

On Monday, the strength in Sterling was largely driven by a sharp fall in the dollar as investors bet that an average inflation targeting mechanism will be introduced by the Federal Reserve in its next meeting this week, and that would likely keep interest rate lower for longer.

The Federal Open market Committee will kick off its 2-day meeting on Tuesday. The interest rates are expected to remain the same within the range of 0% t0 0.25%. However, the comments from FOMC members will be key to watch to take fresh clues about the economic condition of the U.S.

Daily Technical Levels

Support Resistance

1.2807     1.2930

1.2732     1.2978

1.2684     1.3053

Pivot Point: 1.2855

GBP/USD– Trading Tip

On the 4 hour chart, the GBP/USD has closed with a bearish engulfing candle, which suggests odds of more selling the in Cable. On the lower side, GBP/USD can find support at 1.2810 and 1.2765 level. Conversely, the resistance stays at 1.2900 and 1.2975. Let’s consider taking buying trade over 1.2760 until 1.2860 level today.  


USD/JPY – Daily Analysis

The USD/JPY pair was closed at 105.378 after placing a high of 106.105 and a low of 105.114. Overall the movement of the USD/JPY pair remained bearish throughout the day. On Monday, the USD/JPY pair fell sharply and reached 105 level as the JPY capitalized on the risk-off flows at the start of the week. The broad-based U.S. dollar weakness and Japanese Yen’s strength as safe-haven currency caused the pair to decline for the 3rd consecutive session.

The U.S. Dollar Index was down 0.83% on Monday at 93.56 level, which, combined with the decreased Core Durable Goods Orders in June data, weighed on the U.S. dollar. As in result, greenback suffered further and pushed USD/JPY currency pair towards fresh multi-month low.

At 17:30 GMT, the Core Durable Goods Orders were declined to3.3% from the 3.5% of expectations and weighed on the U.S. dollar that ultimately pulled the USD/JPY pair towards the lowest level. At 17:30 GMT, the Durable Goods Orders for June increased to 7.3% against the expected 7.0%

On Monday, the Bank of Japan released the summary of opinions at a July rate review. BOJ’s policymakers debated how the COVID-19 pandemic could reshape monetary policy and its impact on the economy. Many in the nine-member board warned any domestic recovery from the pandemic’s disturbing economic impact would be uncertain and could be delayed depending on how long it takes to contain the outbreak.

Several board members cautioned that any further economic stress would require policymakers to pay close attention to Japan’s banking system and its long-term expectations of inflation. One member suggested that further action was needed with close cooperation with the government and other central banks.

At the July rate review, the Bank of Japan kept the monetary policy steady and gradually maintained its view that the economy would gradually recover from the crisis. In short, the Bank of Japan’s July meeting summary of opinion suggested that the nation’s economy is likely to improve in the latter half of this year, but the impact of a pandemic on inflation and growth expectations must be watched.

On the other hand, US-China tensions escalated after China took over the U.S. consulate locations in the southwest city of Chengdu on Monday. The move came in after the facility was ordered to be vacated in revenge for the closure of China’s consulate in Houston last week.

U.S. Secretary of State Mike Pompeo said that Washington and its allies must use “more creative and assertive ways” to press the Chinese Communist party to change its ways.

The increased tensions between both nations kept the Japanese Yen stronger due to its safe-haven status. The strong Japanese Yen then pushed the USD/JPY pair lower towards multi month’s low level.

Daily Technical Levels

Support Resistance

104.91     106.01

104.47     106.65

103.82     107.10

Pivot Point: 105.56

USD/JPY – Trading Tips

The USD/JPY trades with a selling bias around 105.526 level, trading within a downward channel that provides an immediate resistance at 106.120. On the lower side, the USD/JPY may find support at 105.375 level, and closing of candles below 105.375 can open further selling bias until 104.850. Overall the pair is forming lowers low and lowers high pattern, which signifies selling sentiment among traders. The RSI and MACD suggest selling signals; for instance, the RSI is holding below 50, and the MACD is staying below 0. Today, let’s look for buying trade above 105.200. Good luck! 

Categories
Forex Fundamental Analysis

What Can We Infer From A Country’s Central Bank Balance Sheet?

Introduction

Banks Balance Sheets are useful to ascertain the financial performance of the banks; this is correlated as an economic indicator when the bank in question is the Central Bank of the nation, for example, The Federal Reserve Bank of the United States. A Bank’s Balance Sheet can help us analyze its financial activities in terms of how much money has gone in and out of the banks and in what form, which can have different consequences on the economy. Hence, Analyzing a Bank’s Balance Sheet is useful for investors and also for our fundamental analysis.

What is Bank’s Balance Sheet?

A Bank’s Balance Sheet is a comprehensive summary of its total assets and liabilities. Assets here refer to financial instruments that BRING-IN revenue and liabilities refer to those for which the Banks need to pay off.  In simpler words, assets are what the bank “OWNS” and liabilities are what a company “OWES.”

Banking is a highly leveraged business. Banks make a profit solely out of the interest they receive on the lent out loans and the interest they pay out on the money deposited into their banks. Depositors would typically be general populations opening a savings account for their income and business firms having current accounts usually to maintain and run their holdings.

A Bank’s Balance Sheet has two important categories that divide the entire data, i.e., Assets and Liabilities. For the common man, liability would be a home loan which takes away a portion of his income and an asset would be the home itself on which he may or may not receive rent.

Assets | The assets of a bank can be the following
Reserves

Banks are to follow mandates as dictated by the Central Banks to maintain a certain amount of their total deposits as reserves, which cannot be used to lend out loans in order to maintain solvency during critical times. This mandate also makes sure banks maintain enough cash to meet the withdrawal demands daily at all times.

Loans

For the common man, a loan would be a liability, but for a bank, it is an asset as it brings in revenue in the form of interest. Banks can give credit to the general public, business firms, or even government through bonds. A loan is one of the primary sources of a bank’s income, and the proportion of loans to deposits can make or break a bank when they do not balance out.

Excess loans and fewer deposits can result in insufficient funds to meet withdrawal needs, and excess deposits can eat away the profit margin as the fewer loans do not generate enough revenue to balance out deposit rate amounts.

Cash

The liquid money that the banks maintain to run everyday operations and to show healthy solvency is the most precious of all assets as they can be traded without any loss of value directly without any lag.

Securities

Banks often purchase securities like the Treasury Bonds for which they receive interests regularly, which adds to their total assets.

Fixed Assets

Banks of decent size and scale often diversify their assets by purchasing fixed assets like real estate or gold deposits, which appreciate over time and match up with inflation and act as alternate forms of their other assets.

Balances at Central Banks

Banks are also required to maintain a certain proportion of balances in Central Banks.

Liabilities | The liabilities of a bank could be the following
Deposits

Money deposited by customers who can be people or business organizations.

Money owed to Other Banks

Banks lend each other money in the interbank market when they are either excess or short of their reserves.

Money owed to Bondholders

People owning bonds of banks receive money from the bank, and this generally includes shares and dividends that banks need to pay out as per bond agreement.

Owner’s Equity

Money that belongs to people who invested during the start of the company and helped it run.

Why Bank’s Balance Sheet?

In our context, we need to see the Central Bank’s Balance Sheet, which tells us what open market operations are being conducted by them, which can give us clues about the money circulation conditions in the economy. Since Money Supply metrics like M0, M1, M2 all originate at the Central Bank of a country, their actions and mandates can have a ripple effect in the entire banking system of the nation.

Hence, Central Banks are at the very heart of the Money Supply of a country. With their operations, they can pull out money from the economy or push new money into the system to ensure a smooth run of the economy.

How can the Balance Sheet numbers be used for analysis?

Central Bank activities have a direct influence on inflation and deflation. The Federal Bank in the United States for the past few years has been an active purchaser of bonds as part of the Quantitative Easing Programme, and this has led to a low-interest-rate environment and inflationary conditions. When the Fed releases money into the system on such large scales, it allows banks to lend more money to people and thereby to stimulate the economy. Withdrawal of money by selling their bonds could result in deflationary conditions likewise.

Besides this, what bonds the Fed purchasing is also important, as they have been continuously buying the government bonds to transfer government debt onto themselves, to help the government-run and be able to pay their interest bills in this low-interest-rate environment.

Impact on Currency

The Central Bank’s Balance sheet as a percentage of GDP is just another form of Government debt to GDP ratio, with the only difference being here the debt is owed to the Central Bank. When the debt of government goes beyond 80%, here the only viable choice is to maintain this inflationary condition and low-interest-rate environment.

A decreasing percentage of balance to GDP indicates a growing economy and strengthening of the currency, and an increasing proportion of the same shows an oncoming recessionary period, which is depreciating for the economy.

Economic Reports

In the United States, the Fed’s Balance Sheets are released on Thursday at 4:30 PM every week. Their balance sheet is included in the Federal Reserve’s H.4.1 statistical release titled, “Factors Affecting Reserve Balances of Depository Institutions and Condition Statement of Federal Reserve Banks,” available on the official website.

There are also quarterly reports available for the same, measured as a percentage of GDP in the St. Louis FRED website, which is also a useful tool to monitor the bank’s activity.

Sources of Bank’s Balance Sheets

Below are the official Fed’s Balance Sheet reports – Fed Bal Sheet

Pictorial representation of the same is available in a comprehensive manner in the official website of FRED – FRED – Bal Sheet

Factors affecting Reserve Balances weekly reports can be found here – Thursday Fed Report

The news announcement of this fundamental Forex driver doesn’t have a great impact on the price charts. But we can look at the numbers of Government Debt to GDP ratio as mentioned above to trade the market. Cheers!

Categories
Crypto Market Analysis

Daily Crypto Review, July 28 – Bitcoin Spikes to $11,000; Over $300 Million Liquidated

The cryptocurrency market spent made yet another boom as Bitcoin passed the $11,000 benchmark. Bitcoin is currently trading for $11,024, which represents an increase of 7.7% on the day. Meanwhile, Ethereum lost 1.04% on the day, while XRP gained 2.85%.

 Daily Crypto Sector Heat Map

When talking about top100 cryptocurrencies, Kava.io gained 14.29% on the day, making it the most prominent daily gainer. Divi (13.17%) and Band Protocol (12.84%) also did great. On the other hand, Ampleforth has lost 23.81%, making it the most prominent daily loser. It is followed by Flexacoin’s loss of 17.11% and Augur’s loss of 11.43%.

Top 10 24-hour Performers (Click to enlarge)

Bottom 10 24-hour Performers (Click to enlarge)

Bitcoin’s dominance level increased since we last reported, with its value currently at 64.33 %. This value represents a 2.78% difference to the upside when compared to yesterday’s value.

Daily Crypto Market Cap Chart

The cryptocurrency market capitalization skyrocketed and now confirmed its position above the $300 billion mark. Its current value is $320.99 billion, which represents an increase of $20.52 billion when compared to the value it had yesterday.

_______________________________________________________________________

What happened in the past 24 hours?

_______________________________________________________________________

_______________________________________________________________________

Technical analysis

_______________________________________________________________________

Bitcoin

It’s safe to say that the largest cryptocurrency by market capitalization had another amazing day as it broke a major benchmark of $11,000 and reaching a final price of $11,394 before cooling down. The moment Bitcoin broke $10,000, on-chain activity registered a great increase in exchange inflow, which ultimately led to this fast price increase. During the process, Bitcoin managed to liquidate over $300 million in sell orders.

BTC traders should look for a trade opportunity either with another move up (aggressive) or when the price cools down slightly and makes a top (safer).

BTC/USD 4-hour Chart

Technical factors:

  • Price is currently above its 50-period EMA and its 21-period EMA
  • Price is slightly below its top B.B.
  • RSI is in severely overbought territory (84.33)
  • Volume greatly increased

Key levels to the upside          Key levels to the downside

1: $10,855                               1: $10,505

2: $11,090                               2: $10,015

3: $11,630                                3: $9,870

Ethereum

Ethereum looks like it has found its top at $330 after rising in price for the past 6 days. The final move brought the second-largest cryptocurrency by market cap to the highs of $333 before cooling off a bit. Ethereum now seems like it will (if nothing major happens to Bitcoin) possibly head towards the nearest support level to test it.

Ethereum traders should look for a trade opportunity in Ethereum’s pullbacks and confirmations.

ETH/USD 4-hour Chart

Technical Factors:

  • Price is above the 50-period EMA and the 21-period EMA
  • Price is below the top B.B.
  • RSI elevated (64.32)
  • Extremely high volume

Key levels to the upside          Key levels to the downside

1: $340                                    1: $302

2: $362                                    2: $289

                                                 3: $278

Ripple

The third-largest cryptocurrency by market cap had quite a stable day as it confirmed its path above $0.214. XRP then bounced up and tried to make a break above the $0.227. However, the move was unsuccessful due to the wall of sellers present. XRP will most likely continue to trade within a range, bound by $0.214 to the downside and $0.227 to the upside.

XRP traders can look for an opportunity within the range XRP is currently trading in.

XRP/USD 4-hour Chart

Technical factors:

  • XRP in a mid-term descending trend (though it broke the trend in the short-term)
  • Price above 21-period and the 50-period EMA
  • Price is below the top B.B.
  • RSI is elevated (61.27)
  • Average/slightly higher than average volume

Key levels to the upside          Key levels to the downside

1: $0.227                                  1: $0.214

2: $0.235                                  2: $0.205

3: $0.245                                 3: $0.2


Categories
Forex Assets

Everything About Trading The CHF/THB Forex Exotic Pair

Introduction

CHF/THB is the abbreviation for the Swiss Franc against the Thai Baht. It is classified as an exotic-cross currency pair as it usually has a low trading volume. In this case, the Swiss Franc (on the left) is the base currency, and the Thai Baht (on the right) is the quote currency. The THB is the official currency of Thailand, and it is further split up into 100 satangs.

Understanding CHF/THB

The market price of CHF represents the value of THB that is required to purchase one CHF(Swiss Franc). It is quoted as 1 CHF per X THB. If the market cost of this pair is 34.350, then this amount of THB is required to buy one unit of CHF.

Spread

The distinction between the asking price and the offering price is labeled as the spread. ECN and STP account model will have various spread values; The approximate spread values of CHF/THB pair in both the accounts are mentioned below:

ECN: 30 pips | STP: 35 pips

Fees

The fee is the commission that one pays while entering a trade. A few extra pips are charged on ECN accounts, but there is no fee charged on STP accounts.

Slippage

The mathematical difference between the price expected by the trader and the given price by the broker can be termed slippage. Its cost varies on two factors, i.e., the market’s high volatility and broker’s implementation speed.

Trading Range in CHF/THB

The trading range helps us understand the minimum, average, and maximum pip movement in various time frames. These values assist us in determining the risk, which could be caused by trade. The same is in shown in the below table:

Procedure to assess Pip Ranges

  1. Add the ATR indicator to your chart
  2. Set the period to 1
  3. Add a 200-period SMA to this indicator
  4. Shrink the chart so you can assess a large time period
  5. Select your desired timeframe
  6. Measure the floor level and set this value as the min
  7. Measure the level of the 200-period SMA and set this as the average
  8. Measure the peak levels and set this as Max.

CHF/THB Cost as a Percent of the Trading Range

The cost variations in trade can be determined by applying the total cost to the table mentioned below. The cost percentage of the trading range represents the difference in fees on the trade and various time frames for differing volatility.

ECN Model Account

Spread = 30 | Slippage = 5 |Trading fee = 8

Total cost = Slippage + Spread + Trading Fee = 5 + 30 + 8 = 43 

STP Model Account

Spread = 35 | Slippage = 5 | Trading fee = 0

Total cost = Slippage + Spread + Trading Fee = 5 + 35 + 0 = 40

The Ideal way to trade the CHF/THB

The CHF/THB is an exotic-cross currency pair, and this market’s volatility is moderate. For instance, the average pip movement on the 1H timeframe is 51 pips. We should understand the higher the volatility, the lower will be the cost to implement the trade. However, this is not an added advantage as trading in a volatile market means more risk.

For example, in the 1M time frame, the Maximum pip range value is 1984, and the minimum is 310. When we evaluate the trading fees for both the pip movements, we can see that for 310pip movement fess is 13.87%, and for the 1984 pip movement, the fee is only 2.17%. With the mentioned example, we can conclude that trading the CHF/THB currency pair will be comparatively expensive.

Categories
Forex Fundamental Analysis

What Is ‘Employment Change’ & How Can This Data Be Used For Our Analysis?

Introduction

Employment statistics are closely watched by the market because of their direct effect on consumer spending. Consumer spending makes up over two-thirds of the country’s GDP for many countries. Hence, understanding Employment Change, its place in the reports, and its impact on market volatility are crucial for building reliable fundamental analysis.

What is Employment Change?

Employment

It is the state of having a paid job. A person is considered employed if it does any work for pay or profit. People who are eligible for employment are between the age of 15 and 64 and are called the working-age population.

Employment Change

Unlike most reports which are reported in percentage or ratios to understand the statistics better, the Employment Change reports the nominal change. Employment Change is the change in the number of jobs added or lost over the previous month.

For example, if there were 20,000 jobs in January, and, in February, the figure was 25,000 jobs, then the Employment change would be +5,000. If the total jobs in February were 10,000 only then the Employment Change would report -10,000. Hence, positive numbers indicate job growth or new jobs added to the economy. Conversely, negative numbers indicate jobs were removed from the economy.

It measures the estimated change in the number of employed people during the previous month, excluding the farming and government industry. Hence, it accounts for the non-farm payroll employees, that are widely used statistics to monitor employment levels.

How can the Employment Change numbers be used for analysis?

Employment is a politically and economically vital statistic in any country. High levels of unemployment threaten social structure, and the ruling party’s governance. There have been incidents in many examples, where high unemployment periods have led to an increased number of crime and suicide death rates. Hence, Central Authorities are politically committed to ensuring low levels of unemployment at all times.

High unemployment is terrible for the economy. As Consumer Spending makes more than 70% of the total Gross Domestic Product for many countries, it is no wonder employment statistics are one of the primary indicators in the currency markets. Employment has a direct effect on Consumer Spending. As more people are employed, more people have disposable cash to meet their needs and discretionary spending. Hence, high employment boosts Consumer Spending, which in turn propels the GDP higher.

High unemployment levels tend to have a ripple effect on the economy, as jobs removed from one sector also tends to induce the same effect on dependent industries, and on a smaller scale on indirectly dependent industries and the overall economy.

For instance, if a car manufacturing company has a slow down in business, and decides to lay off half of its staff, then the company supplying tires to this company will also see reduced demand, leading to the same lay off and reduction in business. Also, indirectly dependent industries like car paint and servicing shops, car perfume selling shops would similarly take a hit. Hence, we see how lay-offs in one sector tend to creep into other sectors as well.

Also, during this cascading effect, there is a definite impact on consumer sentiment as well. A drop in consumer confidence also discourages the spending habits of people, which further impacts consumer spending. Hence, people who are still employed are also affected by unemployment in one or the other way. People generally start saving for a rainy day when employment levels drop, thinking their turn is also around the corner. Generally, industries dealing with luxury and recreation tend to take the worst hit during economic slowdowns and recessions.

Employment Change is a nominal figure that is a little misleading and confusing to correctly analyze the severity of positive or negative numbers as it is a function of the population. A country showing -10,000 jobs lost over the previous month could be ignorable for a country like India or China where the population is vast, and critical for small countries where the population is just in a few million. Hence, people generally prefer the unemployment rate and other percentage metrics to analyze the severity of the country’s employment situation correctly.

Impact on Currency

Even though it is a nominal figure, this report’s earliness gives it an edge over other reports, as traders are always looking to be ahead of the game and beat the market trend before it sets in. Hence, seasoned traders look at the Employment Change reports and analyze them historically to make investment decisions before market trends are set in motion. Hence, there tends to be a lot of market volatility around Employment Change reports.

Employment Change is a coincident and high impact indicator that can generate enough market volatility during significant changes in the reports. It is always best to combine reports with initial jobless claims reports, non-farm payroll statistics to build a broader understanding in the long-term to correctly trade these short and long-term volatilities around the time of report’s releases.

Economic Reports

In the United States, the Bureau of Labor Statistics (BLS) publishes monthly, quarterly, semi-annually, and yearly reports of the Employment change seasonally adjusted figures on its website. The report classifies change in employment as per the major industry sectors.

ADP publishes Employment Change reports on its official website about two days after a month ends. Hence, it is a day or two earlier than other employment situation reports published by BLS. ADP Non-farm employment change is the closely watched statistic before BLS releases its Employment Situation Report later.

Image Credit: U.S. Bureau of Labor Statistics

Sources of Employment Change

We can find the earliest Employment Change report from the ADP employment report.

The United States Bureau of Labor Statistics publishes monthly Employment Change, employment, and unemployment reports on its official website.

We can also find the same indexes and many others with a comprehensive summary and statistics of various categories on the St. Louis FRED.

Consolidated reports of Employment Change of most countries can also be found in Trading Economics.

That’s about ‘Employment Change’ fundamental Forex driver. As mentioned above, the impact of this indicator’s new release on the Forex price charts is minimal. However, if we combine them with other credible employment data like initial jobless claims and non-farm payroll statistics, we can get a broader understanding, which is crucial. Cheers!

Categories
Forex Market Analysis

Daily F.X. Analysis, July 27 – Top Trade Setups In Forex – U.S. Durable Goods In Hightlights! 

On the news side, eyes will remain on the German Business Climate, and the U.S. durable good as these have the potential to drive movement in the market gold and US-related pairs. Check out the trading plans below.

Economic Events to Watch Today  


EUR/USD – Daily Analysis

The EUR/USD pair was closed at 1.16543 after placing a high of 1.16579 and a low of 1.15810. The EUR/USD pair extended its 6th-day bullish rally and rose above 1.16500 level on Friday amid the broad-based U.S. dollar weakness. The declines in greenback boosted the currency pair EUR/USD as the marginal gains in the U.S. dollar failed to retain their position.

The U.S. Dollar Index raised to 94.80 level but turned to the downside after dropping to 94.40 level, the lowest since September 2018. The U.S. dollar currency was unable to stabilize as its weakness remained in place.

The main driver behind Friday’s rally in the EUR/USD pair was the U.S. dollar’s weakness. However, the economic data also supported this upside movement in currency pair.

At, 12:15 GMT, the French Flash Services PMI for July rose to 57.8 against the expectations of 52.3 and supported EUR. The French Flash Manufacturing PMI for July dropped to 52.0 from the projected 53.1. At12:30 GM, the German Flash Manufacturing PMI raised to 50.0 from the 48.0 of expectations, and Flash Services PMI also raised to 56.7 from the anticipated 50.4.

At 13:00 GMT, the Flash Manufacturing PMI for whole bloc also rose to 51.1 from the anticipated 50.0, and the Flash Services PMI for whole bloc reached 55.1 in July from the expected 51.0. At 17:55 GMT, the Belgian NBB Business Climate dropped by 13.9 points against the expected drop by 14.3 points, and it also supported Euro as the business climate showed improvement.

On the flip side, the Flash Manufacturing PMI from the U.S. was released at 18:45 GMT. The figure dropped to 51.3 from the anticipated 52.0. The Flash Services PMI from the U.S. also declined to 49.6 from the expected 51.0 in July. The better than expected PMI data from Europe indicated that manufacturing and services activities were improved in Europe, giving strength to EUR. Whereas, the poor than expected data from the U.S. weakened the U.S. dollar when its PMI dropped in July.

The better economic condition and business climate of the European Union could be attributed to the latest approval of a massive stimulus package by the European Union. And the U.S.’s poor economic condition indicated that the U.S. was still suffering and struggling against coronavirus.

The U.S. marked the second day with 70,000 plus new cases of coronavirus and deaths more than 1000 in 24 hours on Saturday. The total number of infections in the U.S. reached 4.1 M, and the fatalities reached 145,324.

The mounting numbers in infected people will likely weigh on the U.S. economy and its currency for a longer period, and the weakness in gold is likely to remain persistent. So, another rally in EUR/USD on Monday is expected unless news suggested otherwise.

Daily Technical Levels

Support Resistance

1.1640     1.1659

1.1629     1.1667

1.1621     1.1678

Pivot point: 1.1648

EUR/USD– Trading Tip

The EUR/USD traded sharply bullish amid weaker dollar to trade at 1.1704 level, and closing below 1.1730 resistance level can trigger selling until 1.1685 level today. On the lower side, the pair may gain support at 1.1686 level. A bullish breakout of the 1.1730 level can extend the buying trend until the 1.1788 level. While the violation of 1.1685 can lead to EURUSD prices towards 1.1589 level. 


GBP/USD – Daily Analysis

The GBP/USD closed at 1.27945 after placing a high of 1.28034 and a low of1.27168. Besides, the trading of the GBP/USD pair remained bullish throughout the day. The GBP/USD pair gained on Friday and extended its bullish streak of the 6th consecutive day on Friday amid better than expected U.K. data and broad-based U.S. dollar weakness.

Despite U.K. data coming in favor of local currency, the other factor involved in the rally of GBP/USD pair was the U.S. dollar’s weakness. The greenback has failed to recover as U.S. yields were low and looking for support. Since March, the U.S. Dollar Index fell and posted the fifth weekly decline in a row with the worst performance. The index dropped below 94.5 level that is lowest since September 2018.

Sterling was high on the board as the macroeconomic data related to PMI for July from the U.K. rose from expectations. AT 13:30 GMT, the Flash manufacturing PMI for July rose to 53.6 against the expectations of 52.0 and supported GBP. The Flash Services PMI for July also raised to 56.6 from the expected 51.4 and supported GBP. At 11:00 GMT, the Retail Sales from the U.K. was raised by 13.9% from the expected 8.3% and supported GBP. The better than expected PMI and Retail Sales data from Great Britain helped GBP/USD to post gains and trade higher.

The U.S. Manufacturing PMI dropped to 51.3 from the expected 52.0, and the Flash Services PMI from the U.S. also dropped to 49.6 from the expected 51.0 in July. This added in the U.S. dollar weakness on board and supported the gains in GBP/USD pair on Friday.

Meanwhile, the U.S. dollar weakness was further bolstered by the rising coronavirus cases across the states. The U.S. marked the second day with 70,000 plus new instances of coronavirus and deaths more than 1000 in 24 hours on Saturday. The total number of infections in the U.S. touched 4.1 M, and the death toll reached 145,324.

The hopes that the U.S. economy will take a long period to recover from the coronavirus crisis as it hit hardest the U.S. States kept weighing on the U.S. dollar. The U.S. Dollar drops across the board pushed the pair above the 1.2800 level, and analysts believe that if the dollar’s weakness remained still, the GBP/USD pair could reach the 1.3000 level.

The British Pound was also backed by the decreasing number of coronavirus cases in the U.K. It means that restrictions will be gradually removed, and these hopes supported Pound.

On Brexit front, the latest round of negotiations ended on Thursday without significant progress on the post-Brexit trade deal. Britain’s chief Brexit negotiator David Frost said that they would not reach a preliminary agreement by the UK PM Boris Johnson’s July deadline. However, although the expectations for striking a deal are very less, it could not lose attention. Next week, the Brexit talks, U.S. stimulus package, and the infection cases in the U.S. will be key to watch.

Daily Technical Levels

Support Resistance

1.2782      1.2803

1.2771      1.2813

1.2762      1.2824

Pivot point:1.2792

GBP/USD– Trading Tip

The GBPUSD is also trading in an overbought region, and now it can drop until 1.2825 level, which marks 23.6% Fibonacci retracement below this the next support will be found around 1.2770. At the same time, resistance stays at 1.2860 and 1.2930. The RSI and MACD are in the bullish region, but they are forming smaller histograms that suggest odds of selling bias. Let’s consider taking buying trade over 1.2760 until 1.2860 level today.  


USD/JPY – Daily Analysis

The USD/JPY was closed at 106.124 after placing a high of 106.902 and a low of 105.679. The USD/JPY pair extended its bearish streak for the second day towards the lowest of 2 years amid broad-based U.S. dollar weakness. The strong bearish pressure on the day came in after the souring market sentiment that helped JPY gather strength as a safe haven. The currency pair dropped below 106 level and extended its slide and reached its lowest since mid-March at 105.67.

The risk-averse market sentiment was boosted by the escalating tensions between the U.S. & China. Last week the U.S. sent a short notice to China to halt its consulate in Houston. In retaliation, China closed the U.S. consulate in Chengdu, and the tensions between the U.S. & China escalated. Besides, U.S. Secretary of State Michael Pompeo asked for an end of “engagement,” a policy that has defined US-China relations for nearly five decades. The policy is considered as the most important foreign policy achievement by China in recent history.

The safe-haven Japanese yen gained traction due to its safe-haven status, causing the USD/JPY pair to move in a downward direction. The U.S. Dollar Index dropped by 0.36% to its lowest level since September 2018 at 94.41 level and made the greenback weak across the board. The weak U.S. dollar weighed on the USD/JPY pair and pushed the pair to its two years lowest level.

Furthermore, the macroeconomic data released on Friday also weighed on the USD/JPY pair when Flash Manufacturing PMI from the U.S. dropped to 51.3 level from the anticipated 52.0 in July. The Flash Services PMI also fell to 49.6 level from the projected 51.0 and weighed on the U.S. dollar. At 19:00 GMT, the New Home Sales in June from the U.S. increased to 776K from the expected 700K.

The decreased PMI data from the U.S. could be attributed to the increased number of coronavirus cases from across the U.S. On Saturday, the U.S. marked the second day with 70,000 plus new instances of coronavirus and deaths more than 1000 in 24 hours. The total number of infections in the U.S. rose to 4.1 M, and the death number reached 145,324.

Next week, the FOMC meeting will remain dovish, and the scope for U.S. Dollars will remain on the downside. This will make investors to short USD positions that will cause further decline in the USD/JPY pair.

Daily Technical Levels

Support Resistance

105.85     106.19

105.70     106.36

105.52     106.52

Pivot Point: 106.03

 USD/JPY – Trading Tips

The USD/JPY trades with a selling bias around 105.526 level, trading within a downward channel that provides an immediate resistance at 106.120. On the lower side, the USD/JPY may find support at 105.375 level, and closing of candles below 105.375 can open further selling bias until 104.850. Overall the pair is forming lowers low and lowers high pattern, which signifies selling sentiment among traders. The RSI and MACD suggest selling signals; for instance, the RSI is holding below 50, and the MACD is staying below 104.866. Today, let’s look for sell trade below 105.800. Good luck! 

Categories
Crypto Market Analysis

Daily Crypto Review, July 24 – Bitcoin Above $10,000; Ethereum Passing $300

The cryptocurrency market spent had quite a bullish weekend. Out of the major cryptocurrencies, Ethereum and Bitcoin broke the strongest barriers. Bitcoin is currently trading for $10,050, which represents an increase of 3.95% on the day. Meanwhile, Ethereum gained 6.42% on the day, while XRP gained 1.04%.

 Daily Crypto Sector Heat Map

When talking about top100 cryptocurrencies, Elrond gained 22.75% on the day, making it the most prominent daily gainer. Status (10.69%) and Terra (9.44%) also did great. On the other hand, Synthetix Network has lost 10.39%, making it the most prominent daily loser. It is followed by Band Protocol’s loss of 6.95% and Aave’s loss of 6.76%.

Top 10 24-hour Performers (Click to enlarge)

Bottom 10 24-hour Performers (Click to enlarge)

Bitcoin’s dominance level decreased slightly since we last reported, with its value currently at 61.51%. This value represents a 0.78% difference to the downside when compared to Friday’s value.

Daily Crypto Market Cap Chart

The cryptocurrency market capitalization skyrocketed and broke the $300 billion mark. Its current value is $300.47 billion, which represents an increase of $13.24 billion when compared to the value it had on Friday.

_______________________________________________________________________

What happened in the past 24 hours?

_______________________________________________________________________

_______________________________________________________________________

Technical analysis

_______________________________________________________________________

Bitcoin

The largest cryptocurrency by market capitalization had an amazing weekend, which ended with it breaking the $10,000 mark. Bitcoin experienced a steady increase in price for six days now, slowly breaking each obstacle in its path. The final move, which broke $10,000, was a bit hectic as the wall of sellers kept the price down for quite a bit. Bitcoin is now held from going up by the ascending resistance level. However, the “battle” for $10,000 is not over yet, as Bitcoin did not make a strong confirmation move.

BTC traders should look for a trade opportunity after BTC decides whether it will move above or below $10,000.

BTC/USD 4-hour Chart

Technical factors:

  • Price is currently above its 50-period EMA and its 21-period EMA
  • Price is above its top B.B.
  • RSI is in the overbought territory (76.57)
  • Volume Increased

Key levels to the upside          Key levels to the downside

1: $10,015                               1: $9,870

2: $10,505                               2: $9,735

3: $10,855                                3: $9,580

Ethereum

Ethereum, just like Bitcoin, made some amazing gains as well as broke major resistance levels over the course of the weekend. The second-largest cryptocurrency by market cap spent the past five days rising sharply towards the upside due to its booming fundamentals. The weekend ended with Ethereum moving past $300 and pushing to $325, with the move still continuing. With the RSI being heavily overbought and volume slowly declining, traders can expect the move to end soon.

Ethereum traders should look for a trade opportunity in Ethereum’s pullbacks from the big move towards the upside.

ETH/USD 4-hour Chart

Technical Factors:

  • Price is above the 50-period EMA and the 21-period EMA
  • Price is above the top B.B.
  • RSI severely overbought (82.86)
  • Extremely high volume

Key levels to the upside          Key levels to the downside

1: $340                                    1: $302

2: $362                                    2: $289

                                                 3: $278

Ripple

The third-largest cryptocurrency by market cap had a good weekend, though not quite as good as Bitcoin and Ethereum. XRP established its position above $0.214, which is a great mid-term indicator. While the initial bullish move got stopped by the $0.227 and XRP started moving towards the downside, the current position XRP is in is quite good.

XRP traders can look for an opportunity within the range XRP is currently trading in.

XRP/USD 4-hour Chart

Technical factors:

  • XRP in a mid-term descending trend (though it broke the trend in the short-term)
  • Price above 21-period and the 50-period EMA
  • Price is below the top B.B.
  • RSI is elevated (64.47)
  • Average/slightly higher than average volume

Key levels to the upside          Key levels to the downside

1: $0.227                                  1: $0.214

2: $0.235                                  2: $0.205

3: $0.245                                 3: $0.2


Categories
Forex Basic Strategies Forex Economic Indicators

Trading Forex News: Why Risk Assessment Calls for a Different Approach

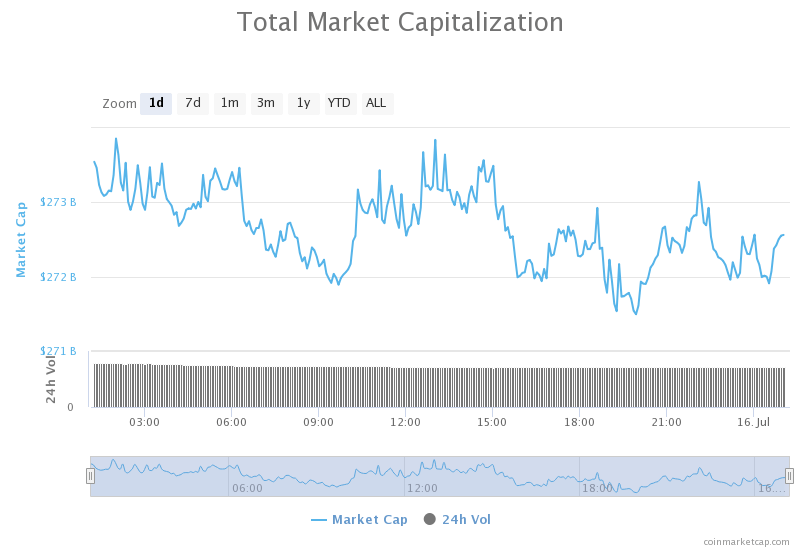
We know how certain markets, such as the crypto market, foster the culture of sharing news and exchanging information. The spot forex market, however, appears to be calling for a different approach for traders to truly master the skill of trading currencies, building the very needed psychological resilience along with one’s trading account. Some of the market’s most prominent traders even fervently support the idea that trading news is one of the least effective strategies forex traders could ever implement. While a number of traders keep striving to find a way to trade news, a portion of successful traders insists on employing another method. Today, we are trying to understand whether traders should necessarily avoid every type of news, and how reliance on such information affects trading, analyzing claims against incorporating news events in trading currencies.

When we think of news, we should first differentiate between the types of information which can have an impact on forex traders and the second type that has no influence on their trading. The forex community consists of traders, which is distinctly different from investors, which why a number of news announcements on websites such as Bloomberg or CNBC simply do not apply to the currency market. Various sources entirely disregard the forex-related news, whereas other media provides information that is simply not very useful and thus should not constitute a part of traders’ daily routine. In comparison to the previous group, news that forex traders should concern themselves with is economic indicators, which are scheduled news events. These pieces of information always come in advance several times a year (e.g. every two or three months, each quarter, etc.). Of course, traders may suddenly receive some unexpected news at times, but such cases are exceptionally rare and seldom. The benefit of having such transparent information ahead of time is to know factors that can actually affect the market in some way and along with the time of these events’ occurrences.

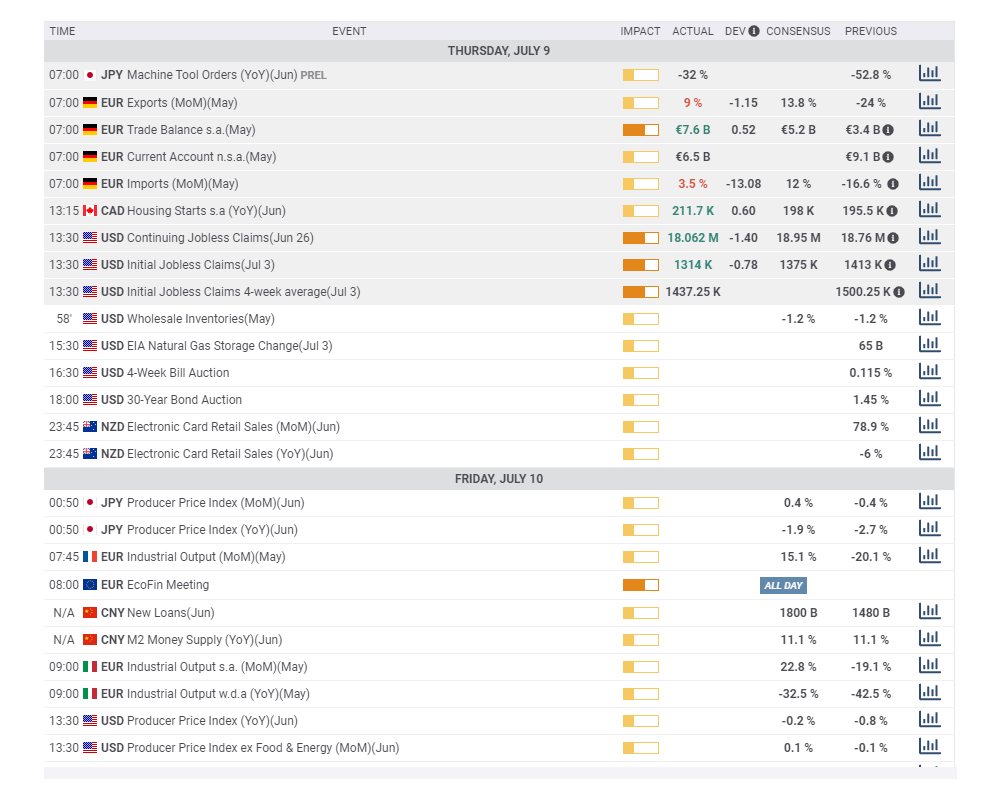
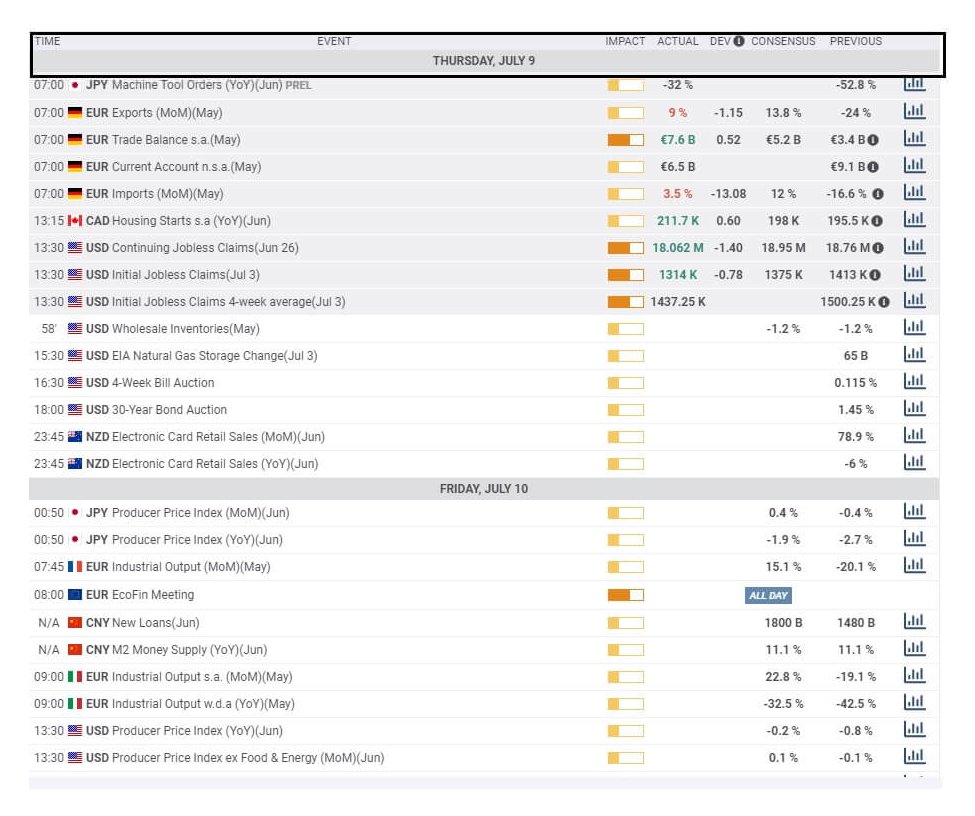
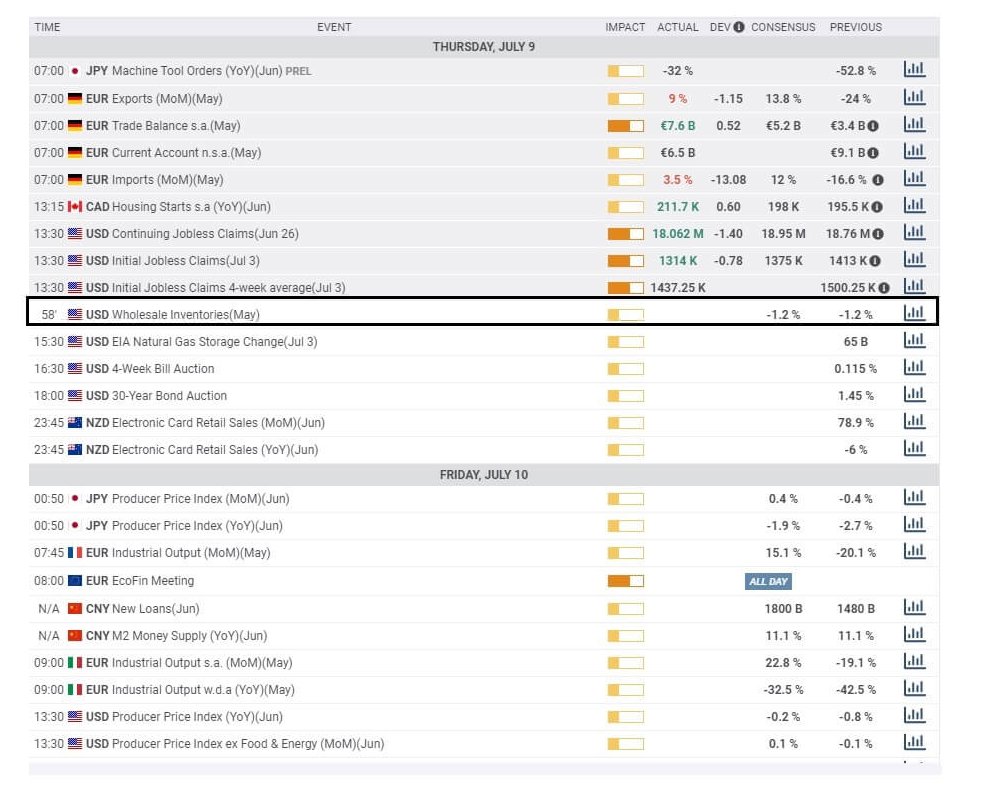
For traders to be able to make use of such pieces of information, they should first access news calendars, which are available online (e.g. https://www.forexfactory.com/calendar?week=jan13.2019 and https://www.dailyfx.com/economic-calendar). These calendars are an excellent source of information because they offer traders the possibility to protect themselves against any potential pip falls in advance. Nonetheless, even if some of the existing economic indicators or news events lack to provide any information a trader may find relevant, they still have a great impact on trading overall. What often happens is that certain pieces of news alarms people and, as you may already know, the more traders react, the faster will the banks get involved. When the big banks overreact, it usually entails some important market activity ending with the price changing direction. Therefore, consulting news calendars before entering a trade is a crucial part of trading in the spot forex market because traders need to have any available information at their disposal as early as possible.

Some traders assume that managing news events is possible, believing that by possessing these information items gives them control over the market, to the extent that they deem generating a great number of pips in little time possible. Their viewpoint on news events boils down to the idea that the moment such news comes out, they will take specific action accordingly. Should the news be strong, they will go long on their chosen currency and vice versa. They believe that any timely reaction will easily bring them many pips, and we cannot but confirm that such a belief is based on solid grounds. Nonetheless, the fact that some traders managed to achieve this does not prove its quality. Not only does it happen occasionally, which immediately introduces a higher than necessary risk, but it also leads to false conclusions. Wanting to stay on top of news events is equal to trying to beat the traders’ main opponent, the big banks, and attempting to fight the one who decides how the prices will move is a very bad idea in the long run. Failure is inevitable when your adversary is unbeatable, so any attempt to control the news already implies more risk than anyone should have to take on.

Since traders already have no power over the price, they may need to consider the role of the big banks on a deeper level. These banks can choose to redirect the market in any desired way and, even if they ever get fined for manipulating prices, which does happen from time to time, they have enough financial support to withstand and last. You may have already noticed how certain decisions they have made in the past have always been justified in the media, regardless of how incomprehensible or unreasonable those may be. Often when traders receive some positive news regarding a particular currency, a pair involving the currency will suddenly go short and keep the same direction for a long period of time. The forex news media (for example Twitter and Bloomberg, among others) always appears to be prepared under any circumstances, providing some vague explanations such as claiming how the news has already been priced in. Traders, unfortunately, do not possess this information beforehand and each time a price moves in an unusual fashion, traders are made to believe it was them who failed to read through the news or take the right steps. Therefore, going against this powerful opponent is sheer luxury traders need not indulge in for the sake of keeping their accounts.

While the price may at times take a strange direction, there are times when they move in an expected manner. Traders may have witnessed how, when some positive news came out on a particular currency, it become more expensive as a result. News events have the power to dictate whether a price will become higher or lower, but you should know that it is the big banks pulling the strings from the shadow. The news may say where the price will go, but these banks alone will ultimately decide when such action will take place and what will happen with the price before it gets there, moving it up and down to their liking. Apart from special permissions, the big banks also have access to exclusive tools that allow them to see orders, stop losses, and whether traders are going long or short. As they have the ultimate power, they can trigger traders’ stop losses and manage the market as they like. What the big banks especially look forward to is seeing where the majority of traders are going because it is the moment that is the most rewarding for them. The ability to see retail money only helps them earn more by moving the prices against the majority. Therefore, when any big news comes out, they immediately know where the price will have to end up for them to reap the benefits, leaving most traders on the other end of the spectrum.

Some traders may still want to make money trading while the big banks are busy, but this approach will only bring random wins. Unfortunately, this game was designed so that there is always only one winner and traders are not meant to be the ones taking the prize home. You should not, therefore, feel confused or surprised if you realize that the price did not act the way you imagined it would, as this market will never let you build your account this way. While you may have previous success with handling news, you should know that the likelihood of maintaining the same approach long term is rather low. Because many successful traders have already failed to try to play these games in the past, they understand that the best solution is to not get involved. Traders need to seek actions that will grant them control and they definitely cannot control the big banks’ decisions, the news events, or the manner in which the masses are going to reach them. By willfully taking part in the attempt to manipulate news events, you are in fact giving u control over your own money.

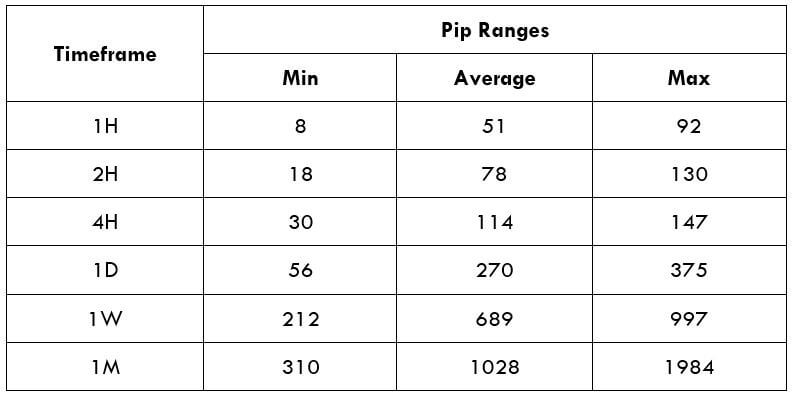
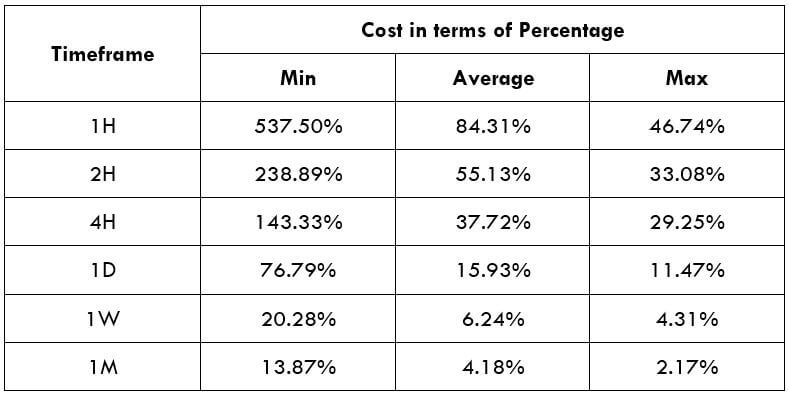
The reason why so many traders get involved in such activities is the rush of instant gratification, which practically boils down to the urge to satisfy the greed for becoming rich fast. The best strategy for any trader dealing with such compulsive need is to learn how to properly address the news, and to be able to do that will then require them to have a set plan in place. You do not have to go to great lengths to be able to secure financial stability. Trading five-minute charts, managing numerous screens, and making rash decisions upon entry and exit will not necessarily lead to any lucrative outcomes. By trading the daily chart, for example, you can successfully evade the impact of news events. Just by looking at the news calendars, you can develop insight into the substantial quantity of news happening on a daily basis. You can also, therefore, grasp how many pieces of information the traders using the five-minute chart, which is a stressful endeavor alone, need to manage at the same time. Trading smaller timeframes, hence, does not necessarily imply having more benefits, but quite the contrary.

Traders have probably seen cases of important news going against the majority of people trading smaller time frames that inevitably produce disastrous outcomes for the group in question. Forex traders using the daily chart, however, may occasionally experience some drawdown, but with the right approach and direction as well as technical skills and tools, it is more often than not only going to be a temporary setback until the price eventually returns to its previous course. Even in the case of some unfavorable news, daily chart traders only need to patiently wait out the interim periods and have a ready plan they will see through until the transition is complete. This further entails that traders are required to be prepared in advance in order to protect their trades from any major events by knowing how they will address any type of news they come across. Luckily, traders have such information at their disposal well in advance in most cases and, what is more, these events often concern only one or two currencies, further reducing their impact.

Although these events rarely affect daily chart traders, as described above, they still need to be wary of going in blindly or unprepared. By being cautious and attentive, traders will establish a firm foothold and withstand any alternating circumstances. Furthermore, they may escape a series of unnecessary yet painful losses and build on the momentum of accumulating wins rather than the opposite. To grow an account, you need to think of potential failure ahead of time because in the world of trading currencies you essentially win by not losing. If you drag your account down by taking unwise steps, allowing yourself to be compelled by any upcoming news event, you willfully and consciously engage in activities that will ultimately cost you your account and financial stability. The main benefit of adopting an observant and focused mindset, you prime yourself for success and give your account the opportunity to be much bigger at the end of the year.

An excellent example of the events requiring such a regimented approach is the times of elections when the market behaves in an unusual and uncontrollable manner. Whenever traders attempt to stay on top of those events, they eventually help banks gloat over the results. The U.S. presidential elections and Brexit are the very proof of how external circumstances and unexpected turns of events affect trading because not only did traders witness exceptional turmoil in the market but they also often had their stop losses passed. The market is not intended to act according to traders’ needs and desires, especially under such circumstances, so if you aspire to trade during the times of utter commotion, you are entering a game you cannot control. Some traders may have had some success while trading during elections, but such wins can hardly be more than exceptionally random and rare instances of gaining the upper hand. If you are ready to commit to a disciplined approach, you may need to reconsider trading elections and thus substantially reduce the risk levels.

Certain news events affect the market long term, leading to more lasting changes. When Greece was undergoing major challenges with the overdue debt burden, the European Union was weighing a decision whether to provide further assistance or refrain from lending any more money to such a greatly weakened economy. Through the course of this long period, a plethora of varying news events would suddenly come out, rendering traders confused and lost. They could not know what the news would indicate, how the market would react, or the direction EUR would take. The same scenario repeats itself every time we face any major transformation, directly affecting the market and the related currency. Therefore, the best strategy any trader could adopt in these long and unpredictable periods is to avoid trading the currencies in question. Eliminating additional risk and ignoring all pop-up news for as long as it takes for the dust to settle provides traders with real control in tumultuous times. Fortunately, with having the option of trading eight major currencies, you still have enough room to keep your account active and earn a profit in a safe and sustainable manner.

With regard to short-term events, it is always best to consult a news calendar prior to entering a trade, making it an essential part of one’s daily routine. There is a great number of events traders can ignore; however, a portion of news events has proved to trigger trading by knocking individual stop losses. NewsImpact.com, for example, is an excellent resource offering a historical overview of how prices moved when news came out in previous years. It provides into how an event that occurred two years ago may not have the same effect at present and vice versa. The impact of events can change substantially, where something traders found to be entirely unimportant before can gain importance in time. Nonetheless, what we can control and use as a relevant piece of information is the knowledge of events that historically elevated risk levels for traders, which is why understanding how each currency is particularly susceptible in a specific situation is crucial for both avoiding volatile market activity and maintaining control over one’s trades.
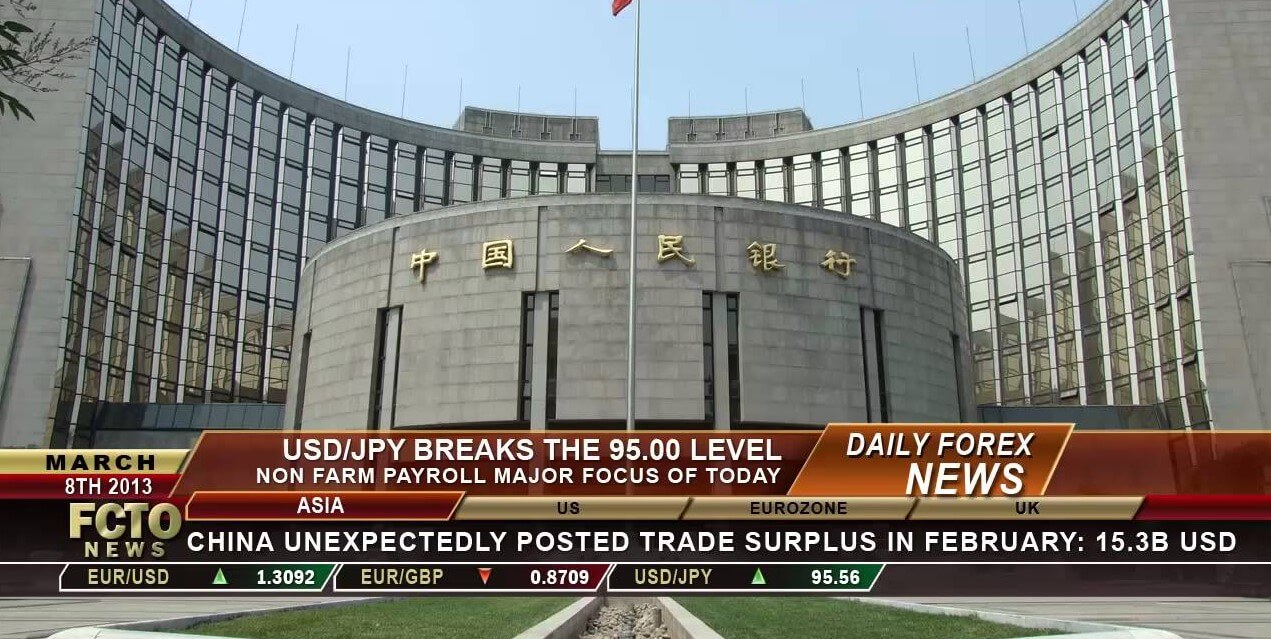
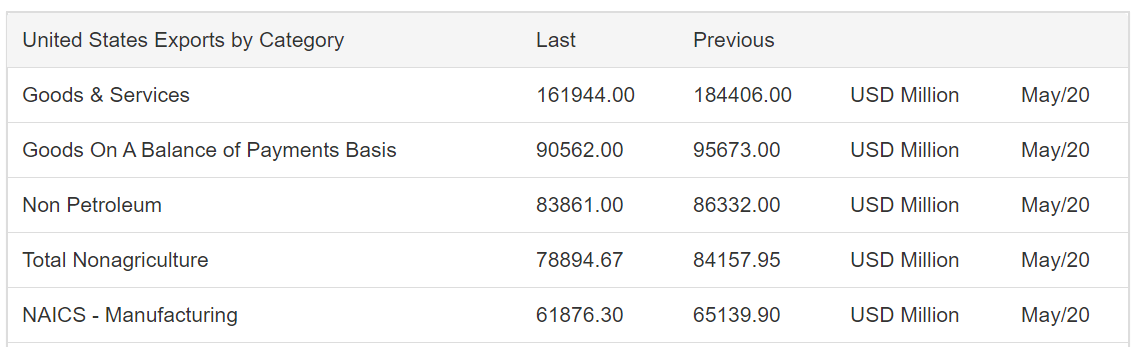
USD

The correlation between nonfarm payroll (NFP) data and the strength of USD proves how trading during this biggest news event of each month is an unwise decision, especially due to its tendency to bring about quick and erratic market activity. The circumstances involving interest rates and The Federal Open Market Committee (FOMC) also require special attention because each time interest rates rise or fall, so does the people’s interest in those currencies. Whenever there is an increase in interest rates, traders look forward to investing their money in the currencies in question owing to the potential of getting a bigger return. Likewise, in the scenario where interest rates decline, traders will inevitably search for better places to direct their money.

Furthermore, each time certain prominent figures decide to speak publicly, their words appear to have a bigger impact on the market. Jerome Hayden “Jay” Powell, the current Fed Chair, is an epitome of a public persona whose apparent disagreements with President Trump may be the source of additional concern because of the number of different interpretations people can derive. When we are assessing words, we are not dealing with any quantitative data, so the result of the manner in which the majority of people conceptualize what was said may lead to some unexpected changes the markets will undergo. From the side of quantitative factors, traders should pay attention to the Consumer Price Index (CPI), which measures price level changes, and these numbers have only recently started to have an impact on USD. As said before, the news impacting this currency may vary and change in relevance over time, but their current impact should not be disregarded.
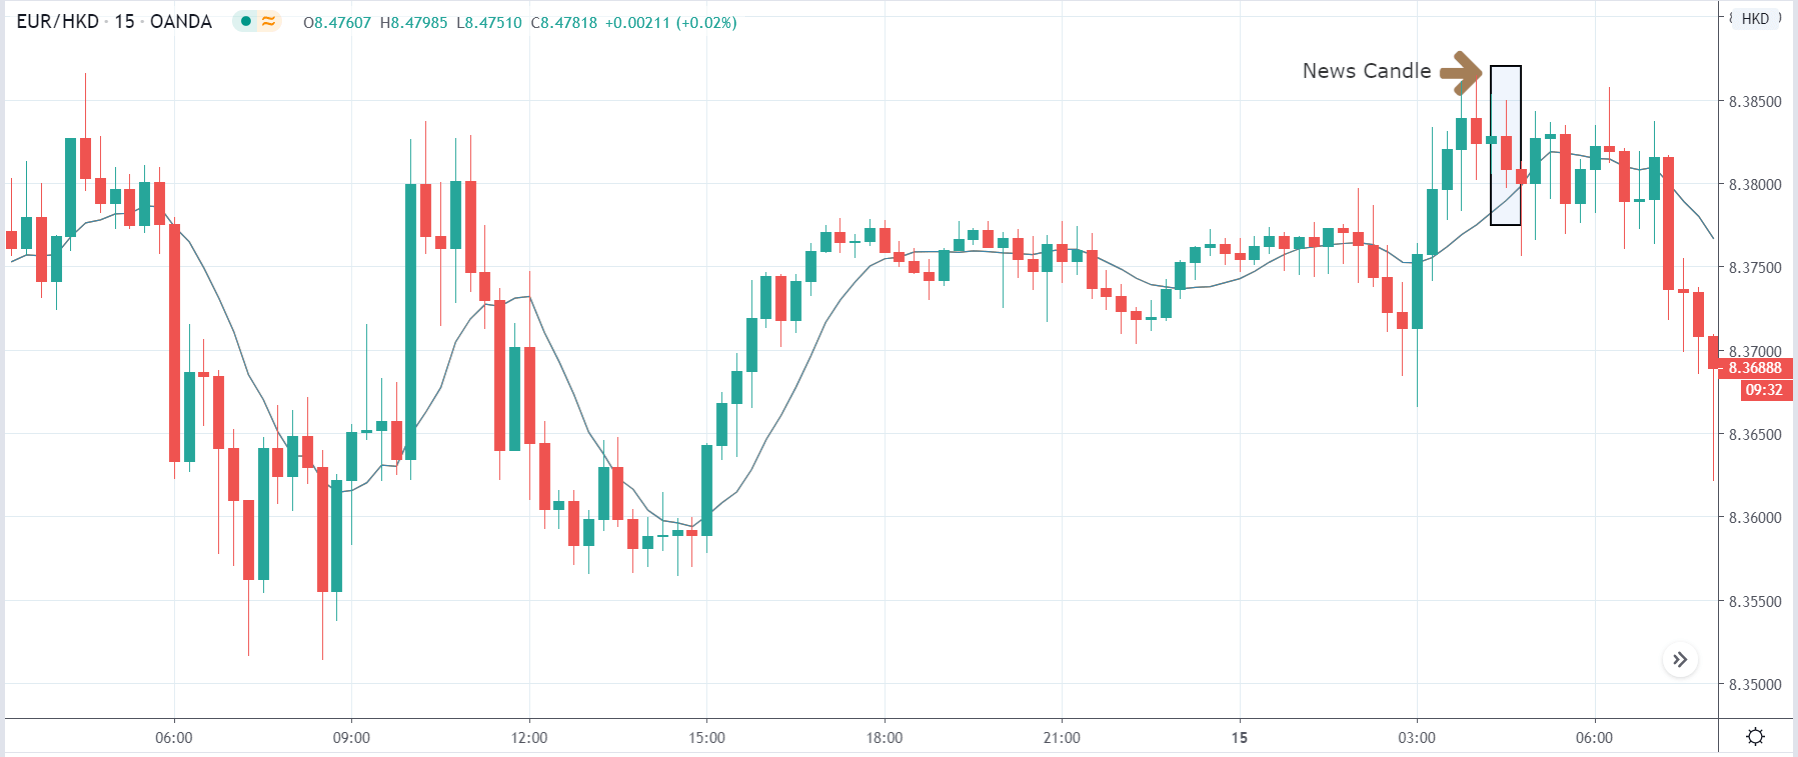
EUR

Due to the fact that this currency spans across several countries, the impact of the news is of a lesser degree than it would be in case of a currency dominating a single country. Apart from interest rates, which prove to be a common factor among all currencies, people trading EUR should pay additional attention to the news coming from the European Central Bank (ECB) because the previous President Mario Draghi’s seldom statements often caused quite a commotion with regard to EUR.

GBP

One would expect economic indicators to have a stronger impact on a country that is as small as the United Kingdom but appears to be irrelevant in this case. Interest rates in this country depend on the Monetary Policy Committee or MPC whose nine members’ vote determines the timing and the direction of interest rates. News calendars will typically disclose information of a uniform nature, where all nine members agree on the same decision. Nonetheless, should this ever change, it may cause GBP to act strangely causing traders to feel alarmed. Another important news concerning the currency is GDP owing to the fact that a country smaller in size is naturally more affected by its gross domestic product than in the case of larger countries.
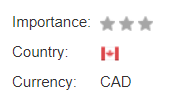
CAD

Aside from interest rates, the Canadian market has proved to be vulnerable when it comes to the employment rate, with these numbers often oscillating at the same time as nonfarm payroll which allows traders to tackle two factors simultaneously. Retail sales should be included in the traders’ assessment of the market’s stability and their next move. The last factor in terms of news events relevant for this currency revolves around CPI, whose significance has grown as of recently.
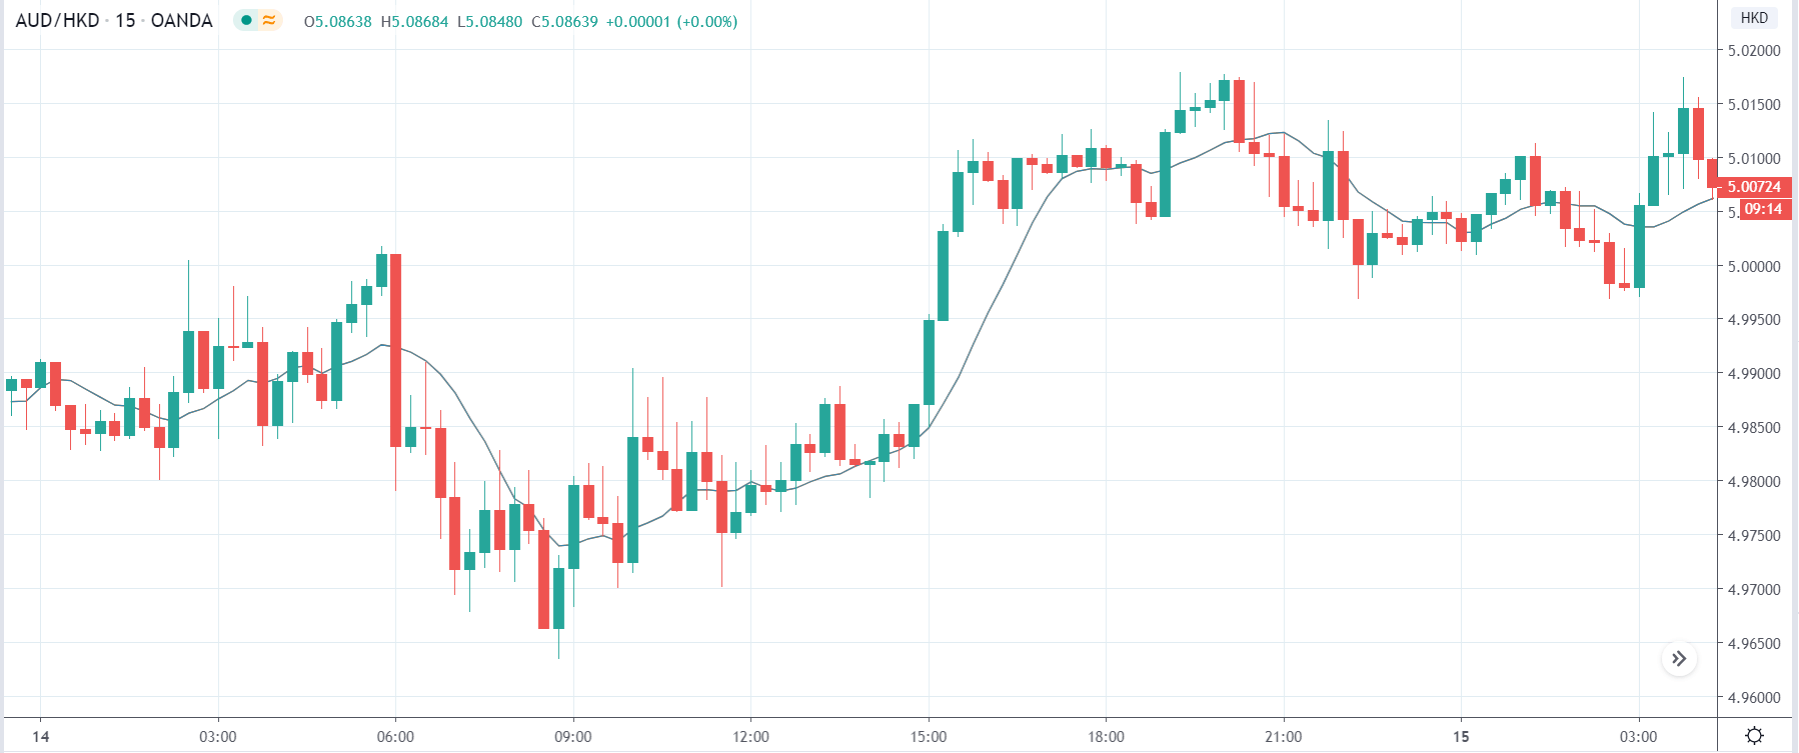
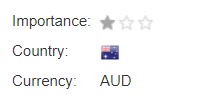
AUD

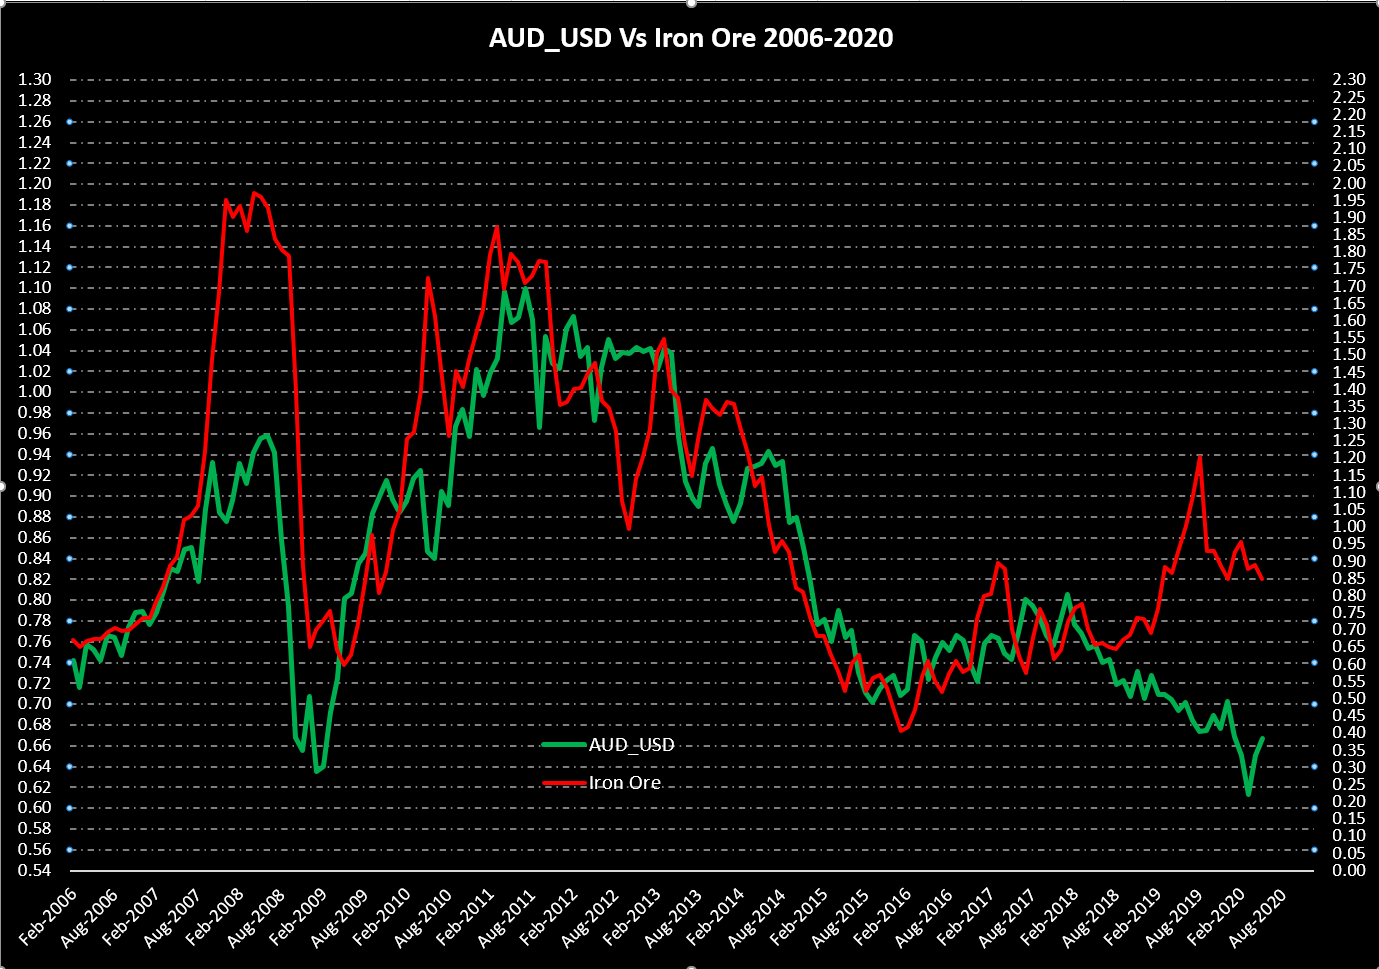
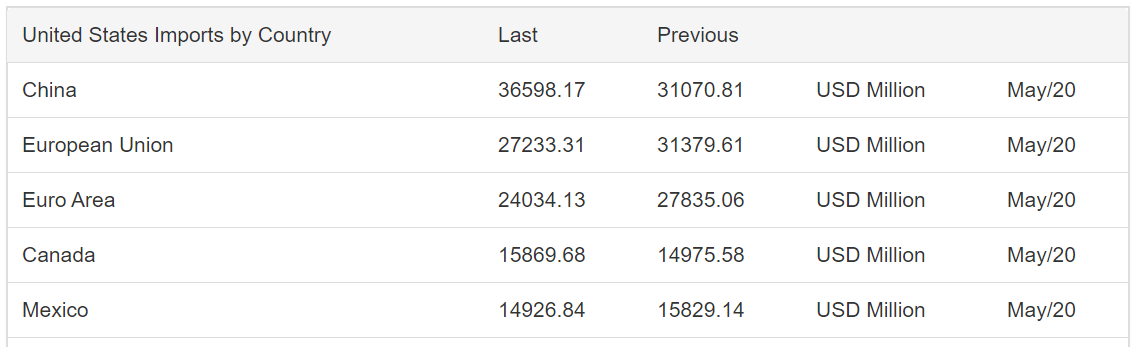
Interest rates and employment numbers also affect this currency as they do some of the previous ones. Yet, what is different about AUD as opposed to other currencies is the impact of the news coming from China. As Australia’s favored trade partner, events occurring in China would naturally impact AUD. Nowadays, however, due to the fact that the Chinese economy has subsided in the recent years, they are not going to buy as many minerals and materials from Australia as before when the country was in the building stage, which lessens the overall impact of news events originating from China on AUD.

NZD

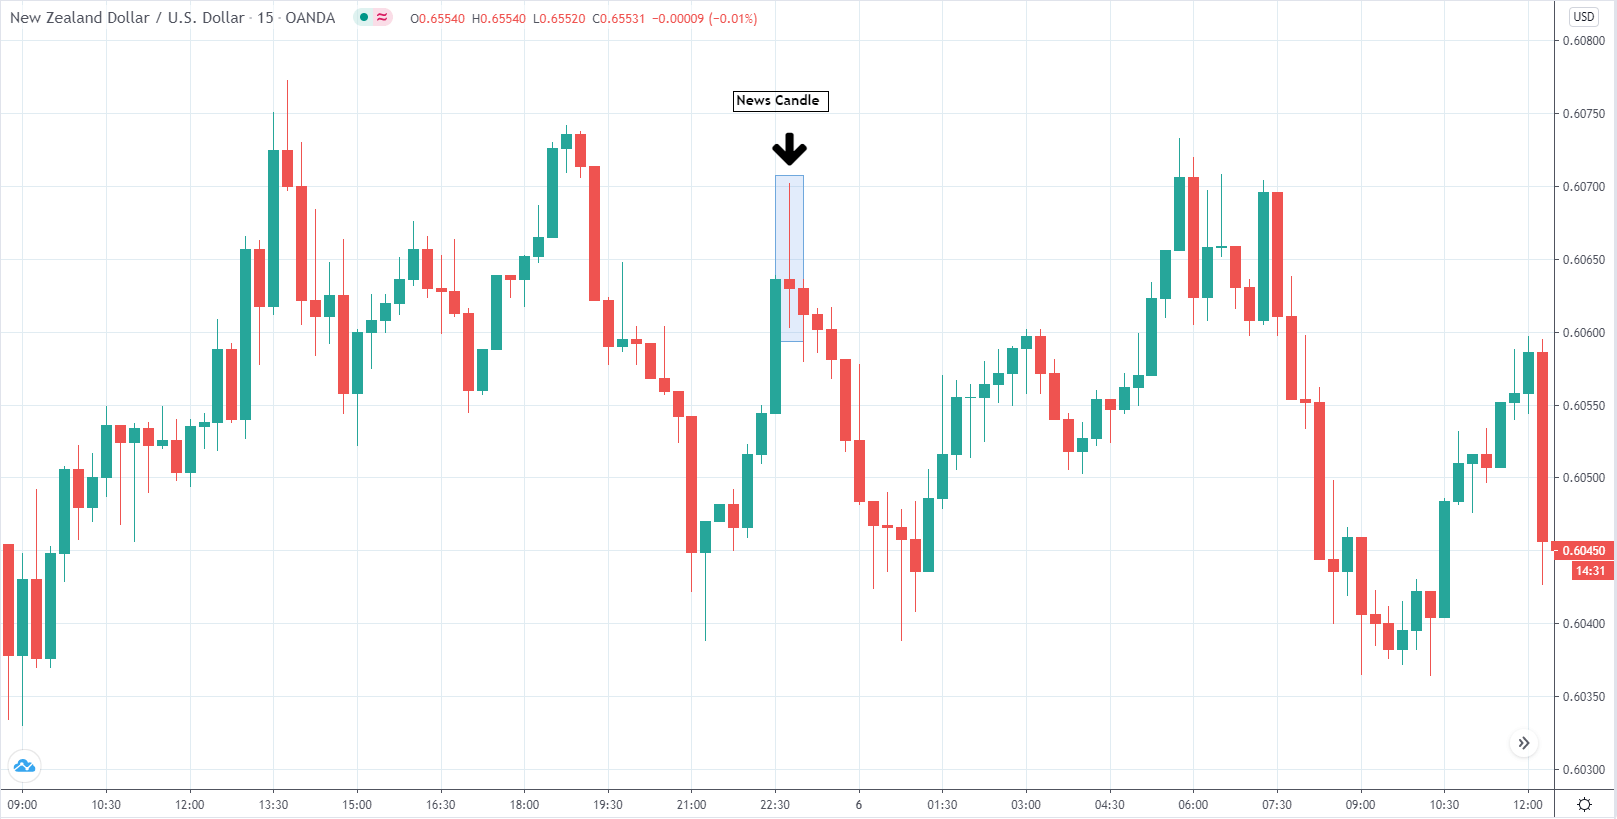
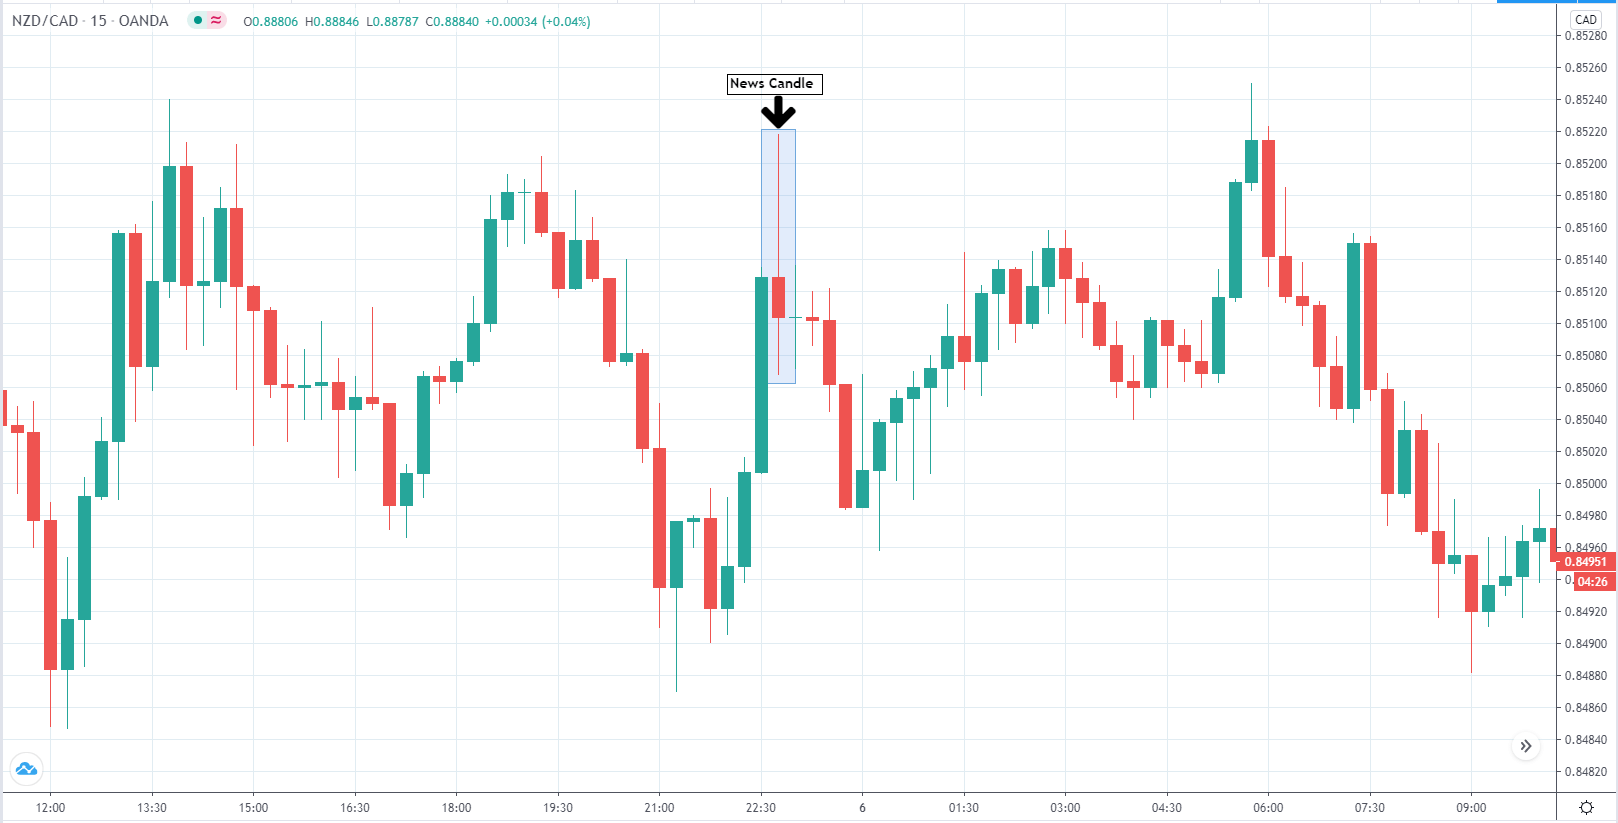
New Zealand’s currency is affected by a number of factors discussed above, such as the employment rate and GDP. However, we also need to introduce GDT, global dairy trade, as dairy does constitute an important part of the country’s economy. Therefore, whenever the news of GDT comes out, it naturally makes a difference in the market of the Kiwi dollar. It is important to remember that some news calendars may not detect or disclose this, or any other piece of information for that matter, which further entails that you may need to consult several news calendars (consider the previously-mentioned options) in order to put together the complete picture. Interestingly enough, interest rate appears to not have had a major impact on the currency in question in years, which certainly does not indicate that it will not become an important factor once again in the future.

JPY

One of the last two currencies which seem to undergo little impact of news events is JPY. As with NYD, the Japanese currency has also not seen any activity worth mentioning in terms of interest rates since they seldom change, but they may pose a threat in the future when they do. Luckily, it a single piece of news that comes out only once each month, which does make it easy for traders to monitor and detect any news-worthy changes.

CHF

The Swiss currency, similar to the ones before, may one day start depending on the fluctuations of interest rates, named the London Interbank Offered Rate or LIBOR in Switzerland when traders are advised to sit out and patiently wait for the currency to stabilize.

While we have analyzed the main news which may have an impact on the major eight currencies at present time, you may come across other news events as the nature of the market is to always grow and change is naturally an inherent part of such growth. We also need to mention that both banks and people trading in the currency market can choose how they will react regardless of individual expectations and/or needs. The example of the 2019 flash crash should serve to teach traders a lesson that even if we know some information in advance like we knew how Apple sent out a warning concerning the Chinese economy, big banks still allowed the market to go into a craze. News, be it small such as this one or a more sizeable piece of news, can at times stop traders. However, we need to accept it as an integral part of the forex market and decide to move on. While there is a vast number of aspects to trading currencies traders cannot control, what they can in fact do is devise a plan that will serve to protect and support them on their path of growing accounts and finances.

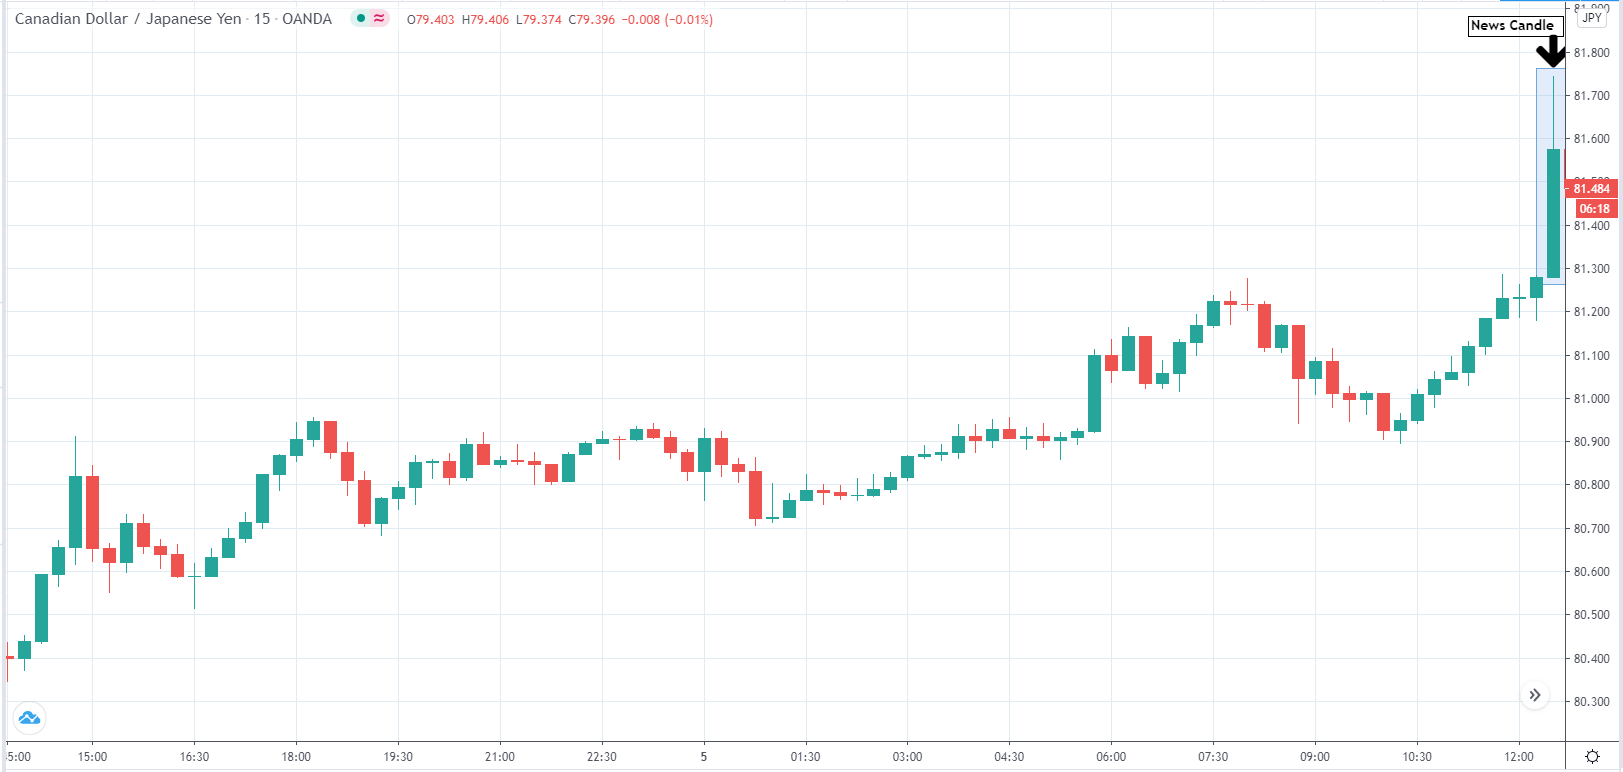
For every news event coming out, each trader should be mindful of the available steps he/she can take so as the secure the best possible position at the time. If, for example, traders are not trading a specific currency pair while receiving some important news, they are advised to refrain from entering any trade involving the currency in question should the news event be occurring within the following 24 hours. If there is a possibility of securing any candles prior to the time frame we have just mentioned, you may freely do so. As long as the trade falls under the period of one day, you are entering the market at the risk of endangering your finances and your account at the same time. This rule will surely introduce more control over news events and limit the urge to trade recklessly, thus providing the necessary stability all people trading in the spot forex market should strive to ensure.

If the news event, however, involves the currency you are trading at the time, you will be able to apply a few different strategies depending on the stage of the trade you are in. In case you are in a trade where you are slightly losing (e.g. 50 pips), but your stop loss has still not been hit, and a big news event is about to take place within the 24-hour period, you will need to exit the trade so as to protect yourself. Taking such loss may be difficult, but considering the fact that by staying you would in fact be open to facing an even bigger loss, this option is the safest it can possibly be. While it may not happen very often, you do not have to get yourself to the stage where the price passes your stop loss without having been triggered. Hoping that the price will go back your way immediately involves too much risk and the cons are simply incomparably higher than the pros. The only way to eliminate a risk this big is to close these trade because the likelihood of your account recovering afterward could be highly questionable otherwise.

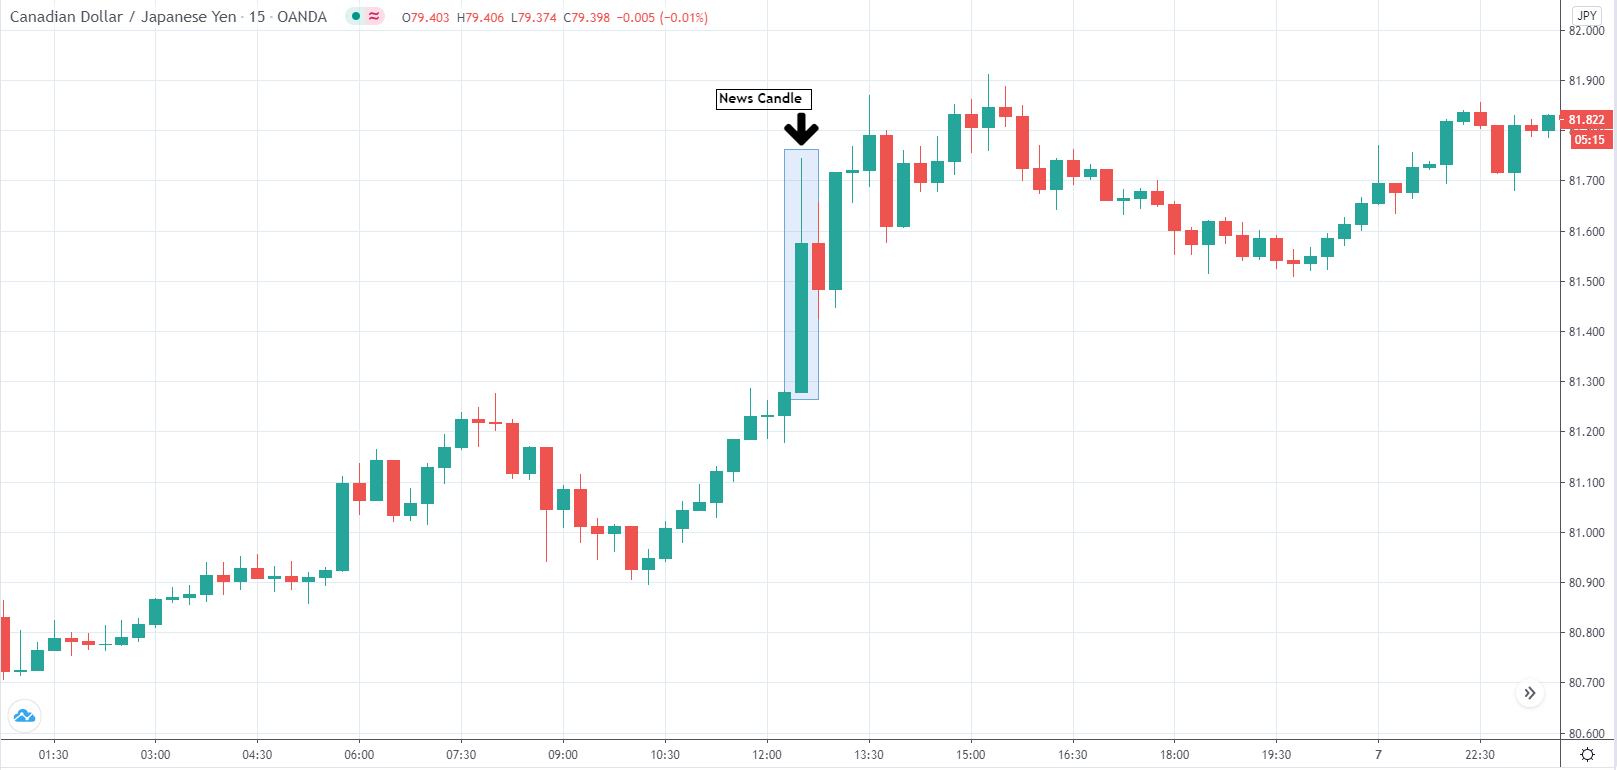
If you have entered a trade that is now winning, there are several important facts you should take into consideration. Firstly, regardless of the fact whether you have already taken any profit, using the ATR indicator as your take-profit point is always advised. We can typically see two scenarios unfolding in this case: either a trader has entered a trade but no profit has been collected yet or they have already taken some profit off the table but the price is now falling. In either case, there is only one solution that will mitigate the risk that comes from trading under the impact of an upcoming (or very happening) news event. The only solution here is to take whatever profit you have made so far and exit the trade at peace. There will surely be people who earned a big profit during the time of an important news event, but what this approach is about is limiting the losses. If a trader was lucky enough to go unharmed once, the same circumstance may not play out again which is why this risky approach is then not your best long-term strategy. Even if a trader chooses to move their stop-loss to the break-even point, the odds of a stop-loss being taken out under such circumstances are higher than they may realize. Whatever preventative measure you think you have included in your trade does not truly mitigate the risk, which is why exiting such trades is the only logical and safe solution.

The very last context we will be analyzing today concerns trades that have already scaled out and are still winning. If you have taken your profit at the ATR value, for example, and you are satisfied with how the trade is progressing, you should carry on as if it were any other normal circumstance despite the big news event approaching. You have probably moved your stop-loss point to the break-even or you are relying on a trailing stop, so there is no need to include any other measure at this point. This scenario has several benefits starting with dealing more pips due to trading the daily chart. Moreover, there is a chance that the price does not hit your trailing stop, but keeps moving in the desired direction even further instead. Be it this best-case scenario or a somewhat different one, your trailing stop will always provide the protection you need under these circumstances. Regardless of which scenario you get to experience among the ones discussed in this article, you should always assess the risk levels and take any preventative measure you can so as not to end up where the majority of traders do.

Finally, the notion of going against the big banks is a losing game and the game which will inevitably, sooner or later bring about massive failure. Your job is not to play the game where everyone is meant to lose, but to navigate around the challenging circumstances the best you can. Recognize the repetitive cycles and acknowledge the news events in a rational, non-compulsive fashion. Learn how to read through the news and understand how some events will take months to fully play out, along with taking a number of traders off the trading scene. Whenever you notice the tension building up in the market, the best strategy is to simply be patient and wait for the turmoil to pass. You cannot predict how any participant in the market is going to react, which is why getting involved in any of the events you cannot control is a risky decision. Use wisely the knowledge on the events you should consistently avoid and keep researching the market and the currencies in the context of the states they govern.

Include news calendars in your daily routine and adopt a healthy, sustainable action plan which you can call upon at every trade stage or in any circumstance. Whatever action you are planning to take, you should always rely on the system you developed because it will provide you with technical support this line of business heavily requires. Lastly, while the effect of having such a comprehensive approach to trading may not help you see any immediate results, by the end of the year your account will provide transparent and tangible proof of how having a structured plan supported by technical tools and factual knowledge always leads to success.

Categories
Beginners Forex Education Forex Economic Indicators

Does a Recession Have an Impact on Forex?

Times change, politics change, economics change, and how do deal with those changes means everything. This phenomenon is not related directly to forex trading but it might be crucial for our long-term success and overall development as forex traders. We need to set us up to succeed and be far more prepared for the problems than anybody else. We want to be equipped if and when the next economic collapse comes. The longer we wait the worse is going to get, and we simply need to have some kind of a plan, we need to know what very next step we are going to take. Good thing is that there is always a way to overcome obstacles but surely there’s a lot more to this.

Trading experts agreed on one, forex is recession-proof far more than any other investment we know. No one can truly forecast of how the economic landscape is going to look like but if everything goes south we need to play defense based on our trading knowledge. Especially nowadays when almost everybody is playing offense because we are in the biggest economic rally in recorded history. Our goal is to change our mindset and start to be proactive now instead of being reactive when the problem is already on our doorstep. So how are we going to play defense? The first thing we can do is not to overpay our taxes, we want to keep them legally as low as possible, secondly, keep your precious metals close to you, make sure your money is disposed to a different place.

These are some of the ways of how we can stay solvent, this is how we might stay alive where everything goes south because the next economic collapse will come, don’t doubt it, it would be a miracle not to happen. From this perspective, we can put ourselves in a position where we can play offense and investing when everything out here is super cheap, like real estate, stocks, etc. These are all good things to do in general but they might be great if the next crisis comes. It could be a perfect way to stay protected and take advantage of the economic downturns when the time comes. The last thing we want to be is a helpless person who complains because they lost their job due to the recession, and how the costs of living are high.

The better option is to try to be in control of our destiny. Educate yourself on economics, be dedicated, and focus on details. One of the better economic minds from which we can learn a lot is Ray Dalio, he was explaining how recessions are cyclical, how we actually need them, and how they are supposed to happen every so often. Because we borrow money through credits, we have cycles.

This isn’t any due to law or regulation, it’s simply in human nature and the way the credit works. If we want to buy something we can’t afford, we need to spend more than we make, we do that through credit. Basically any time we borrow we create a cycle. We can explain cycles through debt. ‘Debt allows us to consume more than we produce when we acquire it, and it forces us to consume less than we produce when we pay it back’. All of you people out there, try to remember the sentence above. Debt swings occur in two big cycles. Statistically, we need about five to eight years for the first cycle and about seventy-five to one hundred years for the second cycle. While most people feel the swings, they typically don’t see them as cycles. Day by day, week by week life goes on, and big wheels of the economy are shifting gears.

The reality is that most of what people call money is, guess what, credit. For example, the total amount of credit in the United States is about seventy trillion dollars, and the total amount of money is about five trillion dollars. As a result, an economy with significant potential in credit makes us spending more, which can cause over-consumption that can’t be paid back. So if the cycle goes up, it eventually needs to come down. It is important for us not to forget these fundamentals because they can help us in making the right decisions. So don’t have your debts rise any faster than income because your debt burdens will eventually crush you, don’t let income rise faster than productivity because you will become uncompetitive, and most importantly do all that you can to raise your productivity because that is what matters the most.

Trading one currency against others we need to be careful, because The United States dollar may not be the safest place to be during the next economic breakdown like it was back in 2008. Peter Schiff said as well that The United States dollar is not the safest currency like before and that it might collapse, so we all need to take a serious precaution to protect ourselves and our accounts. No matter how bright the situation is or no matter how bad it gets, we need to gain the comfort of not having to worry about losing our jobs and incomes just because the economy is falling apart. We don’t want to be dependant on what markets say about the values of some goods. Forex trading is different, that is why we are in advantage. We are trading one currency against others, it is unique and different. So is it forex trading recession-prof? Probably yes. Are we recession-prof? Certainly not.

Here’s what we can do, if we have all our physical money in Canadian dollars or Australian dollars we should consider turning some of those dollars in other currencies, like Euro, Swiss francs, Chinese yuan, or The United States dollar. Apart from bank accounts, most financial experts and traders are keeping their wealth in precious metals as we mentioned. Hopefully, if things were to ever go pretty bad, we would have a chance to stay protected, and we will be ok.

Note that this also means if your forex trading account is in the USD, for example, consider diversifying into other currencies, or even better mix asset categories. Your portfolio should consist of several layers of diversification, by type and category. Pay attention when is the best time to invest in Gold, Oil, various currencies that escalate, or that have stable economies behind. You should also pay attention to the risks each asset carries, for example, crypto and new company stocks might be the least present in your portfolio and Gold the most. This structure is common with the most successful investors such as Warren Buffet, they have risky assets in case they skyrocket, but also have assets that do not have high probabilities of dropping too much in value.

Categories
Forex Fundamental Analysis

Minimum Wages – Understanding This Macro Economic Indicator

Introduction

Minimum Wages are essential for protecting citizens and ensuring that everyone gets a fair share of the fruits of the progress made. Minimum Wages act as the foundation for everyone at the entry-level to compete equally to the top. Minimum Wages are used by a majority of the countries across the world. Understanding Minimum Wages and its importance can help us better understand improvement in people’s living standards over time alongside the country’s economic growth.

What are Minimum Wages?

The International Labor Organization (ILO) defines Minimum Wages as “the minimum amount of remuneration that an employer is required to pay wage earners for the work performed during a given period, which cannot be reduced by collective agreement or an individual contract.” It is the least money paid out for work as a wage over a given period. It cannot be lowered by mutual understanding nor through a legal agreement. Hence, it is the lowest remuneration that an employer can give their employees.

The Minimum Wage can be set by a statute, wage board or council, competent authority decision, industrial or labor courts, tribunals, or law enforced collective arguments. Most countries had introduced the Minimum Wages by the end of the twentieth century.

Minimum Wages initially started off to stop exploiting workers in sweatshops (places with unacceptable working conditions, potentially illegal and dangerous). Owners at such places generally had dominion over that workplace and people working. But later on, it became a means to help uplift the lower-income families. Minimum Wages were first incorporated by New Zealand in 1894, followed by many other countries gradually.

How can the Minimum Wage numbers be used for analysis?

Minimum Wages acted as the price floor beneath which a worker may not sell their labor. The purpose of Minimum Wages is to set a barrier to exploiting the labor force through unduly low wages for their work. It will ensure a just and equitable way of distributing the returns on the progress made collectively. It will also ensure people receive the money required to sustain a living and act as legal protection for people who need it.

Minimum Wages are also used as part of a policy to eradicate poverty. It also helps curb inequality amongst employees based on age, sex, or race for the work of equal value done. Minimum Wages also acts as a floor for wage negotiations and collective agreements. Any negotiation always has a legal and reasonable base, only above which all negotiations can take place and shall not fall below it.

The effect of increasing the Minimum Wage had a negligible impact on the employment rate in general. Still, cost-cutting in other sectors and the profitability of the company become vulnerable. Minimum Wage level adjustments are deemed to be made from time to time, meaning whenever the board feels it is needed based on the cost-of-living indices. Most countries adjust their Minimum Wages yearly, some do on a six-month basis, and some do it on a two-year basis.

Inflation and Cost-of-Living fluctuations erode the purchasing and protection power of the Minimum Wage. At such times, unscheduled interventions become essential to keep protecting the labor force.

Fixing Minimum Wage too low defeats the very purpose for which they were set and too high creates a significant impact on employment, worsening the situation. Careful and objective decisions have to be made to set and adjust Minimum Wages periodically as per economic conditions.

Setting too low could constrain consumer spending, which is terrible for the economy as it fuels the GDP. Setting too high could trigger inflation on subsequent levels, hurting exports, decreasing profit margins, and reducing employment.

The ILO deems the following three economic factors to take into account to set Minimum Wages: economic development requirements, productivity levels, and desirability of achieving and maintaining high levels of employment. All the factors are correlated and have to be set to optimize all three economic factors.

The ratio of Minimum to Average Wage is also used to understand wage inequality among laborers within an organization. In developed economies, Minimum Wages generally range 35 to 60 percent of the Median Wage. In developing economies, the percentage is even higher, indicating higher-level workers are relatively underpaid. Minimum Wage at aggregated levels classified based on regions can also help central authorities to identify lagging states or regions, where the standard of living can be improved and economic backwardness eradicated.

Images Credit: International Labour Organization

Impact on Currency

Minimum Wages changes are often annual and do not have an impact on currency markets as it pertains to a particular section of working-class people. Minimum Wage is a low impact lagging indicator and does not deem any importance in the currency markets.

It is useful for central authorities and vulnerable workgroups to raise their living standards and maintain economic equality. When everyone is treated justly in terms of wages, economic growth is not crippled by exploitation and discrimination.

Economic Reports

In the United States, the Department of Labor enforces the Fair Labor Standards Act (FLSA) and sets the Minimum Wage and overtime pay standards. It is enforced by the Department’s Wage and Hour Division. Annual revisions to the same are made and announced, if any.

Sources of Minimum Wages

  • Minimum Wage details set by the Department of Labor is available here.
  • The OECD also maintains the same as Real Minimum Wages.
  • Consolidated reports of Minimum Wages of most countries can be found on Trading Economics.
  • We can find guidelines on setting the Minimum Wage and various nuances associated with it on ILO.

Minimum Wages Announcement – Impact due to news release

The Minimum Wage is an employees’ base rate of pay for ordinary hours worked. It is dependent on the industrial policies that apply to their employment. Employees cannot be paid less than their Minimum Wage, even if they agree to receive it.

Every year, the work commission reviews the minimum wages received by employees in the national workplace system and then submits it to the government’s labor ministry. Looking at the suggestions mentioned, the government increases the minimum wages for workers of the nation. Minimum wages have little impact on the value of a currency as it does not considerably affect the industrial output and the economy.

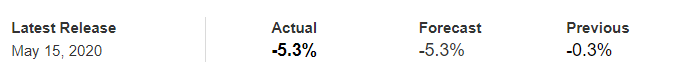
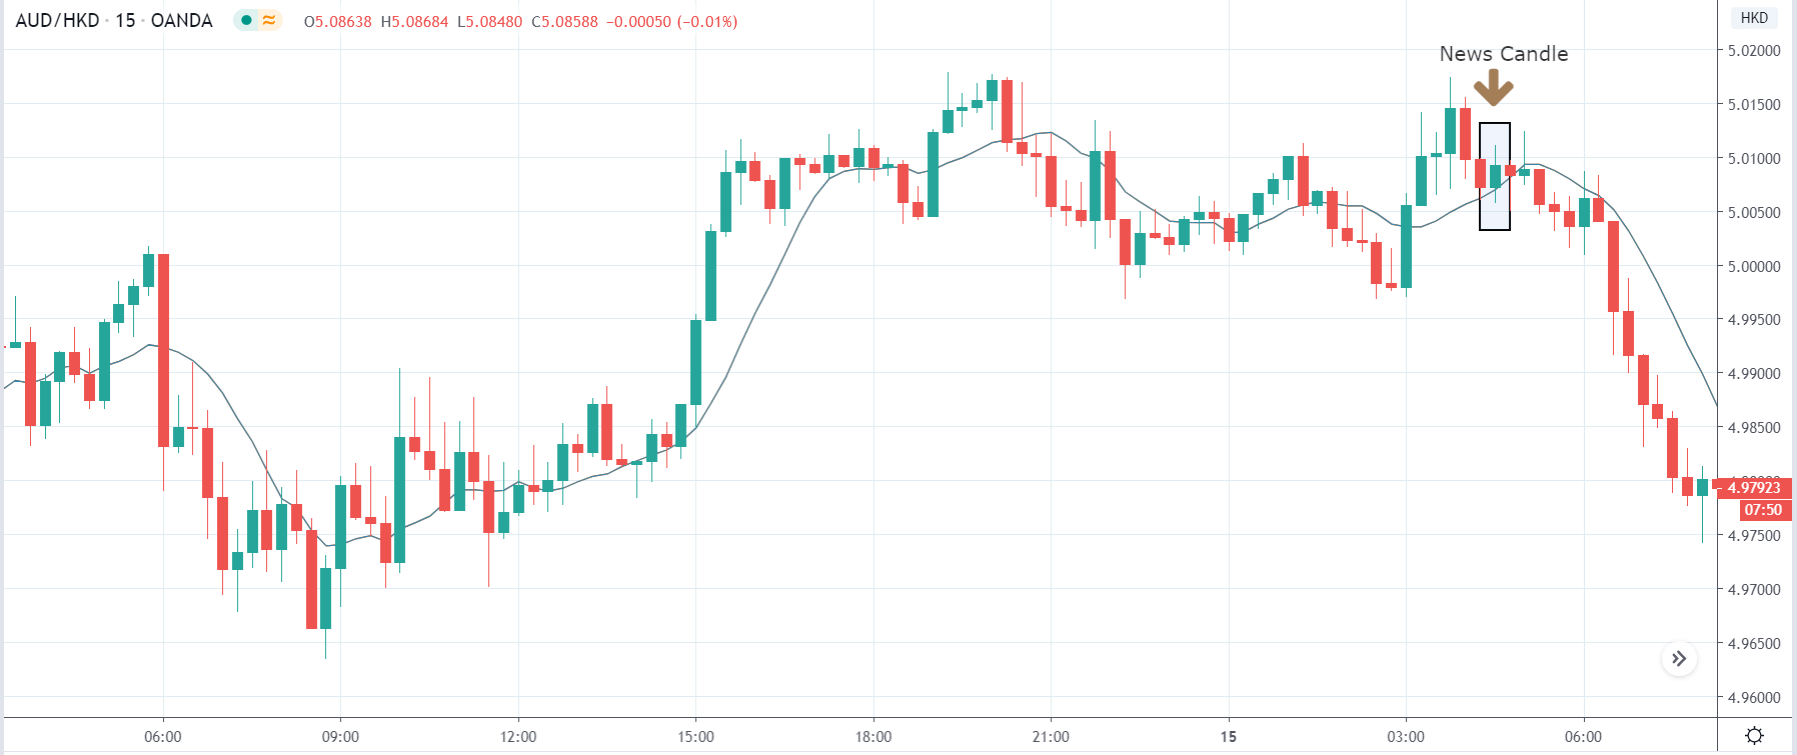
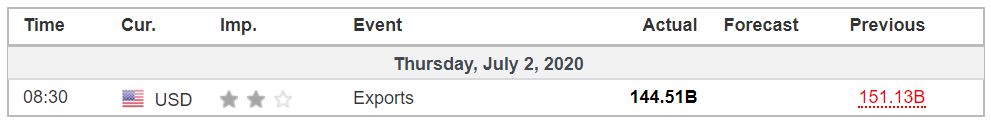
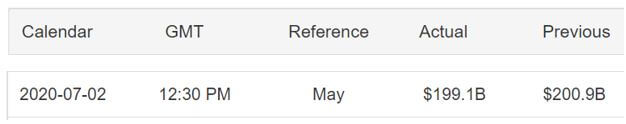
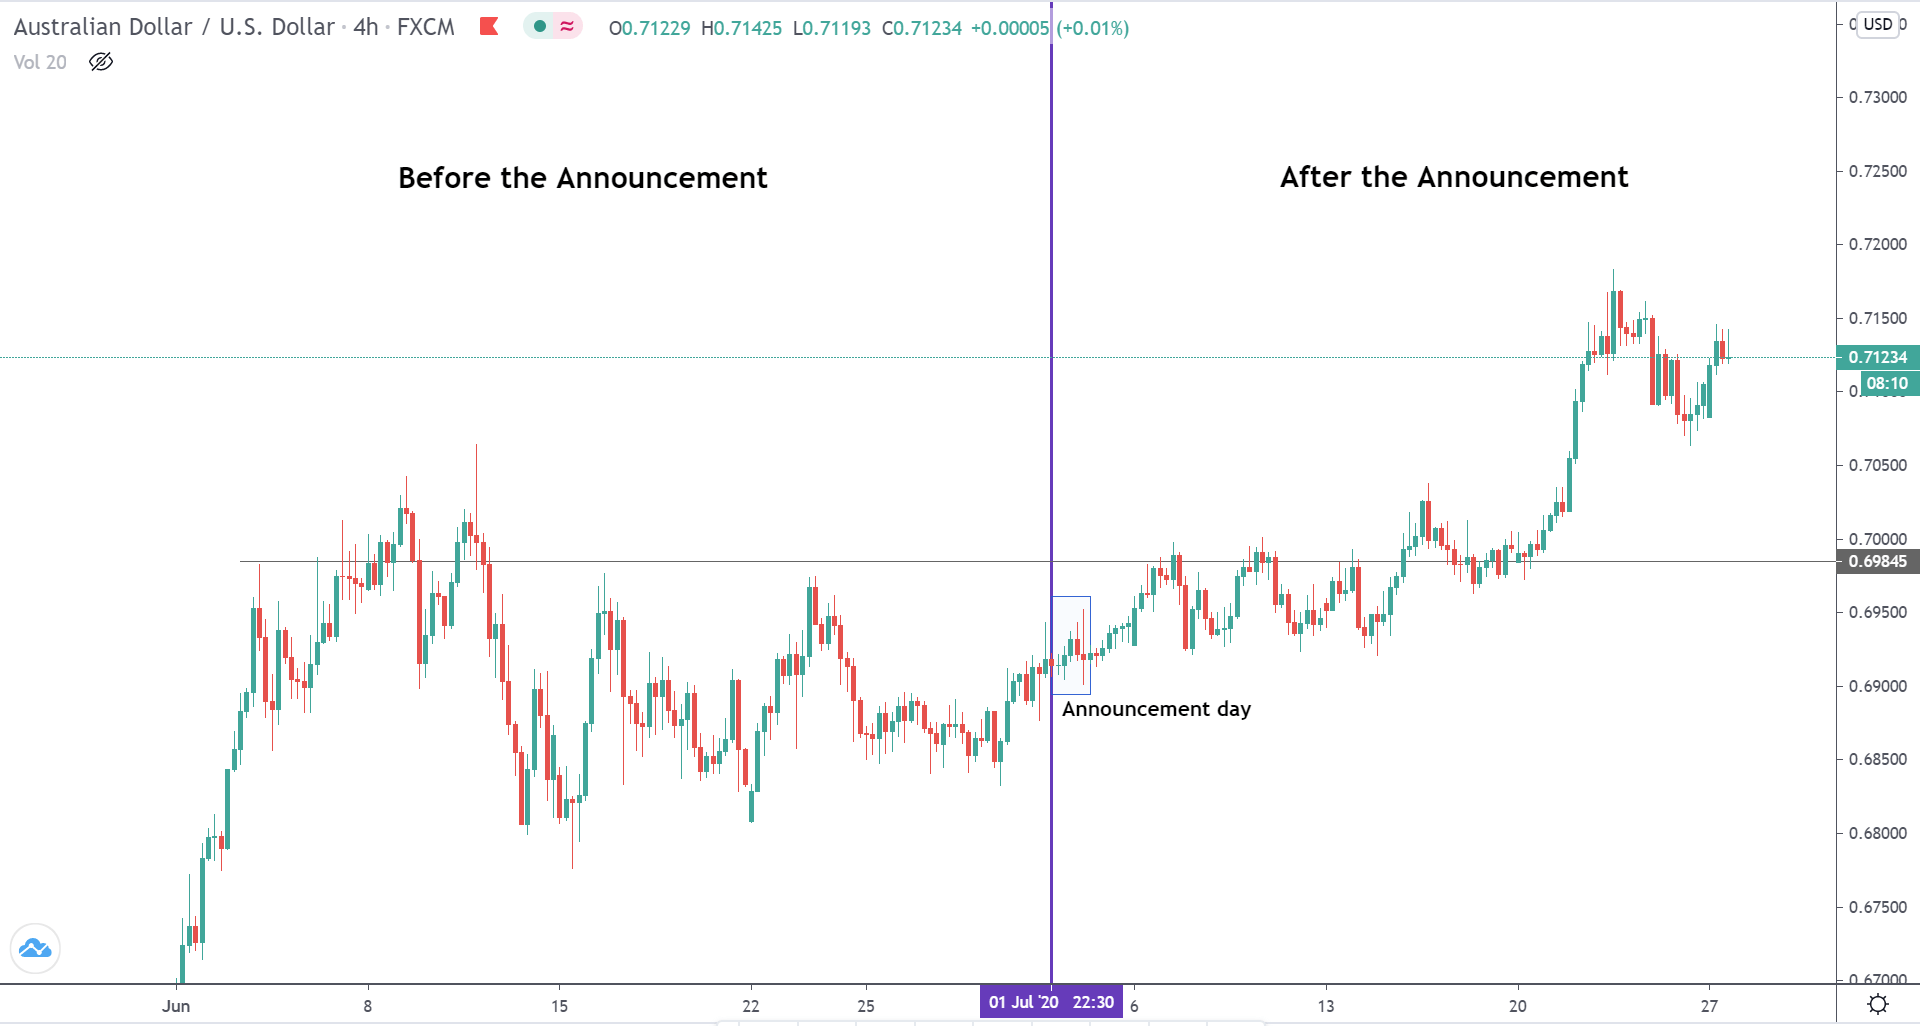
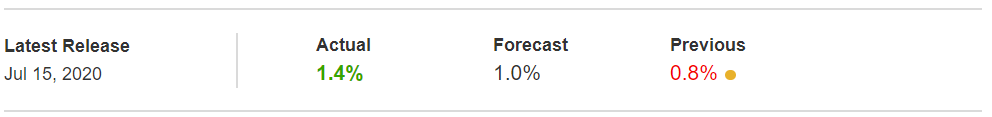
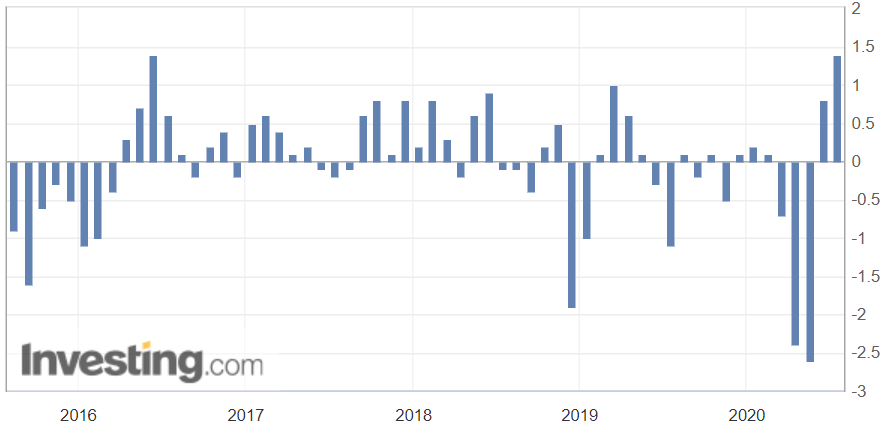
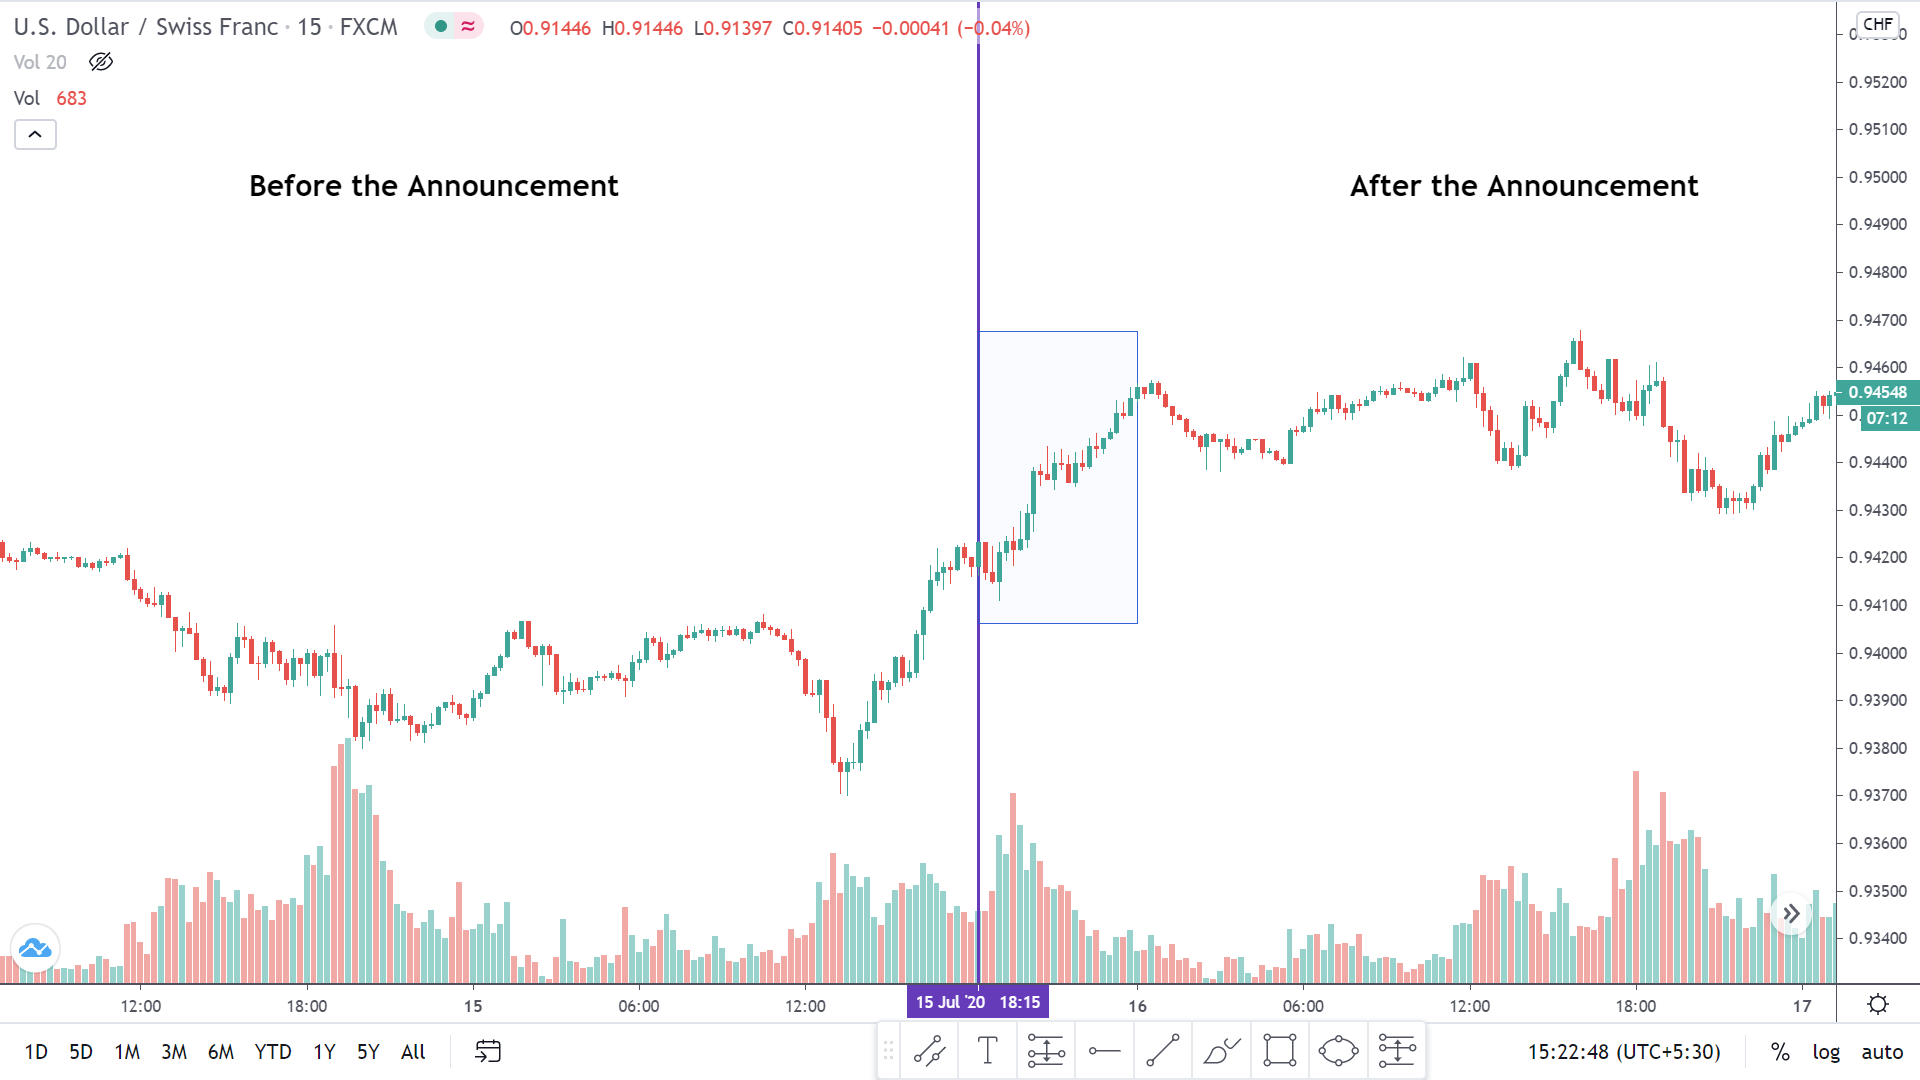
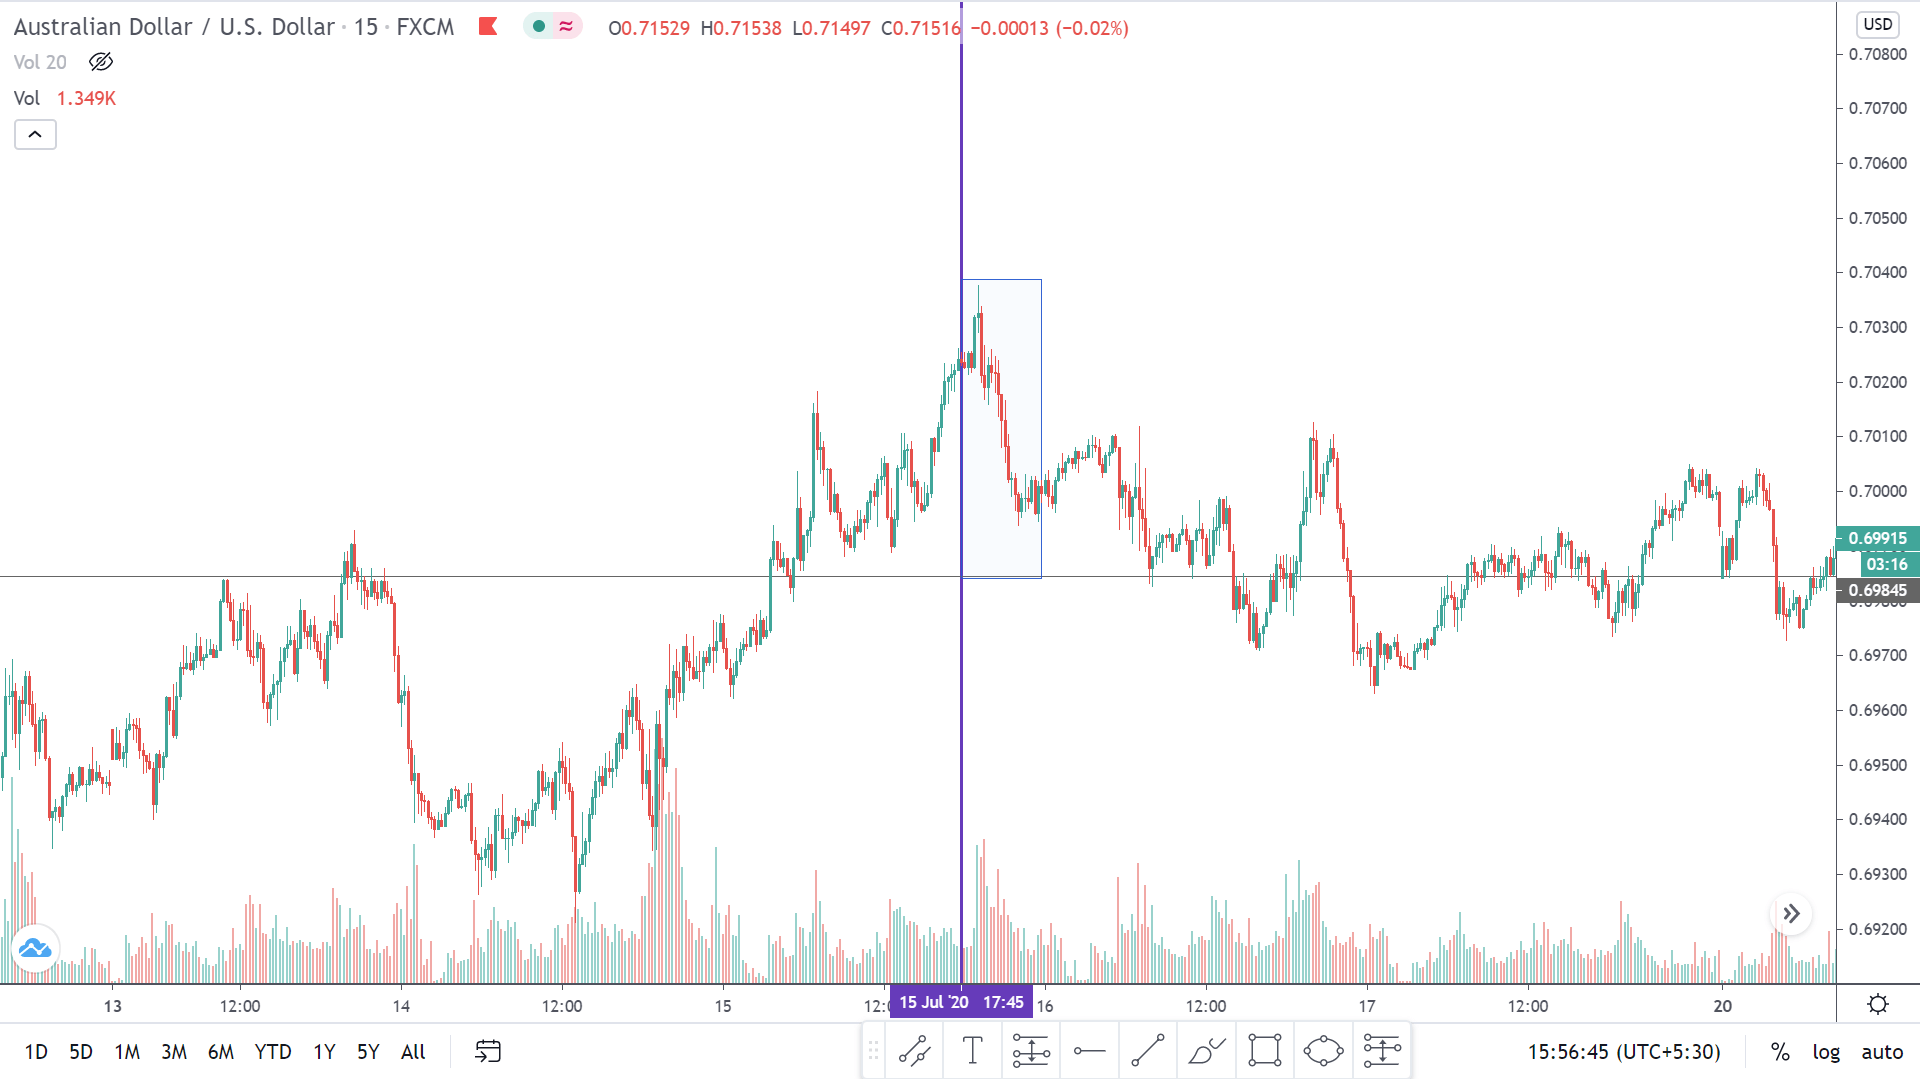
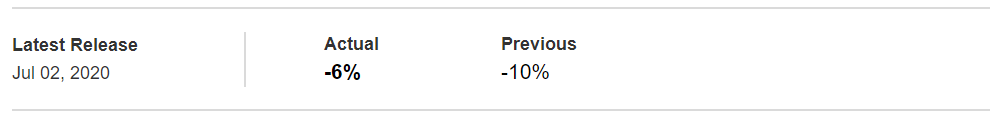
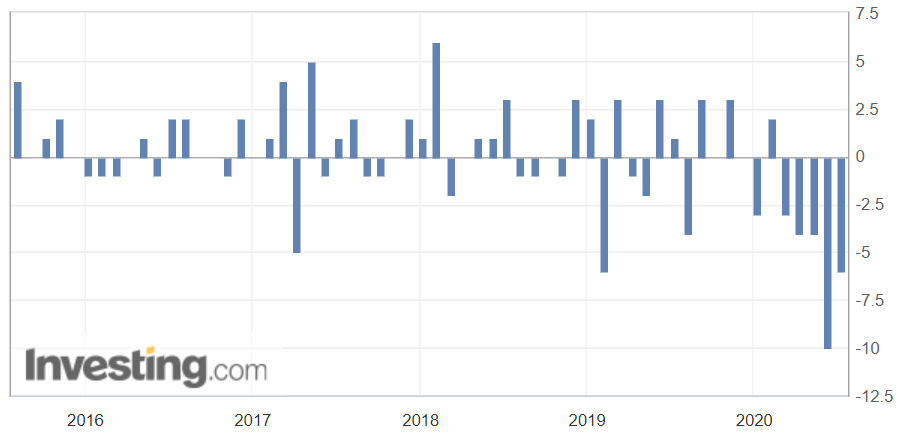
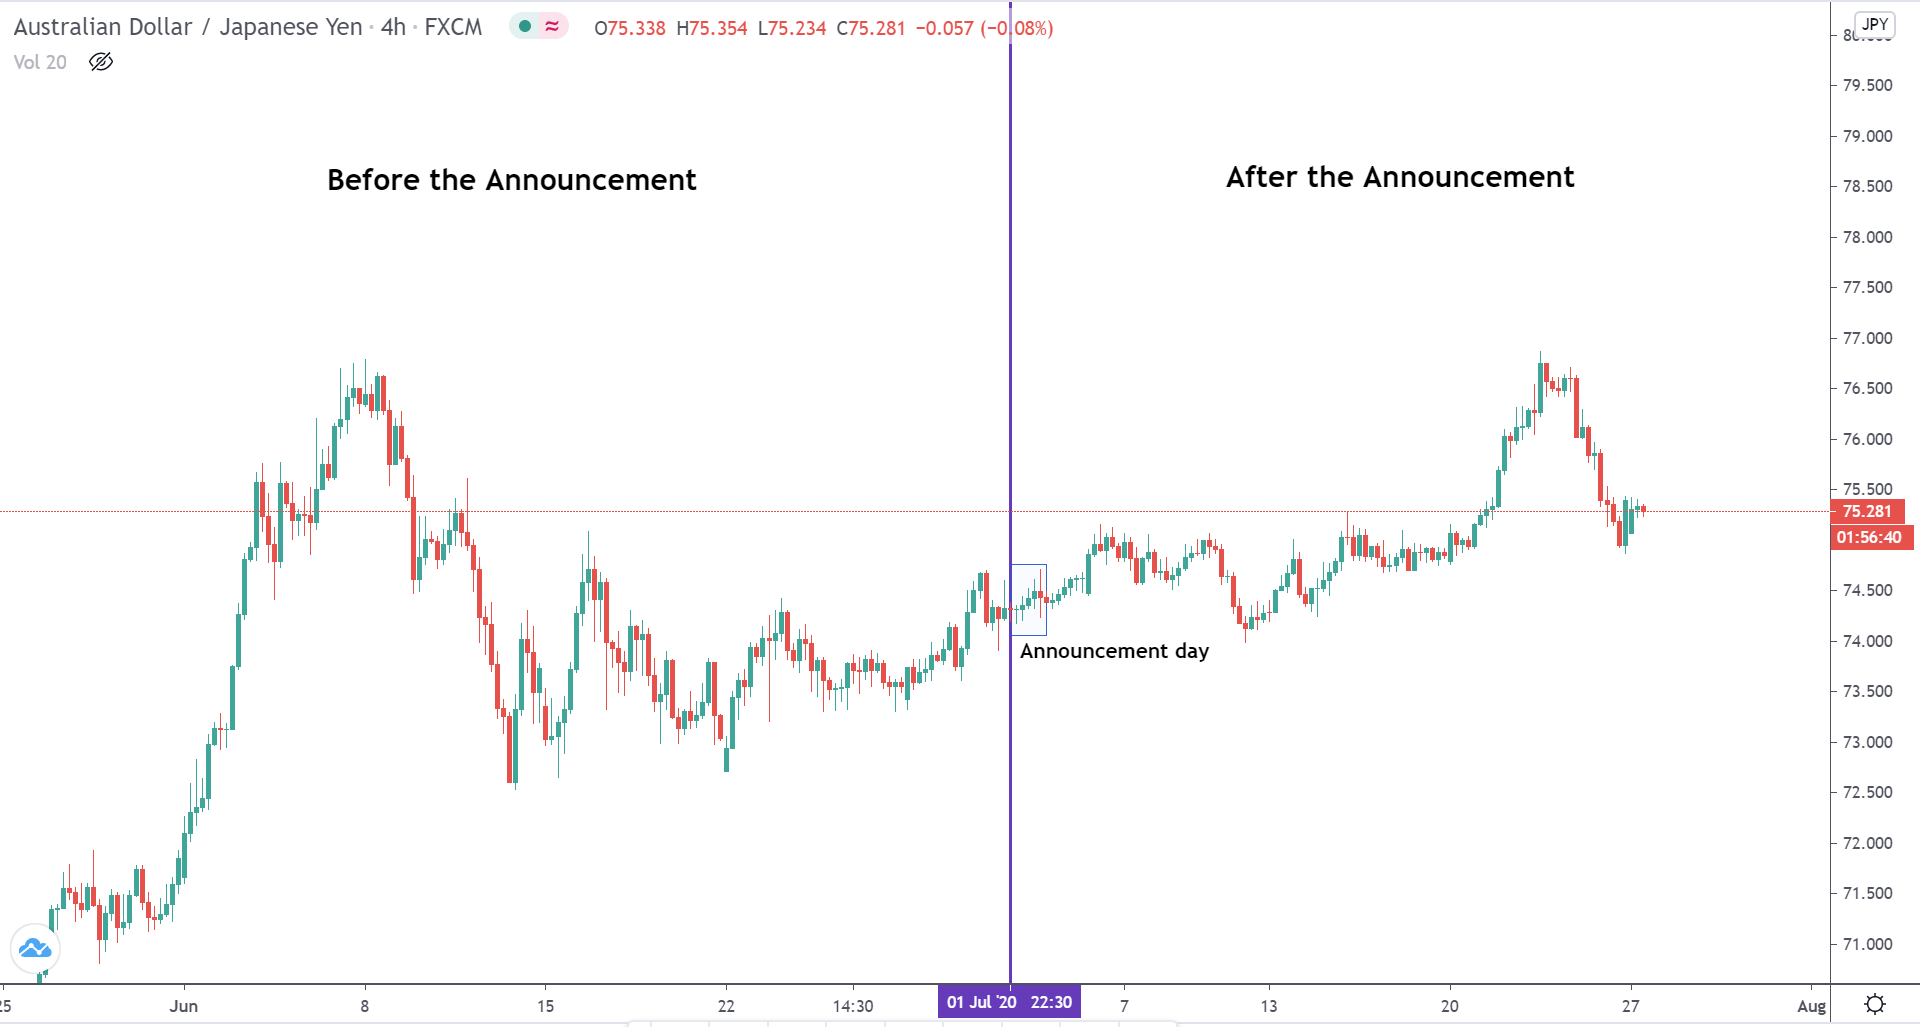
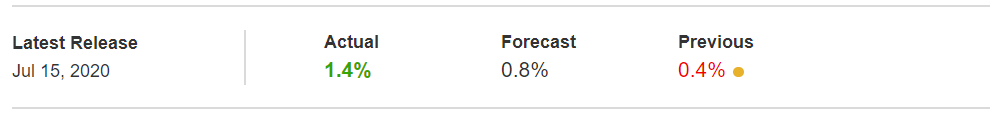
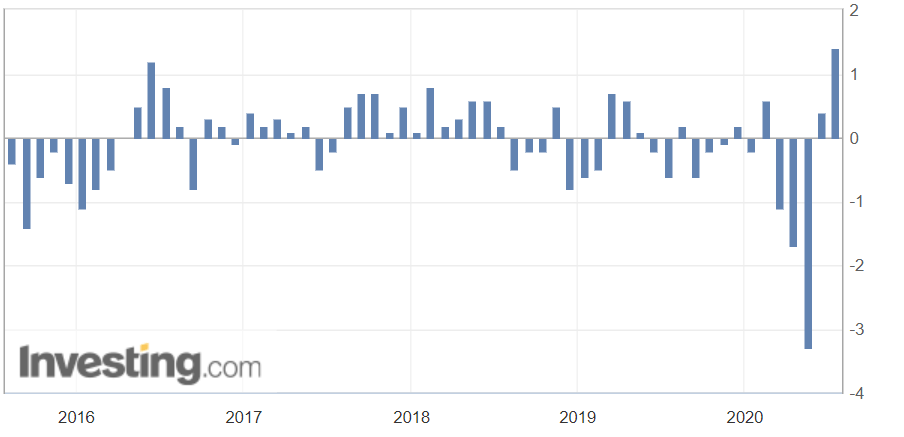
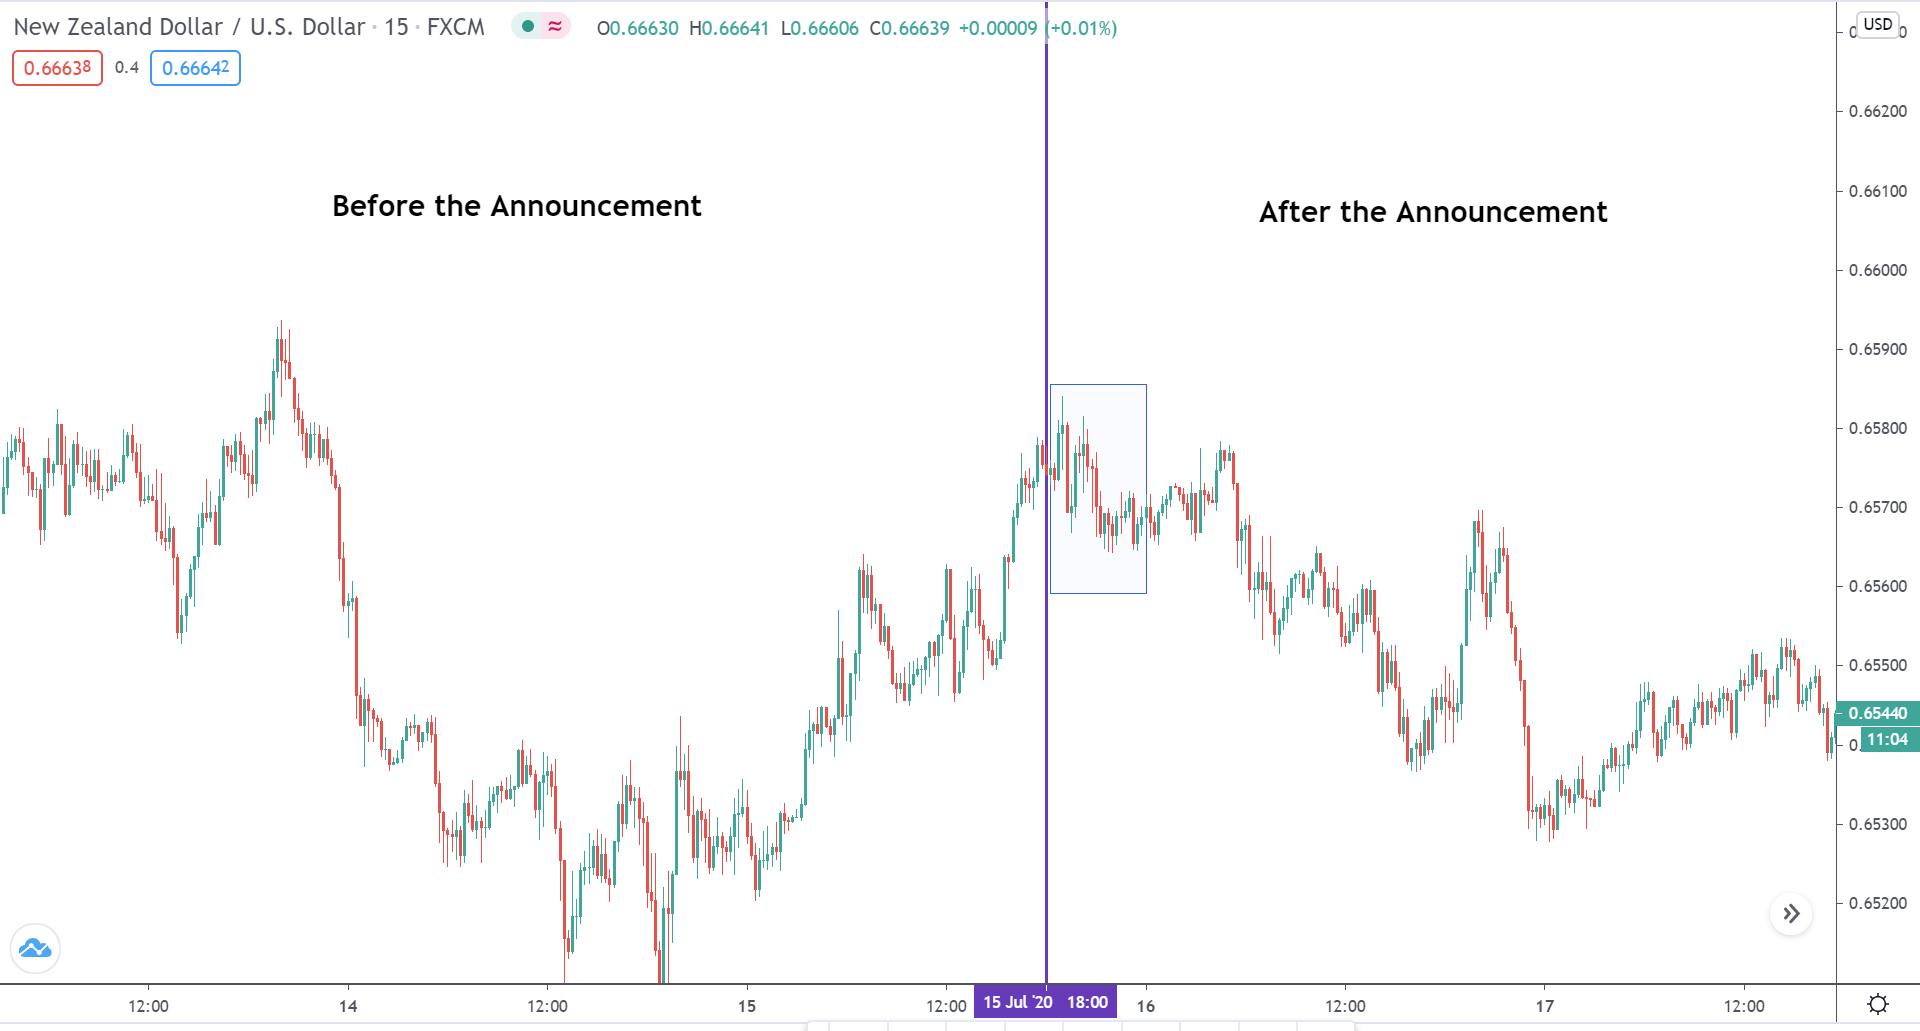
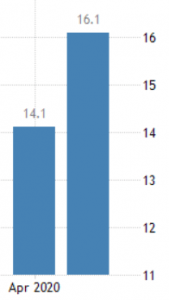
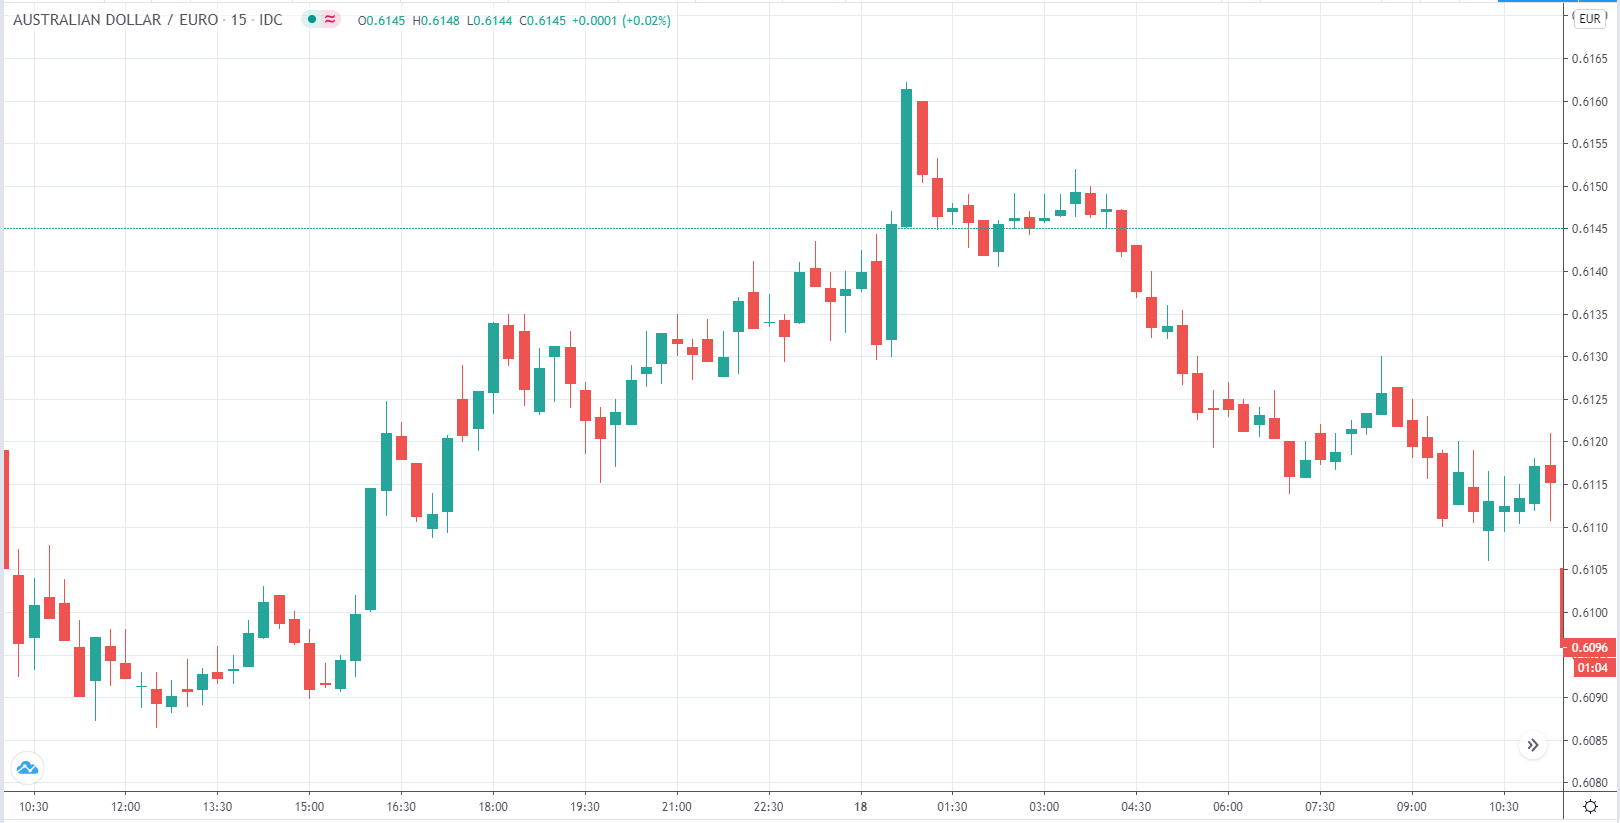
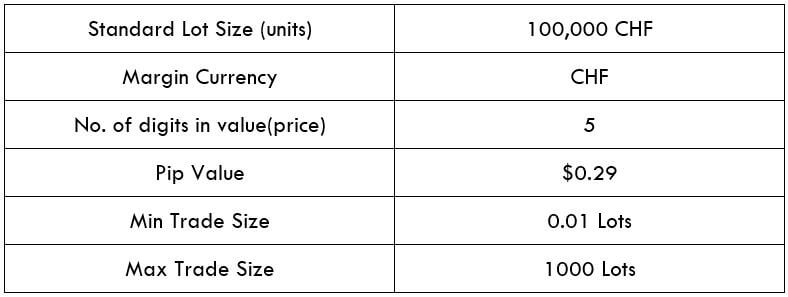
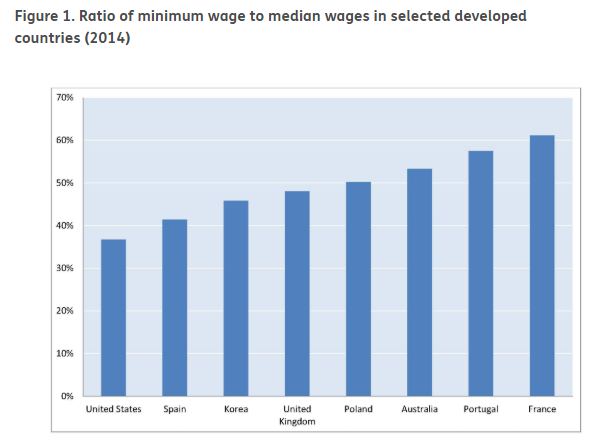
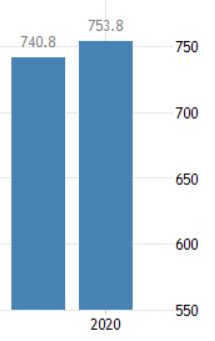
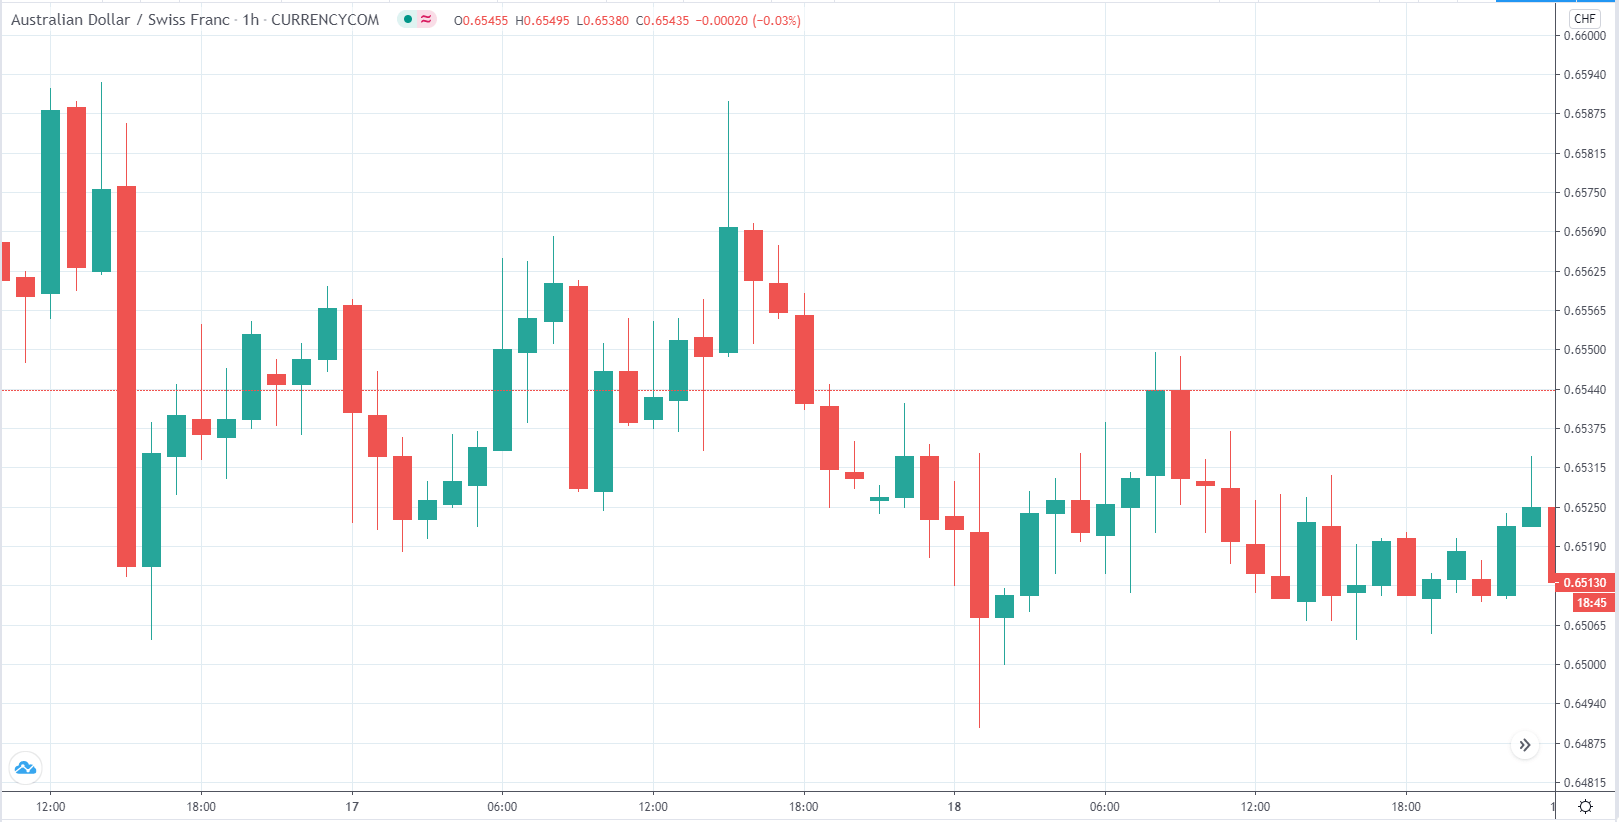
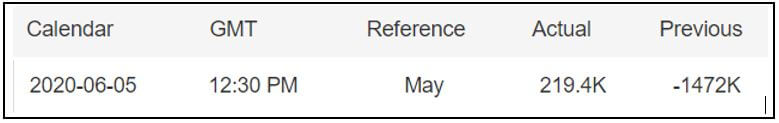
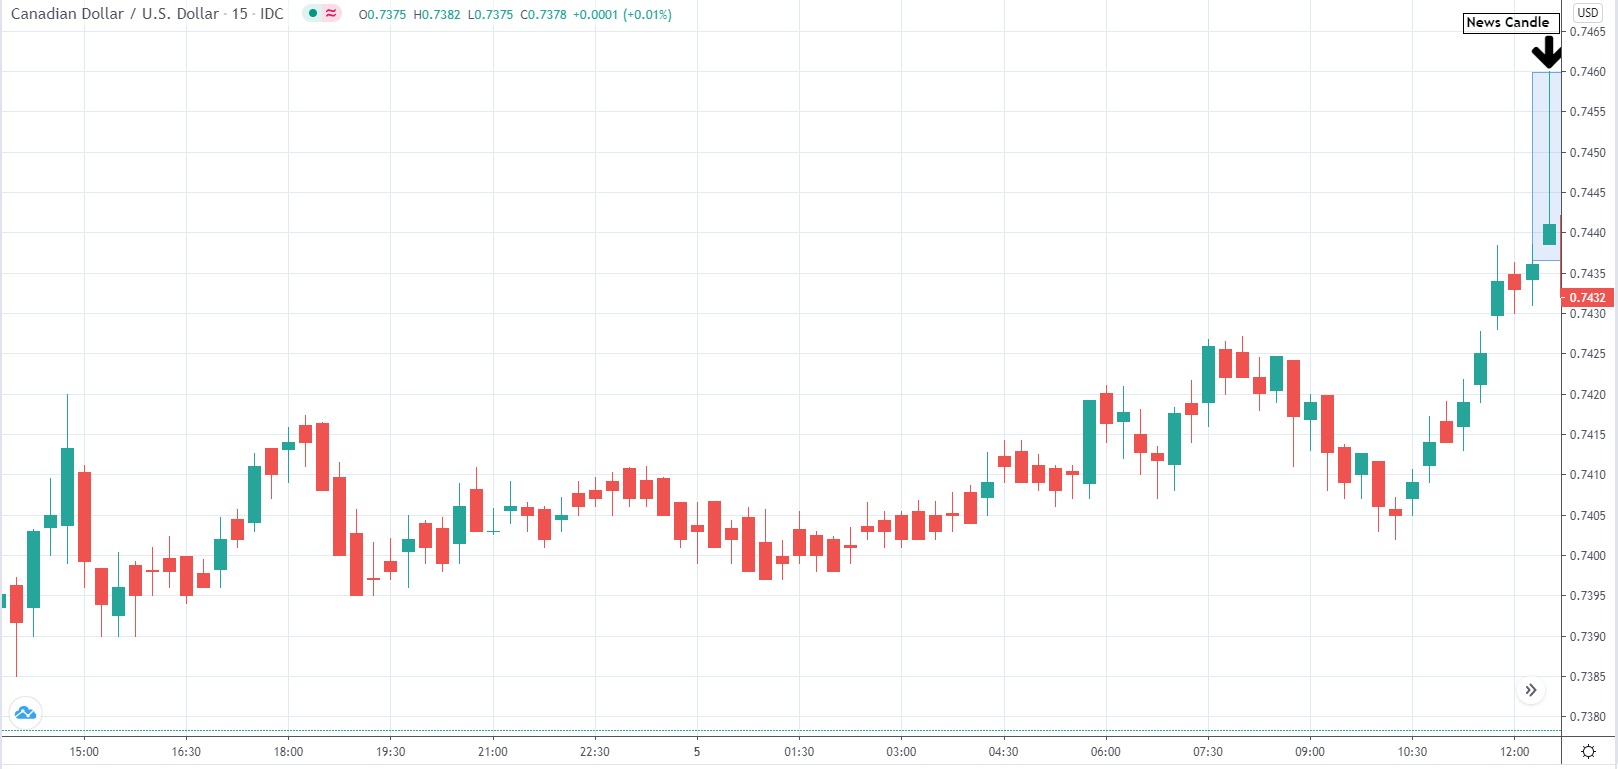
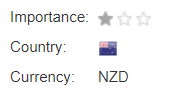
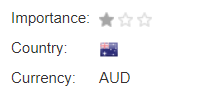
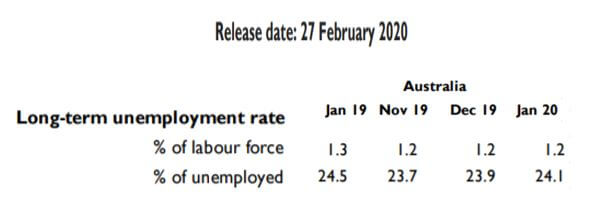
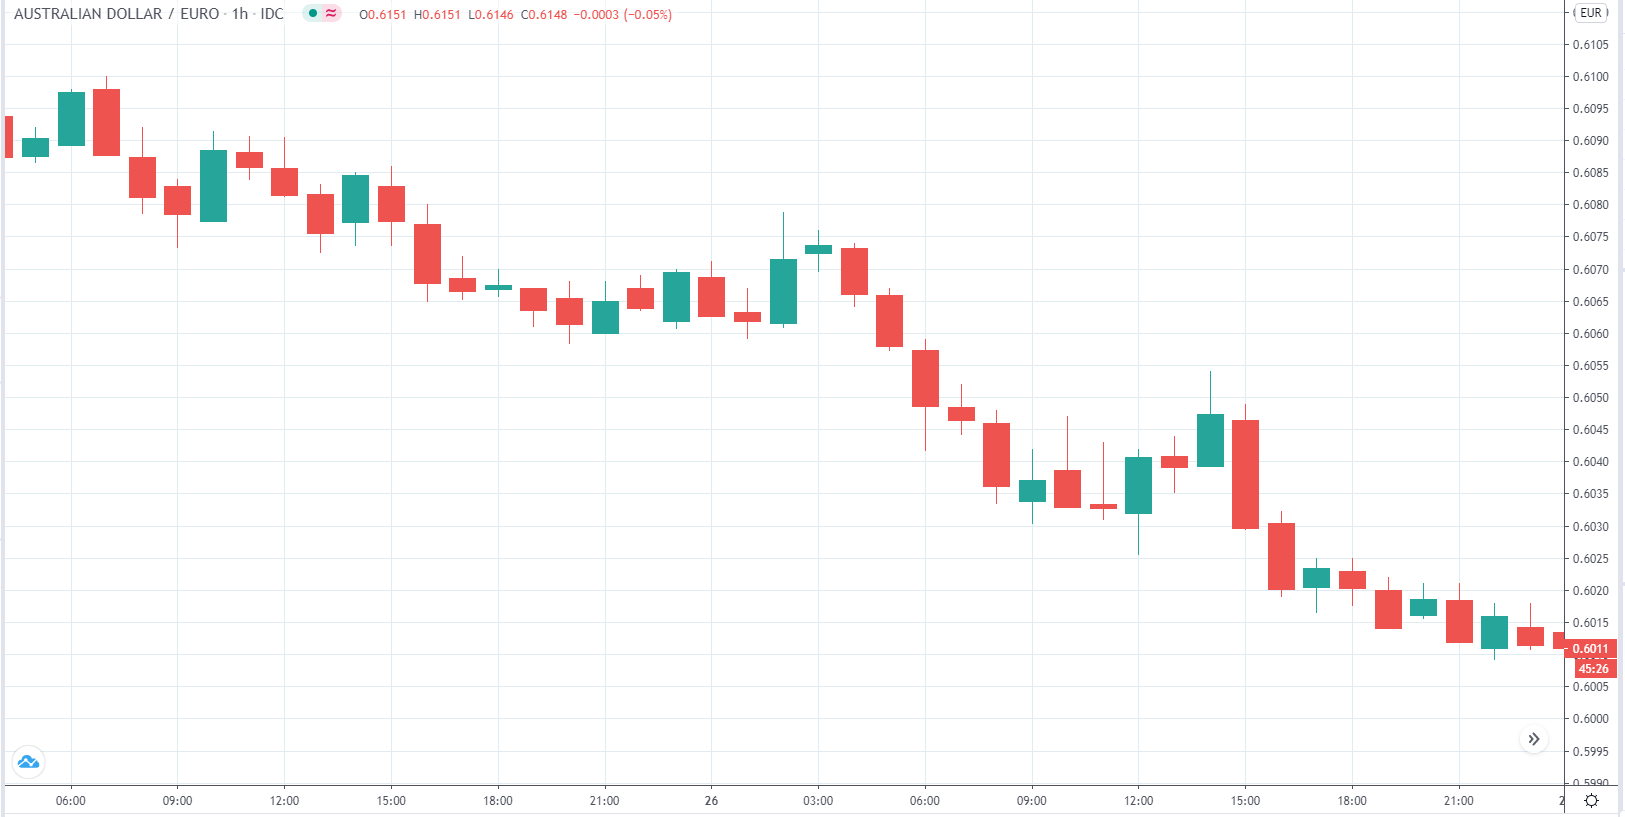
The below image shows that the weekly wages were increased for Australian employees in 2020. Although the difference is not huge, it still is a positive step taken for the daily wage workers. Looking at the data, we should not expect significant volatility in the currency pairs during the announcement.

AUD/EUR | Before the announcement

In the above image of the AUD/EUR 1-hour timeframe chart, we try to establish potential trading opportunities. The pair has been ranging for the past three days before June 19th, 2020.

AUD/EUR | After the announcement

The above image highlights the news announcement day. It may seem there was a small uptrend that was built was erased in the second half of the day. An increase in the minimum wages in favor of AUD did not break the trend established a few days earlier. The pair continues its range post the announcement day also.

AUD/USD | Before the announcement

The above image highlights the AUD/USD pair a few days before the news announcement day. No trend has been established as of now.

AUD/USD | After the announcement

The above image highlights the news announcement day, and we see a similar pattern to the AUD/EUR. We see it is in the typical volatility range of the AUD/USD. The news announcement did not help AUD break the previous and post ranging trend here also.

AUD/CHF | Before the announcement

The above image is AUD/CHF pair, and here also, no potential trading opportunities are building up until June 19th, 2020.

AUD/CHF | After the announcement

The above image highlights the news announcement, and we see that the news did not move the currency in favor of AUD. The AUD/CHF continued to stay in the same range as before the news release day.

Overall, in all the three scenarios, we see the minimum wage economic indicator despite coming in favor of AUD; the market impact was negligible. The market is aware that it is a low impact indicator and affects only a specific section of the labor force.

Hence, changes in minimum wages of a country do not translate to its currency volatility, as already confirmed through our fundamental analysis. Moreover, it is a yearly statistic, and the corresponding effects of increased minimum wages will be captured through monthly indicators better.

Categories
Forex Market Analysis

Daily F.X. Analysis, July 24 – Top Trade Setups In Forex – PMI Figures In Highlights!  

The eyes will remain on the PMI figures from Eurozone, the United Kingdom, and the United States on the news. All of the indicators are expected to perform better than before; therefore, buying can be seen in EUR, GBP during European session and selling during the U.S. session.

Economic Events to Watch Today  


EUR/USD – Daily Analysis

The EUR/USD pair was closed at 1.15969 after placing a high of 1.16267 and a low of 1.15401. Overall the movement of the EUR/USD pair remained bullish throughout the day. The EUR/USD pair continued its bullish streak for the 5th consecutive day on Thursday. They rose above 1.1600 level amid E.U. Summit’s success & broad-based U.S. dollar weakness, in the wake of increasing coronavirus cases in the U.S.. However, the gains were limited because of rising safe-haven appeal after the tensions between the U.S. & China escalated over consulate issues.

The Euro continued to benefit from the E.U.’s agreement on a recovery fund worth 750 euro billion. Investors were stocking into Italian bonds as the Eurozone’s third-largest economy was set to benefit from the funds. The safe-haven German bonds also cheered inflows despite potential competition from the upcoming issuance of the European Commission’s mutual debt.

Besides this, the U.S. dollar struggled to gain traction and failed to receive risk-averse inflows. U.S. jobless claims from last week came in as disappointed with an increase to above 1.4M. The hopes for quick U.S. economic recovery vanished and weighed on the U.S. dollar that ultimately raised EUR/USD prices.

The U.S. Dollar Index that measures the U.S. dollar value against the basket of six currencies was down 0.1% near 94.934 after hitting its lowest since March 9. This situarion also helped in the upward trend of the EUR/USD pair on Thursday. However, the positive news related to coronavirus vaccine countered with the headlines of mounting cases and coronavirus-related deaths in America. The U.S. coronavirus cases reached 4 million on Thursday with over 2600 new cases average, the world’s highest rate. The news about vaccine development from all over the world was raising optimism around the market. As earlier this week, Russia claimed that its first vaccine against the coronavirus was ready as two groups of volunteers completed clinical trials with results showing that all of them build up immunity.

On the other hand, Oxford University’s vaccine and China military vaccine also remained under highlights this week. All the vaccine news in the market, though, helped EUR/USD pair but were also overshadowed by the rising number of coronavirus globally.

Meanwhile, the tensions between the U.S. & China escalated after the U.S. ordered to close its consulate in Houston, Texas, on stealing intellectual property. The tensions between the world’s two largest economies escalated and hopes for a halt of the US-China phase one trade deal emerged.

This raised the safe-haven demand and limited the additional gains in EUR/USD pair on Thursday. Meanwhile, the German Gfk Consumer Climate was released on the data front at 11:00 GMT, which came in as -0.3 against the expectations of -4.6 in July and supported Euro, which ultimately added in the EUR/USD pair.

Daily Technical Levels

Support Resistance

1.1548      1.1637

1.1500     1.1676

1.1460     1.1725

Pivot point: 1.1588

EUR/USD– Trading Tip

The EUR/USD has been trading in a bullish channel, which is providing resistance at 1.1629 level. At the moment, the EUR/USD pair is trading at 1.1609 level, and the continuation of a bullish trend can lead to its prices towards 1.1625 level. Further extension of a bullish trend can lead EUR/USD towards 1.1690 level upon the bullish breakout of 1.1625. The pair is holding above 50 EMA that supports a bullish bias. Today we should consider taking buying trades over 1.1565 level.


GBP/USD – Daily Analysis

The GBP/USD pair was closed at 1.27402 after placing a high of 1.27599 and a low of 1.26727. Overall the movement of GBP/USD pair remained flat yet slightly bullish throughout the day. The GBP/USD pair maintained its bullish streak for the 5th consecutive session on Thursday, supported by the weaker U.S. dollar across the board and negative Brexit hopes. However, the pair dropped heavily before posting gains on Thursday, and that fallout was because of the downbeat comments from the MPC member of Bank of England.

The U.S. Dollar Index fell below 95 levels and reached 94.6 level on Thursday, its lowest since March. The greenback’s massive sell-off was further supported by the poor than expected jobless claims data on Thursday. At 17:30 GMT, the Unemployment Claims form the U.S. increased to 1.416M against the projected 1.3M and weighed on the U.S. dollar. The rise in the number of jobless claims resulted from the increasing number of virus cases from the U.S.

The U.S. coronavirus cases extended to 4 million on Thursday with over 2600 new cases average, the highest rate in the world while the death toll in the U.S. reached 143,000. The weak U.S. dollar gave a push to GBP/USD pair prices on Thursday towards higher levels.

On Brexit front, the latest Brexit talks failed to provide any progress in negotiating and provided negative results instead as the U.K. press reported that the U.K. could be willing to leave the E.U. without a deal.

Supporting the statement, E.U.’s top negotiator Michel Barnier also said that a Brexit deal by the end of 2020 was highly unlikely. These statements weighed on the Cable and its pairs like GBP/USD pair that showed a sudden fall in Thursday prices.

Meanwhile, the local nation’s pandemic situation was also alarming as the U.K. government allowed to open Gyms and swimming pools and set the masks mandatory while getting service from takeaway restaurants. This made traders confused as gyms and pools could be more dangerous in spreading the virus.

Lastly, the interest rate setter of Bank of England, Jonathan Haskel, said that he was worried that Britain’s economic recovery from the coronavirus crisis could be slow. He added that the recovery would depend heavily on whether people felt confident to go out.

Haskel, who backed the BoE’s latest 100 billion pound expansion of asset purchases last month, also warned that unemployment could be worse than in the 2008-09 financial crisis. Haskel’s downbeat comments weighed on the Cable and caused the earlier losses of GBP/USD pair. However, the pair GBP/USD managed to end its day with a bullish candle as the dollar was also struggling.

Daily Technical Levels

Support Resistance

1.2689     1.2778

1.2636     1.2814

1.2600     1.2866

Pivot Point: 1.2725

GBP/USD– Trading Tip

The GBPUSD is also holding in an overbought zone, and now it can drop until 1.2685 level, which marks 23.6% Fibonacci retracement below this the next support will be found around 1.2670 level. At the same time, resistance stays at 1.2730 and 1.2760. The RSI and MACD are in the bullish zone, but they form smaller histograms that suggest odds of selling bias in the market. Let’s consider taking buying trade over 1.2740 until 1.2795 level today.


USD/JPY – Daily Analysis

The USD/JPY pair was closed at 106.847 after placing a high of107.228 and a low of 106.709. Overall the movement of the USD/JPY pair remained bearish throughout the day. The U.S. dollar was weakened on Thursday with recovery gains in Europe despite heightened tensions between the U.S. and China.

The U.S. Dollar Index slipped at 94.6 level, which is the lowest level since March. The drop in the U.S. dollar was caused by the fears of slow economic recovery after a resurgence of infected cases in the U.S. and the improved risk sentiment of the market.

The risk-sentiment on Thursday was supported by the improved German Gfk consumer confidence, which suggested that Europe’s largest economy was on the way of its recovery. The confidence was improved after the 27 member states of the E.U. showed consensus on the E.U. stimulus package that will help the region rebuild from the pandemic’s damage.

The improved risk sentiment in the market pushed the EUR/USD pair prices on Thursday. However, risks sentiment remained under stress due to the escalated tensions between U.S. & China amid intellectual property theft. On Thursday, the U.S. ordered China to close its consulate in Houston and accused it of spying. Beijing called this move by the U.S. as “political provocation.”

Mike Pompeo, the U.S. Secretary of State, told that the decision was taken because China was stealing its intellectual property. China’s foreign ministry denounced the move and said that its embassy in Washington was receiving death threats.

The Chinese foreign ministry spokesman said that the reasons given by the U.S. for closing the consulate were unbelievably ridiculous. She urged the U.S. to reverse its erroneous decision, or china would react with firm countermeasures.

In response to China’s anger, the U.S. President Donald Trump provided hints for the closure of more Chinese consulates and fired the heat more. The rising fears of a dispute between the U.S. & China raised a safe-haven appeal. As in result, Japanese Yen gained strength, and the USD/JPY pair dropped.

On the data front, the Japan market was off due to holiday, and the U.S. released its jobless claims for the last week at 17:30 GMT. The data exceeded the anticipation of 1.3M and came in as 1.416 M; the rise in data means that the U.S. economy has a long way to go before starting to recover. This weighed heavily on the U.S. dollar, and hence, the USD/JPY pair declined further.

Daily Technical Levels

Support Resistance

106.64     107.17

106.41     107.47

106.11     107.71

Pivot point: 106.94

 USD/JPY – Trading Tips

The forex market shows some serious selling trend in the USD/JPY as the pair fell to 106.200 while writing this update. The USD/JPY may find support around 106.850 level, which marks the double bottom support on 4 hours timeframe. Boosted safe-haven demand can also trigger more selling until 105.950 and 105.130 level. The RSI and MACD are also supporting selling bias while the resistance will stay at 106.600 level. Let’s consider selling below 106.450 level today. Good luck!


Categories
Crypto Market Analysis

Daily Crypto Review, July 24 – US Banks Can Provide Crypto Custody Services; Bitcoin Approaches $10,000

The cryptocurrency market spent yet another day shooting for the upside as Bitcoin tries to push itself closer towards $10,000. Bitcoin is currently trading for $9,358, which represents an increase of 0.42% on the day. Meanwhile, Ethereum gained 2.68% on the day, while XRP gained 1.2%.

 Daily Crypto Sector Heat Map

When talking about top100 cryptocurrencies, Flexacoin gained 36.8% on the day, making it the most prominent daily gainer. DigiByte (12.57%) and Maker (8.03%) also did great. On the other hand, Ampleforth has lost 11.12%, making it the most prominent daily loser. It is followed by Aave’s loss of 8.86% and Reserve Rights’ loss of 7.63%.

Top 10 24-hour Performers (Click to enlarge)

Bottom 10 24-hour Performers (Click to enlarge)

Bitcoin’s dominance level decreased slightly since we last reported, with its value currently at 62.29%. This value represents a 0.12% difference to the downside when compared to yesterday’s value.

Daily Crypto Market Cap Chart

The cryptocurrency market capitalization increased when compared to when we last reported, with the market’s current value being $287.23 billion. This value represents an increase of $3.17 billion when compared to the value it had yesterday.

_______________________________________________________________________

What happened in the past 24 hours?

_______________________________________________________________________

_______________________________________________________________________

Technical analysis

_______________________________________________________________________

Bitcoin

The largest cryptocurrency by market capitalization had another great day after the Office of the Comptroller of the Currency made an announcement stating that US banks can now provide crypto custody services. Bitcoin’s price instantly skyrocketed and reached a high of $9,690, therefore passing the $9,580 resistance level. However, the fight to stay above $9,580 is still in play, and it is uncertain where Bitcoin will end up.

BTC traders should look for a trade opportunity after bitcoin establishes itself above or below $9,580.

BTC/USD 4-hour Chart

Technical factors:

  • Price is currently above its 50-period EMA and its 21-period EMA
  • Price is right below its top B.B.
  • RSI is in the overbought territory (72.10)
  • Volume Increased

Key levels to the upside          Key levels to the downside

1: $9,580                                 1: $9,251

2: $9,735                                 2: $9,120

3: $9,870                                  3: $8,980

Ethereum

Ethereum made a move towards the upside as it followed the influx of crypto bulls entering the market. The second-largest cryptocurrency by market cap established its position above $260 and hurled towards $278. However, the bullish move could not quite reach above it, and Ethereum stayed below. However, there is a high possibility that Ethereum will make another move as the range between $278 and the ascending line is closing in.

Ethereum traders should look for a trade opportunity in searching for pullbacks or after range confirmations.

ETH/USD 4-hour Chart

Technical Factors:

  • Price is above the 50-period EMA and the 21-period EMA
  • Price is slightly below the top B.B.
  • RSI severely overbought (82.89)
  • Two-candle volume spike (the rest is average)

Key levels to the upside          Key levels to the downside

1: $278                                    1: $260

2: $289                                    2: $251.4

3: $302                                     3: $240

Ripple

The third-largest cryptocurrency by market cap went past the $0.205 resistance (now support) level as bulls managed to win the fight for the level. However, XRP did not make a great leap towards the next resistance level, as Bitcoin and Ethereum did. Due to a low bullish presence, XRP failed to go past $0.21 and started moving towards the downside.

XRP traders can look for an opportunity after XRP confirms its position above $0.205, or as it falls below $0.205.

XRP/USD 4-hour Chart

Technical factors:

  • XRP in a mid-term descending trend (though it broke the trend in the short-term)
  • XRP lacks strong support levels below $0.178
  • Price above 21-period and the 50-period EMA
  • Price above the top B.B.
  • RSI is elevated (64.43)
  • Average/slightly higher than average Volume

Key levels to the upside          Key levels to the downside

1: $0.214                                  1: $0.205

2: $0.227                                  2: $0.2

3: $0.19


Categories
Forex Daily Topic Forex Fundamental Analysis

Understanding ‘Full-Time Employment’ Fundamental Forex Driver

Introduction

Full-Time Employment statistical figures are a good measure for long term economic growth. Understanding the difference between part-time and  Full-Time employment and its economic impact can help us better understand the long-term trends in economic growth.

What is a Full-Time Employment?

Employment

It is the state of having paid work. A person is considered employed if they do any work for pay or profit. People who are eligible for employment are between the age of 15 and 64 and are called the working-age population.

Full-Time Employment

As such, there is no fixed law defining and differentiating full and part-time employment. Conventionally 40 hours a week has been considered as Full-Time employment, but lately, deviations from this have been observed.

For instance, the United States Bureau of Labor Statistics (BLS) describes 35 hours or more per week as Full-Time employment. Conversely, 1 to 34 hours of work per week is considered part-time employment. The Affordable Care Act (ACA) explains Full-Time employees as those who are working for 30 or more hours a week.

How can the Full-Time Employment numbers be used for analysis?

Distinguishing between the part and Full-Time employment has benefits. Full-Time employment generally has the following benefits over part-time or contract-based employment:

Paid leaves: Full-Time employees are eligible to take leaves or vacation for which there would be no loss of pay. It is generally not applicable to part-time employees. Most part-time employees have a per hour payment. They are paid for the number of hours worked.

Healthcare plans: When an employee spends most of his life working for an organization, it is the company’s responsibility to take care of his health and well being. Full-Time employees enjoy the benefits of healthcare insurance for themselves and their family members as well. Health insurances secure employees against heavy financial losses during health emergencies. Part-time employees don’t generally have those benefits.

Pension plans: Full-Time employees are also given the benefits of retirement plans through pension funds or any other retirement scheme. It financially secures the employee in his/her old age, which is essential. Part-time employees generally do not have any such benefits and usually have to save for retirement themselves.

Job Security: During times of economic slowdown or even worse a recession, companies generally lay off their part-time and contract workforce first. Full-Time employees are their prime assets and generally are managers or professionals in the organization. Hence, Full-Time employees are generally less vulnerable to business and economic cycles.

Part-time employees could also be seasonal and find it hard to get work during off-seasons and are more vulnerable to business cycles.

It is easy to infer that the standard of living of Full-Time employees is generally better than that of their counterparts. As employees feel more financially secure in a Full-Time job, their spending habits would reflect the same. Credit eligibility also is more for Full-Time employees over part-time ones. Hence, in the long run, much of the consumer spending would likely be coming from Full-Time employees.

No one seeks part-time employment voluntarily, and no one wants to sit idle during certain quarters of a year. When companies are making long term progress in their profits rather than short-term gains during particular business cycles, a growth in Full-Time employment could be observed. When businesses are fully established in their sector and are marginally well-off, they opt to hire and retain Full-Time employees more. Otherwise, companies would rely on seasonal hiring and firing strategy only to keep the business running.

Policymakers giving the necessary support and means in terms of infrastructure, financial support, ease of doing business could help organizations to grow faster and offer better employment benefits. As more people from the labor force go into the full-time employment category, fewer people are working as part-time employees overall. When the majority of the labor force is full-time employed, we can expect a robust economy and steady economic growth that is immune to both domestic and international business and economic cycles.

Impact on Currency

Full-Time employment and its other half part-time employment only come into picture when we are trying to assess long-term economic growth and improvements in the citizens’ living standards. Hence, Full-Time employment statistics are more useful to policymakers who are committed to bringing wellbeing to their citizens through meaningful policies.

The currency markets are more concerned with the overall picture and the current business cycle’s impact on the currencies. Hence, Full-Time employment statistics, which are only part of the total labor force, do not move the markets like other employment indicators.

Full-Time employment is a low impact coincident indicator that is more useful for measuring long-term improvements in the quality of people’s lives for investors and policymakers only.

Economic Reports

In the United States, the Bureau of Labor Statistics (BLS) publishes monthly, quarterly, semi-annually, and yearly Employment Situation Reports on its website. The labor force statistics from the Current Population Survey details the nominal values of the full and part-time workers classifying them based on age, sex, race, and ethnicity. Full-Time employment reports are available monthly, quarterly, and annually.

Sources of Full-Time Employment

The United States Bureau of Labor Statistics Current Population Survey details Full and Part-time employment statistics in detail. The United States Bureau of Labor Statistics publishes monthly employment and unemployment reports that are very useful for market analysis. We can also find the same indexes and many others with a comprehensive summary and statistics of various categories on the St. Louis FRED that are relevant for our study. Consolidated reports of Full-Time employment for most countries can be found in Trading Economics.

Full-Time Employment Announcement – Impact due to news release

Full-time employment refers to the number of people working a specified number of hours or more per week at their main job or only job. The number of hours is fixed by the government, who later classify employees in different categories.

Traders and investors worldwide watch the indicator value closely as it tells about a country’s employment situation. For example, in Canada, if a person works 30 hours or more per week, he is considered a full-time Employee. One should expect high volatility in the currency during and after the news release.

The below image shows the employment change in Canada during May. We see that full-time employment increased in Canada by 219.40, which should be positive for the currency. Let us witness the impact of this news release on the Canadian dollar by considering various currency pairs.

CAD/USD | Before the announcement

Let us start with the CAD/USD currency pair to observe the impact of full-time employment change on the Canadian dollar. The above snapshot shows the 15 minutes time-frame chart of the currency pair. The currency has been maintaining a range before the news announcement, and it is only three hours before the release, there seems to be a positive momentum building up for CAD/USD.

CAD/USD | After the announcement

After the news announcement, the price initially moves higher, but this is immediately sold, and the market erases most of the gains. The wick on top of the news candle indicates a strong buy sentiment that is carried over, and momentum continues to build up over the next days. As we can see, despite strong sell at the end-of-the-day positive momentum still built up and the market reached a new high than before the news announcement.

AUD/CAD | Before the announcement

The above image is a snapshot of the AUD/CAD pair on a 15-minute time frame before CAD full employment data release at 12:30 GMT. As we can see before the news announcement, positive momentum was building up, and a downward trend started just hours before the news candle.

AUD/CAD | After the announcement

After the news announcement that came in favor of CAD, AUD/CAD falling momentum increases, and investors lose further confidence in AUD, and a strong sell is seen. That momentum is carried over to the next two days, and the AUD continues to fall against CAD.

CAD/JPY Before the announcement

The above image is a 15-minute time-frame snapshot of CAD/JPY. Before the news announcement, there is no clear uptrend or downtrend.

CAD/JPY After the announcement

It is only after positive news for CAD through full-time employment report the uptrend is further amplified and continues throughout the next few days.

The full-time employment data was able to move currency in favor of CAD against significant currencies after the news announcement confirming the importance of the economic indicator.

Categories
Forex Market Analysis

Daily F.X. Analysis, July 23 – Top Trade Setups In Forex – U.S. Unemployment Claims Ahead! 

The market’s fundamental side is a bit busy today as the focus on traders will stay on German GfK Consumer Climate and U.S. Unemployment Claims as these both events have the potential to drive some price action in the market. 

Economic Events to Watch Today  


EUR/USD – Daily Analysis

The EUR/USD pair was closed at 1.15701 after placing a high of 1.16012 and a low of 1.15067. Overall the movement of the EUR/USD pair remained bullish throughout the day. On Wednesday, Euro racked up gains against the U.S. dollar and tested 1.16 level on Wednesday after extending its benefits for the 4th consecutive session. The Euro rally of this week could be attributed to the E.U. Summit’s success, where European leaders managed to show consensus on massive stimulus package after four days of discussions.

The second-longest ever E.U. Summit indicated the difficulty in getting the consensus of all E.U. member countries on the E.U. recovery fund. Under the new agreed agreement, the EUR 750 Billion recovery fund will be distributed as EUR 390 Billion in grants and EUR 360 in low0interest loans.

This new agreement represented a compromise between E.U.’s wealthier nations, commonly known as Frugal Four, including Netherland, Denmark, Sweden and Austria, and poor member countries as Italy and Portugal. The former wanted most of the funds distributed as loans versus other wanted the funds as grants. In addition to the recovery fund, the E.U. members also approved a seven-year EUR 1.07 trillion budget.

Euro traders cheered after the E.U. Summit ended successfully, and the pair EUR/USD extended its gains. However, the gains were limited and were dragged by some factors in the late session. Factors included the chance of correction after a strong rally and profit-taking. The deal leaves the E.U. economy that is already suffering from a massive debt which will have to be paid back. The agreement was forced on the wealthier nations of the E.U. that are not very fond of large handouts to developing nations in the E.U. The deep division persisted in the E.U. between rich & developing countries; it has only been papered out for now.

All these factors raised concerns, and investors started getting out of EUR/USD pair in the late session, making gains of the pair short.

A statement by ECB President Christine Lagarde also helped in decreasing the daily gains of EUR/USD on Wednesday as she said that the deal between 27 member countries on 750 billion euro fund to help the bloc’s weaker economies recover from pandemic crisis, “could have been better.”

However, the EUR/USD pair’s gains were supported by the weakness in the U.S. dollar that was prompted after a possible delay in the U.S. fiscal stimulus package was reported. The Senate majority leader, Mitch McConnell, said that he was not expecting the bill for paycheck protection program to be rolled out before two weeks.

U.S. dollar also suffered because of the record-high number of coronavirus cases in the U.S. Even President Donald Trump now changed his tone and rhetoric about the pandemic and said in his speech today that the pandemic will get worse before it gets better. The death toll in the U.S. raised since records on Wednesday to 1,000 and weighed heavily on the U.S. dollar.

The broad-based U.S. dollar weakness further surged after the release of macroeconomic data. The Housing Price Index and Existing Home Sales data both fell short of expectations in May and June respectively and added further in the upward motion if EUR/USD pair.

Daily Technical Levels

Support Resistance

1.1454     1.1572

1.1379     1.1615

1.1335     1.1690

Pivot point: 1.1497

EUR/USD– Trading Tip

The EUR/USD has come out of a bullish channel, which was providing resistance at 1.1509 level. Now, this level has been violated, and it’s likely to provide support. At the moment, the EUR/USD pair is trading at 1.1590 level, and the continuation of a bullish trend can lead its prices towards 1.1605 level. Continuation of a bullish trend can lead EUR/USD towards 1.1646 level as the pair is holding above 50 EMA that supports a bullish bias. Today we should consider taking buying trades over 1.1565 level.


GBP/USD – Daily Analysis

The GBP/USD pair was closed at 1.27348 after placing a high of 1.27435 and a low of 1.26440. Overall the movement of GBP/USD pair remained bullish throughout the grounds. On Wednesday, Sterling came under pressure in the early trading session on the concerns that the U.K. will not reach a deal with the European Union. The Daily Telegraph reported that the U.K. government was working on assuming that trade deal with Europe after the end of the transition period will be conducted on World Trade Organization terms.

The U.K. Government officially reported abandoned hope of striking a Brexit trade deal with the E.U. The latest round of Brexit talks began in London this week, but expectations are that they will end in a deadlock today. Both sides were still at disagreement over fishing rights, the European Court of Justice, governance of the deal, and level playing field guarantees. The negotiations will finish on Thursday.

This weighed on Sterling heavily and the pair GBP/USD after posting gains for three consecutive days, started moving in the opposite direction in the early trading session on Wednesday. The pair GBP/USD even crossed the previous session’s lowest level on the fears of no-deal Brexit hopes.

However, the losing trend in GBP/USD pair was reversed in late session on Wednesday after the release of poor than expected data from the U.S. That further dragged the U.S. dollar and supported the GBP/USD pair. In addition to U.S. dollar weakness, the news about U.K. Prime Minister saying that the U.K. could get back to normal as early as Christmas also supported an upward trend in currency pair.

On the data front, the Housing Price Index from the U.S. for May dropped to -0.3% from the expected 0.3% and weighed on the U.S. dollar. At 19:00 GMT, the Existing Home Sales dropped to 4.72 M from the expected 4.77M and weighed on the U.S. dollar.

The U.S. dollar that was already under pressure due to the increasing number of coronavirus cases and recorded high death numbers because of the virus in the U.S. came under more pressure after the U.S. economic release data. The U.S. economy’s struggle to fight against coronavirus kept the local currency under pressure as the U.S. dollar index also fell below 95.35 level. The weak U.S. dollar also played its part in reversing the GBP/USD pair’s movement on Wednesday.

Meanwhile, Boris Johnson ordered the British army to prepare for a possible four-way crisis this winter involving a second spike in coronavirus, flu outbreak, a chaotic Brexit, and widespread flooding. This news was also behind the losses post by GBP/USD pair on Wednesday.

Daily Technical Levels

Support Resistance

1.2664     1.2782

1.2597     1.2835

1.2545     1.2901

Pivot Point: 1.2716

GBP/USD– Trading Tip

The GBPUSD is also holding in an overbought zone, and now it can drop until 1.2685 level, which marks 23.6% Fibonacci retracement below this the next support will be found around 1.2670 level. At the same time, resistance stays at 1.2730 and 1.2760. The RSI and MACD are in the bullish zone, but they form smaller histograms that suggest odds of selling bias in the market. Let’s consider taking buying trade over 1.2740 until 1.2795 level today.  


USD/JPY – Daily Analysis

The USD/JPY pair was closed at 107.155 after placing a high of 107.286 and a low of 106.707. Overall the movement of the USD/JPY pair remained bullish throughout the day.

The USD/JPY pair hovered near the top end of its daily trading range near the 107 level. Some intraday U.S. dollar rebound supported the uptick in currency pair. However, in the absence of any strong follow-through, the pair remained under pressure amid a combination of negative factors.

The U.S. dollar bulls remained defensive mode as worries about the second wave of the coronavirus infection post threat on economic recovery coupled with the delay in U.S. economic stimulus measure raised investors caution. The Republicans & Democrats have been struggling to reach consensus on a $3 trillion relief fund.

The safe-haven Japanese Yen benefited with the rising concerns about the U.S. & China dispute. The tensions between both nations increased further after the United States abruptly ordered China to close its consulate in Houston.

The U.S. state department spokesman Morgan Ortagus said that the closing consulate order was issued to protect American intellectual property and American’s secret information. China quickly responded and threatened to retaliate with firm measures, raising bars for the possible end of the US-China trade deal.

On the other hand, On Wednesday, the U.S. House of Representatives was set to vote on legislation reversing President Donald Trump’s controversial order to ban entry as immigrants from mostly Muslim-majority countries. The NO BAN Act has broad support from Democratic legislators and was likely to pass the democrat-controlled House despite strong disapproval from Republicans and the White House.

Joe Biden, former Vice President of the U.S., has vowed that if he is elected as president, he will end the Trump’s so-called Muslim travel ban on his first day in office. At 18:00 GMT, the Housing Price Index for May was released on the data front, which showed that the index fell to -0.3% from the anticipated 0.3%. At 19:00 GMT, the Existing Home Sales from the U.S. also plunged to 4.72 M from the projected 4.77M in June and weighed on the U.S. dollar. This capped additional gains in USD/JPY pair on Wednesday.

Daily Technical Levels

Support Resistance

106.22     107.39  

106.47     107.63

106.81     107.97

Pivot point: 107.05

 USD/JPY – Trading Tips

The USD/JPY bounced off to test the previously violated upward trendline of 107.250, as investors seem to sell JPY on the back of increased COVID19 cases in Japan. A bullish breakout of 107.250 level can extend buying until 107.500 level while support continues to hold around 106.930. 

The RSI and MACD suggest opposing signals; for instance, the RSI suggests bullish bias, while the MACD suggests selling. Today, let’s choppy trade session by selling below 107.250 and buying above 106.700 level. Good luck! 

Categories
Crypto Market Analysis

Daily Crypto Review, July 23 – Ethereum’s Price Skyrockets As Developers Announce Ethereum 2.0 Test Specifications

The cryptocurrency market spent yet another day shooting for the upside as Bitcoin tries to push itself closer towards $10,000. Bitcoin is currently trading for $9,358, which represents an increase of 1.72% on the day. Meanwhile, Ethereum gained a whopping 8.63% on the day, while XRP gained 2.88%.

 Daily Crypto Sector Heat Map

When talking about top100 cryptocurrencies, Terra gained 15.84% on the day, making it the most prominent daily gainer. DigiByte (8.29%) and Flexacoin (8.14%) also did great. On the other hand, Ampleforth has lost 30.52%, making it the most prominent daily loser. It is followed by iExec RLC’s loss of 12.26% and Velas’ loss of 7.15%.

Top 10 24-hour Performers (Click to enlarge)

Bottom 10 24-hour Performers (Click to enlarge)

Bitcoin’s dominance level decreased slightly since we last reported, with its value currently at 62.41%. This value represents a 0.38% difference to the downside when compared to Friday’s value.

Daily Crypto Market Cap Chart

The cryptocurrency market capitalization increased when compared to when we last reported, with the market’s current value being $284.16 billion. This value represents an increase of $6.63 billion when compared to the value it had on yesterday.

_______________________________________________________________________

What happened in the past 24 hours?

_______________________________________________________________________

_______________________________________________________________________

Technical analysis

_______________________________________________________________________

Bitcoin

The largest cryptocurrency by market capitalization had another green day where it continued strides towards $9,580, and ultimately $10,000. While the price did reach the $9,580 resistance level, it could not pass it for the time being. However, there is still a chance Bitcoin will pas (and confirm) the $9,580 level in this run, even though the overbought RSI says otherwise.

BTC traders should look for a trade opportunity after bitcoin loses bull presence or after it passes $9,580.

BTC/USD 4-hour Chart

Technical factors:

  • Price is above its 50-period EMA and its 21-period EMA
  • Price at its top B.B.
  • RSI is in the overbought territory (74.80)
  • Increased Volume

Key levels to the upside          Key levels to the downside

1: $9,580                                 1: $9,251

2: $9,735                                 2: $9,120

3: $9,870                                  3: $8,980

Ethereum

Ethereum skyrocketed today, gaining over 8% in the past 24 hours. The reason for the sudden increase in Volume (and price) is contributed to the growing DeFi field. This price is the highest Ethereum has been since February. Ethereum’s price rise got stopped by the ascending resistance level, but only for a short amount of time.

Ethereum traders should look for an opportunity in searching for pullbacks.

ETH/USD 4-hour Chart

Technical Factors:

  • Price is above the 50-period EMA and the 21-period EMA
  • Price above the top B.B.
  • RSI severely overbought (85.65)
  • One candle volume spike (rest is average)

Key levels to the upside          Key levels to the downside

1: $278                                    1: $260

2: $289                                    2: $251.4

3: $302                                     3: $240

Ripple

The third-largest cryptocurrency by market cap did well as well, with its price finally passing the $0.2 threshold after being stuck below it for almost a month. The move is currently stuck at the $0.205 resistance level, as XRP didn’t decide whether it will consolidate above or below it.

XRP traders can look for an opportunity to trade after XRP “decides” if it will end up above or below $0.205.

XRP/USD 4-hour Chart

Technical factors:

  • XRP in a mid-term descending trend (though it broke the trend in the short-term)
  • XRP lacks strong support levels below $0.178
  • Price above 21-period and the 50-period EMA
  • Price above the top B.B.
  • RSI is elevated (65.78)
  • Average/slightly higher than average Volume

Key levels to the upside          Key levels to the downside

1: $0.205                                  1: $0.2

2: $0.214                                  2: $0.19

3: $$0.227                               3: $0.178


Categories
Forex Fundamental Analysis

The Impact Of ‘Labor Costs’ Fundamental Driver’s News Release On The Price Charts

Introduction

Labor Cost is a critical element affecting business profitability and sustainability. Labor costs have a direct feedback effect on inflation rates. Understanding its effect on the labor force, economic growth, and inflation helps understand how market forces act.

What are Labor Costs?

It is defined as the total cost of labor used in a business. It is the sum of all wages paid out to the employees of business by the employer. Labor costs include payroll taxes and employee benefits also. Hence, from a business standpoint, it is part of business expenditure dealing with human resources. It can also be defined as the wages cost paid to workers during an accounting period, including taxes and benefits.

Most often, countries measure Unit Labor Cost, which is the labor compensation for a unit of business value produced. It is also a measure of international competitiveness amongst different labor markets throughout the world. Many companies in the United States have shifted their production plants to countries like Mexico, China, and India, where labor cost is relatively lower than the United States.

Labor costs are broadly categorized into the following two categories:

Direct cost: It is the cost of labor that can be traced to produce. It is the labor cost of employees that produce a product. It is a tangible measure. For example, if forty employees are working on assembling and packing an automobile engine, then the labor cost can be traced to the engine’s sale prices.

Indirect cost: It is the labor cost that cannot be traced to any tangible business produce. For instance, building security does not contribute to business output but ensures the safety of the place. It is generally associated with support labor that maintains business activity.

Businesses price in the labor costs, material charges, and overheads, if any, into the final sales price of the product or service they produce. The final product must factor in all the costs incurred; otherwise, it can hurt the company’s profit margin.

While it is easier to evaluate direct costs, indirect costs are a little trickier to evaluate due to their intangible nature. Undervaluation or overvaluation of costs drives the actual price of products away from correct prices. Undervaluation can force employees to quit for better opportunities. Overvaluation can hurt business profit or translate those prices into the end product. When overvalued products hit markets, they lose out to competition and hurt business. Hence, correctly modeling labor costs is vital for business sustenance.

Labor costs are sometimes also classified as fixed and variable costs. Variable costs change based on the amount of work done or business production. For instance, workers working on the production line can see reduced or increased work during business cycles. In such instances, workers are paid for the hours worked, or the output produced. Fixed costs do not vary over the entire business cycle. For instance, a contract with a maintenance company for a year would be fixed for repairs throughout the year.

How can the Labor Costs numbers be used for analysis?

Labor costs are affected by the following factors:

Labor Availability: The supply and demand for labor will drive labor costs. Lack of availability of the required skilled laborers for a particular business can drive up the labor costs due to demand outweighing supply. Conversely, when the market is saturated, labor costs go down due to market forces.

Workplace Location: The cost of living varies across different regions. Businesses having multiple branches can offer different pay for the same work in different areas due to differences in living costs. Wages are generally high in metropolitan cities and lower in semiurban areas.

Task Complexity: The more complex the work, the more a business pays out for it. The task difficulty drives up the labor cost.

Efficiency and Productivity: Efficiency can improve productivity for the same hours of work and workforce. It can increase business profits that can translate into higher labor wages also.

Worker Unions: Hiring a union member ensures that the wages are above a particular minimum pay set by the union. Unions have control over demand and supply of workers, thereby having the power to negotiate labor wages.

Legislation: With many countries adopting minimum wages, and having dedicated acts and laws to protect labor exploitation, labor costs have a price floor below which it cannot drop.

Employer’s idealogy: Some business owners place more emphasis on its employees and view them as the heart of the business. Such people pay higher wages compared to other businesses that emphasize more on profit.

Labor costs are directly proportional to inflation. As prices rise, the cost of living increases and laborers demand higher wages. When labor costs increase, the profit margin of the company decreases. To avoid a reduction in profits, companies may employ cost-cutting mechanisms or lay-offs to accommodate the new wage hike. A significant increase in labor costs can increase unemployment.

On the flip side, the increased labor cost may translate to the product’s end sale price, giving a feedback loop to price inflation. It continues until market equilibrium is achieved through the open demand and supply market forces.

Impact on Currency

Significant and quick increases in the labor market induce inflation, which is depreciating for the currency. Labor cost in itself does not directly affect the country’s currency worth. It is part of a more extensive system. Labor costs are seen from the business point of view and are associated more with inflation.

Overall, labor costs are low impact lagging indicators that do not have a significant effect on currency market volatility. It is deemed more useful for businesses and policymakers to balance laborer’s well-being and business sustainability.

Economic Reports

In the United States, the Bureau of Labor Statistics releases quarterly “Labor Productivity and Costs” that details the Unit Labor Cost also. The report is released in the following mid of the month for the previous quarter.

Sources of Labor Costs

The BLS Labor Productivity and Costs report contains the Unit Labor Cost reports.

The OECD also maintains data of the Unit Labor Cost data of its member countries.

Consolidated Labor Costs data is also available on Trading Economics for most countries.

Labor Costs Announcement – Impact due to news release

In the previous section of the article, we understood the labor costs economic indicator, which essentially measures the change in the price companies pays for labor, excluding overtime. It is a leading indicator of consumer inflation. High labor costs make workers better off, but they reduce companies’ profits and net cash flow.

Policies that increase labor costs can significantly affect employment and working standards, which has an indirect impact on the overall economy. Since labor costs are a company-specific factor, its impact is primarily felt on the company’s stock price and the stock market.  Hence, currency traders do not give much importance to the official labor costs news release.

In today’s article, we will be analyzing the latest labor costs data of New Zealand that was released in May. In the below image, we can see that labor costs were slightly lower than last time and almost equal to market expectations. Let us find out the market’s reaction to this data.

NZD/USD | Before the announcement

The above image shows the NZD/USD 15-minute timeframe chart right until 22:30 GMT. The news release is at 22:45 GMT. Before the news release, the market has no clear pattern and maintains a range with no clear uptrends or downtrends.

NZD/USD | After the announcement

After the news announcement at 22:45 GMT of labor costs Index quarterly reports, which came a little lower than the forecast, no new trends developed. The pair kept its ranging trend before, during, and after the news release.

NZD/CAD | Before the announcement

The above image is the NZD/CAD 15-minute timeframe chart, and we can see here also there is no clear trend building up throughout the day. The currency pair has been in a ranging trend throughout the timeline.

NZD/CAD | After the announcement

After the news announcement, there seems to be no significant volatility in either direction. The news did not create enough volatility to bring about any trend.

NZD/EUR | Before the announcement

The above chart is the NZD/EUR 15-minute time frame chart, and there have been here also no trends building up before the news announcement. There are no potential trade signals here until now.

NZD/EUR | After the announcement

After the news announcement, there seems to be no volatility around the candle. The pair did not build any momentum after the announcement also.

In conclusion, even though the news announcement came slightly less favorable to the NZD currency, we did not see any downtrends for NZD currency against any other currency. The market ignored the news, and there was no impact significant enough to move the currency in either direction. All of this again firmly establishes our fundamental conclusion that the labor costs economic indicator is a low impact indicator in the currency markets and can be overlooked for the fundamental analysis of currencies.

Categories
Forex Market Analysis

Daily F.X. Analysis, July 22 – Top Trade Setups In Forex – COVID19 Boosts Safe Haven!  

On the news side, the Canadian inflation rate will be in highlights, while the U.S. will release its existing home sales, which can drop as people may not have invested in the fixed assets amid covid19. The market can exhibit retracements from yesterday’s price actions.

Economic Events to Watch Today  


EUR/USD – Daily Analysis

The EUR/USD pair was closed at 1.15283 after placing a high of 1.15395 and a low of 1.14227. Overall the movement of the EUR/USD pair remained bullish throughout the day. The EUR/USD pair extended its bullish streak for 3rd day and reached the highest level since January 2020 after crossing 1.1500 level. The pair surged based on an agreement on a massive stimulus plan and broad-based U.S. dollar weakness.

The U.S. Dollar Index traded at its lowest since March at 95.37level on Tuesday and posted the third decline in a row. It dragged the U.S. dollar, which ultimately pushed EUR/USD higher. The U.S. dollar was weak due to hopes for a potential second set of the stimulus package from Congress and a rising number of coronavirus cases in the U.S. The broad-based U.S. dollar weakness gave a push to EUR/USD pair prices.

On Europe front, the long-awaited 750 billion euros stimulus package from the European Commission was agreed on by all member countries with some changes in its initial proposal. The 750 Euros worth package included 500 billion for grants and 250 billion for loans, but it was changed to 390 Billion in grants and 360 Billion in loans on Monday.

The agreed package sends tens of billions of euros to countries hardest hit by the virus, most importantly Spain and Italy, that has suffered hardest from the pandemic against its E.U. counterparts.

After the E.U. stimulus plan was approved by its member states, the hopes for E.U. economic recovery, after being hit by the pandemic, raised and boosted risk-on market sentiment in the market. As in result, the risk-perceived Euro currency gained and pushed EUR/USD pair higher.

The risk sentiment in the market was also supported by the hopes of a potential virus vaccine. The trials of coronavirus vaccine from the U.K. and China gave positive results in early-stage tests. Both countries claimed that the vaccine developed by their companies induced an immune response in the studied participants.

The increased risk sentiment after the potential vaccine news added further in the gains of EUR/USD pair. In the absence of any macroeconomic data release on Tuesday, the pair continued to follow the good news reaction and U.S. dollar weakness and reached above 1.1500 level.

Daily Technical Levels

Support Resistance

1.1454    1.1572

1.1379    1.1615

1.1335    1.1690

Pivot point: 1.1497

EUR/USD– Trading Tip

The EUR/USD is trading within a bullish channel, providing resistance at 1.1556 level. Below this, the EUR/USD may find support at 1.1501 level. While the bullish breakout of 1.1556 can lead EUR/USD prices further higher until 1.1613 levels. The MACD and RSI are holding in a bullish zone, and these may drive bearish correction in the market today. Let’s expect selling bias below 1.1550 level today until 1.1500 and 1.1465. 


GBP/USD – Daily Analysis

The GBP/USD pair was closed at 1.27329 after placing a high of 1.27677 and a low of 1.26484. Overall the movement of GBP/USD pair remained bullish throughout the day. The GBP/USD pair extended its bullish rally and rose to its 5-week highest level since June 10 above 1.2700 level. The bullish rally in currency pair was caused by the risk sentiment and broad-based U.S. dollar weakness.

In the absence of any Brexit headline or major macroeconomic data release, the currency pair GBP/USD followed the U.S. dollar’s selling bias and continued its bullish streak for 3rd day. The continuous surge in coronavirus cases in the U.S. raised worries that the economic recovery is expected to take much longer than expected and kept the U.S. dollar bulls defensive. The sentiment was coupled with the optimism in the market about vaccine development and further decreased the safe-haven greenback.

As for the virus vaccine, the leading British drugmaker AstraZeneca and Oxford University revealed that their COVID-19 vaccine induced an immune response in its first clinical trials on humans. Two other potential vaccines, developed by Cansino Biologics in teamwork with China’s military establishment and the German drugmaker Biotech in collaboration with U.S. drugmaker Pfizer, also showed positive results early stages of the trials.

The risk sentiment was again boosted by the potential virus vaccine positive news and lead the pair GBP/USD on the upside. On the data front, the Public Sector Net Borrowing from the U.K. reached 34.8 B against the expected 34.5 B and gave almost null-effect to GBP/USD as it came as expected. On the U.S. front, there was no macroeconomic data on Tuesday.

On the virus front, the British economy has been hit hard by pandemic as last week, the Office for Budget Responsibility forecasted that the U.K. economy would contract between 10.6% -14.3%. However, the Chief Economist, Andy Haldane, maintained the optimistic tone in her speech and said that the economy had recovered about half of the fall seen in March & April after the pandemic. He added that the economy had produced a V-shaped bounce back.

These positive notes by Andy Haldane not only added in the risk sentiment but also pushed the currency pair GBP/USD gains even higher towards a 5-week top level.

Daily Technical Levels

Support Resistance

1.2664     1.2782

1.2597     1.2835

1.2545     1.2901

Pivot Point: 1.2716

GBP/USD– Trading Tip

The GBPUSD is also holding in an overbought zone, and now it can drop until 1.2685 level, which marks 23.6% Fibonacci retracement below this the next support will be found around 1.2670 level. At the same time, resistance stays at 1.2730 and 1.2760. The RSI and MACD are in the bullish zone, but they form smaller histograms that suggest odds of selling bias in the market. Let’s consider taking selling trade below 1.2740 until 1.2675 level today.  


USD/JPY – Daily Analysis

The USD/JPY pair reached under resumed bearish pressure during the U.S. session as another USD selling-wave knocked the markets. Currently, the USD/JPY pair is trading at its weakest level in 5 days at 106.85, losing 0.35% daily. The risk-on market sentiment initially got support from the fresh, upbeat report that Bloomberg has just reported about a COVID-19 vaccine developed; as the Russian Defense Ministry stating that they completed Phase 2 trials, leading First Deputy Defense Minister Ruslan Tsalikov to say the first domestic inoculation is ready for use, the article reads. Also, Japan approved the usage of dexamethasone to be included in Japan’s basket of cures to the pandemic, after earlier passing Gilead’s redelivery for its use. 

However, the vaccine news suggests that the pandemic’s cure is nearby, which favored the risk sentiment. There are approximately 16 other vaccines that are in the progress of clinical trials in Australia, France, Germany, India, South Korea, the U.K., the U.S., and China.

The European Union (E.U.) leaders agreed on late Monday for a possible €1.8 trillion ($2.06 trillion) coronavirus spending package but with some changes in the proposal that was meant to reverse the coronavirus-induced slump in the European economies.

This news boosted the risk-on market sentiment and strengthened the bid tone around riskier assets. An additional boost on the risk sentiment was derived from negotiations for a second stimulus package in the U.S. after the sustained rise in the pandemic cases from the U.S., which increased hopes of America’s Phase 4 stimulus. Consequently, the safe-haven assets are facing boosted demand to expect Japanese yen as Japan is facing an increased number of COVID19 cases. 

Daily Technical Levels

Support Resistance

106.99     107.51

106.74     107.78

106.47     108.03

Pivot point: 107.26

 USD/JPY – Trading Tips

The USD/JPY has violated the symmetric triangle pattern, supporting the pair at 107 levels. Besides, the pair has also dropped below 50 periods EMA, which is suggesting further selling bias in the USD/JPY pair. On the lower side, the USD/JPY is facing support at 106.700 level, and closing of candles above this may drive slight bullish correction until 107 and 107.100 level before it continues with its selling bias. A bearish breakout of 106.700 level can drop until 106.535 level. Good luck! 

Categories
Crypto Market Analysis

Daily Crypto Review, July 22 – Ethereum Passes Bitcoin and Becomes the Most Used Blockchain

The cryptocurrency market spent yet another day shooting for the upside as Bitcoin tries to push itself closer towards $10,000. Bitcoin is currently trading for $9,358, which represents an increase of 1.75% on the day. Meanwhile, Ethereum gained 3.06% on the day, while XRP gained 1.35%.

 Daily Crypto Sector Heat Map

When talking about top100 cryptocurrencies, Augur gained 22.19% on the day, making it the most prominent daily gainer. Elrond (20.66%) and Blockstack (16%) also did great. On the other hand, Synthetix Network has lost 10.2%, making it the most prominent daily loser. It is followed by Reserve Rights’ loss of 6.28% and Algorand’s loss of 4.53%.

Top 10 24-hour Performers (Click to enlarge)

Bottom 10 24-hour Performers (Click to enlarge)

Bitcoin’s dominance level stayed at the same level since we last reported, with its value currently at 62.79%. This value represents a 0.04% difference to the downside when compared to Friday’s value.

Daily Crypto Market Cap Chart

The cryptocurrency market capitalization increased slightly when compared to when we last reported, with the market’s current value being $277.53 billion. This value represents an increase of $1.98 billion when compared to the value it had on yesterday.

_______________________________________________________________________

What happened in the past 24 hours?

_______________________________________________________________________

_______________________________________________________________________

Technical analysis

_______________________________________________________________________

Bitcoin

The largest cryptocurrency by market capitalization spent the day furthering yesterday’s strides towards $9,580, and ultimately $10,000. However, with volume fading as well as RSI stepping into the overbought territory, it is unlikely that Bitcoin will pass $9,580 without consolidation.

BTC traders should look for a trade opportunity after bitcoin loses bull presence or after it passes $9,580.

BTC/USD 4-hour Chart

Technical factors:

  • Price is above its 50-period EMA and its 21-period EMA
  • Price at its top B.B.
  • RSI is overextended (69.87)
  • Increased volume (descending)

Key levels to the upside          Key levels to the downside

1: $9,580                                 1: $9,251

2: $9,735                                 2: $9,120

3: $9,870                                  3: $8,980

Ethereum

Ethereum continued on its path towards the upside in the past 24 hours. The second-largest cryptocurrency by market cap established its presence above $240 and pushed towards $251. However, the bullish presence is fading, and Ethereum is losing its momentum towards the upside.

Ethereum traders should look for an opportunity in searching for pullbacks.

ETH/USD 4-hour Chart

Technical Factors:

  • Price is above the 50-period EMA and the 21-period EMA
  • Price at the top B.B.
  • RSI elevated (68.02)
  • One candle volume spike (rest is average)

Key levels to the upside          Key levels to the downside

1: $251.4                                 1: $240

2: $260                                    2: $228

3: $278                                     3: $225.4

Ripple

The third-largest cryptocurrency by market cap spent another day trading in a sideways manner. Its moves are bound by the $0.19 support level and (more often) $0.2 resistance level. XRP’s next move will most likely be determined by Bitcoin’s move (in any direction).

XRP traders can look for an opportunity to trade when the currency breaks $0.2 with increased Volume, or falls down below $0.19 with increased volume.

XRP/USD 4-hour Chart

Technical factors:

  • XRP in a mid-term descending trend (though it broke the trend in the short-term)
  • XRP lacks strong support levels below $0.178
  • Price above 21-period and the 50-period EMA
  • Price slightly above middle B.B. (20-period SMA)
  • RSI is neutral (53.58)
  • Average/slightly low Volume

Key levels to the upside          Key levels to the downside

1: $0.2                                      1: $0.19

2: $0.205                                  2: $0.178

3: $0.214


Categories
Crypto Market Analysis

Daily Crypto Review, July 21 – Mastercard Bullish On Bitcoin; Paxos To Become Paypal’s Bitcoin Custodian

The cryptocurrency market spent the day trying to reach past its immediate resistance levels. Bitcoin is currently trading for $9,330, which represents an increase of 1.31% on the day. Meanwhile, Ethereum gained 1.26% on the day, while XRP gained 0.28%.

 Daily Crypto Sector Heat Map

When talking about top100 cryptocurrencies, Augur gained 11.37% on the day, making it the most prominent daily gainer. Waves (11.36%) and DxChain Token (6.32%) also did great. On the other hand, Band Protocol has lost 19.85%, making it the most prominent daily loser. It is followed by Kava’s loss of 17.94% and iExec RLC’s loss of 16.09%.

Top 10 24-hour Performers (Click to enlarge)

Bottom 10 24-hour Performers (Click to enlarge)

Bitcoin’s dominance level increased slightly since we last reported, with its value currently at 62.83%. This value represents a 0.33% difference to the upside when compared to Friday’s value.

Daily Crypto Market Cap Chart

The cryptocurrency market capitalization increased slightly when compared to when we last reported, with the market’s current value being $275.58 billion. This value represents an increase of $2.89 billion when compared to the value it had on yesterday.

_______________________________________________________________________

What happened in the past 24 hours?

_______________________________________________________________________

_______________________________________________________________________

Technical analysis

_______________________________________________________________________

Bitcoin

The largest cryptocurrency by market capitalization spent the day contesting and poking the $9,251 resistance level until a large spike caused by an increase in bear presence brought its price to $9,380. Bitcoin passed $9,251 instantly, but could not reach $9,580. It is currently trying to stabilize at around $9,330.

BTC traders should look for a trade opportunity after bitcoin establishes its position.

BTC/USD 4-hour Chart

Technical factors:

  • Price is above its 50-period EMA and its 21-period EMA
  • Price above the top B.B.
  • RSI is overextended (69.86)
  • Increased volume

Key levels to the upside          Key levels to the downside

1: $9,580                                 1: $9,251

2: $9,735                                 2: $9,120

3: $9,870                                  3: $8,980

Ethereum

Ethereum accompanied Bitcoin on its slow path towards the upside, but with its own little twist. While the upswings were much more explosive, the downswings were slower and less volatile. Ethereum reached past $240, which is where it is consolidating at the moment. The start of the explosive move got supported by the influx of buyers as well as the 21-period and 50-period moving averages, which were right at the bottom of the candle.

Ethereum traders should look for an opportunity when Ethereum confirms that it will stay above $240, or when it fails to do so.

ETH/USD 4-hour Chart

Technical Factors:

  • Price is above the 50-period EMA and the 21-period EMA
  • Price above the top B.B.
  • RSI elevated (67.20)
  • Slightly increased volume

Key levels to the upside          Key levels to the downside

1: $240                                    1: $228

2: $251.4                                 2: $225.4

3: $260                                     3: $218

Ripple

The third-largest cryptocurrency by market cap, unlike Bitcoin and Ethereum, had a pretty slow day. XRP hovered around the $0.2 resistance level, but could not break it. The inability to break this level might come from the steady low volume XRP has. For the time being, XRP will continue to trade stuck in a range, bound by support level of $0.19 and resistance level of $0.2.

XRP traders can look for an opportunity to trade when the currency breaks $0.2 with increased volume, or falls down towards $0.19 with increased volume.

XRP/USD 4-hour Chart

Technical factors:

  • XRP in a mid-term descending trend (though it broke the trend in the short-term)
  • XRP lacks strong support levels below $0.178
  • Price above 21-period and the 50-period EMA
  • Price between the middle B.B. (20-period SMA) and the top B.B.
  • RSI is neutral (56.72)
  • Volume average

Key levels to the upside          Key levels to the downside

1: $0.2                                      1: $0.19

2: $0.205                                  2: $0.178

3: $0.214


Categories
Forex Market Analysis

Daily F.X. Analysis, July 21 – Top Trade Setups In Forex – Weaker Dollar Sentiment! 

The U.S. dollar continued to struggle because of the previous week’s latest U.S. consumer confidence data release. The less consumer confidence over the U.S. economy weighed on the greenback as the economy struggles to overcome the coronavirus situation. Today, the market is likely to focus on the Canadian retail sales figures, but these may not have any impact on gold and other currency pairs. Technical levels will matter today.

Economic Events to Watch Today  


EUR/USD – Daily Analysis

The EUR/USD was closed at 1.14473 after placing a high of 1.14676 and a low of 1.14022. Overall the movement of the EUR/USD pair remained bullish throughout the day. The EUR/USD exchange rate extended its gains on Monday and reached the highest level since March 9. The Euro rose against many rival currencies on hopes over a crucial milestone as the Eurozone’s governments showed consensus on a COVID-19 recovery fund. Although lower than the initial proposal of 500 billion euros in grants, the new agreed grant is now 390 billion euros, which is still a significant boost for the Eurozone’s struggling economy. 

On Monday, the European Council President Charles Michel said that he was confident a deal on the bloc’s coronavirus recovery package could be reached after putting forward a new proposal. The latest proposal offered by him provided significant concessions to the so-called frugal four countries, Austria, Denmark, Netherlands, and Sweden. In the new proposal fund, the grants were decreased to 390 Billion euros from the initial 500 billion euros, and the Loans became 360 Billion Euros from 250 billion euros.

In Eurozone economic data, Germany’s Producer Price Index for June fell below consensus at 0% and weighed on single currency Euro. As a result of EUR/USD, pair investors became increasingly concerned about the Euro zone’s largest economy’s ability to recover from the COVID-19 crisis.

On the U.S. front, the U.S. dollar continued to struggle because of the previous week’s latest U.S. consumer confidence data release. The less consumer confidence over the U.S. economy weighed on the greenback as the economy struggles to overcome the coronavirus situation.

Furthermore, the U.S. Congress was set to announce a new stimulus measure as the previous unemployment benefits package will expire at the end of July. The U.S. dollar remained weak because of the investors were looking ahead of the Congress announcement. The weak U.S. dollar added gains in the EUR/USD pair on Monday.

The next day, the U.S. investors will be looking ahead to the release of June’s Chicago Fed National Activity Index. Any improvement in the index will indicate better economic conditions and would prove positive for the U.S. dollar. The single currency euro will continue to be driven by the news surrounding the European Summit’s discussions on the COvid-19 recovery fund. The euro investors will also await Luis De Guindos, the Vice President of the ECB. Any dovish comments from ECB would cut the Euro gains.

Daily Technical Levels

Support Resistance

1.1410     1.1477

1.1372     1.1506

1.1342     1.1544

Pivot point: 1.1439

EUR/USD– Trading Tip

The EUR/USD continues to follow the same technical outlook as before. It has tested the double top resistance at 1.1446 level, and now it’s finding support at 1.1410 level. The upward trendline on the hourly chart is also likely to support the pair around 1.1375 level. Chances of bullish trend seem solid today. Therefore, the bullish breakout of the 1.1445 level can lead the EUR/USD prices towards the 1.1490 level.


GBP/USD – Daily Analysis

The GBP/USD pair closed at 1.26611 after placing a high of 1.26652 and a low of 1.25180. Overall the movement of GBP/USD pair remained strongly bullish throughout the day. The GBP/USD posted its biggest daily gains since June 30 on Monday and recovered all of its previous five day’s losses on the back of positive comments from England’s FPC and JP Morgan.

Cable found its foot against the U.S. dollar on Monday after the JPMorgan Bank said that the UK was the largest capital importer within G10. The Bank added that as the Brexit process was heading to an end of the transition period, the Cable was becoming rather less dependent on general risk sentiment and started to decouple from other high-beta currencies.

The rise in Sterling was further supported by the latest comments from Jonathan Hall, an appointee to the Bank of England’s Financial Policy Committee (FPC) on Monday. According to him, Brexit will make markets less efficient, but it will not be disastrous for Britain’s economy.

Hall said that Brexit would cause fragmentation, inefficiency, and problems with regulations, but it will not be disastrous.

Meanwhile, on Monday, the Bank of England policymaker Silvana Tenreyro said that Britain might avoid an economically damaging loss of skills in its labor market as long as the rise in unemployment does not drag on.

Tenreyro said that uncertainty persisted in the economy related to COVID-19 and that the crisis may even have led some workers to upskill to adapt to new ways of working remotely. She added that as long as the current period of high unemployment remains temporary, the loss in skills would be only limited.

In contrast to this, the Bank of England economist Andy Haldane warned inflation could be a problem after the coronavirus crisis. He insisted that Britain was enjoying a V-shaped recovery and was in the middle of a quick turnaround as the economy recovered about half of the immense fall in output in March & April when the crisis was most intense. Haldane told that the economy had been growing on an average of about 1% a week since May.

The upbeat comments from all the sides surrounding Britain gave a massive push to the GBP/USD prices on Monday. Adding in the currency pair’s gains was the U.S. dollar weakness backed by the increasing number of infected cases in the U.S. U.S. reported a record-high number of infected cases in past days with death tolls crossed 140,000, and the total number of COVID-19 cases reached 3.8 Million.

On the data front, there was no macroeconomic data to be released on the day, and hence, the pair’s movement was followed by the comments related to the U.K. economy and coronavirus headlines.

Daily Technical Levels

Support Resistance

1.2564     1.2713

1.2466     1.2764

1.2415     1.2861

Pivot Point: 1.2615

GBP/USD– Trading Tip

The GBPUSD has violated the triple top resistance level at 1.2660 level, and bullish crossover of this level opens further room for buying until 1.2729, but before this, the Sterling can retrace until 23.6% Fibo level of 1.2645 level. Below this, the next support can be found at the 1.2625 level. Above 1.2625, the GBP/USD can be showing a buying trend. Let’s consider taking buy trades over 1.2615 level today. 

USD/JPY – Daily Analysis

The USD/JPY pair was closed at 107.270 after placing a high of 107.541 and a low of 106.999. Overall the movement of the USD/JPY pair remained bullish throughout the day. The USD/JPY pair rose to 8 days the highest level on Monday on the back of Japan’s risk sliding back into deflation and the rising numbers of coronavirus cases in the U.S.

Bank of Japan released its minutes of June meeting in which the policymakers debated at the risk of the country sliding back into deflation but stopped short of supporting stronger steps to prevent companies from going bankrupt due to coronavirus pandemic.

More companies were facing the risk of insolvency with the impact of coronavirus pandemic likely to last for a prolonged period of time, even if the companies receive immediate liquidity support. But the members of BOJ differentiate on the opinion of injecting capital into firms to help recover and prevent insolvency.

Some members insisted that injected direct capital to save the struggling firms is an action that should come from the government, and few members said that it was the role of BOJ to provide liquidity and also to cooperate with the government while clarifying the respective role.

The Bank of Japan kept its interest rates unchanged in June after easing monetary policy in March and April. Minutes revealed that the Bank maintained its view over the economy as it will gradually recover from the pandemic’s damage.

However, many members showed concern as the pandemic was picking its pace once again. Japan lifted its lockdown measures in late May, and Tokyo has seen a renewed spike in infections lately. Japan has reported over 25,000 cases, including 1,000 deaths. The downbeat comments from the latest issued meeting minutes by Bank of japan pushed the USD/JPY pair higher on Monday.

On greenback front, the currency was down on Monday as the U.S. Dollar Index decreased by 0.6% to 95.85 level. The currency was suffering from its economy’s struggle to fight the coronavirus crisis as the nation was leading in reporting infected cases worldwide.

U.S. figures related to infected people raised to 3.8 Million, and death toll count reached 140,000 making the U.S. the most affected economy by the pandemic. Despite the safe-haven status of U.S. dollar investors, they were getting out of it due to the U.S. economy’s gloomy outlook.

The rising number of cases urged some states to introduce renewed lockdown measures that weighed on economic recovery hopes, and hence, the U.S. dollar became weak. However, the weak U.S. dollar failed to turn USD/JPY’s gains on Monday.

Daily Technical Levels

Support Resistance

106.99     107.51

106.74     107.78

106.47     108.03

Pivot point: 107.26

 USD/JPY – Trading Tips

The USD/JPY is consolidating in a broad trading range of 107.400 – 107, while the overall bias seems neutral at 107.191. The USD/JPY pair has recently crossed over 50 EMA, which extended resistance at 107 level, including now the same level will work as a support. The bearish breakout of the 107 level can extend the selling trend until 106.580. Simultaneously, the bullish breakout of the 107.400 level can extend the buying trend until 107.600. The MACD and RSI support bearish bias, and we may take a selling trade below 107 and buying above the same level today. Good luck! 

Categories
Forex Fundamental Analysis

The Impact Of ‘Long Term Unemployment Rate’ On A Nation’s Economy

Introduction

The long-term unemployment rate is a killer of economic growth. Its impact on the individual and society as a whole cannot be ignored, particularly in emerging economies. Understanding long-term unemployment trends can help us identify increases and decreases in the dependent economic indicators and their overall impact.

What is Long Term Unemployment Rate?

Long-term unemployment

It occurs when a worker actively seeking employment is unable to find a job for 27 weeks or more. To be included in the statistic, the participant should have actively sought employment in the last four weeks. To be recorded in the statistic, the worker should have been actively seeking employment even after being unemployed for six or more months. Hence, it is probably undercounted as most people do not continuously seek employment for six straight months out of discouragement.

Hence, the long-term unemployment rate is then the percentage share of the labor force that is unemployed for six or more months, given that they have actively sought employment in the last month.

How can the Long Term UR numbers be used for analysis?

Long-term unemployment is majorly caused by cyclical and structural unemployment. Cyclical unemployment occurs due to the natural business cycles that companies go through. Most businesses have specific quarters when business is low, where they might downsize and lay off employees. Seasonal hiring and firing constitute cyclical unemployment. Cyclical unemployment also occurs during economic slowdowns and recessions.

Structural unemployment occurs when unemployed labor skills do not match the available job requirements. Unlike cyclical unemployment, it is not dependent on business cycles. Structural unemployment is more challenging to address than cyclical unemployment. It keeps the unemployment rates high long after the economy’s recovery out of recession. It occurs when business and technology shifts during the time of unemployment make unemployed labor skills outdated.

Long-term cyclical and structural unemployment has a positive feedback effect on each other making things worse. Cyclical unemployment during business slowdowns increases the unemployment rate. When they are unemployed long enough, their skills become outdated and gives rise to structural unemployment. This overall reduces consumer spending for the unemployed and indirectly affects consumer sentiment of the employed. When consumer spending drops, other industries also observe the same cyclical and structural unemployment, spiraling the economy downward.

Long-term unemployment can lead to people working in underpaid jobs or find work not relevant to their skills out of desperation. It reduces economic productivity as skilled laborers are not being utilized for what they know best. Secondly, long-term unemployment places a financial crunch that can have a demoralizing effect on happiness, mental state, and job satisfaction. It is also observed that long unemployment periods tend people to self-isolate from the community. Anti-social behavior and hooliganism are also benefited from long-term unemployment.

While the government gives out unemployment benefits, which may encourage them to hold off to find better paying and more suitable jobs to their skills, it decreases public spending. When the unemployment rates are high, public spending takes a direct hit, crippling the government from spending their revenue on activities that help economic growth. As the government keeps giving out benefits, it has led to a rise in long-term unemployment rates. While benefits are necessary to mitigate financial impact during unemployment, it also tends to increase unemployment duration, which is terrible for economic growth.

As long as long-term unemployment is prevalent, improving the living standards of people is hard to accomplish. People cannot apply for loans or buy a house on a mortgage if they frequently lose jobs and take a long time to find new jobs. Financial insecurity and strained personal finances discourage people from spending and encourage saving for another jobless quarter or two. Long-term unemployment has a severe effect on householders, with only one working individual who provides for the family.

Long-term unemployment is bad for the economy. On the flip side, 50% of the long-term unemployed find a job in six months, and 75% do within a year. Within 18 months, the remaining also does find something or the other if they keep looking.

Chart Credit: OECD

Overall, it is more challenging to reduce long-term unemployment than short-term cyclical unemployment. It is a critical hindrance to achieving high growth rates for any country. The above statistic shows how it is an international issue and not any particular set of countries.

Impact on Currency

Long-term unemployment rates are not as important as unemployment rates, jobless claims, non-farm payroll numbers. As unemployment rates itself include the long and short-term ones, it is not an important economic indicator for currency markets.

Hence, it is a lagging low-impact indicator. It is an inversely proportional indicator, meaning high long-term unemployment is bad for the economy and currency.

Economic Reports

In the United States, The Bureau of Labor Statistics publishes monthly employment and unemployment reports under the Employment Situation Report. Table A-12 in it details the long-term unemployed figures. The figures are seasonally adjusted for month-over-month, and year-over-year comparisons are also provided.

Long-term unemployment reports are also maintained by the Organization for Economic Cooperation and Development (OECD). It defines long-term unemployment if a person is unemployed for 12 or more months.

Sources of Long Term Unemployment Rate

The United States Bureau of Labor Statistics’ Long-term Unemployment data is available here. The Bureau of Labor Statistics publishes monthly employment and unemployment reports on its official website for our analysis. The OECD also maintains long-term unemployment data. Consolidated reports of long-term unemployment rates of most countries can also be found in Trading Economics.

Impact of ‘Long Term Unemployment Rate’ News Release on the Forex Price Charts

The long term unemployment refers to those persons who have been unemployed for more than 52 consecutive weeks. Very long term unemployment rate refers to those persons who have been unemployed for more than 104 consecutive weeks. This data is essential for the government and economists who analyze quarterly and yearly trends of unemployment.

It helps them in understanding the long term employment situation of the country. However, the monthly numbers are significant to the market players when it comes to the forex market. Therefore, the impact of long term unemployment is not realized immediately on the currency pair.

The below image shows the latest long term unemployment data of Australia that was released in February. We can see the unemployment rate was the same compared to the previous year, but there was a reduction in the percentage of the labor force. In the following sections, we will observe the change in volatility due to the news release.

AUD/USD | Before the announcement

The above image is a 1-hour timeframe AUD/USD chart showing the moves from February 25th to March 1st, 2020. The currency has been slowly moving down and picks up a little momentum in its drop-down after February 28th.

AUD/USD | After the announcement

The above image is a snapshot of AUD/USD on the day of long-term unemployment rates in Australia news announcement on February 27th, 2020. The report published by the treasury department of Australia showed lower unemployment rates than the previous year. The favorable figures for AUD did not reflect in the pair’s non-volatility.

AUD/GBP | Before the announcement

The above image is a 1-hour timeframe AUD/GBP chart showing the moves from 25th to February 26th. The currency has not shown any clear down or uptrends till now.

AUD/GBP | After the announcement

The above image highlights the currency pair move throughout the news announcement day. We can see that there was only about a 40-pip maximum move, which is minimal movement and typical for such a pair. The news did not build any rallying up for AUD against GBP.

AUD/EUR | Before the announcement

The above image is a 1-hour timeframe AUD/EUR chart before February 27th, 2020. As we can see, AUD has been losing its value slowly against EUR in the last two days.

AUD/EUR | After the announcement

The above image highlights the news announcement day. We can see that despite the long-term unemployment rates came in favor of AUD, the market ignored and continued selling AUD and purchased EUR. The downward trend before continued during and after the news announcement day without any effect.

In conclusion, as we have seen, the long-term unemployment economic indicator was almost entirely ignored by the market. The market knows it is a lagging indicator, and the effects have already been priced into the market, therefore showing no volatility during the news announcement. Hence, the above trend analysis confirms our fundamental analysis of the economic indicator as a low impact lagging indicator that is overlooked by the currency market.

Categories
Forex Market Analysis

Daily F.X. Analysis, July 20 – Top Trade Setups In Forex – E.U. Economic Summit Ahead

On the news front, the market seems to be muted due to a lack of high impact on economic events. The Eurozone’s German Buba report and current account data will remain in focus, but I highly doubt if this will drive any market movement.

Economic Events to Watch Today 


EUR/USD – Daily Analysis

The EUR/USD pair was closed at 1.14248 after placing a high of 1.14434 and a low of 1.13750. Overall the movement of the EUR/USD pair remained bullish throughout the day. The EUR/USD pair edged higher on Friday and rose near 1.145 level on the increased hopes for further progress on the European Union’s 750 billion euros recovery fund. As a result, the EUR/USD pair traders became optimistic that Eurozone’s economy could be on the road to recovery.

Traders expected some progress in the 2-day Summit even though the German Chancellor Angela Merkel was downbeat about a consensus between E.U. leaders over the recovery fund. She said that the differences were too large to predict that a positive result will reach this time. She added that though it would be desirable, we must be realistic. She said that to reach an agreement, a great deal of willingness to compromise was required, demanding very difficult negotiations.

Meanwhile, on the data front, at 14:00 GMT, the Final CPI from the Eurozone for the year in June came in line with the expectations of 0.3%. The Final Core CPI for the year also remained as expected, 0.8% from the Eurozone. From the U.S. side, the TIC Long-Term Purchases for May came in as 127 B compared to April’s -130.8B. At, 17:30 GMT, the Building Permits in June dropped to 1.24M against the expected 1.30M and weighed on the U.S. dollar. The Housing Starts, however, came in line with the expectations in June as 1.19M.

At 19:00 GMT, the Prelim UoM Consumer Sentiment for July dropped to 73.2 against the expected 79.0 and weighed on the U.S. dollar. The Prelim UoM Inflation Expectations in July increased to 3.1% from the previous 3.0%. The poor than expected data from the United States on Friday pushed the already rising EUR/USD pair.

Further weighing on the greenback was the escalating tensions between U.S. & China trade relations after US Trump’s administration was considering a blanket ban on all Chinese Communist Party members to the U.S.. This news made the markets cautious, and investors became seriously concerned over the economic recovery.

The greenback came under pressure due to its struggles against fighting the pandemic and coping with the increased number of unemployment claims that came in as 1.3M in recent weeks. The weak U.S. dollar helped the EUR/USD pair to gain its strength in the market.

Daily Technical Levels

Support Resistance

1.1355     1.1428

1.1326     1.1472

1.1282     1.1501

Pivot point: 1.1399

EUR/USD– Trading Tip

The EUR/USD has tested the double top resistance at 1.1446 level, and now it’s finding support at 1.1410 level. The upward trendline on the hourly chart is also likely to support the pair around 1.1375 level. Chances of bullish trend seem solid today; therefore, the bullish breakout of 1.1445 level can lead the EUR/USD prices towards 1.1490 level.


GBP/USD – Daily Analysis

The GBP/USD pair was closed at 1.25645 after placing a high of 1.25742 and a low of 1.25115. Overall the movement of GBP/USD pair remained bullish throughout the day. On Friday, Bank of England’s Governor, Andrew Bailey, said that Britain’s economy was starting to recover from its coronavirus lockdown induced crisis, but some job-intense sectors remained weak. He also added that the long-term outlook for the country remained unclear as well.

During a webinar organized by the central bank, Bailey said that the visible activity return could mean the beginning of the recovery. There were signs of activity returning in the Housing market and new car sales but not in hospitality and entertainment that employ many people.

The Governor also warned against the optimism of his chief economist Andy Haldane who has declared that there would be a V-shaped recovery in the economy post Coronavirus. He said that rebound would depend on people’s return to work and go shopping and dining out. He also said that recovery would depend on the progress of medical companies in finding cures and vaccines for the COVID-19 and also the impact of the second wave.

Earlier this week, Britain’s budget forecasters said that economy could shrink by more than 14% this year if there will be lasting damages by the pandemic. The British Pound continued to grind sideways on Friday as Governor Bailey provided gloomy comments, and traders became cautious. However, the U.S. dollar’s weakness kept the GBP/USD pair on the higher track.

On Friday, at 17:30 GMT, the Building Permits from the U.S. for May dropped to 1.24M against the expected 1.30M and weighed on the U.S. dollar. The Housing Starts, however, came in line with the expectations of 1.19M. At 19:00 GMT, the Prelim UoM Consumer Sentiment was dropped to 73.2 from the expected 79.0 and weighed on the U.S. dollar. 

Due to poor than expected macroeconomic data, the weak U.S. dollar caused a surge in GBP/USD prices on Friday in the absence of any macroeconomic data from Britain. Meanwhile, on Friday, the U.K.’s 38 Billion Dollars’ worth Stimulus package announced by Rishi Sunak came under fire after the opposition Labour Party called on the country’s spending watchdog to open an investigation over it.

Daily Technical Levels

Support Resistance

1.2505     1.2610

1.2459     1.2671

1.2399     1.2716

Pivot Point: 1.2565

GBP/USD– Trading Tip

The GBP/USD is trading with a selling bias at 1.2550 level, holding right above the support level of 1.2548 level. Downward breakout of 1.2548 level can extend selling until 1.2506 and 1.2479 support. The MACD and RSI both are supporting a bearish bias. On the upper side, the GBP/USD can face resistance at 1.2575 and 1.2595. Let’s consider taking Sell trades below 1.2533 level today. 


USD/JPY – Daily Analysis

The USD/JPY pair was closed at 107.021 after placing a high of 107.359 and 106.938. Overall the movement of the USD/JPY pair remained bearish throughout the day. The U.S. dollar was marginally lower in early European trade hours on Friday as traders looked past the resurgence in coronavirus cases worldwide and the need for a safe-haven. The U.S. dollar’s focus was on the likelihood of more fiscal stimulus ahead rather than on its safe-haven status.

According to Johns Hopkins University data, the number of coronavirus cases rose to 13.84 million globally. On Thursday, the United States reported almost 77,000 new cases that raised economic recovery concerns.

The sharp increase in the central bank’s stimulus packages to protect economies from the consequences of the pandemic has weighed on the U.S. dollar. The U.S. reported 71,558 new COVID-19 cases on Saturday and made its second day in a row to post more than 70,000 cases, according to Johns Hopkins University. The average daily rise in cases improved by 18.34% as compared to one week ago.

The increasing number of cases urged U.S. lawmakers to partially shut the economies again to control the spread of the virus. This raised fears that economies will suffer from the re-imposed restrictions and calls for more stimulus packages emerged. The need for more stimulus packages from the U.S. and across the globe to save the economy for coronavirus induced lockdowns weighed on the U.S. dollar that dragged the USD/JPY pair on Friday.

On the flip side, there were also reports on the weekend that Trump’s administration was trying to block billions of dollars in an upcoming coronavirus relief fund that was allocated to states for conducting tests and contact tracing. Reports also suggested that Trump’s administration was also blocking the amount of 5 billion that was to be allotted to the Centers for Disease Control and Prevention.

Furthermore, the New York Federal Reserve President John Williams said that it could take a few years for the U.S. economy to recover from the pandemic, and it was not yet the time to think about rising interest rates. The long-lasting decreased interest rates also weighed on the U.S. dollar and kept the pair USD/JPY prices under pressure.

On the data front, at17:30 GMT, the Building Permits fell to 1.24M from the expected 1.30M and weighed on the U.S. dollar. The TIC Long-Term Purchases for May came in as 127 B in comparison to April’s -130.8B. At 19:00 GMT, The Prelim UoM Consumer Sentiment for July also declined to 73.2 from the anticipated 79.0 and weighed on the U.S. dollar. The Prelim UoM Inflation Expectations in July rose to 3.1% from the previous 3.0%.

The poor than expected macroeconomic data from the U.S. weighed on the USD/JPY pair and dragged the pair below the 107 level.

Daily Technical Levels

Support Resistance

106.93    107.51

106.59    107.75

106.35    108.09

Pivot Point: 107

 USD/JPY – Trading Tips

The USD/JPY is consolidating in a broad trading range of 107.400 – 107, while the overall bias seems neutral at 107.191. The USD/JPY pair has recently crossed over 50 EMA, which extended resistance at 107 level, including now the same level will work as a support. The bearish breakout of the 107 level can extend the selling trend until 106.580. 

Simultaneously, the bullish breakout of the 107.400 level can extend the buying trend until 107.600. The MACD and RSI support bearish bias, and we may take a selling trade below 107 and buying above the same level today. Good luck! 

Categories
Crypto Market Analysis

Daily Crypto Review, July 20 – Twitter Hacker Possibly a BitMEX Trader; Hack Will End Up Being Good for Bitcoin?

The cryptocurrency market spent the weekend recovering from the descending trend that brought Bitcoin to $9,000. Bitcoin is currently trading for $9,200, which represents an increase of 0.15% on the day. Meanwhile, Ethereum gained 1.51% on the day, while XRP lost 0.49%.

 Daily Crypto Sector Heat Map

When talking about top100 cryptocurrencies, Band Protocol gained 39.23% on the day, making it by far the most prominent daily gainer. Terra (30.63%) and Swipe (28.00%) also did great. On the other hand, Flexacoin has lost 31.16%, making it the most prominent daily loser. It is followed by iExec RLC’s loss of 11.66% and Reserve Rights’ loss of 10.95%.

Top 10 24-hour Performers (Click to enlarge)

Bottom 10 24-hour Performers (Click to enlarge)

Bitcoin’s dominance level increased slightly since we last reported, with its value currently at 62.5%. This value represents a 0.33% difference to the downside when compared to Friday’s value.

Daily Crypto Market Cap Chart

The cryptocurrency market capitalization increased slightly when compared to when we last reported, with the market’s current value being $272.69 billion. This value represents an increase of $3 billion when compared to the value it had on Friday.

_______________________________________________________________________

What happened in the past 24 hours?

_______________________________________________________________________

_______________________________________________________________________

Technical analysis

_______________________________________________________________________

Bitcoin

The largest cryptocurrency by market capitalization spent the weekend slowly regaining its value after the drop to $9,000. The slow rise in price was stopped by an influx of buyers, which tried to bring the price above the $9,251 resistance level but failed to do so as the sheer volume was too low. Bitcoin is now consolidating at around the $9,200 level.

BTC traders should look for a trade opportunity in the range that is bound by the nearest support and resistance levels.

BTC/USD 4-hour Chart

Technical factors:

  • Price is above its 50-period EMA and its 21-period EMA
  • Price right below the top B.B.
  • RSI is neutral (53.87)
  • Lower than average volume

Key levels to the upside          Key levels to the downside

1: $9,251                                 1: $9,120

2: $9,580                                 2: $8,980

3: $9,735                                  3: $8,820

Ethereum

While Ethereum accompanied Bitcoin on its slow path towards the upside, it did so with much lower volume and volatility. The most recent hours brought a sharp increase in price, which attempted to bring the price above $240, but the push was unsuccessful. Ethereum is now consolidating right below the $240 level.

Ethereum traders should look for an opportunity when Ethereum starts moving down, or when it reacts to the next support/resistance level.

ETH/USD 4-hour Chart

Technical Factors:

  • Price is above the 50-period EMA and the 21-period EMA
  • Price above the top B.B.
  • RSI elevated (63.03)
  • Average/slightly increased volume

Key levels to the upside          Key levels to the downside

1: $240                                    1: $228

2: $251.4                                 2: $225.4

3: $260                                     3: $218

Ripple

The third-largest cryptocurrency by market cap moved along its range-bound upwards path towards $0.2. While the move got stopped at $0.2, XRP managed to gain some value over the course of the weekend. Volume remained stable throughout this slow increase, which is a great indicator.

XRP traders can look for an opportunity to trade when the currency breaks $0.2 with increased volume, or falls down towards $0.19 towards increased volume.

XRP/USD 4-hour Chart

Technical factors:

  • XRP in a mid-term descending trend (though it broke the trend in the short-term)
  • XRP lacks strong support levels below $0.178
  • Price above 21-period and the 50-period EMA
  • Price between the middle B.B. (20-period SMA) and the top B.B.
  • RSI is neutral (55.26)
  • Volume average

Key levels to the upside          Key levels to the downside

1: $0.2                                      1: $0.19

2: $0.205                                  2: $0.178

3: $0.214


Categories
Forex Market Analysis

Daily F.X. Analysis, July 17 – Top Trade Setups In Forex – Final CPI Under Spotlight! 

On the news front, the market may not offer high impact events, but the focus will stay on the UK BOE Gov Bailey Speaks and Prelim UoM Consumer Sentiment from the United States. Since it’s Friday, we can experience sharp movements in the market, especially during U.S. sessions.

Economic Events to Watch Today 


EUR/USD – Daily Analysis

The EUR/USD pair was closed at 1.13818 after placing a high of 1.14415 and a low of 1.13703. The EUR/USD pair broke its four-day bullish streak on Thursday and started posting losses on the back of European Central Bank’s monetary policy meeting decision combined with the broad-based U.S. dollar strength.

The ECB left its rates unchanged on Thursday; however, the latest recovery plan’s decision worth 750 billion euros was still pending. The European Central Bank held its refinancing operations at 0% and pledged to roll out more stimulus if the Eurozone’s economic recovery slowed materially. However, the meeting was seen as something of a non-event by the analysts, who think that the E.U. Summit will overshadow the ECB announcement.

A two-day European Summit will occur on Friday, and the ECB Governor called for fiscal support just a day ahead of the Summit. E.U. leaders will discuss the European Commission proposal’s distribution pattern for a 750 billion euros recovery plan. This plan was introduced to help some of the economic bloc’s worst-hit members.

According to Christine Lagarde, European leaders must show quick agreement on an ambitious package. Member states disagree on how the recovery package should be funded, and to show an agreement on it, all 27 E.U. member states need to back this package.

However, Italy has backed the proposal before the E.U. Summit to guide other member states to follow its footsteps. However, the Netherland, Sweden, Denmark, and Austria, known as “Frugal Four,” insist that these funds should be released as loans rather than as grants. In its last videoconference meeting, the E.U. leaders failed to reach an agreement, and the decision was forwarded to the next meeting. On Friday, the leaders will again discuss the distribution of the recovery plan, but this time, a face-to-face meeting will occur for the first time since the outbreak of the pandemic.

Chances for securing a deal between 27 member states are low, and traders are cautious. The French Final CPI for June rose to 0.1% against the expected -0.1% and supported Euro on the data front. At 13:02 GMT, the Italian Trade Balance showed a surplus of 5.58 B in May compared to 1.13 B of deficit in April.

At 14:00 GMT, the Trade Balance was up by 8.0 B against the forecasted 5.0B and supported Euro. Despite better than expected economic data from Europe, the EUR/USD pair declined on Thursday amid a strong U.S. dollar. From the U.S. side, the Core Retail Sales and Retail Sales were increased to 7.3% and 7.5% respectively against the expected 5.0% in June and supported the U.S. dollar. The strong U.S. dollar weighed on EUR/USD pair, and the pair started to decline.

Furthermore, the risk-off market sentiment after President Trump announced that he had signed the Hong Kong Autonomy Act. Moreover, the Justice Secretary from the US, William Barr, urged American tech firms not to do business with the Chinese government to reduce competitiveness.

These reports raised fears for the potential cold war between U.S. & China and raised risk-off market sentiment that supported EUR/USD pair declines on Thursday.


Daily Technical Levels

Support Resistance

1.1357     1.1429

1.1328     1.1472

1.1285     1.1501

Pivot point: 1.1400

EUR/USD– Trading Tip

The EUR/USD is taking a bearish turn after placing a high around 1.1439 level. The closing of candles below 1.1439 level has extended selling until the 1.1370 level. Closing of candles above 1.1370 level can drive buying in the EUR/USD pair, but in case, the bearish breakout occurs, we may see EUR/USD prices dropping towards 1.1335 level. Let’s keep an eye on 1.1370 as below this; we can capture a quick sell position.


GBP/USD – Daily Analysis

The GBP/USD pair was closed at 1.25538 after placing a high of 1.26144 and a low of 1.25197. Overall the movement of GBP/USD pair remained bearish throughout the day. The pair extended its previous day’s retracement slide and remained depressed through the first half of the day amid modest U.S. dollar strength. On Thursday, the U.S. dollar was strong across the board due to its safe-haven status as the risk-appetite was fading away. The latest optimism about the potential coronavirus vaccine turned out to be short-lived, and concerns about US-China relations raised the safe-haven appeal.

The strong greenback due to safe-haven demand, the GBP/USD pair came under pressure and dropped in early sessions. However, it showed that the downside movement of the GBP/USD pair was limited after the U.S. Treasury bond yields started to decline. This, combined with the better than expected economic data, gave a push to GBP/USD pair.

At 11:00 GMT, the Claimant Count Change from June was released by the Office for National Statistics on Thursday, which showed that the number of people applied for jobless benefits fell by 28.1K against the expectations +250K. The Claimant count rates eased to 7.3% vs. the previous 7.8%.

The U.K.’s official Jobless rate was also decreased to 3.9% against the expected 4.2% and provided strength to the British Pound. The Average Earnings Index, excluding bonuses, arrived at -0.3% in May against the expected -0.4% and supported British Pound. The steady GBP helped the pair GBP/USD to limit its daily losses on Thursday.

On the U.S. front, the Core Retail Sales and Retail Sales were improved to 7.3% and 7.5% respectively against the projected 5.0% in June and supported the U.S. dollar. The strong U.S. dollar weighed on GBP/USD pair, and the pair extended its losses.

Meanwhile, the Bank of England data revealed that lending has dried up quickly in the second quarter of the year. The Bank’s credit conditions survey showed that mortgages, loans, and credit card lending all dropped in the second quarter, and the further decline was still expected.

On Brexit front, the politicians from across the U.K., including Northern Ireland’s first and deputy first ministers, will discuss Brexit via videoconference. Arlene Foster and Michelle O’Neill will join the video conference chaired by Cabinet Minister Michael Gove.

The representatives from Welsh and Scottish governments and NI Secretary Brandon Lewis will also be heard by the joint ministerial committee. The discussion will focus on NI protocol and the Brexit transition period. Meanwhile, the second meeting with a joint EU & UK committee focused on how to implement the Northern Ireland part of the Brexit deal is also due.

Furthermore, the Brexit talks between U.K.’s chief negotiator David Frost and Michel Barnier continued in Brussels on Thursday to secure a trade deal. Several outstanding issues like fishing, trade, and governance, remain undercard even after four fruitless talks. U.K. is set to leave the controversial Common Fisheries Policy (CFP) and take back control of its U.K. waters, and the E.U. has shown its willingness to compromise to gain access to the U.K. waters.


Daily Technical Levels

Support Resistance

1.2505     1.2610

1.2459     1.2671

1.2399     1.2716

Pivot Point: 1.2565

GBP/USD– Trading Tip

The GBP/USD is trading with a selling bias at 1.2550 level, holding right above the support level of 1.2548 level. Downward breakout of 1.2548 level can extend selling until 1.2506 and 1.2479 support. The MACD and RSI both are supporting a bearish bias. On the upper side, the GBP/USD can face resistance at 1.2575 and 1.2595. Let’s consider taking Sell trades below 1.2533 level today. 


USD/JPY – Daily Analysis

The USD/JPY pair was closed at 107.275 after placing a high of 107.398 and a low of 106.830. Overall the movement of the USD/JPY pair remained bullish throughout the day. The USD/JPY pair moved sideways in the first half of the trading session on Thursday; however, it started to gain traction in the early hours of American trading session, and after that, it advanced to a daily high of 107.398.

The optimism related to potential coronavirus vaccine was short-lived and faded away quickly and dragged risk sentiment. The decreased risk appetite in the market weighed on Japanese Yen and pushed the USD/JPY pair on the above track.

Earlier in the day, the U.S. Census Bureau’s data showed that Retail Sales in June increased by 7.5% and beat the market expectations of 5.0%. The Core Retail Sales data in June also surged to 7.3% from the expected 5.0% and supported the U.S. dollar. The Philly Fed Manufacturing Index rose to 24.1 against the expected 20.0 and supported the U.S. dollar. The strong U.S. dollar pushed the USD/JPY prices in the upward direction on Thursday.

However, the gains in currency pair were capped by the poor than expected jobless claims data from the U.S. Last week, the Unemployment claims made by the Americans rose to 1300K from the 1250K of expectations and weighed on the U.S. dollar.

1.3M jobless people filed for jobless benefits last week, and it showed that the U.S. economy still has a large portion to fill in the jobs department. At 19:00 GMT, the Business Inventories from the United States came in as expected -2.3%. The NAHB Housing Market Index from the United States rose to 72 from the expected 60 and supported the U.S. dollar and added further in USD/JPY pair gains.

Furthermore, the New York President of Federal Reserve said on Thursday that the Fed’s emergency lending facilities have helped to ease credit markets after the pandemic disrupted them. He said that relatively low usage of the program indicated that markets were functioning well.

The statement that low-take up of emergency lending facilities was a sign of success from John Williams gave additional strength to the already strong U.S. dollar, and hence, USD/JPY pair further increased.

On US-China front, the US Justice Secretary, William Barr blamed Hollywood and U.S. tech firms of cooperating with the Chinese government to work there. Barr said that such actions could damage the liberal world order.

Speaking at Gerald Ford Presidential Museum, he advised U.S. firms not to give up their secrets and values to China by coming under pressure because it will make the U.S. vulnerable and dependent on China for certain goods.

This was the latest criticism of China by the White House and other U.S. officials. He warned that the working of Disney & American corporations with Beijing would weaken competitiveness and prosperity. He urged U.S. firms to challenge Chinese demands and said that if an individual company cannot take a stand, then firms should combine.

Furthermore, the U.S. imposed visa restrictions on certain employees of Huawei Tech Company. In response to this, the Chinese technology giant Huawei on Thursday, stated regret over the U.S. move to restrict its employees from visiting the U.S. Huawei called the U.S.’s latest move as “an unfair and arbitrary action.”


Daily Technical Levels

Support Resistance

106.93     107.51

106.59     107.75

106.35     108.09

Pivot Point: 107

 USD/JPY – Trading Tips

The USD/JPY is consolidating in a wide trading range of 107.400 – 107, while the overall bias seems neutral at 107.191. Recently the USD/JPY pair has crossed over 50 EMA, which extended resistance at 107 level, including now the same level will work as a support. The bearish breakout of the 107 level can extend the selling trend until 106.580. At the same time, the bullish breakout of the 107.400 level can extend the buying trend until 107.600. The MACD and RSI support bearish bias, and we may take a selling trade below 107 and buying above the same level today. Good luck! 

Categories
Crypto Market Analysis

Daily Crypto Review, July 17 – People Call For a Bitcoin Ban After the Twitter Hack; What Will Actually Happen?

The cryptocurrency market spent most of its day recovering from the move that brought Bitcoin to $9,000. Bitcoin is currently trading for $9,119, which represents a decrease of 0.85% on the day. Meanwhile, Ethereum lost 1.88% on the day, while XRP lost 1.37%.

 Daily Crypto Sector Heat Map

When talking about top100 cryptocurrencies, Ampleforth gained 28.69% on the day, making it by far the most prominent daily gainer. Algorand (24.57%) and Aurora (16.45%) also did great. On the other hand, Divi has lost 8.28%, making it the most prominent daily loser. It is followed by Nexo’s loss of 7.12% and Elrond’s loss of 6.55%.


Top 10 24-hour Performers (Click to enlarge)

Bottom 10 24-hour Performers (Click to enlarge)

Bitcoin’s dominance level increased slightly since we last reported, with its value currently at 62.83%. This value represents a 0.11% difference to the upside when compared to yesterday’s value.

Daily Crypto Market Cap Chart

The cryptocurrency market capitalization decreased slightly when compared to when we last reported, with the market’s current value being $269.69 billion. This value represents a decrease of $2.84 billion when compared to the value it had yesterday.

_______________________________________________________________________

What happened in the past 24 hours?

_______________________________________________________________________

_______________________________________________________________________

Technical analysis

_______________________________________________________________________

Bitcoin

The largest cryptocurrency by market capitalization started the day quite rough, with its price dropping to $9,000 as bearish influence and volume increased. However, the price quickly retraced back above the $9,120 level, where it is currently consolidating. However, Bitcoin is approaching the descending trend line, which fell under during its drop to $9,000, which may cause the price to move once again.

BTC traders should look for a trade opportunity when Bitcoin reacts to the descending trend line.

BTC/USD 4-hour Chart

Technical factors:

  • Price is below its 50-period EMA and its 21-period EMA
  • Price right below the middle B.B. (20-period SMA)
  • RSI neutral/low (40.42)
  • Average volume (came back from increased)

Key levels to the upside          Key levels to the downside

1: $9,251                                 1: $9,120

2: $9,580                                 2: $8,980

3: $9,735                                  3: $8,820

Ethereum

Ethereum started the day by being rejected from the $240 level, therefore triggering a fall towards the $228 level. The second-largest cryptocurrency by market capitalization managed to stop its price drop at $229 and slowly start to recover and consolidate. While the price is on a slow path towards the upside, the ultimate short-term direction of Ethereum is unknown.

Ethereum traders should look for an opportunity when Ethereum approaches the $240 level.

ETH/USD 4-hour Chart

Technical Factors:

  • Price below the 50-period EMA and the 21-period EMA
  • Price below the middle B.B. (20-period SMA)
  • RSI neutral (40.36)
  • Average volume (back from greatly increased)

Key levels to the upside          Key levels to the downside

1: $240                                    1: $228

2: $251.4                                 2: $225.4

3: $260                                     3: $218

Ripple

The third-largest cryptocurrency by market cap was no exception to how the price action played out. The day started with a sharp price drop, which brought the price below $0.19. However, XRP quickly recovered and got on a slow upward trend, which may be stopped by the moving averages above it. If, however, XRP manages to pass them, the $0.2 resistance level will still pose a big problem.

XRP traders can look for an opportunity to trade when the volume increases, and the trend becomes clear enough, as the low volume and volatility are certainly not ideal for trading at the moment.

XRP/USD 4-hour Chart

Technical factors:

  • XRP in a mid-term descending trend (though it broke the trend in the short-term)
  • XRP lacks strong support levels below $0.178
  • Price below 21-period and the 50-period EMA
  • Price right under the middle B.B. (20-period SMA)
  • RSI is neutral (43.89)
  • Volume lower than average

Key levels to the upside          Key levels to the downside

1: $0.2                                      1: $0.19

2: $0.205                                  2: $0.178

3: $0.214


Categories
Forex Videos

Fundamental Analysis For Novices! – Wholesale Inventories USA

Fundamental Analysis for Novices Wholesale Inventories, USA


Thank you for joining the fundamental analysis for novices’ educational video.  Today we will be looking at the United States wholesale Inventories.

If this is the first time you have joined our fundamental analysis for novices’ educational videos, we highly recommend that every day you use an economic indicator in order to plan your trading activity around the releases of economic data that is released by all the government’s around the world.  These statistical data releases can have a dramatic effect on volatility within the market, and that is why it is essential that it becomes second nature that you use one on a regular daily basis.

Most brokers offer an Economic Calendar facility, and they typically look something like this.

The key components to an Economic Calendar are obviously the day and the date and the actual time of the event, and please bear in mind that the time may differ from your own location.  The event itself, where typically you will see the nature of the event, such as trade balance, GDP, housing starts, initial jobless claims, bond auctions, interest rate decisions, etc., and the country the release pertains to.

You will also be able to see the impact barometer, which is typically low, medium, and high, where high would be the more likely to see extra volatility after the data release. They will also be a section for the actual data upon its release, and you will typically find a previous value, whether that is weekly, monthly, quarterly, or annually, and a consensus section that will have been put together by leading economists and analysts.

Here we have highlighted the United States wholesale Inventories for May 2020, and according to the time it was due in 58 minutes at the time of writing and where the previous release for April was 1.2% with a consensus of 1.2% and where the market impact value is set to low. Therefore, upon its release, it is unlikely to cause significant market volatility due to the fact that it lags by two months.

Us wholesale Inventories are released each month by the Census Bureau, and it tracks the changes in wholesale sales and inventory levels. The wholesale inventory component is more important because if producers have high inventory levels, this can be seen by the markets as showing slow demand by consumers, and this would have a knock-on effect of causing decreased manufacturing production; this, in turn, will affect jobs and gross domestic product. The sales component does not reflect personal consumption and is therefore not seen as such an important aspect of the data release.

A high inventory number suggests the economy is slowing in the United States and this is negative or bearish for the dollar, where as a low reading is seen as positive or bullish for the US dollar

Categories
Forex Market Analysis

Daily F.X. Analysis, July 16 – Top Trade Setups In Forex – ECB Policy Decision In Highlights! 

It’s going to be a busy day from a fundamental’s viewpoint, as the European Central Bank is due to release its rate decision. Furthermore, the U.S. will be releasing a series of high impact events like Retail Sales m/m, Philly Fed Manufacturing Index, and Unemployment Claims. Although ECB isn’t expected to hike the interest rate, the ECB press conference can drive movement in the EUR/USD pair today. Besides, U.S. events are expected to perform adversely for the U.S. dollar.

Economic Events to Watch Today 


EUR/USD – Daily Analysis

The EUR/USD pair was closed at 1.14114 after placing a high of 1.14473 and a low of 1.13900. Overall the tendency of the EUR/USD pair remained bullish throughout the day. The EUR/USD pair continued its bullish streak for the 4th consecutive day and reached a multi-month high level near 1.14500 level on Wednesday. The pair rose to the highest level since March 10 in the early Wednesday trading session. Nevertheless, it did not live there for long and was pulled back in the American session.

The upward movement of EUR/USD towards a multi-month high level was caused by the European Central Bank’s monetary policy meeting on Thursday. The lower move was triggered by a recovery of the U.S. dollar across the board. The U.S. Dollar Index (DXY) erased most of its losses and recovered from weekly lows, rose above 96.00 level, and gave strength to the U.S. dollar that eventually weighed on EUR/USD pair.

The risk sentiment was also up in the market by the optimism about the potential vaccine for COVID-19. As a result, the Dow Jones was up by 0.80%, and NASDAQ was up by 0.35%.

On the data front, the U.S. dollar was strong due to better than expected data released on Wednesday. The Empire State Manufacturing Index was published at 17:30 GMT, which showed that the index rose to 17.2 from the expectations of 10.0 in July and supported the U.S. dollar.

The Import Prices from the U.S. in June rose to 1.4% from the expected 1.0% and supported the U.S. dollar. The Industrial Production data was announced at 18:15 GMT, which showed an expansion in activity by 5.4% against the forecasted 4.5% and supported the U.S. dollar. The Capacity Utilization rate from the U.S. Roseto 68.6%from the predicted 67.9% and supported the U.S. dollar. It eventually weighed on EUR/USD pair in late trading session and forced it to lose its early daily gains.

In Europe, the key event ahead is the European Central Bank meeting on Thursday, in its last meeting, ECB made its biggest decision in June and left the rates unchanged and provided no stance to change further. The focus will be on the press conference, where traders will keep an eye on Lagarde’s speech to find fresh clues about the economic outlook. However, the tone is estimated to be positive, and Lagarde’s firm commitment to the full 1.35tn euros PEPP is also expected.


Daily Technical Levels

Support Resistance

1.1384    1.1445

1.1356    1.1480

1.1322    1.1507

Pivot point: 1.1418

EUR/USD– Trading Tip

The EUR/USD is taking a bearish turn after placing a high around 1.1446 level. The closing of candles below 1.1446 level can extend selling until the 1.1390 level. Closing of candles above 1.1390 level can drive buying in the EUR/USD pair, but in case, the bearish breakout occurs, we may see EUR/USD prices dropping towards 1.1365 level.


GBP/USD – Daily Analysis

The GBP/USD pair was closed at 1.25879 after placing a high of 1.26467 and a low of 1.25417. Overall the movement of GP/USD pair remained bullish throughout the day. The GBP/USD pair edged higher on Wednesday on the back of increased risk-appetite that made the U.S. dollar weak due to weakened appeal for the safe-haven currency. The risk sentiment was bolstered by many factors, including reports suggesting China’s economy was rebounding despite the COVID-19 pandemic.

As in result, Investors shifted towards riskier assets like GBP/USD currency pair as the world’s second-largest economy was continuously showing improvement while America was lagging. The latest US CPI data that edged higher by 0.6% was also not enough to boost the U.S. economy’s confidence.

The soft demand for the U.S. dollar due to an extended period of weak growth and the prevailing second wave of coronavirus induced economic downturn, helped the GBP/USD to move upward on Wednesday.

The Pound rose on Wednesday following the release of the latest U.K. Consumer Price Index for June that exceeded the forecasted 0.5% and came in as 0.6%. As in result, investors became more optimistic about Britain’s economic recovery.

The policymaker of Bank of England, Silvana Tenreyro, said on Wednesday that Britain’s economic recovery from the coronavirus lockdown would probably be delayed by the consumer’s caution towards viruses, decreased activity due to social distancing and rising unemployment. She added that behavioral responses mean that the U.K. economic outlook will continue to depend on the global and domestic spread of COVID-19.

She also said that she was prepared to push for fresh stimulus measures to aid the U.K.’s struggling economy. She said that a V-shaped economic recovery was unlikely.

On the data front, the Consumer Price Index for the year from the U.K. was released at 11:00 GMT, which showed an increase to 0.6% from the forecasted 0.4% and supported British Pound. The year’s Core CPI also increased to 1.4% from the expected 1.2% and supported GBP.

The PPI (Producer price index) Input for June from the U.K. decreased to 2.4% from the expected 3.0% and weighed on GBP. However, the PPI Output for June increased to .3% from the anticipated 0.2% and supported GBP. The RPI (Raw-material price index) for the year came in line with the 1.1% expectations. Most of the data came in better than expected and supported British Pound that gave strength to GBP/USD pair and made it move on the upside.

Besides, the Empire State Manufacturing Index rose from 10.0 of the forecast to 17.2 and supported the U.S. dollar. The Import Prices for June came in as 1.4% against the 1.0% of expectations and supported the U.S. dollar.

At 18:15 GMT, the closely watched Industrial Production for June rose to 5.4% against the expectations of 4.5% and supported the U.S. dollar. The Capacity Utilization Rate increased to 68.6% from the forecasted 67.9% and supported the U.S. dollar. The strong U.S. dollar failed to reverse the bullish momentum; however, it managed to limit the additional gains in GBP/USD pair on Wednesday.

Looking forward, GBP investors will be waiting for the release of the UK ILO Unemployment rate for May on Thursday. If unemployment rises, the U.K.’s GBP will show signs of losses. Meanwhile, U.S. traders will await the U.S. Retail Sales data. Any sign of fall in Retail Sales will undermine the U.S. dollar.


Daily Technical Levels

Support Resistance

1.2535   1.2638

1.2490   1.2696

1.2432   1.2742

Pivot point: 1.2593

GBP/USD– Trading Tip

The GBP/USD is trading with a selling bias at 1.2550 level, holding right above the support level of 1.2548 level. Downward breakout of 1.2548 level can extend selling until 1.2506 and 1.2479 support. The MACD and RSI both are supporting a bearish bias. On the higher side, the GBP/USD pair can face resistance at 1.2575 and 1.2595. Let’s consider taking Sell trades below 1.2533 level today. 


USD/JPY – Daily Analysis

The USD/JPY pair was closed at 107.233 after placing a high of 107.432 and a low of 107.116. Overall the movement of the USD/JPY pair remained bearish throughout the day. At 9:30 GMT, the Revised Industrial production for May from Japan came in as -8.9% against the expected -8.4% and weighed on Japanese Yen.

At 15:00 GMT, the NFIB Small Business Index for June raised to 100.6 from the expected 97.5 and supported the U.S. dollar. At 17:30 GMT, the Consumer Price Index for June increased to 0.6 % from the expected 0.5% and supported the U.S. dollar. For June, the Core CPI also rose to 0.2% against the expected 0.1% and supported the U.S. dollar.

On Tuesday, Federal Reserve Governor Lael Brainard offered a downbeat assessment of risk ahead. She said that the path ahead for the U.S. economy was under the clouds of high uncertainty, and the Federal Reserve should use forward guidance and large scale asset purchases for a sustained period to help the recovery.

In a virtual event hosted by the National Association for Business Economics, Brainard said that the pandemic was the key driver of the economy’s course. A thick fog of uncertainty still surrounded the U.S. and downside risks predominated.

The calls for further stimulus accommodation from the Federal Reserve by Brainard weighed on the U.S. dollar that dragged USD/JPY with it.

However, the uncontrolled rise in the numbers of coronavirus cases from the U.S. made investors cautious about holding the greenback, and hence, USD lost its traction and weighed on the USD/JPY pair.

The losses in the U.S. dollar were extended after many countries reported renewed lockdown measures to help control the virus’s spread. The California State, which is considered the most populous state of America, also imposed renewed restrictions and weighed on the U.S. dollar as its economic recovery would be difficult.

The cities and states imposed lockdown measures on the back of warning given by the World Health Organization that pandemic could only worsen if countries failed to follow strict precautions. In response to this, Hong Kong, Philippines, Hungary, Australia, and California announced lockdown measures. These restrictions imposed negative pressure on market sentiment as it will affect the global economic recovery.

Meanwhile, Beijing announced sanctions on Lockheed Martin for his involvement in the latest U.S. arms sale to Chinese-claimed Taiwan. This raised the ongoing tensions between the U.S. & China that were already heightened due to the South China Sea issue. The lockdown mentioned above restrictions and ongoing US-China tensions raised a safe-haven appeal that supported Japanese Yen and weighed on USD/JPY pair.


Daily Technical Levels

Support Resistance

107.10    107.43

106.94    107.60

106.77    107.75

Pivot point: 107.27

 USD/JPY – Trading Tips

The USD/JPY is trading with a bearish bias at 106.997 to consolidate within a wide trading range of 107.350 to 106.950. Recently the USD/JPY pair has crossed below 50 EMA, which extended support at 107.100 level, including now the same level is going to work as a resistance. The bearish breakout of the 106.900 level can extend the selling trend until 107.620 and 106.37 level. The MACD and RSI support bearish bias, and we may take a selling trade below 107.27 today. Good luck! 

Categories
Crypto Market Analysis

Daily Crypto Review, July 16 – Bitcoin Giveaway Scam Hits Twitter: Jeff Bezos, Barack Obama, Kanye West And More Targeted

The cryptocurrency market had quite a slow day with sideways movements. Bitcoin is currently trading for $9,206, which represents a decrease of 0.59% on the day. Meanwhile, Ethereum lost 0.53% on the day, while XRP lost 0.95%.

 Daily Crypto Sector Heat Map

When talking about top100 cryptocurrencies, Elrond gained 14.90% on the day, making it by far the most prominent daily gainer. Syntherix Network (12.31%) and iExec RLC (11.07%) also did great. On the other hand, Bytom has lost 8.57%, making it the most prominent daily loser. It is followed by Nervos Network’s loss of 8.39% and Divi’ loss of 8.38%.

Top 10 24-hour Performers (Click to enlarge)

Bottom 10 24-hour Performers (Click to enlarge)

Bitcoin’s dominance level decreased slightly since we last reported, with its value currently at 62.72%. This value represents a 0.28% difference to the downside when compared to yesterday’s value.

Daily Crypto Market Cap Chart

The cryptocurrency market capitalization didn’t change in valuation when compared to when we last reported, with the market’s current value being $272.53 billion. This value represents a decrease of $0.13 billion when compared to the value it had yesterday.

_______________________________________________________________________

What happened in the past 24 hours?

_______________________________________________________________________

_______________________________________________________________________

Technical analysis

_______________________________________________________________________

Bitcoin

The largest cryptocurrency by market capitalization had quite a slow day. Its price followed the descending resistance line throughout most of the day until it jumped slightly above it. However, the current move has insufficient strength to pass the $9,251 resistance level. On top of that, the upside is guarded by the 21 as well as 50-period moving averages.

BTC traders should look for a trade opportunity after the largest cryptocurrency passes $9,251, or fails to break it.

BTC/USD 4-hour Chart

Technical factors:

  • Price is below its 50-period EMA and its 21-period EMA
  • Price right below the middle B.B. (20-period SMA)
  • RSI neutral (47.59)
  • Average volume

Key levels to the upside          Key levels to the downside

1: $9,251                                 1: $9,120

2: $9,580                                 2: $8,980

3: $9,735                                  3: $8,820

Ethereum

Ethereum also had a slow day, with its price dancing between $237.5 (where ETH seems to have found some form of support) and a $240 resistance level. The second-largest cryptocurrency by market capitalization might attempt to break $240 very soon, but such a move would need strong confirmation afterward to be completely valid.

Ethereum traders should look for an opportunity after the fight for $240 ends.

ETH/USD 4-hour Chart

Technical Factors:

  • Price below the 50-period EMA and the 21-period EMA
  • Price below the middle B.B. (20-period SMA)
  • RSI neutral (47.81)
  • Average volume

Key levels to the upside          Key levels to the downside

1: $240                                    1: $228

2: $251.4                                 2: $225.4

3: $260                                     3: $218

Ripple

The third-largest cryptocurrency by market cap was trading sideways throughout the day, with its price being slightly below $0.2. The resistance level held up quite nicely, which brought XRP’s price down by a bit. However, even though it performed the worst out of the top3 cryptocurrencies in the past 24 hours, XRP’s price moved less than 1% in total.

XRP traders can look for an opportunity to trade when the volume increases, and the trend becomes clear enough, as the low volume and volatility are certainly not ideal for trading at the moment.

XRP/USD 4-hour Chart

Technical factors:

  • XRP in a mid-term descending trend (though it broke the trend in the short-term)
  • XRP lacks strong support levels below $0.178
  • Price above 21-period and below the 50-period EMA
  • Price right under the middle B.B. (20-period SMA)
  • RSI is neutral (47.11)
  • Volume lower than average

Key levels to the upside          Key levels to the downside

1: $0.205                                  1: $0.2

2: $0.214                                  2: $0.19

3: $0.227                                 3:$0.178


Categories
Forex Market Analysis

Daily F.X. Analysis, July 15 – Top Trade Setups In Forex – EU Industrial Production Ahead!

Today the major focus will remain on the UK CPI data, along with Canadian interest rate decision, which is due later today. The crude oil inventories will also remain in highlights to drive price action in CAD and WTI.

Economic Events to Watch Today 


EUR/USD – Daily Analysis

The EUR/USD pair was closed at 1.13999 after placing a high of 1.14085 and a low of 1.13250. Overall the movement of the EUR/USD pair remained bullish throughout the day. The EUR/USD rose above 1.1400 level for the first time in more than a month since June 10 on the back of heavy selling bias surrounding greenback. The pair EUR/USD rose for the 3rd consecutive day on Tuesday, in the wake of broad-based U.S. dollar weakness.

In the absence of significant fundamental drivers, the U.S. dollar index continued to react to Wall Street’s performance. The major equity indexes rose and made it difficult for the safe-haven U.S. dollar to find demand.

The U.S. Dollar Index (DXY) was down 0.3% on the day at 96.25, while the Dow Jones Industrial Average gained 1.2% and the S&P 500 gained 0.5%.

On the data front, the Industrial Production expanded in May by 12.4% against the expected 14.9% and weighed on single currency Euro that helped limit additional gains. The ZEW Economic Sentiment for July came in as 59.6 against the forecasted 55.8 and supported Euro.

For July, the German ZEW Economic Sentiment dropped to 59.3 from the expected 60.1 and weighed on Euro that additional caped gain in EUR/USD pair. On the other hand, the Consumer Price Index for May rose to 0.6% against the forecasted 0.5% and supported the U.S. dollar from the American side. The Core CPI for May came in as 0.2% against the expected 0.1% and supported the U.S. dollar. The strong U.S. dollar failed to turn EUR/USD’s gains into losses.

On Thursday, the European Central Bank will announce its interest rate decision and release its monetary policy statement. According to analysts, they expect major policy changes next week. The ECB awaits more data on the economic outlook, developments on the fiscal front, and the impact of its measures to decide on further policy changes.

Meanwhile, the rising numbers of coronavirus cases from the U.S. pushed California’s state government to impose renewed lockdown measures to contain the spread and avoid the second wave of coronavirus. The most populous state of the United States under lockdown weighed heavily on local currency. The weak U.S. dollar against its rival currency Euro as the renewed lockdown measures imposed economic recovery threats also weighed on EUR/USD pair on Tuesday.


Daily Technical Levels

Support Resistance

1.1345     1.1430

1.1292     1.1462

1.1260     1.1514

Pivot Point: 1.1377

EUR/USD– Trading Tip

The EURUSD is testing Triple Top resistance around 1.1415 level, but the recent daily candle is bullish engulfing, which may drive the bullish trend in the EUR/USD pair. On the higher side, a bullish breakout of the 1.1415 level can extend bullish bias until the 1.1490 level. On the lower side, support stays at 1.1380 and 1.1365 level.


GBP/USD – Daily Analysis

The GBP/USD pair was closed at 1.25545 after placing a high of 1.25634 and a low of 1.24798. Overall the movement of GBP/USD pair remained flat throughout the day. The pair GBP/USD during early trading session lost its ground and faced some heavy selling pressure on the back of poor than expected GDP data from the U.K.  

The pair dropped to a one-week low level near 1.24800 level and then reversed its direction in the late trading session and closed the day at the same level it started its day. The pair witnessed some heavy selling pressure on Tuesday for the second consecutive day, followed by the U.K. monthly GDP report’s disappointing release. The report suggested that the economy of the U.K. expanded n may by 1.8% while it was previously expected to expand by 5%, and hence, GBP suffered. The less than expected expansion in the U.K. economy could be associated with the lack of progress in the post-Brexit talks that ultimately affect the British Pound.

The pair started to decline and reached two weeks low level on Tuesday. Other than GDP, many economic reports were also released on Tuesday from the U.K. At 11:00 GMT, the Construction Output for May decreased to 8.2% against the forecasted 14.9% and weighed on GBP and dragged GBP/USD pair with it. The Goods Trade Balance showed a deficit of 2.8B against the deficit of 8.2B and supported GBP. However, the Index of Services 3m/3m came in as -18.9% against the expected -16.9% and weighed on GBP that caused a decline of GBP/USD pair.

The Industrial Production for May declined to 6.0% from the expected 6.2% and weighed on British Pound that added further in GBP/USD pair’s downward movement. For May, the Manufacturing Production increased 8.4% from the expected 7.5% and supported British Pound that kept a check on additional losses in GBP/USD pair.

On the other hand, from the American side, the Consumer Price Index for May increased to 0.6% against the expected 0.5% and supported the U.S. dollar. The Core CPI for May came in as 0.2% against the expected 0.1% and helped the U.S. dollar. The strong U.S. dollar added further in the losses of the GBP/USD pair.

Apart from weak GDP data, the pair declined to its one week lowest level on the back of the decreased risk-on market sentiment. The concerns about the deteriorating US-China relations and increased coronavirus cases worldwide kept the risk appetite under pressure that added further in GBP/USD pair’s daily losses.

The number of COVID-19 cases globally has reached 13 million marks, and Johns Hopkins University data has shown that the cases jumped by one million over the last five days. In response to this, the World Health organization said that if protocols were not followed, then pandemic would only worsen.

This resulted in demand for the U.S. dollar as hopes about quick economic recovery fall after many countries announced re-imposing restrictions to curb the virus’s spread. The demand for safe-haven U.S. dollar was also supported by the fresh tensions between the U.S. & China over the South China Sea. Strong USD weighed on GBP/USD pair on Tuesday. There were no latest updates on Tuesday, including traders continued following fundamentals & coronavirus updates on Brexit front.

Daily Technical Levels

Support Resistance

1.2499     1.2587

1.2445     1.2621

1.2410     1.2675

Pivot point: 1.2533

GBP/USD– Trading Tip

The GBP/USD is trading with a bullish bias as it has violated the strong resistance level of 1.2575 level. Above this, the next target is expected to be 1.2625 level. The 50 EMA is likely to extend support at 1.2570 level, and it can lead the GBP/USD prices further higher until 1.2660 levels. The RSI and MACD are both supporting bullish bias in the pair. Let’s consider taking buy trades above 1.2533 level today. 


USD/JPY – Daily Analysis

The USD/JPY pair was closed at 107.233 after placing a high of 107.432 and a low of 107.116. Overall the movement of the USD/JPY pair remained bearish throughout the day. At 9:30 GMT, the Revised Industrial production for May from Japan came in as -8.9% against the expected -8.4% and weighed on Japanese Yen.

At 15:00 GMT, the NFIB Small Business Index for June raised to 100.6 from the expected 97.5 and supported the U.S. dollar. At 17:30 GMT, the Consumer Price Index for June increased to 0.6 % from the expected 0.5% and supported the U.S. dollar. For June, the Core CPI also rose to 0.2% against the expected 0.1% and supported the U.S. dollar.

On Tuesday, Federal Reserve Governor Lael Brainard offered a downbeat assessment of risk ahead. She said that the path ahead for the U.S. economy was under the clouds of high uncertainty, and the Federal Reserve should use forward guidance and large scale asset purchases for a sustained period to help the recovery.

In a virtual event hosted by the National Association for Business Economics, Brainard said that the pandemic was the key driver of the economy’s course. A thick fog of uncertainty still surrounded the U.S. and downside risks predominated.

The calls for further stimulus accommodation from the Federal Reserve by Brainard weighed on the U.S. dollar that dragged USD/JPY with it.

However, the uncontrolled rise in the numbers of coronavirus cases from the U.S. made investors cautious about holding the greenback, and hence, USD lost its traction and weighed on the USD/JPY pair.

The losses in the U.S. dollar were extended after many countries reported renewed lockdown measures to help control the virus’s spread. The California State, which is considered the most populous state of America, also imposed renewed restrictions and weighed on the U.S. dollar as its economic recovery would be difficult.

The cities and states imposed lockdown measures on the back of warning given by the World Health Organization that pandemic could only worsen if countries failed to follow strict precautions. In response to this, Hong Kong, Philippines, Hungary, Australia, and California announced lockdown measures. These restrictions imposed negative pressure on market sentiment as it will affect the global economic recovery.

Meanwhile, Beijing announced sanctions on Lockheed Martin for his involvement in the latest U.S. arms sale to Chinese-claimed Taiwan. This raised the ongoing tensions between the U.S. & China that were already heightened due to the South China Sea issue. The lockdown mentioned above restrictions and ongoing US-China tensions raised a safe-haven appeal that supported Japanese Yen and weighed on USD/JPY pair.


Daily Technical Levels

Support Resistance

107.10     107.43

106.94     107.60

106.77     107.75

Pivot point: 107.27

 USD/JPY – Trading Tips

On Wednesday, the USD/JPY is trading with a bearish bias at 106.997 to consolidate within a wide trading range of 107.350 to 106.950. Recently the USD/JPY pair has crossed below 50 EMA, which extended support at 107.100 level, including now the same level is going to work as a resistance. The bearish breakout of the 106.900 level can extend the selling trend until 107.620 and 106.37 level. The MACD and RSI support bearish bias, and we may take a selling trade below 107.27 today. Good luck!