Categories
Forex Fundamental Analysis

What Does The ‘GDP Growth Rate’ Forex Driver Say About A Nation’s Economy?

Introduction

GDP Growth Rate is the most critical fundamental macroeconomic indicator for measuring economic prosperity. It is the number one macroeconomic indicator, and all other leading, coincident, and lagging indicators are all trying to predict what GDP Growth Rate would be. Our fundamental analysis revolves around predicting the growth rate before the GDP Growth Rate reveals it. It is the de facto measure of economic growth for all countries worldwide.

The importance of this economic indicator cannot be understated. GDP Growth Rate figures move the markets like no other, be it the currency or the stock markets. Hence, understanding the significance of this macroeconomic indicator is paramount for traders and investors.

What is the GDP Growth Rate?

Gross Domestic Product

It is a measure of the total economic output of a country. It is the total monetary value of all the goods and services produced within the country regardless of citizenship (resident or foreign national). The commonly used term “size of the economy” refers to this economic indicator. The US is the world’s largest economy, and it means it has the highest nominal GDP or highest economic output.

GDP Growth Rate

GDP Growth Rate is the measure of the rate of economic growth. In other words, it tells the pace at which an economy is growing. Generally, developing or emerging economies like China, India, or Japan will have a higher GDP growth rate than the mature or developed economies like the United States, United Kingdom, etc.

Mathematically, it is the percentage change of Gross Domestic Product with regards to the previous quarter. Although the GDP Growth Rate is reported quarterly, it is annualized for better analysis and comparison. It means that the quarterly GDP is scaled to a year to compare the Growth Rate with the previous year and understand whether the economy is growing faster or slower compared to the previous year. 

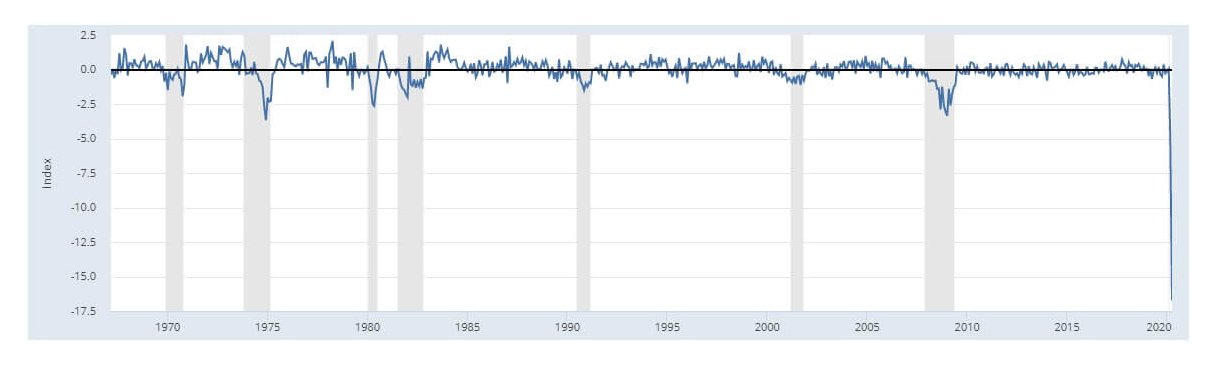
The other reason is that the GDP Growth Rate changes according to the business cycle and is usually very high during the last quarter, accounting for holiday shopping from consumers driving up the GDP. Hence, annualizing with seasonal adjustment makes it more accurate for analysis. The Real GDP Growth Rate accounts for inflation and is the most-watched GDP statistic.

The GDP Growth Rate is affected by the four components of the GDP:

A | Consumer Spending: It is also called Personal Consumption. It represents spending associated with the end-consumers or the general population. The Personal Consumption Expenditure reports, Retail Sales, are all different economic indicators representing Consumer Spending. It makes up about 69% of the total GDP in the United States.

B | Business Investment: Economic Output of the Business Sector makes up 18% of the total GDP in the United States. Business Surveys like Purchasing Manager’s Index, Industrial Production, etc. help assess the Business Sector’s contribution to economic output.

C | Government Spending: It involves all the expenditures incurred by the Government to maintain and stimulate economic growth and run its operations. In the United States, significant proportions of Government Spending go to Social Security, Medicare benefits, and Defense Spending. It accounts for 17% of the total economic output for the United States.

D | Net Exports: It is the difference between the total exports and imports. Revenue is generated from exports and depleted from imports. Developing economies will mostly have positive Net Exports as it is an integral part of their revenue generation. The United States has -5% Net Exports of the total GDP, meaning it is a net importer.

How can the GDP Growth Rate numbers be used for analysis?

When the economy is growing or expanding, the GDP Growth Rate is favorable. When the GDP Growth Rate is increasingly positive, businesses, jobs, and personal income all grow followingly. Developing economies grow faster than mature economies (as the developed economies are already more saturated compared to developing ones). It is generally standard for matured economies to peak out at 3-4% GDP Growth Rate and developing economies can have anywhere between 5-20%.

When the economy is slowing or contracting, businesses will halt new investments and plans to avoid deflation. New hiring is also postponed; people will save more than spend to prepare for the oncoming deflationary conditions. The economy comes to a slowdown. The Government intervenes through fiscal and monetary levers to stimulate economic growth and bring it back to normal conditions and maintain the growth rate. Overall, the GDP growth rate tells us the economy’s health.

Impact on Currency

The GDP is a lagging macroeconomic indicator that has high-impact on the market volatility. Investors’ decisions are based on the GDP growth rate. It is a proportional indicator. High GDP Growth Rates are suitable for the economy overall and vice-versa.

Though it is a lagging indicator, it has many implications for the economy. It is the most extensive measure of economic activity and the primary gauge of the economy’s health. GDP Growth Rate comparisons amongst different economies are vital for currency markets, and hence, it has a very high impact on the currency market.
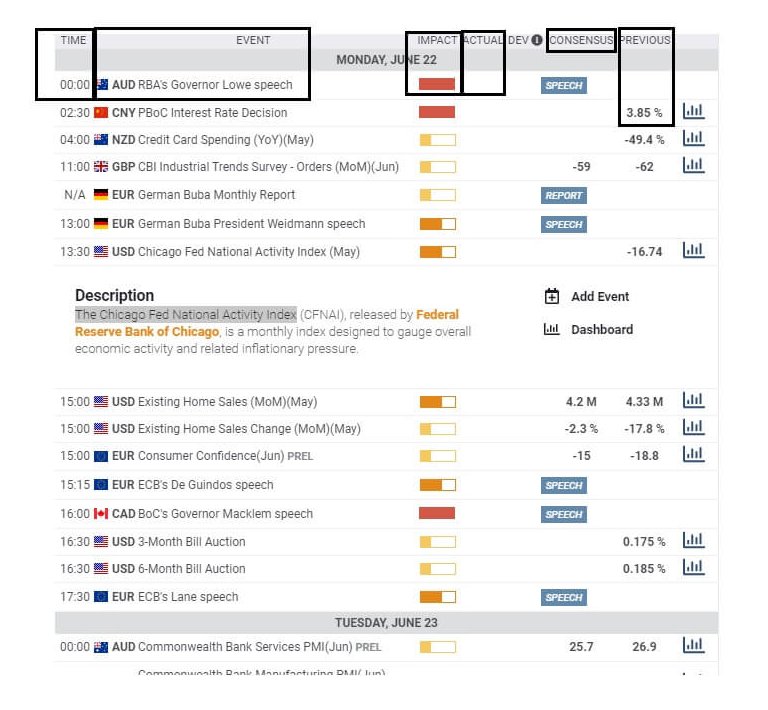
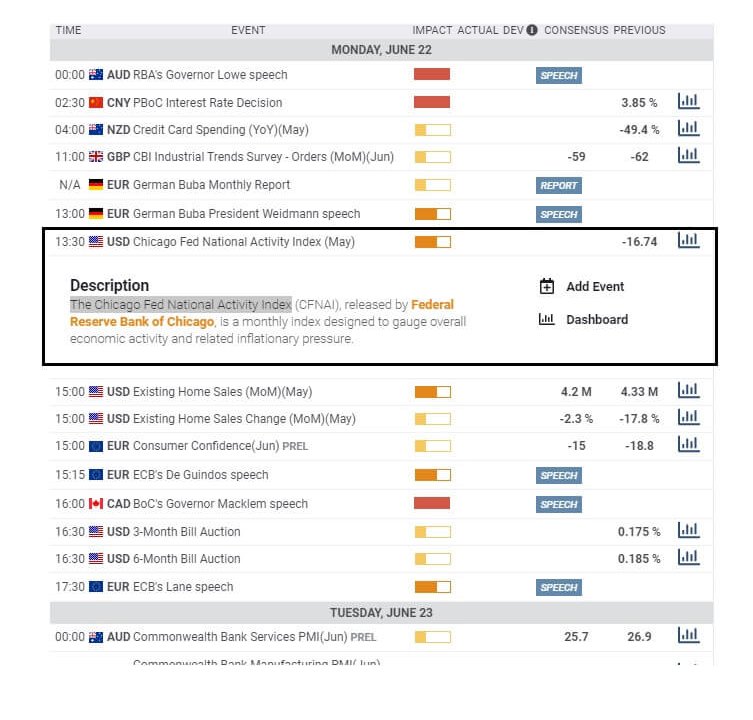
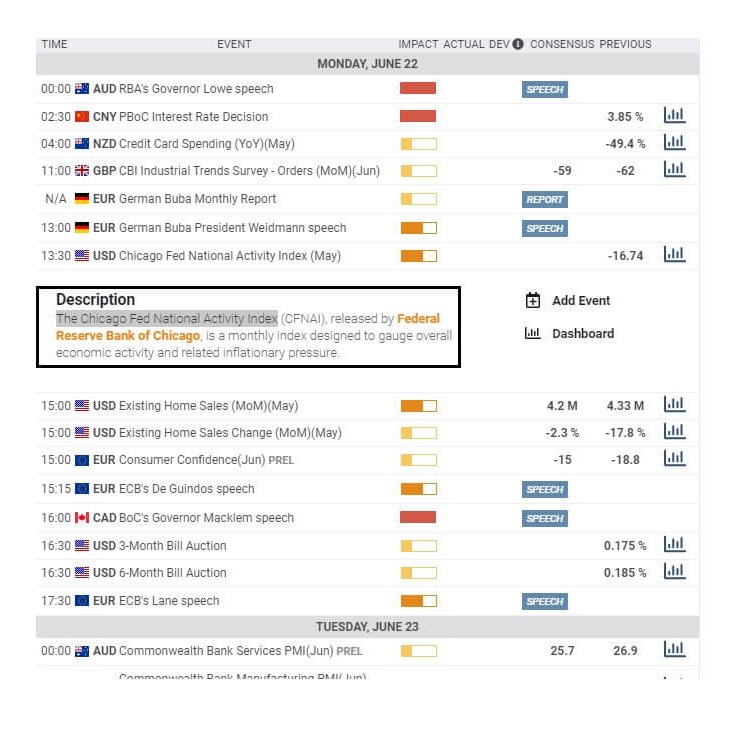
Economic Reports

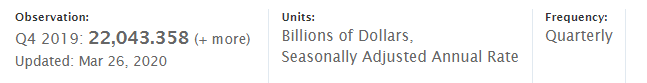
For the United States, the Bureau of Economic Analysis releases quarterly GDP Growth Rate figures on its official website every quarter. The release schedule is already mentioned on the website and is generally released one month after the quarter ends. 

Major international organizations like the World Bank, International Monetary Fund, OECD, etc. actively maintain track of most countries on their official website: 

Sources of GDP Growth Rate

For the United States, the BEA reports are available here.

The St. Louis FRED keeps track of all the GDP and its related components in one place on its official website. You can find that information in the sources mentioned below.  

GDP & GNP – FRED 

GDP Growth Rate – World Bank

GDP Growth Rate – IMF

Impact of the “GDP Growth Rate” news release on the Forex market

In the previous section of the article, we explained the GDP Growth Rate fundamental indicator and saw how it could be used for gauging the strength of an economy. The GDP Growth Rate indicates how quickly or slowly the economy is growing or shrinking.

It is driven by four components of GDP, the largest being personal consumption expenditures. But economists prefer using real GDP when measuring growth because it is inflation-adjusted. When the economy is improving, the GDP Growth Rate is favorable. If it is contracting, businesses hold off investing in new technologies. If GDP Growth Rate turns, then the country’s economy is in a recession.

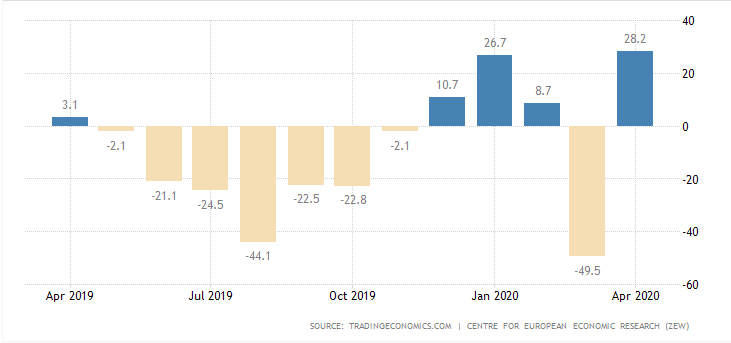
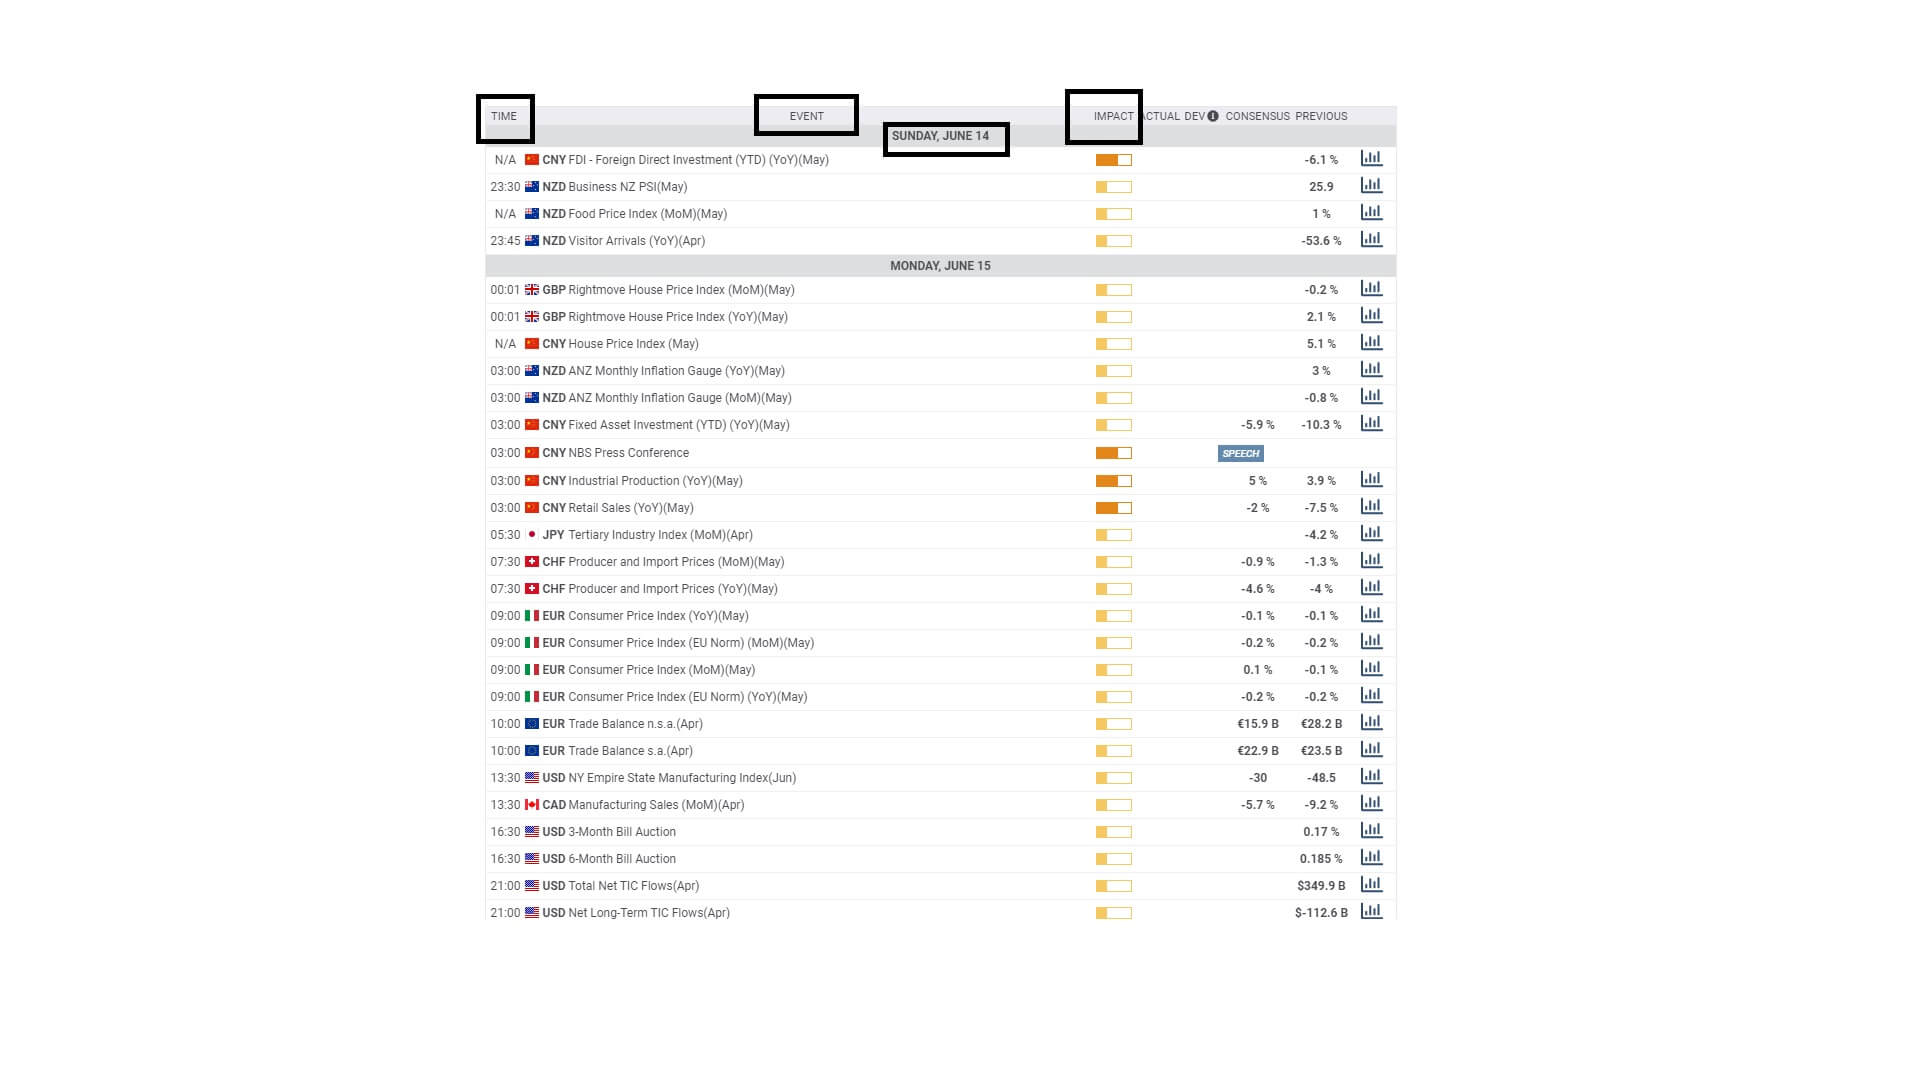
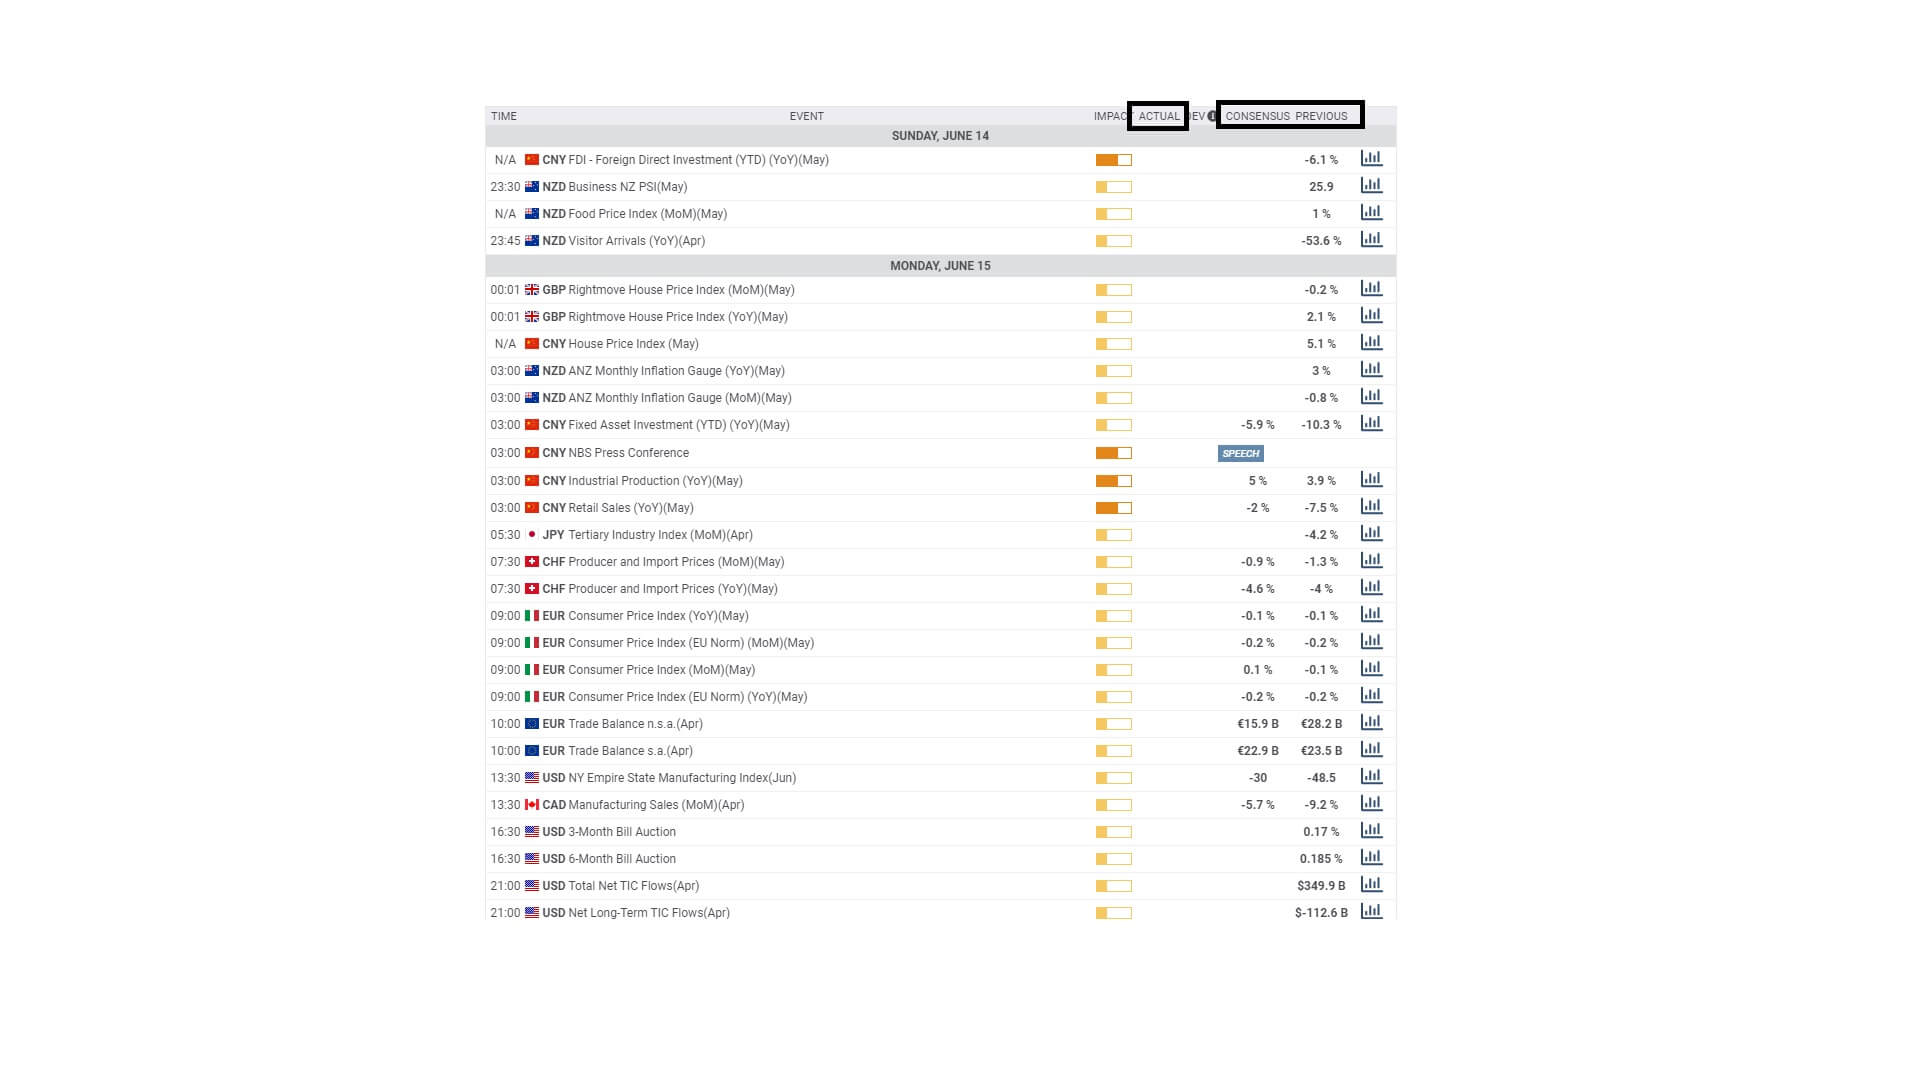
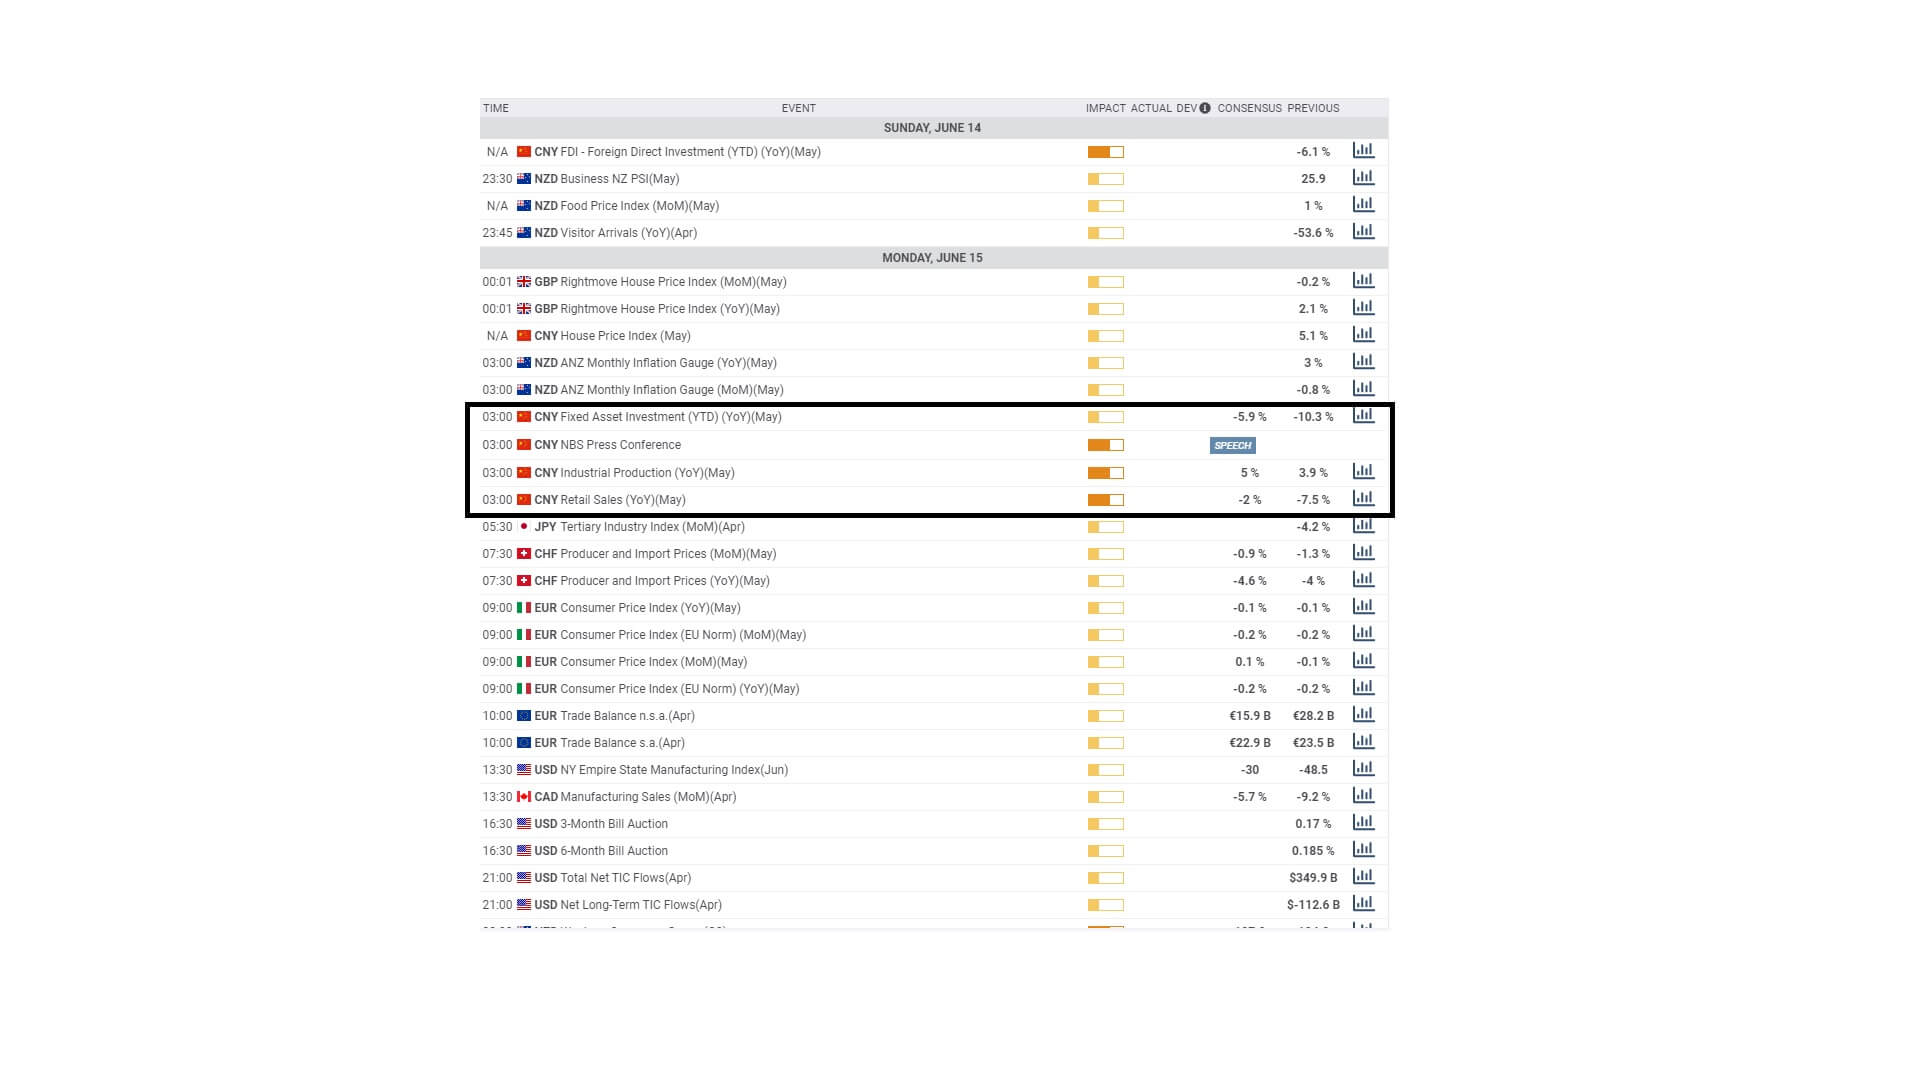
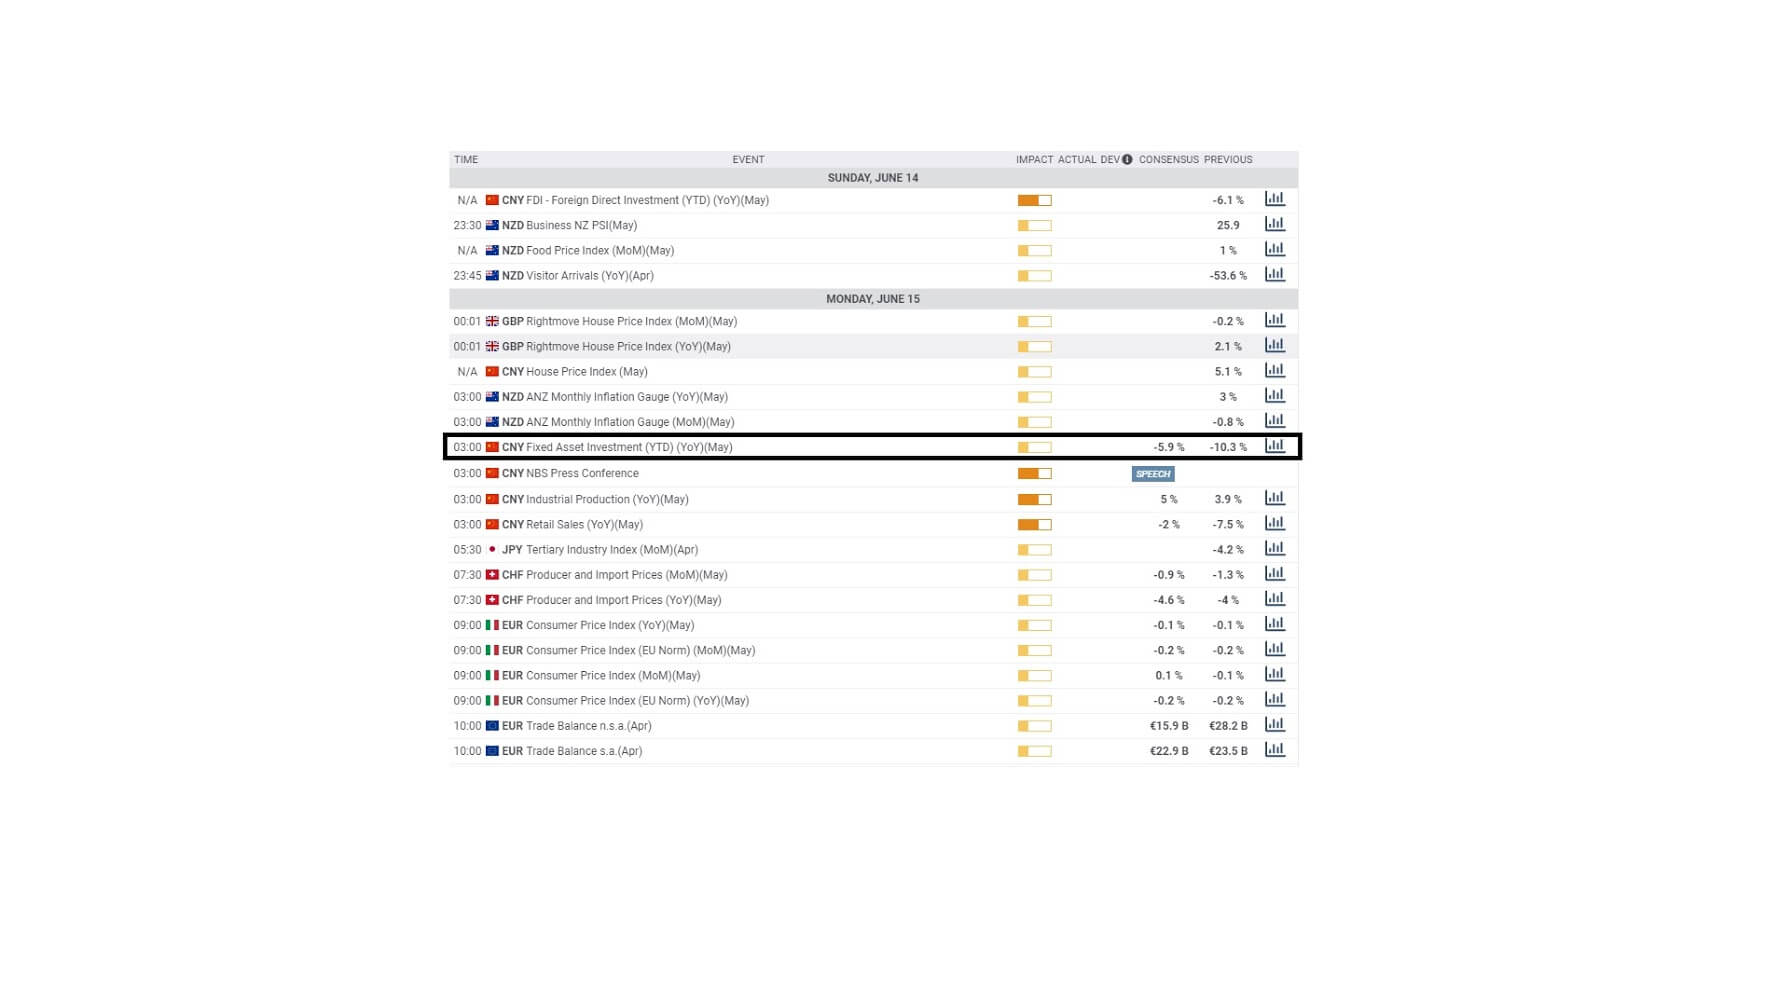
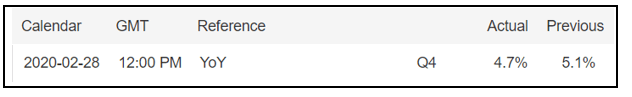
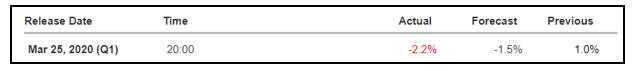
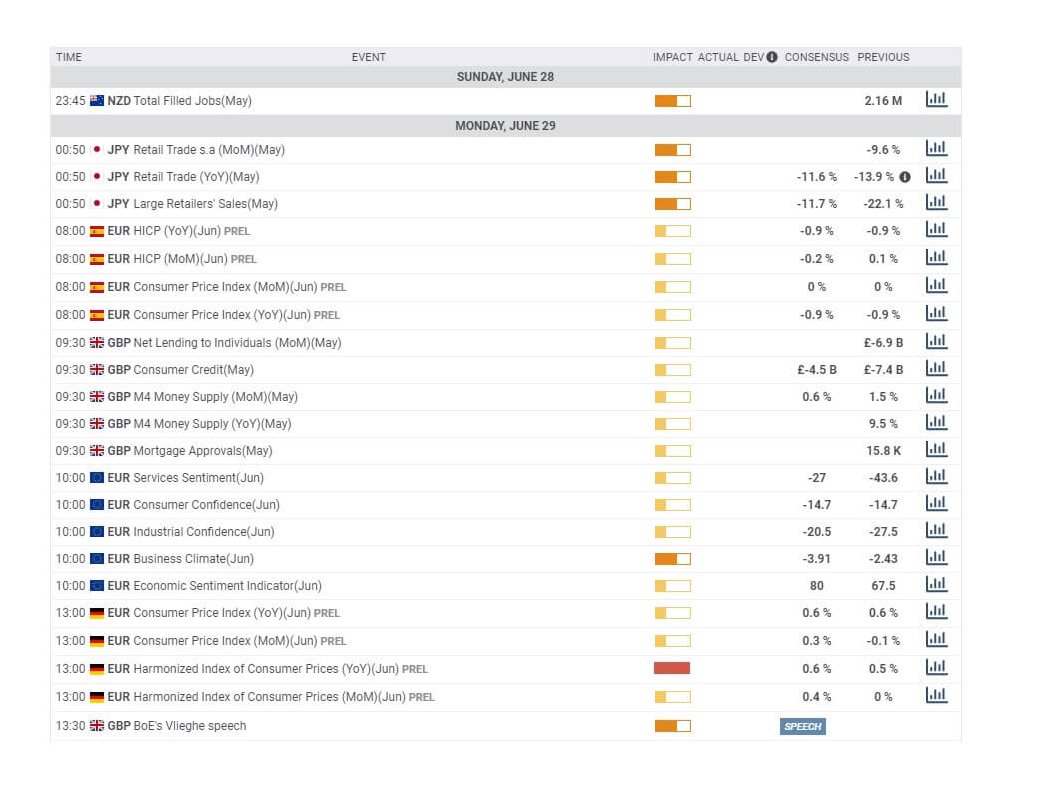
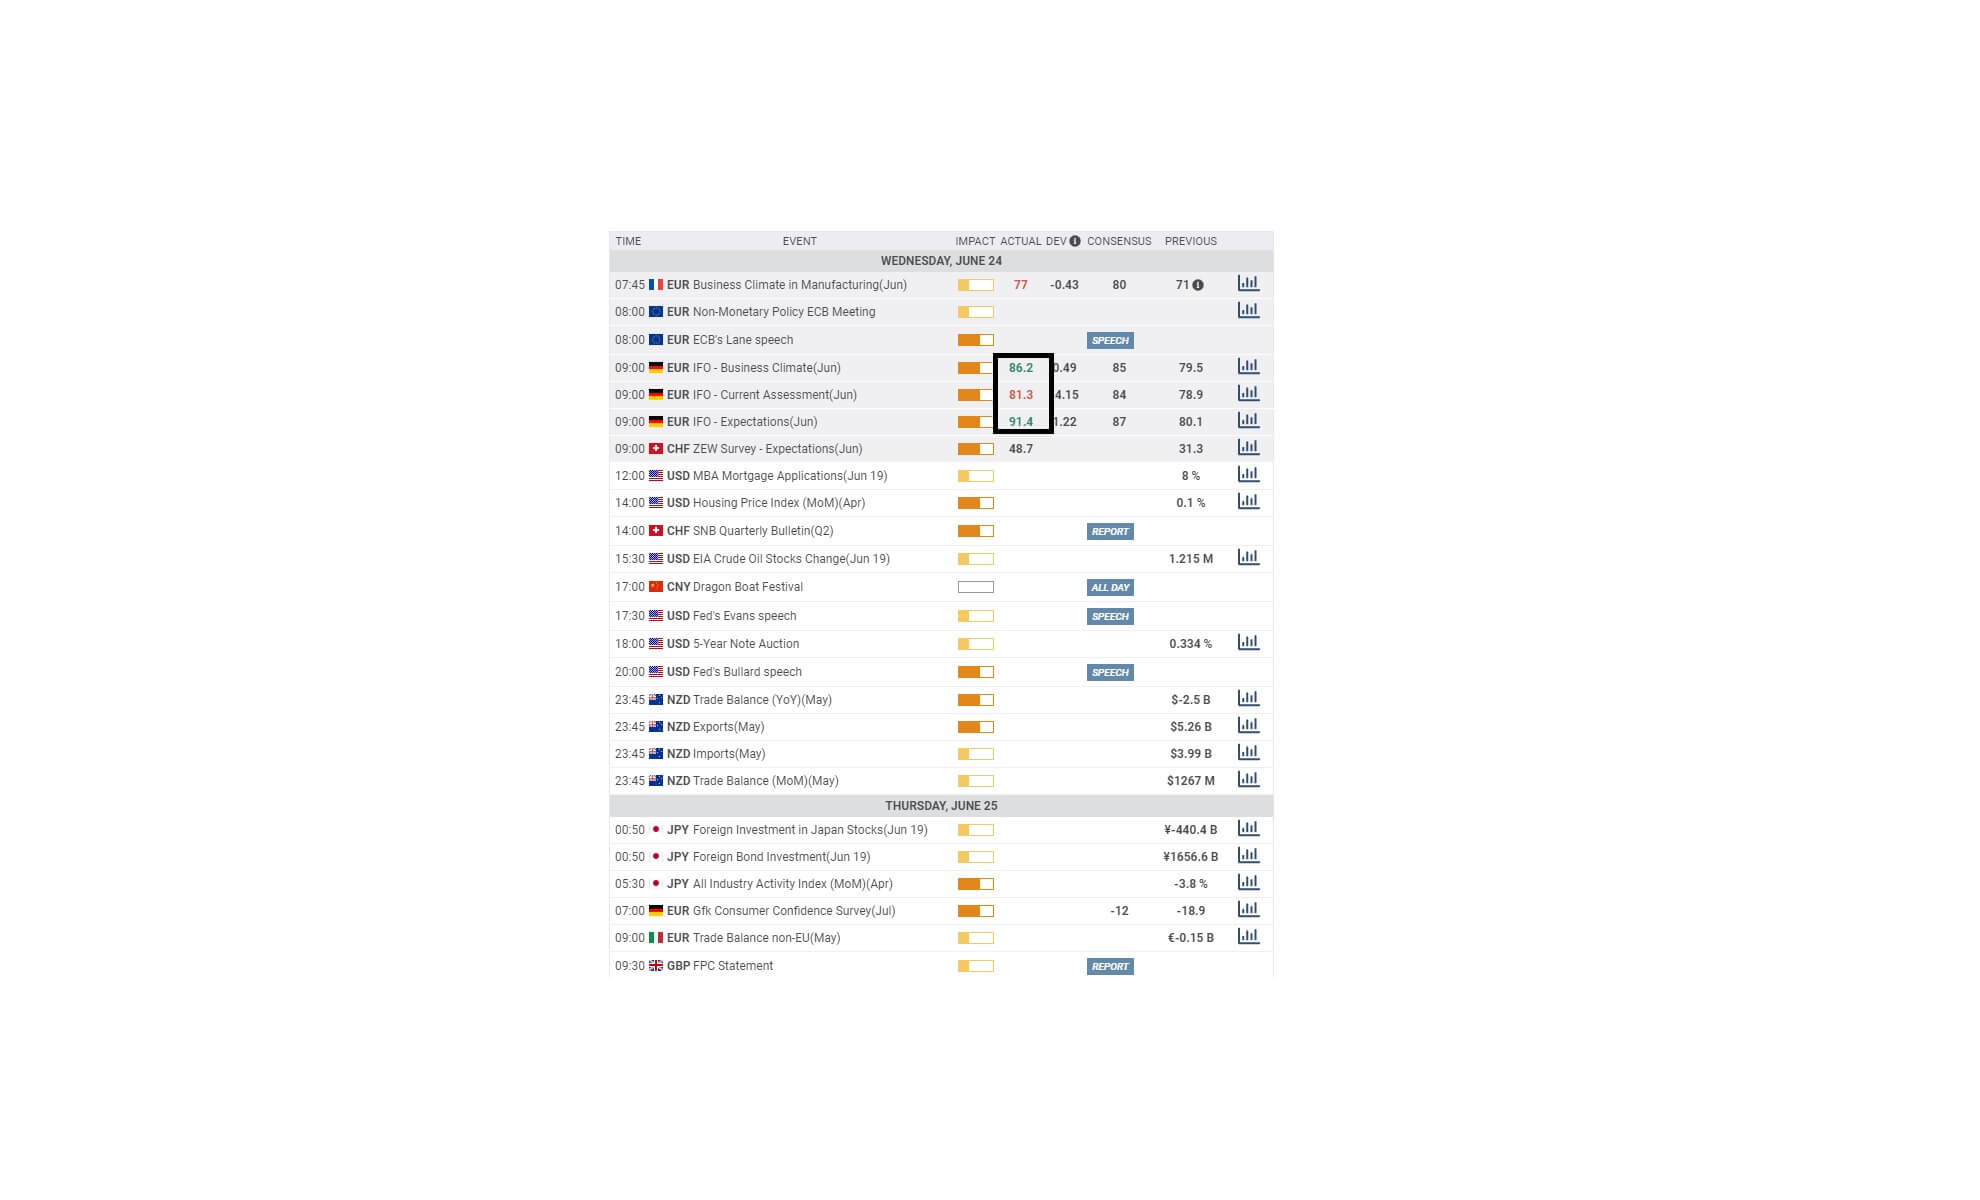
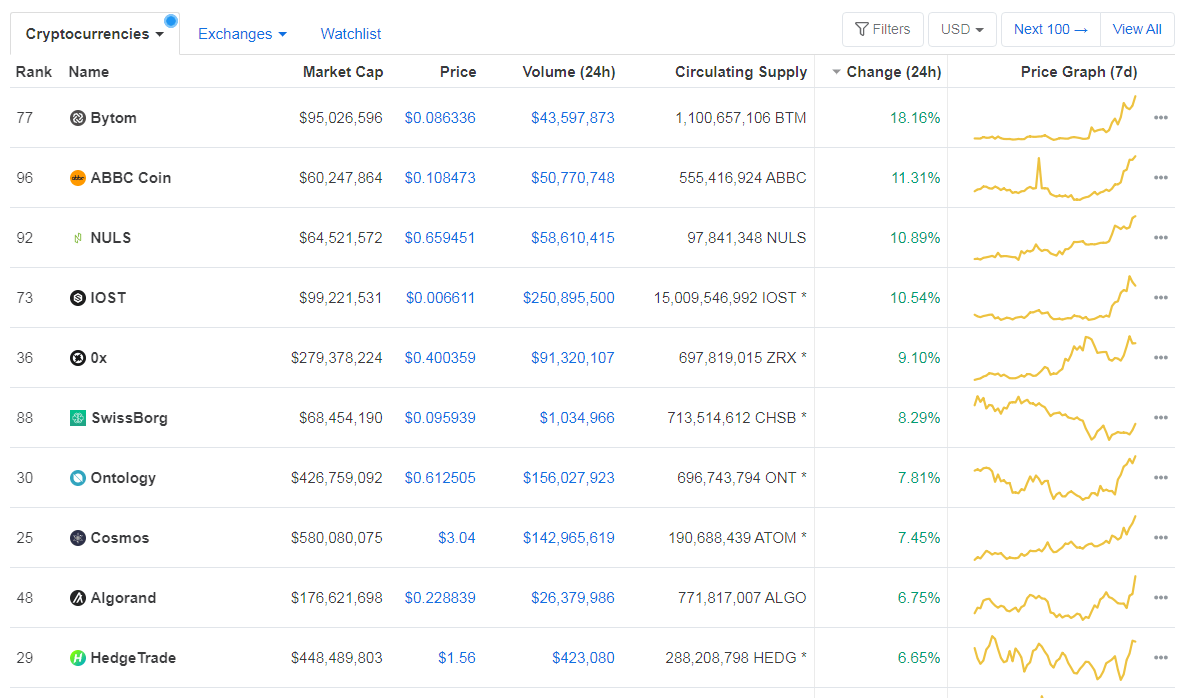
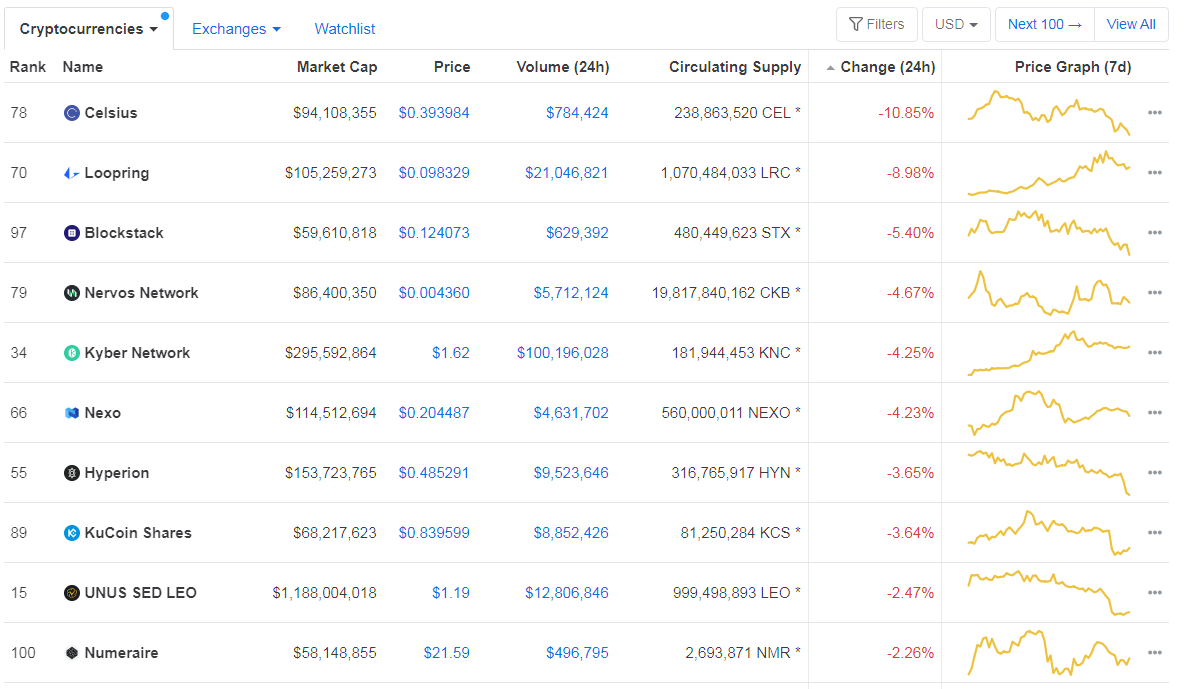
In the following section, we will analyze India’s GDP Growth data and observe the change in volatility due to the news announcement. The below image shows the fourth quarter GDP Growth data of India, where there has been a fall in the value compared to the previous quarter. The most critical and highest contributor to the growth of the Indian economy is services. Let us find out the reaction of the market to this data.  

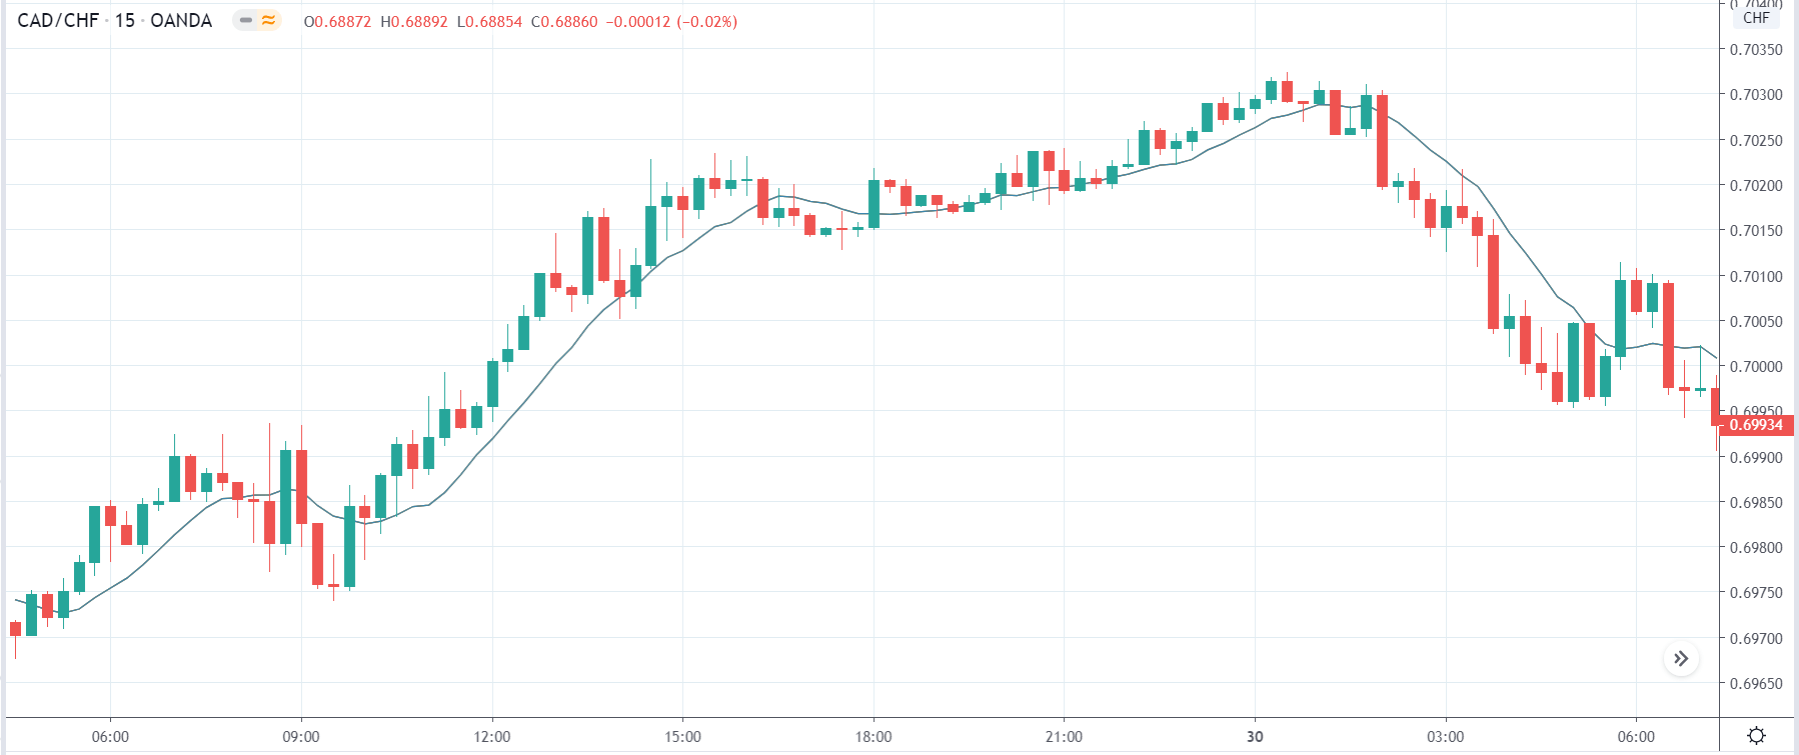
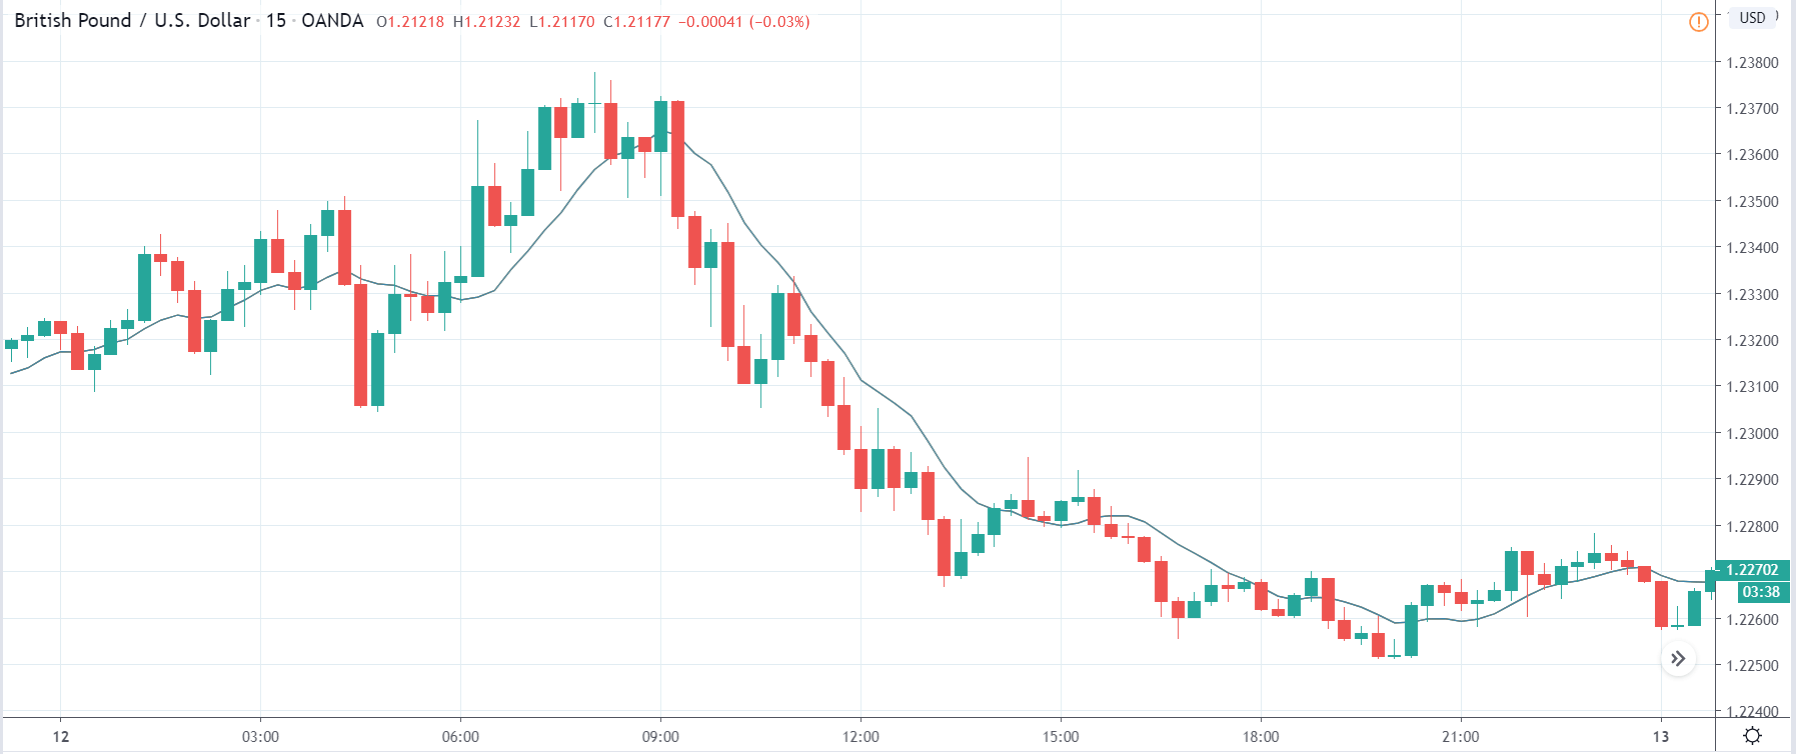
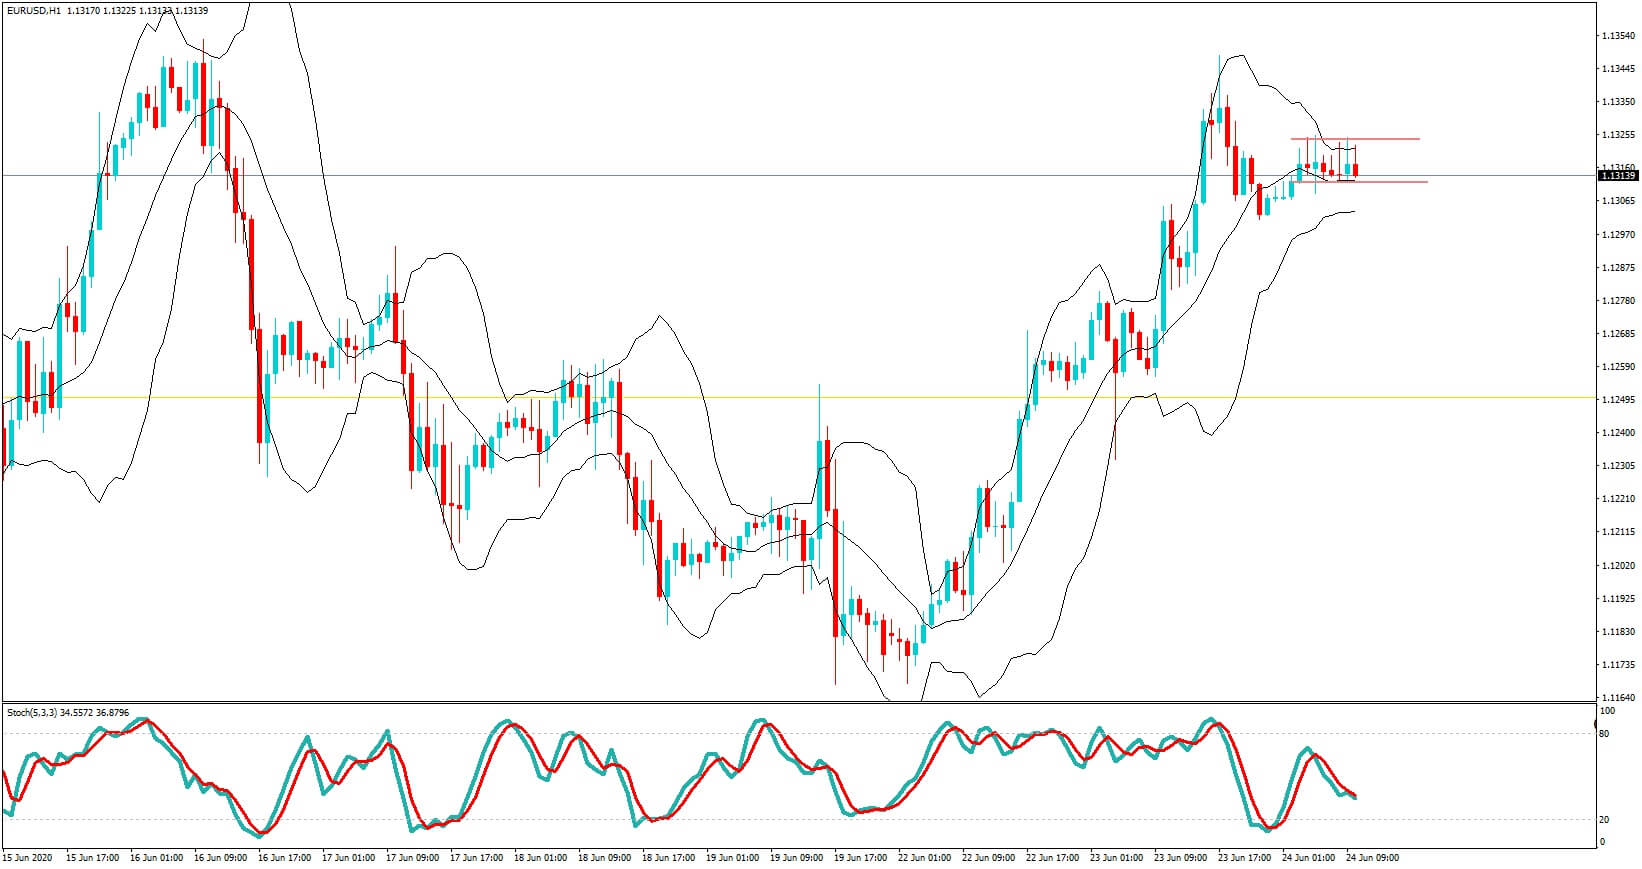
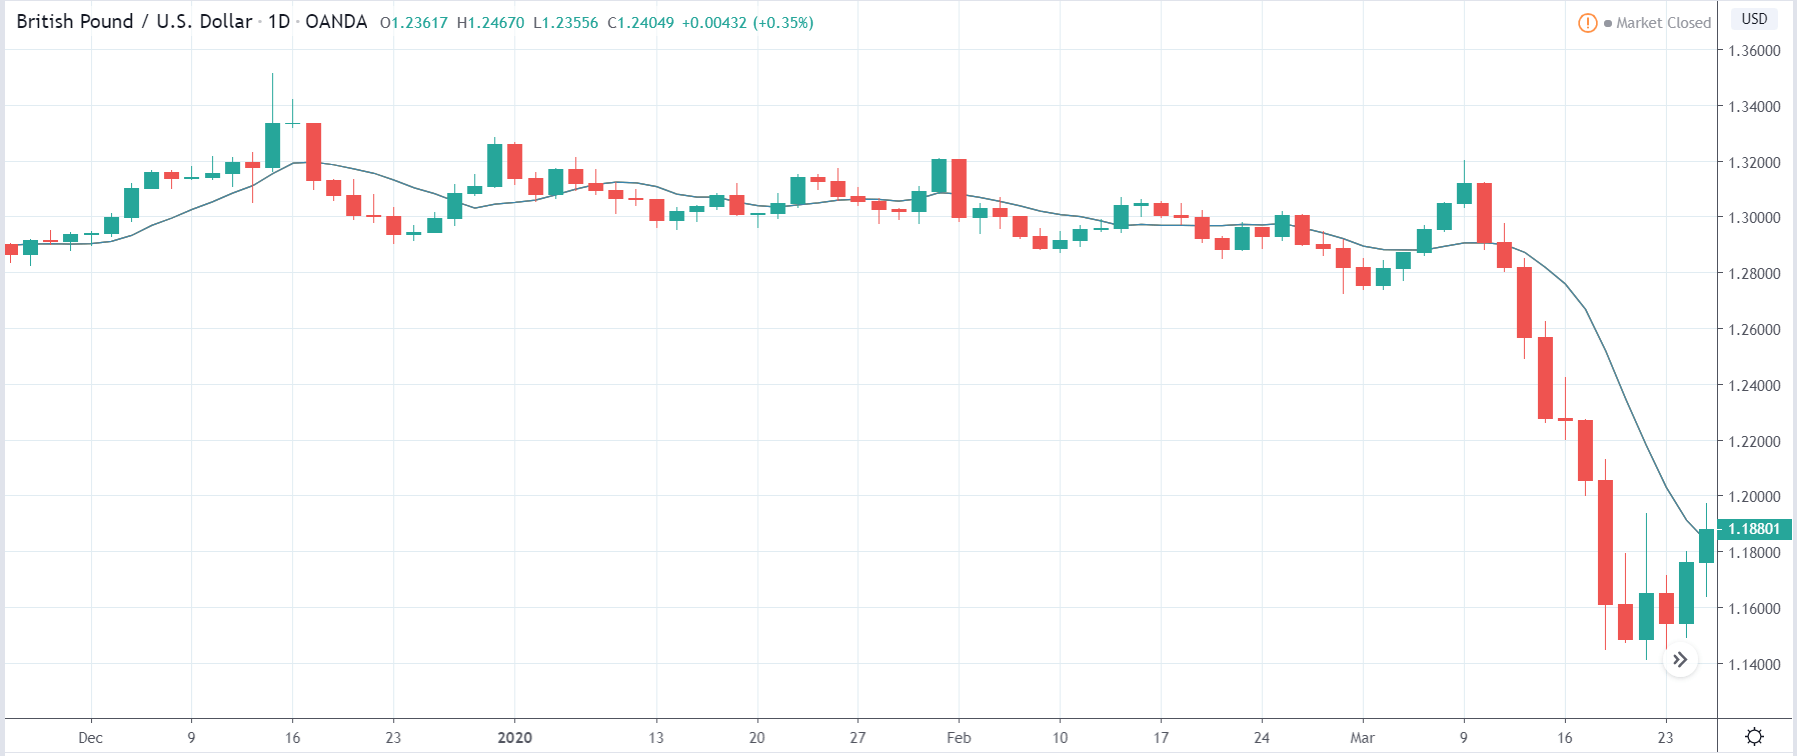
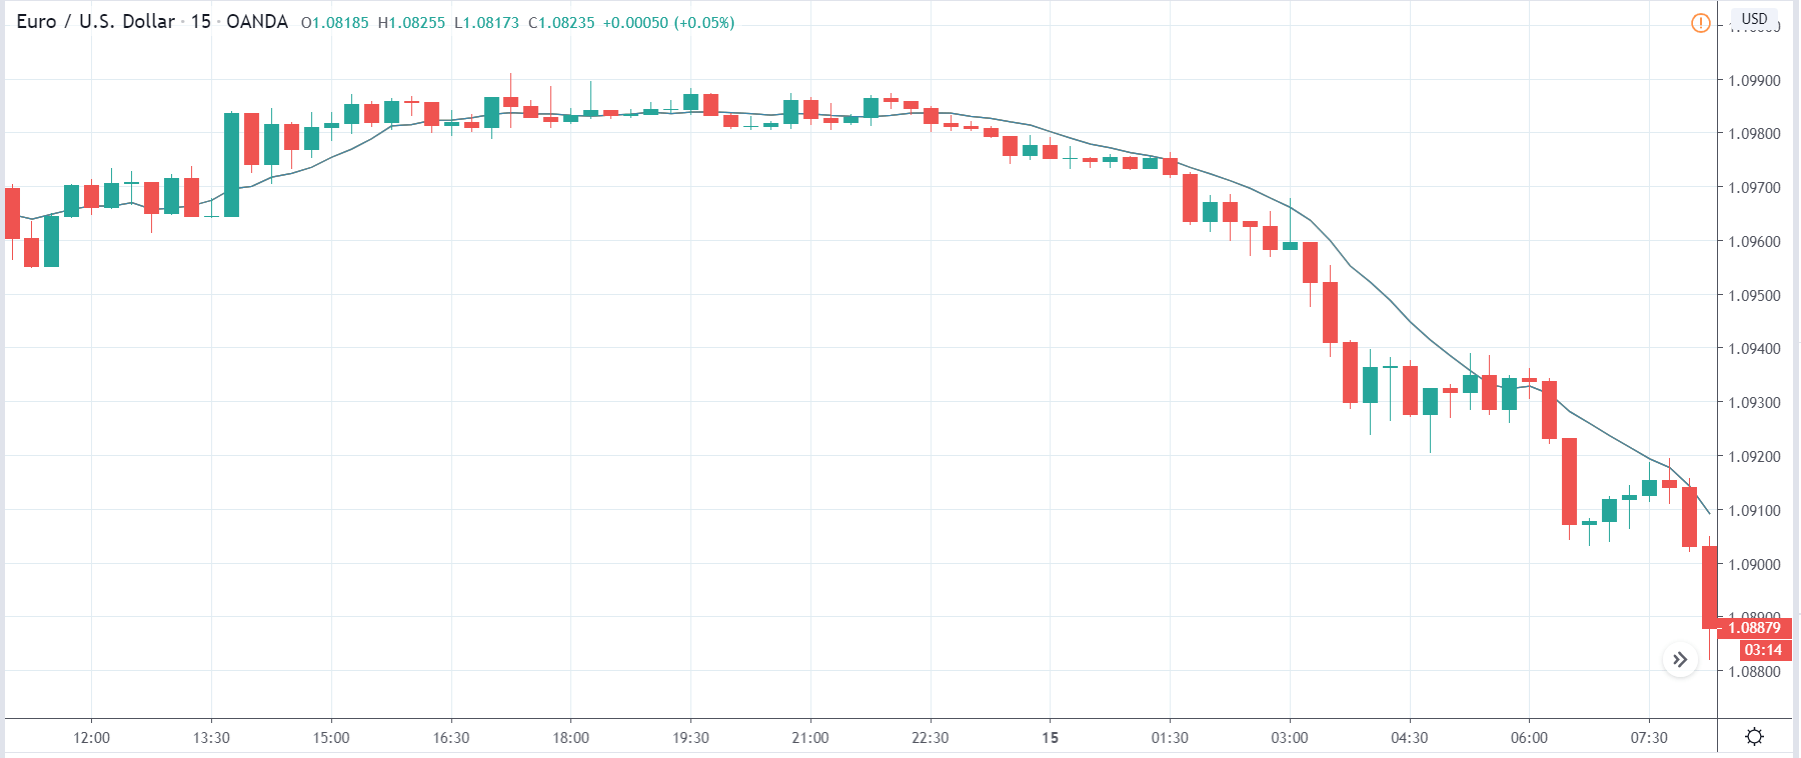
USD/INR | Before the announcement:

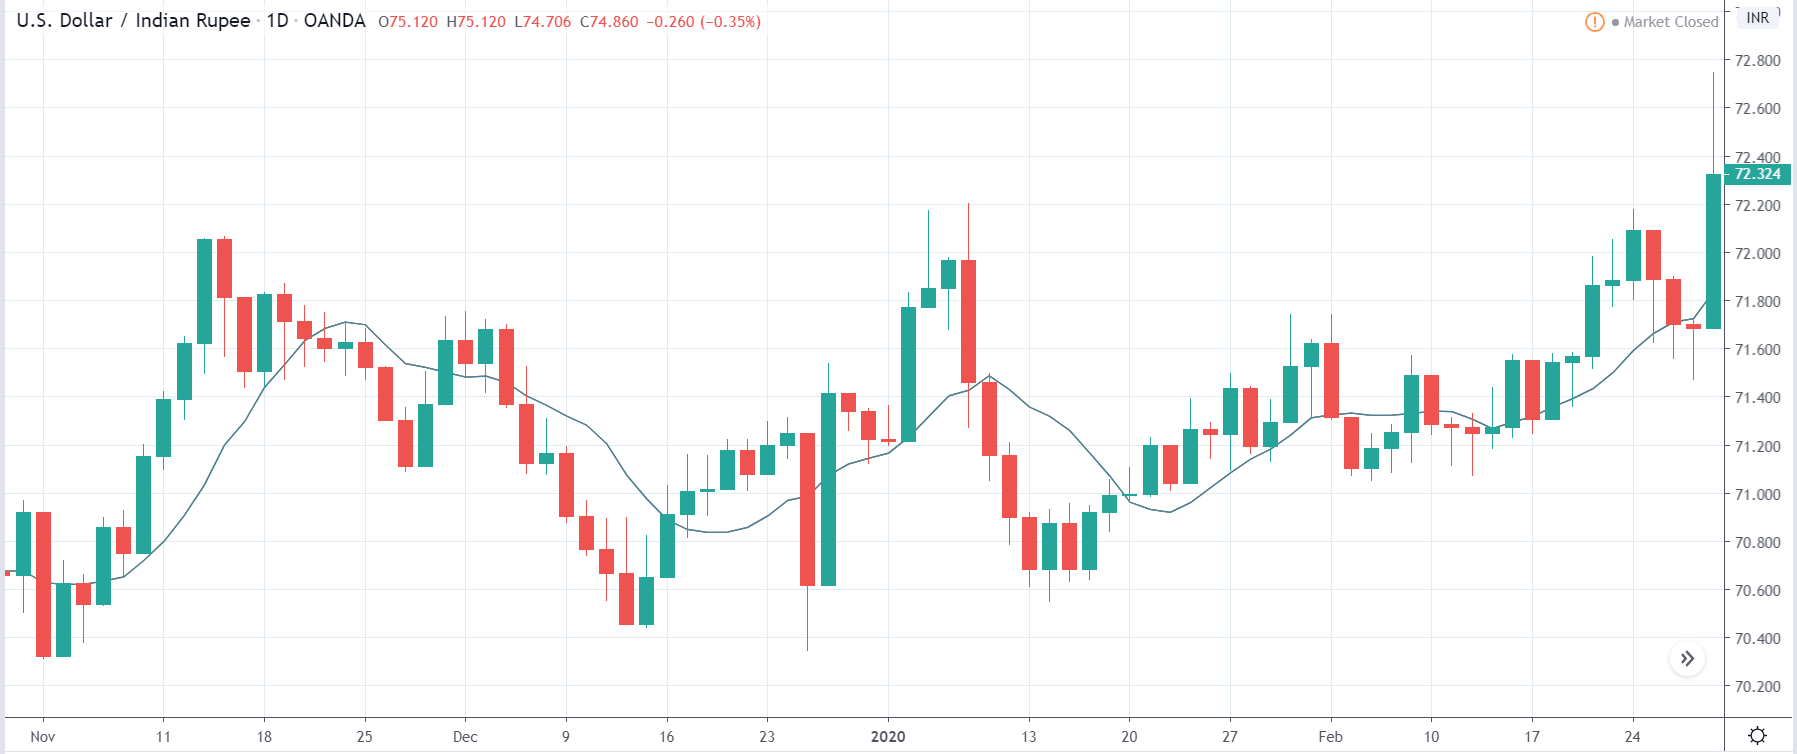
We shall start with the USD/INR currency pair to study the impact of GDP Growth Rate on the Indian Rupee. The above image shows the ‘Daily’ time-frame chart of the currency before the news announcement, where we see that the market is moving within a ‘range’ and currently the price seems to have broken out of the ‘range.’ The volatility is high on the upside, indicating that the Indian Rupee is weakening. Depending on the GDP Growth Rate data, we will take a suitable position.  

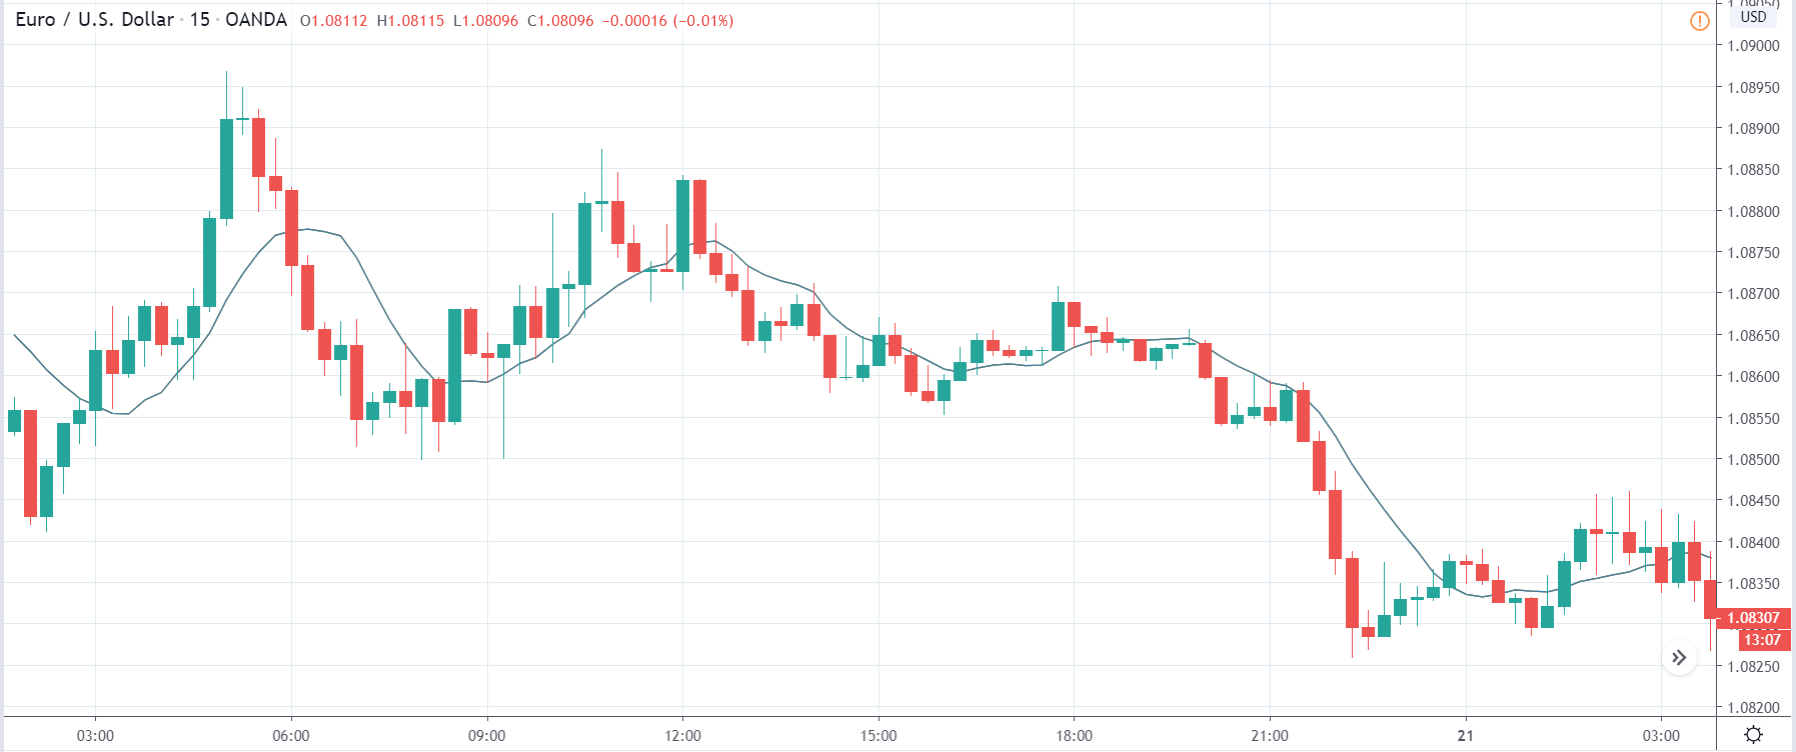
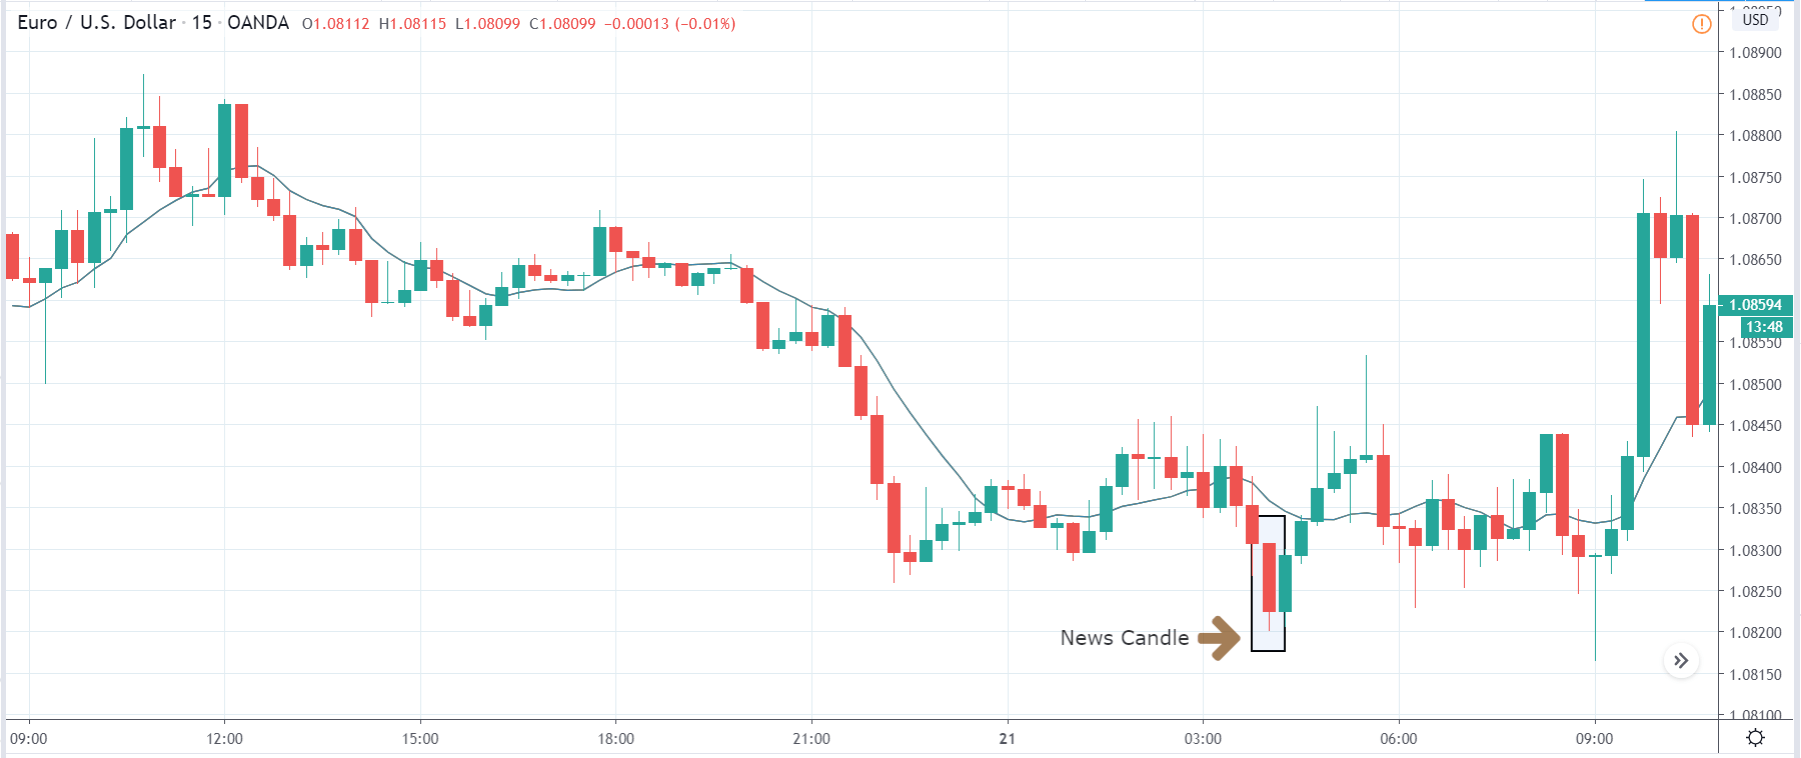
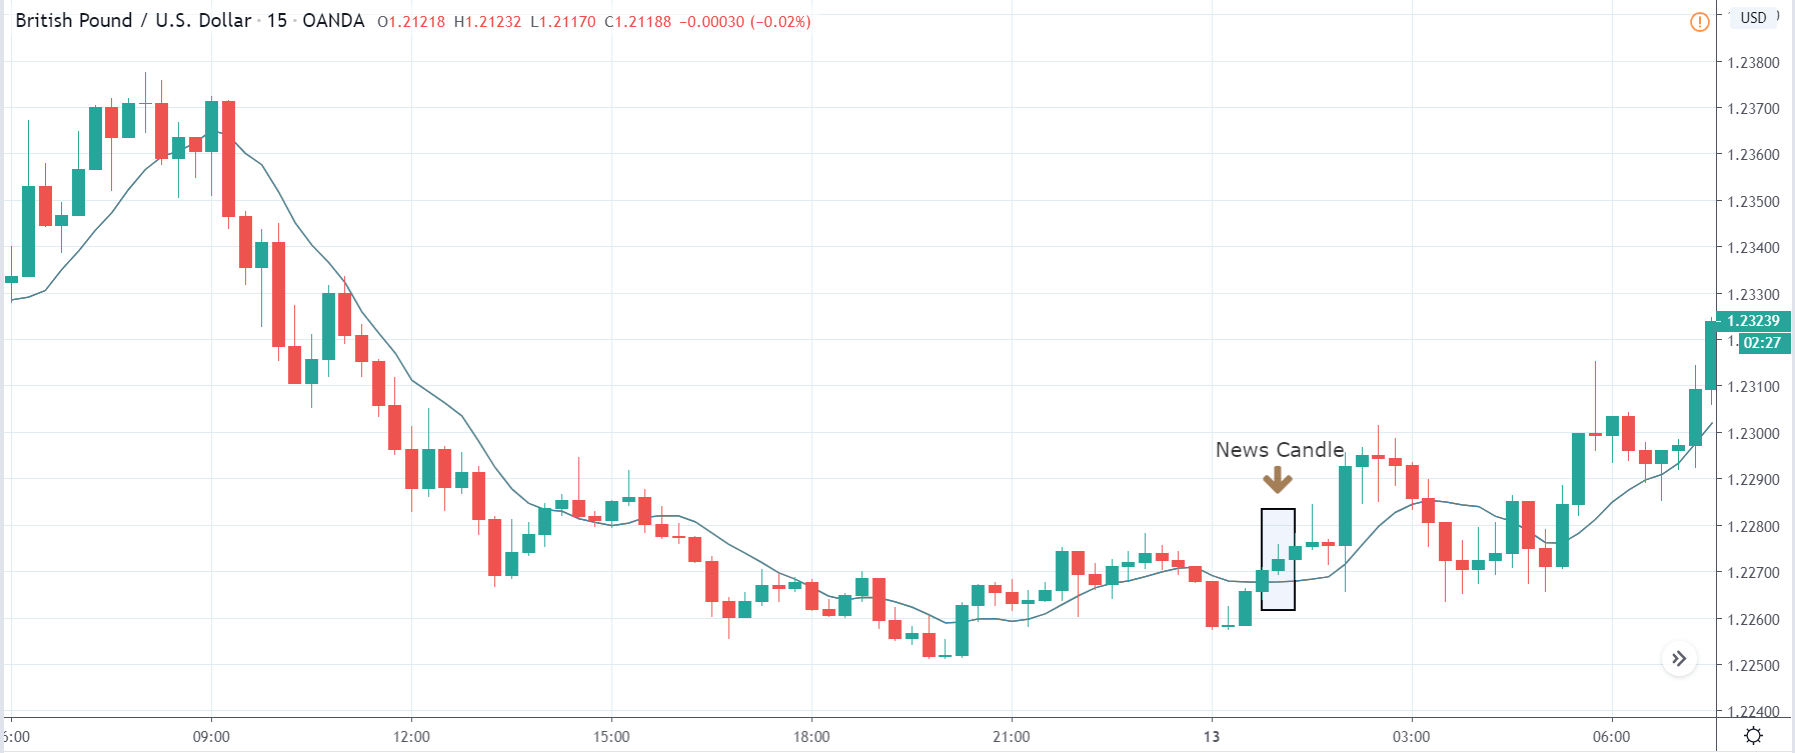
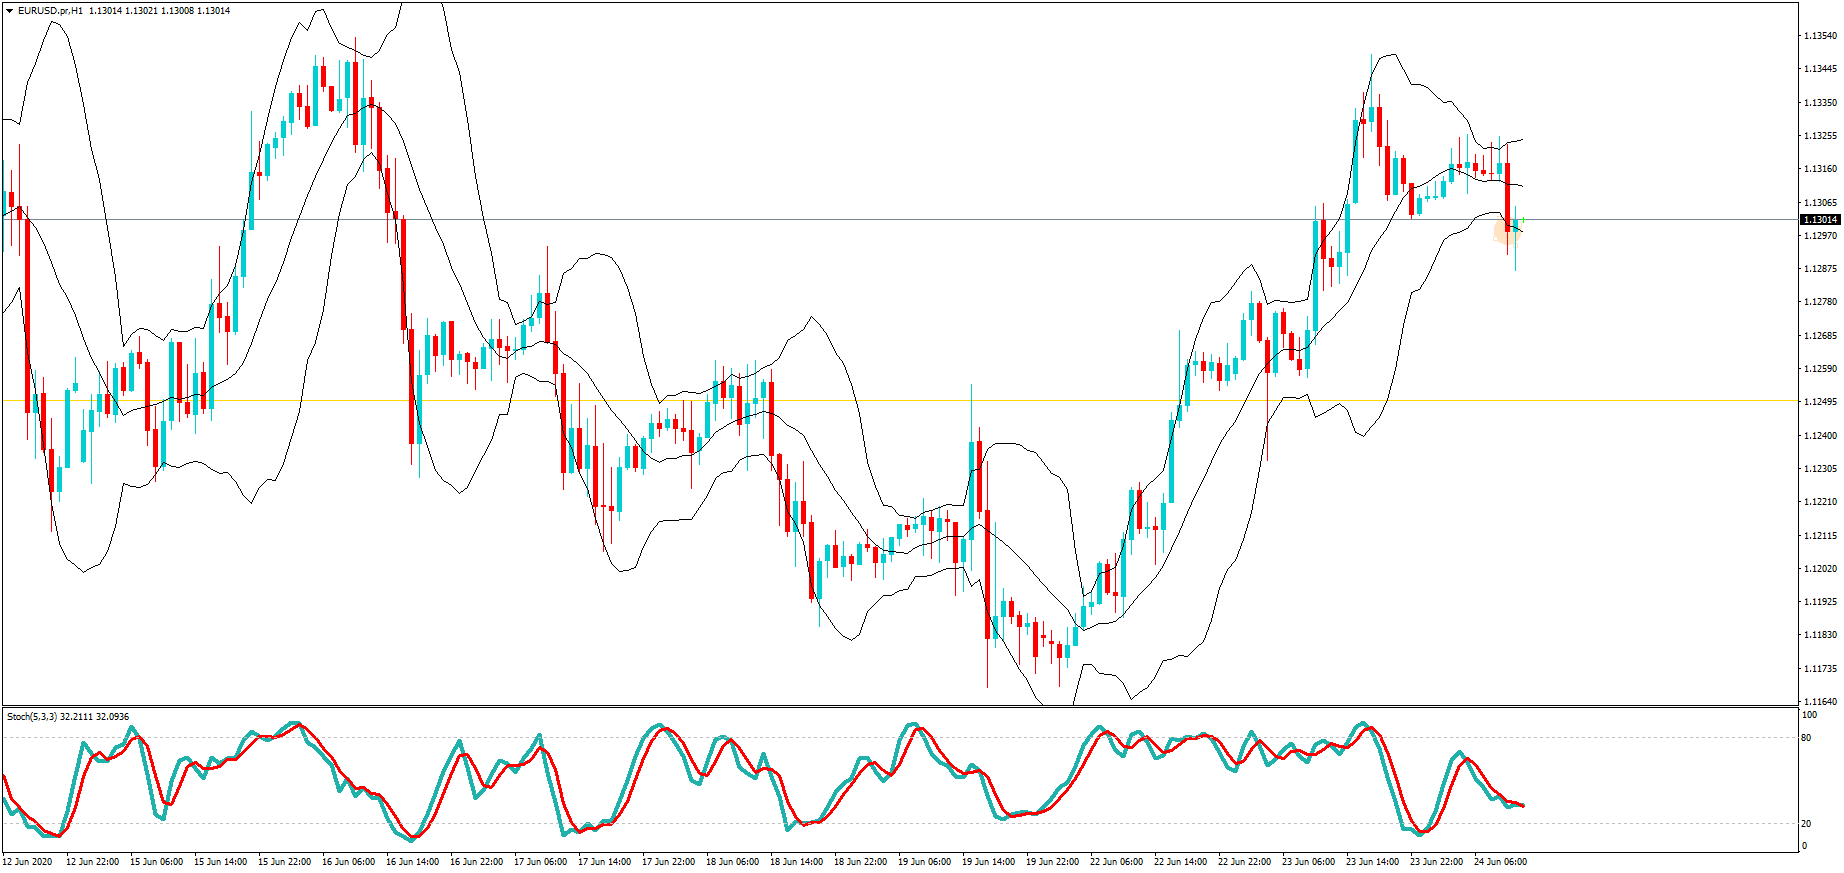
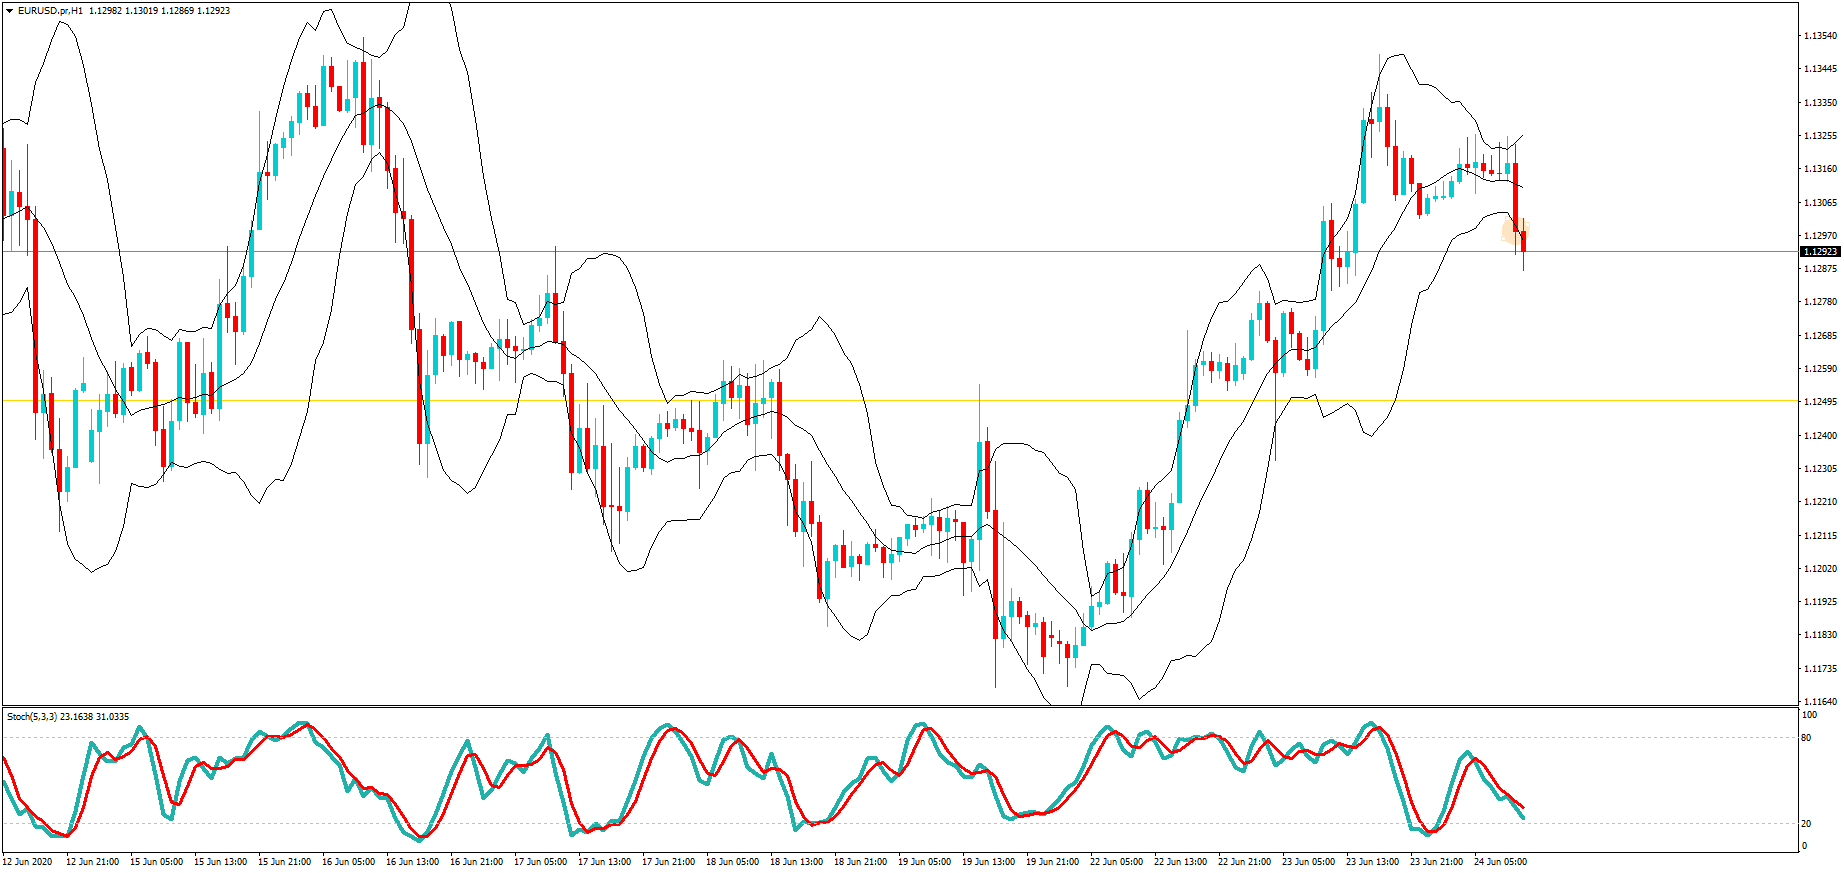
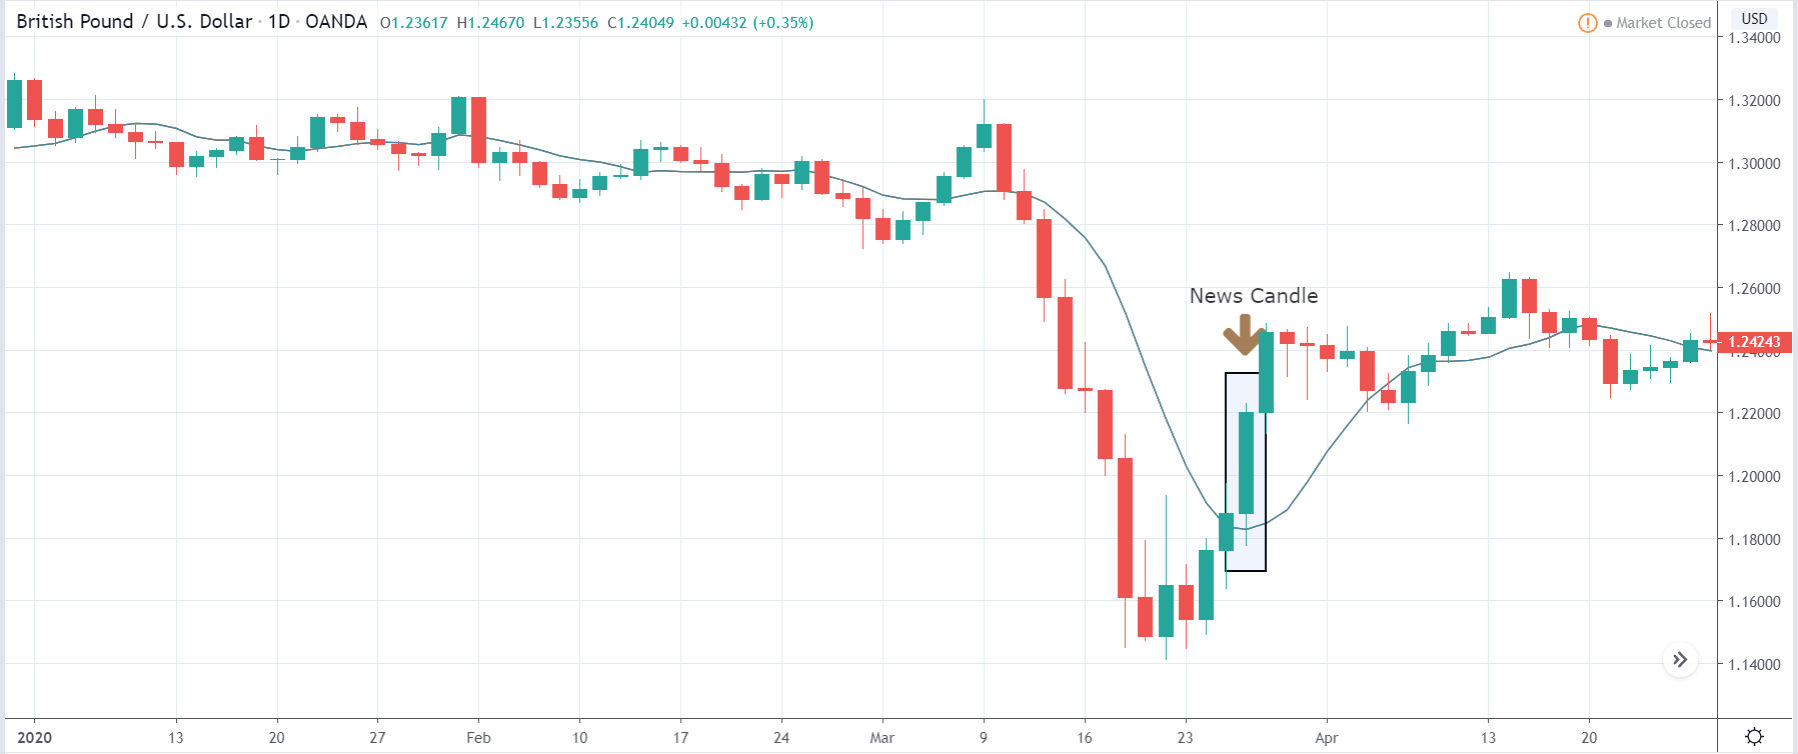
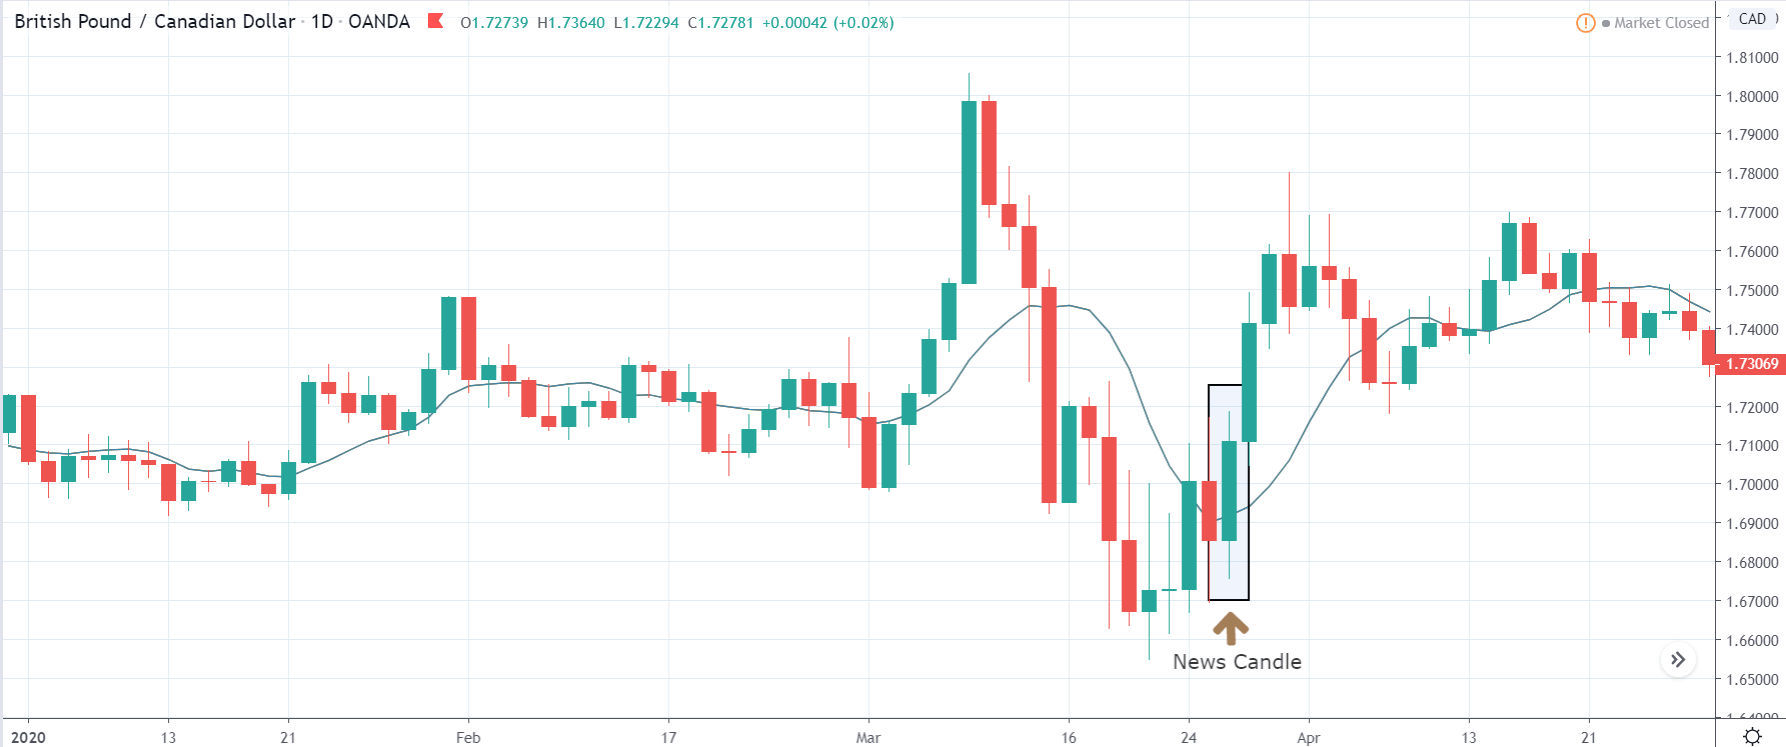
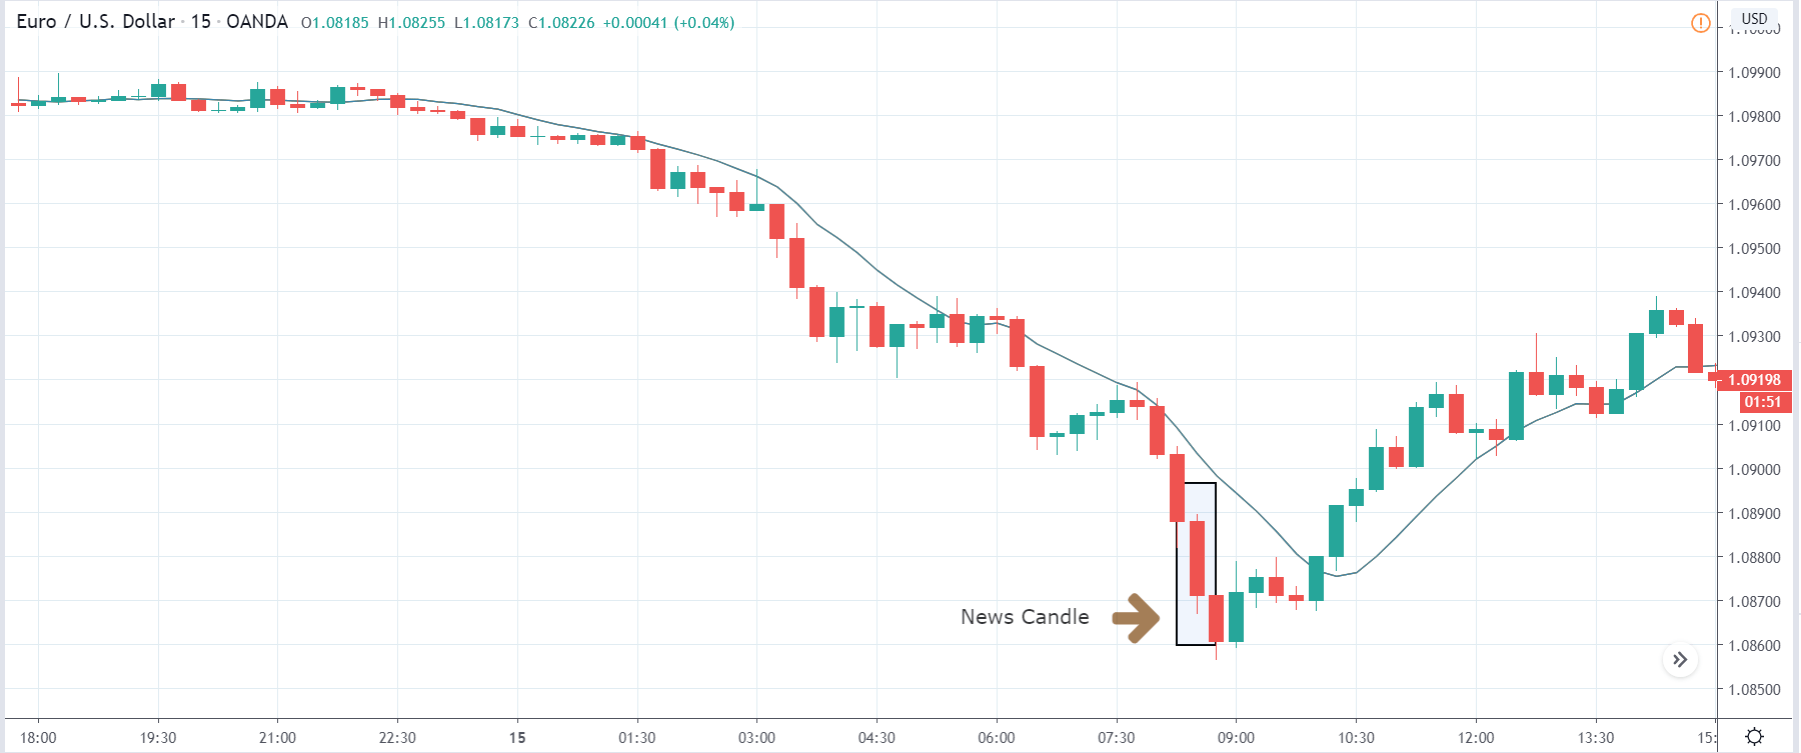
USD/INR | After the announcement:

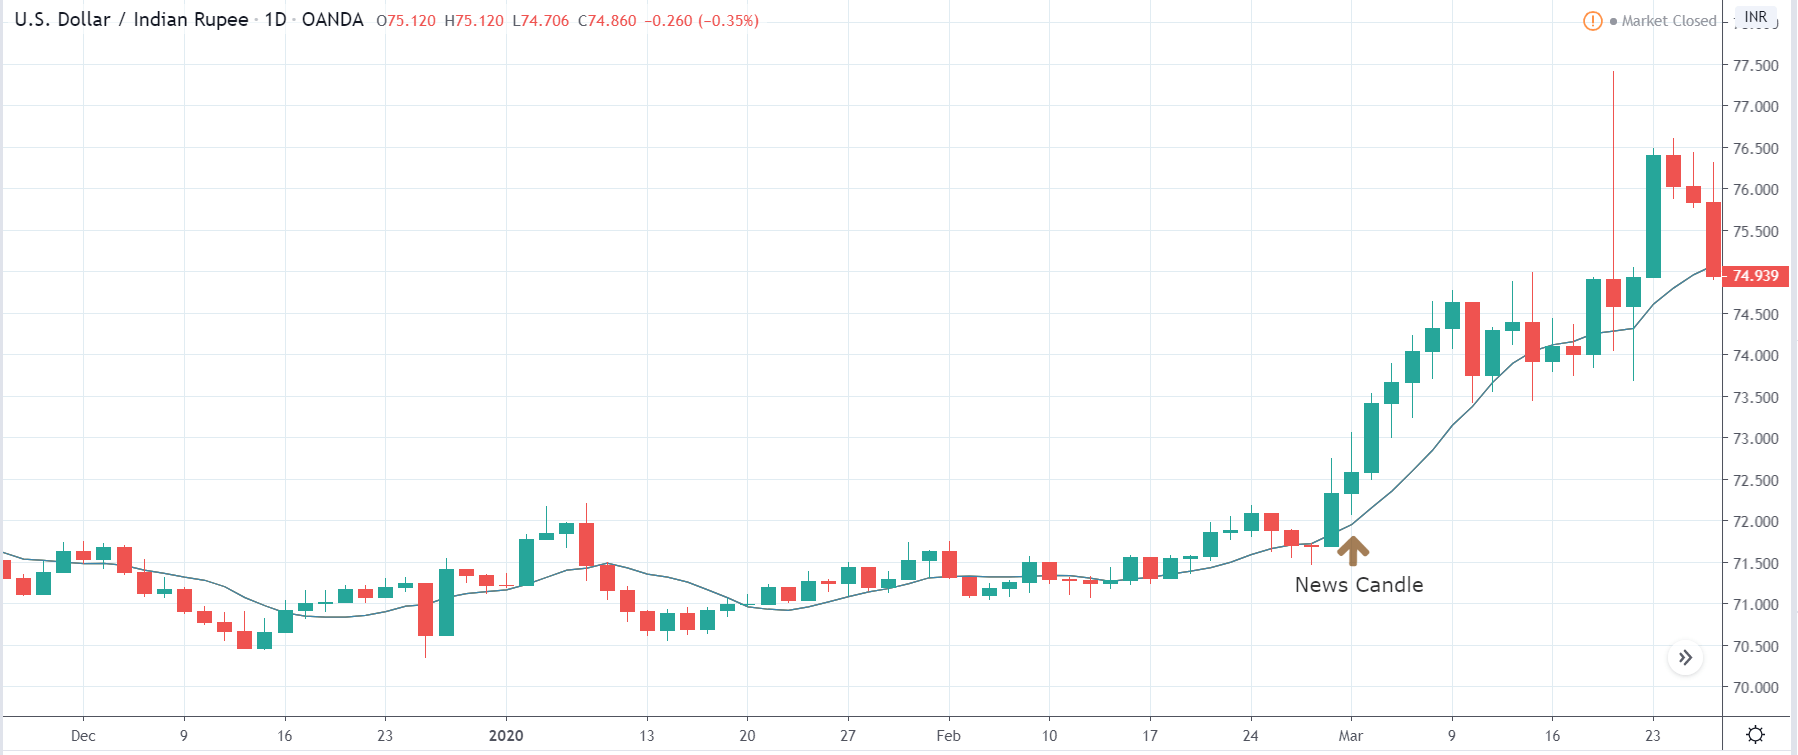
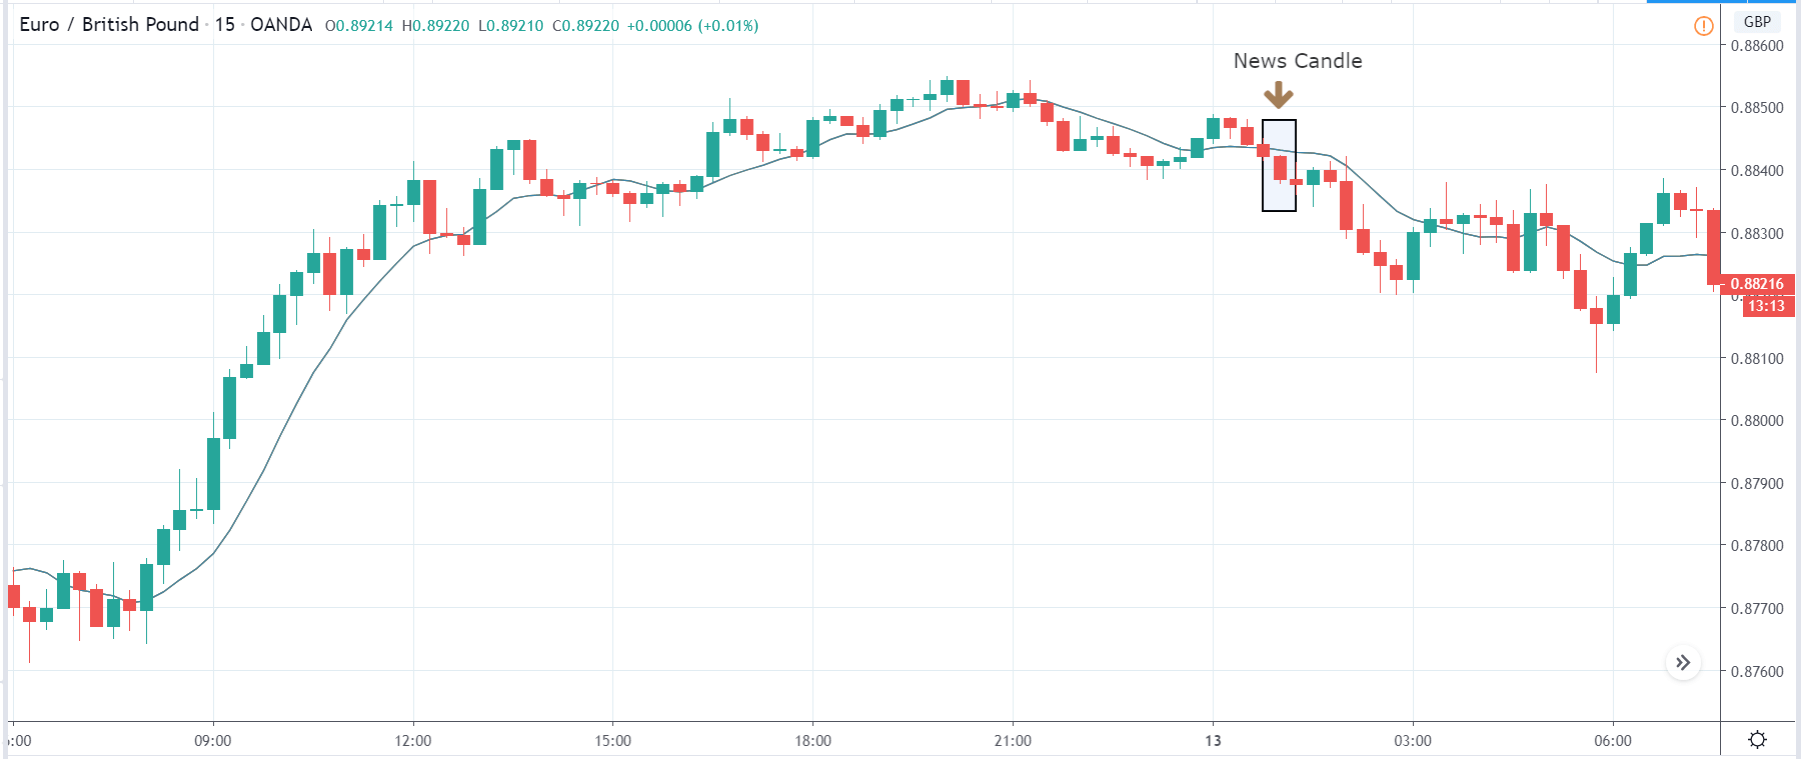
After the news announcement, we see a sudden rise in the volatility to the upside. The price moves higher initially, but selling pressure from the top makes the ‘news candle’ to close with a wick on the top. This was a result of the harmful GDP Growth data where there was a reduction in the Growth Rate from last quarter.   

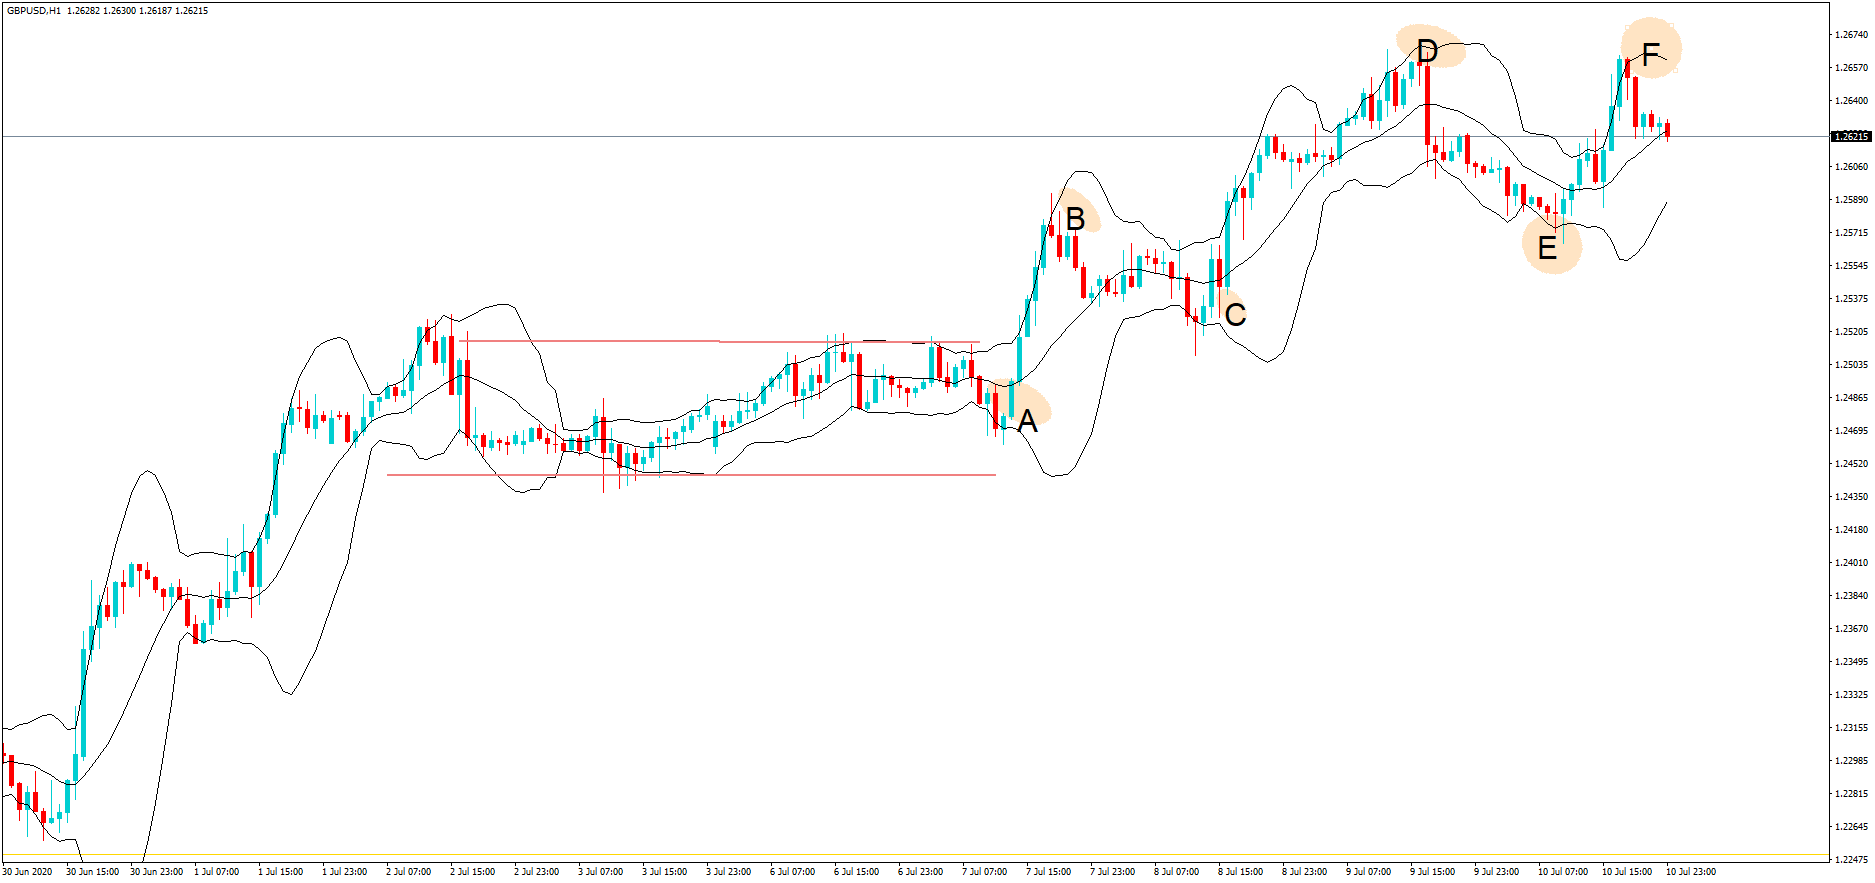
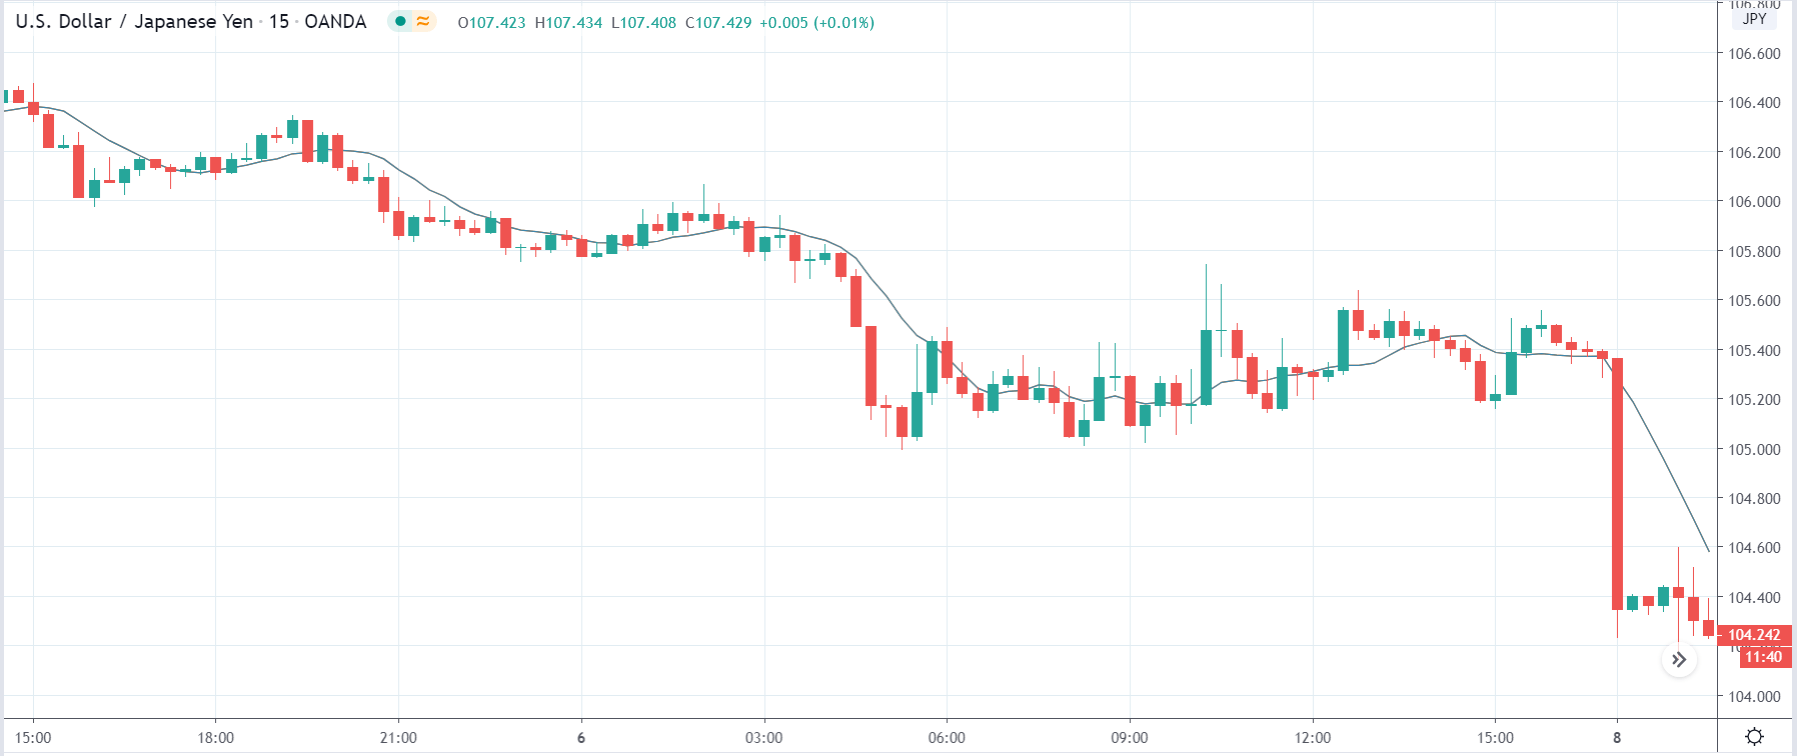
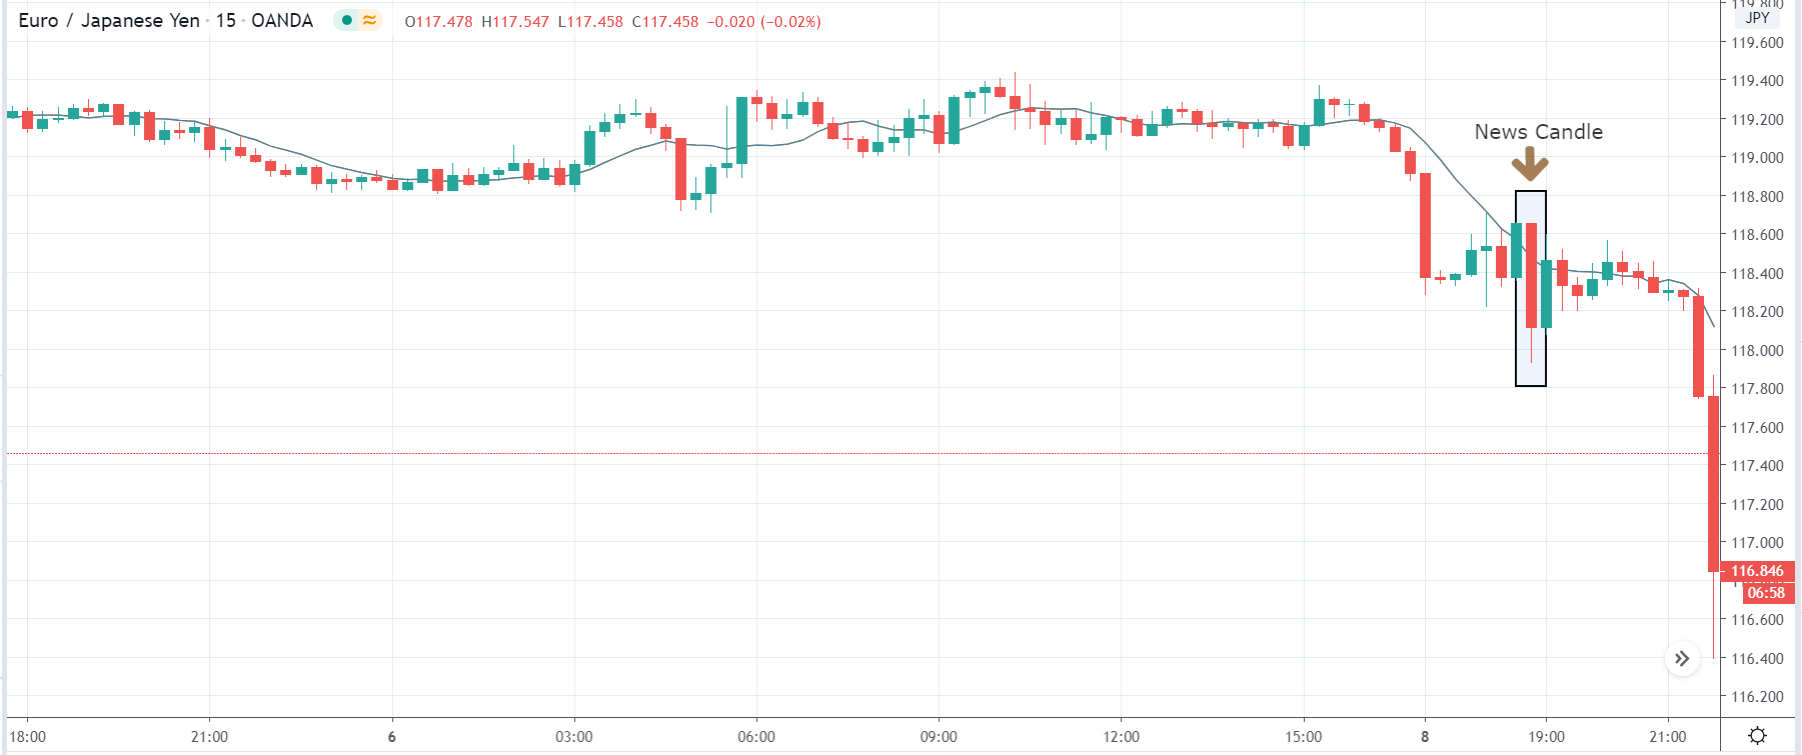
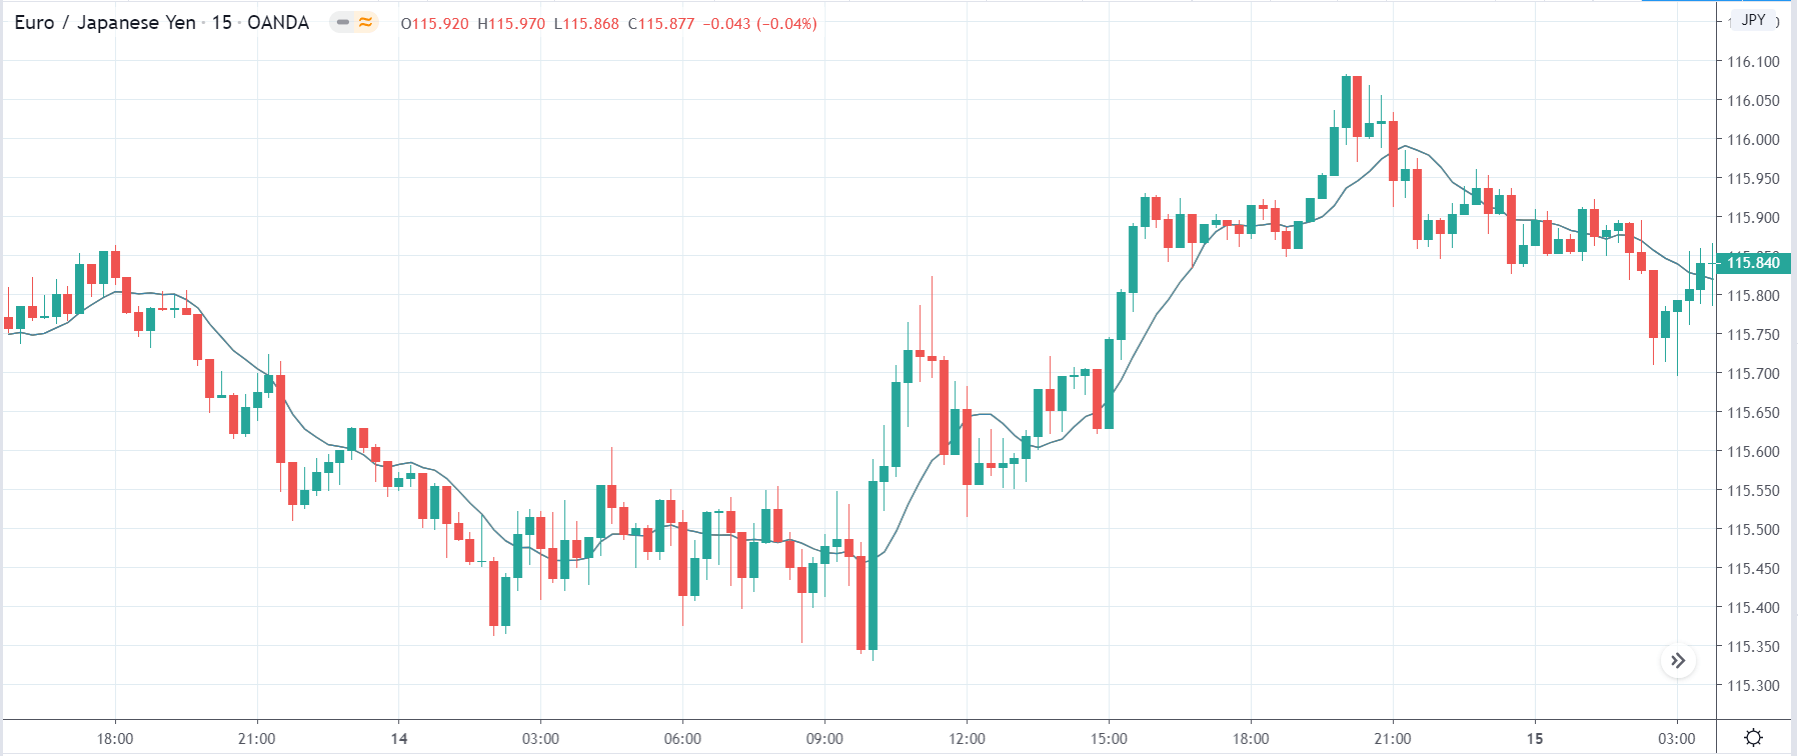
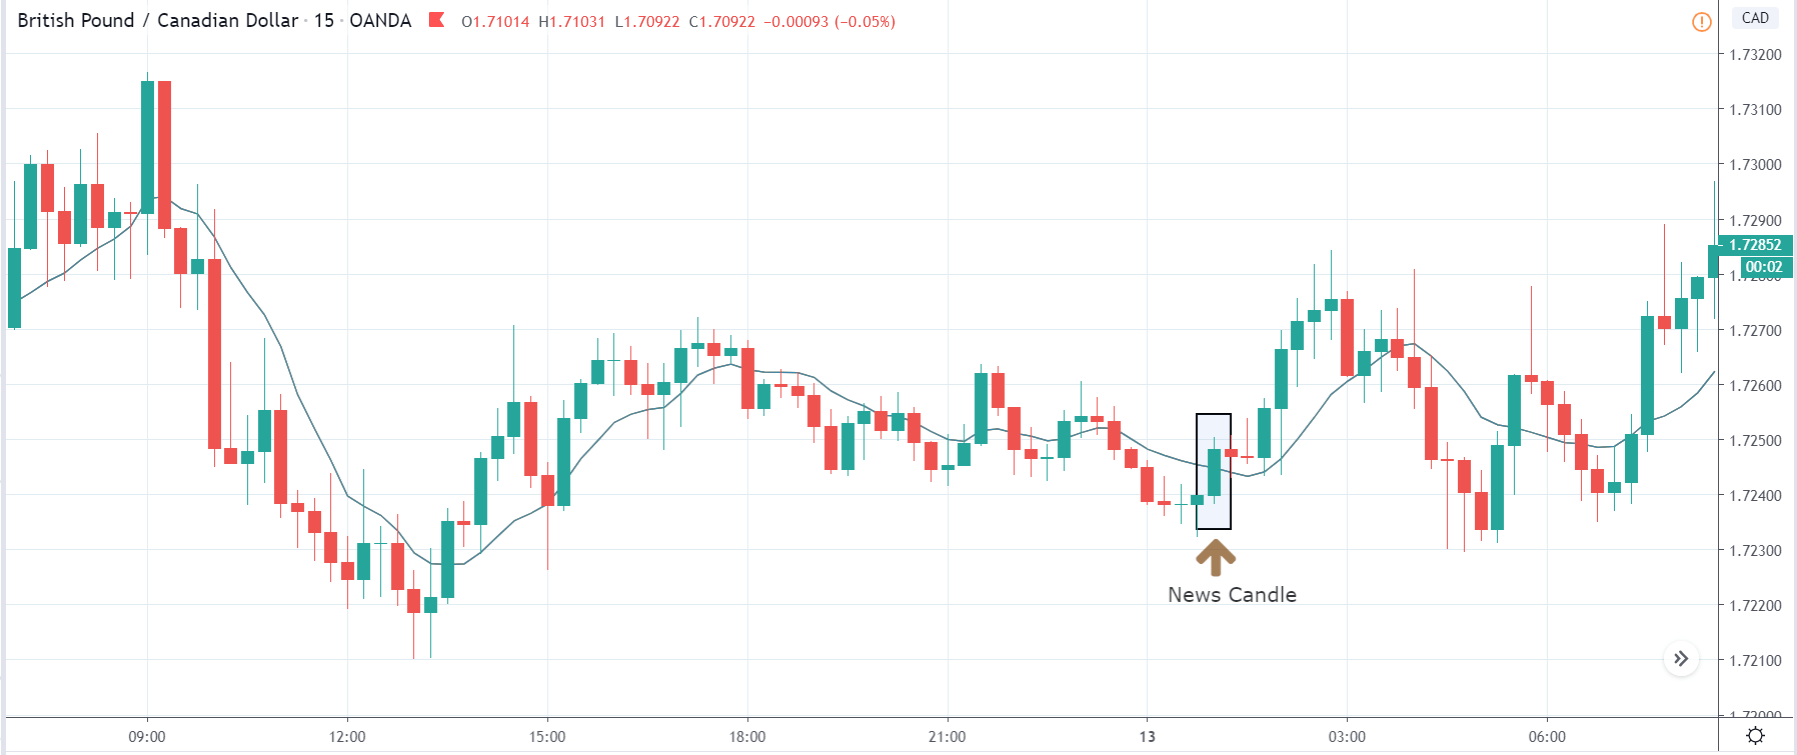
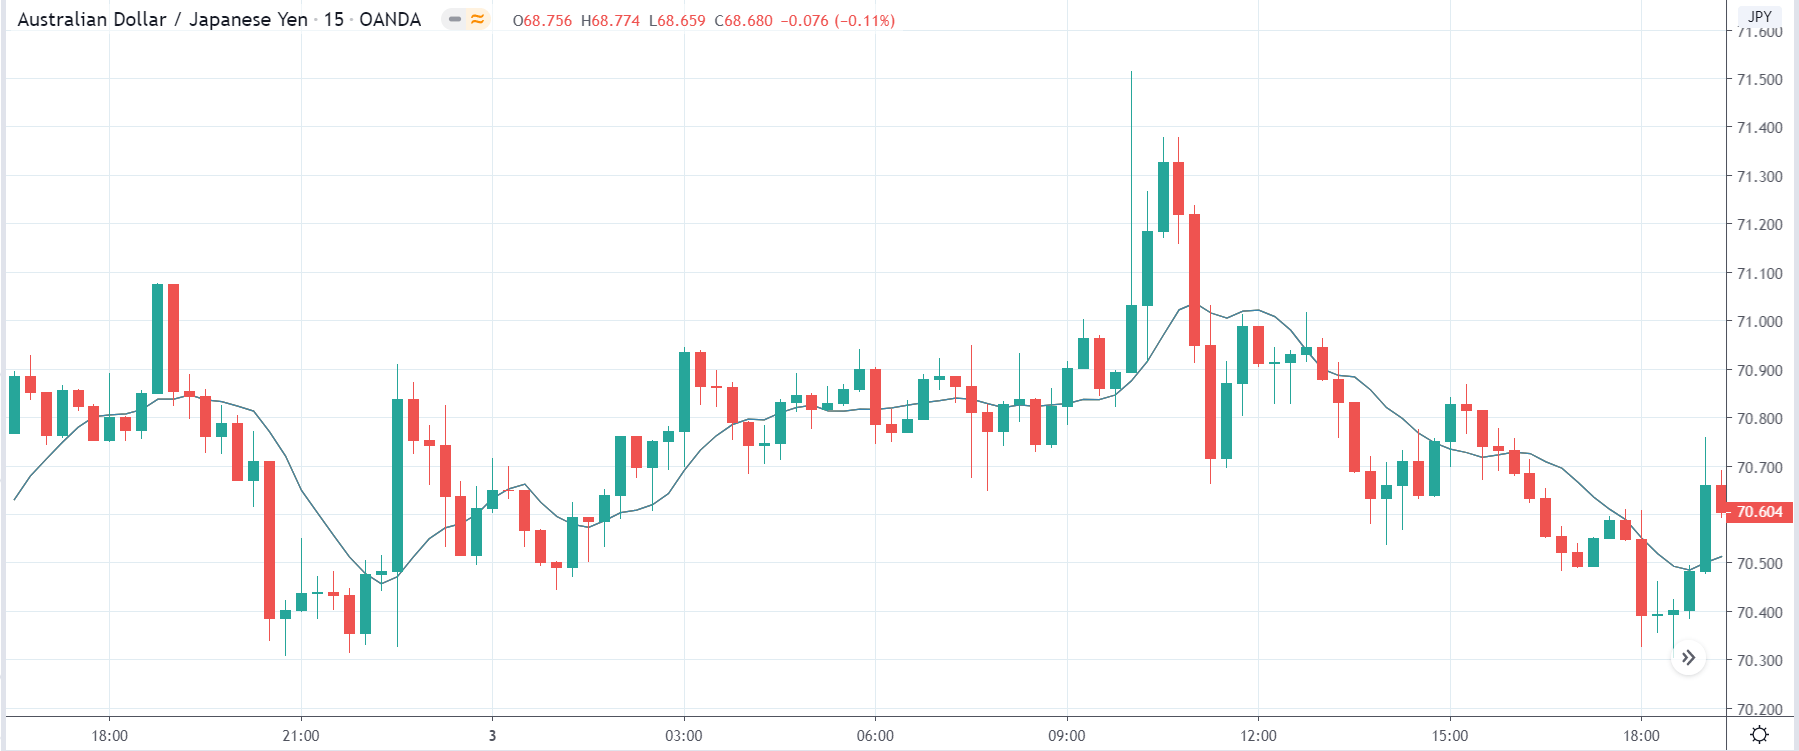
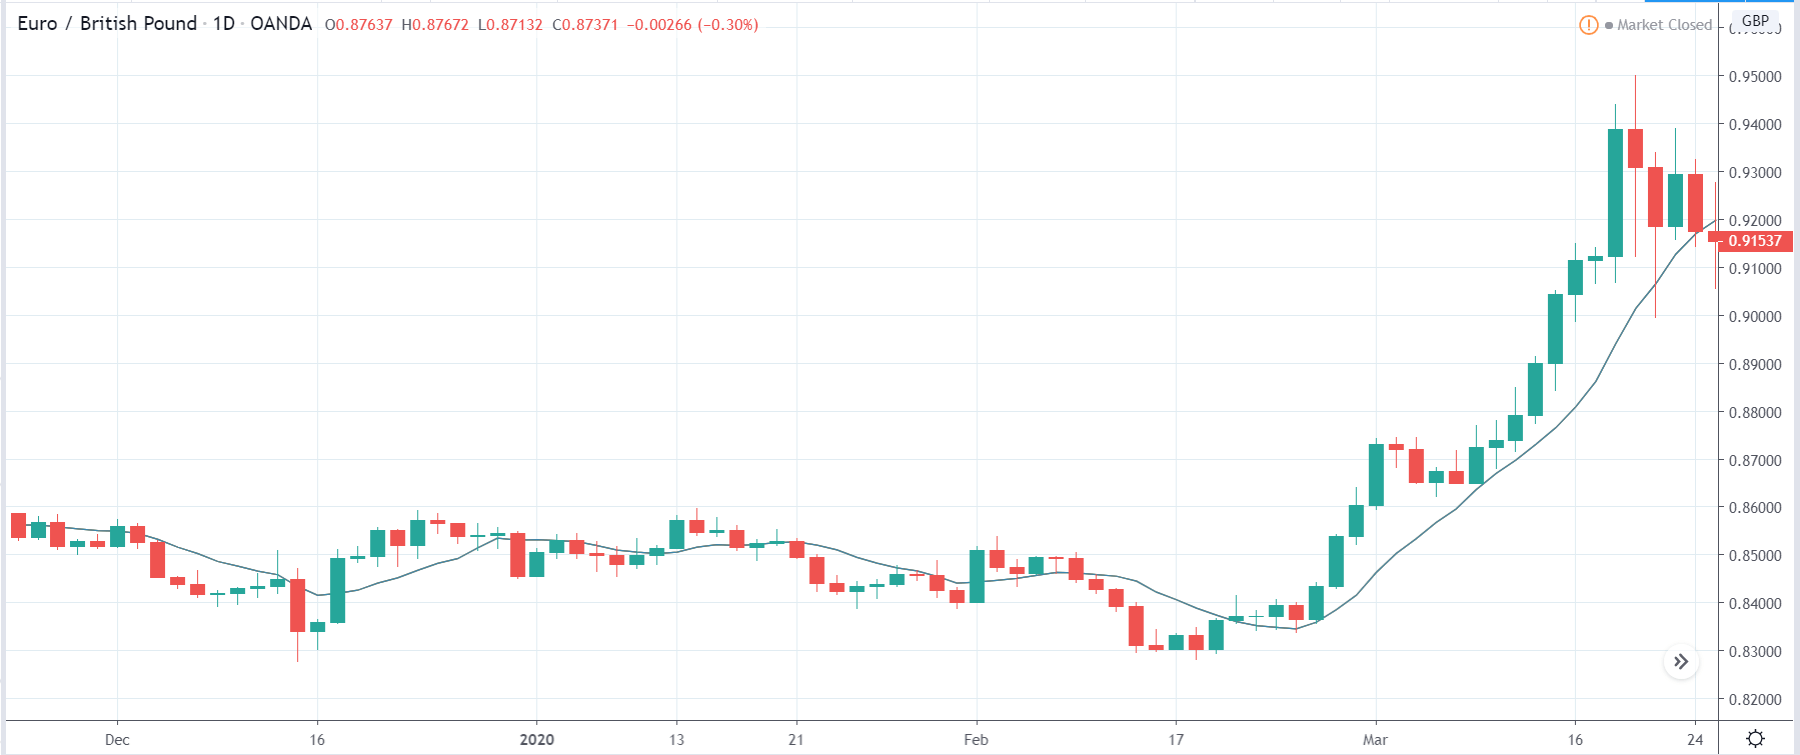
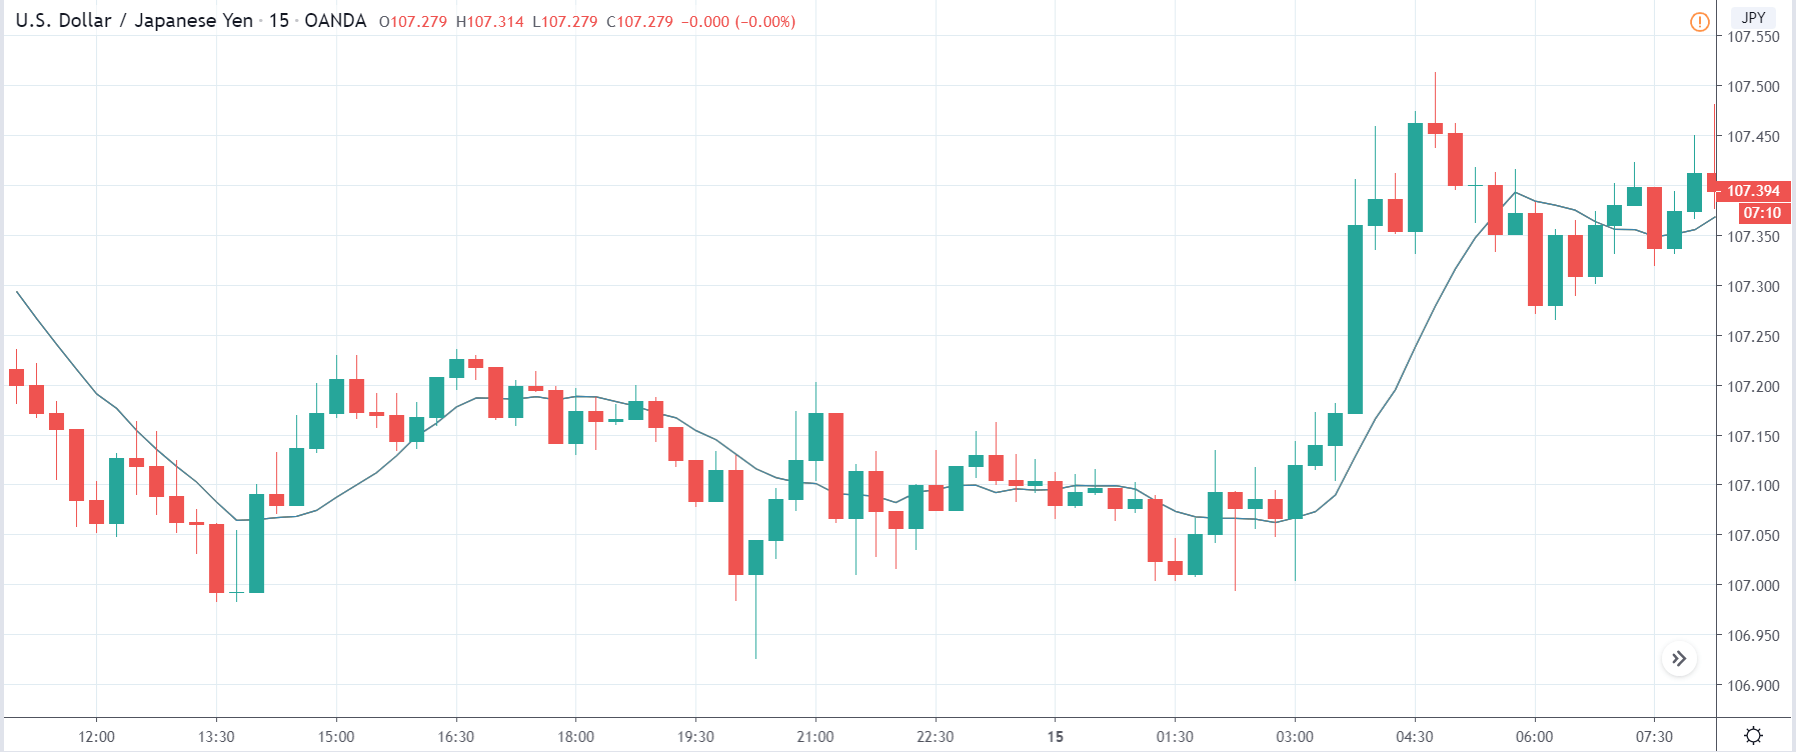
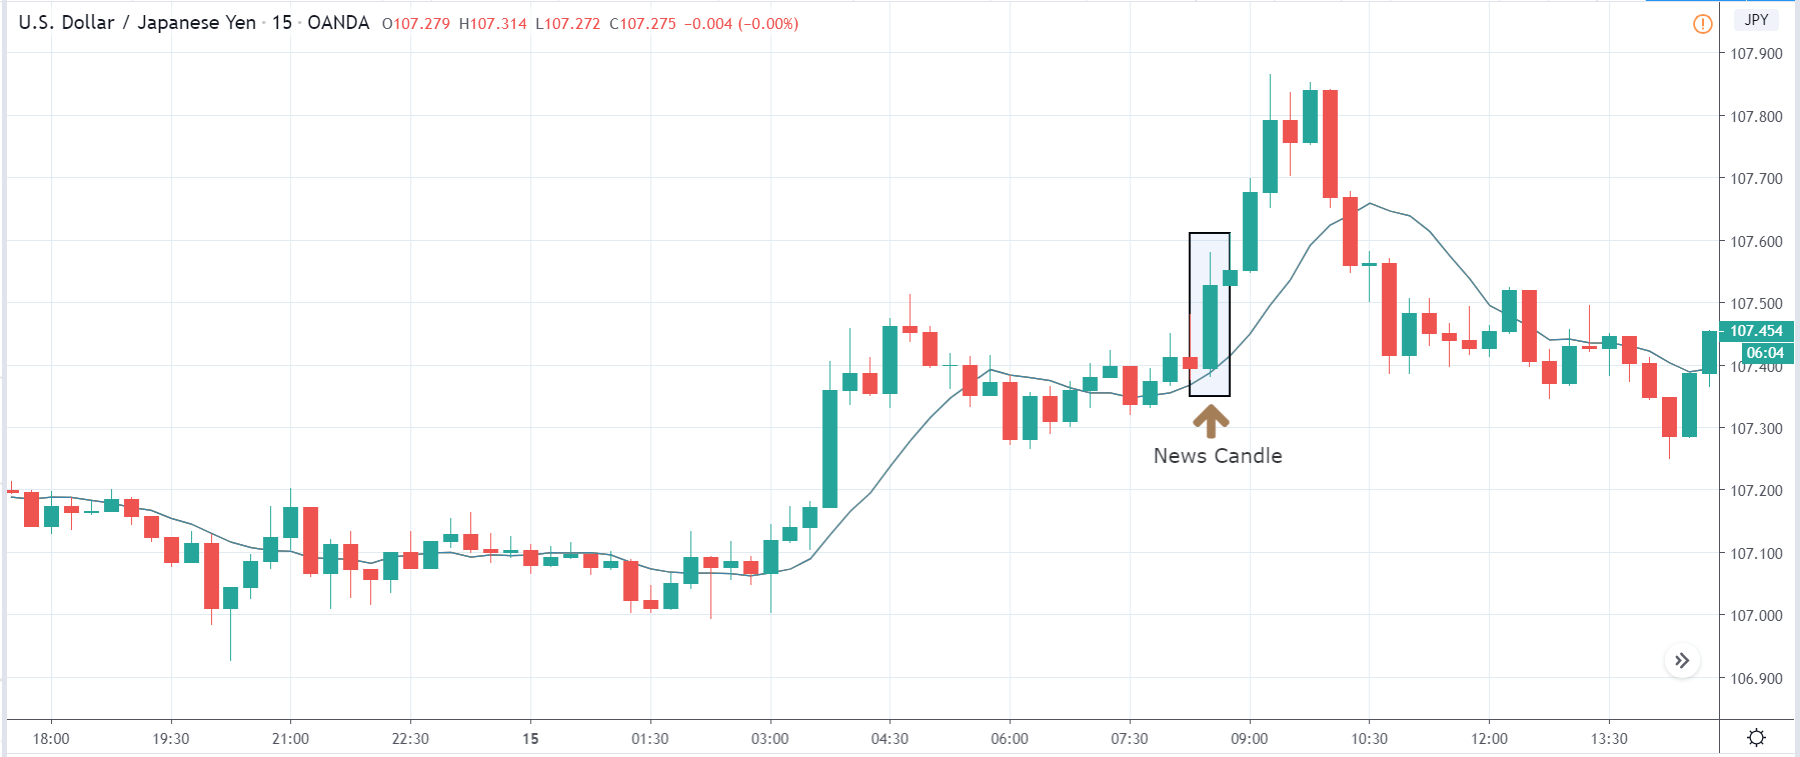
INR/JPY | Before the announcement:

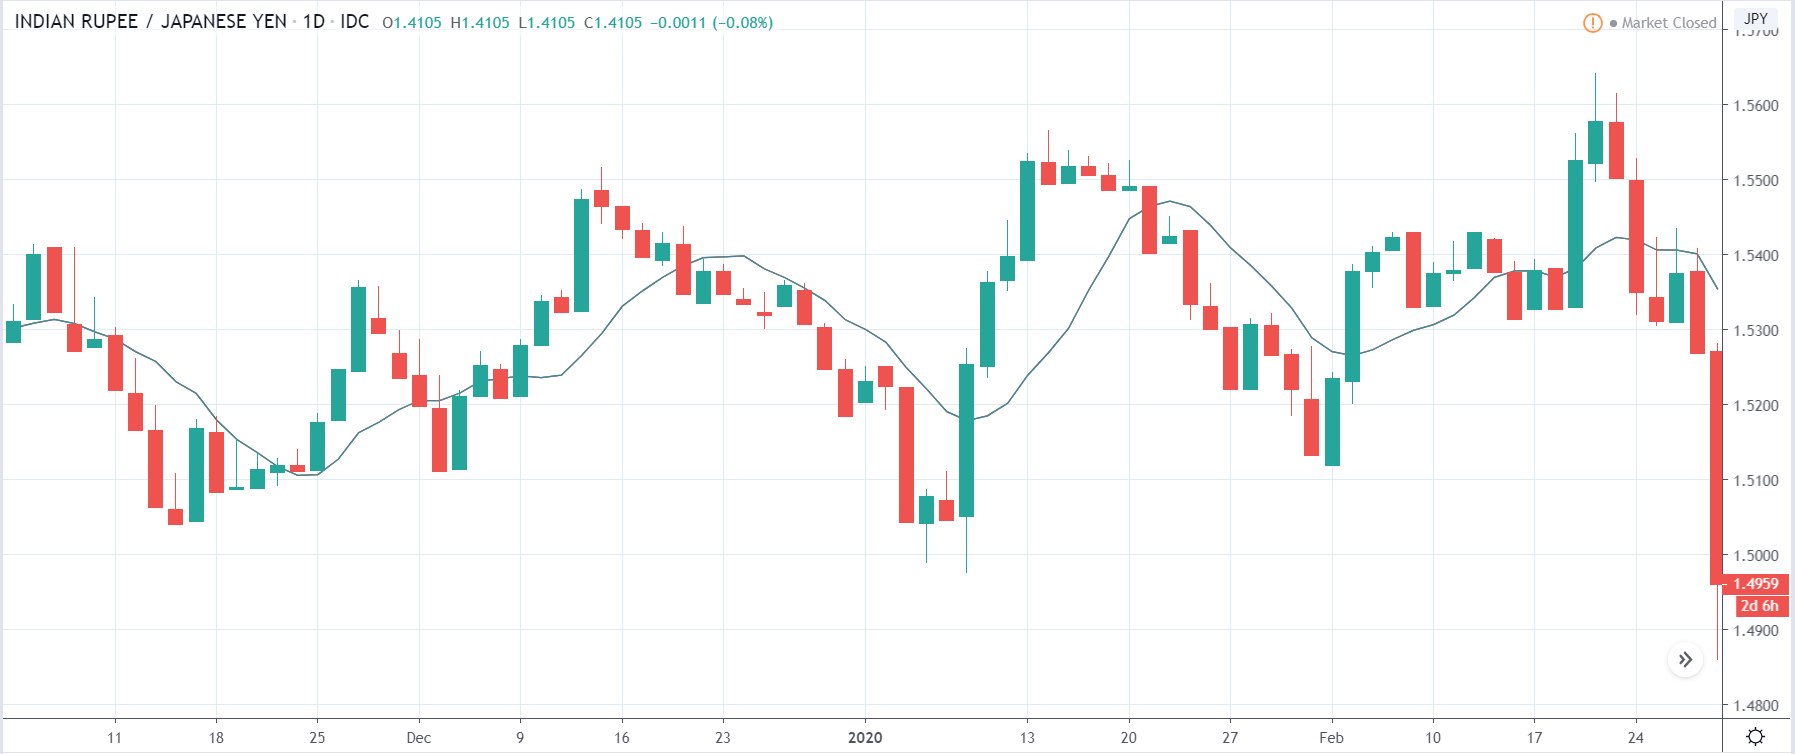
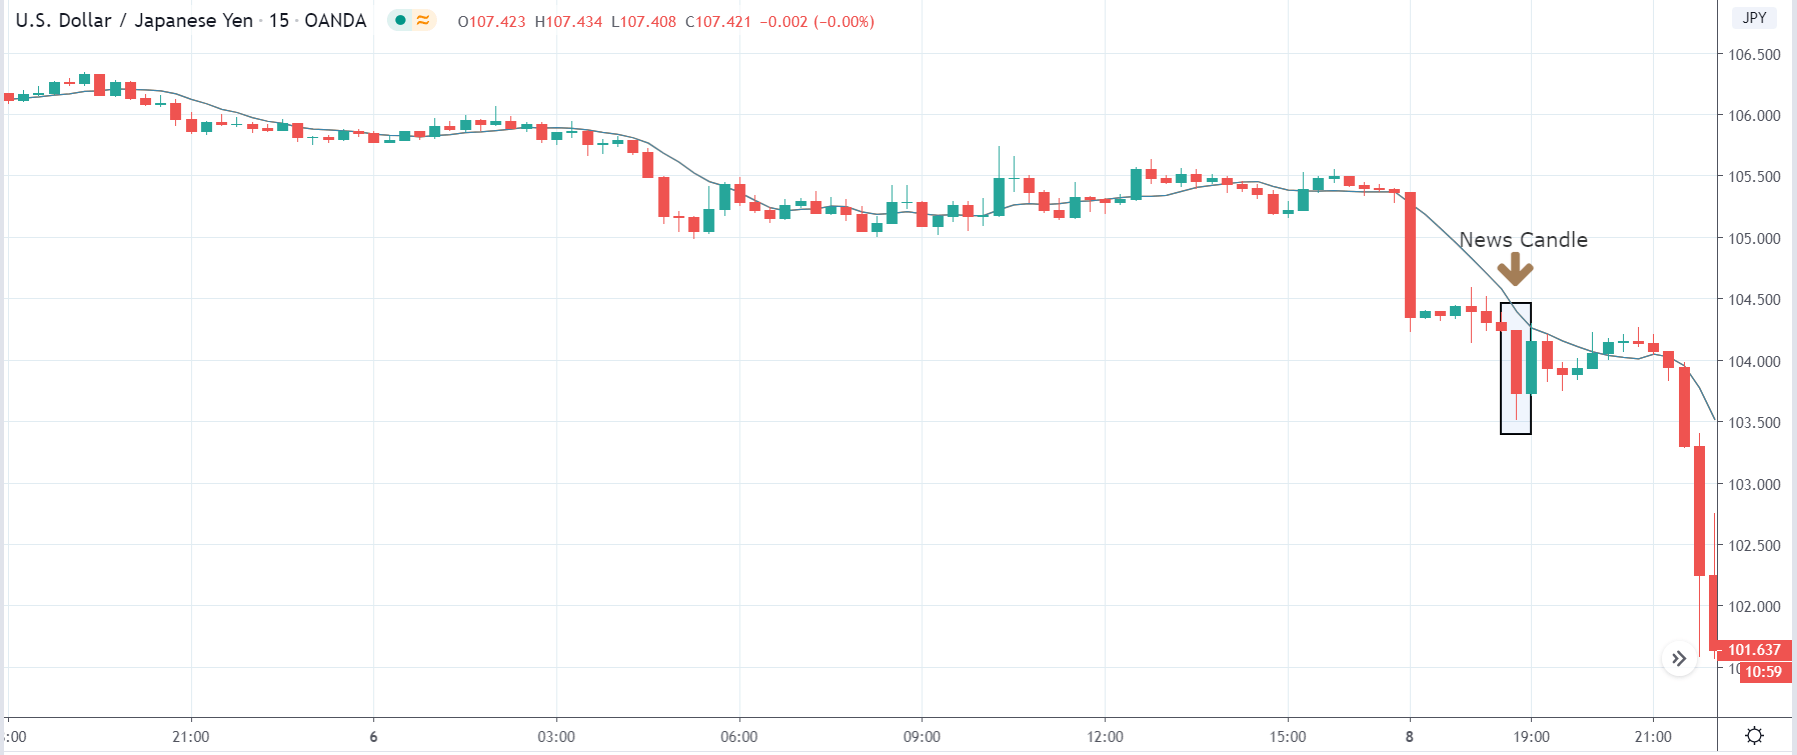
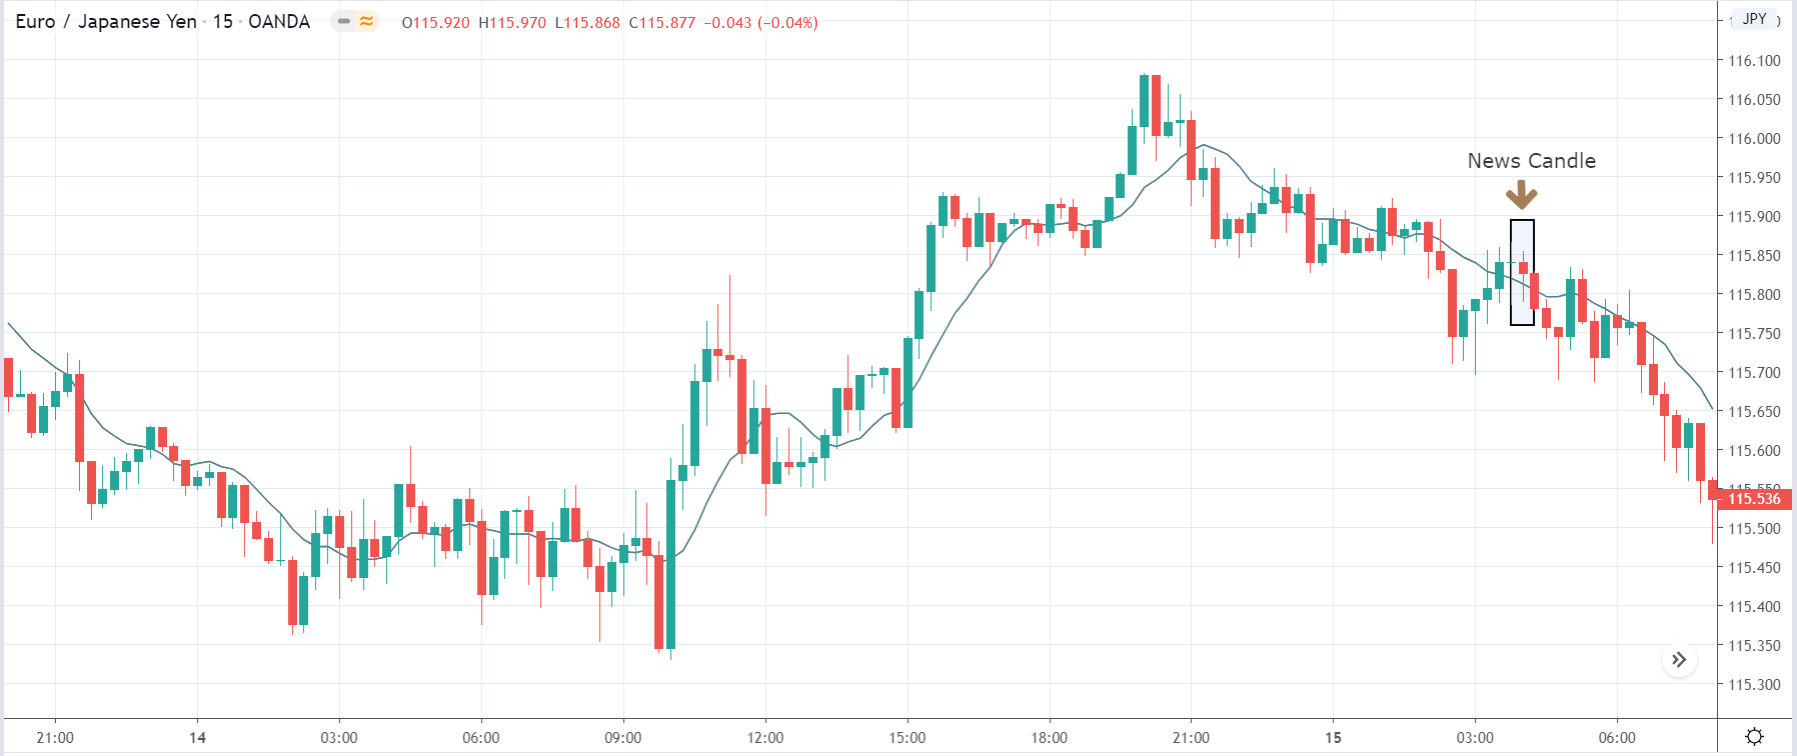
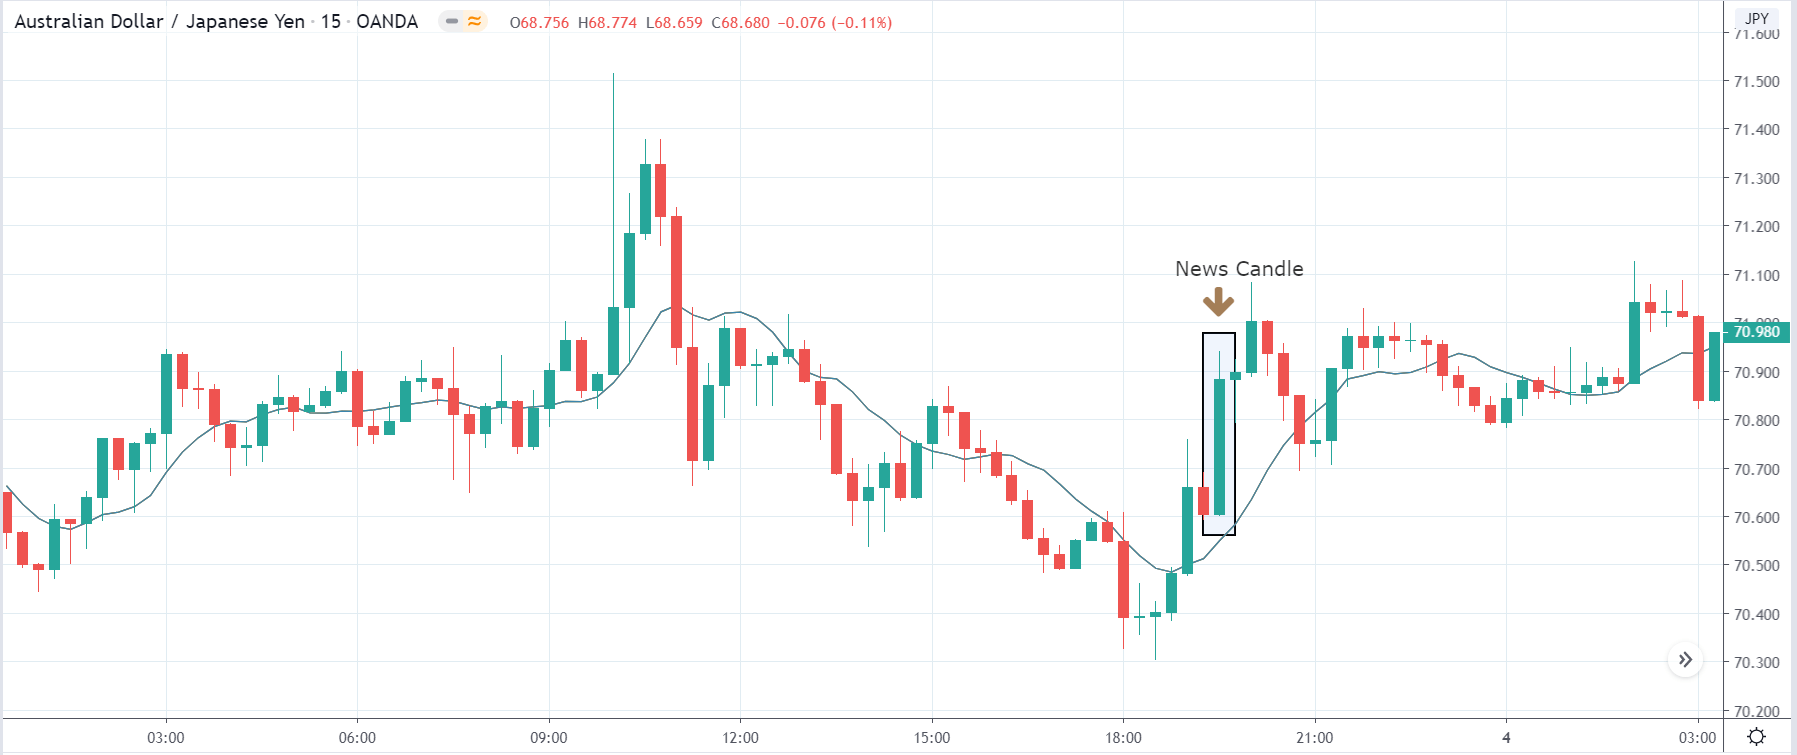
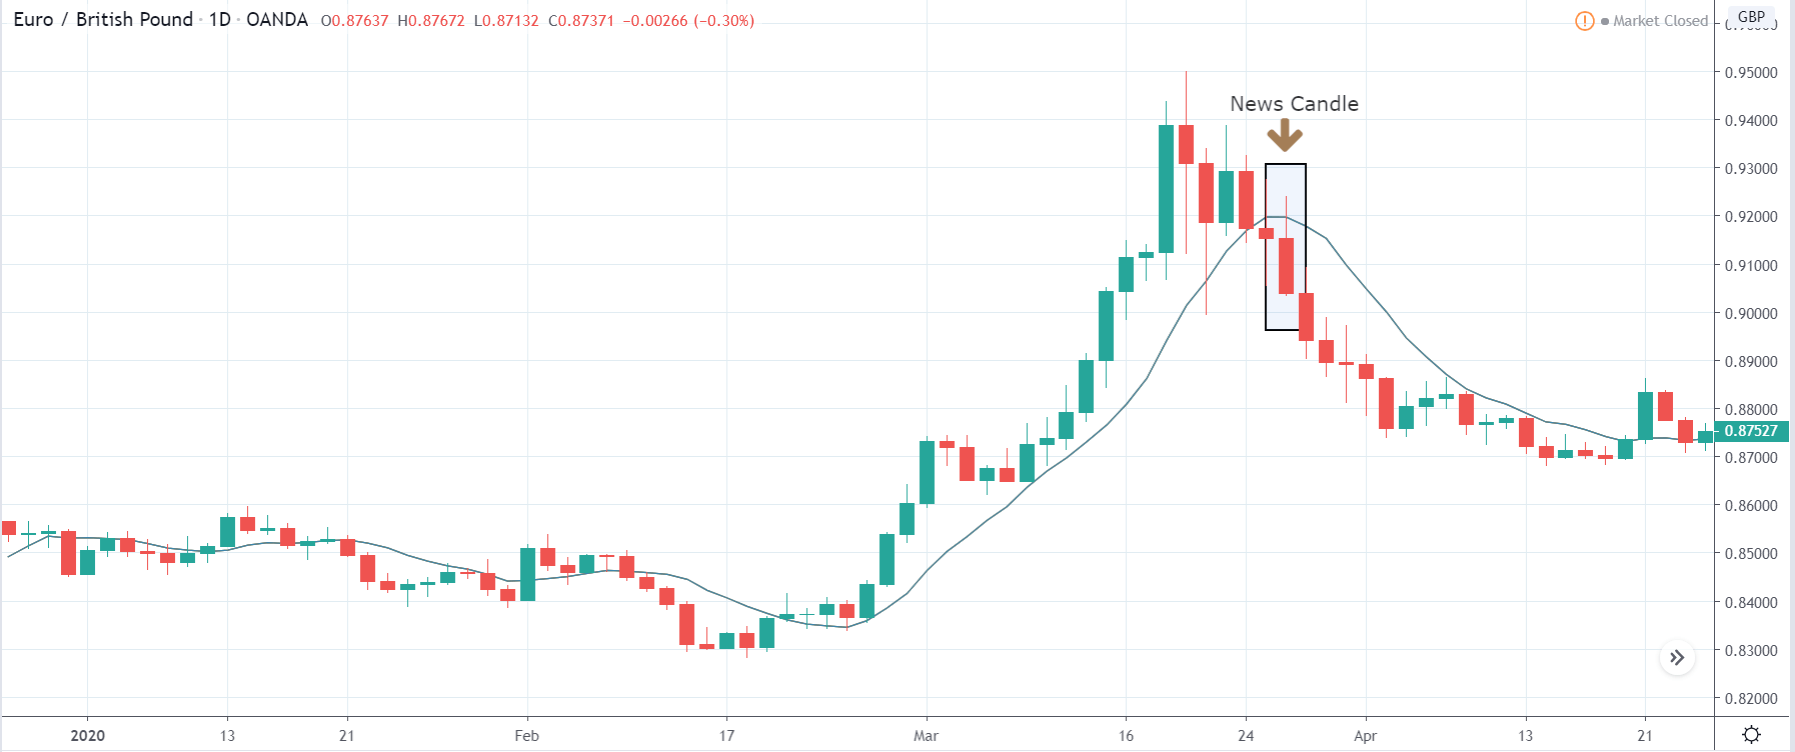
INR/JPY | After the announcement:

The above images represent the INR/JPY currency pair, where it is clear from the first image that the price was moving in a ‘range’ before the announcement, and presently it has broken the ‘support’ with a lot of strength. This is the first sign of weakness in the Indian Rupee that could probably extend. If the price remains below the moving average, a ‘sell’ trade can be initiated.

After the news announcement, the price crashes lower but immediately gets reversed, and the ‘news candle’ closes with a wick on the bottom. The initial reaction was a result of the weak GDP Growth Rate, which lead to the further weakening of the currency. Volatility increased to the downside due to the news announcement, which was on expected lines.

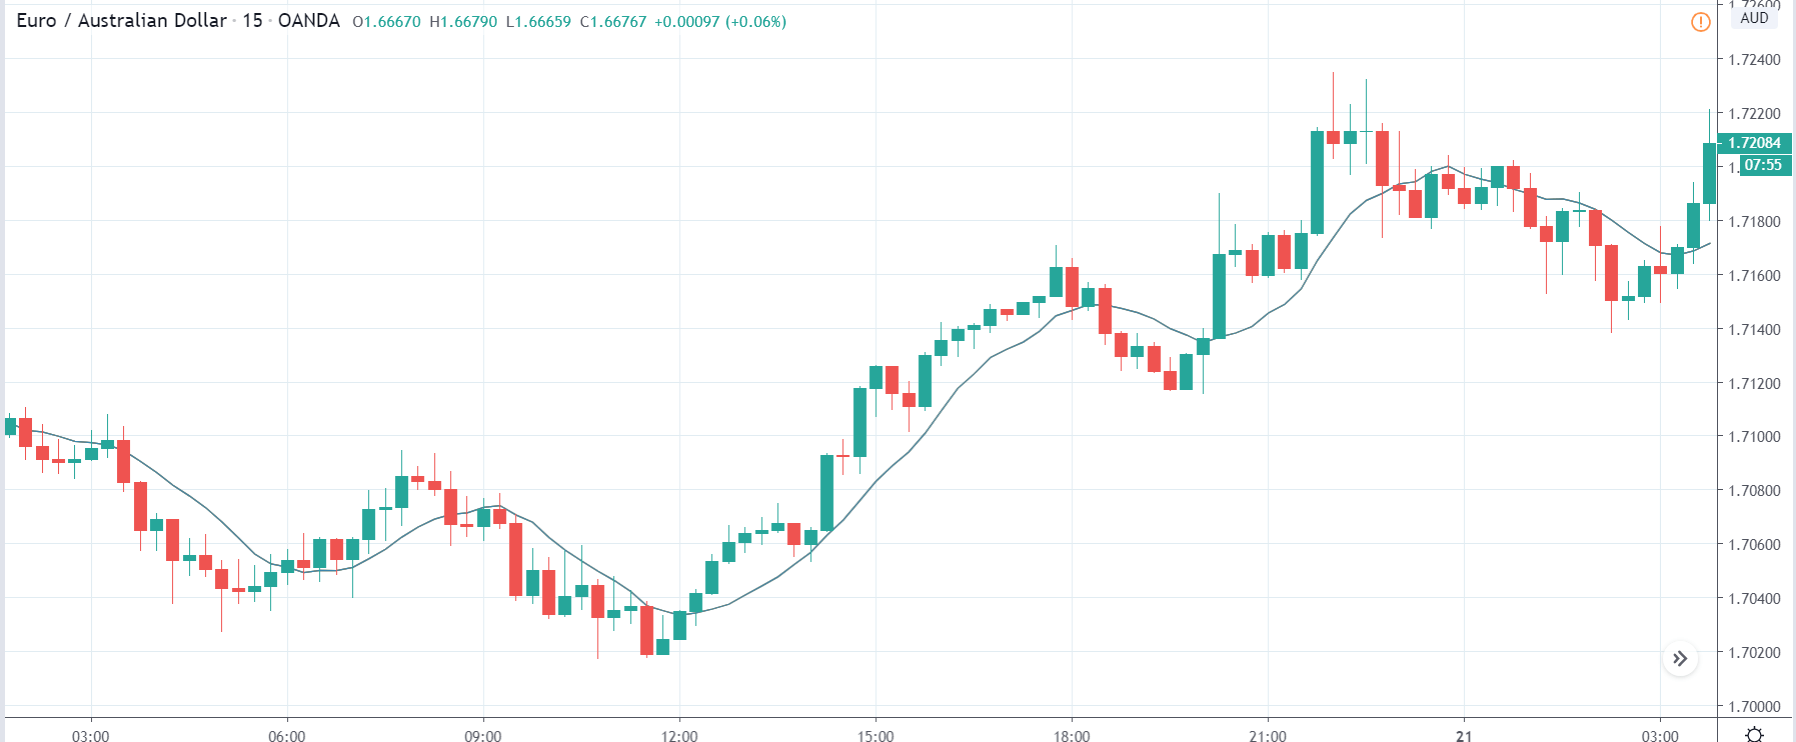
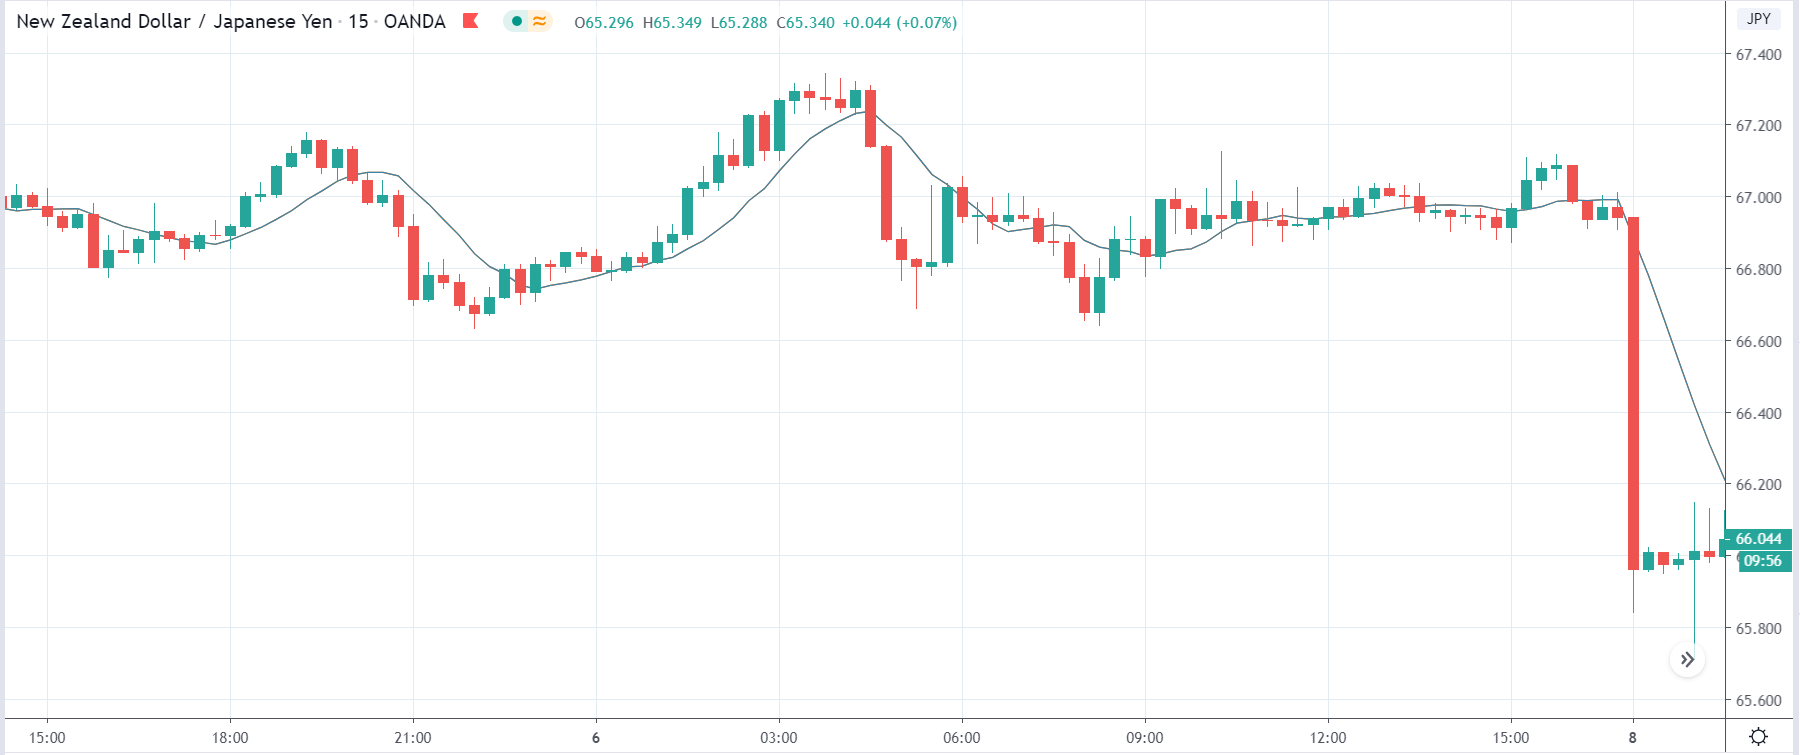
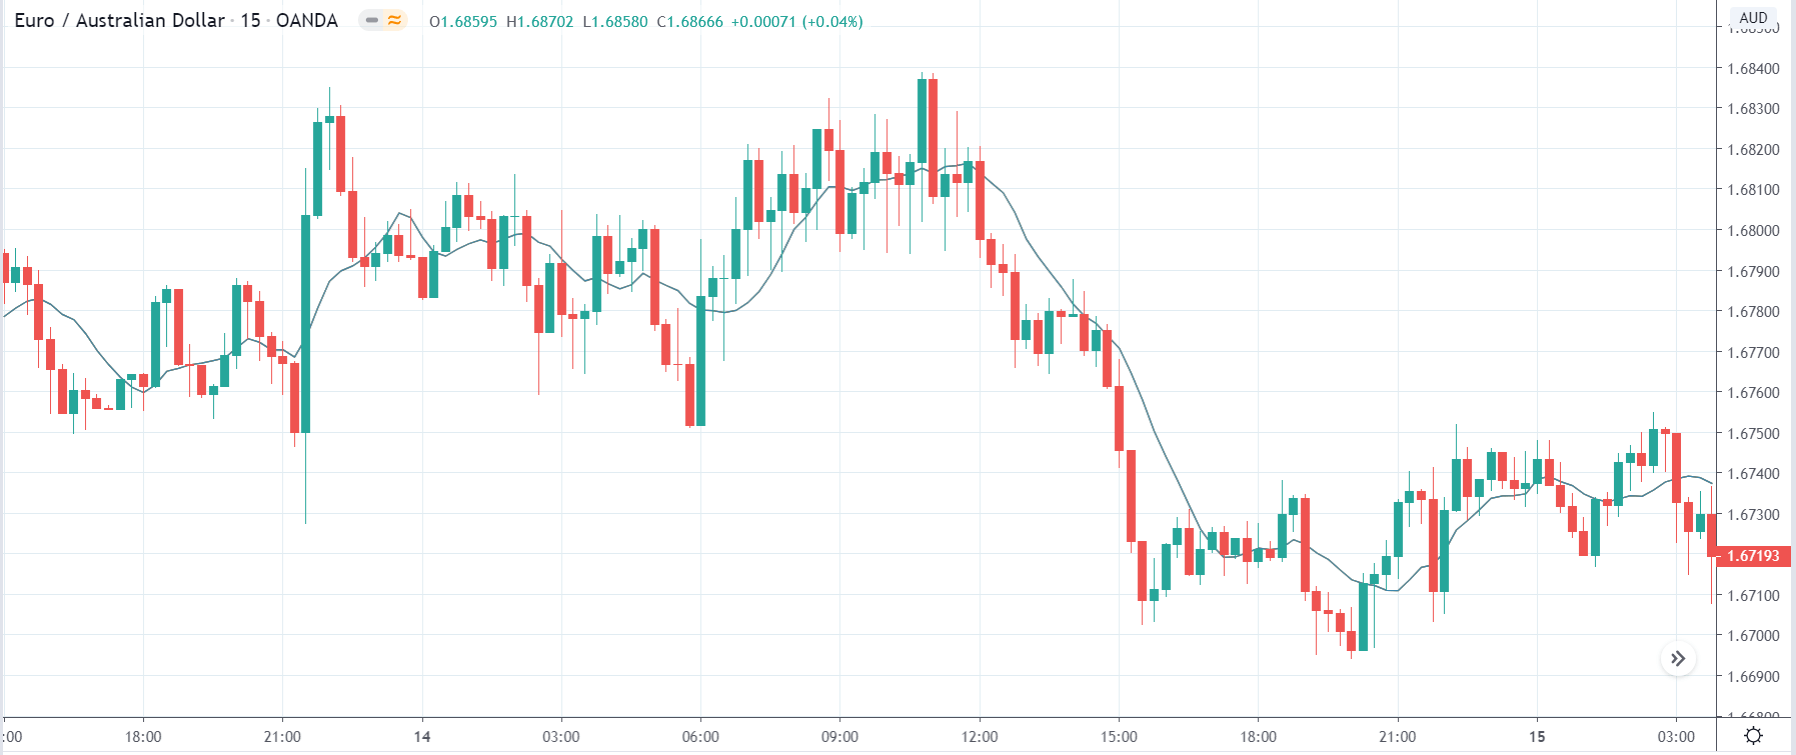
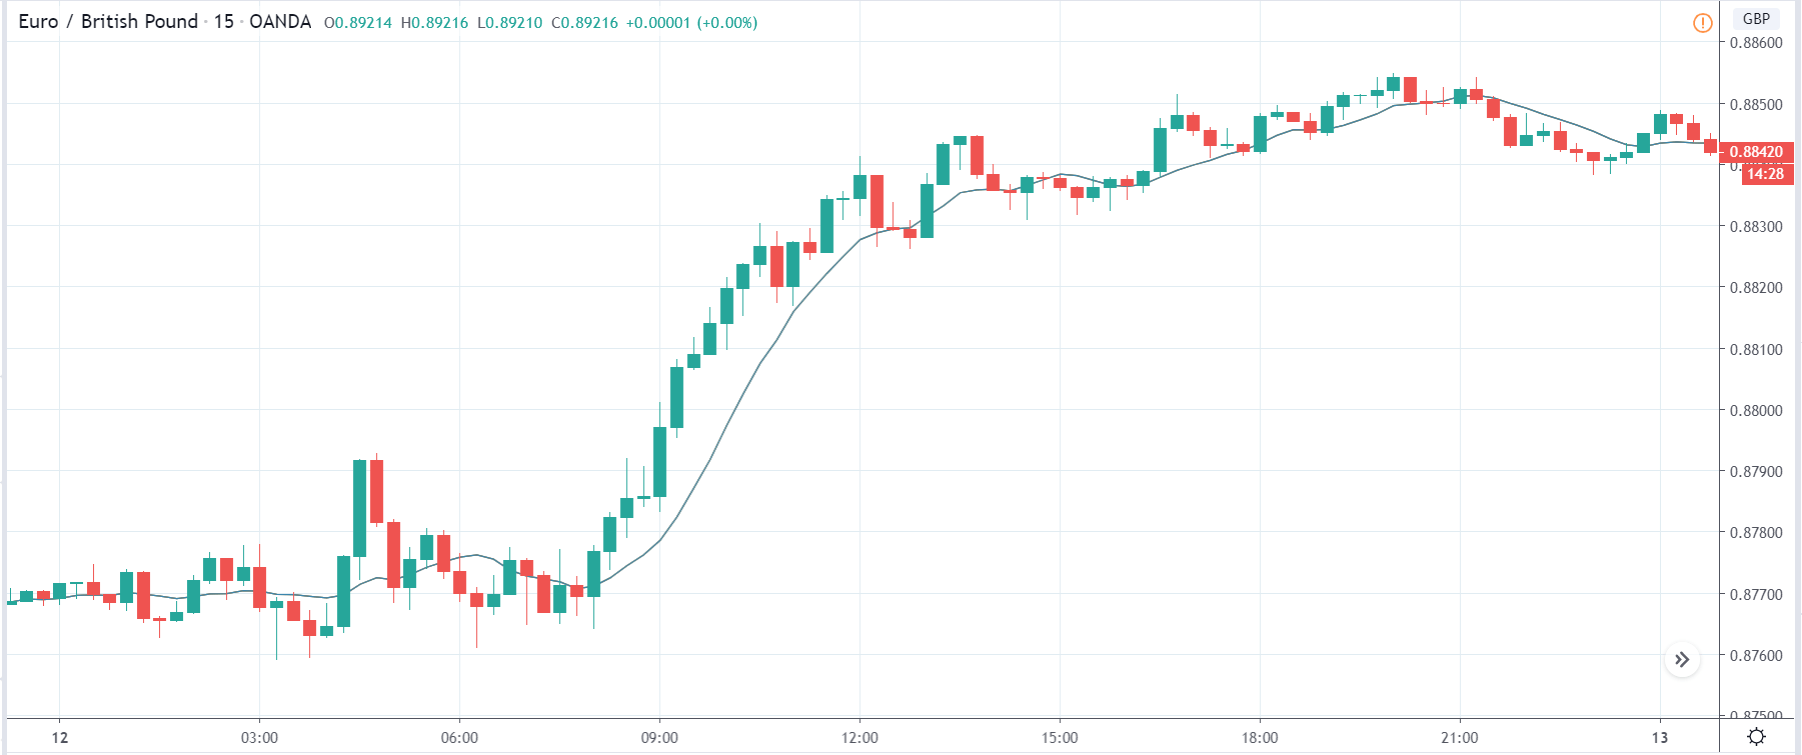
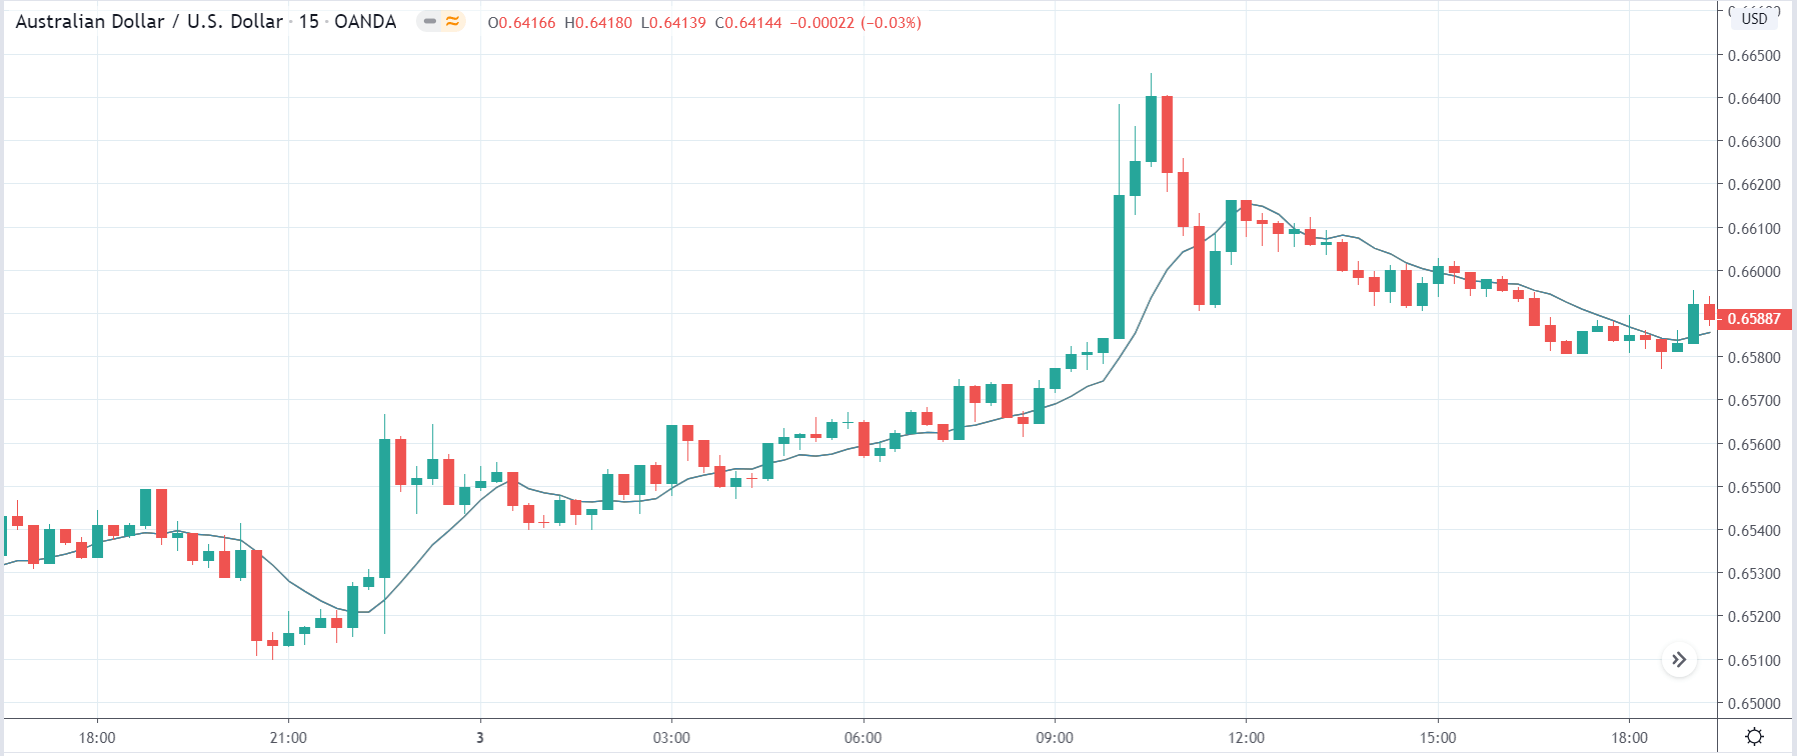
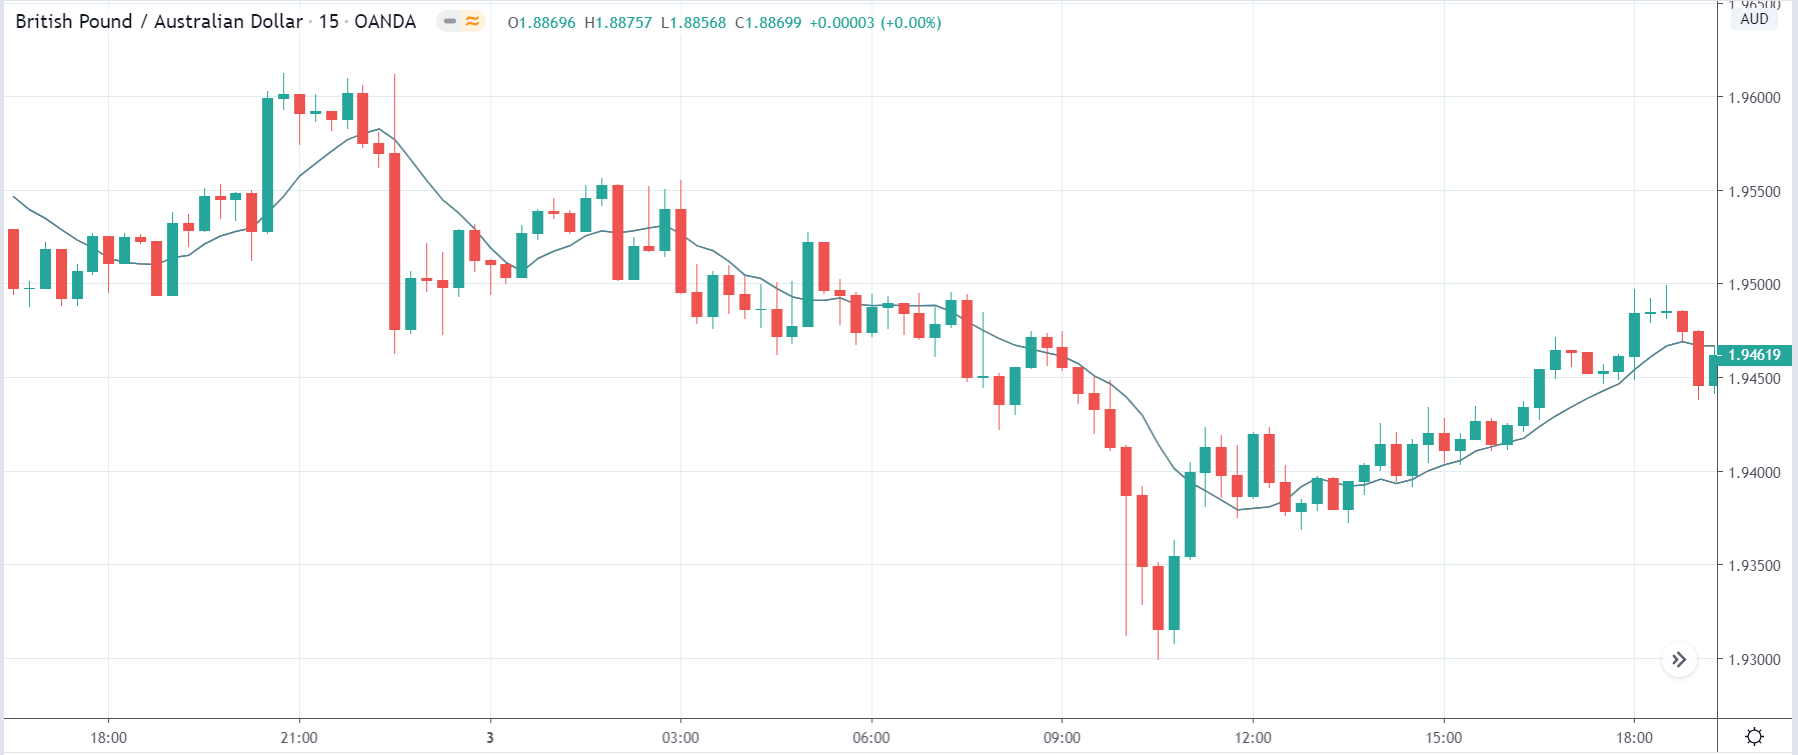
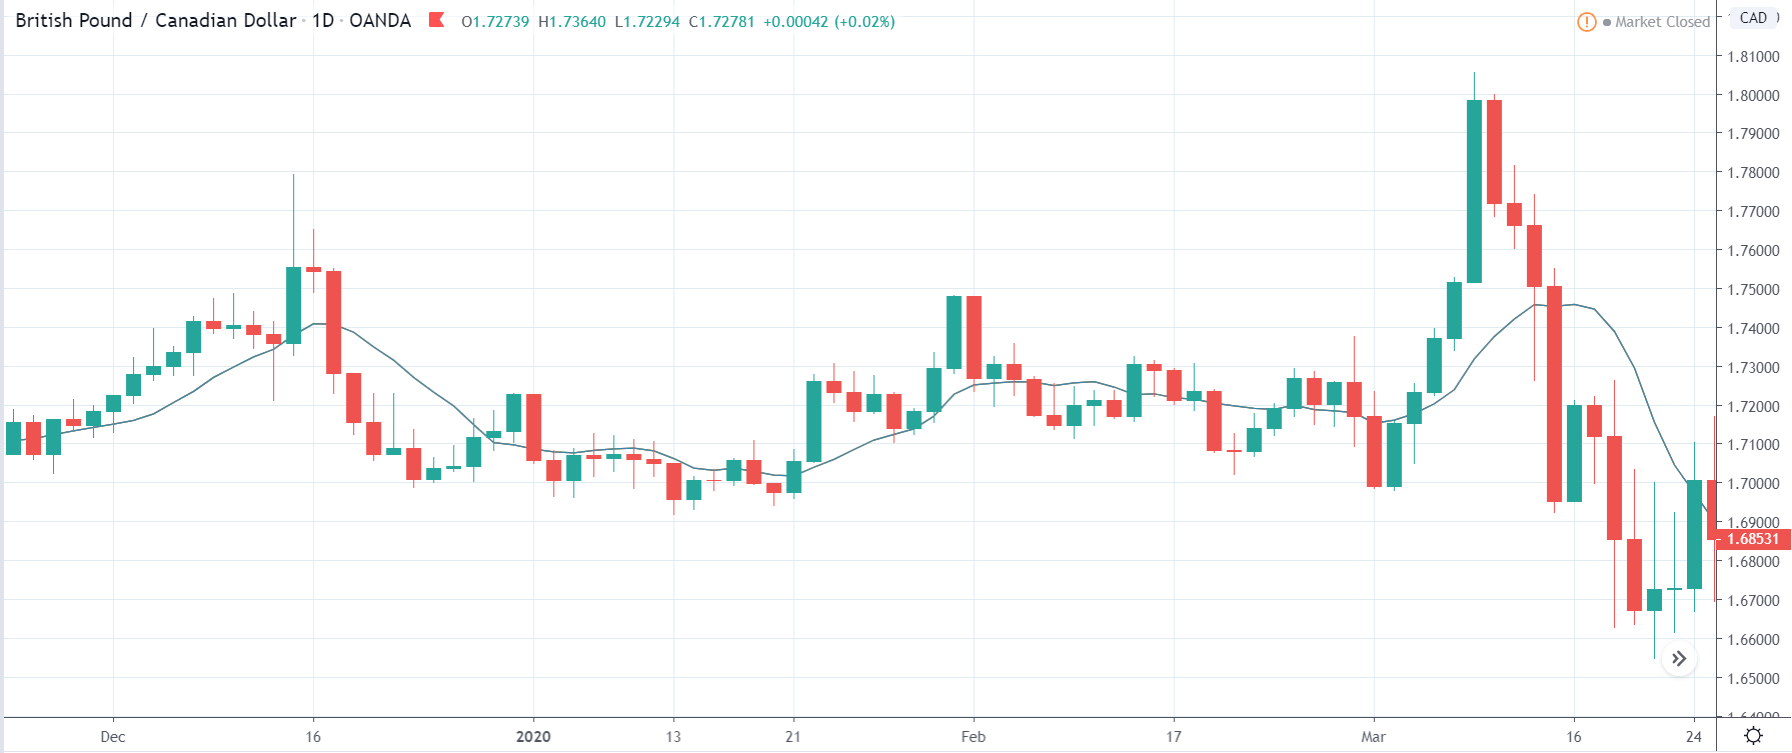
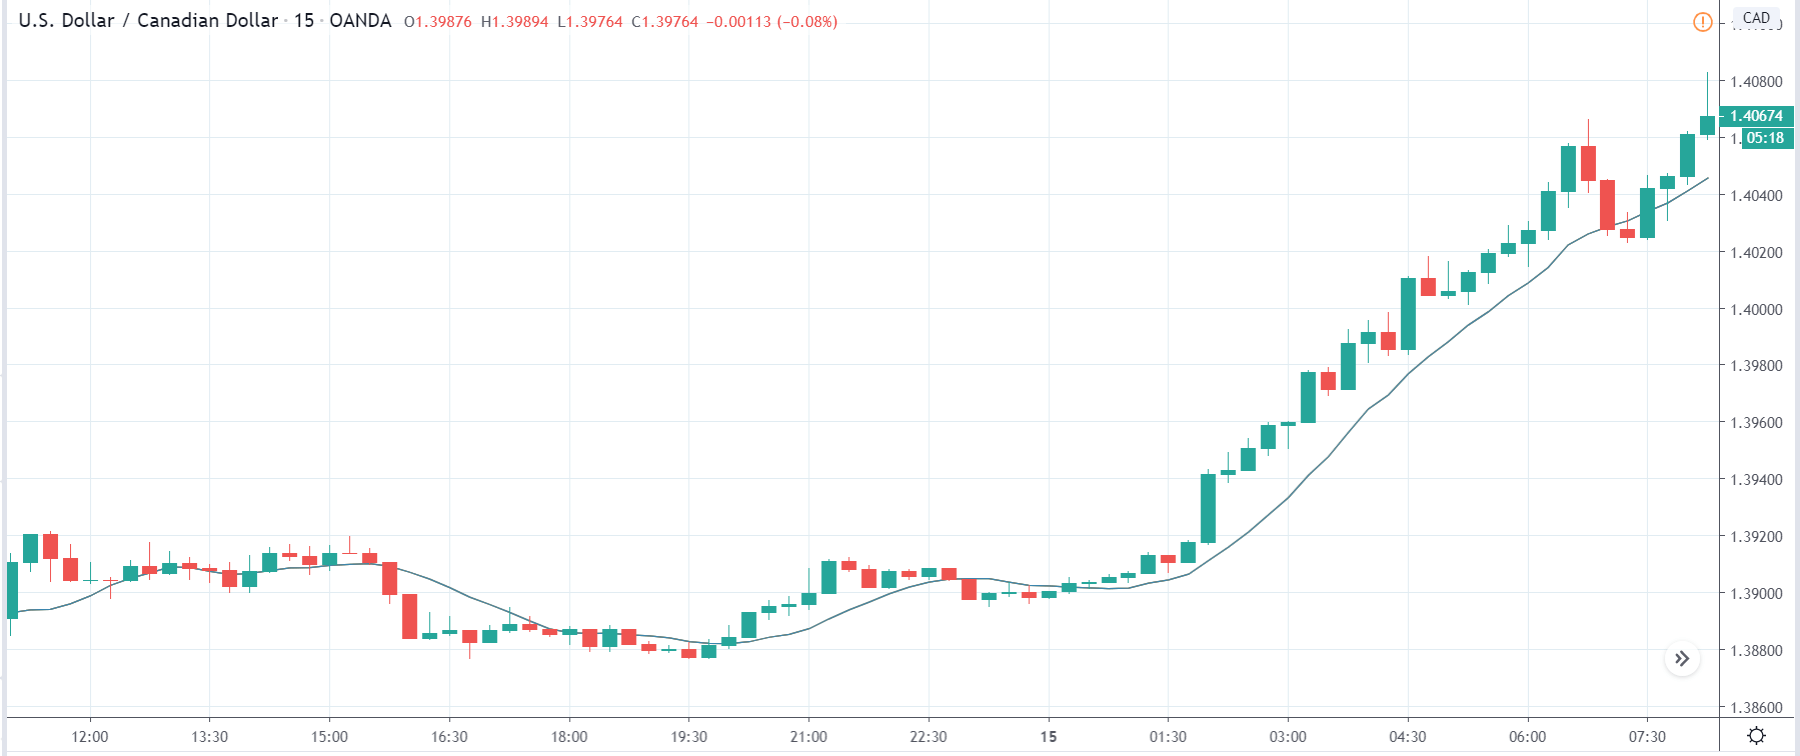
AUD/INR | Before the announcement:

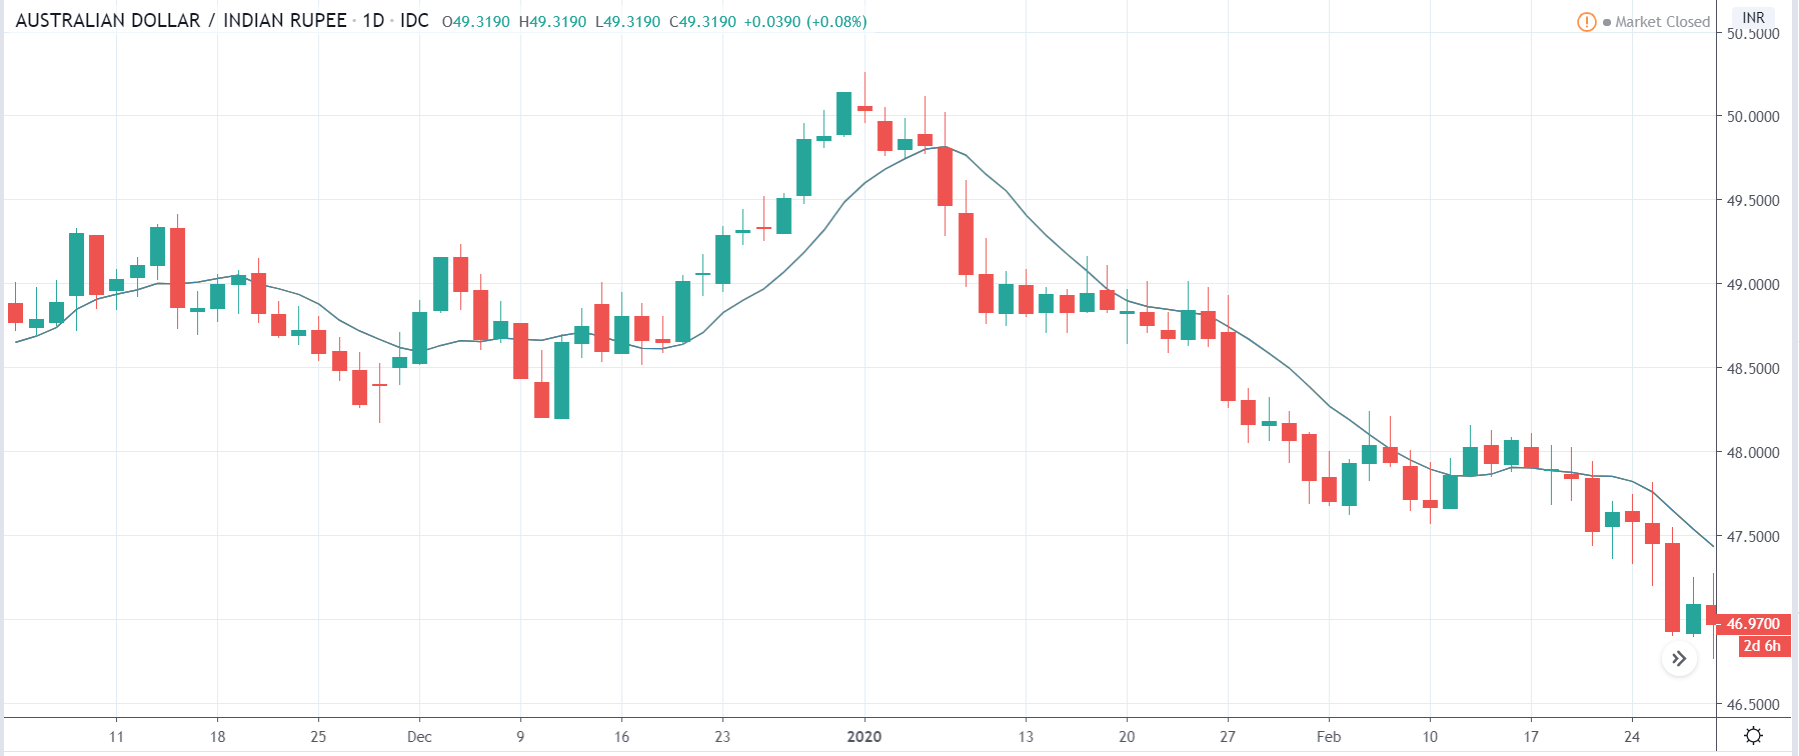
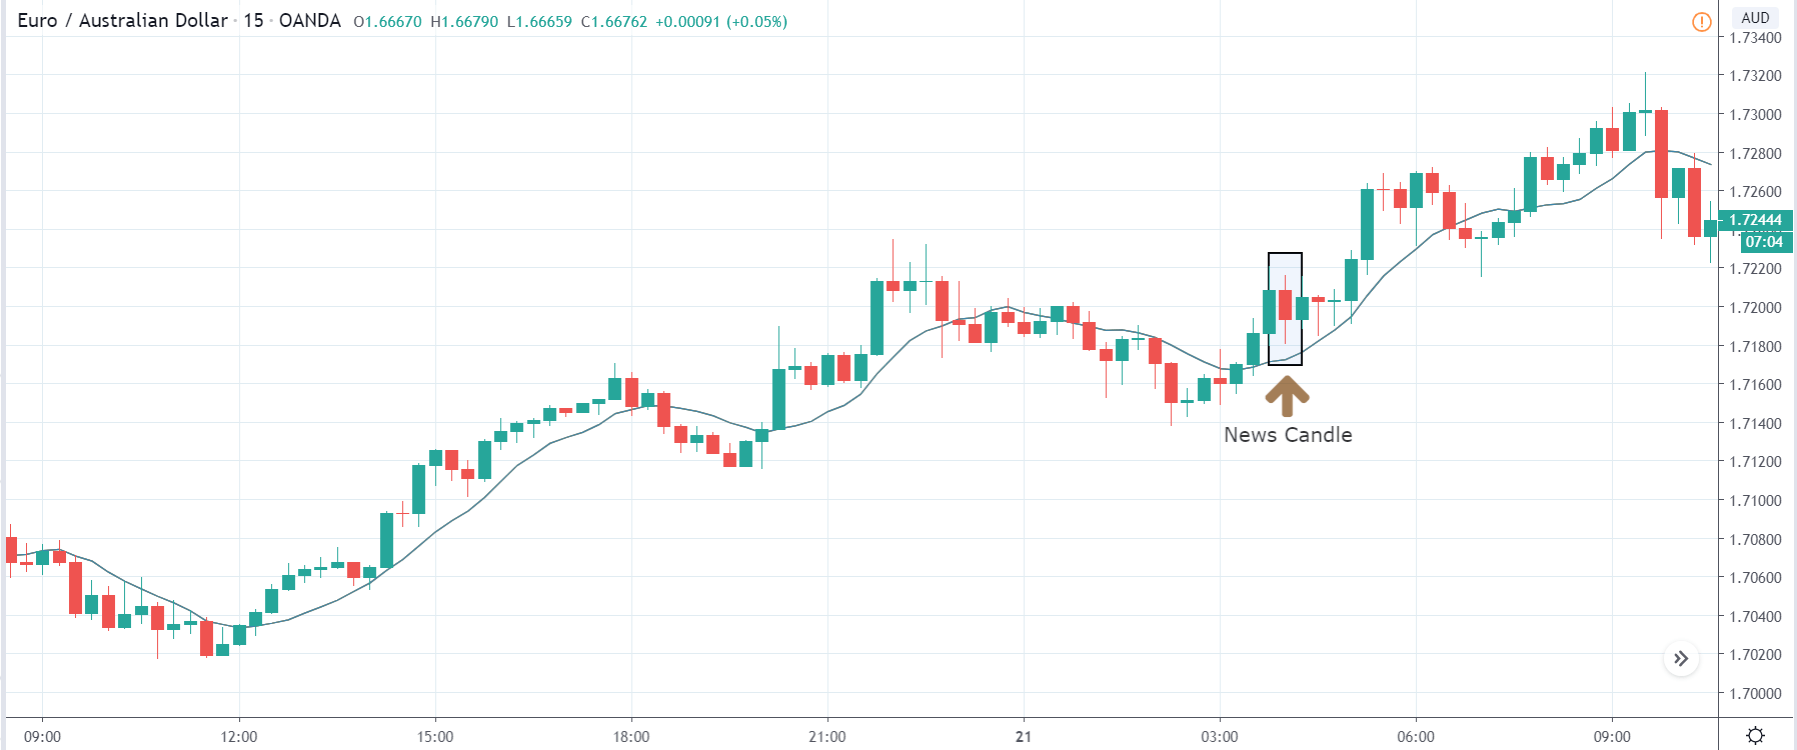
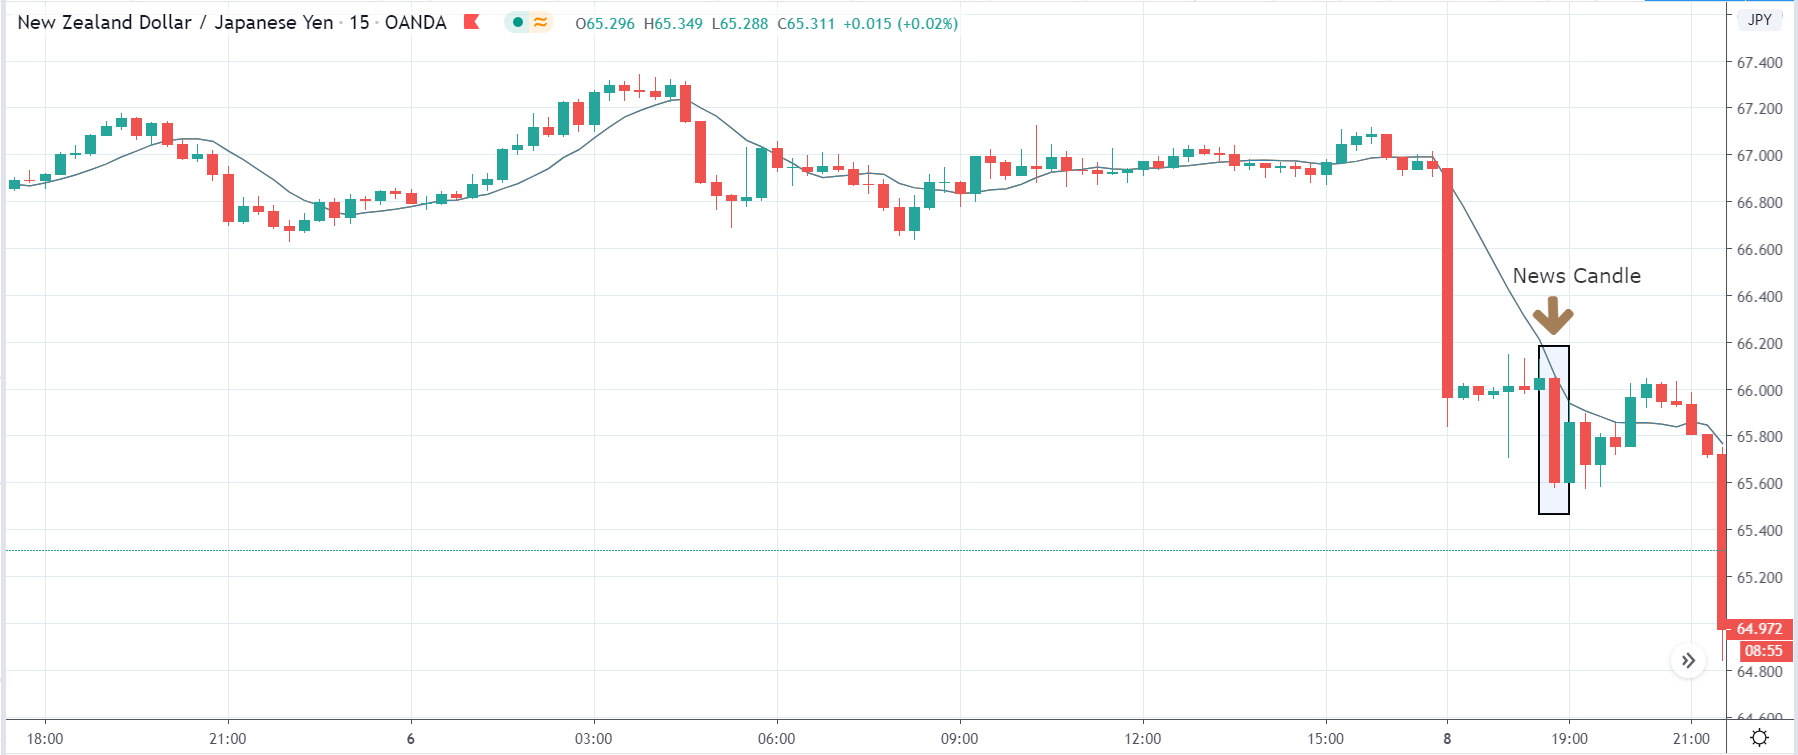
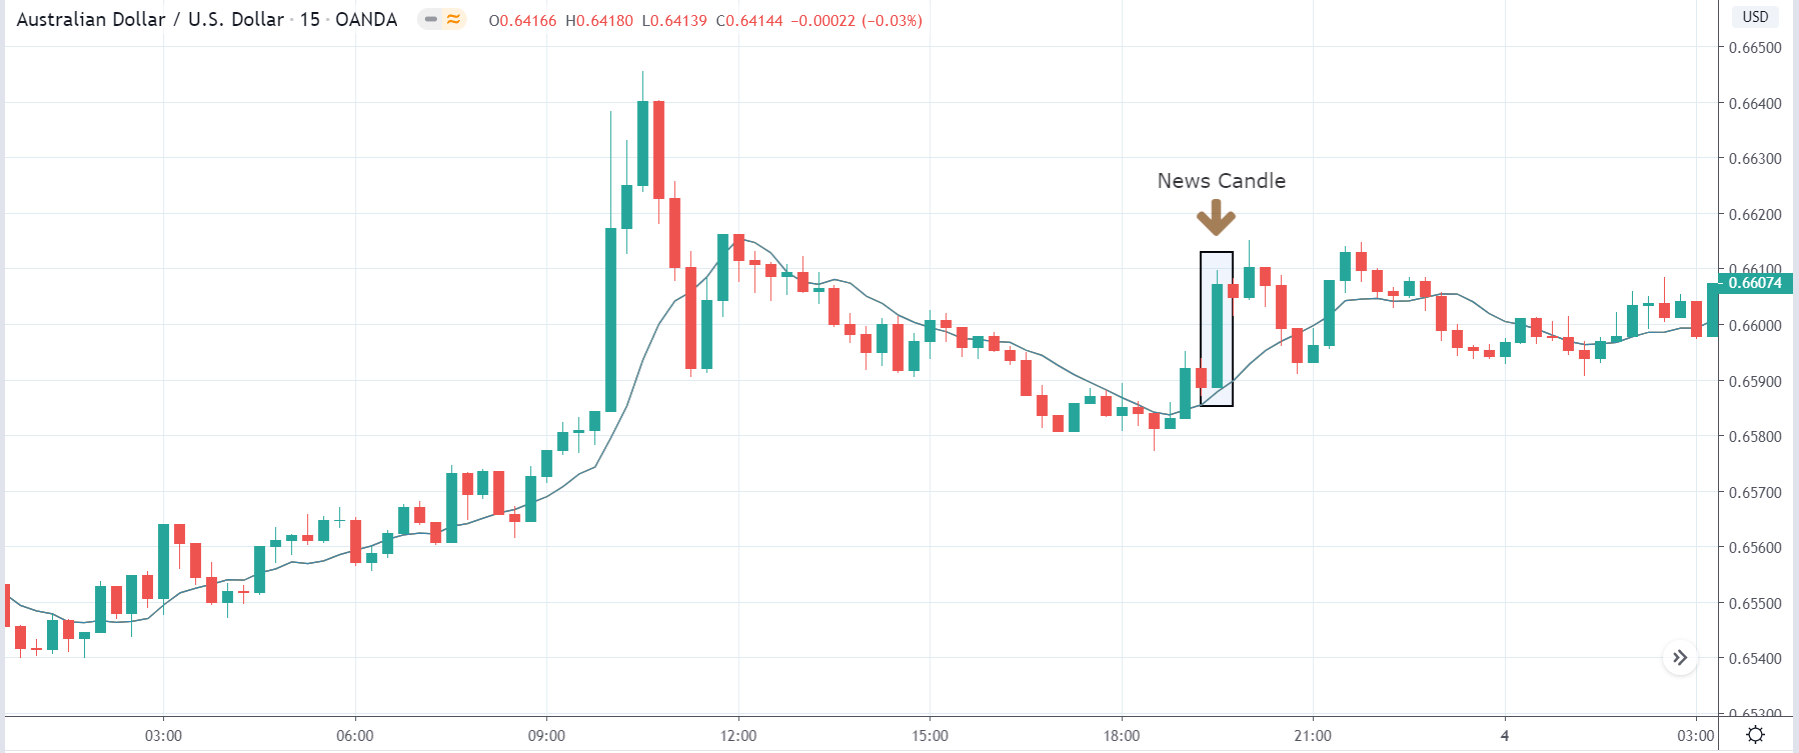
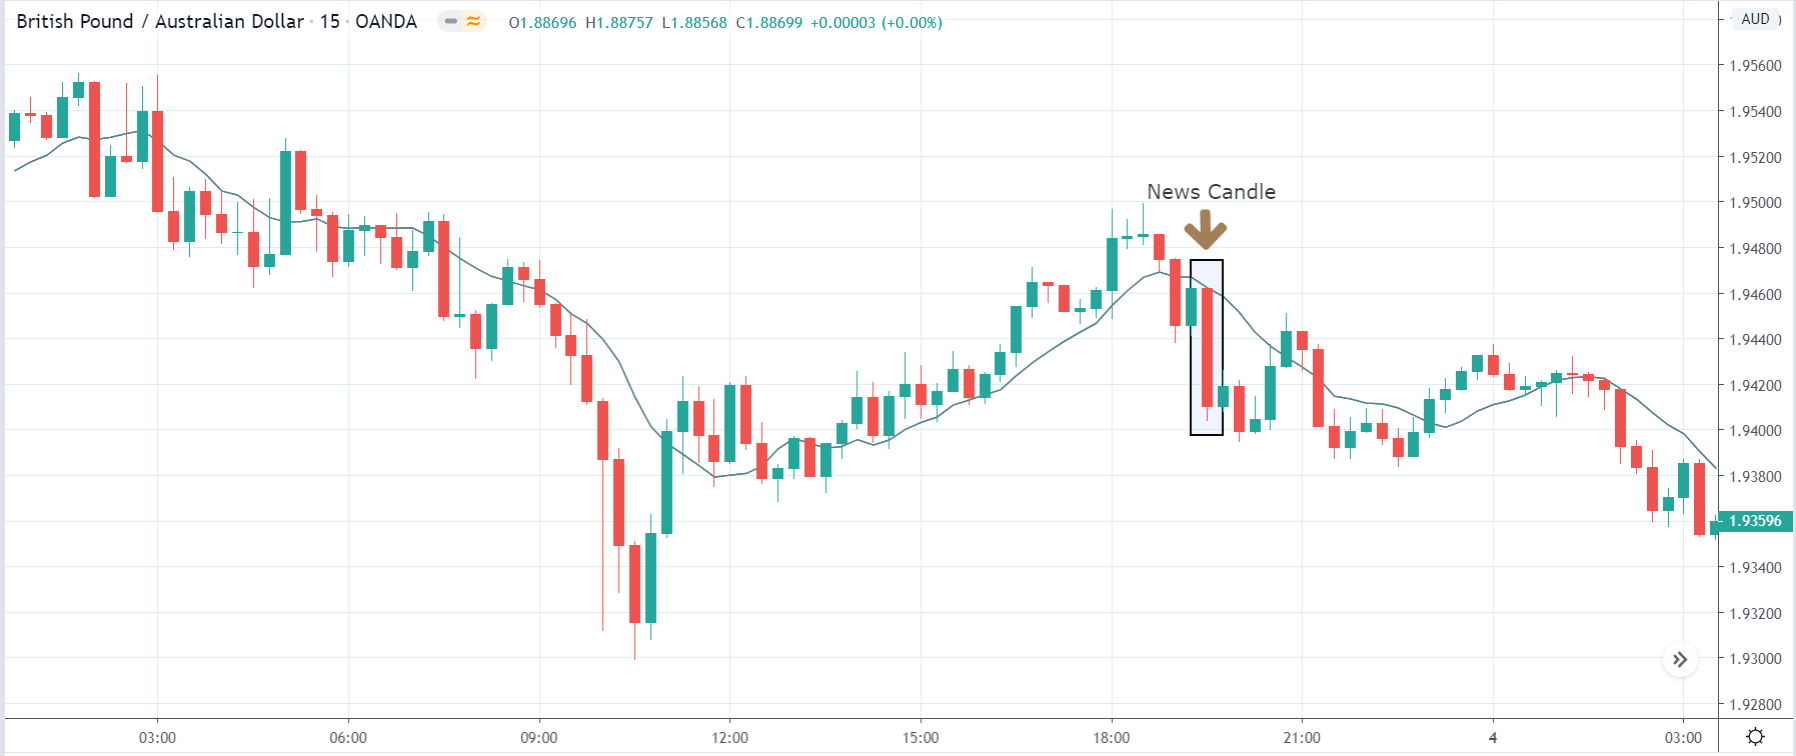
AUD/INR | After the announcement:

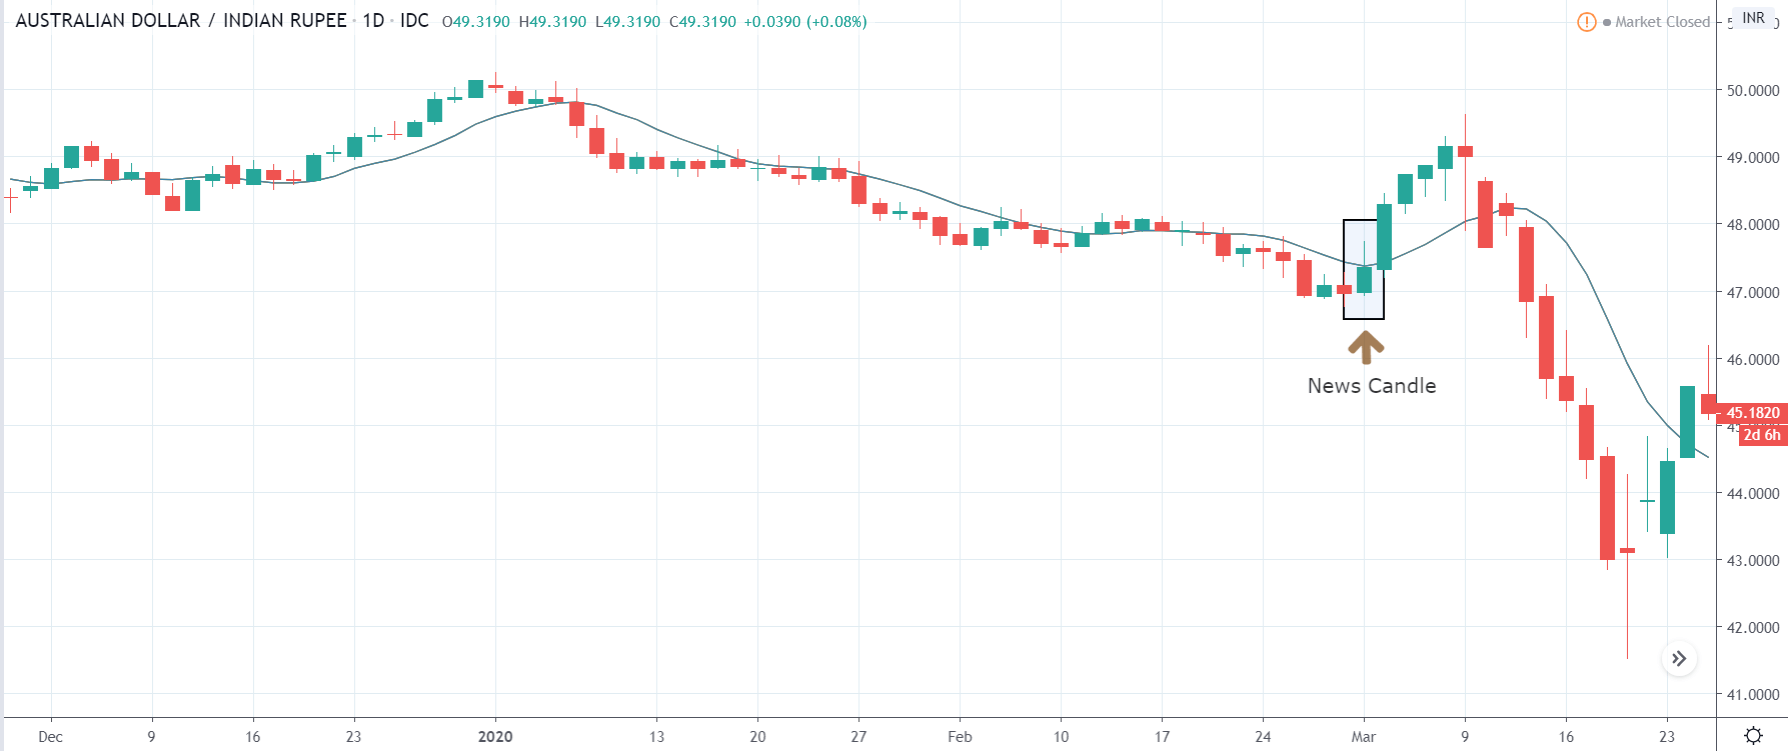
The above images are that of AUD/INR currency, where we see before the news announcement, the market is in a downtrend, and currently, the price is at its lowest point. Technically, we should be looking to sell the currency pair after a price retracement to the nearest’ resistance’ level or an appropriate Fibonacci ratio. Therefore, depending on the volatility change due to the news release, we will take a pair.

After the news announcement, the volatility emerges to the upside, and we see a sudden rise in the price that also goes above the moving average. This was a result of the weak GDP Growth Rate that made traders to ‘long’ in the currency pair by selling Indian Rupees. The news release hurts the currency where the weakness persists for a while, but later, the downtrend continues.

We hope you understood the concept of “GDP Growth Rate” and its impact on the Forex price charts after its news release. All the best. Cheers!

Categories
Crypto Market Analysis

Daily Crypto Review, July 15 – Fidelity Goes All-In On Bitcoin; BTC Difficulty At Historic Heights

The cryptocurrency market had quite a slow day and closed to no movement in the past 24 hours. Bitcoin is currently trading for $9,243, which represents an increase of 0.59% on the day. Meanwhile, Ethereum gained 0.56% on the day, while XRP gained 0.74%.

 Daily Crypto Sector Heat Map

When talking about top100 cryptocurrencies, Kava gained 20.77% on the day, making it by far the most prominent daily gainer. Syntherix Network (16.17%) and Waves (15.28%) also did great. On the other hand, Nexo has lost 12.73%, making it the most prominent daily loser. It is followed by Ravencoin’s loss of 8.11% and The Midas Touch’ loss of 6.75%.

Top 10 24-hour Performers (Click to enlarge)

Bottom 10 24-hour Performers (Click to enlarge)

Bitcoin’s dominance level decreased slightly since we last reported, with its value currently at 63%. This value represents a 0.27% difference to the downside when compared to yesterday’s value.

Daily Crypto Market Cap Chart

The cryptocurrency market capitalization increased slightly when compared to when we last reported, with the market’s current value being $272.66 billion. This value represents an increase of $1.79 billion when compared to the value it had yesterday.

_______________________________________________________________________

What happened in the past 24 hours?

_______________________________________________________________________

_______________________________________________________________________

Technical analysis

_______________________________________________________________________

Bitcoin

The largest cryptocurrency by market capitalization had quite a slow day. While its price went above the descending resistance line, the price itself did not move that much. On top of that, the move seemingly got stopped by the $9,251 resistance level (at least for now). The decreasing volume while being stopped by both moving averages and the resistance level suggests that the move reached exhaustion and that $9,251 will not be tackled (in the very near future).

BTC traders should look for a trade opportunity after the largest cryptocurrency passes $9,251.

BTC/USD 4-hour Chart

Technical factors:

  • Price is below its 50-period EMA and its 21-period EMA
  • Price right below the middle B.B. (20-period SMA)
  • RSI neutral (48.17)
  • Increased volume (Coming back to normal)

Key levels to the upside          Key levels to the downside

1: $9,251                                 1: $9,120

2: $9,580                                 2: $8,980

3: $9,735                                  3: $8,820

Ethereum

Ethereum was even less volatile than Bitcoin, with its price hardly even moving throughout the day. The second-largest cryptocurrency by market capitalization spent the day sitting on the $240 level while the bears and bulls were fighting on whether the price will consolidate below or above it. The volume dwindled as time passed, and ETH seems like it has more chance of remaining under $240. However, there is still a chance for bulls to win.

Ethereum traders should look for an opportunity after the fight for $240 ends.

ETH/USD 4-hour Chart

Technical Factors:

  • Price above the 50-period EMA and below the 21-period EMA
  • Price below the middle B.B. (20-period SMA)
  • RSI neutral (48.14)
  • Increased volume (Coming back to normal)

Key levels to the upside          Key levels to the downside

1: $240                                    1: $228

2: $251.4                                 2: $225.4

3: $260                                     3: $218

Ripple

The third-largest cryptocurrency by market cap hardly moved at all after the price drop of July 13, which brought the price below the $0.2 threshold yet again. XRP is hovering below the $0.2 level for two days now, without any possibility of breaking it yet.

XRP traders can look for an opportunity to trade when the volume increases, and the trend becomes clear enough, as the low volume and volatility are certainly not ideal for trading at the moment.

XRP/USD 4-hour Chart

Technical factors:

  • XRP in a mid-term descending trend (though it broke the trend in the short-term)
  • XRP lacks strong support levels below $0.178
  • Price above 21-period and below the 50-period EMA
  • Price right under the middle B.B. (20-period SMA)
  • RSI is neutral (46.8)
  • Volume lower than average

Key levels to the upside          Key levels to the downside

1: $0.205                                  1: $0.2

2: $0.214                                  2: $0.19

3: $0.227                                 3:$0.178


Categories
Forex Assets

Analyzing The ‘CHF/AED’ Forex Exotic Pair

Introduction

CHF/AED is the short form for the Swiss Franc against the United Arab Emirates Dirham. It is considered an exotic currency pair. Currencies are always traded in pairs in the Forex market. The main currency in the pair is considered the base currency, while the sequential one is the quote currency.

Understanding CHF/AED

The market value of CHF/AED determines the value of AED required to buy one Swiss Franc. It is priced as 1 CHF per X AED. Hence, if the market price of this pair is 3.8835, these many United Arab Emirates Dirham units are necessary to buy one CHF.

Spread

The spread is the distinction between the ask-bid price. Mostly, these two prices are set by the stockbrokers. The gap between the pip values is through which brokers generate revenue. Below are the ECN & STP Spread values of CHF/AED pair.

ECN: 19 pips | STP: 24 pips

Fees

The fee is the minimum commission you pay to the broker on every single spot you open. There is no fee to be paid on STP accounts, but a few additional pips on ECN accounts.

Slippage

Slippage is the distinction between the price at which the trader implemented the trade and the original price he got from the broker – this changes based on the volatility of the market and the broker’s implementation speed.

Trading Range in CHF/AED

The trading range table will help you determine the amount of money that you will win or lose in every timeframe. This table signifies the minimum, average, and maximum pip movement in a currency pair.

Procedure to assess Pip Ranges

  1. Add the ATR indicator to your chart
  2. Set the period to 1
  3. Add a 200-period SMA to this indicator
  4. Shrink the chart so you can assess a large time period
  5. Select your desired timeframe
  6. Measure the floor level and set this value as the min
  7. Measure the level of the 200-period SMA and set this as the average
  8. Measure the peak levels and set this as Max.

CHF/AED Cost as a Percent of the Trading Range

The price of the trade alters based on the volatility of the market. Hence, the total cost comprises slippage and spreads, excluding from the trading fee. Below is the analysis of the cost difference in terms of percentages.

ECN Model Account

Spread = 19 | Slippage = 5 |Trading fee = 8

Total cost = Slippage + Spread + Trading Fee = 5 + 19 + 8 = 32 

STP Model Account

Spread = 24 | Slippage = 5 | Trading fee = 0

Total cost = Slippage + Spread + Trading Fee = 5 + 24 + 0 = 29

Trading the CHF/AED

The CHF/AED is not a very volatile pair. For example, the average pip movement on the 1H timeframe is only 42 pips. If the volatility is more significant, then the cost of the trade is low. Nevertheless, it involves a higher risk to trade highly volatile markets.

Also, the higher/lesser the proportions, the greater/smaller are the costs on the trade. We can then determine that the costs are higher for low volatile markets and high for highly volatile markets.

To reduce your risk, it is recommended to trade when the volatility is around the minimum values. The volatility here is low, and the costs are slightly high, corresponding to the average and the maximum values. But, if the priority is towards reducing costs, you could trade when the volatility of the market is near the maximum values.

Benefits on Limit orders

For orders that are implemented as market orders, there is slippage applied to the trade. But, with limit orders, there is no slippage valid. Only the spread and the trading fees will be accounted for estimating the total costs. Therefore, this will bring down the cost noticeably.

STP Model Account (Limit Orders)

Spread = 24 | Slippage = 0 | Trading fee = 0

Total cost = Slippage + Spread + Trading Fee = 0 + 24 + 0 = 24

Categories
Forex Videos

Forex! What’s Driving Cable & Where You Should Be Trading!

What’s Driving Cable?

Welcome to the Forex Academy educational video in this session we will be looking at the British pound and discuss what might be driving it within the realms of the pound vs. the United States dollar also known as Cable.


What is driving Cable? 

After a bullish rally at the end of June, where price action had consolidated due to end of the month, end of quarter rebalancing, the Great British pound found some buying pressure at the beginning of July and where price action in Cable largely consolidated for a few days due to the fact that Britain and the European Union had completed a recent round of trade negotiations, which had fallen largely flat and all come to nothing.

However, at position A, the European Union chief Negotiator Michael Barnier announced he would be having dinner with the UK’s trade negotiator, David Frost, at Number 10 Downing Street. That evening. No doubt, they would be eating fish and chatting about fisheries, which is one of the biggest stalling points between in the UK and the EU you being able to reach an agreement on a future trading deal.

However, the announcement of the meeting gave a lift to the pound, causing Cable to make fresh highs, just below the key 1.26 level at position B.


The morning after the night before induced some negative tones from Barnier who declared there had been no major developments and cable consolidated and pulled back to position C, which was just before the Chancellor of the Exchequer, Rishi Sunak released an emergency budget. This was largely well-received by the market because it will help people retain their jobs as the UK tries to recover from the COVID pandemic, especially the younger generation of the United Kingdom. Job losses would be limited UK Gov offering a further olive branch in the form of £1,000 payments to companies in order to retain staff after the end of the furlough arrangement.

After a strong move above the 1.26 level sentiment shifted to a downbeat United States dollar which began to reverse some of its bad performance across the board on all the major currencies, mostly driven by better than expected US data releases, and which sent Cable back down to position E. Some of this would have been down to profit-taking. However, we see an uptake in the pair again during Friday’s European session to retest the previous high at around 1.2663 level. A double top always makes the markets nervous.

However, around this time, President Donald Trump came out and said that there would likely be no Phase 2 to deal with China. It simply wasn’t on his mind.  This sent a shockwave through the market where US equities initially were sold off and which saw buying pressure on the United States dollar and a pullback in Cable.

The financial markets and especially the forex markets are extremely volatile at the moment and liable to huge swings caused by a myriad of reasons but mostly centered around the fallout from the Covid pandemic, of course. Tensions are building with China as it flexes its muscles over its new security law regarding Hong Kong and which is causing fall out with most of its trading partners. The UK government is about to make a decision with regards to the Chinese technology firm Huawei and whether or not to implement its 5G technology within the UK communications infrastructure.  Declining the use of Huawei technology may be seen by the Chinese government as a further indication that relationships are souring between the two nations.  Any increased tensions could also cause downward pressure on the Pound Sterling.

Categories
Forex Fundamental Analysis

How The New Announcement Of ‘GDP Per Capita’ Indicator Affects The Forex Market?

Introduction

GDP per capita is the primary economic indicator in macroeconomics to measure the standard of living and economic prosperity. While GDP indicates the economy’s size in terms of economic output, it does not reveal for what populace the output is divided. Hence, GDP per Capita is more suited to assess the wealthiness of the country’s population. 

Every nation strives to improve its standard-of-living by increasing the wealth of the population beyond just meeting daily needs. Hence, GDP per Capita becomes an important economic indicator for countries’ comparison of how well-off their people are.

What is the GDP per Capita?

GDP 

GDP is the measure of a country’s total economic output. It is the total monetary value of all the goods and services produced within the country regardless of citizenship (resident or foreign national). It is the market value of all the finished goods and services within a nation’s geographical borders for a given period. The period is generally a quarter (3 months) or a year. The commonly used term “size of the economy” refers to this economic indicator. The USA is the world’s largest economy, and it means it has the highest nominal GDP or highest economic output.

GDP Per Capita

It is a metric that is obtained by dividing a country’s GDP by its population count. Here, “per Capita” translates to “per average head” or “for one individual.” Hence, GDP per Capita is the measure of economic output per person. 

If we want to compare GDP per Capita amongst countries, we use the Purchasing Power Parity (PPP). Through PPP measure, we can compare countries on equal terms, as many countries have different currencies, comparing economic output becomes difficult. Hence PPP measures everything in the United States dollar terms, thus creating a base standard for comparison.

How can the GDP per Capita numbers be used for analysis?

Since GDP is the total economic output, countries with lower economic output than other countries may not necessarily be poorer. On the contrary, it could be wealthier. For example, Qatar has only 19 billion US dollars GDP in comparison to the USA, which has 20.54 trillion US dollars. But Qatar is the number one ranked the country as per GDP per Capita. It has 126,898 US Dollars compared to the United States that has only 62,794 US Dollars. Hence, the people of Qatar are wealthier than those in the United States. 

Here, we have to understand GDP per Capita is a function of the population. Higher population results in higher GDP prints but also distributes the GDP amongst more people. Qatar is a prosperous country with sizeable natural oil resources, which is not a labor-intensive task to extract and export. Hence, the high GDP through Crude Oil exports is divided amongst a few populace of 2.7 million people compared to the United States 328 million. The USA is the third most populous country after China and India.

Overall, small and prosperous countries and developed industrial nations tend to have high GDP per Capita. The wealthiest and most impoverished countries are also assessed based on the GDP per Capita as a primary metric.

The income per capita and GDP per Capita are the two most common tools for measuring economic wealth and prosperity. GDP per capita is more popular and widely used as it is more regularly tracked and maintained on a global scale by most countries. It, in turn, helps in ease of calculation, usage, and comparison amongst countries.

It tells us how much economic output is attributed to a citizen. Hence, it is a measure of national wealth. On the other hand, it can also tell us the economic productivity of the people. Productive and talented groups of people will contribute more value to the GDP prints.

GDP per capita is used alongside GDP and other GDP related metrics like the GDP Growth Rate, Real GDP, by policymakers to assess the economic health and take necessary actions to drive the economy in the right direction. When the GDP prints are consequently decreasing for two quarters, Central Authorities intervene through monetary and fiscal levers to counter deflation and stimulate economic growth through inflationary pressures. 

GDP metrics are closely watched by investors (domestic and foreign alike) to make investment decisions. Declining GDP holds off investments from investors, due to decreased confidence and vice-versa.

Impact on Currency

GDP metrics are used in a variety of ways by a variety of people. Economists and Central Authorities primarily use GDP per Capita to understand the economic wellbeing of its people. GDP Growth Rate is primarily used by Traders, Business people, and Investors to make business decisions.

GDP per capita would likely be more useful for Policymakers, and Business people. Business people can use this as a wealth metric and consequently decide the products that would suit the budget of people. The higher the wealth of the individual citizen, the costlier products and services they can afford. Hence, business decisions can also be impacted.

It is a proportional high impact indicator. Fluctuations in the GDP metrics bring a lot of volatility in currency markets. Falling GDP metrics are terrible for the economy, its businesses, consumers, and the Government. GDP impacts everyone. Hence, Central Authorities are committed to maintaining GDP Growth and take the necessary actions to avoid deflation. Businesses also hold off investment decisions in the stagnating economy and vice-versa.

Higher GDP per Capita is good for the currency and the economy and vice-versa. Although for trading decisions, GDP Growth Rate serves as a more relevant metric for comparisons amongst different currency countries. 

Economic Reports

For the United States, the Bureau of Economic Analysis releases quarterly GDP figures from which we can obtain our statistics on its official website every quarter. The release schedule is already mentioned on the website and is generally released one month after the quarter ends. 

Major international organizations like the World Bank, International Monetary Fund, OECD, etc. actively maintain track of GDP figures of most countries on their official website:

Sources of GDP per Capita

For the United States, the BEA reports are available here.

The St. Louis FRED keeps track of all the GDP and its related components in one place on its official website. You can find this information in the below-mentioned sources. 

GDP & GNP – FREGDP per Capita

Real GDP per Capita – FRED

GDP per Capita – World Bank

Impact of the “GDP per Capita” news release on the Forex market

In the above section of the article, we saw the definition of GDP Per Capita and understood how it differs from the nominal GDP. Per Capita GDP is calculated by dividing GDP over the entire population of the country. GDP Per Capita is a universal measure used by most economists to gauge the prosperity of nations.

It provides insight into the economic prosperity and economic development across the globe. Countries with high technological progress see a significant increase in GDP Per Capita. It is also a significant indicator of comparing the economic growth between the two countries. GDP Per Capita if often analyzed alongside GDP. GDP Per Capita considers both the GDP and its population.   

In today’s lesson, we will analyze the impact of GDP on the value of the currency and observe the variation in volatility due to the news announcement. In this regard, we have collected the year-on-year GDP of Japan, where the below image shows the GDP measured in the last fiscal year. Let us find out the reaction of the market to this data.

USD/JPY | Before the announcement:

We shall start with the USD/JPY currency pair to observe the impact of GDP data on the Japanese Yen. We can see in the earlier image that the market is in a downtrend with a large bearish candle visible a few minutes before the news release. As the market is very bearish, we will look to the currency pair after a price retracement to a technically significant level. At this point, we cannot take any position in the market. 

USD/JPY | After the announcement:

After the news announcement, we see that the price moves lower, resulting in further strengthening of the Japanese Yen. As the GDP data was very close to market expectations, traders comprehended this data to be positive for the economy and bought Japanese yen by selling the currency pair. In terms of positioning ourselves in the market, once should not go ‘short’ in the market soon after the news release as this would mean chasing the market, which is very risky.     

NZD/JPY | Before the announcement:

NZD/JPY | After the announcement:

The above images represent the NZD/JPY currency pair, where we see that the market has crashed recently, and the price is at the same level since then. This means there is extreme optimism in the market concerning the Japanese Yen. As the price is meager, we need a pullback before we can take a ‘short’ trade in the currency pair. Until then, we will watch the impact of GDP on the currency.

After the news announcement, the volatility expands on the downside, and the price sharply lower. The market reacted positively to the GDP data since it was measured to be nearly the same as before. This proved to be bullish for the Japanese Yen, where traders bought the currency and took the price lower.   

EUR/JPY | Before the announcement:

EUR/JPY | After the announcement:

The above images are that of EUR/JPY currency pair where we see that again, the market is in a downtrend, but in this pair, we notice a strong bullish candle from the lowest point, which has taken the price higher. This means the Japanese Yen is not as bullish as it was in the above two pairs. Since the market is not expecting a fall in the GDP, aggressive traders can take a ‘short’ position with a strict stop loss.

After the news announcement, the price moves lower and closes with a large bearish candle. This increases the volatility to the downside and strengthens the Japanese yen. Therefore, it clear that the GDP data had a hugely positive impact on all the currency pairs.    

We hope you understood the concept of ‘GDP per Capita’ and how the Forex price charts get affected after its news release. All the best. Cheers!

Categories
Forex Market Analysis

Daily F.X. Analysis, July 14 – Top Trade Setups In Forex – U.S. Inflation Report Ahead! 

On the news side, the economic calendar is fully loaded with a series of high impact economic events, especially the UK GDP, and the Inflation figures from Germany and the U.S. Most of the action will be seen during the U.S. session upon inflation figures.

Economic Events to Watch Today 


EUR/USD – Daily Analysis

The EUR/USD pair was closed at 1.13424 after placing a high of 1.13746 and a low of 1.12976. Overall the movement of the EUR/USD pair remained bullish throughout the day. The EUR/USD pair extended its previous day’s gains and jumped sharply on Monday against the U.S. dollar ahead of key developments in European Union later this week. Euro is likely to face a volatile week ahead as European Central Bank is set to retain its monetary policy conference on Thursday, and an E.U. Summit will also take place on Friday.

The ECB will likely hold its rates unchanged on Thursday that has drawn traders’ attention over the speech of ECB president Christine Lagarde, which could include some clues about future policy actions.

The ECB meeting could be shadowed by the E.U. Summit when all 27 member states of the European Union will meet, and bloc’s leaders will debate over the European Commission’s coronavirus recovery plan. The plan needs the backing of all 27 member states that made it difficult for compromise.

Germany and Italy have shown their consent and backed the E.U.’s 750 Billion euros recovery plan ahead of Friday’s meeting to appease other member states who have voiced concerns over the distribution of stimulus.

The Frugal Four, including Netherland, Sweden, Denmark, and Austria, have insisted that the funds be released as loans rather than grants or subsidies. The ongoing demand for the single currency can be seen by the week’s strong start for the Euro. On the flip side, the U.S. dollar was on the low track on Monday due to improved risk appetite after optimism raised in hopes of potential virus vaccine. The weaker U.S. dollar against its rival currency Euro gave a push to EUR/USD prices on Monday.

On the data front, at 11:00 GMT, the German WPI Wholesale Price Index for June came in as 0.6% compared to May’s -0.6%. From the American side, the Federal Budget Balance showed that in June, there was a deficit of 864.1 Billion against the expected 860 Billion and supported the U.S. dollar that kept a lid on additional gains in EUR/USD pair.

Daily Support and Resistance

  • R3 1.1459
  • R2 1.1406
  • R1 1.1368

Pivot Point 1.1315

  • S1 1.1278
  • S2 1.1224
  • S3 1.1187

EUR/USD– Trading Tip

On the 4 hour timeframe, the EUR/USD pair has violated an upward trendline, which was extending support at 1.1341 level, and now, this level will work as a resistance for the EUR/USD. On the lower side, the EUR/USD pair may find the next support at 1.1304 and 1.1265 level. The EUR/USD’s selling bias seems dominant since the violation of an upward trendline. We should consider taking selling trades below the 1.1345 level today. 


GBP/USD – Daily Analysis

The GBP/USD pair was closed at 1.25531 after placing a high of 1.26661 and a low of 1.25500. Overall the movement of GBP/USD pair remained bearish throughout the day. On Monday, the pair GBP/USD failed to extend its previous day’s bullish trend and started to decline because of downbeat comments from BOE’s Governor Bailey and persistent Brexit uncertainty ahead of the U.K.’s deadline’s official departure from E.U.

Bank of England Governor Andrew Bailey said on Monday that he thought that Britain’s economy was recovering, but it had a long way to go with the outlooks for jobs. He said that with the economies re-opened, the economy seems like it has come back, but there was a long way to go because a lot of people were still jobless.

Bailey’s downbeat comments weighed on Cable and dragged the Cable pair GBP/USD on the downside on Monday. Bailey also said that the Bank of England was looking at whether it should create a digital currency as it has huge implications on the nature of payments and society. He also acknowledged that since the coronavirus pandemic has escalated, there had been calls to step back from the shift away from Libor, which is used to price trillions of dollars of financial contracts.

However, he said that coronavirus’s shock has only reinforced the importance of removing the dependency of financial systems on Libor in a timely way. He warned lenders and borrowers to place their transition plans because if they think that the deadline to shift away from Libor of 2021 will be extended, then they were wrong.

On Brexit front, the U.K. government set to build 10-12 new Brexit border customs and control sites across the country to strengthen the mission to take back control from the E.U. The Cabinet Minister Michael Gove defended his plans for new post-Brexit border infrastructure after the opposition party said that the government was unprepared.

 Daily Support and Resistance

  • R3 1.277
  • R2 1.2697
  • R1 1.2654

Pivot Point 1.2581

  • S1 1.2538
  • S2 1.2465
  • S3 1.2421

GBP/USD– Trading Tip

The GBP/USD is trading with a bearish bias, especially after crossing below 50 EMA support level of 1.2570. This level is now working as resistance, and the Cable can show further bearish bias below 1.2570 level. Closing below this level can lead the GBP/USD pair towards 1.25200 level. The MACD and RSI are holding in a selling zone, and the 50 EMA, which is providing resistance at 1.2570, is also demonstrating the strong sell signal. Let’s consider taking sell trades below 1.2570 level. At the same time, second selling can be placed below the 1.2515 level today. 


USD/JPY – Daily Analysis

The USD/JPY was closed at 107.287 after placing a high of 107.316 and a low of 106.785. Overall the movement of the USD/JPY pair remained bullish throughout the day. The USD/JPY pair after falling for three consecutive days rose on Monday amid improving risk sentiment in the market that undermined the Japanese Yen and contributed to pair gains.

A report suggesting an effective coronavirus vaccine gave hopes and recovered optimism in the market. It also helped equity indexes start the new week on firm foot. The S&P 500, Dow Jones and NASDAQ were up from 1%-1.2% on the day and weighed on safe-haven Japanese Yen. The weaker Yen against the U.S. dollar gave a push to USD/JPY prices on Monday.

As for the vaccine new, on Sunday, several media reports suggested that Russia has become the first nation to complete the clinical trials of a COVID-19 vaccine on humans. The trials have reported that in initial results, the vaccine was safe and effective to an extent. Russia celebrated the supposed “world’s first COVID-19 vaccine”; however, it seemed premature as more research was still needed.

However, this news raised optimism and risk sentiment around the market and decreased the safe-haven appeal. The risk weighed on safe-haven Japanese yen and dragged the pair USD/JPY with itself. On the data front, at 9:30 GMT, the Tertiary Industry Activity from Japan came in as -2.1% against the expectations of -3.7% for May. It supported Japanese Yen and additional capped gains in currency pair.

From the American side, the Federal Budget Balance for June showed a deficit of 864.1 Billion against the forecasted 860 Billion. It supported the U.S. dollar, which added further in the currency pair daily gains.

On the other hand, The Director-General of WHO, Tedros Adhanom Ghebreysus, warned that too many countries were moving towards their destruction as the virus was the number one public enemy. If basic protocols were not followed, the pandemic might get worse and worse and worse.

Tedros said that on Sunday, from across the globe, 230,000 new cases appeared, out of which 80% were from 10 nations and 20% from just two countries. Tedros also said that the WHO had still not received formal notifications of the U.S. pullout that Trump announced. This downbeat statement by WHO raised concerns about global economic recovery and weighed on risk sentiment that kept a check on additional currency pair gains.

Support and Resistance    

  • R3 108.1
  • R2 107.91
  • R1 107.59

Pivot Point 107.39

  • S1 107.07
  • S2 106.87
  • S3 106.55

 USD/JPY – Trading Tips

On Tuesday, the USD/JPY continues to consolidate in a wide trading range of 107.350 to 106.950. Recently the USD/JPY pair has violated a downward channel, which extended resistance at 107.100 level. Simultaneously, the USDJPY pair has also crossed over 50 periods exponential moving average, which also supports the bullish bias in the USD/JPY pair. For now, the bullish breakout of the 107.340 level can extend the buying trend until 107.620 and 107.900 level. The MACD and RSI support bullish bias, and we may take a buying trade over 107.350 today. Good luck! 

Categories
Crypto Market Analysis

Daily Crypto Review, July 14 – IRS Violated Taxpayers’ “Bill of Rights”; The UK Wants a Digital Currency

The cryptocurrency market shad a green day, mostly caused by Bitcoin dropping under its immediate support level. Bitcoin is currently trading for $9,199, which represents a decrease of 0.82% on the day. Meanwhile, Ethereum lost 1.6% on the day, while XRP lost 1.42%.

 Daily Crypto Sector Heat Map

When talking about top100 cryptocurrencies, Aurora gained 245.87% on the day, making it by far the most prominent daily gainer. Divi (24.12%) and Ravencoin (17.39%) also did great. On the other hand, Ampleforth has lost 36.61%, making it the most prominent daily loser. It is followed by Nexo’s loss of 13.30% and Quant’ loss of 11.55%.

Top 10 24-hour Performers (Click to enlarge)

Bottom 10 24-hour Performers (Click to enlarge)

Bitcoin’s dominance level increased slightly since we last reported, with its value currently at 63.27%. This value represents a 0.33% difference to the upside when compared to yesterday’s value.

Daily Crypto Market Cap Chart

The cryptocurrency market capitalization decreased slightly when compared to when we last reported, with the market’s current value being $270.87 billion. This value represents a decrease of $3 billion when compared to the value it had yesterday.

_______________________________________________________________________

What happened in the past 24 hours?

_______________________________________________________________________

_______________________________________________________________________

Technical analysis

_______________________________________________________________________

Bitcoin

The largest cryptocurrency by market capitalization had a red day as bears broke its immediate support level. BTC dropped below the descending trend line as well as the $9,251 level in a short bear run. The price went all the way down to the $9,120 support level, but stopped and reversed its path there.

Once again, BTC traders had a great opportunity to trade the pullback after the bearish move. Trading Bitcoin’s reversals and confirmations are the safest way to trade at the moment.

BTC/USD 4-hour Chart

Technical factors:

  • Price is below its 50-period EMA and its 21-period EMA
  • Price at the lower B.B.
  • RSI at below the middle point and heading down (42.17)
  • Increased volume

Key levels to the upside          Key levels to the downside

1: $9,251                                 1: $9,120

2: $9,580                                 2: $8,980

3: $9,735                                  3: $8,820

Ethereum

Ethereum had a slightly red day as well, but with a much tamer move towards the downside. While bears did manage to push Ethereum below the $240 level, they faced a good amount of resistance at the 4-hour 50-period moving average. However, the price went under it as well, but stopped near the $237 level, where some form of support is created.

Ethereum traders should look for an opportunity to trade the next bounce off of $240 or break to the downside from the $240.

ETH/USD 4-hour Chart

Technical Factors:

  • Price below the 50-period EMA and the 21-period EMA
  • Price at the lower B.B.
  • RSI near the middle (45.68)
  • Increased volume

Key levels to the upside          Key levels to the downside

1: $240                                    1: $228

2: $251.4                                 2: $225.4

3: $260                                     3: $218

Ripple

The third-largest cryptocurrency by market cap fell below the $0.2 support level after a failed attempt of breaking $0.205 to the upside. The price dropped all the way to $0.192 before bouncing back. XRP is now consolidating above the 4-hour 50-period moving average, which it uses as a temporary support. The “battle” for $0.2 is, however, not yet finished.

XRP traders can look for an opportunity to trade after XRP establishes whether it will end up above or below $0.2.

XRP/USD 4-hour Chart

Technical factors:

  • XRP in a mid-term descending trend (though it broke the trend in the short-term)
  • XRP lacks strong support levels below $0.178
  • Price below 21-period and the 50-period EMA
  • Price at the lower B.B.
  • RSI is neutral (45.92)
  • Average volume

Key levels to the upside          Key levels to the downside

1: $0.205                                  1: $0.2

2: $0.214                                  2: $0.19

3: $0.227                                 3:$0.178


Categories
Forex Fundamental Analysis

Everything You Should Know About ‘GDP Per Capita PPP’ Macro Economic Indicator

Introduction

GDP per Capita PPP is the popular macroeconomic indicator for comparing economic prosperity and wellbeing of its citizens amongst countries, especially those with different currencies. As currencies can be managed lower or higher, GDP per Capita PPP is the most commonly used metric by economists for comparison and analysis.

GDP and its related metrics are the most important economic indicators for macroeconomic analysis, especially for traders’ fundamental analysis. Hence, it is imperative to understand GDP per Capita PPP to better understand relative economic prosperity in the international market place.

What is GDP Per Capita PPP?

GDP

Gross Domestic Product helps in measuring a country’s total economic output. It is the total monetary value of all the goods and services produced within the country regardless of citizenship (resident or foreign national).

It is the market value of all the finished goods and services within a nation’s geographical borders for a given period. The period is generally a quarter (3 months) or a year.

The commonly used term “size of the economy” refers to this economic indicator. The USA has the world’s largest economy, and it means it has the highest nominal GDP or highest economic output.

GDP Per Capita

It is a metric obtained by dividing a country’s GDP by its population count. Here, “per Capita” translates to “per average head” or “for one individual.” Hence, GDP per Capita is the measure of economic output per person. It tells us how much economic output is attributed to a citizen. Hence, it is a measure of national wealth. On the other hand, it can also tell us the economic productivity of the people.

Purchasing Power Parity (PPP)

It is an economic theory that compares different countries’ purchasing power through a basket of goods common in both countries. By evaluating the cost of a particular good in both countries, the PPP is calculated. For example, comparing the price of 1 gallon of milk in two countries would help us know the purchasing power parity. Parity means a state of being equal, and all things being equal, how much currency is required to procure identical goods in both countries helps understand the purchasing power of that country.

It measures how much a particular set of goods and services cost in each country, instead of the exchange rates that can be manipulated by speculative trading, or central authorities’ intervention.

A wide range of goods and services are taken into account to develop the PPP, and hence the process is complicated, but once generated, the PPP remains mostly constant in the long run.

GDP Per Capita PPP

If we want to compare GDP per Capita amongst countries, we use the Purchasing Power Parity (PPP). Through PPP measure, we can compare countries on equal terms, as many countries have different currencies, comparing economic output becomes difficult. Hence PPP measures everything in the United States dollar terms, thus creating a base standard for comparison.

How can the GDP per Capita PPP numbers be used for analysis?

Using nominal GDP values for economic growth comparisons would be misleading as currencies are often manipulated in favor of countries by the governing agencies. For example, China frequently devaluates currencies to increase their income through exports and offer their goods at a competitive price in the international markets.

Hence, using the GDP per Capita PPP is a more sensible approach as PPP values stay stable over more extended time frames and better understand and analyze economies with different currencies. The below table proves our above analysis.

It is important to understand we use PPP for making a fair comparison, but PPP is not perfect, it has the following limitations:

Taxes: Tax policies differ from country to country and consequently affects the price of goods and services, thereby making the PPP skewed.

Transportation: Goods need not be available across the planet at the same level. The import of goods from the manufacturing site would add to the prices of the goods differently to different countries. 

Tariffs: Governments can intervene to impose tariff barriers for economic reasons like protecting domestic businesses, which may again impact the imported product prices, making it costlier in the concerned country.

Non-Traded Services: Cost of Labor, utility, or equipment costs variation can also induce price differences in the reference goods.

Market Competition: Popularity in particular areas can give companies an edge and enable them to price higher than in other countries. Established reputation can change prices, which varies from its market presence duration. On the international scale, the popularity of a good is not the same across all economies and hence can skew prices.

All the above factors limit PPP in some ways, but PPP is still better than nominal GDP comparisons. So, GDP per Capita PPP may not be perfect, but currently, there is no better metric for economic prosperity comparisons amongst countries.

Impact on Currency

GDP metrics are used in a variety of ways by a variety of people. Economists and Central Authorities primarily use GDP per Capita PPP to understand its people’s economic wellbeing in contrast to other economies. GDP Growth Rate is primarily used by Traders, Business people, and Investors to make business decisions.

GDP per Capita PPP would likely be more useful for Policymakers, and Business people. Business people can use this as a wealth metric and consequently decide the products to suit the budget of people. The higher the wealth of the individual citizen, the costlier products and services they can afford. Hence, business decisions can also be impacted.

The PPP value can be used to base exchange rate fluctuations and identify signs of strengthening or weakening of currencies. 

It is a proportional high impact indicator. Higher GDP per Capita PPP is good for the currency and the economy and vice-versa. Although for trading decisions, GDP Growth Rate serves as a more relevant metric for comparisons amongst different currency countries. Also, GDP per Capita PPP is a yearly statistic and is more relevant for long term investment decisions than short-term currency trading decisions.

Economic Reports

Major international organizations like the World Bank, International Monetary Fund, OECD, etc. actively maintain track of most countries’ GDP figures on their official website. The World Bank maintains the GDP per Capita PPP for most countries. Every three years, the World Bank announces a report comparing the productivity and growth of different countries based on PPP. It is a yearly data.

Sources of GDP per Capita PPP

GDP per Capita PPP – World Bank

GDP per Capita PPP – CIA World Factbook

GDP per Capita PPP – the United States – FRED

We can find a consolidated list of the same here as well.

Impact of the ‘GDP Per Capita PPP’ news release on the price charts 

In the previous section of the article, we understood the definition of GDP based on PPP and how it is different from the nominal GDP. PPP based GDP is converted to international dollars using purchasing power parity rates and divided by the total population. 

Purchasing Power Parity (PPP) between two countries, X and Y, is the ratio of several units from country X’s currency required to purchase in country X. The same quantity of an excellent/service as one unit of country Y’s currency will purchase in country Y. It can be used mostly to compare inflation in two and, to some extent, the economic growth. But the nominal GDP is one that taken into consideration while making investment decisions.

In today’s example, we will observe the impact of GDP on various currency pairs and witness the change in volatility due to the official news release. The below image shows the GDP in the Euro Zone during the fourth quarter, where we see the GDP was as in the previous quarter. Let us find out the reaction of the market. 

EUR/USD | Before the announcement:

We shall start with the EUR/USD currency pair to analyze the impact of GDP on the Euro. It is clear from the preceding illustration that the market is not trending in any direction, which means there is confusion concerning the market trend. Therefore, until we have clarity in the market, it is smart not to take any trade.

EUR/USD | After the announcement:

After the news announcement, the price gets volatile as it moves in both the directions and finally, closes near the opening price. The GDP data did not strengthen or weaken the currency where the ‘news candle’ closed, forming an indecision candlestick pattern. As the news release did not bring about any significant change to the currency pair, one should analyze the currency based on technical indicators.    

EUR/JPY | Before the announcement:

EUR/JPY | After the announcement:

The above images represent the EUR/JPY currency pair, where we see that the overall trend of the market is up, and recently it is has shown signs of reversal before the news announcement. One needs to wait for confirmation before taking a trade as the news event can cause significant changes to the existing chart pattern, resulting in an unnecessary loss. Until the price is below the moving average, the uptrend shall not continue.

After the news announcement, the price initially moves lower, but it gets immediately bought and closes with a wick on the bottom. There is some volatility seen, which eventually takes the market lower. The GDP data came out to be as expected, where it was the same as before. Since there was no improvement in the GDP, we can ascertain that it was negative for the currency.    

EUR/AUD | Before the announcement:

EUR/AUD | After the announcement:

The above images are that of EUR/AUD currency pair, where we see that before the news announcement, the market is in a strong downtrend, and currently, the price is on the verge of continuing the downward move. However, since a significant news announcement is due, there is a possibility that it can change the trend, hence need to take a position based on the impact of the news.

After the news announcement, market shoots up, and volatility increases to the upside. Here we see that the GDP data has a positive impact on the Euro, and the currency strengthens after the news release. Now it is clear that selling the currency pair is no longer valid.

We hope you understood all about the ‘GDP Per Capita PPP.’ Do let us know your thoughts in the comments below. Happy Trading!

Categories
Forex Videos

Forex Fundamental Analysis for Novices – Japanese Bank Lending Rate!

Fundamental Analysis for Novices Japanese Bank Lending Rate


Welcome to the fundamental analysis for novices’ educational video.  In this session, we will be looking at the bank Japanese bank lending rate.

You have probably heard the old adage – failing to plan is planning to fail.  Well failing to take note of an Economic Calendar on a regular, daily, basis in order to plan your trading around potential volatile economic data releases is planning to fail at trading.
You should refer to one the day before you plan to trade, and eventually, when you are proficient enough, you will look for opportunities where extra volatility might creep into the market after a particular data release, in order to hop on a post developing trend.  But before you are proficient, you should avoid such volatile times at all costs.

The critical components of any Economic Calendar which are available by most brokers,  is the day and date, the event type, the time of the event, noting that the time of the event might be your local time and not the time of the particular country where the information is being released,  the likely impact that the data will have on the financial markets upon its release, the actual data will be released into a set area of the calendar and it is important that you find out where,  the consensus or forecast of the data, which has been put together by the economists and analysts and where large deviances from this upon release may cause volatility and the previous level of that data for comparison purposes. Remember, we are looking to see whether data is worse, better or the same as the previous release.  Better economic data numbers are positive for that economy, and where you might see the local currency strengthen, worse numbers might mean that the country is not doing so well economically and therefore bad for the country and where you might see the local currency weekend against its counterparts.

As mentioned, we are looking at the bank lending rate for Japan year on year for June, which will be released on Wednesday, July 8th, at 12:50 AM BST.

This particular data is considered as low-impact upon its release by the bank of Japan. It is the value of outstanding loans with Japanese Banks, and it is seen as important within the financial markets because it provides an insight as to whether banks are lending more to businesses. The more money that is lent, the better that is for companies who might be expanding, or buying more raw materials, and perhaps taking on extra staff.


The actual data released is calculated as a percentage and where year on year figure 4 May was 4.8%,  and that the general consensus forecast is for an increase to 7.2%,  and this is what the market will be looking for, a better number than for May and thus an improvement year on year.

Although the data is perceived as being of low impact, this will show whether or not the Japanese economy is faring better from the fallout of the pandemic.  Holistically, this and the rest of the data which is coming out of Japan currently will give an overall picture of the general health of the Japanese economy. A strengthening economy might mean a strengthening currency.  And vice versa,  The only caveat being that quite often, the Japanese Yen is considered to be a safe-haven currency, and it can be bought heavily even when the Japanese economy is not faring very well.

Categories
Forex Market Analysis

Daily F.X. Analysis, July 13 – Top Trade Setups In Forex – U.S. Federal Budget Balance In Focus 

On the news front, eyes will be European German WPI data, Canadian BOE Gov Bailey Speaks, and Federal Budget Balance. But none of them is highly impacted and may not drive major movements in the market. Let’s focus on the technical side of the market.

Economic Events to Watch Today 


EUR/USD – Daily Analysis

The EUR/USD pair was closed at 1.12984 after placing a high of 1.13245 and a low of 1.12545. Overall the movement of EUR/USD remained bullish throughout the day. The EUR/USD pair left behind its bearish stance and started posting gains on Friday due to better than expected macroeconomic data from the European side and weak data from the U.S. side. The downside pressure on greenback supported the upside movement of the EUR/USD pair.

The tone around the U.S. dollar remained negative due to the increased number of coronavirus cases from many states that reached more than 60,000 per day. Moreover, the number of deaths was also increasing that raised bars for renewed restrictions. The potential lockdown measures weighed on the U.S. dollar as it would affect the U.S. economy. The downbeat U.S. dollar added strength to EUR/USD pair on Friday.

On the other hand, ECB said that Bulgaria and Croatia were accepted to be a part of the ERM-2 mechanism, a mandatory stage for joining the euro, and beginning the currency bloc’s first expansion in half a decade. After the approval from the eurozone finance minister and ECB officials, the two eastern European nations will also join the bloc’s banking union from October 1.

Following the procedure, both nations must spend at least two years in ERM-2 before starting the practical preparations to join the euro that will roughly take another year. So, the estimated earliest year for their membership will be 2023. This positive news added further in the EUR/USD gains.

On the data front, at 11:45 GMT, the French Industrial Production for May increased to 19.6% from the forecasted 15.2% and supported euro. At 13:00 GMT, the Italian Industrial Production for May was also raised to 42.1% from the forecasted 23.5 % and supported euro that ultimately helped the EUR/USD currency pair to post gains.

From the American side, the Core PPI for June declined to -0.3% from the forecasted 0.1% and weighed on the U.S. dollar. At 17:30 GMT, the PPI for June also declined to -0.2% from the expected 0.4% and weighed on the U.S. dollar that added further in the upward trend of EUR/USD pair.

Next week, the key data would be about the ECB’s next policy meeting on the coming Thursday, and from the U.S. side, eyes will be on Core Retail Sales & Retail Sales data on Thursday. A repetition of recent comments is expected in ECB’s next policy meeting that means ECB will reiterate its stance towards supporting a recovery.

Daily Support and Resistance

  • R3 1.1459
  • R2 1.1406
  • R1 1.1368

Pivot Point 1.1315

  • S1 1.1278
  • S2 1.1224
  • S3 1.1187

EUR/USD– Trading Tip

The EUR/USD pair has violated a downward trendline, which extended resistance at 1.1291 level, and now this level is going to work as a support for the EUR/USD. On the higher side, the EUR/USD may find resistance at 1.1350 level. Above this, the next target can be seen around the 1.1390 level. Bullish bias seems dominant today.


GBP/USD – Daily Analysis

The GBP/USD pair was closed at 1.26217 after placing a high of 1.26640 and a low of 1.25666. Overall the movement of GBP/USD pair remained bullish throughout the day. The fresh supply in the U.S. dollar gave strength to GBP/USD pair on the last day of the week, and the pair rallied around 90 pips. Greenback struggled to gain attraction on Friday despite the increasing number of coronavirus cases. The fresh leg down in the U.S. Treasury bond yields dragged the U.S. dollar and made it weaker.

The traders ignored the persistent Brexit uncertainties on Friday as the main driver of the GBP/USD was the U.S. dollar. The European Union’s top negotiator Michel Barnier said that talks on the post-Brexit relationship had made a little progress. However, there were still significant differences in several important issues. This also added some positive momentum to Cable pairs.

On the data front, the U.S. dollar was weak due to poor than expected PPI reports. At 17:30 GMT, the Core PPI for June dropped to -0.3% from the expected 0.1%, and PPI was declined to -0.2% from the forecasted 0.4% and pushed the GBP/USD pair higher. While from Great Britain, the C.B. Leading Index for May came in as -1.4% compared to April’s -3.7%.

For the next week, coronavirus cases will remain dominant. Still, the calendar will also be under observation as U.K.’s GDP and claims will be announced, while from the U.S., the Consumer figures will remain under watch.

GDP for May will be released from the U.K. next Tuesday that could show some stability after a collapse of 20.4% in April. The most important data will release on Thursday about the jobs report. The Unemployment Rate is expected to increase to 4.7% in May after the remaining 3.9% in April. The government’s furlough scheme that was extended through October has helped keep unemployment low. Wages are expected to jump from 1% to 1.4% in the gauge, including bonuses.

From the U.S. side, the increasing number of coronavirus cases from Florida, California, Arizona, and Texas will remain under watch. However, on the data front, the key release will Retail Sales that are projected to rebound in June to 4.6%. The Core Consumer Price Index is expected to surge to 0.1% from the previous -0.1%.

 Daily Support and Resistance

  • R3 1.277
  • R2 1.2697
  • R1 1.2654

Pivot Point 1.2581

  • S1 1.2538
  • S2 1.2465
  • S3 1.2421

GBP/USD– Trading Tip

The GBP/USD is trading with a bearish bias, especially after crossing below 50 EMA support level of 1.2570. This level is now working as resistance, and the Cable can show further bearish bias below 1.2570 level. Closing below this level can lead the GBP/USD pair towards 1.25200 level. The MACD and RSI are holding in a selling zone, and the 50 EMA, which is providing resistance at 1.2570, is also demonstrating the strong sell signal. Let’s consider taking sell trades below 1.2570 level today. 


USD/JPY – Daily Analysis

The USD/JPY pair was closed at 106.911 after placing a high of 107.262 and a low of 106.635. Overall the movement of USD/JPY remained bearish throughout the day. The pair USD/JPY extended its previous day losses and dropped for the 3rd consecutive day on the back of broad-based selling bias around the U.S. dollar. The pair dropped to over two weeks the lowest level in the wake of risk-off market sentiment that gave strength to safe-haven Japanese Yen.

The recent optimism regarding the sharp V-shaped economic recovery faded away quickly after the record increase in the number of daily reported COVID-19 cases in the U.S. on Thursday. The continuous surge in the number of appearing cases and deaths also pushed the risk-off market sentiment that weighed on the equity market.

The global fight to safety weighed on U.S. Treasury bond yields that prompted selling bias in the U.S. dollar. The weak U.S. dollar failed to lend any support to the USD/JPY pair. On the data front, the PPI from Japan was released at 04:50 GMT, dropped by 1.6% against the forecasted drop of 2.0%, and supported Japanese Yen. The strong Japanese yen added in the losses of the USD/JPY pair.

At 17:30 GMT, the Core PPI for June was dropped to -0.3% from the expected 0.1% and weighed on the U.S. dollar. For June, the PPI also dropped to -0.2% against the forecasted 0.4% and weighed on the U.S. dollar that also dragged USD/JPY Pair.

On the other hand, the largest one-day increase in any country since the pandemic started was reported in the U.S. as 65,000 cases alone on Thursday. This raised the market’s safe-haven appeal that gave a push to Japanese Yen and ultimately weighed on USD/JPY pair. Moreover, the Federal Reserve said that in June, it purchased $1.8 Billion in corporate bonds to keep U.S. interest rates lower and ensure that large companies could borrow by selling bonds. 

The bonds were purchased to keep interest rates on corporate bonds lower, making it harder for companies to borrow by selling debts. A Fed official announced this week that recently Fed has slowed down its bond-buying and if the market remained relatively healthy, then the central bank will continue to do so.

Support and Resistance    

  • R3 108.1
  • R2 107.91
  • R1 107.59

Pivot Point 107.39

  • S1 107.07
  • S2 106.87
  • S3 106.55

 USD/JPY – Trading Tips

The USD/JPY is holding at 106.850, and this is going to provide solid support to the USD/JPY pair for now. However, this level’s bearish breakout has a huge odds of driving more selling until 106.450 level today. At the moment, the pair is trading with a selling bias of above 106.850 support. The USD/JPY is dropping below 50 periods EMA on the hourly charts, which supports the Japanese pair’s selling bias. Let’s look for selling trades below 107.250 today. Good luck! 

Categories
Forex Fundamental Analysis

What Is ‘GDP From Public Administration’ Forex Fundamental Driver All About?

Introduction

Public Administration is a critical aspect that drives overall economic growth. GDP from Public Administration can give us insights into the strength of the current central authorities’ efficiency in governance. Public Administration is the levers to the economic engine, and it can put brakes or accelerate the economy to sink into a recession or propel to economic growth. Hence, understanding Public Administration and its contribution to GDP will help us better understand its role in society’s functioning as a whole.

What is GDP from Public Administration?

Gross Domestic Product

GDP is the measure of a country’s total economic output. It is the total monetary value of all the goods and services produced within the country regardless of citizenship (resident or foreign national).

It is the market value of all the finished goods and services within a nation’s geographical borders for a given period. The period is generally a quarter (3 months) or a year.

The commonly used term “size of the economy” refers to this economic indicator. The USA is the world’s largest economy, and it means it has the highest nominal GDP or highest economic output.

Public Administration

It is the implementation of government policies. Public Administration is a part of every economy. Policies can be either monetary policy or fiscal policy.

Public Administration is concerned with the operations of government that run the nation. It is centered around the structuring of the Government policies and programs and government officials’ conduct to implement the same.

Public Administration’s definition and goals are vast subjects. In our analysis, we will only focus on the economic impact of Public Administration. 

How can the GDP from Public Administration numbers be used for analysis?

An analogy to understand the importance of Public Administration would be if an economy or nation is viewed as a car or engine. Public Administration would be the brake, gear, and acceleration levers. Levers determines whether the car moves forward or backward, and also the pace of movement.

Similarly, Public Administration determines what direction the economy’s growth is going towards and at what rate. Monetary policy is associated with the Central Bank of a nation. Fiscal Policies are associated with the Central Government. 

Officials working as per the Public Administration policies are called Civil Servants, together the Governing body and its policy determine how effectively the opportunities are maximized to satisfy the public demands and lead to overall economic wellbeing.

Policy reforms and effective Administration can reduce economic disparity amongst different classes of people, increase employment, wages, and business prosperity. Government Spending, Tax programs, Outlays, allowances, funding programs are all part of the Government policy. Public Administration determines how effectively such policies are implemented.

Public Administration provides the foundation for economic activity through laws and as a catalyst to economic wellbeing through its services. 

Without firm laws and regulations and active civil servants, the nation is in jeopardy. Weak governance and policy can sink the nation where corruption, political instability, riots, public protests, etc. can creep in. 

Services like transportation, maintaining law and order, road construction, police, jails, tax exemptions, medicare, social security, etc. directly may or may not generate revenue for the government but indirectly helps other sectors to boost overall economic prosperity.

When a nation’s government fails to stimulate the economy, there is a probability that it will continue for its elected period. Hence, International Investors can glean such clues from GDP from Public Administration figures. They can understand the behavioral nuances of the government and its probable impact in the upcoming quarters.

The government impacts the people and the business. On an absolute basis, the government has complete control over the nation for the elected period. It can bring about any policy reforms they see fit. It can help businesses or impede businesses. It can control money flow through the economy, and how much people pay taxes.

It is also essential to perceive that the GDP from Public Administration is only part of the government’s revenue. It assists in the functioning of other sectors through its public services that are not accounted for in the GDP. 

Hence, GDP from Public Administration itself does not tell us the real contribution of Public Administration in growth. The functions of a government span across various sectors and vary from region to region based on the economic region’s requirements.

Impact on Currency

The GDP from Public Administration is a low impact indicator, as the broader measures like Real GDP and GDP Growth Rates are more important for the Currency Markets. 

GDP from Public Administration does not paint the full picture of the economy, but it tells us the effectiveness of the current government and its policies. Still, for the International Currency Markets, it does not serve as a useful indicator.

It is a proportional and lagging indicator. Higher GDP from Public Administration is good for the economy and its currency, and vice-versa.

Economic Reports

For the United States, the Bureau of Economic Analysis releases quarterly GDP figures on its official website every quarter. The release schedule is already mentioned on the website and is generally released one month after the quarter ends.

In the full report, we can extract the GDP from Public Administration figures. We can also go through GDP by Industry to get the Public Administration performance in the report. Below is a sample of the same:

World Bank actively maintains track of GDP by Sector figures of most countries on their official website. Public Sector 

Sources of GDP from Public Administration

For the United States, the BEA reports are available here.

We can use the GDP by Industry to see the government’s contribution to GDP here. 

Different metrics like Public Debt, Expenditure, etc. are all categorically available here.

We can also find GDP from Public Administration for different countries here.

Impact of the ‘GDP From Public Administration’ news release on the price charts 

In the previous section of the article, we understood the importance of Public Administration in an economy and how it impacts economic growth. It plays an essential role in overseeing and shaping new impact market strategies. It is the responsibility of public administrators, whether policymakers or non-profit executives, to make use of the opportunity to ensure that the economy flourishes.

Profound policies are needed to facilitate private-sector investment in socially beneficial concerns. All this is in the hands of public administrators and the government. Therefore, the department has a fair amount of contribution to the GDP and the economy. When it comes to investing based on this information, investors do not make investment decisions based on the contribution from different sectors. They look at the final GDP and take a position in the currency.

In today’s lesson, we will analyze the impact of GDP on different currency pairs and see the volatility created after the news release. The below image shows the first-quarter GDP data of Singapore, where we see a significant drop in the GDP value compared to the previous quarter. Let us find out the reaction of the market to this data. 

USD/SGD  | Before the announcement


Let us start with the USD/SGD currency pair, where the above image shows the state of the chart before the news announcement. We see that the market is moving in a small ‘range,’ and just before the release, the price is at the top of the ‘range.’ This means we can expect selling pressure from this point that can take the price lower. However, it is better to take a position based on the volatility caused by the news announcement. 

USD/SGD  | After the announcement:

After the news announcement, we see that the price moves lower, and the market falls considerably. The market reacted oppositely to what was expected as it resulted in the strengthening of the Singapore dollar even though the GDP data was negative. The volatility increased to the downside, and eventually, the market turns into a downtrend.    

SGD/JPY | Before the announcement

SGD/JPY | After the announcement:

The above images are that of the SGD/JPY currency pair, where we see that the price is precisely at the ‘support’ before the news announcement. There is a high chance that the buyers might come back in the market and go ‘long’ in the currency pair. Since economists forecast a lower GDP for this quarter, it is advised not to take a ‘short’ position before the news release.

After the news announcement, the price initially moves higher, but this gets immediately sold into, and the candle closes with a large wick on the top. We witness a fair amount of volatility in the currency, and finally, it gets extended to the downside. One can take a ‘short’ position in the currency after noticing trend continuation patterns in the market and after confirmation from technical indicators.     

GBP/SGD | Before the announcement

GBP/SGD | After the announcement:

The above images represent the GBP/SGD currency pair, where we see that before the news announcement, the market has reversed to the upside, and currently, the price has reacted strongly from the ‘demand’ area. This indicates a high amount of bullishness in the currency pair and weakness in the Singapore dollar since it is on the left-hand side of the currency pair.

After the news announcement, the market falls lower, and the volatility slightly increases to the downside. The Singapore dollar gets more influential after the news release, despite reporting weak GDP data. Thus, we can conclude that there is some confusion in the market and hence it moves in both the directions. Traders should technically analyze and take positions accordingly. 

That’s about ‘GDP From Public Administration’ and its impact on the Forex market after its news release. In case of any questions, let us know in the comments below. Good luck!  

Categories
Crypto Market Analysis

Daily Crypto Review, July 13 – Coinbase Working With the US Secret Service; ETH 2.0 Facing Delays

The cryptocurrency market spent the weekend mostly rising in price after a semi-severe drop in price. Bitcoin is currently trading for $9,289, which represents an increase of 0.03% on the day. Meanwhile, Ethereum gained 0.59% on the day, while XRP lost 1.03%.

 Daily Crypto Sector Heat Map

When talking about top100 cryptocurrencies, iExec RLC gained 17.91% on the day, making it by far the most prominent daily gainer. Chainlink (17.25%) and Elrond (12.52%) also did great. On the other hand, Flexacoin has lost 21.07%, making it the most prominent daily loser. It is followed by UNUS SED LEO’s loss of 6.27% and Celsius’ loss of 6.03%.

Top 10 24-hour Performers (Click to enlarge)

Bottom 10 24-hour Performers (Click to enlarge)

Bitcoin’s dominance level decreased slightly since we last reported, with its value currently at 62.95%. This value represents a 0.34% difference to the downside when compared to Friday’s value.


Daily Crypto Market Cap Chart

The cryptocurrency market capitalization increased slightly when compared to when we last reported, with the market’s current value being $273.87 billion. This value represents an increase of $0.74 billion when compared to the value it had on Friday.

_______________________________________________________________________

What happened in the past 24 hours?

_______________________________________________________________________

_______________________________________________________________________

Technical analysis

_______________________________________________________________________

Bitcoin

The largest cryptocurrency by market capitalization had an average weekend in terms of volatility. Its price went down from $9,200 levels to $9,000 first, but bounced back quickly and started regaining its previous levels. BTC faced resistance in the form of the descending trend line for a short while but overcame it eventually. The price went up and then down to confirm the position above the level above which it is currently trading.

BTC trades should wait for the next increase in volume before trading BTC.

BTC/USD 4-hour Chart

Technical factors:

  • Price is above its 50-period EMA and its 21-period EMA
  • Price between the upper B.B. and the middle B.B (20-period SMA)
  • RSI at the mid-levels (52.35)
  • Decreased volume

Key levels to the upside          Key levels to the downside

1: $9,580                                 1: $9,251

2: $9,735                                 2: $9,120

3: $9,870                                  3: $8,980

Ethereum

Ethereum had had a slow weekend, with mostly sideways movement. However, the second-largest cryptocurrency by market cap managed to establish its position above the $240 during it. While the move to the upside seems to be done, Ethereum fulfilled its short-term goal and can trade, knowing it has strong support at $240.

Ethereum traders should look for an opportunity to trade the next bounce off of $240 or break to the downside from the $240.

ETH/USD 4-hour Chart

Technical Factors:

  • Price above the 50-period EMA and the 21-period EMA
  • Price slightly below the upper B.B.
  • RSI near the middle (55.41)
  • Decreased volume

Key levels to the upside          Key levels to the downside

1: $251.4                                 1: $240

2: $260                                    2: $228

3: $278.8                                  3: $225.4

Ripple

The third-largest cryptocurrency by market cap kept making higher lows and lower highs throughout the weekend. Ultimately, the price broke $0.2 to the downside and came back above it many times, with it currently being below $0.2. It is still uncertain where the price will end up.

XRP traders can look for an opportunity to trade after XRP establishes whether it will end up above or below $0.2.

XRP/USD 4-hour Chart

Technical factors:

  • XRP in a mid-term descending trend (though it broke the trend in the short-term)
  • XRP lacks strong support levels below $0.178
  • Price is at the 21 and above the 50-period EMA
  • Price slightly above the middle B.B. (20-period SMA)
  • RSI is neutral (52.65)
  • Average volume

Key levels to the upside          Key levels to the downside

1: $0.205                                  1: $0.2

2: $0.214                                  2: $0.19

3: $0.227                                 3:$0.178


Categories
Forex Videos

Fundamental Analysis For Novices – Eurozone Services Sentiment!

,

Fundamental Analysis For Novices – Eurozone Services Sentiment


Welcome to the fundamental analysis for novices educational video.  In this session, we will be looking at the eurozone services sentiment indicator.

It doesn’t matter if you are an occasional trader,  a day trader,  or an institutional size trader,  one aspect of trading which is an absolute must is to regularly refer to an economic indicator such as this one,  in order to plan your trades around the release of countries’ economic data releases.

Many Traders only trade on economic data releases, as soon as the data is released, they will have orders already placed into the market or execute instant trades depending on the statistical data releases as they come out into the market.  This is called trading on fundamental news flow.  It can cause extreme volatility in the market.  This is just one of the reasons why you need to be informed as to when countries release their economic data statistics into the market, and where these are usually released at set times and subject to an embargo.

Most brokers will provide their traders with an economic calendar,  and the critical components are the time of the release, which may not necessarily be in the local time, the type of event, showing the country and the data to be released, including which aspect of the economy it refers to, the date and date. The impact that it will likely have upon its release, which will typically be in three levels – low – medium and high risk. Where high risk is more likely to cause volatility in the market.  A general consensus amongst economists and analysts with regard to what they expect the level to be, and the previous data release.
The economic data release is typically updated weekly, monthly, quarterly, and annually.

Here we can see that our area of interest today is the eurozone services sentiment for June, which is set to be released at 10 am British Summer Time on Monday the 29th of June.  The impact level is set to low, the consensus value is  – 27,  and the actual figure for the previous month of May was – 43.6.


So, what is the eurozone services sentiment indicator? The indicator is calculated on a monthly basis by the European Commission and is seasonally adjusted.
The services sector comprises firms only in-service industries such as: transportation, information, trading and securities, investment, insurance, mortgages, waste management, private healthcare and social assistance, arts, entertainment, etc.

A sample of 18000 companies across the eurozone are surveyed about business conditions for the last three months, and where they are asked three questions:

If business conditions have improved, worsened, or remained the same over the last three months,

If the demand for their services has increased, decreased, or stayed the same over the last three months.

And they are also asked a question about the expected demand for their services in the next three months, and whether they think it is expected to grow, fall or stay at the same level.

Each respondent’s answer is weighted to the relevance of their contribution to their country’s economy and where each country’s response is weighted with regard to their contribution to the Eurozone area.

Let’s just go back to the economic calendar for June, and although the impact of value is set too low, we can see that the previous figure for May was – 43.6, which is incredible, and was obviously this low because of the coronavirus impact.  The consensus value is -27, which is a much greater improvement on the previous month’s figure, and where economists and analysts are predicting a general improvement in this indicator.  Huge deviations from the consensus, especially if the released data is worse than the previous month’s figure, will, in actual fact, cause extreme market volatility.

The reason the indicator is is so important is because it tells the market if conditions are improving in the Eurozone area in which case should the figure come out at -27 as per economists’ expectations or even better this would be considered good news for the eurozone and we might expect the euro to gain in exchange rate values against its counterparts.

Should the figure be worse than -27,  this would show that in actual fact conditions in the service sector across the eurozone are not improving and the businesses in this sector have a pessimistic outlook for the next quarter, and this might have a negative impact on the Euro currency which might then fall in exchange rates against its counterparts.

Bear in mind, that if businesses have an optimistic view, they will be employing more people, perhaps borrowing more money to expand their businesses, it also means that the general population is using more services because they have a more optimistic view of the circumstances in the eurozone area as things improve from the virus conditions.  And so there is a huge knock-on effect with regard to jobs, extra demand for services, and a generalized getting back to normal.

The opposite applies should the respondents have a completely negative out view for the next quarter.

Categories
Crypto Market Analysis

Daily Crypto Review, July 10 – Tether and Bitfinex on Trial for $850 million? Tether Holders: Watch Out!

The cryptocurrency market was mostly in the red in the past 24 hours, with Bitcoin currently trading for $9,169, which represents a decrease of 2.62% on the day. Meanwhile, Ethereum lost 3.73% on the day, while XRP lost 4.45%.

 Daily Crypto Sector Heat Map

When talking about top100 cryptocurrencies, Holo gained 25.95% on the day, making it by far the most prominent daily gainer. Nervos Network (13.81%) and The Midas Touch (13.38%) also did great. On the other hand, Flexacoin has lost 13.72%, making it the most prominent daily loser. It is followed by Quant’s loss of 11.26% and Siacoin’s loss of 9.81%.

Top 10 24-hour Performers (Click to enlarge)

Bottom 10 24-hour Performers (Click to enlarge)

Bitcoin’s dominance level decreased slightly since we last reported, with its value currently at 63.29%. This value represents a 0.1% difference to the downside when compared to yesterday’s value.

Daily Crypto Market Cap Chart

The cryptocurrency market capitalization decreased when compared to when we last reported, with the market’s current value being $273.13 billion. This value represents a decrease of $2.57 billion when compared to the value it had yesterday.

_______________________________________________________________________

What happened in the past 24 hours?

_______________________________________________________________________

_______________________________________________________________________

Technical analysis

_______________________________________________________________________

Bitcoin

The largest cryptocurrency by market capitalization had a red day, as bears pushed the price back down towards the $9,000. The descending line Bitcoin broke previously fell under the bearish pressure, and Bitcoin started rushing towards the downside. The bearish move got stopped by the $9,120 level, which held up quite nicely. However, bears have not reached exhaustion, which means that the $9,120 level is not safe yet.

BTC trades should look for the retracement move for a safe trade.

BTC/USD 4-hour Chart

Technical factors:

  • Price is below its 50-period EMA and its 21-period EMA
  • Price at the lower B.B.
  • RSI at the lower levels (37.8)
  • Increased volume

Key levels to the upside          Key levels to the downside

1: $9,580                                 1: $9,251

2: $9,735                                 2: $9,120

3: $9,870                                  3: $8,980

Ethereum

Ethereum made a move towards the downside as well, falling below the ascending line it previously broke, as well as below the $240 level. The move was (for now) stopped by the 4-hour 50-period moving average, and ETH seems to be starting a consolidation phase near the $240 level.

Ethereum traders should look for an opportunity in trading pullbacks from the moving averages or horizontal levels. They should also pay close attention to Bitcoin’s movement, as BTC is mostly the main factor that causes ETH’s volatility.

ETH/USD 4-hour Chart

Technical Factors:

  • Price above the 50-period EMA and below the 21-period EMA
  • Price slightly below the middle B.B. (20-period SMA)
  • RSI near the middle (45.8)
  • Increased volume

Key levels to the upside          Key levels to the downside

1: $240                                    1: $228

2: $251.4                                 2: $225.4

3: $260                                     3: $217.7

Ripple

The third-largest cryptocurrency by market cap ended up in the red as well. After bulls reaching exhaustion at $0.212, bears took over and caused the price to reach the lows of $0.192, therefore breaking $0.205 and $0.2 support levels. XRP has strong support at the $0.19 line (both the horizontal support line and the 50-period moving average are there), so there is almost no chance XRP will move down (unless BTC makes a sharp move down).

XRP traders can look for an opportunity to trade in a range, as XRP is pretty much bound within $0.19 to $0.20 range unless BTC makes a move.

XRP/USD 4-hour Chart

Technical factors:

  • XRP in a mid-term descending trend (though it broke the trend in the short-term)
  • XRP lacks strong support levels below $0.178
  • Price is below the 21 and above the 50-period EMA
  • Price slightly below the middle B.B. (20-period SMA)
  • RSI is neutral (50.6)
  • Increased volume

Key levels to the upside          Key levels to the downside

1: $0.205                                  1: $0.2

2: $0.214                                  2: $0.19

3: $0.227                                 3:$0.178


Categories
Forex Market Analysis

Daily F.X. Analysis, July 10 – Top Trade Setups In Forex – US PPI Figures Ahead! 

On the news front, the eyes will remain on the Canadian labor market figures, and US PPI figures, which are expected to perform better than previous figures as the COVID19 driven lockdown is over, and people are back to jobs. We can expect CAD and USD to stay stronger today.

Economic Events to Watch Today 


EUR/USD – Daily Analysis

The EUR/USD pair was closed at 1.12846 after placing a high of 1.13704 and a low of 1.12800. Overall the movement of the EUR/USD pair remained bearish throughout the day. The EUR/USD has hit its highest in four weeks on Wednesday amid market optimism but retreated from that on Thursday on the back of concerns like E.U. recovery package, U.S. jobless claims, and coronavirus cases from the U.S. & all over the world.

The Eurogroup held its meeting on Thursday to elect the new president, and Paschal Donohoe, Minister for Finance and Public Expenditure & Reform of Ireland was selected as the Eurogroup’s new president.

 The New president will take office from July 13, 2020, and serve for two and a half years. The first Eurogroup meeting under Paschal Donohoe has been planned for September 11, 2020.

Eurogroup is an informal body where ministers of euro area member states discuss common concerns as they share the Euro as a single currency. The focus of the discussion remains particularly on the coordination of economic policies. Eurogroup usually meets once in a month, on the eve of Economic & Financial Affairs Council meeting.

The risk tone around the market was faded away after the U.S. Trump Administration announced that it has planned to finalize the regulations this week that will bar the U.S. government from buying goods & services from any company that uses products from five Chinese companies including Huawei, Hikvision, and Dahua. This indicated a surge to the ongoing tensions between U.S. & China and raised safe-haven appeal that weighed on riskier EUR/USD currency pair, and hence, the pair started to fell on Thursday.

On the data front, the German Trade Balance was released at 11:00 GMT that showed a surplus of 7.6B against the expected 6.6B in May and supported the single currency Euro that capped on additional losses in EUR/USD pair.

From the U.S. side, the Unemployment Claims for last week were reported at 17:30 GMT, as 1.314M against the expected 1.375M, and supported the U.S. dollar that added in the losses of EUR/USD pair. Though the numbers came in less than expectations, they were still very big, and hence, investors gave a little attention to this data on Thursday.

Daily Support and Resistance

  • R3 1.1459
  • R2 1.1406
  • R1 1.1368

Pivot Point 1.1315

  • S1 1.1278
  • S2 1.1224
  • S3 1.1187

EUR/USD– Trading Tip

The EUR/USD pair has violated an upward trendline, which extended support at 1.1291 level, and now, this level will work as a resistance for the EUR/USD. On the lower side, the double bottom may extend support at 1.1262 level. Below this, the next support can be seen around the 1.1240 level. Bearish bias seems dominant today.


GBP/USD – Daily Analysis

The GBP/USD pair was closed at 1.26060 after placing a high of 1.26639 and a low of 1.25952. Overall the movement of GBP/USD pair remained bearish throughout the day. The GBP/USD pair climbed to its highest level in three weeks in the earlier session on Thursday but failed to remain there and turned to the downside on the back of a strong U.S. dollar.

The greenback rose across the board as equity prices in the Wall Street Journal turned negative sharply right after the U.S. Supreme Court ruled that President Trump cannot block his financial records to prosecutors.

Donald Trump has come under fire for not making his tax returns public as his predecessors. His lawyers have argued that he enjoyed total immunity while in the White House office and that Congress had no valid justification for examining the records. The U.S. stocks turned lower, and U.S. yields also moved to the downside. The U.S. dollar rose, and the DXY bounced back from 4 weeks lowest level to 96.70 level.

On the data front, at 04:50 GMT, the RICS House Price Balance from Great Britain came in as -15% against the expected -25% in June and supported single currency Cable that limited the additional losses in the pair.

However, on the U.S. side, the Unemployment Claims were released at 17:30 GMT. In last week 1.314M Americans applied for jobless benefits against the expected 1.375M and supported the U.S. dollar added further in the losses of GBP/USD pair on Thursday.

On Brexit front, the top E.U. negotiator, Michel Barnier, said on Thursday that talks between E.U. & U.K. would continue later this month. The Brexit trade talks broke up early for the week as Barnier warned that “significant divergences” remain between them.

He also urged E.U. national governments at the same time to be prepared for disruption at the end of the year as chances for no-deal were still high. He said that to overcome the significant divergences between both parties, his team would continue to work with patience, respect, and determination.

 Daily Support and Resistance

  • R3 1.277
  • R2 1.2697
  • R1 1.2654

Pivot Point 1.2581

  • S1 1.2538
  • S2 1.2465
  • S3 1.2421

GBP/USD– Trading Tip

The GBP/USD is trading with a bearish bias, especially after crossing below 50 EMA support level of 1.2570. This level is now working as resistance, and the Cable can show further bearish bias below 1.2570 level. Closing below this level can lead the GBP/USD pair towards 1.25200 level. The MACD and RSI are holding in a selling zone, and the 50 EMA, which is providing resistance at 1.2570, is also demonstrating the strong sell signal. Let’s consider taking sell trades below 1.2570 level today. 


USD/JPY – Daily Analysis

The USD/JPY pair was closed at 107.199 after placing a high of 107.395 and 107.095. Overall the movement of USD/JPY remained bearish throughout the day. The USD/JPY pair rose in the earlier session on the back of U.S. dollar strength but couldn’t stay there due to strong Japanese Yen amid increased safe-haven demand and dropped to post losses.

On the data front, at 04:50 GMT, the Core Machinery Orders from Japan rose by 1.7% against the expected decline by 5.2% in May and supported Japanese Yen that weighed on USD/JPY pair. TheM2 Money Supply from Japan came in as 7.2% against the forecasted 5.6% and supported the Japanese Yen that added further in USD/JPY pair losses. At 10:59 GMT, the Prelim Machine Tool Orders came in line with the expectations of -32.0%.

From the U.S., at 00:00 GMT, the Consumer Credit for May showed a decline of 18.3B from the expected decline of 15.2B and weighed on the U.S. dollar that dragged the USD/JPY pair with itself. However, at 17:30 GMT, the U.S. Unemployment Claims for last week came in as 1.314M against the expected 1.375M and supported the U.S. dollar that helped limit losses in USD/JPY pair.

The U.S. dollar was strong across the board after the equities, and U.S. stocks in WSJ dropped to their lower levels due to the U.S. Supreme Court ruled that the New York prosecutors can examine Trump’s financial records.

Donald Trump was criticized for not making hid financial records, including tax returns public like his predecessors. At the same time, his lawyers argued that he was immune to publish those records while he was in office and that Congress had no justification for seeking those records.

But on Thursday, U.S. Supreme Court ruled that President Trump cannot block the release of his tax returns and financial records to prosecutors.

On the other hand, data revealed that coronavirus had affected more than 3 million Americans so far, with a daily record of more than 60,000 cases and death tolls around 134,000.

Meanwhile, the U.S. & China relations also remained under highlights as the US Trump administration announced that this week the regulations would be finalized to block the U.S. government. The U.S. seems to restrict buying goods & services from any company that uses products from five Chinese companies, including Huawei, Hikvision, and Dahua. This also weighed on market tone and added in USD/JPY pair’s losses.

Support and Resistance    

  • R3 108.1
  • R2 107.91
  • R1 107.59

Pivot Point 107.39

  • S1 107.07
  • S2 106.87
  • S3 106.55

 USD/JPY – Trading Tips

The USD/JPY was consolidating in a broad trading range of 107.800 to 107.250, which was finally violated. The pair is now holding at 106.850, and this is going to provide solid support to the USD/JPY pair for now. However, this level’s bearish breakout has a huge odds of driving more selling until 106.450 level today. At the moment, the pair is trading with a selling bias of above 106.850 support. The USD/JPY is dropping below 50 periods EMA on the hourly charts, which supports the Japanese pair’s selling bias. Let’s look for selling trades below 107.250 today. Good luck! 

Categories
Forex Videos

Fundamental Analysis For Novices – Money Supply!

Fundamental Analysis For Novices – Money Supply  


Thank you for joining our educational video four fundamental analysis for novices. In this video, we will be looking at Money Supply as an economic indicator.


Successful traders use economic calendars to tell them when governments are due to release statistics regarding the health of that particular nation’s economy.  Such data release information can be found on an economic calendar such as this one.  The majority of brokers provide an economic calendar, and you should refer to it every day in order to avoid trading around times of possible extra market volatility surrounding the release of high impact economic data.

The critical components of an economic calendar are the day, date and time, the actual event, the likely impact of the data, the actual data upon release, the previous data for comparison, and a market consensus of what the likely figure will be.

Here we can see that on Monday, June 29th at 9:30 BST Great Britain will release is M4 money supply data for May and also the year on year update, and where the economic impact is considered to be low.

All countries pay particular attention to money supply, but in the UK, the M4 Money supply data Is released by the Bank of England. Basically, it is an indicator that tells the market how much sterling is in circulation, in both notes, coins as well as money held in bank accounts.

Typically, more money in the system usually reflects lower interest rates and where this might generate more investment while increasing the amount of money in consumers’ bank accounts, which thereby stimulates spending.

Intern businesses will buy more materials to increase production for consumers’ needs, and this increased business activity might also have an effect on the labour market, which might see more employment during such times.

The opposite would apply if money supply falls, which could be a reflection on economic growth rates.
There are various types of money supply levels from M0, M1, M2, M3, and M4. And you might hear terms such as broad money supply, Narrow money, I’m very in degree as to the type and size of a council in which the monies and coins are kept.

Money supply data is published periodically by the country’s Central Bank or the Federal Reserve as in the United States, and where they release the pertaining data on a weekly and monthly basis. Their respective treasuries issue paper and coin currency depending on their requirements, which will change from time to time, depending on economic circumstances.  For example, during the economic crisis brought on by the coronavirus, central banks have issued more money into their economies for banks to hold on reserve in order to extend credit.

M4 is the bank of England’s main measure of money supply and would be a comparison of M3 measures in many other countries. The Bank of England does not set a target for money supply. However, the monetary data does throw lights on the incremental outlook for inflation, and because government’s do usually have targets for inflation M4 money supply does play a significant aspect in the UK economy. At the moment the British government, like most, is extremely active in providing stimulus to shore up the British economy from the effects of the coronavirus, this stimulus, or quantitative easing as it is known, is a policy aimed at boosting money supply.

Although the M4 money supply data will not usually be a market-moving indicator, it is important that traders keep tabs on all governments’ money supply data, and quantitative easing in particular, in order to gauge what each country’s government is doing in this area.

Categories
Forex Fundamental Analysis

‘GDP From Manufacturing’ – Understanding The Macro Economic Indicator & Its Impact

Introduction

GDP from Manufacturing is significant for many developing economies. It is their primary driver for economic growth to improve the standard of living and generate wealth. Manufacturing Sector has supported a large share of jobs in the economy. 

Manufacturing Sector has helped many economies to come out of underdeveloped status to developing nation status. Hence, understanding GDP from Manufacturing has varying significance in different countries is suitable for macroeconomic view in the international markets.

What is the GDP from Manufacturing?

Gross Domestic Product

GDP is a basic measure of a country’s total economic output. It is the total monetary value of all the goods and services produced within the country regardless of citizenship (resident or foreign national).

It is the market value of all the finished goods and services within a nation’s geographical borders for a given period. The period is generally a quarter (3 months) or a year. The commonly used term “size of the economy” refers to this economic indicator. The USA has the world’s largest economy, and it means it has the highest nominal GDP or highest economic output.

Manufacturing

It is producing goods for use or sale labor, processing equipment, or machinery. It is a process that could be physical, chemical, or mechanical. The manufacturing sector mainly uses raw materials to make finished goods for consumption by end customers or intermediate goods for other manufacturing industries. For example, a car Manufacturing company could import raw iron ore metal, and process it to produce metal car body parts.

In the lifecycle of a finished good, the Manufacturing comes in as the second stage in the supply chain right after the source of raw materials. The manufacturing sector includes plants, factories, mills, and generally use power-driven machinery in their process. The manufacturing sector can also include small businesses, or home startups like bakeries, candy stores, or custom tailors, etc.

How can the GDP from Manufacturing numbers be used for analysis?

Manufacturing is an essential component of GDP. In the United States, it contributed 11.6% of total GDP. Manufactured products make up half of the total United States exports. In the United States alone, the Manufacturing Sector has 12.85 million jobs, about 8.5% of the total workforce. The importance of the Manufacturing Sector is evident from the rapidly developing economies like China, Japan, and India. 

The industrialization has been the main propellent for economic growth in these countries that put them back on the map. With export-led growth, China has primarily used Manufacturing Sectors to achieve growth rates of 10% and above to catch up with the advanced economies like the United Kingdom, and the United States. Manufacturing Sector is a labor-intensive sector, and it requires skilled labor. Despite the advent of modern technologies, equipment, and automated machinery, it still requires skilled laborers to fill the gaps.

Developing economies do not have a competitive edge over the developed economies in the services sector. But they do have the advantage in the Manufacturing and Industrial Sectors due to the availability of cheap labor. The low costs associated with a low standard of living and maintenance attracts business to establish their production centers in such countries. For example, an autoworker in Detroit makes 58 dollars an hour compared to 8 dollars in Mexico.

With an improved standard of living in developed economies like the United States, the cost of labor is high in comparison. It is the primary reason for the decline in the Manufacturing Sector growth in the developed economies for over two decades, paired with rapid growth in developing economies during the same period. 

With many developed economies transitioning more into the services sector, the Manufacturing Sector has lost its fair share in developed economies while developing ones like China have significantly increased their Manufacturing Industry production levels. 

About Thirty percent of the GDP of China comes from the Manufacturing Sector alone. Hence, we can understand that the Manufacturing Sector is the primary source of growth for many developing countries. The above plot shows the increase in Manufacturing Production in China. It is steady and steep growth. The vertical axis is plotted in CNY HML (Chinese Yuan Hundred Millions).

As the countries develop, they start to get involved in the Service sector by investing the wealth generated from the Manufacturing Sector to come on par with developed economies and establish a total equilibrium. But there is a long way to go before all developing economies become developed.

Impact on Currency

The GDP from Manufacturing in itself is not a high impact indicator, as the broader measures like Real GDP and GDP Growth Rates are more important for the Currency Markets. GDP from Manufacturing does not paint the full picture of the economy. It can be an essential tool for the Central Authorities to keep track of Manufacturing Sector performance and its implications to the economy.

As established, the Manufacturing Sector is a significant contributor to economic growth for developing economies. Hence, changes in this sector widely affect the overall economic health, and all the dependent industries therein. It is a proportional and lagging indicator. Higher GDP from Manufacturing is good for the economy and its currency, and vice-versa.

Economic Reports

For the United States, the Bureau of Economic Analysis releases quarterly GDP figures on its official website every quarter. The release schedule is already mentioned on the website and is generally released one month after the quarter ends.

In the full report, we can extract the GDP from Manufacturing figures. We can also go through GDP by Industry to get the Manufacturing Industry performance in the report. The World Bank actively maintains track of GDP by Sector figures of most countries on its official website.

Sources of GDP from Manufacturing

For the United States, the BEA reports are available below: 

World Bank also maintains the Manufacturing Sector’s contribution as a percentage of GDP on its official website, as given below for reference. ‘GDP From Manufacturing’ of various economies can be found here.

Impact of the ‘GDP from Manufacturing’ news release on the price charts

The manufacturing sector is crucial for the development of a country. The growth of machinery output and technological improvements are the main drivers of economic growth. The service sector, too, is dependent on most of the manufactured goods. Manufacturing also revives the economy by creating tens of millions of new jobs, eradicating recession.

Therefore, the manufacturing sector contributes a significant part of the GDP of a country. When we drill down to the fundamental analysis of the currency, investors do not look at the manufacturing sector’s contribution alone but consider the distinct GDP as the leading indicator of economic growth.

For example, we will be analyzing the influence of GDP on various currency pairs and see the impact it makes on the value of a currency. The below image displays the previous and latest GDP in the United Kingdom released in May, where we see a significant drop in the GDP compared to the previous month. Let us find out if the market reacts positively or negatively to the news release.  

GBP/USD | Before the announcement:

We shall start our analysis with the GBP/USD currency pair, where the above image shows the properties of the pair before the news announcement. We can see in the above image that the market is in a downtrend, and recently the price has been moving within a ‘range.’ Since the GDP announcement is a high impact event, we should wait for the news release to clarify the direction of the market.  

GBP/USD | After the announcement:

After the news announcement, we witness a slight amount of volatility in the currency pair where the price initially goes up, and later it closes with a wick on the top. We do not observe the kind of impact that was expected due to the news release may be because the market had already priced in a negative outlook. Since the impact was less, we should look to trade the currency pair based on technical indicators and chart patterns.     

GBP/CAD | Before the announcement:

GBP/CAD | After the announcement:

The above images represent the GBP/CAD currency pair, where we see in the first image that the market seems to be resuming the downtrend after a price retracement to the resistance. Given that the impact of GDP announcement is high, we will look to take a ‘short’ only after confirmation from the market. There is a probability that the market may turn to the upside from this point if the news comes out to be positive for the British Pound.

After the news announcement, we see that the price rises above the moving average, and it closes with some bullishness. Even though the GDP data was fragile, traders bought British Pound and strengthened the currency. One of the reasons could be that the market has factored in the negative expectations, which led to a positive reaction after the news release. One should analyze the pair technically before taking a position in the currency.  

EUR/GBP | Before the announcement:

EUR/GBP | After the announcement:

The above images are of the NZD/GBP currency pair, where we see that the market is in a steady uptrend before the news announcement, signifying the enormous amount of weakness in the British Pound. Ideally, we will be looking to buy the currency pair after a suitable price retracement to the ‘support’ or ‘demand’ area. By the way, we should also not forget that the news release can reverse the trend.

After the news announcement, we see that the market reacts negatively to the news release but positive for the British Pound since it is on the right-hand side of the currency. The volatility slightly increases to the downside, which is evident from bearish ‘news candle.’

That’s about ‘GDP from Manufacturing’ and its influence on the Forex market after its news release. If you have any questions, please let us know in the comments below. Good luck!

Categories
Forex Market Analysis

Daily F.X. Analysis, July 09 – Top Trade Setups In Forex – Trade Plans to Follow! 

On the news front, traders will keep their focus on the German trade balance, and U.S. Jobless Claims data in order to predict further price action in the market. Both events are expected to perform better than before and may help positive moves in the U.S. dollar.

Economic Events to Watch Today 


EUR/USD – Daily Analysis

A day before, the EUR/USD pair was closed at 1.13294 after placing a high of 1.13516 and a low of 1.12621. Overall the movement of the EUR/USD pair remained bullish throughout the day. The EUR/USD pair rose on Wednesday due to the U.S. economy’s gloomy look after a rising number of infection cases from the U.S. Despite growing fears over a possible second wave of coronavirus in the U.S., the market’s risk sentiment improved. Investors have weighed hopes in favor of a swift economic recovery despite signs of a pandemic resurgence.

The Greenback has been increasingly compromised by the growing doubts over its safe-haven status, as the Chinese economy was improving quickly while the U.S. was still facing the prospect of the second wave. The EUR/USD pair edged higher on Wednesday against the U.S. dollar despite concerns that Eurozone’s economy could be headed for an additional recession than previously forecasted.

According to E.U. Commission Vice President Valdis Dombrovski, the European economy was facing many risks, including the second wave of coronavirus. The report of the E.U. Commission indicated that the rising number of infection cases in the U.S. and other markets had deteriorated the global outlook, and it could drag the European economy with itself.

However, in the absence of Eurozone economic data on Wednesday and the presence of safe-haven demand, the investors lost confidence in the U.S. dollar because of America’s struggling economy. And with the Euro being a direct competitor of the U.S. dollar, investors turned towards it and benefited single currency Euro, which ultimately pushed the EUR/USD pair.

On Wednesday, Spain and Italy’s leaders called for a strong response from the European Union to the economic crisis triggered by COVID-19. Ten days ahead of the E.U. Summit, where leaders of member countries will try to reach a deal on 750 B euros COVID-19 recovery package and the long-term E.U. budget, Italian PM met its Spain counterpart on Wednesday. 

On the other hand, German Chancellor Angela Merkel on Wednesday urged E.U. countries to show unity and overcome differences to approve a massive coronavirus recovery plan in E.U. Summit. However, the gains were limited due to recent forecasts of and 8.7% contraction in the Eurozone economy this year. This weighed on the single currency and limited the daily gains in EUR/USD pair.

On Thursday, Euro traders will look forward to the release of German Trade data. Any improvement in the Eurozone powerhouse economy export will push the pair EUR/USD higher further. Meanwhile, the U.S. employment data will be under close observation by the traders to take fresh impetus. The EUR/USD pair will be driven by Eurozone economic data for the rest of the week. Any signs of economic recovery in the Eurozone area will provide support to the persisting gains.

Daily Support and Resistance

  • R3 1.1459
  • R2 1.1406
  • R1 1.1368

Pivot Point 1.1315

  • S1 1.1278
  • S2 1.1224
  • S3 1.1187

EUR/USD– Trading Tip

The EUR/USD pair has violated the triple top resistance level of 1.1340 level, and above this, the pair has the potential to go after the 1.1405 resistance area. A bullish breakout of 1.1405 level can extend buying until 1.1489. Stay tuned to our forex signals; we will share more signals as soon as the market shows some movement. 


GBP/USD – Daily Analysis

The GBP/USD pair was closed at 1.26092 after placing a high of 1.26229 and a low of 1.25085. Overall the movement of GBP/USD pair remained bullish throughout the day. The GBP/USD exchange rate rose for the 4th consecutive day on Wednesday and reached 1.26229 level on the back of decreased demand for the U.S. dollar and a new stimulus package from the U.K. government.

The UK Chancellor Rishi Sunak said on Wednesday that U.K. would cut VAT on hospitality as part of a 3 Billion British Pound plan to prevent mass unemployment that was caused by the coronavirus pandemic.

He also announced that the U.K. government would pay firms a 1000 pounds bonus for every staff member they kept for three months when the furlough scheme will end in October. He also announced a scheme which will give 50% off to the people dining out in August. He added that he would cut VAT on food, accommodation, and attractions from 20% to 5% from next Wednesday. Mr. Sunak warned that hardships were ahead but also vowed that no-one would be left without hope.

The Chancellor refused to extend the furlough scheme beyond October as it would provide false hope to people that they will return to their jobs. Longer, the people remain on furlough; the more likely their sill could fade.

Mr. Sunak said that the U.K. would cut stamp duty on house purchases of up to 500,000 British pounds. The government will also invest an extra 1B pound in the work & pension department to support unemployed people.

After the 30 B pound stimulus package announcement, the GBP currency got some support and lifted GBP/USD pair a little.

On Brexit front, the U.K. government was seeking to agree “special provisions” with the European Union over food supply to Northern Ireland from the U.K. This provided some optimism over the Brexit and compromised deal. However, prospects of no-deal were also there in the market as the U.K. has said that it would go for Australian-style agreement if the end of the transition period secured no deal.

Meanwhile, the U.S. dollar was under pressure as its safe-haven status was compromised due to the pandemic’s struggling American economy. The U.S. Dollar Index was slipped 0.5% at 96.40 on Wednesday and weighed on the U.S. dollar. The weak U.S. dollar in the wake of an increased number of coronavirus cases from the U.S. gave a push to the already increasing GBP/USD pair on Wednesday.

 Daily Support and Resistance

  • R3 1.277
  • R2 1.2697
  • R1 1.2654

Pivot Point 1.2581

  • S1 1.2538
  • S2 1.2465
  • S3 1.2421

GBP/USD– Trading Tip

The GBP/USD is trading with a bullish bias, especially after violating the resistance level of 1.2570 level. For now, this level is working as support, and the Cable can show further bullish bias above 1.2570 level to lead the GBP/USD pair towards 1.2680 level. The MACD and RSI are holding in a buying zone and the 50 EMA, which also supports the pair’s buying trend. The recent candles are also bullish, as it seems like the traders are looking to enter fresh long entries over 1.2630 level. Let’s consider taking buying trades today. 


USD/JPY – Daily Analysis

The USD/JPY pair was closed at 107.257 after placing a high of 107.709 and 107.200. Overall the movement of the USD/JPY pair remained bearish throughout the day. On Wednesday, at the Department of Education, U.S. Vice President Mike Pence claimed progress against COVID-19 even the infections topped 3 Million in numbers. In reply to the hiked number of cases from Florida, Arizona, and Texas, Mike Pence said that these were the early indications of a percent positive testing.

Pence joined President Trump in his push for reopening schools as it was needed not just for educating kids but also for the workforce and providing essential services. He also announced plans for new CDC guidelines after President Trump criticized public health agency for its impractical instructions to reopen schools. Donald Trump warned schools on Wednesday that if they do not open in fall 2020 due to coronavirus pandemic, he may cut off government funding.

Pence said that the national death rate from coronavirus was lowered compared to before and said that early indications for positive testing from three major states were flattening. Pence and Trump’s statement pushed he equities back into upward trend and decreased the demand for safe-haven U.S. dollar, downed the U.S. Dollar Index to 96.47 level, and added in the downward trend of USD/JPY.

The U.S. dollar was already under pressure due to the rising number of coronavirus cases, which affected the U.S. economic outlook as it was struggling heavily to fight the pandemic. This compromised the safe-haven U.S. dollar status, and hence U.S. dollar lost its demand in the market, which dragged the USD/JPY pair with itself.

However, the safe-haven Japanese Yen was stronger against the U.S. dollar on the back of increased demand for safe-haven during uncertainty related to coronavirus and positive macroeconomic data from Japan on Wednesday, which helped to add losses in USD/JPY pair. On the data front, at 4:50 GMT, the Bank Lending for the year from Japan surged to 6.2%from the forecasted5.0% and supported the Japanese Yen, which ultimately pushed the already rising USD/JPY pair prices further.

The Current Account Balance from Japan showed a surplus of 0.82T against the forecasted 0.71T and supported the Japanese Yen. At 10:00 GMT, the Economy Watchers Sentiment for June from Japan also increased to 38.8 from the forecasted 24.7 and supported Japanese Yen that added in the bearish trend of USD/JPY pair.

Support and Resistance    

  • R3 108.1
  • R2 107.91
  • R1 107.59

Pivot Point 107.39

  • S1 107.07
  • S2 106.87
  • S3 106.55


USD/JPY – Trading Tips

The USD/JPY is consolidating in a wide trading range of 107.800 to 107.250. At the moment, the pair is trading with a selling bias of below 107.80 resistance. On the hourly charts, the USD/JPY is dropping below 50 periods EMA, which supports the Japanese pair’s selling bias. It seems like we have a margin to capture quick 25 pips in USD/JPY as the pair moves within a sideways range and has odds of the testing support level of 107.250. Good luck! 

Categories
Crypto Market Analysis

Daily Crypto Review, July 9 – TikTokers Causing Dogecoin’s Surge; Cryptos Make Another Move Up

The cryptocurrency market made another slight move towards the upside in the past 24 hours. Bitcoin is currently trading for $9,414, which represents an increase of 1.39% on the day. Meanwhile, Ethereum gained 2.91% on the day, while XRP gained 3.34%.

 Daily Crypto Sector Heat Map

When talking about top100 cryptocurrencies, Holo gained 40.15% on the day, making it by far the most prominent daily gainer. Stellar (20.70%) and Nervos Network (16.73%) also did great. On the other hand, Quant has lost 11.42%, making it the most prominent daily loser. It is followed by SwissBorg’s loss of 6.36% and Cardano’s loss of 6.16%.


Top 10 24-hour Performers (Click to enlarge)

Bottom 10 24-hour Performers (Click to enlarge)

Bitcoin’s dominance level increased since we last reported, with its value currently at 63.39%. This value represents a 0.14% difference to the upside when compared to yesterday’s value.

Daily Crypto Market Cap Chart

The cryptocurrency market capitalization increased slightly when compared to when we last reported, with the market’s current value being $275.70 billion. This value represents an increase of $3.55 billion when compared to the value it had yesterday.

_______________________________________________________________________

What happened in the past 24 hours?

_______________________________________________________________________

_______________________________________________________________________

Technical analysis

_______________________________________________________________________

Bitcoin

The largest cryptocurrency by market capitalization has made another move towards the upside as bulls gathered up. The price managed to push above the descending trend line and reach just shy of $9,500 before returning down to test the newly conquered line as a support level. The line was tested successfully, and Bitcoin seems like it’s consolidating at the $9,400 level.

As mentioned yesterday, the descending line forced a move on Bitcoin, which ended up in BTC crossing to the upside. As with most BTC trades, trading confirmations and pullbacks are the safest way to profit.

BTC/USD 4-hour Chart

Technical factors:

  • Price is above its 50-period EMA and its 21-period EMA
  • Price is between the upper B.B. and middle line (20-period SMA)
  • RSI at the upper levels (65.5)
  • Increased volume (returning to average)

Key levels to the upside          Key levels to the downside

1: $9,580                                 1: $9,251

2: $9,735                                 2: $9,120

3: $9,870                                  3: $8,980

Ethereum

Ethereum made a move towards the upside as well. In fact, it broke a much stronger resistance level than Bitcoin. The ascending resistance level was broken as volume skyrocketed, but the price fell back under it during the confirmation period. However, Ethereum passed to the upside again, where it is now. It is important to note that this price level is unstable because it has not been properly confirmed, as well as because the line is moving sharply towards the upside, which Ethereum might not be able to follow for a long period of time.

Ethereum traders should look for an opportunity to trade around the ascending line (possibly when ETH falls back under it again).

ETH/USD 4-hour Chart

Technical Factors:

  • Price above the 50-period EMA and the 21-period EMA
  • Price slightly below the upper B.B.
  • RSI almost in the overbought territory (68)
  • Increased volume

Key levels to the upside          Key levels to the downside

1: $240                                    1: $228

2: $251.4                                 2: $225.4

3: $260                                     3: $217.7

Ripple

The third-largest cryptocurrency by market cap had much more uniformed moves. After days of almost no volume and volatility, the past couple of days have been extremely interesting for XRP’s price. XRP managed to break the $0.19 resistance (now support) yesterday, while its most recent spike brought its price above $0.2. However, the move got stopped at the $0.205 resistance level a couple of times, so XRP is now trading within a small range.

XRP traders can look for an opportunity to trade now since XRP is trading within a range bound by $0.2 and $0.205.

XRP/USD 4-hour Chart

Technical factors:

  • XRP in a mid-term descending trend (though it broke the trend in the short-term)
  • XRP lacks strong support levels below $0.178
  • Price is above the 21 and 50-period EMA
  • Price slightly below the upper B.B.
  • RSI is in the overbought territory (71)
  • Increased volume

Key levels to the upside          Key levels to the downside

1: $0.205                                  1: $0.2

2: $0.214                                  2: $0.19

3: $0.227                                 3:$0.178


Categories
Crypto Market Analysis

Daily Crypto Review, July 8 – BTC Will Never Be Private; XRP Skyrocketing

The cryptocurrency market has had more of a steady day as cryptos were trying to find a level to consolidate at. Bitcoin is currently trading for $9,300, which represents an increase of 0.37% on the day. Meanwhile, Ethereum gained 1.61% on the day, while XRP gained 2.43%.

 Daily Crypto Sector Heat Map

When talking about top100 cryptocurrencies, Dogecoin gained 54.43% on the day, making it by far the most prominent daily gainer. Cardano (27.36%) and VeChain (18.52%) also did great. On the other hand, SwissBorg has lost 6.68%, making it the most prominent daily loser. It is followed by KuCoin Shares’s loss of 5.48% and Verge’s loss of 4.84%.

Top 10 24-hour Performers (Click to enlarge)

Bottom 10 24-hour Performers (Click to enlarge)

Bitcoin’s dominance level decreased since we last reported, with its value currently at 63.25%. This value represents a 0.88% difference to the downside when compared to yesterday’s value.

Daily Crypto Market Cap Chart

The cryptocurrency market capitalization increased slightly when compared to when we last reported, with the market’s current value being $272.15 68.74 billion. This value represents an increase of $3.41 billion when compared to the value it had yesterday.

_______________________________________________________________________

What happened in the past 24 hours?

_______________________________________________________________________

_______________________________________________________________________

Technical analysis

_______________________________________________________________________

Bitcoin

The largest cryptocurrency by market capitalization has spent the day trying to find a place to consolidate at, as it seems like the move towards the upside ended as soon as BTC approached the descending line). While Bitcoin found support at $9,251, its support level and resistance level will soon clash, and Bitcoin will have to make a move.

Traders should look for what happens with Bitcoin’s price when the descending line forces a move on BTC.

BTC/USD 4-hour Chart

Technical factors:

  • Price is above its 50-period EMA and its 21-period EMA
  • Price is between the upper B.B. and middle line (20-period SMA)
  • RSI at the upper levels (61)
  • Average Volume

Key levels to the upside          Key levels to the downside

1: $9,251                                 1: $9,120

2: $9,580                                 2: $8,980

3: $9,735                                  3: $8,820

Ethereum

Ethereum’s is in a slightly different spot when compared to Bitcoin. While its price advances have been stopped by the non-horizontal resistance level, Ethereum’s resistance line is going towards the upside. That opens up a lot of possibilities as ETH isn’t forced to make a move, but might rather choose to follow the line up.

Ethereum traders should look for an opportunity in range trading between the immediate support and resistance levels.

ETH/USD 4-hour Chart

Technical Factors:

  • Price above the 50-period EMA and the 21-period EMA
  • Price slightly below the upper B.B.
  • RSI almost in the overbought territory (67)
  • Increased volume

Key levels to the upside          Key levels to the downside

1: $240                                    1: $228

2: $251.4                                 2: $225.4

3: $260                                     3: $217.7

Ripple

The third-largest cryptocurrency by market cap had an extremely volatile day. XRP managed to skyrocket from $0.183 all the way to $0.2 in one 4-hour candle. The move got stopped by the $0.2 resistance, under which XRP is currently consolidating. While it is highly likely that the move will end here, we might see an attempt of breaking $0.2 yet again.

XRP traders should wait and see what XRP does and look for retracements.

XRP/USD 4-hour Chart

Technical factors:

  • XRP in a mid-term descending trend (though it broke the trend in the short-term)
  • XRP lacks strong support levels below $0.178
  • Price is above the 21 and 50-period EMA
  • Price at the upper B.B.
  • RSI is in the overbought territory (79)
  • Increased volume

Key levels to the upside          Key levels to the downside

1: $0.19                                    1: $0.178

2: $0.2                                      2: $0.147

3: $0.205


Categories
Forex Market Analysis

Daily F.X. Analysis, July 08 – Top Trade Setups In Forex – Trade Plans to Follow! 

On the news side, we don’t have much to focus on due to a lack of economic events. However, the trading levels and technical outlook will be worth watching today. Crude oil inventories can drive price action in crude oil prices.

Economic Events to Watch Today 


EUR/USD – Daily Analysis

The EUR/USD pair was closed at 1.12741 after placing a high of1.13323 and a low of 1.12585. Overall the movement of the EUR/USD pair remained bearish throughout the day. The EUR/USD pair started to fall on Tuesday on the back of many factors, including negative macroeconomic data from Europe, downbeat comments from E.U. Commission, Chinese stock surge, and an increasing number of coronavirus cases across the world.

On the data front, at 11:00 GMT, the German Industrial Production for May dropped to 7.8% from the expected 11.0% and weighed on Euro. At 11:45 GMT, the French Trade Balance for May showed a deficit of 7.1B against the expected 4.5B deficit and weighed on single currency Euro and dragged the pair EUR/USD on the downside. At 13:02 GMT, the Italian Retail Sales for May surged by 24.3% from the expected 15.0% and supported single currency Euro.

On the U.S. side, at 18:59 GMT, the IBD/TIPP Economic Optimism for July dropped to 44.0 from the forecasted 48.2 and weighed on the U.S. dollar. At 19:00 GMT, the JOLTS Job Openings in May were reported as 5.40M against the expected 4.70M and supported the U.S. dollar and added further in the downward trend of EUR/USD pair.

The European Commission said on Tuesday that the E.U. would likely suffer a deeper contraction in 2020 than previously expected, while 2021 recovery will also be weaker than forecast. The E.U. Commission expected EU GDP to contract by 8.3% in 2020, and in 2021 an expansion by 5.8% was expected. However, previously the contraction was forecasted to be 7.75 in 2020, and the growth in 2021 was predicted as 6% by the commission. 

The change in the forecast was made due to the government’s slow efforts to lift lockdown measures than expected. An executive vice president of the Commission, Valdis Dombrovskis said that the lockdown’s economic impact was more severe than it was initially expected. He said that many risks were still present in the economy, including another major wave of infection. Italy, Spain, and France’s economies were expected to get the worst-hit by the pandemic this year as the GDP contraction for these were expected as 11.2%, 10.9%, and 10.6%, respectively. However, Germany’s economy was expected to contract by 6.3% this year as per the E.U. Commission’s latest forecast.

According to the commission, the worst may have passed as of May, and June’s economic data came in mostly positive. The recovery will likely gain traction in the second half of this year, while inflation was expected to average 0.3% this year and 1.1% in 2021, said by E.U. Commission on Tuesday. The downbeat forecast and comments from E.U. Commission on Tuesday weighed heavily on single currency Euro and caused the pair EUR/USD to lose almost all of its gains from yesterday.

Daily Support and Resistance

  • R3 1.1463
  • R2 1.1405
  • R1 1.1356

Pivot Point 1.1298

  • S1 1.125
  • S2 1.1191
  • S3 1.1143

EUR/USD– Trading Tip

The EUR/USD is trading above a strong support level of 1.1265 level, and closing the Doji and bullish engulfing candle above this level may drive the buying trend in the EUR/USD pair. On the higher side, the next resistance is likely to be found around the 1.1303 level. But in case, the pair violates 1.1265 support, the next support is likely to stay around 1.1225 level.


GBP/USD – Daily Analysis

The GBP/USD pair was closed at 1.25432 after placing a high of 1.25920 and a low of 1.24624. The GBP/USD pair rose for 3rd consecutive day on Tuesday and reached near 1.2600 level, highest since June 16, 2020, on the back of fresh hopes that the E.U. might compromise on fisheries policy to reach the Brexit trade deal.

British Pound rose to 3 weeks highest level on the back of news that chief Brexit negotiator of U.K. would meet the Michel Barnier ahead of the next round of talks. To discuss some of the trickier parts of negotiations, David Frost will have dinner on Tuesday night with Barnier.

The dinner between both Brexit negotiators will be seen as an opportunity for both sides to clear issues in an informal setting. As they will be informal talks, the agenda will include the range of the problems that need to reach an agreement from the level playing field, fishing waters, to governance structures.

Some other reports came in the market related to fresh hopes for the Brexit deal as the E.U. showed a willingness to compromise on fisheries policy. Michel Barnier said that Brussels would support a U.K. proposal to divide fishing quotas according to data that reflects the number of fish in Britain waters.

After the failure of last week’s round of Brexit talks, this news raised new hopes that a deal could be reached before transition periods end. This gave strength to British Pound, which ultimately pushed GBP/USD pair higher on Tuesday.

Fisheries have long been a point of argument for both sides as Britain has been asking for a system based on yearly quotas, while Brussels has said that any deal had to be part of a larger comprehensive trade agreement.

On the data front, at 12:30 GMT, the Halifax HPI for June from the U.K. came in as -0.1% against the forecasted -0.8% and supported British Pound. It ultimately raised the GBP/USD pair on Tuesday.

On the U.S. side, at 18:59 GMT, the IBD/TIPP Economic Optimism declined to 44.0 from the forecasted 48.2 in June and weighed on the U.S. dollar and supported the GBP/USD pair’s bullish trend.

At 19:00 GMT, the JOLTS Job Openings increased to 5.40M against the expected 4.70M in May and supported the U.S. dollar, which kept the gains in GBP/USD pair limited.

 Daily Support and Resistance

  • R3 1.2584
  • R2 1.2553
  • R1 1.2523

Pivot Point 1.2491

  • S1 1.2461
  • S2 1.2429
  • S3 1.24

GBP/USD– Trading Tip

The GBP/USD is trading with a bullish bias, especially after violating the double top resistance level of 1.2530 level. The same level is working as support, and the Cable can show bullish bias above this level today to lead the pair towards 1.2580 level. The MACD and RSI are holding in a buying zone and the 50 EMA, which also supports the buying trend in the pair. The recent candles are neutral, as it seems like the traders are looking to stay bullish over 1.2530 level. Let’s consider taking buying trades today. 


USD/JPY – Daily Analysis

The USD/JPY pair was closed at 107.524 after placing a high of 107.789 and 107.244. Overall the movement of the USD/JPY pair remained bullish throughout the day. The dollar edged higher against Japanese Yen on Tuesday amid negative macroeconomic data from Japan and a combination of some other factors supporting the U.S. dollar.

The rising number of COVID-19 cases in the U.S. kept the market sentiment on the upside as Florida reported 7,347 new cases, and Arizona reported 3,653 new cases on Tuesday. The second wave of coronavirus was causing a surge in the hopes for renewed lockdown restrictions in the U.S. as well. However, Australia, Spain, and Serbia imposed renewed lockdown in their areas where the spread of COVID-19 was needed to control.

The second round of lockdown restrictions from countries across the globe raised hopes that further stimulus measures will be needed from central banks to support the economy. This gave a push to U.S. Dollar prices on Tuesday, and the pair USD/JPY started posting gains.

On the data front, at 4:30 GMT, the Average Cash Earnings from Japan for the year decreased to -2.1%from the expected -0.9% and weighed on Japanese Yen. The Household Spending from Japan also decreased to -16.2% from the forecasted -11.8% and weighed on Japanese Yen and added further strength in the rising USD/JPY prices. At 10:00 GMT, the Leading Indicators from Japan remained flat with the expectations of 79.3%.

On the U.S. side, at 18:59 GMT, the IBD/TIPP Economic Optimism for July declined to 44.0 from the anticipated 48.2 and weighed on the U.S. dollar. At 19:00 GMT, the JOLTS Job Openings in May were recorded as 5.40M against the forecasted 4.70M and supported the U.S. dollar and ultimately raised USD/JPY pair further.

Meanwhile, on Tuesday, China’s foreign ministry announced that China had joined a global arms trade treaty at the U.N. that was rejected by the United States. The foreign ministry spokesman, Zhao Lijian, said that all the legal procedures to join the treaty were completed, and it will be effective after 90 days.

As per the treaty, it requires the member countries to keep records of international transfer of weapons and to prohibit cross-border shipments that could be used in human rights violations or attacks on civilians. Beijing committed to the treaty efforts on Tuesday to improve peace and stability in the world. Apart from this, reports suggested on Tuesday that scientists were calling for the WHO to acknowledge that coronavirus could spread in the air. This would change the current measures being taken to stop the virus spread.

Support and Resistance    

  • R3 108.21
  • R2 108
  • R1 107.69

Pivot Point 107.47

  • S1 107.16
  • S2 106.94
  • S3 106.63


USD/JPY – Trading Tips

The USD/JPY is consolidating in a wide trading range of 107.800 to 107.250. At the moment, the pair is trading with a selling bias of below 107.80 resistance. On the hourly charts, the USD/JPY is dropping below 50 periods EMA, which supports the selling bias in the Japanese pair. It seems like we have a margin to capture quick 25 pips in USD/JPY as the pair moves within a sideways range and has odds of the testing support level of 107.250. Good luck! 

Categories
Forex Daily Topic Forex Videos

Fundamental Analysis For Novices – German IFO Indicators

Fundamental Analysis For Novices – German IFO Indicators 

Thank you for joining our educational video four fundamental analysis for novices. In this video, we will be looking at the German IFO Indicators.


One of the absolute must-dos for traders is to routinely analyze economic data releases from governments around the world. These show the economic health of that particular nation’s economy.  This data can be found on an economic calendar such as this one.  The majority of brokers provide an economic calendar, and you should refer to it every day in order to avoid trading around times of possible extra market volatility surrounding the release of high impact economic data.
The key components of an economic calendar are the day, date and time, the actual event, the likely impact of the data, the actual data upon release, the previous data for comparison, and a market consensus of what the likely figure will be.

INSERT WHAT IS THE GERMAN IFO

This is a German business sentiment index. The data is compiled by the Munich based CESIFO Group. The institute conducts a survey of around 9000 German businesses, including manufacturing, the service sector, trade and construction, and focuses on their assessment of the business situation, including their short-term planning.  Each response is weighted according to the significance of the particular firm’s importance within the German economy. The data is compiled in such a way to reflect outcomes between – 100 and plus 100.  where the lower, the worse for the German economy and vice versa.  The IFO is a leading indicator.

Here we can see that the IFO economic indicator is due for release in 27 minutes and where the data is released in three components: business climate for June, current assessment for June, and Expectations for June.  The impact of value is medium, and that means there is a possibility that the data release can cause volatility in the market upon release.

The consensus values are highlighted and are expected to be slightly higher in each case for the previous releases for May 2020.  This means that economists and market analysts are predicting the IFO releases will be an improvement on the previous month.

This is the technical analysis of a 1-hour time frame for the euro US dollar pair just prior to the release of the IFO number.

This is the actual data release for each of the three components. While all three are better than the previous month’s figures for May, the current assessment component is slightly lower than the consensus value.

After an initial dip lower due to volatility at the time of the release, a slight bid tone returns to the pair. Traders saw a positive figure, which was above the previous release, and this was considered to be good for economic growth, and therefore traders viewed this as bullish for the Euro. A lower reading would have had the opposite effect.

A short while after the markets had time to analyze the data and listen to some negative comments, post-release, from the German finance minister, the pair pushes lower.

It is always advisable when trading around important data releases, such as the German IFO economic indicator, to wait until such time as the market has done its own analysis and then try and get on to a trend once it is started to develop.

Categories
Crypto Market Analysis

Daily Crypto Review, July 7 – Institutions Rushing Into Crypto; Lightning Network Vulnerability?

The cryptocurrency market has had a pretty volatile day, with most cryptos trying to make a move towards the upside. Bitcoin is currently trading for $9,257, which represents an increase of 0.79% on the day. Meanwhile, Ethereum gained 1.82% on the day, while XRP gained 2.2%.

 Daily Crypto Sector Heat Map

When talking about top100 cryptocurrencies, Dogecoin gained 21.58% on the day, making it by far the most prominent daily gainer. Aave (20.85%) and Bitcoin SV (15.90%) also did great. On the other hand, Bytom has lost 7.49%, making it the most prominent daily loser. It is followed by NULS’s loss of 7.25% and Synthetix Network’s loss of 3.81%.

Top 10 24-hour Performers (Click to enlarge)

Bottom 10 24-hour Performers (Click to enlarge)

Bitcoin’s dominance level decreased since we last reported, with its value currently at 64.13%. This value represents a 0.68% difference to the downside when compared to yesterday’s value.

Daily Crypto Market Cap Chart

The cryptocurrency market capitalization increased slightly when compared to when we last reported, with the market’s current value being $268.74 billion. This value represents an increase of $4.43 billion when compared to the value it had yesterday.

_______________________________________________________________________

What happened in the past 24 hours?

_______________________________________________________________________

_______________________________________________________________________

Technical analysis

_______________________________________________________________________

Bitcoin

The largest cryptocurrency by market capitalization has spent the day being quite volatile, even though it only had an average volume. Bitcoin tried to push past its $9,251 resistance level, which it did for a brief period, but then failed as the price reached a descending resistance line (dating June 01). The bulls got stopped from rising the price, and the price came back to the $9,251 level. It is still unsure whether it will end up above or below the level.

Bitcoin traders should look for whether the price will end up creating a confirmation of a move above or below the $9,251 and go from there.

BTC/USD 4-hour Chart

Technical factors:

  • Price is above its 50-period EMA and its 21-period EMA
  • Price is below the top B.B.
  • RSI at the upper levels (58.49)
  • Average Volume

Key levels to the upside          Key levels to the downside

1: $9,251                                 1: $9,120

2: $9,580                                 2: $8,980

3: $9,735                                  3: $8,820

Ethereum

Ethereum’s price movements followed Bitcoin’s almost to a tea. The second-largest cryptocurrency by market cap rose in price as bull presence intensified, reaching the price of $244 before starting to go back down. The price returned below the $240 level and is now consolidating at the $236 levels. Unlike Bitcoin, Ethereum has quite a bit of volume, which may indicate that its move isn’t over.

Ethereum traders should look for an opportunity in trading when ETH’s price hits the support levels (moving averages, horizontal support levels, etc.).

ETH/USD 4-hour Chart

Technical Factors:

  • Price above the 50-period EMA and the 21-period EMA
  • Price slightly below the upper B.B.
  • RSI almost in the overbought territory (62.8)
  • Increased volume

Key levels to the upside          Key levels to the downside

1: $228                                    1: $225.4

2: $240                                    2: $217.7

3: $251.4                                  3: $198

Ripple

The third-largest cryptocurrency by market cap broke the $0.178 resistance level as well as secured its position above it yesterday. However, the bulls wanted more, and XRP continued its “gain season.” However, it was stopped in its tracks by the $0.19 level. XRP is now consolidating between $0.178 and $0.19.

XRP traders should wait and see how XRP reacts to indicators (moving averages) and go from there.

XRP/USD 4-hour Chart

Technical factors:

  • XRP in a mid-term descending trend (though it broke the trend in the short-term)
  • XRP lacks strong support levels below $0.178
  • Price is above the 21 and 50-period EMA
  • Price is slightly below the upper B.B.
  • RSI is in the overbought territory (64.6)
  • Increased volume

Key levels to the upside          Key levels to the downside

1: $0.19                                    1: $0.178

2: $0.2                                      2: $0.147

3: $0.205


Categories
Forex Fundamental Analysis

The Impact Of ‘GDP From Agriculture’ News Announcement On The Forex Price Charts

Introduction

Economic output from the Agriculture Sector is non-negotiable for the economy. The increasing population must be fed and meet the demands of consumption at all times. Hence, the Central Government is committed to making positive growth in the Agriculture Sector. Agriculture Sector is the primary sector where Government Spending goes.

Since food is an essential commodity, it is an ever-green industry that will never run out of demand. Hence, understanding this sector can help us understand dependent industries’ performance and expenses associated with personal consumption.

What is GDP from Agriculture?

Gross Domestic Product 

GDP is the measure of a country’s total economic output. It is the total monetary value of all the goods and services produced within the country regardless of citizenship (resident or foreign national).

It is the market value of all the finished goods and services within a nation’s geographical borders for a given period. The period is generally a quarter (3 months) or a year.

Agriculture Sector

Also, it accounts for all the activities associated with crop production called the Primary Sector of an economy. From the point of cultivation to end-marketing of the food products all are accounted under the Agriculture Sector. It primarily includes farming, fishing, and forestry.

The quick increase in the world population has put pressure on the Agriculture sector to bring innovations through science and technology to increase crop yield. Agriculture Sector is the primary source of food for a country’s population.

The Agriculture Sector goes beyond farm business and includes farm-related industries like Food Service and Food Manufacturing (Packaged Foods, Processed Foods).

How can the GDP from Agriculture numbers be used for analysis?

The agriculture sector contributes about 6.4% of the World GDP. The most significant contributor to this being China, followed by India. China accounts for 19.49%, and India accounts for 7.39% of total agricultural output. The United States is in third place. 

It is necessary to understand the economic output of Agriculture is a function of population, as China, India, and the USA are ranked in population terms in the same order.

The three sectors of the economy, namely, primary Sector, secondary (Industry) Sector, and tertiary (Service) sector, contribute to the overall GDP. It is common for developed nations to have a high contribution to GDP from the Service Sector. Developing economies like China, Japan would have higher contributions from the Industry Sector. The underdeveloped economies would have Agriculture or Primary Sector as a leading contributor to GDP.

In the United States, the entire Agriculture Sector contributes about 5.4% of the GDP. The farms have only contributed 1% of GDP, and the rest is contributed to by the dependent industries that rely on agricultural input to produce goods. The Food Service, Textiles, Beverages, Processed Foods, Tobacco products, etc. contribute the remaining 4% to the GDP.

11% of the total U.S. employment is accounted for by the Agriculture Sector, which is about 22 million jobs in 2018. Food accounts for 13% expenditure of an average American Household. 

It is essential to understand that food is an essential requirement for conducting our livelihood. Hence, Government Spending first prioritizes the Agriculture Sector and releases benefit programs to assist the sector and maintain and grow its economic output. The society and Government will quickly collapse if the Agriculture Sector slows down, and that is why it is called the “Primary Sector.”

The Government Outlays on Food Programs and Nutrition Assistance exceeds that of any other federal program. Improper management and assistance to the Agriculture Sector can lead to price hikes in the food industry. It would trigger a negative response from the public that could cost them in the next elections. Hence, the Government is committed to assisting the Agriculture Sector at all times, good or bad.

Impact on Currency

GDP from Agriculture in itself is not a high impact indicator, as the broader measures like Real GDP and GDP Growth Rates are more important for the Currency Markets. 

GDP from Agriculture does not paint the full picture of the economy, but can be an essential tool for the Central Authorities to keep track of Agriculture Sector performance. Businesses dependent on Agriculture input may use this data to understand potential business opportunities amongst different countries. Still, for the International Currency Markets, it does not serve as a useful indicator.

It is a proportional and lagging indicator. Higher GDP from Agriculture is good for the economy and its currency, and vice-versa.

Economic Reports

For the United States, the Bureau of Economic Analysis releases quarterly GDP figures on its official website every quarter. The release schedule is already mentioned on the website and is generally released one month after the quarter ends.

In the full report, we can extract the GDP from Agriculture figures. We can also go through GDP by Industry to get the Construction Industry performance in the report. Major international organizations like the World Bank, CIA World Factbook, etc. actively maintain GDP by Sector figures of most countries on their official website.

Sources of GDP from Agriculture

For the United States, the BEA reports are available in the sources mentioned below. 

GDP -BEAGDP by Industry – BEAFARM – GDP

The St. Louis FRED keeps track of all the GDP and its related components in one place on its official website hereWorld Bank also maintains the Agriculture Sector as a percentage of GDP on its official websiteWe can find GDP sector composition for different countries here. We can find the consolidated list of Agriculture – GDP figures for most countries here.

Impact of the “GDP from Agriculture” news release on the Forex market

The agricultural sector plays an essential role in the process of economic development of a country. It contributes to the economic prosperity of advanced countries, and its role in the economic development of underdeveloped countries is of vital importance. In other words, countries where per capita real income is low, the emphasis is laid on agricultural and other primary industries.

History tells us that agricultural prosperity contributed considerably to the national income and the GDP. When we are talking about the impact of this contribution on the currency, we will have to say that it is least and not of much importance to investors. They look at broader data, which is the GDP, and make decisions based on the reading. 

In today’s example, we will examine the impact of GDP on different currency pairs and observe the volatility due to the news announcement. The below image shows the latest quarter GDP data of Australia, where it was more or less the same as in the quarter. Let us find out the reaction of the market to this news release.

AUD/USD | Before the announcement:

We will first look at the AUD/USD currency pair to observe the impact of GDP on the Australian dollar. In the above image, we see that the market is in an uptrend, and recently the price seems to have retraced the up move. This is an ideal chart pattern for joining the trend, but since a significant news announcement is due, we need to wait to understand the impact it creates on the chart.

AUD/USD | After the announcement:


After the news announcement, the market moves higher, where the price rises sharply above the moving average. The bullish ‘news candle’ is a consequence of better than expected GDP data, which was higher by 0.2%. Although it was marginally less than the previous quarter, it turned out to be positive for the currency. This is a confirmation sign of trend continuation where one can expect a new ‘higher high.’      

AUD/JPY | Before the announcement:

AUD/JPY | After the announcement:

The above images represent the AUD/JPY currency pair, where the market moves within a ‘range’ before the news announcement. We also notice an initial reaction from the ‘support’ where the price has moved higher from the ‘low.’ Since economists have forecasted a lower GDP estimate in the fourth quarter, it is not recommended to take a ‘long’ position before the news release.

After the news announcement, we see that the price quickly moves up, and market surges to the upside. As the GDP data was beyond expectations, traders bought Australian dollars and strengthened the currency. Therefore, the news release has a hugely positive impact on the currency pair. In this pair, once needs to be cautious before taking buy trade as the price is at the top of the ‘range.’ 

GBP/AUD | Before the announcement:

GBP/AUD | After the announcement:

The above images are that of GBP/AUD currency pair, where we see that before the news announcement, the market has retraced the downtrend by more than half, indicating that the Australian dollar has gained strength newly. After the occurrence of trend continuation candlestick patterns, it could result in a flawless sell trade. However, there is also a probability that the news release could change the dynamics of the chart.

After the news announcement, market crashes and the price significantly moves lower. As the GDP data was positive for the economy, it leads to bullishness in the Australian dollar resulting in the price fall. One could take a risk-free ‘short’ position at this point, expecting the market to move much lower.

That’s about ‘GDP from Agriculture’ and its impact on the Forex market after its news release. If you have any questions, please let us know in the comments below. Good luck!

Categories
Forex Market Analysis

Daily F.X. Analysis, July 07 – Top Trade Setups In Forex – Sideways Trading In Play! 

On the news front, the Eurozone and Switzerland may release a series of low impact events, but they are expected to have a muted impact in the market. The market will be looking towards the new signals about the recovery fund from the meeting of euro-area finance ministers on the coming Thursday before E.U. Summit on 17-18 July.

Economic Events to Watch Today 


EUR/USD – Daily Analysis

The EUR/USD pair was closed at 1.13084 after placing a high of 1.13454 and a low of 1.12407. Overall the movement of the EUR/USD pair remained bullish throughout the day. The EUR/USD pair extended its previous day gains and rose for the second consecutive day towards the nine-day highest level near 1.13460 level on the back of improved risk-sentiment and weak U.S. dollar.

At 11:00 GMT, the German Factory Orders for May decreased to 10.4% from the expected 15.1% and weighed on single currency Euro. At 13:30 GMT, the Sentix Investor Confidence for July was declined to -18.2 from the expected -10.8 and weighed on Euro. At 14:00 GMT, the Retail Sales in May from the European Union was reported to increase by 17.8% against the forecasted 15.0% and supported Euro.

Investors followed the release of Retail Sales from the E.U. and gave a push to Euro, which ultimately raised EUR/USD prices on Monday. However, the negative data from German factory orders and Sentix investor confidence capped the additional gains in EUR/USD pair.

On the U.S. dollar front, the Final Services PMI rose to 47.9 from the expected 47.0. The ISM Non-manufacturing PMI was also raised to 57.1 from the forecasted 50.0 and supported the U.S. dollar, which also limited the EUR/USD pair’s bullish move on Monday.

U.S. & Global equities surged on Monday on the back of improved U.S. Services sector data. The data showed that the U.S. services sector was regaining its pre-pandemic position. The rising global equities, including S&P 500 futures that raised almost 1.5% on Monday, pushed the risk-on market sentiment and raised EUR/USD pair. Despite positive data from the U.S., the U.S. dollar was weak across the board due to risk-on market sentiment. The U.S. Dollar Index was down by almost 0.5% at 96.852 level.

The market will be looking towards the new signals about the recovery fund from the meeting of euro-area finance ministers on the coming Thursday before E.U. Summit on 17-18 July. As Germany has the six-month rotating presidency of the European Union, It will arrange the consensus about the structure of the COVID-19 recovery fund.

Daily Support and Resistance

  • R3 1.1463
  • R2 1.1405
  • R1 1.1356

Pivot Point 1.1298

  • S1 1.125
  • S2 1.1191
  • S3 1.1143

EUR/USD– Trading Tip

The EUR/USD is stuck below the triple top resistance level of 1.1342, which can be seen on the 4-hour timeframe. On the lower side, the support stays at 1.1303 level today. A bullish breakout of 1.1342 level can trigger the continuation of a bullish trend until 1.1395, while bearish breakout of 1.1306 can open further room for selling until 1.1223 level today.


GBP/USD – Daily Analysis

The GBP/USD pair was closed at 1.24918 after placing a high of 1.25202 and a low of 1.24560. Overall the movement of GBP/USD pair remained bullish throughout the day. The GBP/USD was moving on the upside track on Tuesday but faced too much resistance. The investors were cautious about placing any strong position in the market due to Brexit negotiations that have resumed in London.

This time, the negotiations were face-to-face, and traders were hopeful that a Brexit deal could be secured, which raised the bars for British Pound in the market. However, the stakes were also high after the last round of talks ended a day earlier last week in Brussels because of profound differences between both parties.

E.U. chief negotiator Michel Barnier said that serious divergences remain, but it would be too early to say that chances of trade agreement had fallen. Even if a deal were secured, the risks of the economic impact would be significant, which will be priced into the pound.

On the other hand, U.K. chief negotiator David Frost said that while the talks continue to be constructive, there were still significant differences between the U.K. & E.U. It was a chance to have some further discussion to see what progress might be made. Britain wanted to see if there was a chance for progress in talks with the European Union this week after last week’s round of Brexit negotiations ended a day earlier due to significant differences between both sides.

However, some speculations that the U.K. could sign up to the E.U.’s compromise requests initially, with a warning, would move away from them in the future in the knowledge that the E.U. would respond with tariffs.

On the data front, at 13:30 GMT, the Construction PMI from Great Britain came in as 55.3 in June against the expected 46.0 and supported British Pound. At 13:34 GMT, the Housing Equity Withdrawal for the first quarter came in as -5.1B in comparison of the previous -5.0B and gave almost null-effect to GBP.

On late Tuesday, the British finance minister Rishi Sunak announced that he would spend 3 billion pounds to create green jobs and increase the energy performance of public buildings to kickstart the economy. This announcement helped British Pound to gain traction in the late Tuesday session and raised GBP/USD.

Meanwhile, the U.S. dollar was under pressure in the risk-on market sentiment as the reports came in about failure to contain coronavirus from many countries like India, Mexico, and specifically the United States. Weak U.S. dollar added in the upward movement of GBP/USD pair on Tuesday.

 Daily Support and Resistance

  • R3 1.2584
  • R2 1.2553
  • R1 1.2523

Pivot Point 1.2491

  • S1 1.2461
  • S2 1.2429
  • S3 1.24

GBP/USD– Trading Tip

The GBP/USD is trading at 1.249 level, and it’s finding immediate support at 1.2478 level. Closing of candles above 1.2478 level can open further room for buying until double top resistance level of 1.2530 level. While, the bullish breakout of 1.2530 level, can drive further buying in Cable until 1.2620 level. The RSI and MACD show bullish bias as the MACD and RSI are holding in a buying zone. Let’s consider taking a buy trades above 1.2441 level today.


USD/JPY – Daily Analysis

The USD/JPY was closed at 107.391 after placing a high of 107.770 and a low of 107.255. Overall the movement of the USD/JPY pair remained bearish throughout the day. The USD/JPY pair rose in the first half of the day but failed to stay at upside track and reversed its direction in the second half on the back of weak U.S. dollar in improved risk sentiment after the release of better than expected U.S. Services Sector data.

At 18:45 GMT, the Final Services PMI from the United States was released for June, which surged to 47.9 from the expected 47.0 and supported the U.S. dollar. At 19:00 GMT, the ISM Non-Manufacturing PMI came in as 57.1 against the expected 50.0 and supported the U.S. dollar, which limited the additional losses in USD/JPY pair.

The Non-Manufacturing PMI released from the ISM showed that the United States’ services sector was improved in June. It raised the U.S. equity market across the globe and added in the risk sentiment of the market weighing on the U.S. dollar, which dragged the USD/JPY pair on Tuesday towards the downside. The U.S. Dollar Index that measures the value of the U.S. dollar against the basket of six currencies dropped more than 0.5%, while U.S. 2-year Treasury yield was stuck at 0.16% and 10-year treasury yield fell from 0.71% to near 0.68%.

The positive data from the market was cheered by the investors as it indicated signs of economic recovery on the back of measures taken by the central banks from across the globe. The fact that global governments were restrained from imposing lockdown measures for the second time and preferred to contain the outbreak at the regional and local levels has helped recover the economy.

On the trade front, the U.S. Chamber of Commerce and 40 other trade associations advised the top U.S. and Chinese officials to redouble efforts to complete phase one trade deal despite the coronavirus crisis. On Monday, in a letter to U.S. Treasury Secretary Steven Mnuchin, US Trade Representative Robert Lighthizer and Chinese Vice Premier Liu He, the group said that the development in trade deal vows fortified them. Still, they called for a substantial increase in China’s purchases of U.S. goods & services.

On Coronavirus front, in the first four days of July, the 15 states of the U.S. reported a record rise in the new cases of COVID-19. Meanwhile, India, Australia, and Mexico also reported record increased number of infection cases on Monday. India beat Russia and became the country with the third-highest number of cases in the world after 25,000 new infections were recorded in a day.

Support and Resistance    

  • R3 108.21
  • R2 108
  • R1 107.69

Pivot Point 107.47

  • S1 107.16
  • S2 106.94
  • S3 106.63


USD/JPY – Trading Tips

The USD/JPY is trading with a bearish bias of around 107.560. On the two-hourly charts, the USD/JPY is gaining bullish support from the regression channel. Channel is expected to support the USD/JPY pair around 107.420 while crossing below this level can open up further room for selling until 107 and 106.850 level. The 50 EMA will also be supporting the Japanese pair at 107.300 level. However, the MACD and RSI are suggesting selling bias. Let’s keep an eye on 107.400 level to buy above and sell below this level. Good luck! 

Categories
Forex Assets

XPT/USD – How Expensive Is It To Trade This Commodity Asset Class?

Introduction

Platinum is one of the rarest precious metal found in the Earth’s crust. Only a few hundred tons are produced annually. The name Platinum is derived from a Spanish word platina (little silver).

Similar to how other precious metals like Gold and Silver are traded in the exchange market, Platinum is also actively traded in the market. Its ISO code is XPT and is highly traded against the US Dollar with the ticker XPT/USD.

Understanding XPT/USD

Platinum is a precious metal that is measured in troy ounces (Oz). The market price of XPT/USD represents the value of the US Dollar for one troy oz of Platinum. It is quoted as 1 XPT per X USD. For instance, if the current market price of XPT/USD is 814.50, then it means that each oz of Pl is worth 814.50 USD.

XPT/USD Specification

Spread

It is the difference between the bid and the ask prices. The typical spread in Platinum is usually around 700 pips.

Fee

Unlike currency pairs, Platinum is traded as a Contract for difference (CFD). There are three different types of the fee charged for such trades:

  • Commission charge
  • Overnight fee

Thus, the total fee will be,

Total fee = Spread + commission + overnight

For our example, we shall ignore the overnight fee as it completely depends on how long aa trader is willing to hold his positions. So, the revised fee will be,

Total fee = Spread + commission = 700 + 200 = 900 pips

Trading Range in XPT/USD

The trading range is a representation of volatility in the pair for different time frames in a tabular format. It gives the minimum, average, and maximum volatility in the pair for various time frames.

Procedure to assess Pip Ranges

  1. Add the ATR indicator to your chart
  2. Set the period to 1
  3. Add a 200-period SMA to this indicator
  4. Shrink the chart so you can assess a large time period
  5. Select your desired timeframe
  6. Measure the floor level and set this value as the min
  7. Measure the level of the 200-period SMA and set this as the average
  8. Measure the peak levels and set this as Max.

XPT/USD Cost as a Percent of the Trading Range

Cost as a % of the trading range illustrates the variation in the cost of trade by considering the time frame and volatility of the instrument. Mathematically, it is the ratio of the volatility value and the total cost represented in terms of a percentage.

Total fee = Spread + commission = 700 + 200 = 900 pips

Trading the XPT/USD

Platinum is one of the highly traded commodities in the exchange market. But its trading volume is lesser than Gold Spot and Silver Spot. Nonetheless, it has enough volatility and liquidity for retail traders to participate in the market.

Platinum is primarily driven by supply and demand that comes from fundamental factors. These factors are different from that of Gold and Silver, yet some do apply on Pl. When it comes to technical analysis, all the techniques apply that is used in other markets.

As mentioned, Platinum is traded as CFD, and each trade has a commission, overnight, and spread involved in it. This fee is fixed irrespective of the volatility of the market and the time frame traded. But there is a catch here. Even though the fee is fixed, the fee varies relatively. Meaning, a trader aiming high profit must pay the same fee as a trader aiming for small profits. The former is typically a large time frame trader, while the latter is a trader trading relatively smaller time frame.

Since the timeframe is something that cannot be fixed, one can relatively reduce costs by considering the volatility of the market. As the above table evidently depicts, as the volatility increases, the relative fee on the trade decreases. Thus, one must consider trading when the volatility of the pair is at or above the average volatility.

Categories
Forex Market Analysis

Daily F.X. Analysis, July 06 – Top Trade Setups In Forex – U.S. ISM Non-Manufacturing PMI

On the fundamental side, the market isn’t bustling as we only got ISM Non-Manufacturing PMI from the U.S. and BOC Business Outlook Survey from the Canadian economy. The ISM non-manufacturing may drive some price action during the U.S. session today. Overall, the technical side will play most of the role.

Economic Events to Watch Today 


EUR/USD – Daily Analysis

The EUR/USD closed at 1.12404 after placing a highof1.12510 and a low of 1.12191. he EUR/USD pair showed a little positive movement on Friday as the U.S. market was closed due to Holiday, and in the absence of American traders, EUR/USD pair followed economic data from Eurozone and COVID-19 news.

On Friday, the economic data from the Eurozone came in positive and above expectations and raised Euro above the U.S. dollar, which pushed EUR/USD pair on the upward track. On the data front, at 11:45 GMT, the French Government Budget Balance for May showed a deficit of 117.9B compared to April’s deficit of 92.1B. At 12:15 GMT, the Spanish Services PMI for June rose to 50.2 from the expected 46.0 and supported Euro. At 12:45 GMT, the Italian Services PMI was decreased to 46.4 from the expected 46.9 and weighed on Euro. 

At 12:50 GMT, the French Final Services PMI for June rose to 50.7 from the 50.3 expected and supported Euro. At 12:55 GMT, the German Final Manufacturing PMI rose to 47.3 in June from the forecasted 45.8 and supported Euro. At 13:00 GMT, the Final Services PMI from the whole bloc for June rose to 48.3 from the expected 47.3 and supported Euro.

The positive PMI data from the whole bloc except Italy gave a boost to single currency Euro at the ending day of the week and raised EUR/USD pair. However, due to a limited number of traders, the currency pair failed to provide a significant bullish move and remained in consolidation.

On the US-EU relation front, earlier this week, the E.U. declined to include the U.S. in its list of “safe-countries” that will be welcomed to enter E.U. bloc during a pandemic. However, given the unshakable alliance between both nations, in a political move, the E.U. would now open the majority of E.U. borders for some residents of the United States. It was not surprising that Americans would indeed enter the E.U. even with almost 3 million COVID-29 cases from 50 U.S. states.

On the negative side, according to European diplomats, the strained alliance of the E.U. and the U.S. would restore in Joe Biden’s presidency. The Presidency of Donald Trump has weighed on the relation of the U.S. with its closest allies, including the European Union. The attacks on International institutions like WHO by Trump have been stressful for its allies. Trump’s disliking for multilateral action has tested longstanding alliances, and European diplomats and foreign policy experts believe that Joe Biden will repair the damage done by Trump to America’s broken alliance with Europe.

This week, the consumer confidence and retail sales figures from Eurozone will be under watch from Euro traders for taking fresh impetus. The attention would also be upon the update of the Recovery fund and announcement of new Eurogroup President.

Daily Support and Resistance

  • R3 1.1339
  • R2 1.1312
  • R1 1.1298

Pivot Point 1.1271

  • S1 1.1256
  • S2 1.123
  • S3 1.1215

EUR/USD– Trading Tip

On Monday, the EUR/USD has violated in a tight range of 1.1243 – 1.1193, which has opened further room for buying until 1.1350. On the lower side, the EUR/USD may find support around 1.1290 and 1.2050. The MACD and RSI are holding in a bullish zone and are supporting the bullish bias in EUR/USD. While the 50 EMA is also supporting bullish bias in the EUR/USD pair, let’s consider taking buying trade in EUR/USD above 1.2565 level today. 


GBP/USD – Daily Analysis

 The GBP/USD closed at 1.24825 after placing a high of 1.24863 and a low of 1.24378. Overall the movement of GBP/USD pair remained bullish throughout the day. The GBP/USD pair moved higher in the risk-on market sentiment after the positive data released from China’s Services sector and continued moving in the same trend to recover some of its previous day’s losses on Friday.

The Caixin Services PMI from China rose to 58.4 in June and indicated growth in the service sector of the second-largest economy of the world. This raised the risk sentiment on the back of increased hopes for sharp V-shaped recovery after China’s positive data. Being a riskier currency pair, the GBP/USD pair moved higher in the market in an improved risk appetite.

On the other hand, the Final Services PMI from Great Britain was released at 13:10 GMT, as 47.1 against the expected 47.0 in June and provided strength to British Pound. The strong GBP pushed GBP/USD further at the ending day of the week.

In the absence of U.S. traders due to bank holiday in the United States, the pair GBP/USD followed the British Pound and Brexit news on Friday.

On Brexit front, Boris Johnson suggested that the prospect of failing to reach a Brexit trade deal before the end of the transition period would be a “very good option” for the U.K.

The remarks from PM Boris Johnson came in after the German Chancellor, Angela Merkel, warned the E.U. to be prepared for the possible failure of Brexit trade talks. She said that the progress in the negotiations and chances to reach a deal were minimal. However, PM Boris Johnson remained positive and optimistic and said that he believed that a good agreement would be reached, but if it failed, then the U.K. will have a very good option of the Australian-style deal.

The European Commissioner for trade, Phil Hogan, has said that the E.U. has not an agreement with Australian, and if the U.K. was seeking an “Australian-style” deal with the bloc, then it was a code for no-deal at all.

Meanwhile, on Saturday, PM Boris Johnson and Kenya’s counterpart, Uhuru Kenyatta, agreed to start negotiations for a post-Brexit trade agreement between the two nations. The talks will be conducted within the Kenya-UK Strategic Partnership Framework established in January and the East African Community parameters.

 Daily Support and Resistance

  • R3 1.2657
  • R2 1.2574
  • R1 1.2524

Pivot Point 1.2441

  • S1 1.239
  • S2 1.2308
  • S3 1.2257

GBP/USD– Trading Tip

The GBP/USD is trading at 1.249 level, and it’s finding immediate support at 1.2478 level. Closing of candles above 1.2478 level can open further room for buying until double top resistance level of 1.2530 level. While, the bullish breakout of 1.2530 level, can drive further buying in Cable until 1.2620 level. The RSI and MACD show bullish bias as the MACD and RSI are holding in a buying zone. Let’s consider taking a buy trades above 1.2441 level today.


USD/JPY – Daily Analysis

The USD/JPY closed at 107/475 after placing a high of 107.565 and a low of 107.434. In the absence of U.S. traders due to U.S. Bank Holiday and economic data from Japan, traders remained confused in the market due to the influence of positive data from economies and the increasing number of coronavirus cases.

The USD/JPY remained confined in a closed range and provided a slightly bearish candle at the ending day of the week due to mixed economic market sentiment. The risk sentiment was improved after the release of economic data about the Caixin Services PMI from China, which indicated an expansion in China’s services sector. 

The Caixin Services PMI rose to 58.1 in June, the highest reading in 2 months. It rose the risk appetite in the market, so the USD/JPY pair rose in the earlier trading session. The U.S. jobs figure was also improved on Thursday with 4.8M job creation in June, this also added in the risk appetite. 

However, the USD/JPY pair started moving in the reverse direction due to an increased number of coronavirus cases from across the world. The U.S. recorded more than 52,000 new cases from its 50 states on Thursday, with Florida alone accounting for over 10,000 of them. The U.S. alone was accounted for around a quarter of 10.8M global coronavirus cases. The U.S. Dollar Index that tracks the U.S. dollar value against the basket of six currencies was down 0.1% at 97.203 and dragged the USD/JPY pair on Friday.

On the US-China front, as we already know that the relation between both nations was further deteriorating over a series of issues including trade, COVID-19 pandemic, Taiwan, and Hong Kong, but on Friday, the U.S. deployed two aircraft carriers on the South China Sea which is considered as a significant show of force.

Furthermore, some reports came in that China was forcing birth control and sterilization in Uighurs to destroy the Muslim population. However, China’s foreign ministry spokesman called this news as fake.

In response to this, 75 members of the U.S. Congress sent a letter to Donald Trump urging the President to make a formal determination on whether China’s attitude towards Uighurs Muslims and other groups constituted an atrocity. These tensions raised US-China ongoing conflict and weighed on the market sentiment, which dragged the USD/JPY pair with itself.

Daily Support and Resistance    

  • R3 108.79
  • R2 108.48
  • R1 107.98

Pivot Point 107.67

  • S1 107.17
  • S2 106.86
  • S3 106.36


USD/JPY – Trading Tips

On Monday, the USD/JPY is trading with a bearish bias of around 107.560. On the two-hourly charts, the USD/JPY is gaining bullish support from the regression channel. Channel is expected to support the USD/JPY pair around 107.420 while crossing below this level can open up further room for selling until 107 and 106.850 level. The 50 EMA will also be supporting the Japanese pair at 107.300 level. However, the MACD and RSI are suggesting selling bias. Let’s keep an eye on 107.400 level to buy above and sell below this level. Good luck! 

Categories
Crypto Market Analysis

Daily Crypto Review, July 6 – Cryptos Skyrocket on Increased Volume; Bitcoin vs. the S&P 500

The cryptocurrency market has had a relatively slow weekend until 12 hours ago when the volatility skyrocketed, and cryptocurrencies started moving. Bitcoin is currently trading for $9,221, which represents an increase of 1.63% on the day. Meanwhile, Ethereum gained 2.6% on the day, while XRP gained 2.52%.

 Daily Crypto Sector Heat Map

When talking about top100 cryptocurrencies, Bytom gained 18.16% on the day, making it by far the most prominent daily gainer. ABBC Coin (11.31%) and NULS (10.89%) also did great. On the other hand, Celsius has lost 10.85%, making it the most prominent daily loser. It is followed by Loopring’s loss of 8.98% and Blockstack’s loss of 5.40%.

Top 10 24-hour Performers (Click to enlarge)

Bottom 10 24-hour Performers (Click to enlarge)

Bitcoin’s dominance level decreased since we last reported, with its value currently at 64.81%. This value represents a 0.32% difference to the downside when compared to Friday’s value.

Daily Crypto Market Cap Chart

The cryptocurrency market capitalization increased slightly when compared to when we last reported, with the market’s current value being $264.31 billion. This value represents an increase of $3.72 billion when compared to the value it had on Friday.

_______________________________________________________________________

What happened in the past 24 hours?

_______________________________________________________________________

_______________________________________________________________________

Technical analysis

_______________________________________________________________________

Bitcoin

The largest cryptocurrency by market capitalization has spent the weekend without too much volatility, mostly trading within a range bound by $8,980 and $9,120. There were a couple of occasions where the price tried to pass below the support level and one time that it tried to break above the resistance. However, the volatility skyrocketed in the past 12 hours, as Bitcoin first dropped significantly, reaching $8,900, only to recover and push to $9,200.

Bitcoin seems to be stopped at the $9,251 resistance level, and people should look for how the price movement unfolds after that. Trading when Bitcoin moves within a range, or trading breakout confirmations and pullbacks is the easiest way to net a profit.

BTC/USD 4-hour Chart

Technical factors:

  • Price is above its 50-period EMA and its 21-period EMA
  • Price is above the top B.B.
  • RSI at the upper levels (62.4)
  • Increased Volume

Key levels to the upside          Key levels to the downside

1: $9,251                                 1: $9,120

2: $9,580                                 2: $8,980

3: $9,735                                  3: $8,820

Ethereum

Ethereum’s price movements looked a lot like Bitcoin’s, except that it made an even bigger gain on the daily. The second-largest cryptocurrency by market cap had strong support at $225.4 from which it bounced up, reaching $235. However, the momentum dwindled, and Ethereum is unsure of whether it will continue its move up. For now, the price is consolidating at around $233.

Ethereum traders should look for an opportunity in trading pullbacks or confirmations from ETH contesting the trend (if it manages to reach the bottom trend line).

ETH/USD 4-hour Chart

Technical Factors:

  • Price above the 50-period EMA and the 21-period EMA
  • Price above the upper B.B.
  • RSI almost in the overbought territory (67.2)
  • Increased volume

Key levels to the upside          Key levels to the downside

1: $228                                    1: $225.4

2: $240                                    2: $217.7

3: $251.4                                  3: $198

Ripple

The third-largest cryptocurrency by market cap finally gathered enough bull presence to make a move towards the upside. Sparked up by Bitcoin’s movements, XRP broke out of the descending trend (for now) and reached past the $0.178 support level. While the move seems to be over, due to buyer exhaustion, XRP managed to reach $0.182 levels, which should make it safe from immediately falling under $0.178 (at least in the short term).

XRP/USD 4-hour Chart

Technical factors:

  • XRP in a mid-term descending trend (though it broke the trend in the short-term)
  • XRP lacks strong support levels below $0.178
  • Price is above the 21 and 50-period EMA
  • Price is above the upper B.B.
  • RSI is in the overbought territory (71.2)
  • Increased volume

Key levels to the upside          Key levels to the downside

1: $0.178                                    1: $0.147

2: $0.19                                    

3: $0.2


Categories
Forex Fundamental Analysis

Knowing The Significance Of ‘Gross National Product’ Macro Economic Indicator

Introduction

The two most important metrics of economic growth are the Gross Domestic Product (GDP) and Gross National Product (GNP). Up until 1991 the United States primarily measured its economic growth in terms of the Gross National Product and switched to Gross Domestic Product to make it easy for comparison with other countries, since many other countries were measured through the same.

But in practice, it is always necessary to assess a country’s growth in both the GDP and GNP terms to better understand the overall economic output. Hence, GNP also forms an excellent fundamental indicator of economic growth, almost as important as the GDP.

What is the Gross National Product?

Gross National Product, also called GNP, is the total monetary value of all goods and services produced by the country’s residents and businesses, irrespective of the production location. It means a business earning revenue in a foreign land is included in the domestic country’s GNP. 

Gross National Product defines the economic output based on citizenship, or that country’s native people. Hence, a citizen having an extra income source in any monetary form overseas is factored into the GNP. GNP is higher for countries that have many of their businesses established in a foreign land. Accordingly, any output generated by foreign residents within the country is excluded out from the GNP.

Gross Domestic Product (GDP) v/s Gross National Product (GNP)

It is essential to understand the difference between GDP and GNP during our analysis. GDP and GNP both measure economic output for a given period but differ in how they define the economy’s scope.

Gross Domestic Product is the total value of all goods and services produced by the nation. Here, GDP limits its assessment to the nation’s geographical borders and does not take into account the overseas economic activities of its nationals.

GNP does not restrict itself to the geography of the nation but limits itself in terms of citizenship. GDP does not reflect determinant in nationality. As long as the finished goods and services are within the country’s borders, it is included. On the other hand, GNP will not include any of the domestic borders’ revenue if it is from a foreigner.

The formula for GNP is given as:

GNP = Consumption + Investment + Government + Net Exports + Net Income

In the above equation,

  • Net Exports stands for the difference between the revenue generated from Exports and revenue going out for imports.
  • Net Income stands for the income of domestic residents from overseas or foreign investments minus net income of foreign residents from domestic investments.

The GNP is very indicative of the financial well-being of a country’s nationals and its country-based multinational corporations. From a relative perspective, it does not tell us much about the country’s health, as the GDP does. GNP is a more realistic measure of a country’s Income than its production.

To clarify the role of each metric better, consider the below examples:

Microsoft is the United States-based multinational company. It has a branch in India. The revenue generated from the Microsoft-India branch will be included in the GNP of the United States, but not in India’s GNP. On the other hand, Microsoft-India’s revenue is not included in the GDP of the United States but is included in India’s GDP.

How can the Gross National Product numbers be used for analysis?

It is essential to understand that GNP does not reflect the domestic (geographical basis) conditions well. If a natural disaster were to occur within the United States, then the GNP would not be as affected as the GDP, as the foreign revenue by its residents would not depend on the domestic situations. Hence, GDP is a more accurate measure of economic activity. On the other hand, its citizens’ financial well-being is more accurately measured through GNP than GDP.

GDP is a measure of economic health, while GNP is a measure of a nation’s Real Income. Both are different but related. A country like China, where many companies from other countries have their business has higher GDP than GNP, on the other hand, the United States, which has many of its firms’ production houses outside its land, has higher GNP than its GDP. Significant differences between the GDP and GNP values can be accounted to the openness of the countries to International Trade and Global Markets.

Impact on Currency

The Gross National Product is itself susceptible to the currency and exchange rate. When the currency falls, the Gross National Product increases due to the strengthening of other countries’ currencies where the domestic firms are doing business. The health of the economy is not gauged by the GNP accurately. Currency movements are not as driven by the GNP as they are by the GDP. Hence, it is more critical as a financial indicator than as an economic indicator in our analysis.

It is a lagging and proportional indicator, and hence the impact of the GNP is not as pronounced as the GDP, as all other countries use GDP as their primary measure of economic health. Investors, economists, policymakers, and traders all use GDP primarily over GNP to assess the economy’s current health and direction. Hence, it is a low impact indicator of our fundamental currency analysis.

Economic Reports

For the U.S., the Bureau of Economic Analysis releases quarterly reports of the Gross Domestic Product, which contains the GNP information. The St. Louis FRED consolidates the same data and maintains it on its website.

Sources of Gross National Product

The St. Louis FRED website holds the GNP data that is very easy to access and analyze, and the link is here.

GNP data for various countries can be obtained here

Impact of the “Gross National Product” news release on the Forex market

In the above section of the article, we defined the Gross National Product (GNP) and described the analysis method. We will extend our discussion and understand the impact of the Gross National Product news announcement on the value of a currency. The GNP gives an estimate of the total value of all the final products and services rolled out in a given period utilizing production owned by a country’s residents.

The GNP includes personal consumption expenditures, domestic investment, government expenditure, net exports, and Income from foreign investments. A small distinction between the GNP and GDP is that GDP measures the value of goods and services produced within the country’s borders. In contrast, GNP calculates the value of goods and services produced by the country’s citizens only both domestically and abroad. However, GNP is also one of the most commonly used indicators for measuring the country’s economy.    

In today’s example, we will analyze the impact of the United Kingdom’s GNP on the value of the Great British Pound. The below image shows the GNP in the U.K. during the fourth quarter, which was higher than the third quarter. Let us find out the impact.  

GBP/USD | Before the announcement:

We will begin our discussion with the GBP/USD currency pair to observe the change in volatility after the news announcement. The earlier image shows the state of the chart before the news announcement, where we understand the market is in a strong downtrend, and recently the price seems to be moving upwards. This could be a possible price retracement that could lead to the continuation of the trend and an opportunity. 

GBP/USD | After the announcement:

After the news announcement, the market gets very bullish, and we see a sharp rise in the price. The positive reaction from the market is a result of the upbeat GNP data, which was better than expectations. This brought cheer among the market participants who took the price higher by strengthening the British Pound. We should not take any ‘short’ position until we notice trend continuation patterns in the market.

GBP/CAD| Before the announcement:

GBP/CAD| After the announcement:

The above images represent the GBP/CAD currency pair, where in the first image, we see that the market appears to be moving within a ‘range’ with the price currently at the bottom of the ‘range.’ Before the news announcement, the currency pair is very volatile, suggesting that there is a lot of trading action in this pair. In such high volatile environment, we recommend waiting for the news release and then taking a suitable position in the pair.

After the news announcement, the price suddenly moves higher and volatility expands on the upside. The bullishness in the British Pound is a consequence of the optimistic GNP data, which showed a growth in the economy during the fourth quarter. Since the price is at the bottom of the ‘range,’ one can take ‘long’ in this currency pair with a target until the ‘resistance.’

EUR/GBP | Before the announcement:

EUR/GBP | After the announcement:

The above images are that of the EUR/GBP currency pair, where we see that the market is in a strong uptrend before the news announcement, signifying the enormous amount of strength in the British Pound, since the currency is on the left-hand side of the pair. Depending on the outcome of the news and change in volatility, we will analyze the currency pair accordingly.

After the news announcement, market crashes, so much that the price goes below the moving average. The ‘news candle’ closes, forming a reversal candlestick pattern that could lead to the beginning of a downtrend. The volatility increases to the downside as the GNP data was reasonably good.

We hope you understood what ‘Gross National Product’ is and its impact on the Forex price charts. Cheers!

Categories
Forex Videos

Forex Fundamental Analysis For Novices – The Chicago Fed National Activity Index


Fundamental Analysis For Novices – The Chicago Fed National Activity Index 


Thank you for joining our educational video four fundamental analysis for novices. In this video, we will be looking at the Chicago Fed national activity index.


If you are new to trading, one of the most important aspects of a daily trading routine is to analyse economic data releases from the government’s around the world, which reflect the health of that particular nation’s economy. This data can be found on an economic calendar such as this one. Most brokers provide an economic calendar, and you should refer to it every day in order to avoid trading around times of possible extra market volatility surrounding the release of high impact economic data.


The most important aspects of the economic calendar are the time and date of the event, the impact value, which is typically low, medium, and high, and where a high impact event is more likely to cause extra volatility upon its release. The actual data, which is updated in the calendar at the time of the release and is usually subject to an embargo. The consensus – where available – which is the anticipated actual release as put together by economists and analysts, and also the previous data which is usually released weekly, monthly, quarterly, or annually.


As we can see, the Chicago fed national activity index for May will be released at 1:30 BST on Monday, June 22nd, and the impact level is medium and where there is no consensus value, but the previous value for April was – 16.74.


Some brokers’ economic calendars will provide a brief description of the event, and here we can see that the Chicago Fed national activity index, also referred to as the CFNAI on some calendars, Is released by the Federal Reserve bank of Chicago. It is a monthly index design to gauge overall economic activity and related inflationary pressure.

In fact, the CFNAI is actually a combination of 85 indicators covering areas such as housing, personal consumption, employment, unemployment, hours worked, income, production, factory orders, and inventories.
The index measures various aspects of overall macroeconomic activity and was designed by Harvard University. The idea being that all the data can be brought together in one single point in order that policymakers can have a more focused aspect for being able to forecast inflation within the US economy.

The index has an average value of 0 and a standard deviation of 1. Traders will be looking for a positive reading which will be considered as bullish and showing that the economy is improving, but if the value is negative, it implies that the US economy is contracting or in recession and is therefore seen as bearish.


Here we can see that from as early as the 1970’s the index has been fairly tightly confined to its zero-axis. However, for the year 2020, we can see a huge spike lower to the current levels of – 16.74 for April. Of course, this can only be associated with the coronavirus pandemic, and the terrible impact it is having on the United States economy.


Traders already realise that the economy is in a bad state and that the figure is going to be well below the zero-axis. And so there will be no shocks or surprises that the figure is going to be bad. They will be looking for how greatly the number will be with regard to its divergence from the release for May.

Therefore, a lesser minus figure will show that the economy may be bouncing back and may have hit the bottom with regard to the impact from the coronavirus pandemic, and this will be seen as positive or bullish for the economy and where you would find potentially an improvement in the exchange rate for the United States dollar against its counterparts and also an uptick in us stocks and indices.
However, should the minus figure be even greater in value you and the previous release, this will show that the worst is not yet over for the US economy, and we might find that the US dollar loses value against its counterparts and stocks and indices may fall as a result.
The higher the divergence from the previous month’s figure in either direction, the greater the risk of market volatility.

Categories
Forex Market Analysis

Daily F.X. Analysis, July 03 – Top Trade Setups In Forex – U.S. Independence Day! 

A day before, the highly noticed Non-Farm Employment Change from the United States was increased to 4.8M from the expected 3.037M and supported the U.S. dollar. The Unemployment rate from the U.S. in June dropped to 11.1% from the 12.4% forecasted and helped the U.S. dollar. The news side is a bit muted today, and we may see no major even as the U.S. Banks will be closed in the observance of U.S. independence day.

Economic Events to Watch Today 


EUR/USD – Daily Analysis

The EUR/USD pair was closed at 1.12393 after placing a high of 1.13025 and a low of 1.12232. Overall the movement of the EUR/USD pair remained bearish throughout the day. The EUR/USD pair in its early trading session rose to nearly six days high on the back of increased risk appetite in the market. The increased number of jobs created from the United States in June improved market risk sentiment, which raised riskier currency pair EUR/USD pair. However, the pair failed to extend its gains and started moving in the reverse direction after the release of NFP data from the United States.

The EUR/USD currency pair remained well-supportive ahead NFP data from the U.S. due to increased hopes of renewed jobs that increased risk sentiment. After a better than expected rise in job data, the traders started following the results, which were in favor of the U.S. dollar, and the EUR/USD pair came under pressure.

The investors’ appetite was already up after the global economies’ positive data indicated faster recovery after a sharp earlier contraction. However, the second wave of coronavirus continued its fever around the market and kept a lid on investors’ appetite, which reversed the pair’s bullish trend on Thursday.

Meanwhile, the earlier gains of EUR/USD could also be attributed to the attractiveness of shared currency Euro that was under spot after the gradual reopening of the European economy despite the second wave of coronavirus. The persistent monetary stimulus from the European Central Bank and effective control of the virus spread added strength in Euro.

On data front at 12:00 GMT, the Spanish Unemployment Change in June came in as 5.1K against the forecasted -113.0K and weighed on Euro. At 13:00 GMT, the Italian Monthly Unemployment Rate was dropped to 7.8% from the forecasted 7.9% and supported Euro.

At 14:00 GMT, the Producer Price Index from the whole bloc was dropped to -0.6% in May from the expected -0.4% and weighed on Euro. The Unemployment Rate from Eurozone for May was declined to 7.4% against the expected 7.6% and supported Euro.

The Eurozone’s mixed data failed to provide any specific move to the EUR/USD pair on Thursday so, traders continued to follow the U.S. dollar signals for fresh impetus.

On the other hand, from America, the highly noticed Non-Farm Employment Change from the United States was increased to 4.8M from the expected 3.037M and supported the U.S. dollar. The Unemployment rate from the U.S. in June dropped to 11.1% from the 12.4% forecasted and helped the U.S. dollar. The U.S. dollar strength dragged the rising currency pair EUR/USD in the late session, and hence EUR/USD pair ended its day with a bearish candle.

Daily Support and Resistance

  • R3 1.138
  • R2 1.1328
  • R1 1.1289

Pivot Point 1.1237

  • S1 1.1198
  • S2 1.1146
  • S3 1.1108

EUR/USD– Trading Tip

The EUR/USD is trading in a tight range of 1.1243 – 1.1193, limiting the price action for now. On the lower side, the EUR/USD pair can drop towards 1.1145 level upon the bearish breakout of 1.1193 level, while the bullish breakout of 1.1243 level will allow us to go long. On Friday, the pair may show slow movement in the wake of the U.S. bank holiday. Anyhow, we should look for selling below 1.1295 and buying above 1.1193 level. 


GBP/USD – Daily Analysis

 The GBP/USD pair was closed at 1.24679 after placing a high of 1.25297 and a low of 1.24559. Overall the movement of GBP/USD pair remained flat but slightly bearish throughout the day. The GBP/USD pair extended its previous daily gains and rose near a one-week top on Thursday in early trading hours amid increasing risk sentiment and selling bias around the U.S. dollar.

The increased risk sentiment resulted in the positive momentum around GBP/USD pair after a potential COVID-19 vaccine by the joint efforts from German biotech firm BioNTech and U.S. pharmaceutical giant Pfizer, which gave positive results in its phase1 and phase 2 trials. This, in turn, undermined the demand for safe-haven U.S. dollar and raised GBP/USD pair towards a one-week high level.

The global risk sentiment was further supported by the U.S. monthly jobs report of Non-Farm Payroll. The positive data showed that the coronaviruses worst was probably over, and the hopes for sharp V-shaped recovery again came on board. The intraday profit-taking in GBP/USD was prompted after the risk –on market flow took its pace in the presence of persistent Brexit uncertainties.

In the latest Brexit round of talks, E.U. & U.K. officials failed to make any breakthrough on several vital issues. The negative comment from E.U. negotiator Michel Barnier that there was a still serious gap between Bloc and Britain weighed on GBP/USD pair.

The pair was further dragged in late after the release of a decreased unemployment rate from the U.S., which added strength to the U.S. dollar and dragged the GBP/USD pair with itself. At 17:30 GMT, the Non-Farm Employment Change for June showed that 4.800M jobs were created in one June, which gave strength to the U.S. dollar and dragged the GBP/USD pair from its daily gains. The Unemployment Rate from June also dropped to 11.1% from expected 12.4% and supported the U.S. dollar, which weighed on GBP/USD prices and turned the daily gins in losses.

A meeting between U.K. and E.U. negotiators scheduled for Friday this week has been delayed to next week due to divergence between them. This has raised serious doubts over securing the Brexit deal before the end of the transition period in December. This kept British Pound under heavy pressure and the pair GBP/USD on the downside on Thursday.

Daily Support and Resistance

  • R3 1.2657
  • R2 1.2574
  • R1 1.2524

Pivot Point 1.2441

  • S1 1.239
  • S2 1.2308
  • S3 1.2257

GBP/USD– Trading Tip

The GBP/USD is trading at 1.249 level, and it’s finding immediate support at 1.2478 level. Closing of candles above 1.2478 level can open further room for buying until double top resistance level of 1.2530 level. While, the bullish breakout of 1.2530 level, can drive further buying in Cable until 1.2620 level. The RSI and MACD show bullish bias as the MACD and RSI are holding in a buying zone. Let’s consider taking a buy trades above 1.2441 level today.


USD/JPY – Daily Analysis

The USD/JPY pair was closed at 107.495 after placing a high of 107.722 and a low of 107.330. Overall the movement of USD/JPY remained bullish throughout the day. At 4:50 GMT, the Monetary Base for the year from Japan surged to 6.0% from the anticipated 4.2% and supported Japanese Yen, which kept a lid on the additional gains in USD/JPY pair.

At 17:30 GMT, the Average Hourly Earnings from the U.S. fell by 1.2% from the expected decline of 0.8% and weighed on the U.S. dollar. The Non-Farm Employment Change added 4.8M jobs in June against the expected 3.037M jobs and added strength in the U.S. dollar, which raised USD/JPY pair.

The Unemployment Rate from the U.S. for June also decreased to 11.1% from the expected 12.4% and supported the U.S. dollar. The Unemployment Claims from the previous week was not in favor of the U.S. dollar as it surged to1.427M against the expected 1.35M. The Trade Balance from the U.S. showed a deficit of 54.6B against the expected deficit of 53.0B and weighed on the U.S. dollar. At 19:00 GMT, the Factory Orders from the U.S. also declined to 8.0% from the expected 8.6% and weighed on the U.S. dollar.

The Non-Farm Payroll data showed a record high number of jobs created in June by the U.S. economy raised risk sentiment in the market after the hopes of sharp V-shaped economic recovery emerged due to a rise in NFP. It raised USD/JPY riskier assets across the board on Thursday, but the gains started to fell after the release of other economic data. The negative reports related to unemployment claims, factory orders, and trade balance from the U.S. exerted pressure on USD/JPY pair on Thursday.

Daily Support and Resistance    

  • R3 108.79
  • R2 108.48
  • R1 107.98

Pivot Point 107.67

  • S1 107.17
  • S2 106.86
  • S3 106.36


USD/JPY – Trading Tips

The USD/JPY is trading with a bearish bias of around 107.560. On the two-hourly charts, the USD/JPY is gaining bullish support from the regression channel. Channel is expected to support the USD/JPY pair around 107.420 while crossing below this level can open up further room for selling until 107 and 106.850 level. The 50 EMA will also be supporting the Japanese pair at 107.300 level. However, the MACD and RSI are suggesting selling bias. Let’s keep an eye on 107.400 level to buy above and sell below this level. Good luck! 

Categories
Crypto Market Analysis

Daily Crypto Review, July 3 – IRS Wants to Track Lightning Transactions and Privacy Coins; Cryptocurrencies Facing Boundaries

The cryptocurrency market has gone through the day trying to make moves to the upside, but mostly ending up in the red. Bitcoin is currently trading for $9,102, which represents a decrease of 1.2% on the day. Meanwhile, Ethereum lost 0.78% on the day, while XRP lost 0.05%.

 Daily Crypto Sector Heat Map

When talking about top100 cryptocurrencies, Kyber Network gained 13.60% on the day, making it by far the most prominent daily gainer. ICON (10.43%) and VeChain (6.68%) also did great. On the other hand, The Midas Touch has lost 11.52%, making it the most prominent daily loser. It is followed by Bitcoin Gold’s loss of 7.81% and Compound’s loss of 6.81%.

Top 10 24-hour Performers (Click to enlarge)

Bottom 10 24-hour Performers (Click to enlarge)

Bitcoin’s dominance level decreased slightly since we last reported, with its value currently at 65.13%. This value represents a 0.17% difference to the downside when compared to yesterday’s value.

Daily Crypto Market Cap Chart

The cryptocurrency market capitalization decreased slightly when compared to yesterday, with the market’s current value being $260.59 billion. This value represents a decrease of $2 billion when compared to the value it had yesterday.

_______________________________________________________________________

What happened in the past 24 hours?

_______________________________________________________________________

_______________________________________________________________________

Technical analysis

_______________________________________________________________________

Bitcoin

The largest cryptocurrency by market capitalization has spent the past day struggling to keep its current level after failing to break $9,251. As the volume increased greatly, Bitcoin managed to approach $9,251 and contest it, but only for a short period of time before falling all the way to $8,935. Its price is now stabilizing at around $9,050.

As we said in our yesterday’s article, traders should be wary of trading Bitcoin just based on its momentum as you never without confirmation. They should rather watch for confirmations or pullbacks and trade those (and those that did had a great trade yesterday).

BTC/USD 4-hour Chart

Technical factors:

  • Price is below its 50-period EMA and its 21-period EMA
  • Price is between the Lower B.B and the Middle B.B. (20period SMA)
  • RSI below the middle point (44.4)
  • Increased Volume (Coming back to normal)

Key levels to the upside          Key levels to the downside

1: $9,251                                 1: $9,120

2: $9,580                                 2: $8,980

3: $9,735                                  3: $8,820

Ethereum

Ethereum had quite a bad day, as Bitcoin’s move towards the downside pulled its price down as well, making it leave the ascending trade channel it was in. After falling out of the channel, Ethereum found support in the $225.4 support level, which held up nicely. The price is now moving up, possibly contesting the channel soon.

Ethereum traders should look for an opportunity in trading pullbacks or confirmations from ETH contesting the trend.

ETH/USD 4-hour Chart

Technical Factors:

  • Price below the 50-period EMA and the 21-period EMA
  • Price at the Middle B.B. (20-period SMA)
  • RSI below the middle point (48.8)
  • Increased volume (Coming back to normal)

Key levels to the upside          Key levels to the downside

1: $228                                    1: $225.4

2: $240                                    2: $217.7

3: $251.4                                  3: $198

Ripple

The third-largest cryptocurrency by market cap is continuing its path towards the downside by following the descending trading channel. XRP doesn’t have enough volume to tackle any resistance levels, and it seems that it is just bouncing off of the bottom and top channel lines.

There aren’t many XRP trading opportunities at the moment, but traders could sneak in a trade or two tradings this ranging move XRP is performing.

XRP/USD 4-hour Chart

Technical factors:

  • XRP in a mid-term (and short-term) descending trend
  • XRP lacks strong support levels below $0.178
  • The upside is guarded by the 21 and 50-period EMA
  • Price is at the Middle B.B. (20 SMA)
  • RSI is below the middle point (47.9)
  • Average (extremely low) volume

Key levels to the upside          Key levels to the downside

1: $0.178                                    1: $0.147

2: $0.19                                    

3: $0.2


Categories
Forex Daily Topic Forex Fundamental Analysis

Understanding ‘Retail Sales MoM’ Fundamental Forex Driver

Introduction

The Month-over-Month Retail Sales figures are one of the closely watched statistics in the financial markets and have a lot of volatility in the markets around these figures. An increase in sales is one of the earliest signs of growth for businesses that can imply a multitude of things for the economy. It is a closely watched high impact leading indicator. Hence, an understanding and analysis of Retail Sales are paramount for our fundamental analysis.

What is Retail Sales Month-over-Month?

Retail Sales

In the purest sense, it is just the dollar amount of purchase of goods and services made by end-consumers for a given period. Here, the period is MoM, which stands for Month-over-Month. It is the sale of durable and non-durable goods at the retail outlets to consumers.

It can also be defined as the purchase of finished goods and services by consumers and businesses. The goods and services have reached the end of the supply chain. The chain generally starts with the manufacturer or provider and ens up at the retailer where the general population or other businesses consume it.

The Retail Sales figures are often presented in two ways: including and excluding auto and gas sales. As the Auto (vehicle purchase) figures and Oil prices fluctuate frequently, the exclusion helps to identify the trends better once the volatile components are removed. The excluded version is called the Core Retail Sales report.

Retail Sales statistic covers the in-store (retail) sales, catalog sales, and out-of-store sales of durable (goods that last more than three years) and non-durable goods (that have short-life span). The major categories include:

Retail Stores have the following categories:

How can the Retail Sales MoM numbers be used for analysis?

The Retail Sales figures provide us a reliable measure of CURRENT economic activity. It is essential to an objective assessment of the need for and impact of a broad range of policy decisions. Hence, the policymakers use this statistic to keep a pulse-check on the economy’s health.

The Retail Sales figures are significant statistics for many as the Consumer Spending makes up 66% of the United States Gross Domestic Product. The remainder is from Government Spending, Business Spending, and Net Exports. It is also essential as it represents the end of the supply chain figures. All the statistics that precede the Retail Sales figures like Inventory Changes or Manufacturing Production figures all lead up to the Retail Sales, which confirms and triggers the next wave in the trend change in the other indicators, in a feedback loop.

In other terms, once Retail Sales figures improve, businesses see an increase in their revenue and correspondingly demand their products, which leads to an increase in their Manufacturing Production figures, and that would later translate to Change in Inventory statistics. So, we see how the Retail-Sales figure operates amongst the economic indicators in a feedback loop cyclical pattern.

Once Retail Sales figures improve, businesses see profits that encourage expansionary plans, that would increase investment in their business, employment, or even wage growth. It is necessary to understand, Sales improve business, once business improves, wage growth or employment increase is a possibility. Hence, the Retail Sales figure is an essential leading macroeconomic indicator for our fundamental analysis.

The US Bureau of Economic Analysis releases quarterly GDP statistics. If the Month-over-Month Retail Sales figures have been influential, then there is a good chance that the GDP print will be higher. The only downside to the Retail Sales figures that we need to be careful of is that it does not account for inflation, and the increase in the Retail Sales figures could also be a by-product of inflation.

To be noted: The Retail Sales figures are seasonal. It generally tends to increase around the holiday season. Hence, care must be taken during analysis that the decline in stats is due to a business slowdown or seasonal effects. In this case, the Retail Sales figures Year-over-Year is also another parameter that we can use to compare the current conditions with the preceding year to understand the growth trend better, as the GDP is also compared with the last year.

Although data is available in the seasonally adjusted format, to account for the seasonal patterns but it does not adjust for inflation. Hence, it is essential for users of the data to check for the seasonally adjusted figures.

Impact on Currency

Retail Sales is a leading macroeconomic high impact indicator. An increase in Retail Sales is the first sign of growth for businesses in monetary terms. Due to a multitude of economic factors that are affected by the Retail Sales figures, the volatility around the release of these figures is generally high.

It is a proportional indicator, meaning that a consistent or significant increase in the Retail Sales figures translates to increased profits for the businesses, indicates reasonable Consumer Confidence and Consumer Spending, and in turn it will also translate to increased employment, and wage growth. It is a cyclical effect that further promotes spending, and business booms and the economy prospers. It translates to higher GDP prints, which is appreciating for the currency.

Low Retail Sales figures are indicative of a slowdown of business, bearish Consumer Sentiment, where consumers are saving more and spending less. It stagnates the businesses, in the worst case, could lead to lay-offs, and ultimately recession. It will translate to lower GDP prints, which is depreciating for the currency.

Economic Reports

In the United States, the Census Bureau publishes monthly reports of the Retail Sales figures on its official website under the section “Monthly Retail Trade.” The report is released at 8:30 AM about two weeks after the reference month (13-15th day of the month). The schedule for the year is already posted on the website for the user’s convenience. The report details the total sales, percentage changes, and also YoY (Year-over-Year) changes.

Sources of Retail Sales MoM

  • The Month-over-Month Retail Sales statistics can be found here
  • Both advance estimates and Retail Sales figures are available in aggregated format in St. Louis FRED website here
  • We can find Retail Sales monthly figures for various countries here

Impact of the ‘Retail Sales – MoM’ news release on the Forex market

In the previous section of the article, we understood the Retail Sales economic indicator and its consequences on the economy. We will take this discussion forward in identifying the impact of Retail Sales on the value of the currency. Retail Sales is an important economic indicator because consumer spending drives much of our country.

When consumers spend more, the economy tends to hum along, whereas if consumers are uncertain about their financial future, they hold off their purchases that lead to the slow down of the economy. The release of Retail Sales numbers is said to have a large impact on the currency, as shown in the below image.

In this section, let’s analyze the Retail Sales data of the Unites States that was gathered in the month of March. The below image shows that there was a big drop in the Retail Sales compared to the previous month indicating a major disruption in the economy. Let’s see how the market reacts to this data.

USD/JPY | Before the announcement

We will start with the USD/JPY currency pair to witness the impact of the news announcement. The above image shows the state of the chart before the news announcement, where we see that the overall trend of the market is up, and currently, the price is on the verge of continuation of the trend. Depending on the impact of the news, we will position ourselves in the currency pair.

USD/JPY |  After the announcement

After the news announcement, there is a surge in the price, and volatility jumps to the upside. Even though the Retail Sales were very poor in the month, the market reaction was opposite to what was expected. After the news release, traders bought US dollars and strengthened the currency much more. The bullish ‘news candle’ shows the impact of the news on the currency. Since the market reacted very positively to the data, we should take a ‘buy’ trade only after a price retracement.

EUR/USD | Before the announcement

EUR/USD | After the announcement

The above images represent the EUR/USD currency pair, where we see that the market is in a significant downtrend indicating the great amount of strength in the US dollar. The price is currently is at its lowest point, which means we need a pullback in the market to join the trend. If the news announcement results in a retracement of the price, this could be taken as an opportunity for taking a ‘short’ trade.

After the news announcement, the market moves lower, and volatility increases to the downside. Although the Retail Sales data was weak, it did not result in weakening of the currency, but rather the US dollar strengthened. This means the news data was not bad enough to turn the markets to the upside. We will still be looking to enter the market only after a price retracement to a key technical level.

USD/CAD | Before the announcement

USD/CAD | After the announcement

The above price charts are of the USD/CAD currency pair, where we see that the market is aggressively moving up with almost no price retracement. This indicates the US Dollar is very strong, or the Canadian dollar is weak. In any case, we will join the trend only if the price retraces to a ‘support’ or ‘demand’ area.

After the news announcement, volatility expands on the upside, and the price closes, forming a bullish ‘news candle.’ Here too, the Retail Sales data has an opposite impact on the currency as the market reacts positively to the data even though the Retail Sales were largely lower in this quarter. It is advised not to chase the market after the news release since it against the rules of risk management.

We hope you understood Retail Sales MoM fundamental Forex driver and the relative impact of its news announcement on the Forex price charts. Cheers!

Categories
Crypto Market Analysis

Daily Crypto Review, July 2 – Paypal Using Crypto? Bitcoin Preparing For a Move

The cryptocurrency market has spent the day attempting to break its immediate resistance levels. Bitcoin is currently trading for $9,202, which represents an increase of 0.56% on the day. Meanwhile, Ethereum gained 1.57% on the day, while XRP gained 0.66%.

 Daily Crypto Sector Heat Map

When talking about top100 cryptocurrencies, Synthetix Network gained 22.77% on the day, making it by far the most prominent daily gainer. Kyber Network (16.35%) and Aave (14.66%) also did great. On the other hand, Celsius has lost 9.71%, making it the most prominent daily loser. It is followed by Compound’s loss of 9.57% and SwissBorg’s loss of 4.86%.

Top 10 24-hour Performers (Click to enlarge)

Bottom 10 24-hour Performers (Click to enlarge)

Bitcoin’s dominance level decreased slightly since we last reported, with its value currently at 65.30%. This value represents a 0.06% difference to the downside when compared to yesterday’s value.

Daily Crypto Market Cap Chart

The cryptocurrency market capitalization increased slightly when compared to yesterday, with the market’s current value being $262.59 billion. This value represents an increase of $3.11 billion when compared to the value it had yesterday.

_______________________________________________________________________

What happened in the past 24 hours?

_______________________________________________________________________

_______________________________________________________________________

Technical analysis

_______________________________________________________________________

Bitcoin

The largest cryptocurrency by market capitalization has spent the past day trying to reach above its $9,251 resistance level. As the volume increased, Bitcoin managed to tackle this level, but only for a short period of time. The price didn’t manage to stay above $9,251, and Bitcoin moved below it yet again. It is now consolidating right below it.

Traders should be wary of trading Bitcoin just based on its momentum. They should rather watch for confirmations or pullbacks and trade those.

BTC/USD 4-hour Chart

Technical factors:

  • Price is above its 50-period EMA and its 21-period EMA
  • Price is above the Middle B.B. (20period SMA)
  • RSI above the middle point (55.5)
  • Increased Volume (Coming back to normal)

Key levels to the upside          Key levels to the downside

1: $9,251                                 1: $9,120

2: $9,580                                 2: $8,980

3: $9,735                                  3: $8,820

Ethereum

Ethereum was also ready to move to the upside in the past 24 hours, which it did a bit more successfully than Bitcoin. The second-largest cryptocurrency by market capitalization gathered up buyers and tried to reach higher levels (though not necessarily to break any resistance levels like $240 is too far away. However, it got stopped in its tracks around the $233 mark, where the price hit the newly-formed trend upper line.

Ethereum traders should have an easy time trading within the boundaries of the newly-formed trend.

ETH/USD 4-hour Chart

Technical Factors:

  • Price above the 50-period EMA and the 21-period EMA
  • Price right above Middle B.B. (20-period SMA)
  • RSI above the middle point (52.7)
  • Increased volume

Key levels to the upside          Key levels to the downside

1: $228                                    1: $225.4

2: $240                                    2: $217.7

3: $251.4                                  3: $198

Ripple

The third-largest cryptocurrency by market cap is continuing its path towards the downside by following the descending trend line. XRP doesn’t have enough volume to tackle the $0.178 level at the moment, so its moves are either to the downside or right to the resistance level.

There aren’t many XRP trading opportunities at the moment, but most of them are completely straightforward, as they are always accompanied by sharp increases in volume.

XRP/USD 4-hour Chart

Technical factors:

  • XRP in a mid-term descending trend
  • XRP lacks strong support levels below $0.178
  • The upside is guarded by the 21 and 50-period EMA
  • Price in a narrow range between the Middle B.B. (20 SMA) and Lower B.B.
  • RSI is below the middle point (47)
  • Average (extremely low) volume

Key levels to the upside          Key levels to the downside

1: $0.178                                    1: $0.147

2: $0.19                                    

3: $0.2


Categories
Forex Market Analysis

Daily F.X. Analysis, July 02 – Top Trade Setups In Forex – U.S. NFP Under Spotlight! 

The broad-based U.S. dollar drew offers on the day, possibly due to the modest upbeat trading sentiment backed by the hopes of further stimulus and upbeat outcome of the global PMIs. However, the losses in the greenback could be short-lived or temporary as the second wave of coronavirus continuously picking up pace in the U.S., which boosts the safe-haven demand in the market.

Although, the losses in the U.S. dollar turned out to be one of the key factors that kept a lid on any additional losses in the gold prices as the price of gold is inversely related to the price of the U.S. dollar. Whereas, the U.S. Dollar Index that tracks the greenback against a basket of other currencies dropped 0.04% to 97.118 by 11:30 PM. Brace for U.S. NFP figures today.

Economic Events to Watch Today 


EUR/USD – Daily Analysis

The EUR fell below the bottom of our expected 1.1200/1.1270 area recently (low of 1.1183) ere catching back up to 1.1274. Despite the speedy bounce, the skyward drive has slightly improved. Nevertheless, EUR can bind nearer to 1.1290. For now, 1.1330 isn’t expected to challenge this level until the NFP comes out to be negative. Support is at 1.1225 followed by 1.1200

On the data front, at 11:45 GMT, the French Consumer Spending for May increased to 36.6% from the expected 30.0% and supported Euro. The French Prelim CPI for June dropped negative to -0.1% from the forecasted 0.4% and weighed on Euro, which ultimately dragged the EUR/USD pair with itself. At 14:00 GMT, the CPI Flash Estimate for the year increased to 0.3% from the expected -0.1% and supported Euro. The Core CPI Flash Estimate for the year remained flat with the projected 0.8%. The Italian Prelim CPI also remained flat with the expectations of 0.1% in June.

On the other hand, from the United States, the S&P/CS Composite-20 HPI increased to 4.0% from the expected 3.8% and supported the U.S. dollar for the year. At 18:45 GMT, the Chicago PMI dropped to 36.6 from the anticipated 45.0 and weighed on the U.S. dollar. At 19:00 GMT, the C.B. Consumer Confidence rose to 98.1 from the expected 91.6 and supported the U.S. dollar added in the downfall of EUR/USD pair on Tuesday.

The U.S. Fed chairman, Jerome Powell, provided a gloomy and unexpectedly uncertain outlook for the biggest economy of the world, which weighed on the U.S. dollar and supported the EUR/USD currency pair.

Later today, the course of the breakout will probably be determined by the U.S. payrolls release, which is anticipated to confer the economy appended 3,000K jobs in June following May’s 2509K expanding. The unemployment claims, too, are projected to grow to 7.7% in June from 7.3% in May. Meantime, Average Hourly Earnings are supposed to have grown by 5.3% year-on-year in June, indicating a strike from May’s increase of 6.7%. 

Daily Support and Resistance

  • R3 1.138
  • R2 1.1328
  • R1 1.1289

Pivot Point 1.1237

  • S1 1.1198
  • S2 1.1146
  • S3 1.1108

EUR/USD– Trading Tip

The EUR/USD is trading below a strong resistance level of 1.1285 level, closing candles below this level, and suggesting chances of selling bias until the 1.1218 level. Continuation of selling trend under 1.1280 level can extend bearish movement unto 1.1195 level today. Alternatively, a bullish breakout of the 1.1285 level can continue buying until the 1.1350 level. Mixed sentiments play as investors are waiting for the U.S. NFP and Unemployment figures, which are due later today. 


GBP/USD – Daily Analysis

During the Asian session, the GBP/USD takes stairs to 1.2485, up 0.06% on a day, while heading into the London open on Thursday. The Cable lately profited from the U.S. dollar’s lazy moves ahead of the key U.S. jobs announcement for June. Nevertheless, Brexit distress and concerns of more job declines in the U.K. have shielded the quote’s immediate bullish move.

The lack of consensus over the key Brexit concerns forced German Chancellor Angela Merkel to respond, “The European Union (E.U.) obliges to be equipped for the probability that they may not be ready to meet an alliance with the United Kingdom (U.K.).” This major news exhibits the downbeat performance of the EU-UK exit discussions in Brussels. Besides acting as the Brexit-negative sign could be the news from the U.K. Express indicating that higher than 300 EU vessels will be counted as an attack of British waters following no-deal departure.

According to Haldane, the risks of the economic outlook were considerable and two-sided. He added that the risks were more evenly balanced in June than in May and remained skewed. The views that the U.K. economy was on track for V-shaped recovery gave strength to the British Pound and pushed the GBP/USD pair on the upward track.

The strong rebound in the Pound could also be attributed to the little signs of progress on the latest post-Brexit talks. E.U. Negotiator Michel Barnier criticized Britain for choosing not to extend the deadline for the transition period that will end on Dec.31. He also said that Britain was trying to secure as many single markets as possible while showing little compromises on key sticking points, including the level playing field, security, and fisheries.

On the U.S. front, the course of the breakout will probably be determined by the U.S. payrolls release, which is anticipated to confer the economy appended 3,000K jobs in June following May’s 2509K expanding. 

Daily Support and Resistance

  • R3 1.2657
  • R2 1.2574
  • R1 1.2524

Pivot Point 1.2441

  • S1 1.239
  • S2 1.2308
  • S3 1.2257

GBP/USD– Trading Tip

The GBP/USD is trading with a bullish bias as the dollar is getting weaker ahead of the U.S. NFP figures. The GBP/USD is trading at 1.249 level, and it’s finding immediate support at 1.2478 level. Closing of candles above 1.2478 level can open further room for buying until double top resistance level of 1.2530 level. While, the bullish breakout of 1.2530 level, can drive further buying in Cable until 1.2620 level. The RSI and MACD show bullish bias as the MACD and RSI are holding in a buying zone. Let’s consider taking a buy trades above 1.2441 level today.


USD/JPY – Daily Analysis

The Japanese yen saw significant outflows into overseas investments towards the end of the month but could all come back on the risks of a second wave impact on U.S. stocks. Some states in the U.S. have reversed the reopening of economies and closed their businesses on fears of a second wave of coronavirus. The U.S. Federal Reserve Chairman Jerome Powell warned on Tuesday that the second wave of coronavirus outbreak would damage consumer confidence and weaken the economy.

He was cautious that during the second outbreak, the government and people could withdraw again from the economic activity. He added that the worst part of the second wave would be the downward impact on public confidence, which could play a crucial role in getting back to economic activity.

In Republican Arizona, gyms bars, movies, and theatres and water parks were shut down for at least 30 days. These institutions were reopened in middle May, but after the rise in the infected cases across the country, the government announced to shut them down.

The health care professionals in Houston have urged residents to remain at home, wear masks, and cancel gatherings in the wake of intensified virus cases. The residents of Houston also received an emergency alert on their phones to stay home as virus infections have spiked in the town. Later today, the focus will stay on the U.S. NFP to determine further moves in the USD/JPY pair. 

Daily Support and Resistance    

  • R3 108.79
  • R2 108.48
  • R1 107.98

Pivot Point 107.67

  • S1 107.17
  • S2 106.86
  • S3 106.36


USD/JPY – Trading Tips

On Thursday, the USD/JPY is trading with a bearish bias of around 107.560. On the two-hourly charts, the USD/JPY is gaining bullish support from the regression channel. Channel is expected to support the USD/JPY pair around 107.420 while crossing below this level can open up further room for selling until 107 and 106.850 level. The 50 EMA will also be supporting the Japanese pair at 107.300 level. However, the MACD and RSI are suggesting selling bias. Let’s keep an eye on 107.400 level to buy above and sell below this level. Good luck! 

Categories
Forex Signals

Daily F.X. Analysis, July 01 – Top Trade Setups In Forex – ADP Non-farm In Highlights! 

On the news front, the primary focus will stay on the ADP non-farm payroll figures, which are expected to be positive. If the actual data also comes out positive, we are going to see sharp selling in gold. Conversely, the negative data can drive selling the dollar and buying in gold.

Economic Events to Watch Today 


EUR/USD – Daily Analysis

The EUR/USD closed at 1.12333 after placing a high of 1.12616 and a low of 1.11908. Overall the movement of the EUR/USD pair remained flat but slightly bearish throughout the day. The pair EUR/USD moved in sideways during Tuesday’s trading session and ended the day with some losses. The greenback was strong throughout the day ahead of Fed chair Jerome Powell’s speech and weighed on EUR/USD pair. However, after the speech, the U.S. dollar became weak, and the EUR/USD pair recovered some of its daily losses.

On the data front, at 11:45 GMT, the French Consumer Spending for the month of May increased to 36.6% from the expected 30.0% and supported Euro. The French Prelim CPI for the month of June dropped negative to -0.1% from the forecasted 0.4% and weighed on Euro, which ultimately dragged the EUR/USD pair with itself.

At 14:00 GMT, the CPI Flash Estimate for the year increased to 0.3% from the expected -0.1% and supported Euro. The Core CPI Flash Estimate for the year remained flat with the projected 0.8%. The Italian Prelim CPI also remained flat with the expectations of 0.1% in June.

On the other hand, from the United States, the S&P/CS Composite-20 HPI increased to 4.0% from the expected 3.8% and supported the U.S. dollar for the year. At 18:45 GMT, the Chicago PMI dropped to 36.6 from the anticipated 45.0 and weighed on the U.S. dollar. At 19:00 GMT, the C.B. Consumer Confidence rose to 98.1 from the expected 91.6 and supported the U.S. dollar added in the downfall of EUR/USD pair on Tuesday.

The U.S. Fed chairman, Jerome Powell, provided a gloomy and unexpectedly uncertain outlook for the biggest economy of the world, which weighed on the U.S. dollar and supported the EUR/USD currency pair.

The increased number of infected cases from many states of the U.S. raised alarming bells, and some states again started to shut down economic activity. The second outbreak forced people to stay in their homes once again and keep them away from the labor market after hurting their confidence level. According to Powell, full consumer confidence was vital to full economic recovery. Euro investors will be looking forward to the release of Germany’s Unemployment Rate figures for June on Wednesday for fresh impetus.

Daily Support and Resistance

  • R3 1.1241
  • R2 1.1235
  • R1 1.1229

Pivot Point 1.1223

  • S1 1.1217
  • S2 1.1211
  • S3 1.1205

EUR/USD– Trading Tip

The EUR/USD is trading below a strong resistance level of 1.1245 level, closing candles below this level, and suggesting chances of selling bias until the 1.1218 level. Continuation of selling trend under 1.1218 level can extend selling unto 1.1195 level today. Alternatively, a bullish breakout of the 1.1245 level can continue buying until 1.1289. Mixed sentiments play as investors are waiting for the U.S. ADP figures, which are due later today. 

GBP/USD – Daily Analysis

The GBP/USD pair was closed at 1.24002 after placing a high of 1.24016 and a low of 1.22574. Overall the movement of GBP/USD pair remained bullish throughout the day. The Pound raised against the dollar after clawing back early day losses on Tuesday amid the suggestion by Bank of England that the U.K. was on track for a stronger than expected rebound after the worst slump in more than 40 years in the first quarter of 2020.

At 11:00 GMT, the Current Account Balance from the United Kingdom showed a deficit of 21.1B against the expected deficit by 15.2B and weighed on British Pound. The Final GDP for the first quarter dropped to -2.2% against the forecasted -2.0% and weighed on British Pound. The Revised Business Investment for the quarter also came in as -0.3% from the 0.1% and weighed on British Pound.

In an earlier trading session on Tuesday, GBP/USD remained under pressure due to poor than expected data from Britain’s side. However, after the positive comments from the chief economist from the Bank of England, the pair GBP/USD gained traction.        

On Tuesday, Andy Haldane said that recent signs suggested that Britain was on course for V-shaped economic recovery from the coronavirus-induced lockdowns, but there was still a risk of high & persistent unemployment.    

According to Haldane, the risks of the economic outlook were considerable and two-sided. He added that the risks were more evenly balanced in June than in May and remained skewed.  

The views that the U.K. economy was on track for V-shaped recovery gave strength to the British Pound on Tuesday and pushed the GBP/USD pair on the upward track.

The strong rebound in the Pound could also be attributed to the little signs of progress on the latest post-Brexit talks. E.U. Negotiator Michel Barnier criticized Britain for choosing not to extend the deadline for the transition period that will end on Dec.31. He also said that Britain was trying to secure as many single markets as possible while showing little compromises on key sticking points, including the level playing field, security, and fisheries.

On the U.S. front, the dollar was weak across the board after the speech of Federal Reserve Chairman Jerome Powell, who provided an uncertain and gloomy outlook for the U.S. economy due to an increased number of infected cases in the U.S. that had forced the renewed lockdown measures in some states. The weak U.S. Dollar added in the gains of the GBP/USD currency pair on Tuesday.

Daily Support and Resistance

  • R3 1.2381
  • R2 1.2367
  • R1 1.2354

Pivot Point 1.234

  • S1 1.2327
  • S2 1.2313
  • S3 1.23

GBP/USD– Trading Tip

On Wednesday, the GBP/USD is trading with a bearish bias as the dollar is getting strong, perhaps due to the positive forecast of ADP figures. The GBP/USD is trading at 1.2375 level, and it’s finding immediate support at 1.2358 level. Closing of candles below 1.2404 level can open further room for selling until 38.2% Fibo level of 1.2340 level. But the bullish breakout of 1.2400 level can drive buying in Cable and can lead its prices towards the next target level of 1.2504 level. The RSI and MACD show diverse opinions as the MACD is in a selling zone, while the RSI is in a buying zone. Let’s consider taking a selling trades below 1.2400 level and buying above the same. 

USD/JPY – Daily Analysis

The USD/JPY was closed at 107.925 after placing a high of107.982 and a low of 107.519. At 4:30 GMT, the Unemployment Rate from Japan increased to 2.9% against the forecasted 2.8% in May and weighed on Japanese Yen that pushed USD/JPY pair higher. At 4:50 GMT, the Prelim Industrial Production was dropped by 8.4% in May against the expected drop of 5.6%, it weighed on Yen and supported USD/JPY pair.

The Japanese yen saw significant outflows into overseas investments towards the end of the month but could all come back on the risks of a second wave impact on U.S. stocks. Some states in the U.S. have reversed the reopening of economies and closed their businesses in the fears of the second wave of coronavirus. The U.S. Federal Reserve Chairman Jerome Powell warned on Tuesday that the second wave of coronavirus outbreak would damage consumer confidence and weaken the economy.

He was cautious that during the second outbreak, the government and people could withdraw again from the economic activity. He added that the worst part of the second wave would be the downward impact on public confidence, which could play a crucial role in getting back to economic activity.

In Republican Arizona, gyms bars, movies, and theaters and water parks were shut down for at least 30 days. These institutions were reopened in middle May, but after the rise in the infected cases across the country, the government announced to shut them down.

The health care professionals in Houston have urged residents to remain at home, wear masks, and cancel gatherings in the wake of intensified virus cases. The residents of Houston also received an emergency alert on their phones to stay home as virus infections have spiked in the town.

Daily Support and Resistance    

  • R3 107.39
  • R2 107.31
  • R1 107.27

Pivot Point 107.19

  • S1 107.14
  • S2 107.07
  • S3 107.02

USD/JPY – Trading Tips

On Wednesday, the USD/JPY is trading with a bearish bias of around 107.560. On the two-hourly charts, the USD/JPY is gaining bullish support from the regression channel. Channel is expected to support the USD/JPY pair around 107.420 while crossing below this level can open up further room for selling until 107 and 106.850 level. The 50 EMA will also be supporting the Japanese pair at 107.300 level. However, the MACD and RSI are suggesting selling bias. Let’s keep an eye on 107.400 level to buy above and sell below this level. Good luck! 

Categories
Forex Fundamental Analysis

The Impact Of ‘GDP Constant Prices’ News Announcement On The Forex Market

Introduction

GDP Constant Prices is the primary indicator used by Government Agencies, Economists, Investors, Traders for year-to-year analysis of economic progress. GDP Constant Prices is the real scorecard for a country’s progress. 

It is a national level indicator and is closely watched by the market. The most important fundamental indicator Real GDP Growth Rate is derived from GDP Constant Prices. Hence, overall it is very critical for us to understand GDP Constant Prices and its nuances for correct interpretation.

What is GDP Constant Prices Indicator?

Gross Domestic Product (GDP) 

GDP is the measure of a country’s total economic output. It is the total monetary value of all the goods and services produced within the country regardless of citizenship (resident or foreign national).

Nominal GDP is also called Current Dollar GDP. It is the market value of all the finished goods and services within a nation’s geographical borders for a given period. The period is generally a quarter (3 months) or a year.

The commonly used term “size of the economy” refers to this economic indicator. USA has the world’s biggest economy, which means it has the highest nominal GDP or highest economic output.

GDP Constant Prices

It is the inflation-adjusted GDP value. It is the total monetary value of all goods and services produced, excluding the effects of inflation in prices. It is also called Real GDP, Constant Dollar GDP, Inflation-Corrected GDP, or only Constant Prices. The raw value of the economic output is called the Nominal GDP, whereas Real GDP accounts for inflation effects and is a more accurate measure of growth.

GDP Constant Prices or Real GDP is obtained by dividing the Nominal GDP with a GDP deflator. The GDP deflator is an inflation measurement from a fixed base year. Real GDP is inflation-adjusted to compare on an as-if basis with the base year GDP. It means GDPs are compared as if the prices remained the same as the base year and see if the GDP has improved due to increased economic activity.

Calculating GDP Deflator is a bit tedious process, that is best left to the experts like the Bureau of Economic Analysis. The Real GDP is made up of the following components and is affected by them:

A) Consumer Spending: It represents spending associated with the end-consumers or the general population. It makes up about 69% of the total GDP in the United States.

B) Business Investment: Economic Output of the Business Sector makes up 18% of the total GDP in the United States. 

C) Government Spending: It involves all the expenditures incurred by the Government to maintain and stimulate economic growth and run its operations. It accounts for 17% of the total economic output for the United States.

D) Net Exports: It is the difference between the total exports and imports. The United States has a -5% Net Exports of the total GDP, meaning it is a net importer.

How can the GDP Constant Prices numbers be used for analysis?

Inflation is the underlying fire that drives capitalist economies. In general, a low inflation rate of 2-3 % a year is good for the economy. A stable inflation rate of 2-3% will stimulate economic growth to achieve a 3-5% annual GDP growth for developed economies.

As prices increase year-over-year, the economic output will also seem inflated even though it is the same as the previous year. Hence, Real GDP is a more accurate measure of scoring the economic output of a country.

Nominal GDP is useful when comparing economic output within a year among different quarters, while it is more sensible to use Real GDP for year-over-year comparison. Policymakers use both Nominal and Constant Prices GDP for economic assessment and implementing policy reforms as deemed necessary.

When inflation is positive (which is the cast most of the time), the GDP Constant Prices will be lesser than Nominal GDP. When there is deflation in the economy (during slowdowns or recessions), the GDP Constant Prices may be higher than the nominal GDP value.

GDP Constant Prices is better for assessing long-term growth, or knowing whether the economy has grown over the previous year or not. With Nominal GDP, it is difficult to tell whether an increase in the figures is due to an expanding economy or just a factor of inflating prices of goods and services.

Impact on Currency

GDP data is essential for almost everyone. Economists use for macroeconomic analysis and Central Bank planning. Policymakers are committed to maintaining a steady Real GDP Growth. Hence, Central Authorities also watch it tightly.

Investors make decisions based on GDP data. Businesses hold their expansion plans based on economic stability and market stability, as indicated by GDP. Traders heavily trade once GDP estimates and actual figures are published.

Hence, overall it is a high impact indicator. It is a proportional macroeconomic indicator, meaning higher GDP Constant Prices are suitable for the overall economy and currency. The opposite also holds. 

Lower Real GDP prints indicate weakening economy, businesses hold hiring or investment plans, spending is reduced, and in extreme cases, it can lead to a recession. All of this leads to currency depreciation.

Economic Reports

In the United States, the Bureau of Economic Analysis publishes quarterly and annual Nominal and Real GDP reports on its official website. It is released almost 30 days after a quarter ends. The schedule of release is available on the website. The headline number is the GDP Constant Prices figure, GDP Growth Rate figure.

Major international organizations like the World Bank, International Monetary Fund, OECD, etc. actively maintain track of most countries’ GDP figures on their official website.

Sources of GDP Constant Prices

For the United States, the BEA reports are available here 

The St. Louis FRED keeps track of all the GDP and its related components in one place on its official website here:

GDP & GNP – FRED

Real GDP – FRED

The World Bank GDP Constant Prices with base year as 2010 in US Dollar terms are available here:

GDP Constant Prices (2010 US$) – World Bank

OECD – GDP Constant Prices and other variants

We can find a consolidated list of most countries’ GDP Constant Prices here.

Impact of the ”GDP Constant Prices” news release on the Forex market

GDP Constant Prices, also known as real GDP, is a measure of GDP that has been adjusted for the price level. Current prices measure the GDP using the actual prices we notice in the economy. Current prices make no adjustments for inflation. However, constant prices adjust to the effects of inflation. Using persistent prices enables us to measure the actual change in the outcome and not just rise due to inflation’s effects. The real GDP is calculated by dividing nominal GDP over a GDP deflator. When nominal is higher than real, inflation is occurring, and when real is higher than nominal, deflation is occurring. Fundamentally speaking, nominal GDP matters to investors when taking a position in currency or the stock market.      
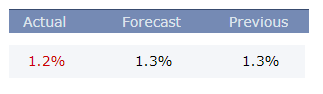
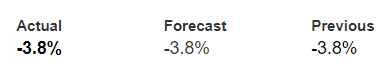
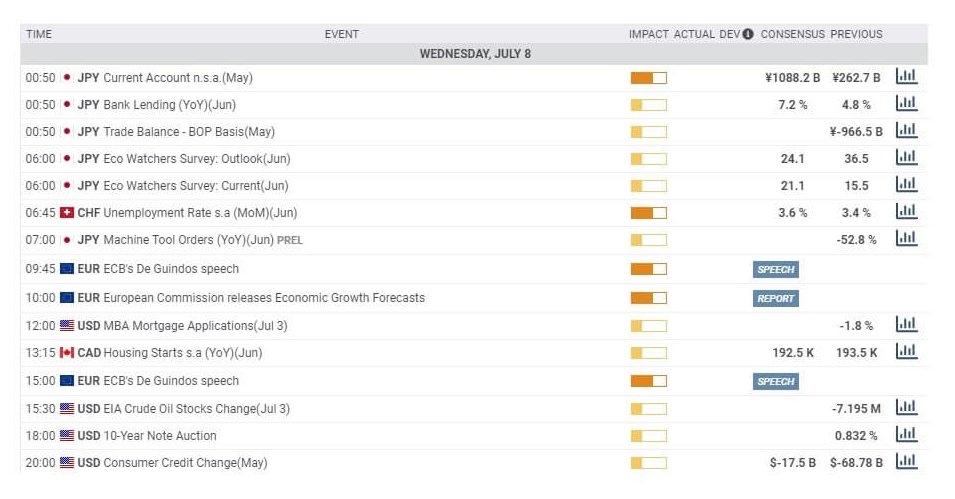
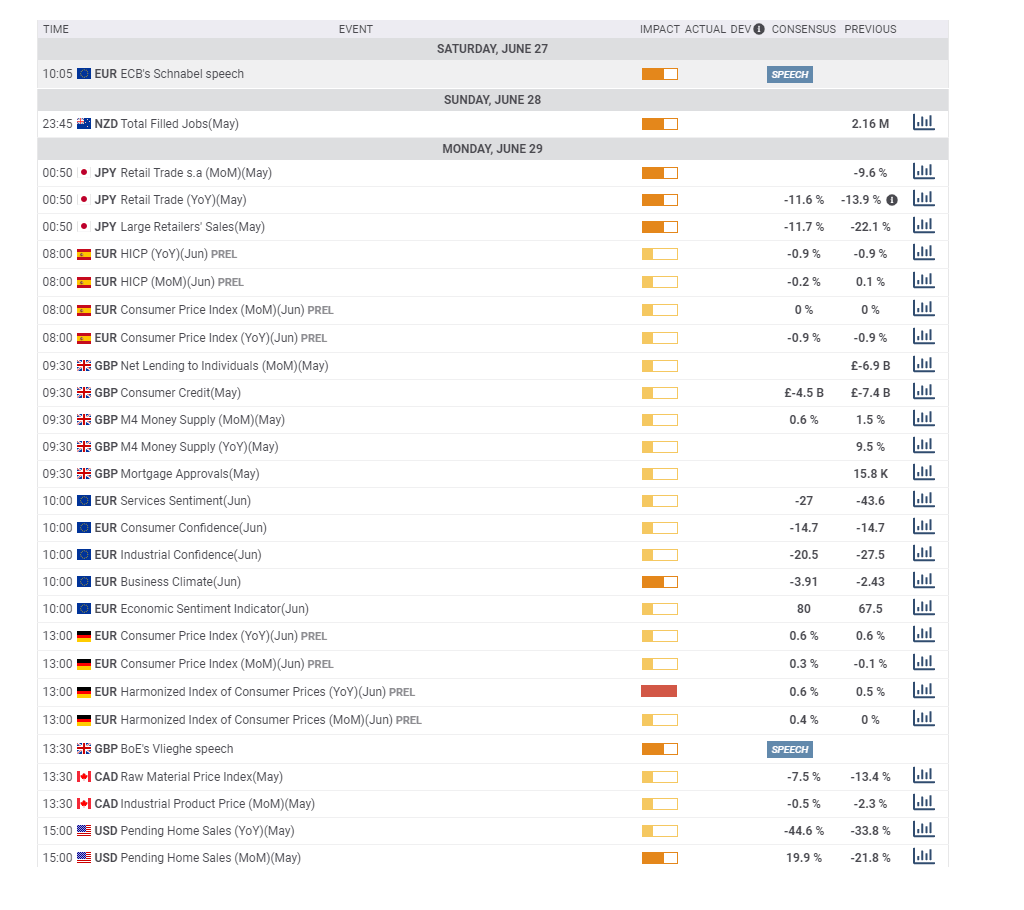
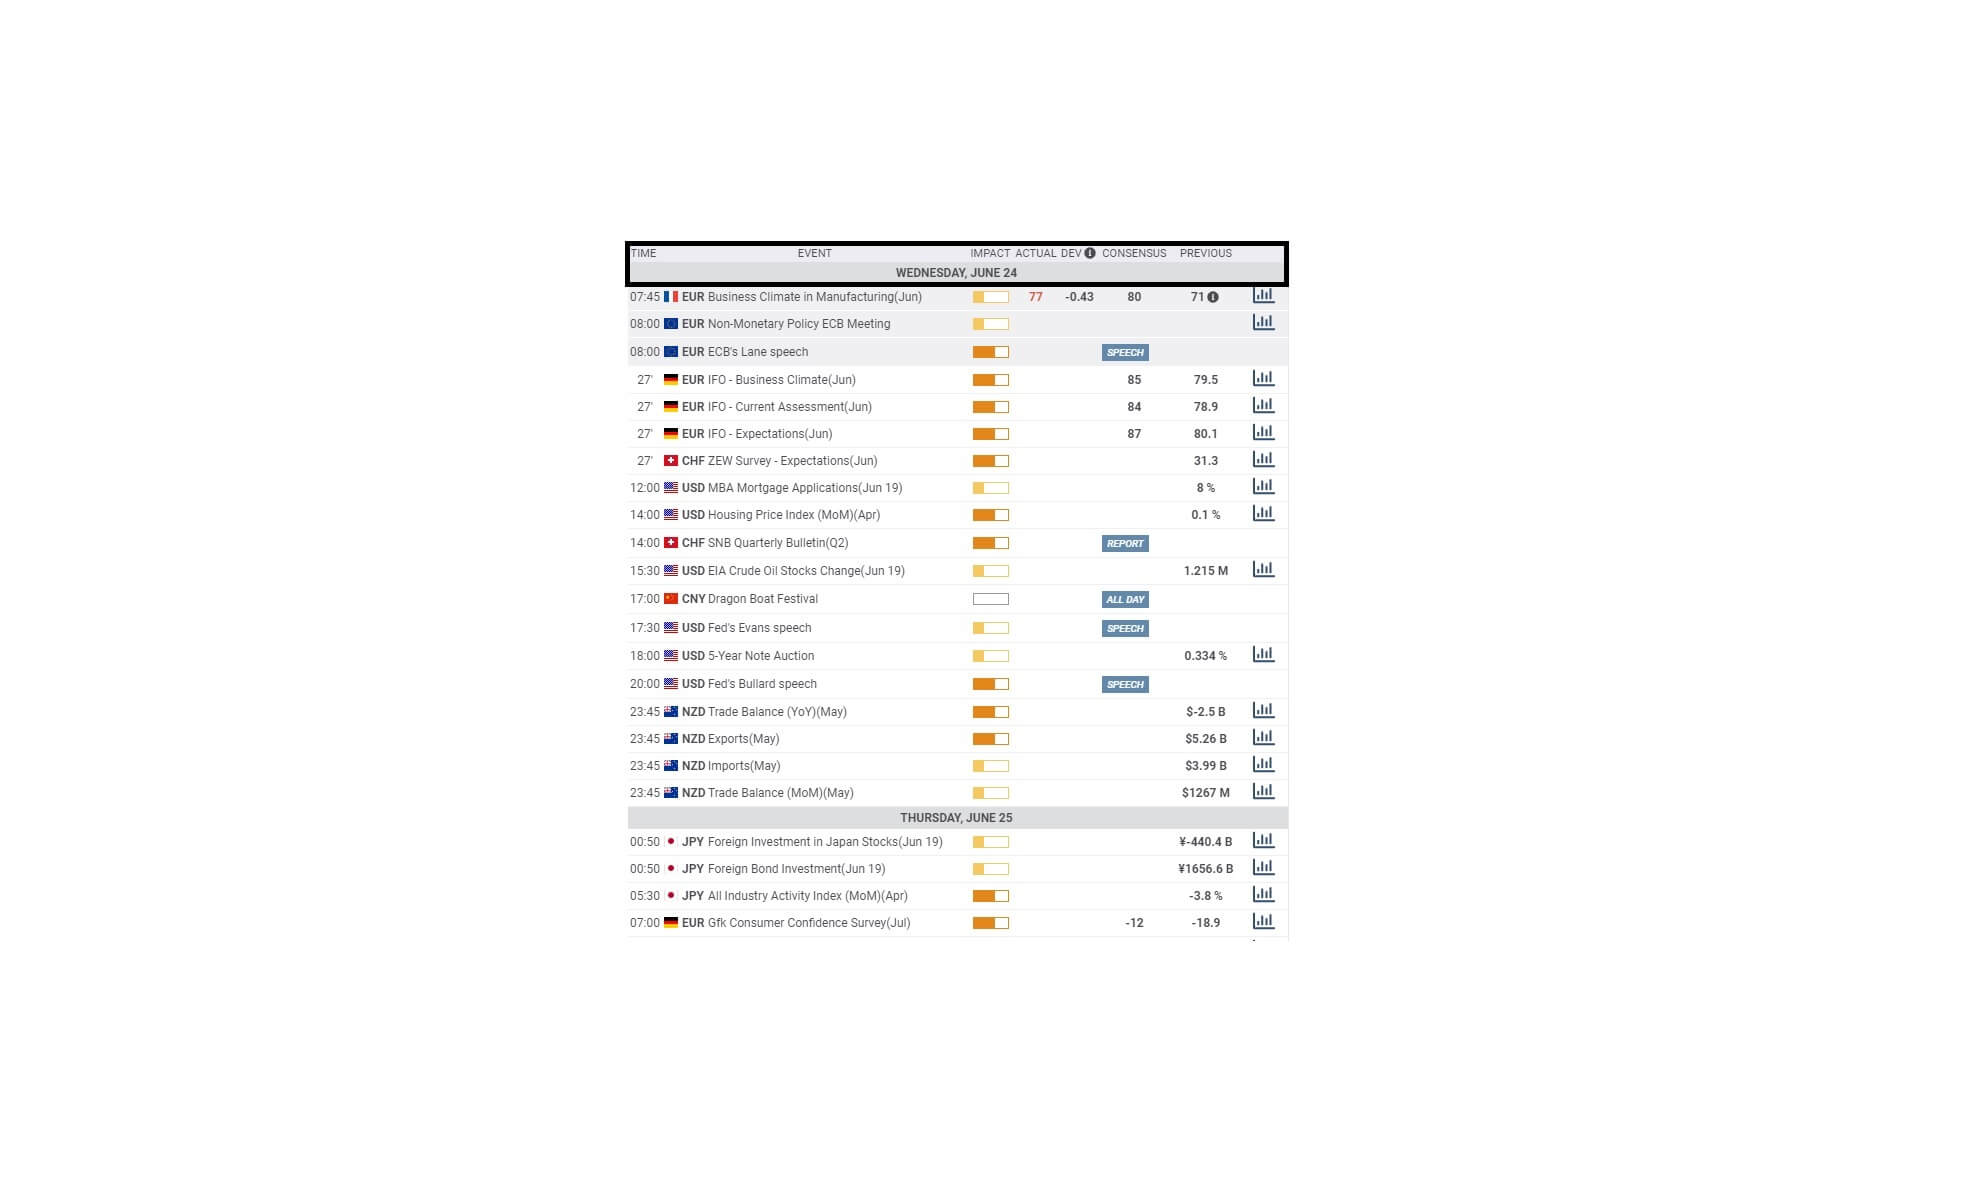
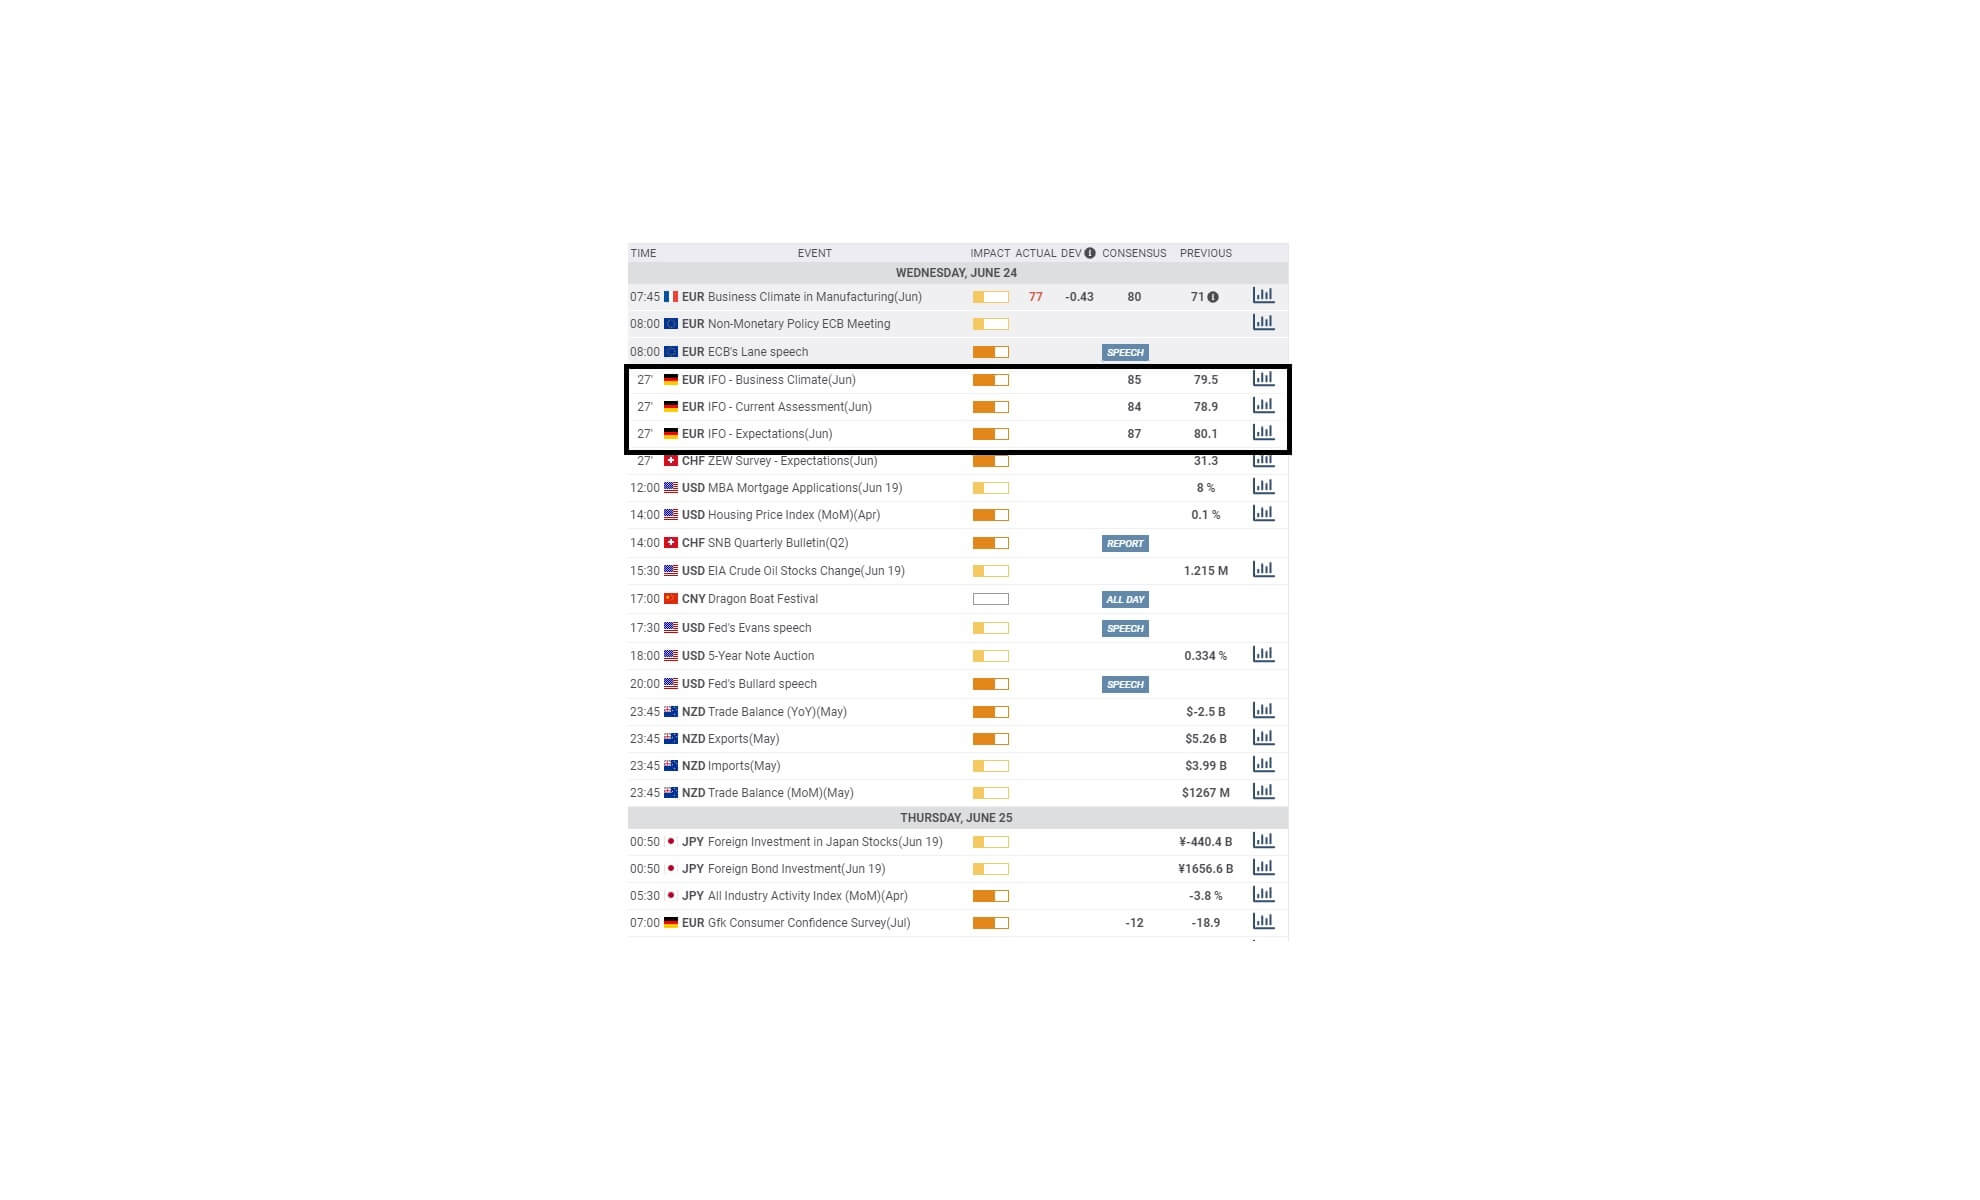
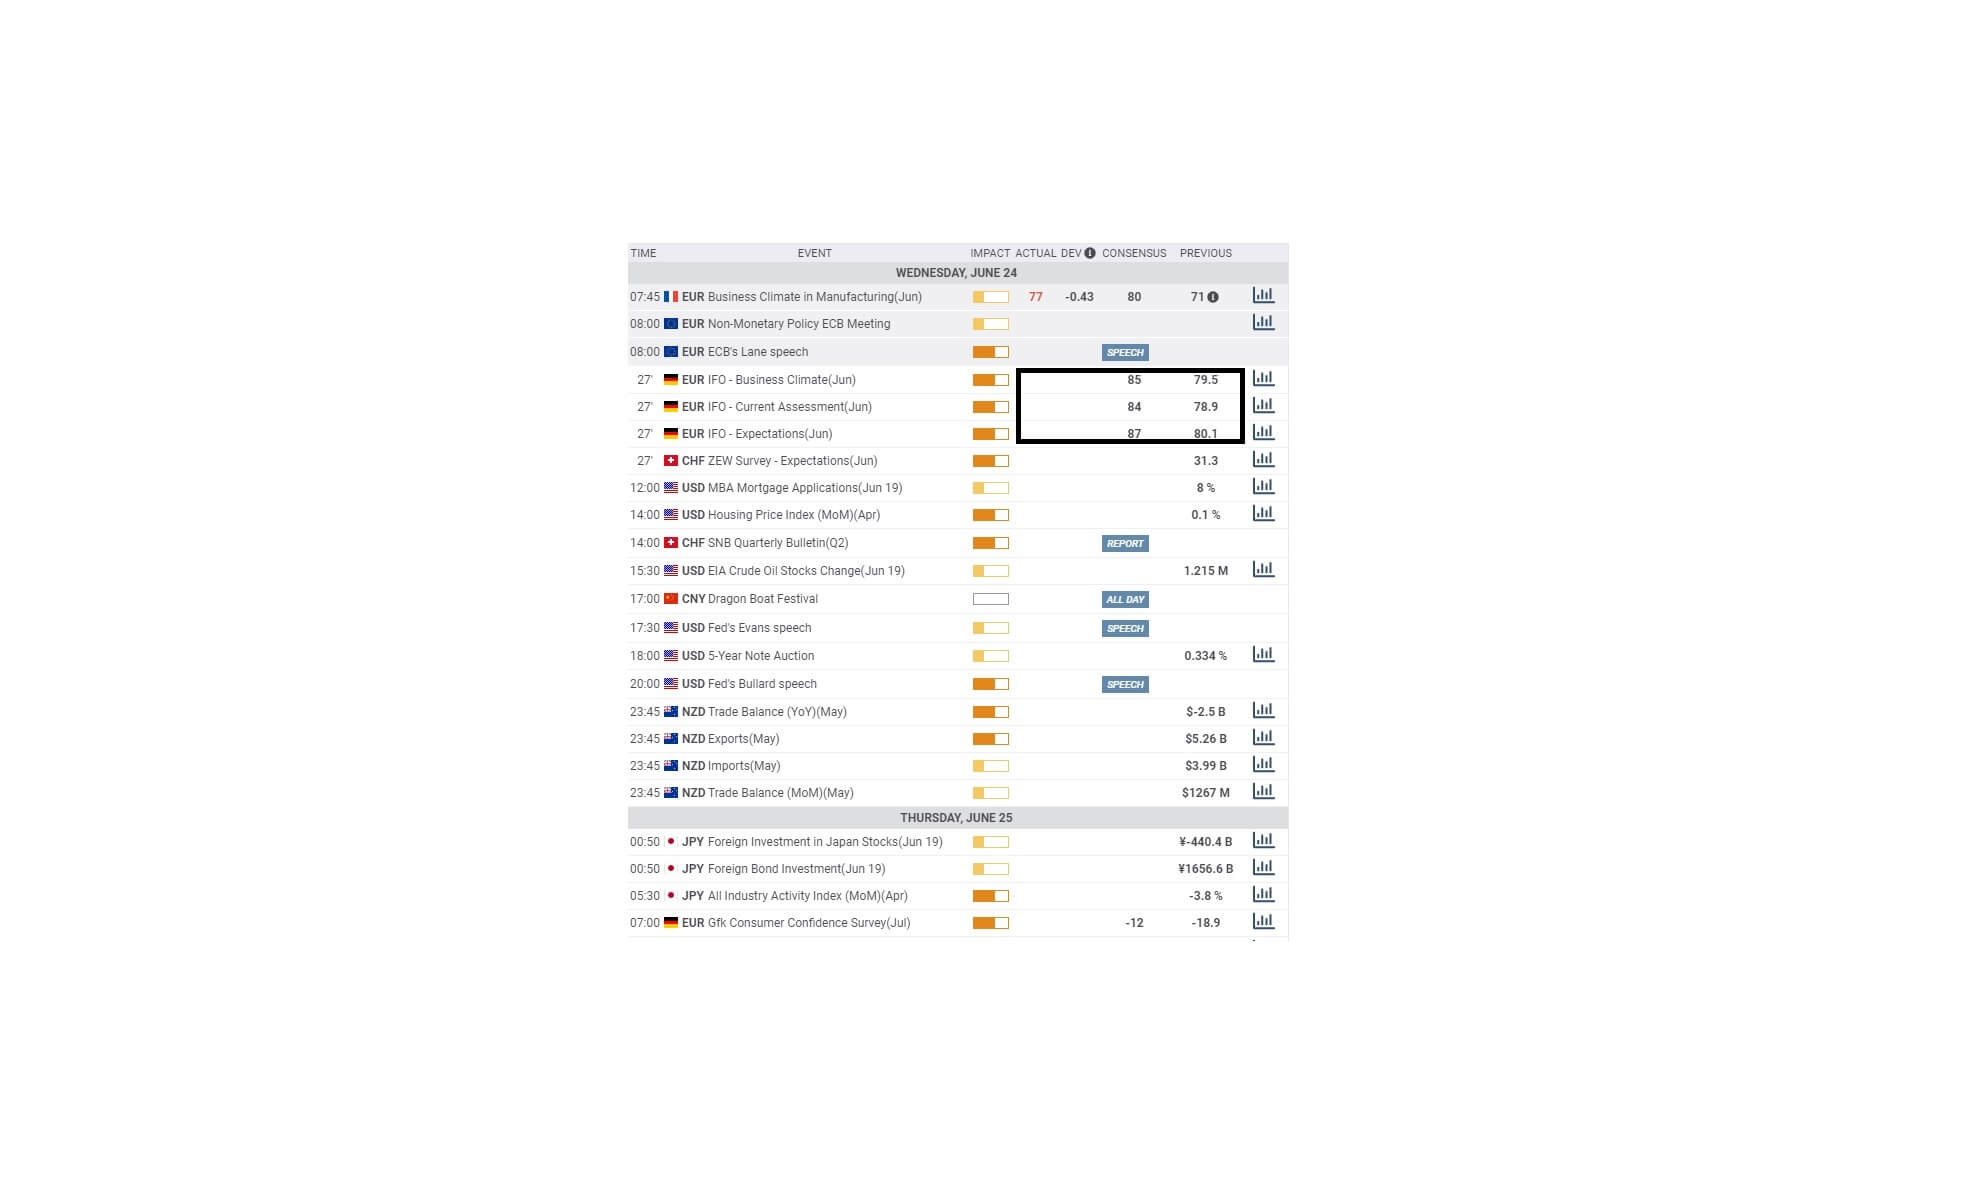
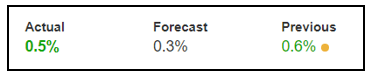
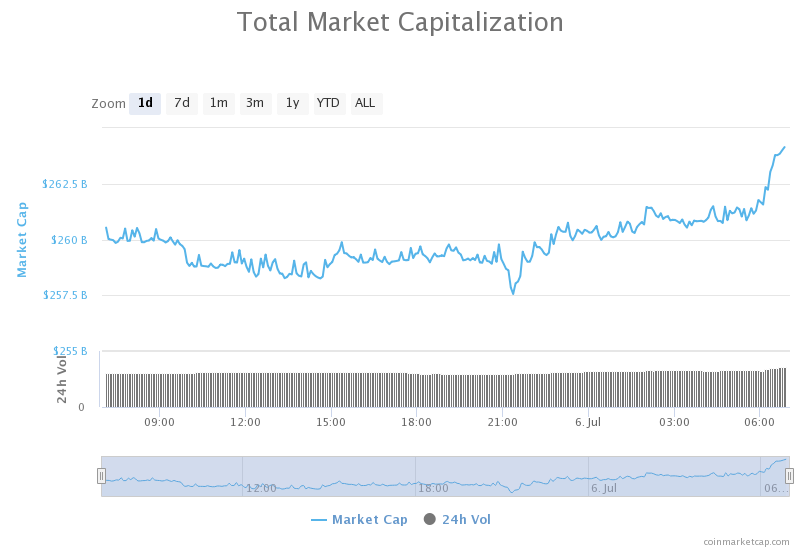
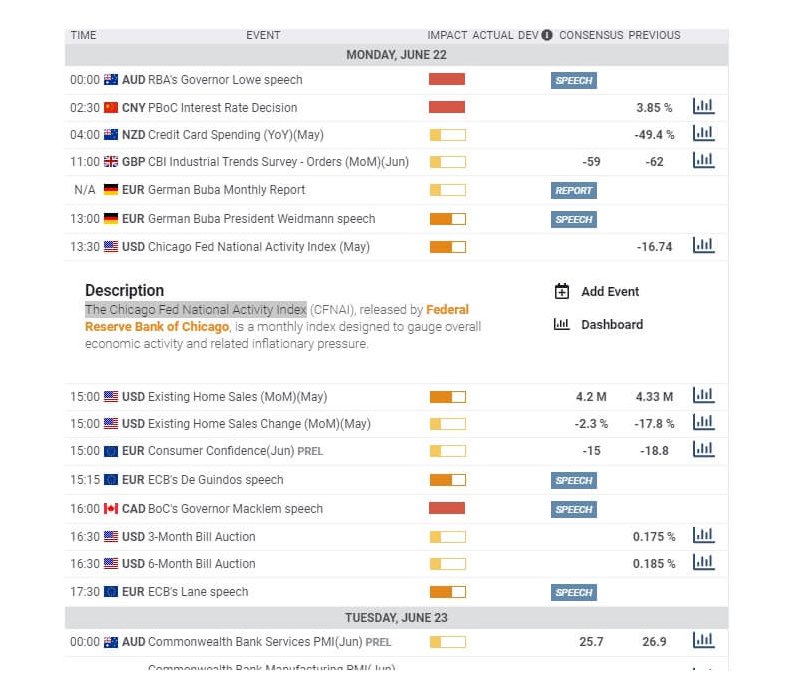
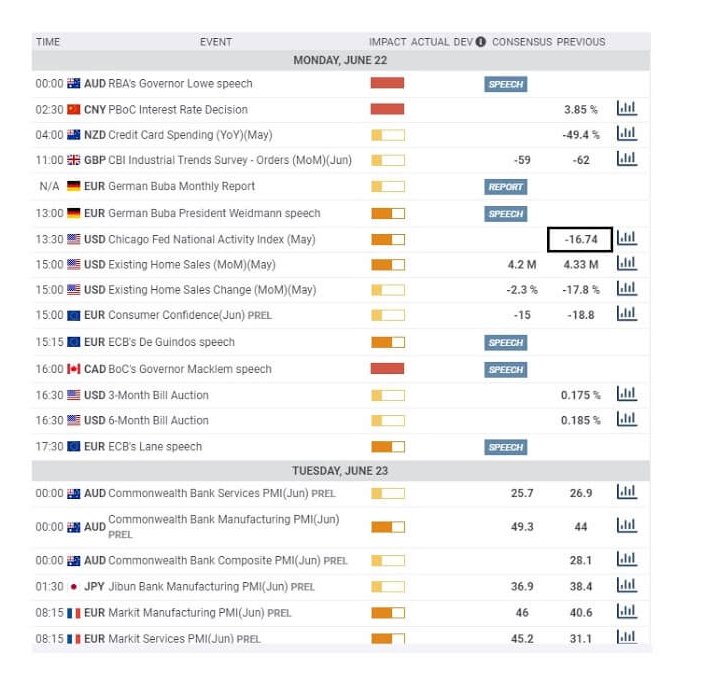
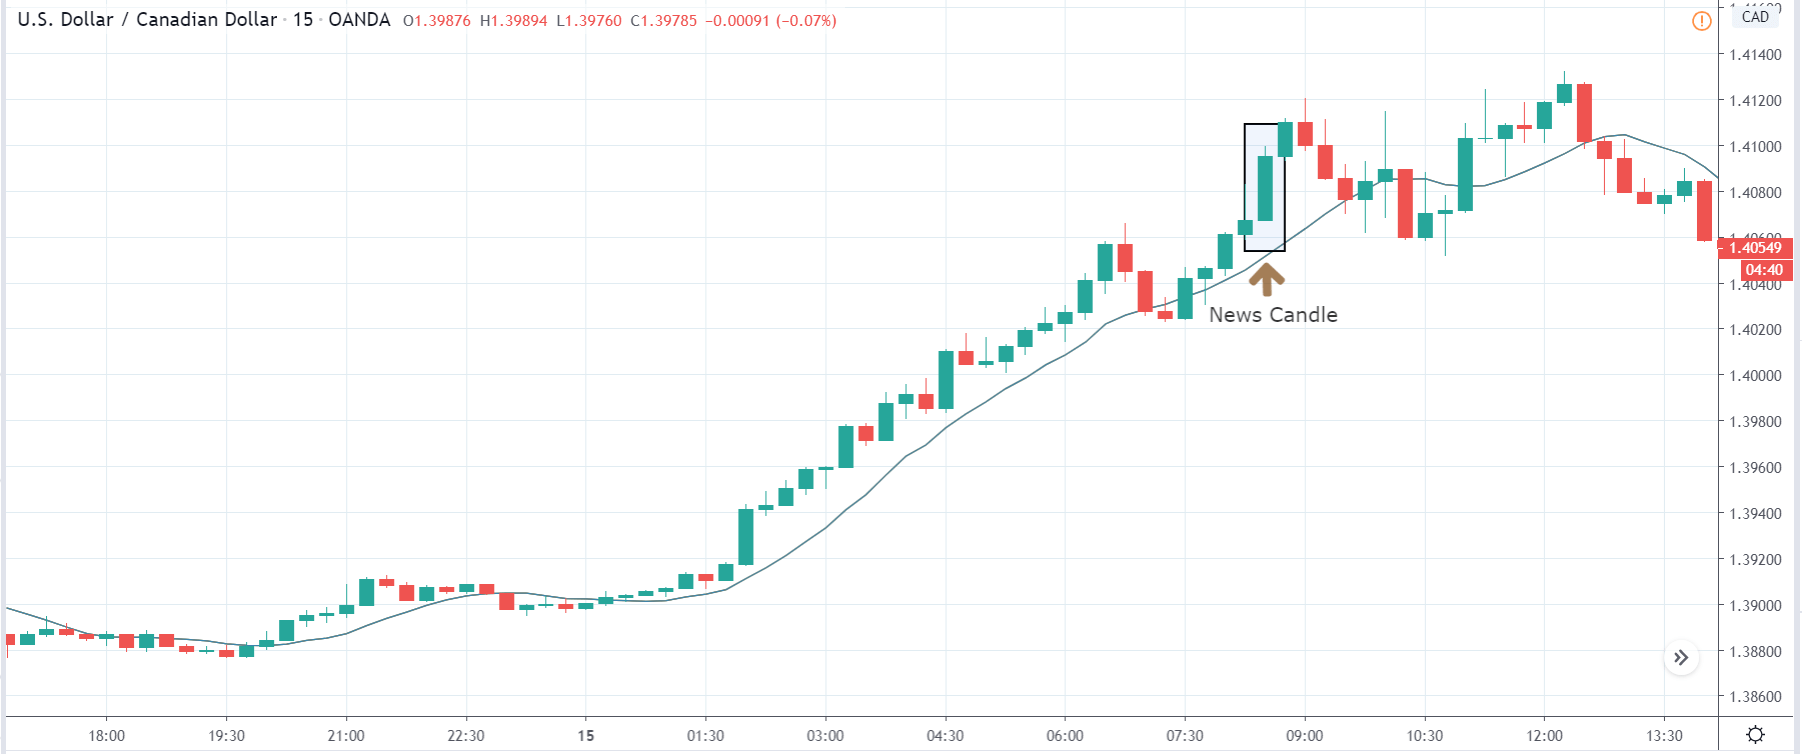
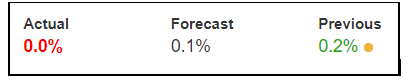
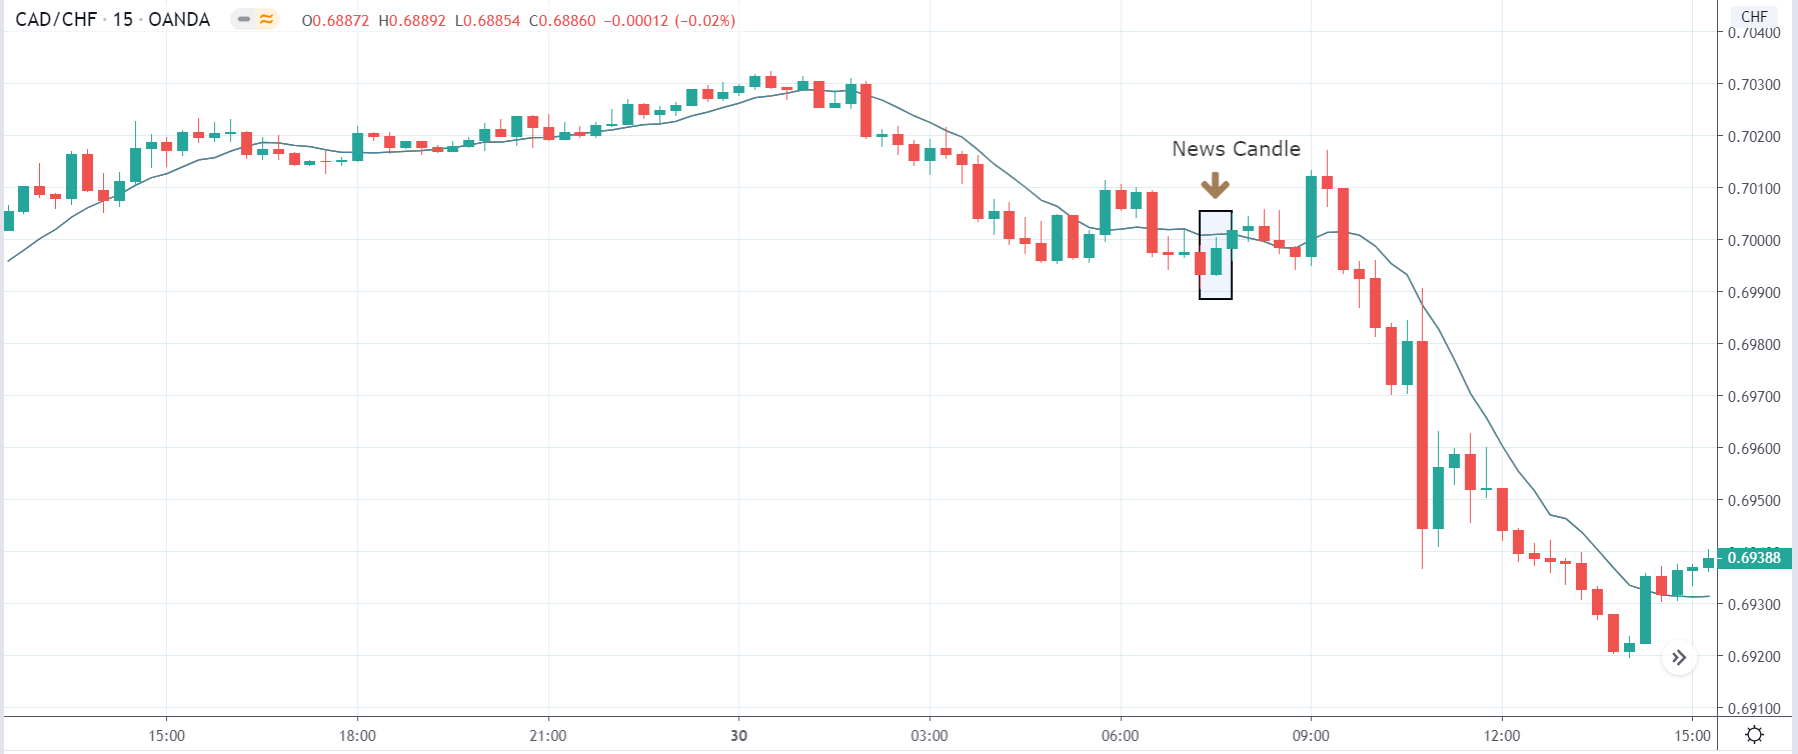
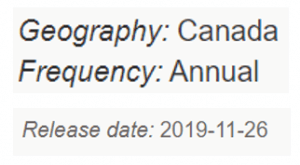
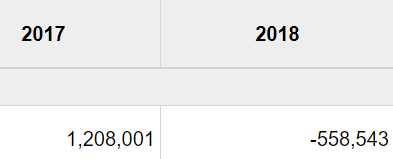
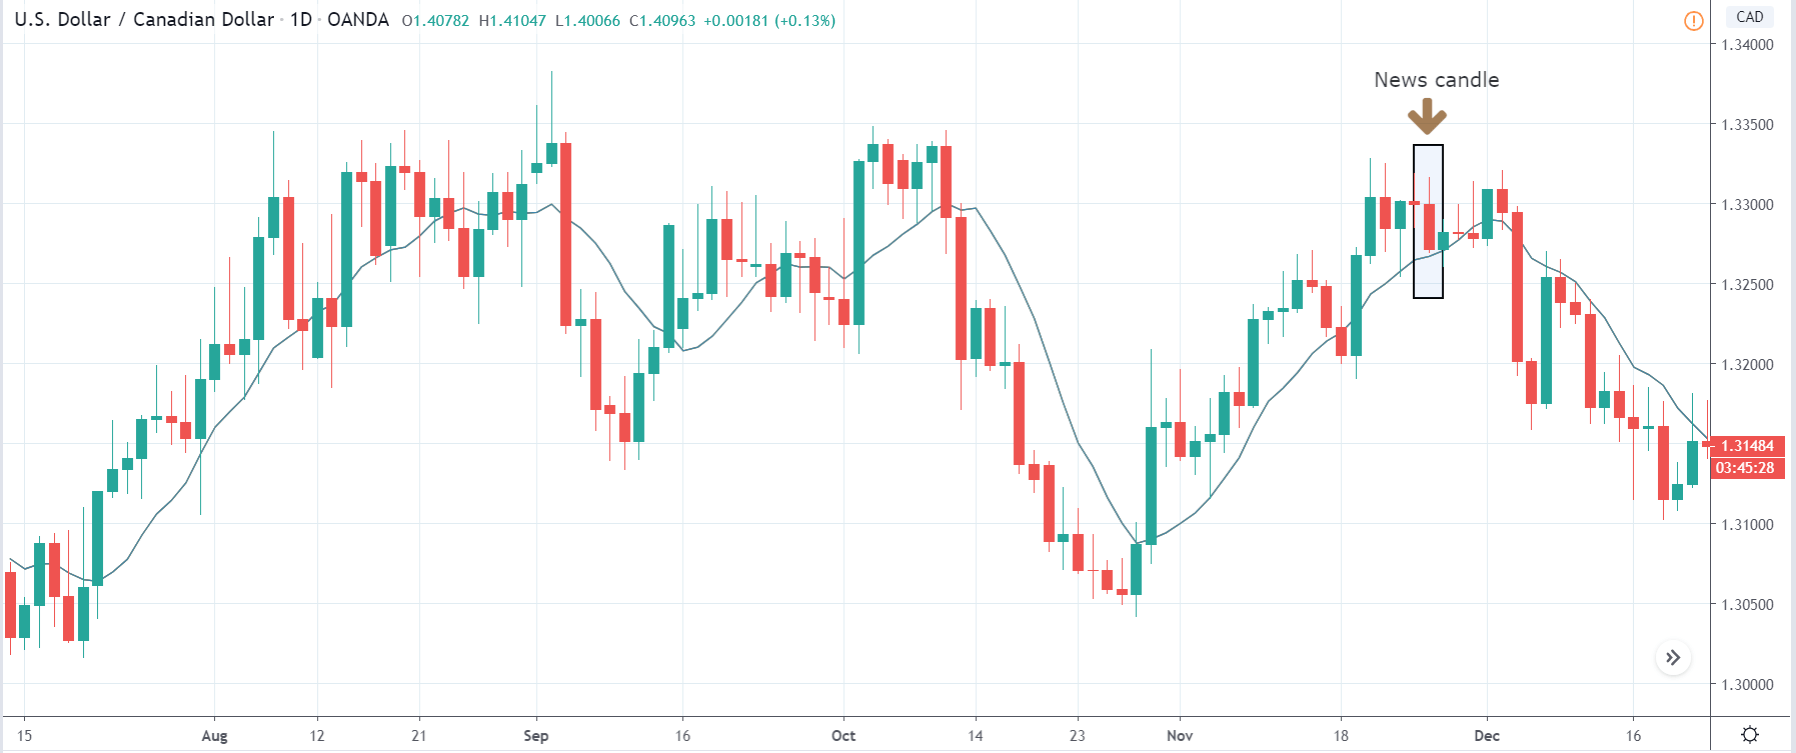
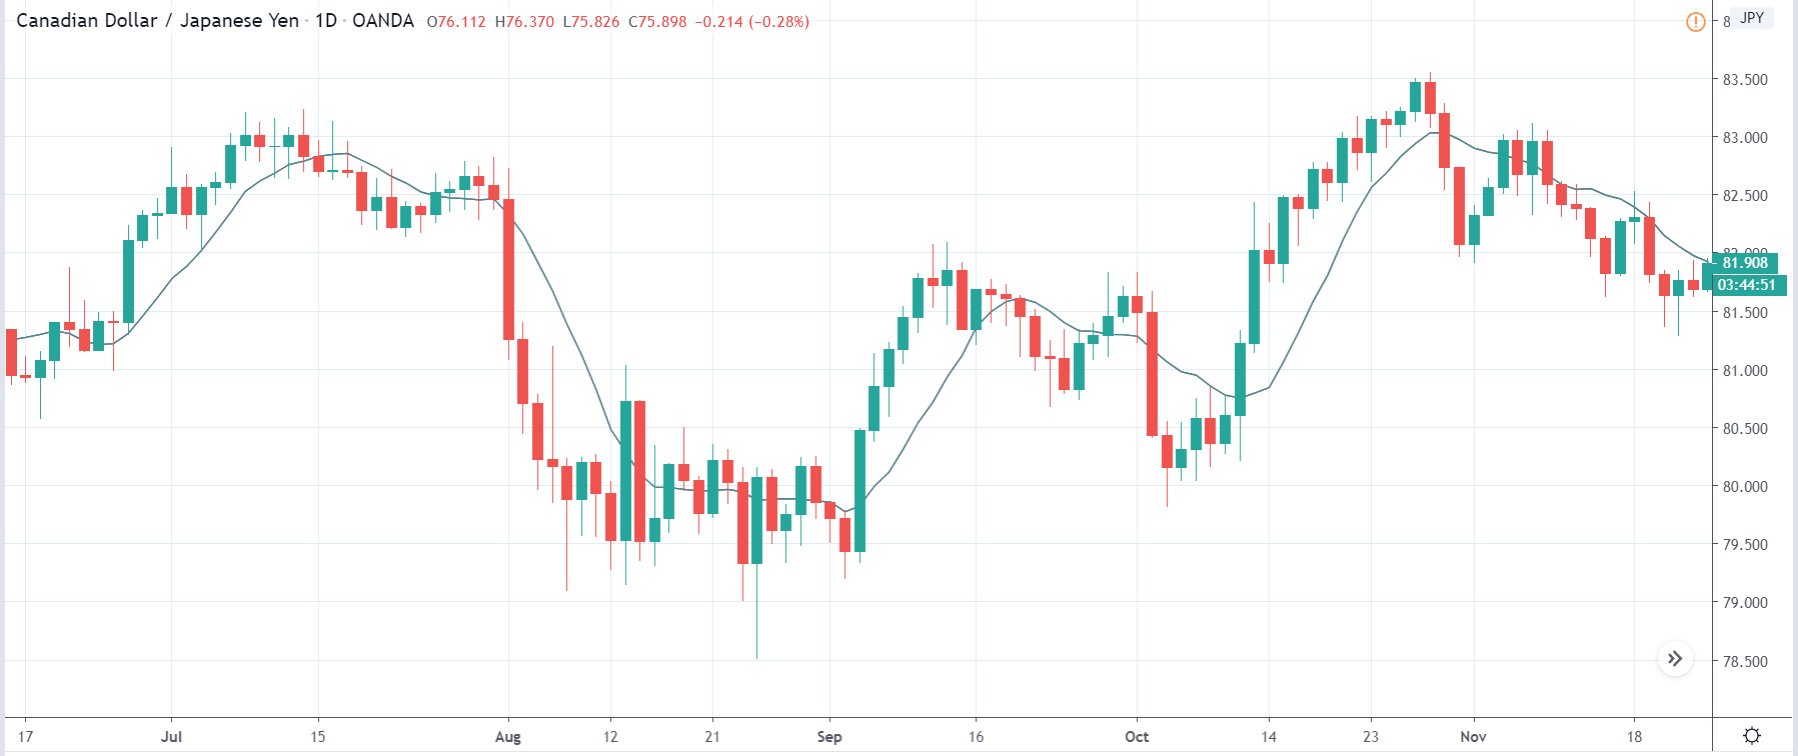
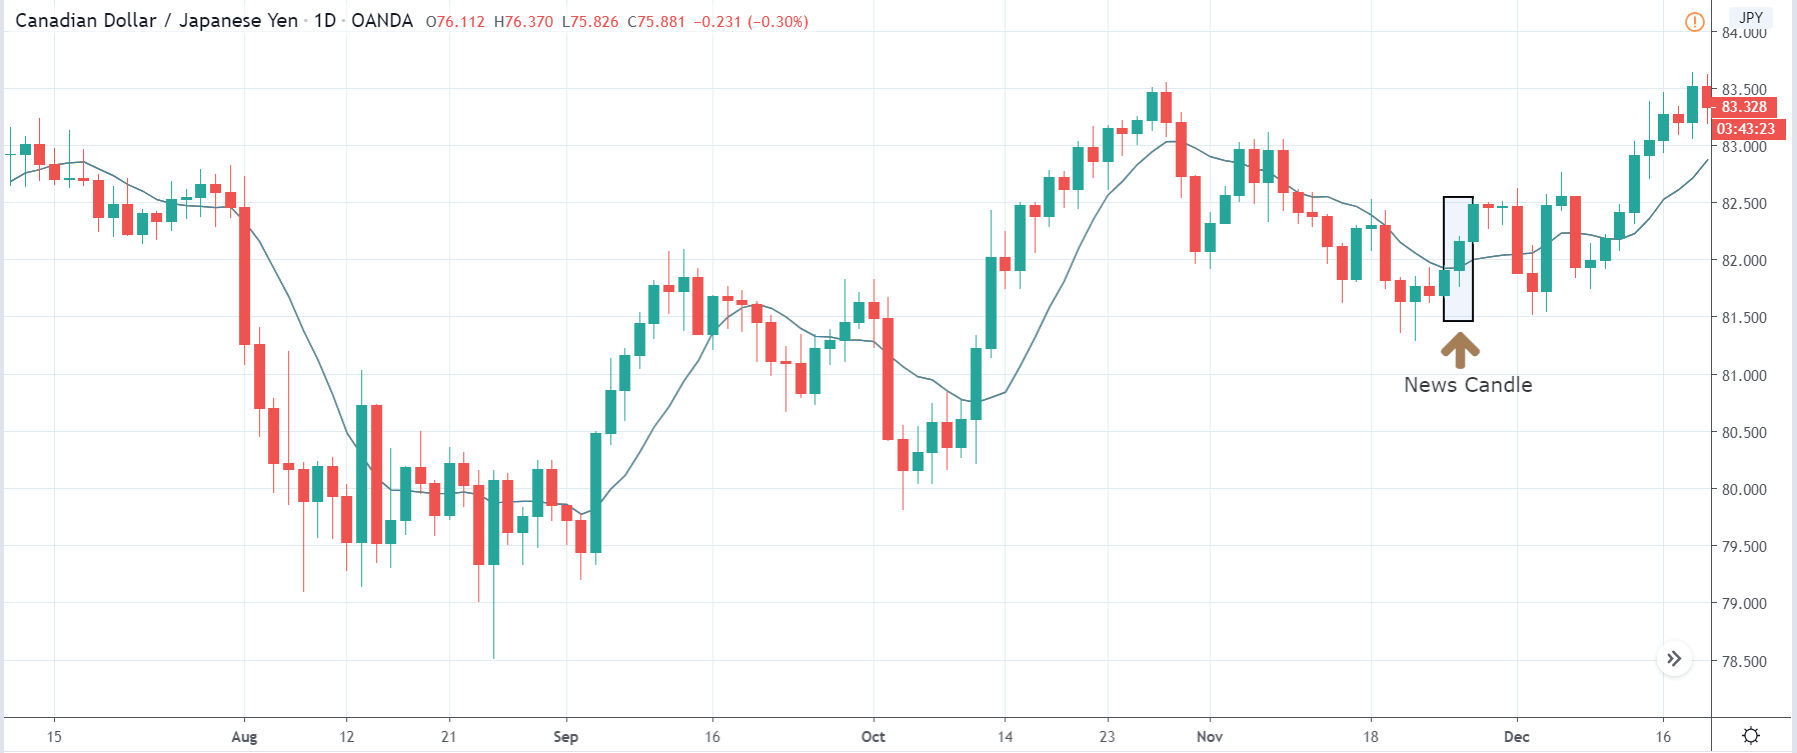
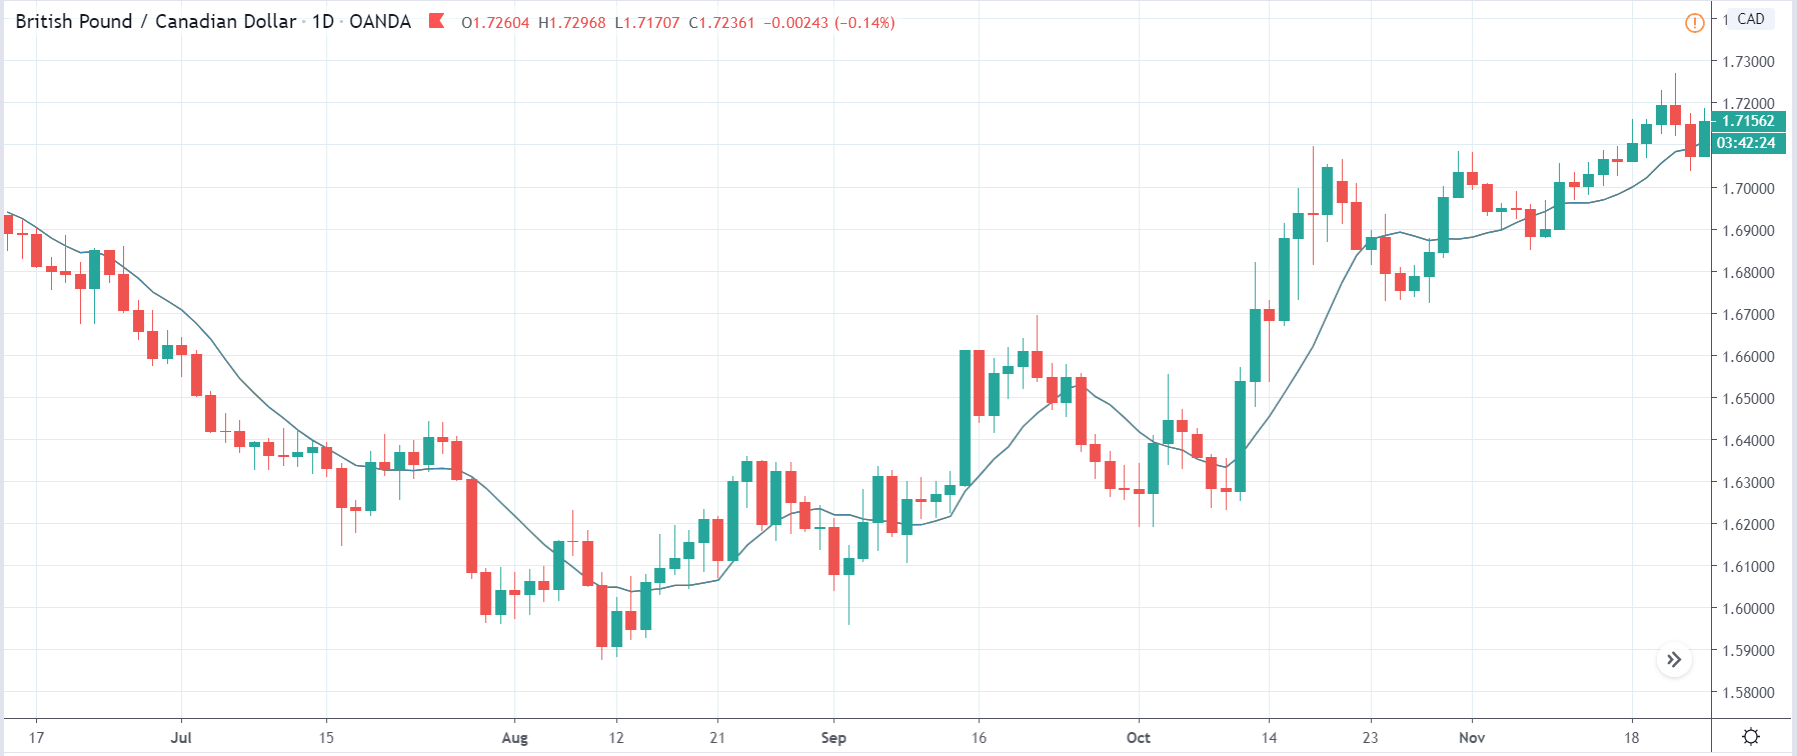
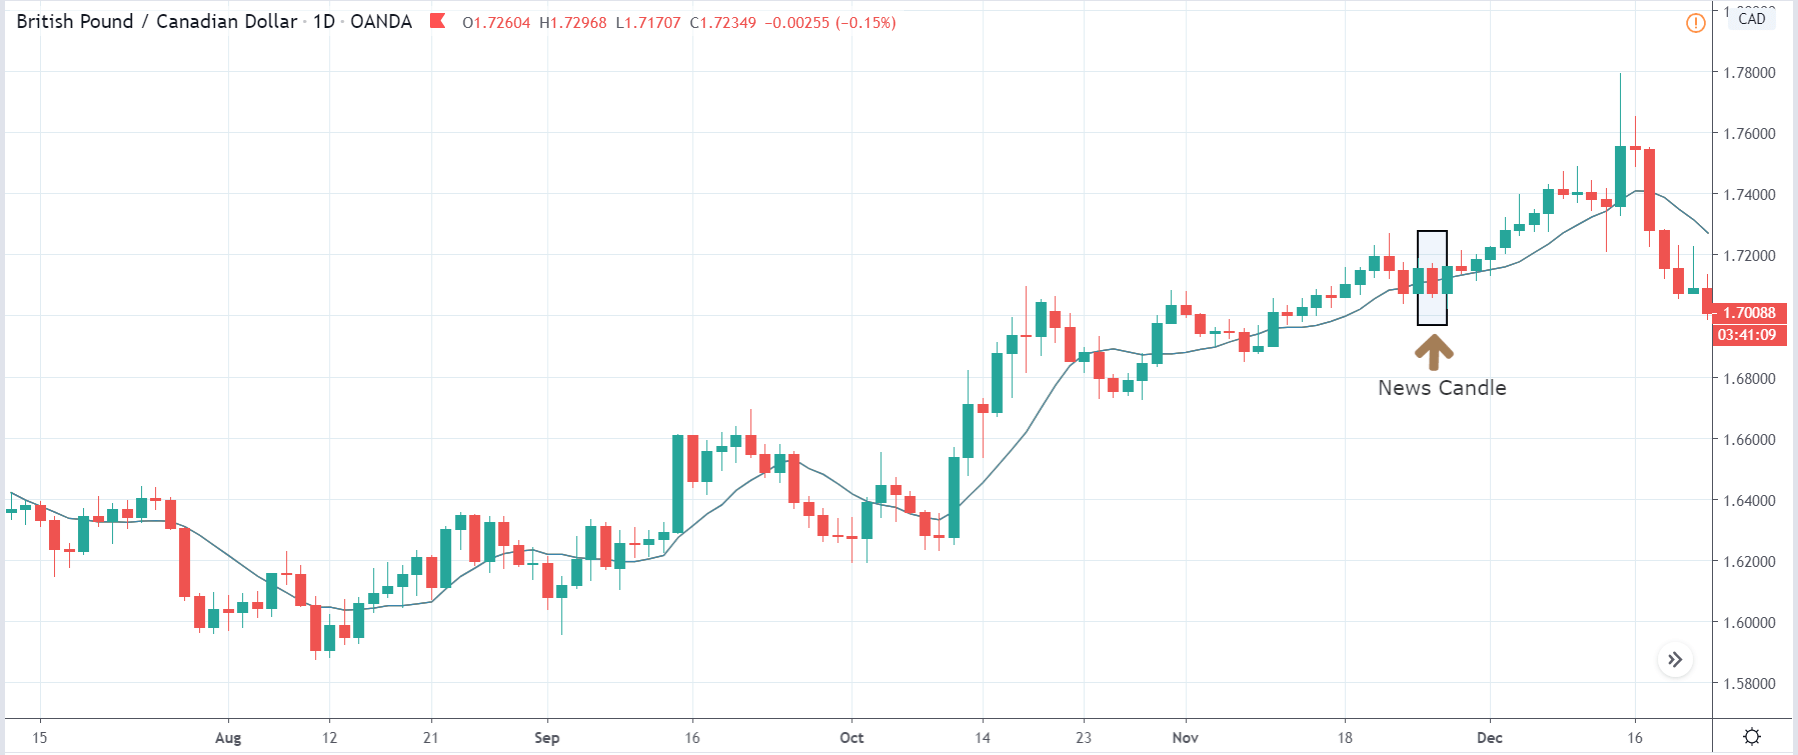
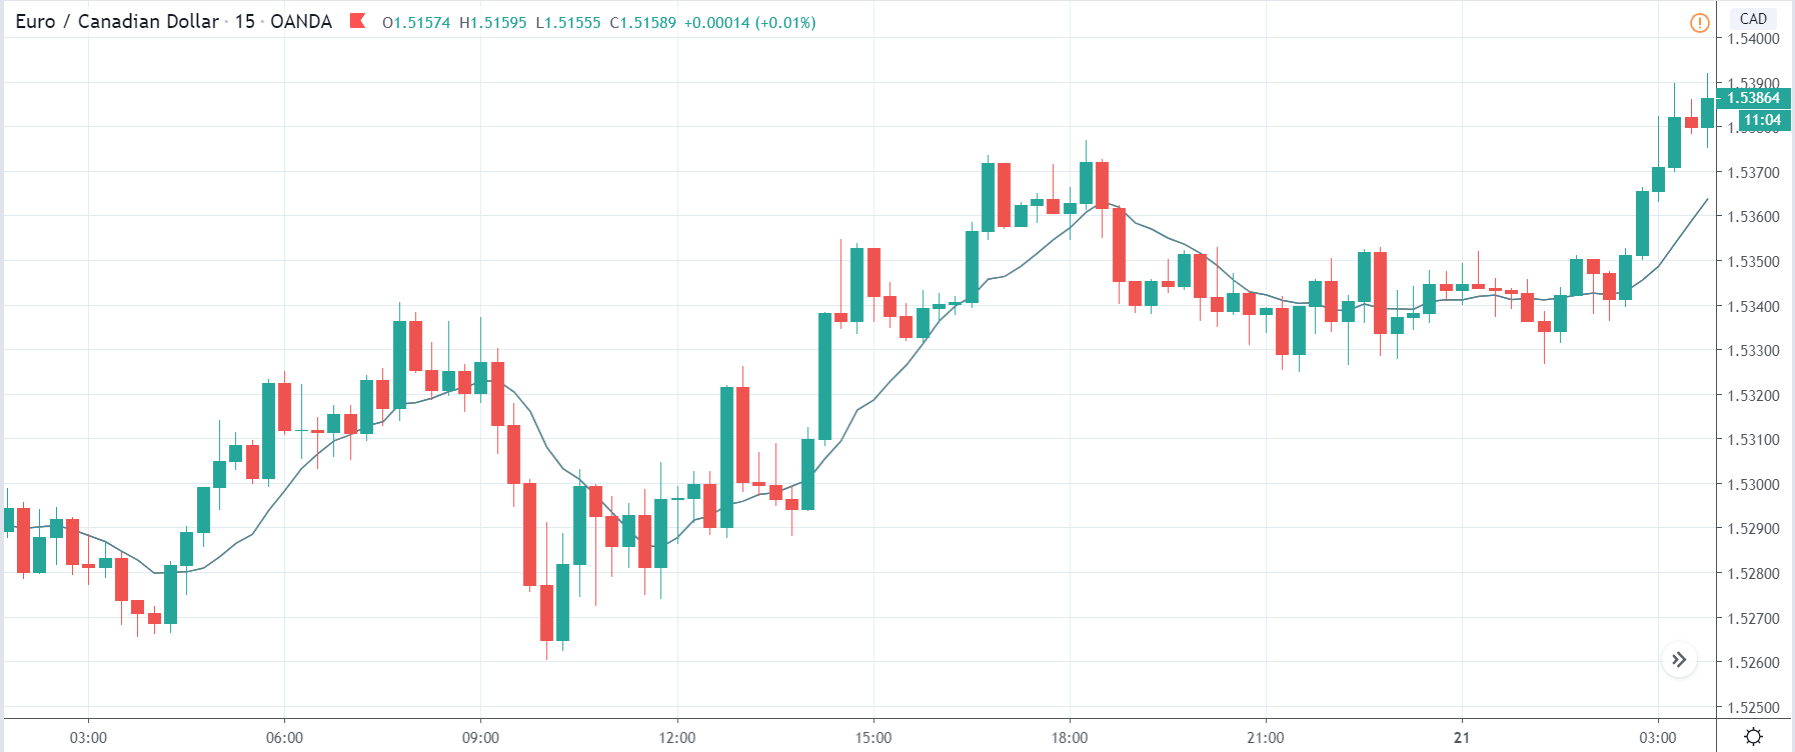
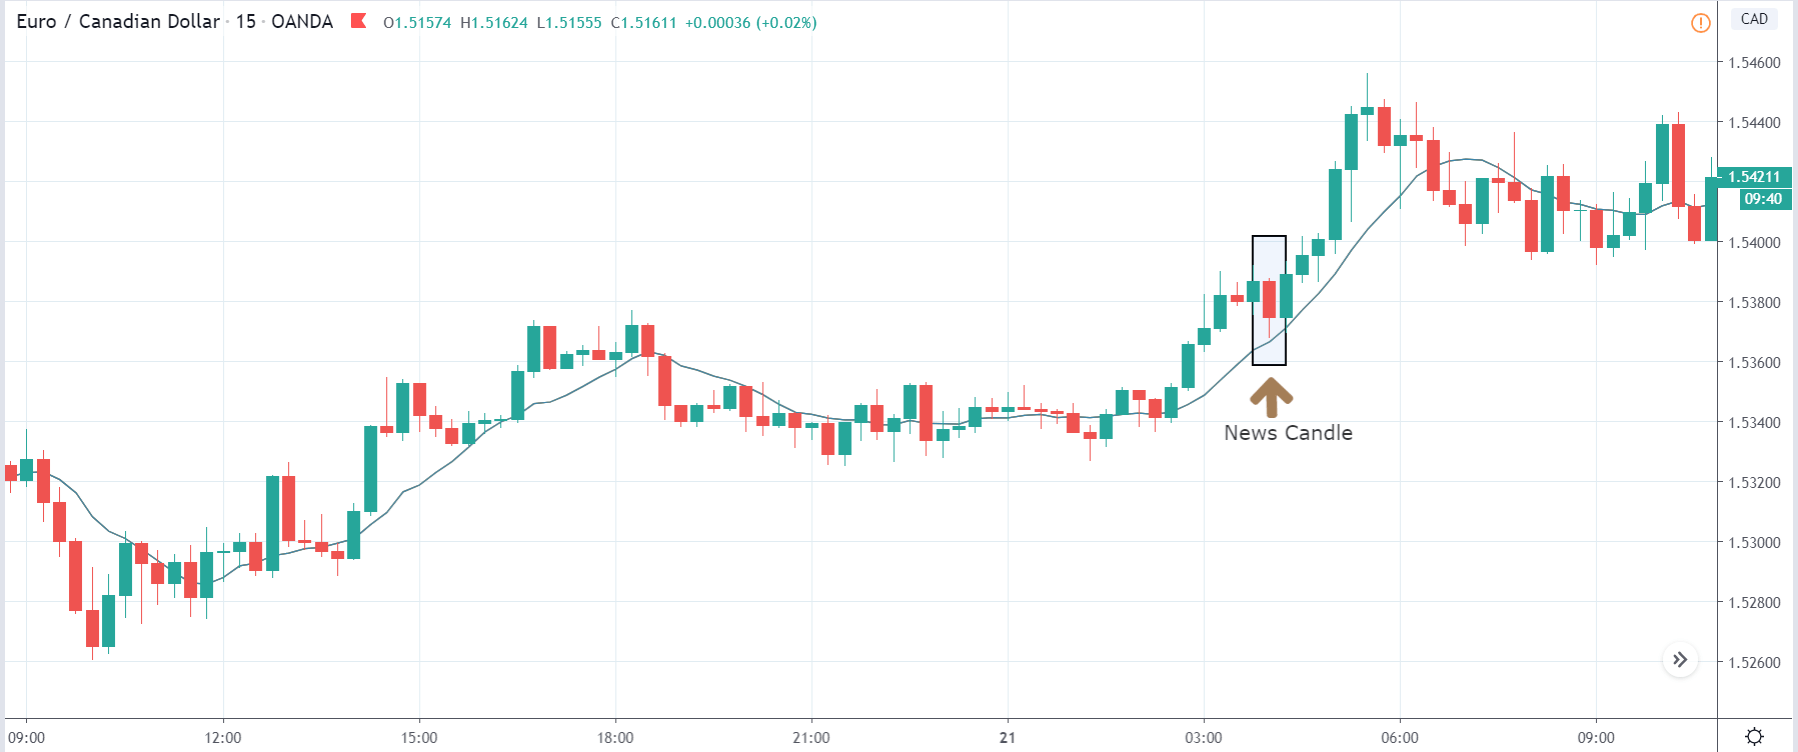
In today’s lesson, we will analyze the impact of GDP on various currency pairs by observing the change in volatility before and after the news announcement. For that purpose, we have collected the GDP data of Canada, where the below image shows the month-on-month GDP data released recently. Let us find out the market’s reaction to this data.

USD/CAD | Before the announcement:

We will start with the USD/CAD currency pair to observe the impact of GDP on the Canadian dollar. The above image shows the state of the chart before the news announcement, where we see that the market is in a downtrend, and recently the price has reversed to the upside. Either could result in a reversal of the trend or a continuation of the current trend. The impact of GDP will decide the direction of the market and so our position. 

USD/CAD | After the announcement

After the news announcement, the price drops below the moving average, and the market falls considerably owing to the positive GDP data. Even though there was a decrease in the GDP, it was only a tad bit lower and much around the market expectations. Hence, it proved to be bullish for the Canadian dollar, and the market goes lower. One should confirm the continuation of the trend using technical indicators before taking a ‘short’ trade.

GBP/CAD | Before the announcement:

GBP/CAD | After the announcement:

The above images represent the GBP/CAD currency pair, where we see in the first image that the market has broken out from a downward ‘channel’ and is moving higher and higher from then on. It very likely that the up move will continue further, which makes us wait for a price retracement to take a buy trade. Based on the volatility caused by the news release, we will have a clear idea about the direction of the market.

After the news announcement, volatility slightly increases to the downside, and the market falls by a few pips. The bearish ‘news candle’ is a consequence of the positive GDP data, mostly on expected lines. We need to note that the news release did not change the overall trend of the market, where the uptrend is still intact.    

CAD/CHF | Before the announcement:

CAD/CHF | After the announcement:

The above images are that of CAD/CHF currency pair, where we see that before the news announcement, the market has reversed from an uptrend to a downtrend and is currently on the verge of continuing the downward move. Since the GDP has a high impact on the currency (indicated by the red box), it is advised not to take any position before the news release.

After the news announcement, the price moves higher by a small amount and manages to close on a bullish mark. The GDP data was close to what was expected, it leads to bullishness within a currency, and hence the Canadian dollar gains strength for a short while.

We hope you understood the concept of ‘GDP Constant Prices’ and how the Forex price charts get affected after its news release. All the best. Cheers!

Categories
Crypto Market Analysis

Daily Crypto Review, July 1 – BoA Treating Crypto as Cash; XRP Continuing its Downtrend

The cryptocurrency market has had a slow day, with most cryptos seeking consolidation. Bitcoin is currently trading for $9,144, which represents an increase of 0.13% on the day. Meanwhile, Ethereum lost 0.76% on the day, while XRP lost 0.86%.

 Daily Crypto Sector Heat Map

When talking about top100 cryptocurrencies, Electroneum gained 16.39% on the day, making it by far the most prominent daily gainer. Elrond (15.22%) and SwissBorg (10.43%) also did great. On the other hand, Flexacoin has lost 16.03%, making it the most prominent daily loser. It is followed by Quant’s loss of 8.69% and Compound’s loss of 7.84%.

Top 10 24-hour Performers (Click to enlarge)

Bottom 10 24-hour Performers (Click to enlarge)

Bitcoin’s dominance level decreased slightly since we last reported, with its value currently at 65.36%. This value represents a 0.04% difference to the downside when compared to yesterday’s value.

Daily Crypto Market Cap Chart

The cryptocurrency market capitalization stayed at almost precisely the same place when compared to yesterday, with the market’s current value being $259.48 billion. This value represents a decrease of $1.76 billion when compared to the value it had yesterday.

_______________________________________________________________________

What happened in the past 24 hours?

_______________________________________________________________________

_______________________________________________________________________

Technical analysis

_______________________________________________________________________

Bitcoin

The largest cryptocurrency by market capitalization took another day to find a place at which to consolidate. Low Volume and low volatility gave us a day with seemingly no movement, but the lack of action is more likely produced by the support and resistance levels rather than the absence of Volume. Bitcoin is trading in an extremely tight range, bound by the 50-period moving average to the upside and $9,120 to the downside.

Trading in such a narrow range is impossible for more extended periods, so traders should be aware of any volume increases accompanied by one of these levels being broken.

BTC/USD 4-hour Chart

Technical factors:

  • Price is below its 50-period EMA and above its 21-period EMA
  • Price above the Middle B.B. (20period SMA)
  • RSI near the middle point (48)
  • Average Volume

Key levels to the upside          Key levels to the downside

1: $9,251                                 1: $9,120

2: $9,580                                 2: $8,980

3: $9,735                                  3: $8,820

Ethereum

The second-largest cryptocurrency by market capitalization retreated to the support level of $225.4 over the course of the day. While the Volume is extremely low, bears seem to be in slight control over Ethereum, which is why the immediate support level is continuously being tested.

Ethereum traders should position their next trade based on the break confirmation (to the upside or downside) of the $225.4 level.

ETH/USD 4-hour Chart

Technical Factors:

  • Price below the 50-period EMA and the 21-period EMA
  • Price right above Middle B.B. (20-period SMA)
  • RSI near the middle point (46)
  • Extremely low Volume

Key levels to the upside          Key levels to the downside

1: $228                                    1: $225.4

2: $240                                    2: $217.7

3: $251.4                                  3: $198

Ripple

The third-largest cryptocurrency by market cap is continuing its path towards the downside by following the descending trend line. After failing to regain its position above the $0.178 level, XRP started dropping in price. The price drop was (for now) stopped by the lower Bollinger band. However, any move towards the upside will not only have to tackle the $0.178 level, but the 21-period and 50-period moving averages as well.

There aren’t many XRP trading opportunities at the moment, but most of them are completely straightforward, as they are always accompanied by sharp increases in Volume.

XRP/USD 4-hour Chart

Technical factors:

  • XRP in a mid-term descending trend
  • XRP lacks strong support levels below $0.178
  • The upside is guarded by the 21 and 50-period EMA
  • Price in a narrow range between the Middle B.B. (20 SMA) and Lower B.B.
  • RSI is below the middle point (39)
  • Lower than average Volume

Key levels to the upside          Key levels to the downside

1: $0.178                                    1: $0.147

2: $0.19                                    

3: $0.2


Categories
Forex Videos

Forex Fundamental Analysis For Novices – Policymaker Speeches!

Fundamental Analysis For Novices – Policymaker Speeches


Thank you for joining our educational video section for fundamental analysis for novices. In this video, we are going to be looking at policymaker speeches.

Most brokers provide an Economic Calendar. And traders use them to keep them advised of various types of economic data releases because these can significantly affect market volatility depending on the level of impact they will have upon their release. If you are not already using one, we strongly recommend that you start doing so. You can plan your trading day around them And try to avoid opening trades close to the release of such data until you are a seasoned trader who understands just how such information can affect price action.


Most economic calendars are similar. However, the types of information which are key to traders are the release time, the type of events – in this case, we are looking at speeches -, the day and date, the likely impact that any speech might have on the market. In terms of general economic data releases, you will find that the actual data is released at the time signified on the calendar and where typically you might find a consensus by economic specialists as to what that data might be, and also the previous data release and where this can be compared to the actual data release, and the traders will gauge what effect that might have on an economy and of course thereafter the related currency exchange rates and stock market indices.


On the economic calendar for Monday the 22nd of June, we have highlighted four speeches by various policymakers. Typically these are announced ahead of time, and you will find them listed in an Economic Calendar. Some policymakers comment on the market unexpectedly, and a good example of that would be President Trump, who often tweets potentially market-moving comments pertaining to economic relevance, mostly in the United States.
So let’s look at some examples.


AT midnight BST, Philip Lowe, who replaced Glenn Stephen as governor of Australia Central Bank, will be making a speech regarding the health of the Australian economy, and this has a high impact value attached to its importance.
Therefore, Traders will be paying particular notice to his comments because he has the power to influence interest rates and also monetary stimulus within the Australian economy, which is particularly significant at the moment due to the impact of the coronavirus pandemic.
Negative sentiments from Mr. Lowe will be seen as bearish for the Australian economy. This could affect their stock market and also lower the value of the Australian dollar against other counterparts in the forex market.

It would be advisable not to trade the Australian dollar during this event.


3:15 BST again on Monday the 22nd of June, the vice president of the European Central Bank, Luis de Guindos, a Spanish politician, will be making a speech regarding the eurozone economy.
The impact level of the speech is set as medium, and any unexpected comments, especially negative ones, could cause market volatility, especially with the euro, including the EURO USD and cross currency pairs.
During a recent speech from Madrid during May this year, Mr de Guindos Stated that the eurozone had left the worst of the pandemic behind in terms of economic impact from the coronavirus pandemic, although he mentioned that it was likely that the eurozone would take two years to recover. This type of comment is both dovish and hawkish. Hawkish because he says the worst is over, and dovish because he says there are still two years of recovery ahead of the eurozone economy. He finished his speech by saying that the eurozone economy is facing a deep recession due to the coronavirus pandemic, and therefore analysts and Traders will be looking at this forthcoming speech to ascertain if he is Leaning more one way than the other.
Dovish comments would be seen as bearish for the euro currency and might cause a lowering of the euro exchange rates against its counterparts.
It is highly unlikely that his comments will be hawkish and therefore have a bullish effect on the market after such recent comments, as mentioned above.


At 4 p.m. BST, again on Monday the 22nd of June, the Bank of Canada governor Tiff Macklem, will be making a speech about economic policy in Canada and where this has been given an impact value of high.

The Canadian dollar is highly sensitive to policymaker speeches and where the currency can be particularly volatile during economic data releases and speeches. Again traders and analysts and economists will be looking for policymaker decisions from the governor that offer strong potential of keeping the country’s recovery on track from the fall out of the pandemic.

They will also be looking for hints from the governor regarding future interest rate decisions and stimulus packages to keep Canada from going further into recession.
As mentioned previously, the Canadian dollar is highly susceptible to volatility during these types of economic events and is strongly recommended that you do not trade during such times of release. Wait until trends are developing post data release, and try and get on those rather than trying to second guess which direction the currency will go at the actual time of economic release.

Categories
Forex Fundamental Analysis

Everything About ‘Changes in Inventories’ Macro Economic Indicator

Introduction

Changes in Inventories are one of the primary business leading economic indicators that can give us insight into economic prospects for the coming months. Understanding of Inventory Changes and Sales can help us forecast economic growth, which is our primary objective through Fundamental Analysis.

What are Changes in Inventories?

Inventory: It is the stock of goods that retailers, wholesalers, and manufacturers hold with them. Inventory is measured in their appropriate dollar values. Businesses often keep stock of their finished goods when they predict an increase in sales in the coming months so that they are ready to meet the increased demand and can lock in profits.

The Monthly Retail Trade Survey, the Manufacturer’s Shipments, Inventories, and Orders Survey, and the Monthly Wholesale Trade Survey are the primary sources from which Business Inventory is compiled.

At the level of Retail Merchandise, Inventories are measured at cost level at the retailers as per the FIFO (first-in, first-out) method of valuation. At the Wholesalers who distribute goods to retailers, the inventories’ values are added to the business inventories every month. At the manufacturer level, the inventories, whether in raw material, work-in-process or finished, are valued at cost, primarily by the FIFO method of valuation.

How can the Changes in Inventories numbers be used for analysis?

Business owners and retailers have a certain kind of acquaintance with market trends, and due to their years of experience running their business, they know the subtle trends of increase in sales, demand, etc. Hence, Businesses stocking up on inventories is not a joke, as it costs them real money for producing as well as holding the stocks. If they did not forecast an increase, they would not have increased inventories in the first place.

Seasonally Adjusted Inventory Changes can thus act as a leading indicator for the increase in consumer consumption, which is good for business, and the economy. On the other hand, increased inventory figures could also indicate that the sales have fallen, and thus creating an inventory stockpile, which indicates decreased consumer spending, which signals terrible times for the economy are ahead.

Hence, it is often essential to combine Inventory figures with Retail Sales figures to correctly gauge the economic trend. Retail Sales figures indicate actual consumption of goods by consumers and hence is the more accurate figure when compared to Changes in Inventories.

An increase in Manufacturing Production is followed by an increase in Inventory. It is then followed by an increase in Retail Sales. The first two stages, i.e., increase in Manufacturing Production and Inventory Changes, are still forecast, i.e., the rolled dice can turn either way. But Retail Sales is a guaranteed economic indicator, as money comes back into the pockets of retailers and manufacturers.

Hence, the more commonly watched statistic out of the business inventories figures is the Inventory-to Sales Ratio. It is the ratio of Inventory value to Retail Sales figures. It gives us an indication, by how many times the inventories outpace the Retail Sales. The lesser the number, the better.

For example, an Inventory-to-Sales Ratio of 2.5 indicates that there is enough inventory stock to supply 2.5 months of Retail Sales. When the ratio increases, it is an indication that the inventories are increasing in contrast to the sales, which indicates the economy is slowing down. The upcoming Production activity would be reduced until the current Inventory stock starts to deplete off. On the other hand, when the ratio is falling, it is indicative of manufacturers to increase production activity to the oncoming increase in demand.

Inventories are primarily concerned with the Manufacturing Sector, which accounts for 20% of GDP in the United States. It drives a significant portion nonetheless.  An increase in manufacturing activity as a consequence of decreasing ratio figures can add to employment, or even wage growth, which is good for the economy. Increased employment further stimulates Consumer Spending as more people have the cash to spend, which cyclically boosts the economy.

Impact on Currency

Changes in Inventory figures can be leading indicators. If correctly put, way too leading. It means that the changes in inventories are figures at the start of the manufacturing process-consumer purchase lifecycle. The indicator has two-way conclusions to be drawn, as discussed above. Hence, the traders who are not well versed with the industry should use this indicator with caution, as an increase in Inventory can mean slowdown or expected growth both.

Only investors or traders who have a historical perspective of the figures can use this indicator effectively to predict growth months ahead of the market. In general, the market follows Retail Sales and Ratio as reliable metrics, and hence there are significant moves in the market around these figures. Hence, although a leading indicator of economic growth, it is advised to combine it with Retail Sales figures to affirm your assessment of economic activity.

Economic Reports

In the United States, the Bureau of Economic Analysis releases quarterly reports of the GDP, wherein the section of “Key Sources and Assumptions” contains the details of “Changes in Private Inventories.” The BEA publishes quarterly reports on its official website after every quarter. The release dates are also posted on its official website.

The United States Census Bureau maintains the Manufacturing & Trade Inventories on its official website.

Sources of Changes in Inventories

BEA – Gross Domestic Product

The St. Louis FRED website makes the search and analysis of Inventories data from BEA a lot easier. The links are given below

Change in Private Real Inventories – FRED

Change in Private Inventories – FRED

Census Bureau – Inventory

Census Bureau – Shipment, Inventory, and Orders

Inventory data for various countries are available in statistical and list format here.

Impact of the ‘Change in Inventory’ news release on the Forex market

The Change in Inventory measures the value of change in producer-owned inventories between the beginning and the end of the calendar year. For businesses, the build-up of inventories can be a threat. The problem is that these inventories will probably be cut in the future, depressing demand for goods and leading to production cutbacks. In hard times, managers work hard to cut back on inventories. All companies need to be prepared for business cycles, which is driven by inventory swings. Companies must try to reduce their inventories by reevaluating their practices.

In today’s lesson, we will analyze the change in inventory levels of many agricultural commodities, particularly grains, that are produced in a given year and stored or held until they are marketed. The annual value of inventory change represents the gross value of agricultural production. The below image shows the net Change in Inventory from 2017 to 2018 in the agricultural sector of Canada. This value has been estimated for durum wheat, oats, rye, corn, soybean, potatoes, tobacco, and many other commodities. Let us find out how the market responds to this data.

USD/CAD | Before the announcement:

Let us start with the USD/CAD currency pair in order to observe the impact of the Change Inventory on the Canadian dollar. In the above image, we see that the market is in moving within a ‘range,’ and currently, the price is at the top of the ‘range.’ Since the impact of this news event is less on a currency, aggressive traders can take ‘short’ positions with a large stop loss.

USD/CAD | After the announcement:

After the news announcement, the market moves lower, and the price reaches to the moving average. The bearish ‘news candle’ indicates that the Change in Inventory data was positive for the Canadian economy, which resulted in the strengthening of the currency. The close of ‘news candle’ is a confirmation sign of a down move. Thus, one could take a risk-free ‘short’ position soon after the news release.

CAD/JPY | Before the announcement:

CAD/JPY | After the announcement:

The above images represent the CAD/JPY currency pair, where we see that before the news announcement, the market seems to be moving in a ‘channel’ with the price presently is at the bottom of the ‘channel.’ Since the Canadian dollar is on the left-hand side of the currency pair, an upward channel signifies strength in the currency. Therefore, traders who trade channel can buy the currency pair with a stop loss below an appropriate technical level.

After the news announcement, the price moves higher, and volatility expands on the upside. The ‘news candle’ closes with a fair amount of bullishness as a result of better than expected Change in Inventory data. At this point, once could confidently take a ‘long’ position with a target up to the higher end of the ‘channel.’

GBP/CAD | Before the announcement:

GBP/CAD | After the announcement:

The above images are that of GBP/CAD currency pair, where we can see in the first image that the market is in a strong uptrend, which signifies the great amount of weakness in the Canadian dollar. Technically, we should be looking to buy the currency pair after a price retracement to a ‘support’ or ‘demand’ area. Until then, we will be monitoring the impact of the news release.

After the news announcement, volatility slightly increases to the downside, and we witness a fall in the price. However, the Change in Inventory does not have a major on the currency pair where the Canadian dollar strengthens only momentarily. One needs to still wait for a pullback in order to join the uptrend.

That’s about the ‘Change in Inventory’ and the relative impact of its news announcement on the Forex price charts. Let us know if you have doubts regarding the article in the comments below. Cheers!

Categories
Forex Market Analysis

Daily F.X. Analysis, June 30 – Top Trade Setups In Forex – Eyes on U.S. News! 

On the news front, it’s going to be a busy day in the wake of U.S. Chicago PMI, C.B. Consumer Confidence, and Fed Chair Powell Testifies. The European session may exhibit muted trading, but the New York session is likely to bring sharp movements in the market, and we can expect breakouts.

Economic Events to Watch Today 


EUR/USD – Daily Analysis

The EUR/USD pair was closed at 1.12423 after placing a high of 1.12876 and a low of 1.12149. Overall the movement of the EUR/USD pair remained bullish throughout the day. During the Monday session, Euro broke higher and reached near 1.1300 level; however, U.S. dollar strength caped on any additional gains and took the prices away from that level. European Union has been praised for its handling of coronavirus crisis through its stimulus plans, and despite the increasing numbers of infected cases around the world, the E.U. has decided to open its gates for 15 countries.

European Union revealed a new list of countries that will be permitted to enter the E.U. from July 1 when external borders will be officially reopened. However, the U.S. was excluded from the permitted countries to enter the E.U. due to coronavirus developments. This raised Euro across the board on the hopes that tourism will aid in the fast E.U. economic recovery.

China was also excluded from the “safe list” of the European Union; however, if the Chinese government would offer a reciprocal travel deal for E.U. citizens, then the E.U. will add China to its “safe list.” E.U. has said that the safe list will be reviewed every two weeks and will be adjusted according to the coronavirus developments in each country.

Furthermore, Germany’s finance minister and lawmakers said on Monday that the European Central Bank (ECB) had met the principle of proportionality with its stimulus package that ended the legal conflict threatening to undermine central bank policy. The German Constitutional Court last month gave ECB 3 months to justify bond purchases under its stimulus plan –PSPP or lose German central bank as a participant. This raised Euro in the financial market and pushed EUR/USD pair higher on Monday.

On the data front, The German Prelim CPI for June surged to 0.6% from the expected 0.3% and supported Euro. At 12:00 GMT, the Spanish Flash CPI for the year was dropped by 0.3% against the expected drop by 0.9% and supported the single currency Euro.

The better than expected CPI data from Germany and Spain gave strength to Euro, which added in the gains of EUR/USD pair on Monday.

On the other hand, from the American side, the Pending Home Sales for May increased to 44.3% against 18.9%, which gave strength to the U.S. dollar that exerted downward pressure on EUR/USD at 19:00 GMT.

The U.S. Dollar was also intense because of its safe-haven status during increased US-China tensions and China-India conflict and rising number of coronavirus cases in the U.S. & many other countries. This dragged the rising EUR/USD and limited the gains of the pair on Monday.

Daily Support and Resistance

  • R3 1.1241
  • R2 1.1235
  • R1 1.1229

Pivot Point 1.1223

  • S1 1.1217
  • S2 1.1211
  • S3 1.1205

EUR/USD– Trading Tip

The EUR/USD is holding below a strong resistance level of 1.1245 level, the closing of candles below this level is suggesting chances of selling bias until 1.1218 level. Continuation of selling trend below 1.1218 level can extend selling until 1.1195 level today. Conversely, a bullish breakout of the 1.1245 level can extend buying until 1.1289. The RSI and MACD are still in a bearish zone, while the 50 EMA also suggests selling bias. Therefore, we should look for selling trades below 1.1223levels.  


GBP/USD – Daily Analysis

The GBP/USD pair was closed at 1.22980 after placing a high of 1.23893 and a low of 1.22513. Overall the movement of GBP/USD pair remained bearish throughout the day. The Pound was already weak against the U.S. dollar, and the decline in Pound gained speed after the risk-off market sentiment gained traction and made the U.S. dollar stronger on Monday in the late trading session.

On Monday, face-to-face negotiations on the post-Brexit trade deal between the E.U. & U.K. began after both parties pledged to intensify talks. It would be the first time the U.K.’s chief negotiator David Frost will meet in person with his E.U. counterpart Michel Barnier since the talks began in March. Negotiations were continued through the pandemic but virtually not in person due to coronavirus pandemic.

Boris Johnson has said that a deal could be reached this month with new momentum. PM Johnson met E.U. Commission President Ursula von der Leyen in a video conference this month and exclaimed that there were very good chances of getting a trade deal by Dec. The traders were cautious ahead of talks as to how they would go; so, British Pound came under pressure on Monday and dragged GBP/USD pair with itself.

Furthermore, Boris Johnson promised “an active approach to economy” while speaking at a school construction site. His comments came ahead of the launch of a task force to speed up the delivery of infrastructure projects. PM Boris Johnson said that “the cash is there” for long-term investment to help the U.K. recover from the coronavirus crisis and its impact on the economy. He announced that $1.23 B would be delivered to build the first 50 projects, including schools. The U.K. economy was contracted by 20.4% in April, the largest monthly fall on record due to the coronavirus crisis.

On the data front, The M4 Money Supply in May was released at 13:30 GMT, from the United Kingdom, which increased to 2.0% from the forecasted 1.6% and supported British Pound. The Mortgage Approvals from the U.K. in May were decreased to 9K against the forecasted 25K and weighed on British Pound. At 13:32 GMT, the Net Lending to Individuals for May decreased to -3.4B from the -4.0B and supported British Pound.

On the other hand, the Pending Home Sales from the United States for May came in as 44.3% against the expected 18.9%and supported the U.S. dollar. Better than expected data from the U.S. gave strength to the U.S. dollar, which added in the downward trend of GBP/USD on Monday.

The U.S. dollar was strong across the board due to its safe-haven status that was high due to the increased geopolitical tensions and intensified numbers of coronavirus cases around the world. Strong U.S. dollar weighed on GBP/USD pair on Monday.

Daily Support and Resistance

  • R3 1.2381
  • R2 1.2367
  • R1 1.2354

Pivot Point 1.234

  • S1 1.2327
  • S2 1.2313
  • S3 1.23

GBP/USD– Trading Tip

The GBP/USD is trading with a bearish bias, primarily upon the release of worse than expected GDP figures. The cable is trading at 1.2275 level, and it’s finding immediate support at 1.2258 level. Closing of candles below 1.2258 level can open further room for selling until 1.2175 level while the resistance continues to hold at 1.2400 level. On the 4 hour chart, the GBP/USD has also formed a downward channel, which is extend selling bias, along with the 50 EMA, MACD, and RSI as all of the technical indicators are in support of selling. Let’s consider taking sell trades below 1.2345 level today.


USD/JPY – Daily Analysis

The USD/JPY pair was closed at 107.570 after placing a high of 107.882 and a low of 106.979. Overall the movement of USD/JPY remained bullish throughout the day. The USD/JPY extended its gains and raised for the 4th consecutive day on Monday on the back of improving risk sentiment that made it difficult for safe-haven Japanese Yen to find demand.

On Monday, China said that it would impose visa restrictions on certain United States individuals in response to the same move by Washington on Chinese officials over the Hong Kong issue. The Chinese Ministry of Foreign Affairs spokesman Zhao Lijian said that the visa restrictions would be imposed on confident Americans with egregious conduct relating to Hong Kong.

He added that national security law for Hong Kong was purely China’s internal affairs, and foreign countries had no right to interfere. He said that attempts from Washington to destruct China’s legislation for safeguarding national security in Hong Kong would never succeed. This increased the risk sentiment, and hence, the USD/JPY pair gained.

On the data front, the Retail Sales for the year from Japan was released at 4:50 GMT, which dropped by 12.3% against the forecasted decline by 11.6% and weighed on Japanese Yen that raised USD/JPY across the board. At 19:00 GMT, the Pending Home Sales from the United States on Monday for May increased to 44.3% against the forecasted 18.9% and supported the U.S. dollar, which helped USD/JPY to gain traction in the market. Meanwhile, the U.S. Dollar Index, which dropped to a daily low of 96.11, gained traction and reached 97.50 and helped the USD/JPY pair to surge further.

Daily Support and Resistance    

  • R3 107.39
  • R2 107.31
  • R1 107.27

Pivot Point 107.19

  • S1 107.14
  • S2 107.07
  • S3 107.02

USD/JPY – Trading Tips

Technically, the USD/JPY pair is trading with a bullish bias of around 107.660. On the three hourly charts, the USD/JPY is gaining bullish support by the regression channel. The upward channel has the potential to support the USD/JPY pair around 107.395 level. Closing of candles above this level can drive buying until 107.950, while below 107.390, the USD/JPY may drop until 106.835 level. The 50 EMA is supporting bullish bias; therefore, we should look for buying over 107.350 today. Good luck! 

Categories
Crypto Market Analysis

Daily Crypto Review, Jun 30 – Crypto Debit Cards are Dead? Crypto Market Preparing For a Move

The cryptocurrency market has had a slow day, with most cryptos seeking consolidation after a turbulent weekend. Bitcoin is currently trading for $9,161, which represents an increase of 0.66% on the day. Meanwhile, Ethereum gained 1.02% on the day, while XRP gained 0.12%.

 Daily Crypto Sector Heat Map

When talking about top100 cryptocurrencies, SwissBorg gained 18.17% on the day, making it by far the most prominent daily gainer. Elrond (12.74%) and Flexacoin (10.34%) also did great. On the other hand, The Midas Touch has lost 6.55%, making it the most prominent daily loser. It is followed by Ren’s loss of 5.09% and Bitcoin Gold’s loss of 4.36%.

Top 10 24-hour Performers (Click to enlarge)

Bottom 10 24-hour Performers (Click to enlarge)

Bitcoin’s dominance level increased slightly since we last reported, with its value currently at 65.4%. This value represents a 0.15% difference to the upside when compared to yesterday’s value.

Daily Crypto Market Cap Chart

The cryptocurrency market capitalization stayed at exactly the same place when compared to yesterday, with the market’s current value being $261.24 billion. This value represents an increase of $1.82 billion when compared to the value it had yesterday.

_______________________________________________________________________

What happened in the past 24 hours?

_______________________________________________________________________

_______________________________________________________________________

Technical analysis

_______________________________________________________________________

Bitcoin

The largest cryptocurrency by market capitalization took the time to recover after a pretty volatile weekend. The price surpassed yesterday’s price, but not by much. Even so, the 21-period moving average is tackled, and Bitcoin is now using it as a support rather than a resistance level. However, its moves to the upside were stopped by the 50-period moving average as well as the $9,251 resistance level.

Traders should closely pay attention to how well Bitcoin reacts to immediate support and resistance levels, as well as to the 21-period and 50-period moving averages.


BTC/USD 4-hour Chart

Technical factors:

  • Price is below its 50-period EMA and above its 21-period EMA
  • Price above the Middle B.B. (20period SMA)
  • RSI near the middle point (52)
  • Slightly above-average Volume

Key levels to the upside          Key levels to the downside

1: $9,251                                 1: $9,120

2: $9,580                                 2: $8,980

3: $9,735                                  3: $8,820

Ethereum

Ethereum had an interesting day, as its price was not so stagnant. The second-largest cryptocurrency by market cap made a move to the upside in order to confirm breaking of $225.4 to the upside. After this was done successfully, the move got stopped in between the 21-period moving average to the downside and the 20-period SMA to the upside.

Ethereum traders should pay attention to support and resistance levels more than the moving averages, as it seems that Ethereum respects clear horizontal levels a bit more.

ETH/USD 4-hour Chart

Technical Factors:

  • Price below the 50-period EMA and above the 21-period EMA
  • Price right below Middle B.B. (20-period SMA)
  • RSI near the middle point (51)
  • Average (low) Volume

Key levels to the upside          Key levels to the downside

1: $228                                    1: $225.4

2: $240                                    2: $217.7

3: $251.4                                  3: $198

Ripple

The third-largest cryptocurrency by market cap had a slow day, even with slightly elevated volume. XRP tried to break the $0.178 resistance level over the course of the day but failed to do so many times. As both 21period EMA and 20-period SMA are currently at the $0.178 level, XRP’s price might slowly go down as these moving average lines lower.

There aren’t many XRP trading opportunities at the moment, but most of them are completely straightforward, as they are always happening with sharp increases in volume. If XRP goes down, It is heavily guarded by the descending line which can be traded off of.

XRP/USD 4-hour Chart

Technical factors:

  • XRP in a mid-term descending trend
  • XRP lacks strong support levels below $0.178
  • The upside is guarded by the 21 and 50-period EMA
  • Price slightly below the Middle B.B. (20 SMA)
  • RSI is below the middle point (44)
  • Average Volume

Key levels to the upside          Key levels to the downside

1: $0.178                                    1: $0.147

2: $0.19                                    

3: $0.2


Categories
Crypto Market Analysis

Daily Crypto Review, Jun 29 – Grayscale Buying Bitcoin Non-Stop: Preparing For a Bull Run or Whales Dumping BTC?

The cryptocurrency market has had a somewhat turbulent weekend. Most cryptocurrencies’ prices tumbled on Jan 27 as Bitcoin led the move to the downside but quickly started gaining bullish momentum and recovered over the rest of the weekend. Bitcoin is currently trading for $9,103, which represents an increase of 1.64% on the day. Meanwhile, Ethereum gained 2.82% on the day, while XRP gained 1.11%.

 Daily Crypto Sector Heat Map

When talking about top100 cryptocurrencies, Bitcoin Gold gained an astonishing 30.57 on the day, making it by far the most prominent daily gainer. Celsius (13.56%) and NULS (13.27%) also did great. On the other hand, Flexacoin has continued extremely bad performance, and is the worst daily performer once again, with a daily loss of 22.66%. It is followed by SwissBorg’s loss of 4.08% and BAT’s loss of 3.72%.

Top 10 24-hour Performers (Click to enlarge)

Bottom 10 24-hour Performers (Click to enlarge)

Bitcoin’s dominance level increased slightly since we last reported, with its value currently at 65.25%. This value represents a 0.22% difference to the upside when compared to Friday’s value.

Daily Crypto Market Cap Chart

The cryptocurrency market capitalization stayed at exactly the same place when compared to Friday, with the market’s current value being $259.88 billion. This value represents an increase of $1.52 billion when compared to the value it had on Friday.

_______________________________________________________________________

What happened in the past 24 hours?

_______________________________________________________________________

_______________________________________________________________________

Technical analysis

_______________________________________________________________________

Bitcoin

The largest cryptocurrency by market capitalization had quite a volatile weekend. It dropped heavily in price on Saturday as a response to the PlusToken Ponzi scheme sell-off. The price reached a low of $8,820 before bouncing back. Bitcoin bulls managed to bring the price back above $9,000 and further until the price has collided with the 4-hour 21-period moving average.

Traders should closely pay attention to how well Bitcoin reacts to immediate support and resistance levels, as well as to the 21-period and 50-period moving averages when recovering from bearish moves or consolidating after bullish moves.

BTC/USD 4-hour Chart

Technical factors:

  • Bitcoin is creating lower lows
  • Price is below its 21 and 50-period EMA
  • Price at the Middle B.B. (20period SMA)
  • RSI near the middle point (47)
  • Below-average Volume

Key levels to the upside          Key levels to the downside

1: $9,251                                 1: $9,120

2: $9,580                                 2: $8,980

3: $9,735                                  3: $8,820

Ethereum

Ethereum followed Bitcoin’s initiative throughout the weekend and mirrored its moves (with more or less strength). The price drop on Saturday brought the price to the $217.7 support level before slowly returning to its previous levels before the price drop. Ethereum is now fighting for the $225.4 level, which it is currently above.

As mentioned in our previous articles, Ethereum doesn’t have much initiative at the moment except for following Bitcoin’s moves. Traders can use that to either trade within a range while Bitcoin isn’t moving or to trade ETH with the trend as it is (on average) making larger moves in the same direction than Bitcoin.

ETH/USD 4-hour Chart

Technical Factors:

  • Price gain stopped by the 21 and 50-period EMA
  • Price right below the Middle B.B. (20-period SMA)
  • RSI near the middle point (46)
  • Average (low) Volume

Key levels to the upside          Key levels to the downside

1: $228                                    1: $225.4

2: $240                                    2: $217.7

3: $251.4                                  3: $198

Ripple

The third-largest cryptocurrency by market cap followed Bitcoin all throughout the weekend (in both its move to the downside and upside) but also followed its descending path. XRP fell right to the descending trend line, which held up nicely and triggered a price bounce. This line has proven itself as strong support. However, XRP fell below the $0.178 in the process, and the price bounce couldn’t bring it back above it.

There aren’t many XRP trading opportunities, but most of them are completely straightforward as they are always happening with sharp increases in Volume.

XRP/USD 4-hour Chart

Technical factors:

  • XRP in a mid-term descending trend
  • XRP lacks strong support levels below $0.178
  • The upside is guarded by the 21 and 50-period EMA
  • Price slightly below the Middle B.B. (20 SMA)
  • RSI is below the middle point (43)
  • Average Volume

Key levels to the upside          Key levels to the downside

1: $0.178                                    1: $0.147

2: $0.19                                    

3: $0.2


Categories
Forex Daily Topic Forex Fundamental Analysis

Heard Of Germany’s ‘ZEW Economic Sentiment Index’?

Introduction

ZEW Economic Sentiment Index is a leading economic indicator that specially focuses on Germany and a few other countries. The correlation of the index with the growth is healthy. Hence, like any other business sentiment index, it is handy for our fundamental analysis to predict near-term economic activity, and identify potential opportunities.

What is the ZEW Economic Sentiment Index?

The ZEW Economic Sentiment Index is a sentiment index compiled out of the ZEW Financial Market Survey.  ZEW stands for Zentrum für Europäische Wirtschaftsforschung, which means the Center for European Economic Research.

ZEW Financial Market Survey 

It was introduced in 1991. A survey of about 350 analysts working at banks, insurances, and significant industrial firms are surveyed in a time frame of about two weeks. The proportion of participants from different sectors generally remains constant. It collects the general German sentiment or expectations with regards to the development of six international financial markets, especially Germany.

The panel of financial experts selected for the survey express their near-term expectations of the business cycle growth and progress, inflation rates, short and long term interest rates, stock market, exchange rates, and the oil prices. The survey questions aim to answer the situations in Germany, the USA, Japan, France, Great Britain, Italy, and the Euro-zone as a whole.

The experts are finally asked to assess the profitability of many economic sectors like banks, insurances, trade, construction, vehicle industry, chemistry, electronics, mechanical engineering, utilities, services, telecommunication, and information technology. Each expert forecasts on every category form a fraction that reflects different assumptions in percentages. The score from each individual in percentages are summed together to give an overall sentiment.

The results of this method, when it is applied to forecasted changes in the economic situation in Germany, is known as the “ZEW Indicator of Economic Sentiment.” The ZEW Indicator of Economic Sentiment is obtained from the results of the ZEW Financial Market Survey. It is computed as the difference between the percentage share of analysts that are bullish and those that are bearish towards the German economy in six months.

For instance, if 30% of the survey respondents predict the German economic situation to deteriorate, 20% expect it to remain the same as before, and 50% expect it to improve. The overall score of the survey would be a positive value of 20. It is a bullish reading and suggests that financial experts see positive signs for growth in the medium term.

Note: The IFO Business Climate Index is also a similar survey-based index that is popular in Germany. It is also a monthly report that surveys over 7,000 companies in Germany to obtain business condition sentiment for the near term. It measures business confidence and is also a leading indicator. It is a weighted index, meaning company scores are weighted in based on their contribution to the economy’s revenue.

However, the ZEW panel comprises of financial experts and is more diverse in its area of coverage as it also publishes estimates about other economic zones outside of Germany. IFO is business sentiment, while ZEW is economic sentiment, economic sentiment is a broader gauge, and hence, for our fundamental analysis, it is more useful.

How can the ZEW Sentiment Index numbers be used for analysis?

Sentiment Index in any country or any sector is the leading economic indicators for traders, investors, economists, and policymakers. Since the ZEW Sentiment Index is composed of a panel of financial market experts, people who are well-versed with the economy and business cycles throughout their career, their assessments generally have a strong correlation with actual GDP growth.

As with any sentiment index, the ZEW index also tends to be overly sensitive to changes in the economy, meaning the results sometimes would seem exaggerated but in the right direction. For our analysis, the direction of the economy is essential, and the magnitude can be understood over time with historical data.

Overall, the Economic Sentiment Index is helpful for us to predict the upcoming six-month changes with a good amount of certainty.

Impact on Currency

Market volatility is sensitive to Economic Sentiment Indexes. Significant moves in the index cause volatility in the market. It is a leading indicator. The above picture is a snapshot of ZEW for the past one year.

High Positive Economic Sentiment Index figures translate to improving economic prospects, which will translate to higher GDP prints and currency appreciation. Low or NegativeEconomic Sentiment Index figures translate to possible business slowdowns in the near-term, in extreme cases, even a recession. It will translate to the contracting economy, and lower GDP print, and thereby leading to currency depreciation.

Economic Reports

The ZEW Economic Sentiment Index is released every month on its official website, with insightful comments on different sectors. The IFO reports and ZEW Economic Sentiment Index are the two popular Sentiment Indexes in Germany.

Other companies also publish Economic Sentiment numbers, and IHS Markit Group is one such company that puts out numbers on the international scale for many countries. Internationally, IHS Markit business surveys are popular, but within Germany, ZEW is more popular amongst the traders, investors, policymakers.

Sources of ZEW Economic Sentiment Index

We can monitor the reports on the official website of the ZEW.

We can also go through the Sentiment Index of other countries here.

We can also find the aggregated statistics of all business confidence indexes for various countries here.

Impact of the ”ZEW Economic Sentiment Index” news release on the Forex market

In the previous section of the article, we understood the ZEW Economic Sentiment fundamental indicator, which essentially rates the outlook of an economy for a six-month period. On the index, a level above zero indicates optimism, below indicates pessimism. It is a leading indicator of economic health.

The reading is compiled from a survey of about 350 German institutional investors and analysts. Therefore, it is given a fair amount of importance from investors, especially when analyzing growth in the Eurozone. The ZEW financial market survey covers a number of areas, sectors, and regions which are used to create the ZEW Economic Sentiment.

In this part of the article, we will examine the impact of the ZEW Economic Sentiment indicator on the value of various currencies involving the EUR and witness the change in volatility. For that, we have collected the latest data of ZEW Economic Sentiment, which was published in the month of April. We can see in the below image that the index jumped by a huge margin in April 2020, which was well above market expectations.

EUR/USD | Before the announcement

Let us start with the EUR/USD currency pair to observe the impact of the ZEW Economic Sentiment Indicator on the value of EUR. The above image shows the state of the chart before the news announcement, where we see that the price is in a downtrend, and very recently, the price has formed a ”range.” Just before the news release, the price is at the bottom of the ”range,” so we can expect buyers to come back in the market, initiating some strength in the Euro.

EUR/USD | After the announcement

After the news announcement, market crashes below the ”support” of the ”range” and volatility increases to the downside. Although the ZEW Economic Sentiment was extremely positive for the economy, market participants do not by Euro immediately at the ”news candle,” but instead, we see a rally in the price after the close of ”news candle.” Thus, we witness moderate volatility in the currency pair after the news release.

EUR/CAD | Before the announcement

The above images represent the EUR/CAD currency pair, where, in the first image, we see that the market is in an uptrend signifying strength in the Euro. Currently, the price is at its highest point, crossing the previous ”higher high.” As per the technical analysis, we should wait for price retracement to a ”support” or ”demand” area in order to join the trend. Depending on the impact of the news release, we will position ourselves in the currency.

EUR/CAD | After the announcement

After the news announcement, the price initially falls lower due to volatility, but it does not sustain at that level where the buyers immediately take the price higher. We can see that the market bounces exactly from the moving average and continues to move higher. The market is seen to react oppositely to the ZEW Index at the time of release, but one should not conclude the impact of news from just one candle.

EUR/AUDBefore the announcement


EUR/AUD | After the announcement

The above images are that of the EUR/CAD currency pair, where we see that before the news announcement, the market is in a strong uptrend again, signifying the great amount of strength in the Euro. Just before the release, the price appears to be at the ”supply” area, which means we should expect some selling pressure from this point. A breakout trade is possible if the price sufficiently breaks the ”supply” area.

After the news announcement, we witness slight bearishness in the currency but was not large enough to cause a reversal of the trend. We see that the price only hovers at the ”supply” area, with no major impact, which results in a breakout.

That’s about the ‘ZEW Economic Sentiment Index’ and the relative impact of its news announcement on the Forex price charts. Let us know if you have doubts regarding the article in the comments below. Cheers!

Categories
Forex Fundamental Analysis

Did You Know That ‘Internet Speed’ Of A Nation Is Also Considered A Forex Fundamental Driver?

What is Internet Speed?

Internet Speed refers to the speed at which data, voice, and video travel long distances. This is achieved with the help of broadband. Broadband refers to the transmission technologies used to transmit the internet. The term is used to describe high-speed and high-bandwidth communication infrastructure. Without broadband, it is not possible to attain high-speed internet at any cost. The common medium of transmission technologies includes coaxial cable, fiber optic cable, and radio waves.

(Source: Statista.com)

Business and Internet Speed  

Companies accessing the internet is nothing new. In the 80s, banks and Wall Street began changing the way they dealt with information. Back then, internet-related tasks were accomplished with the help of a simple modem and dial-up connection. In today’s demand scenario, much faster and reliable systems of internet connection are required. Business owners and IT professionals have a lot to choose from.

High-speed internet leads to greater advantages for companies that rely on cloud-based apps and data. According to the study conducted by an international group, a city with high-speed internet, over a gigabit connection, has an overall healthier economy. The research was carried out by comparing 14 metropolitan areas where more than half the population has access to high-speed internet with that of 40 neighboring cities without high-speed internet.

It was reported that cities that had gigabit connections, like the fiber optics, can support a 1.1% higher gross domestic product than other “slower internet” cities. A 1.1% contribution might soundless, but when this is seen in the context of developed countries that grow a minimum of 1-2% every year, one can estimate how significantly it can impact economic growth. It could mean up to $1.5 billion in the local economy.

Importance of High-Speed Internet

On a global level, increasing internet speeds have the power to transform whole economies. During the keynote speech at Broadband World Forum, Johan Wiberg (Head of Business Unit Network, Ericsson) described that when more and more people begin to have access to high-speed internet and mobile broadband, people will find new ways to conduct the businesses.

High internet speed has the power to spur economic growth by creating efficient systems for businesses and consumers. It opens up opportunities for more advanced online services, smarter utility services, and telecommunication. In healthcare, for instance, innovative mobile applications will be used by nearly 800 million people.

But when it comes to high-speed internet, it is not easy to launch into an area overnight. It takes effort from companies and governments to introduce data and wi-fi connectivity in rural areas. Hence, the positive effects of these new technologies are hard to see right away. As more and more businesses get access to high-speed internet, whole verticals of the economy will transform.

With these effects sounding exciting, one shouldn’t expect higher income levels with the introduction of high-speed internet in our communities. When governments and policymakers fully comprehend the importance of digital highways, it is then we can find drastic changes in the economy in no time.

Countries with Fastest Internet around the World

Taiwan has the fastest internet with an average speed of 85Mbps, followed by Singapore, Jersey, Sweden, and Denmark. While Yemen has the slowest internet in the world with an average speed of just 0.38Mbps. Thirty-seven of the fifty fastest internet countries are located in Europe, with 10 in Asia, 2 in North America, and just 1 in Africa. The global internet speed is getting faster.

The previous year, global average internet speed was 9.1Mbps while this year, the global average is 11.03Mbps, a rise of more than 20%. Generally speaking, countries which have the fastest internet speeds are the ones which are small and developed. The larger & less developed a nation is, the slower will be the internet.

By looking at the present statistics, we can say that there is little change in development, availability, and rollout of faster infrastructure in the bottom half of the ranking compared to the top half.

Below is the avg Internet Speed of different countries in the world (In terms of MBPS)

(Source – Fastmetrics)

Impact on Currency 

Temporary internet shutdown in a high connectivity country is estimated to have a GDP impact per 10 million people per day of $23.5 million on average. The average impact in a medium connectivity country would be an estimated $6.5 million and $0.6 million of GDP, respectively. Therefore, Internet Speed does impact the value of the currency as well. But it does not an immediate impact, rather the effect is felt on a longer-term.

Sources of information on Internet Speed

There are many speed testing websites that calculate internet speed and keep them updated every few minutes. However, this information cannot be found on most of the economic websites as it is a very important economic indicator for traders. The website of telecommunication ministry is also a source of information on the internet and broadband.

Links to Internet Speed information sources

GBP (Sterling) – https://tradingeconomics.com/united-states/internet-speed

AUD – https://tradingeconomics.com/australia/internet-speed

USD – https://tradingeconomics.com/united-states/internet-speed

CAD – https://tradingeconomics.com/canada/internet-speed

JPY – https://tradingeconomics.com/japan/internet-speed

CHF – https://tradingeconomics.com/switzerland/internet-speed

Final Words

Broadband has created new sectors and redefined the old ones. The music industry, for example, after years of declining sales, is growing rapidly after the adoption of digital distribution models. All this is possible only with the help of fast internet. As broadband becomes abundant and faster, everything from retail to government services finds new ways to reinvent themselves, especially in knowledge-based sectors where such speed and efficiency can enhance competitiveness.

Digital infrastructure opens up possibilities for more advanced online services, smarter utility services, e-health, telecommunication, and telepresence. All are dependent on high-speed broadband networks. Hence Internet Speed of a nation pays a key role in determining how advanced the country is in terms of technology as well.

Having that said, the news release of Internet Speed figures for different countries doesn’t really affect the Forex price charts in any way. Hence, technical analysts can ignore this fundamental driver’s news announcements. Cheers!

Categories
Forex Market Analysis

Daily F.X. Analysis, June 26 – Top Trade Setups In Forex – Potential Breakouts Everywhere!

The fundamental side is again muted with a limited number of economic events that don’t have the potential to drive major movement in the market today. Therefore, the focus will remain on the technical side of the market.

Economic Events to Watch Today 


EUR/USD – Daily Analysis

The EUR/USD pair was closed at 1.12177 after placing a high of 1.12595 and a low of 1.11902. The EUR/USD pair posted losses on Thursday for the second consecutive day on the back of U.S. dollar strength amid risk-averse market sentiment. The worries over an increase in the number of coronavirus cases across the globe raised fears in the market. The number of death tolls in the U.S. topped to 120 thousand, and the number of rising cases reached 2.4M.

The S&P 500 declined to a 2-week lowest by 2.55% on Thursday. The U.S. Dollar Index rallied higher on the day but remained within a broader range near the starting point of the month. On the data front, at 11:00 GMT, the German GfK Consumer Climate for June supported Euro when it came in as -9.6 against the forecasted -11.7.

On Thursday, ECB released its last monetary policy meeting minutes, which revealed that ECB aimed to neutralize a German court ruling and to justify its bond purchasing scheme. ECB will also release confidential documents to curb the threat.

In May, Germany’s constitutional court threatened to block the central bank from participating in the stimulus plan unless ECB could prove that its government debt purchases exceeded the legal limits. German court provided a time period of 3 months to ECB to prove that. The critics argued that the bond purchases exceeded the ECB’s mandate, and the leading judge of the court said that ECB should not consider itself the ‘master of the universe.’

In monetary policy minutes, the ECB also underlined the delicate economic situation with millions of jobs at risk and inflation at weak levels. The forecast for Eurozone’s deep recession was also mentioned while stressing the efficiency of stimulus measures in helping to stimulate economic growth.

In short, the minutes send two messages: the ECB was ready to do more if needed, and the ECB efforts to end the conflicts with the German Constitutional court. Whereas, from the U.S., the Core durable goods orders for May increased by 4.0% against the forecasted 2.1% and supported the U.S. dollar. The Durable goods orders for May also increased by 15.8% against the expected 10.3% and supported the U.S. dollar, which weighed on EUR/USD pair on Thursday.

Daily Support and Resistance

  • R3 1.1383
  • R2 1.1355
  • R1 1.1304

Pivot Point 1.1276

  • S1 1.1225
  • S2 1.1197
  • S3 1.1147

EUR/USD– Trading Tip

The EUR/USD is trading in a narrow range of 1.1243 – 1.1193 level, which limits the price action for now. On the lower side, the EUR/USD pair can drop towards 1.1145 level upon the bearish breakout of 1.1193 level, while the bullish breakout of 1.1243 level will allow us to go long. Simultaneously, the RSI and MACD are still in a bearish zone, while the 50 EMA also suggests selling bias. Therefore, we should look for selling trades below 1.1250 levels.  


GBP/USD – Daily Analysis

The GBP/USD pair was closed at 1.24184 after placing a high of 1.24642 and a low of 1.23888. Overall the movement of GBP/USD pair was flat throughout the day. The GBP/USD pair attempted to recover amid the hopes of Brexit breakthrough as the next round of face-to-face talks came. However, the fresh Brexit optimism was not expected to offset the disappointing U.S. coronavirus data giving strength to the greenback.

Britain’s chief negotiator David Frost warned Michel Barnier to ‘get real’ ahead of the face-to-face meeting in months. Both men will conduct an intensified round of talks at the Commission headquarters on Monday in a view to strike a breakthrough.

Frost said that he would go to Brussels in good faith to engage with the E.U.’s concerns, and this should be a real negotiation, and for that, E.U.’s unrealistic positions must have to change if they wanted the U.K. to move forward.

He added that U.K. sovereignty over its laws, its courts, and its fishing waters were not up for discussion. He also said that the U.K. did not seek anything that could undermine the E.U.’s single market. This raised the bars that the Brexit deal could be done when the face-to-face meeting will happen, but at the same time, the U.K.’s decision not to show any relaxation towards E.U.’s demands weighed on the positive expectations.

According to the European Social Survey (ESS), a pan-European poll carried out every two years, 56.8% of respondents in the U.K. showed a willingness to remain in Europe while 34.9% said that they would leave the bloc while 8.3% said that they would not vote at all. This survey also exerted pressure on GBP/USD on Thursday.

On the other hand, at the economic data front, the CBI Realized Sales from Great Britain remained flat with the expectations of -37 in June. While from the American side, the core durable goods order gave strength to the U.S. dollar when exceeded the expectations of 2.1% and came in as 4.0% and weighed on GBP/USD. The durable goods orders from the U.S. in May also exceeded 15.8% from the expected 10.3% and supported the U.S. dollar to weigh on GBP/USD pair. However, the Unemployment claims exceeded 1.480M from the expected 1.320M and weighed on the U.S. dollar, which supported the GBP/USD pair. Hence, the GBP/USD remained flat throughout the day.

Daily Support and Resistance

  • R3 1.2633
  • R2 1.2588
  • R1 1.2504

Pivot Point 1.2459

  • S1 1.2375
  • S2 1.233
  • S3 1.2245

GBP/USD– Trading Tip

The GBP/USD extends trading with bearish momentum at 1.2406 level, having disrupted the 1.2460 support level. This mark is presently serving as resistance and can point the GBP/USD prices lower until 1.2380 level. On the downside, the Cable may find support around 1.2380 and 1.2336 levels. Acknowledging the fresh bearish crossover on the MACD and bearish bias extended by the RSI, the pair can show us a bearish trend. The 50 EMA is also proposing selling sentiment; hence, we should consider taking selling trades below 1.2459 level on Friday. 


USD/JPY – Daily Analysis

The USD/JPY pair was closed at 107.050 after placing a high of 107.069 and a low of 106.382. Overall the movement of USD/JPY remained bullish throughout the day. The US Centers for Disease Control and Prevention (CDC) Director Robert Redfield recently said that the number of actual confirmed cases is ten times bigger than reported cases. The Redfield indicated that approximately 92 to 95 % of the U.S. population is still in trouble by the fears of ever-increasing virus figures. There are 37,667 new cases with 692 deaths in America on June 25 as per the latest report, which initially weighs on the risk sentiment and contributed to the yellow-metal gains.

The risk-off market was further bolstered by the latest report that the United States recently announced to impose fresh sanctions on eight entities connected with Iran’s metal industry that supply revenue for the country’s Revolutionary Guard Corps. As per the U.S. Secretary of State Mike Pompeo tweet, “Today, we are sanctioning nine entities for their connections to Iran’s metals sector. Iran’s leaders must stop squandering resources to support proxies abroad while Iranians suffer.” which adds strength to the risk-tone and weighs on the riskier assets.

It’s worth mentioning that the U.S. also imposed sanctions on a Chinese company known as the Global Industrial and Engineering Supply Ltd., for providing graphite — a vital material in Iran’s metal industry — to Tehran in 2019.

Moreover, the reason behind the risk-off market sentiment could also be associated with the report of a huge unconfirmed blast in Tehran and the trade wars between the U.S. and the rest of the major global economies. It should be noted that the police have started to look into an incident that happened over the last few hours in Tehran, where a bright light and loud sound in the eastern portion of Tehran were reported.

Besides the geopolitical tensions, the Federal Reserve recently banned 34 largest banks from share buybacks in the 3rd quarter (Q3). As well as, the Federal Reserve capped dividend payment to the second quarter (Q2) levels for these banks. While the U.S. central bank also released gloomy analyses, due to the coronavirus (COVID-19) economic impact, which exerted some downside press on the risk-tone. 

Daily Support and Resistance    

  • R3 107.99
  • R2 107.54
  • R1 107.28

Pivot Point 106.83

  • S1 106.58
  • S2 106.12
  • S3 105.87

USD/JPY – Trading Tips

The USD/JPY is consolidating with bullish sentiment at 107.191 marks, but the closing of recent candles underneath 107.220 marks can encourage selling or retracement. Although the pair has violated the downward trendline resistance at 107 mark and technically, it should dispense selling the USD/JPY pair below 107.225. But we also require to recognize the double top resistance mark of 107.250. I will be glad to take a sell-trade if the USDJPY holds below 107.250 level to target 106.450 today. Good luck! 

Categories
Crypto Market Analysis

Daily Crypto Review, Jun 26 – Bitcoin’s Move Towards the Upside Stopped. What Should Traders Do?

The cryptocurrency market has spent the past 24 hours mostly consolidating or being slightly in the green, as the bull initiative wasn’t strong enough to push cryptos (mostly Bitcoin as the “pack leader”) higher. Bitcoin is currently trading for $9,227, which represents an increase of 1.54% on the day. Meanwhile, Ethereum gained 0.92% on the day, while XRP lost gained 1.03%.

 Daily Crypto Sector Heat Map

When talking about top100 cryptocurrencies, Compound came back from the biggest daily losers (yesterday) to a daily gain of 13.84 today. Celsius (8.27%) and Ren (8.16) also did great. Flexacoin was by far the worst daily performer, with a loss of 18.09%, then followed by SwissBorg’s loss of 5.38% and Seele-N’s loss of 5.31%.

Top 10 24-hour Performers (Click to enlarge)

Bottom 10 24-hour Performers (Click to enlarge)

Bitcoin’s dominance level increased slightly since we last reported, with its value currently at 65.03%. This value represents a 0.1% difference to the upside when compared to yesterday’s value.

Daily Crypto Market Cap Chart

The cryptocurrency market capitalization stayed at exactly the same place when compared to yesterday, with the market’s current value being $261.4 billion. This value represents an increase of $0.01 billion when compared to the value it had yesterday.

_______________________________________________________________________

What happened in the past 24 hours?

_______________________________________________________________________

_______________________________________________________________________

Technical analysis

_______________________________________________________________________

Bitcoin

The largest cryptocurrency by market capitalization spent the past 24 hours trying to recover and re-enter the triangle formation it fell from just a day ago. However, the bottom triangle line, combined with the 21-period moving average, stopped it in its tracks. With that being said, Bitcoin did gain some value on the day. However, that wasn’t enough to pass the $9,251 and confirm the breakthrough. The $9,120 level, which was problematic yesterday, was, however, tackled, and Bitcoin is now sitting strong above it.

Traders should closely pay attention to the future short-term development of Bitcoin. When no major volume spikes happen, Bitcoin is very responsive to its support/resistance levels as well as its moving averages. Traders can use that to their advantage.

BTC/USD 4-hour Chart

Technical factors:

  • Triangle Formation re-entering failed
  • Price is below its 21 and 50-period EMA
  • Price is between the Lower BB and Middle line (20period SMA)
  • RSI near the middle point (42)
  • Slightly elevated volume

Key levels to the upside          Key levels to the downside

1: $9,251                                 1: $9,120

2: $9,580                                 2: $8,980

3: $9,735                                  3: $8,820

Ethereum

Ethereum bounced back from its lower Bollinger Band and tried to make a move towards the upside, but got stopped in its tracks by the 21 and 50-period moving averages. The second-largest cryptocurrency by market cap seems to have acknowledged these lines and couldn’t make a move past them, therefore returning to a slightly lower price. Ethereum is still trading within a large range, bound by $228 (and $225.4 as stronger support) support level and the moving averages + $240 level to the upside.

If Bitcoin doesn’t make any sharp move, which will prompt Ethereum into moving, traders can take advantage of clear support and resistance levels and trade-off of them.

ETH/USD 4-hour Chart

Technical Factors:

  • Price gain stopped by the 21 and 50-period EMA
  • Price between the Lower BB and Middle line (20-period SMA)
  • RSI near the middle point (43)
  • Average Volume

Key levels to the upside          Key levels to the downside

1: $240                                    1: $228

2: $251.4                                 2: $225.4

3: $260                                     3: $217.7

Ripple

The third-largest cryptocurrency by market cap traded mostly sideways over the course of the day. It managed to bounce off from the lower Bollinger Band and strengthen its position around the $0.183 but failed to even attempt a move towards the upside as the upside seems to be guarded by the descending 21 and 50-period moving averages. However, the good thing is that XRP is stable and does not look like it will drop below $0.178 any time soon.

There aren’t many XRP trading opportunities, but most of them are straightforward as they are always happening with increased volume, and are one-sided and without many retracements. Traders might find a good, simple, and clean trade on XRP/USD here and there.

XRP/USD 4-hour Chart

Technical factors:

  • XRP in a mid-term descending trend
  • XRP lacks strong support levels below $0.178
  • The upside is guarded by the 21 and 50-period EMA
  • Price slightly above the Lower BB
  • RSI is below the middle point (42)
  • Elevated volume (returning to normal)

Key levels to the upside          Key levels to the downside

1: $0.19                                    1: $0.178

2: $0.2                                      2: $0.147

3: $0.205


Categories
Forex Market Analysis

Daily F.X. Analysis, June 25 – Top Trade Setups In Forex – U.S. GDP Under Spotlight!

As risk aversion emerged in the market, the U.S. dollar became strong, and equity prices in Wall Street started losing as the speed of the U.S. dollar rallied. On the news front, the eyes will be on the U.S. Final GDP, Durable Goods Orders m/m, and Unemployment Claims figures due to come out during the New York Session. Overall the macroeconomic events are expected to be positive, and these may keep the U.S. dollar bullish today while keeping gold bearish.

Economic Events to Watch Today 


EUR/USD – Daily Analysis

The EUR/USD pair was closed at 1.12499 after placing a high of 1.13257 and a low of 1.12481. Overall the movement of the EUR/USD pair remained bearish throughout the day. The EUR/USD pair in the risk-off market sentiment moved in a downward trend on Wednesday on the back of strong U.S. dollar and U.S. tariffs on E.U. & U.K.

On late Tuesday, a document from the United States Trade Representative office said that the U.S. was considering an additional list of products from France, Germany, Spain, and the U.K. to be placed with 100% duty. The products included olives, beer, chocolate, coffee, gin, some trucks, and machinery. The enforcement of the new tariffs will potentially take effect from July 26. The move was taken against the long-lasting dispute with E.U. over subsidies to large civil aircraft manufacturers.

In October, WTO ruled that Germany, France, Spain, and the U.K. granted illegal subsidies to plane-maker Airbus and allowed the U.S. to impose $7.5 billion in duties as part of the punishment. Furthermore, in December, WTO also said that the European Union did not end its illegal subsidies, which gave the U.S. further room to impose new tariffs on European products.

This weighed heavily on Euro and dragged the pair EUR/USD towards the negative side. EUR/USD pair was already under pressure due to risk-off market sentiment & U.S. dollar strength. However, the losses were limited as the better than expected macroeconomic data from Europe gave some strength to the Euro. At 13:00 GMT, the German Ifo Business Climate for June exceeded the expectations of 85.0 and came in as 86.2 and supported EUR/USD pair. On the other hand, the Belgian NBB Business Climate was expected as -25.1, which came in June as -22.9 and supported Euro.

As risk aversion emerged in the market, the U.S. dollar became strong, and equity prices in Wall Street started losing as the speed of the U.S. dollar rallied. The DXY was up 0.6 % and rose above 97.10 level on Wednesday. Dow Jones lost 2.40%, and Nasdaq lost 2.05%, the lower return in Wall Street Journal stocks was followed by the latest COVID-19 reports from the several U.S. States. The strength of the U.S. dollar remained a key driver for EUR/USD pair on Wednesday.

Daily Support and Resistance

  • R3 1.1383
  • R2 1.1355
  • R1 1.1304

Pivot Point 1.1276

  • S1 1.1225
  • S2 1.1197
  • S3 1.1147

EUR/USD– Trading Tip

The EUR/USD pair has violated the upward trendline support level of 1.1280, and now it’s finding support around 1.1240 level. The violation of the 1.1240 level can also extend sell-off until 1.1195. The MACD and RSI are holding in a selling zone, which is supporting the selling bias. On the lower side, recently, the formation of a bearish engulfing candle is also suggesting a strong selling bias. Today, we should look for taking a selling position below 1.1240 level to target 1.1195 level, but don’t forget to monitor the U.S. GDP, and Jobless claims data as these are the main ones to impact the market.   


GBP/USD – Daily Analysis

The GBP/USD pair was closed at 1.24199 after placing a high of 1.25425 and a low of 1.24141. Overall the movement of GBP/USD pair remained bearish throughout the day. The risk perceived, GBP/USD currency pair came under heavy pressure after the risk appetite from market faded h gave strength to the U.S. dollar. The GBP was one of the worst-performing currencies on Wednesday after AUD & NZD. Along with decreased risk appetite, Brexit uncertainties also weighed on British Pound. Britain’s Prime Minister Boris Johnson also unveiled new easing measures across England from July 4. This indicted the reopening of pubs and restaurants and less social distancing.

On Brexit front, the E.U. chief negotiator, Michel Barnier, said that he was neither optimistic nor pessimistic about achieving a deal and also described himself as determined to break the deadlock. He also believed that the deal was still possible.

He showed concerns and said that a failure to reach a deal with the European Union would only damage the U.K.’s economy. He added that it was in particular interest of Britain to reach an agreement and avoid no-deal Brexit. He also added that the E.U. was willing to find a margin of flexibility on the sticking point of Britain’s fishing water, but he did not include the level playing field in this statement.

However, talks between E.U. & U.K. will start in the coming week, and the U.K. was an inch closer to the 1st July deadline for extending the transition period, which will end on December 31. On the data front, there was no macroeconomic data to be released from the U.K. so, the pair showed technical movement and followed the U.S. dollar on Wednesday. 

At 18:00 GMT, the House Price Index for April from the United States came in as 0.2% against the expected 0.3% and weighed on the U.S. dollar. But GBP/USD pair failed to give attention to the macroeconomic data from the U.S. and continued falling on the back of a key technical level, which was rejected.day.

Daily Support and Resistance

  • R3 1.2633
  • R2 1.2588
  • R1 1.2504

Pivot Point 1.2459

  • S1 1.2375
  • S2 1.233
  • S3 1.2245

GBP/USD– Trading Tip

The Cable continues to trade with bearish momentum to trade at 1.2406 level, having violated the 1.2460 support level. This level is now working as resistance and can lead the GBP/USD prices until 1.2460 level. On the downside, the GBP/USD may gain support at 1.2380 level and 1.2336 level. Considering the recent bullish crossover on the MACD and bearish bias extended by the RSI, the pair is confusing traders about which way to move. The 50 periods EMA is still suggesting selling bias; therefore, we should consider taking selling trades below 1.2459 level today. 


USD/JPY – Daily Analysis

The USD/JPY pair was closed at 107.050 after placing a high of 107.069 and a low of 106.382. Overall the movement of USD/JPY remained bullish throughout the day. The USD/JPY pair extended the rebound on Wednesday, which was started on Tuesday from the lowest level in seven weeks, near the 106.00 level. The surge in USD/JPY prices was due to the U.S. dollar’s strength across the board.

The Japanese Yen failed to benefit from the declines in the Wall Street Journal and lower U.S. yields. The Dow Jones fell almost 3% on the day, and the S&P 500 fell 2.70%. The U.S. Treasury yield of 10 Years fell to 0.679%. Usually, the risk-off market sentiment tends to give strength to Japanese Yen on Wednesday, the yen fell, and the U.S. dollar gained traction on the back of increasing concerns related to coronavirus contagion.

The President of Chicago Fed, Charles Evans, said on Wednesday that no one at the central bank was thinking about negative interest rates and if Fed moved there it would be a big surprise. He said that there was more space for monetary stimulus and expected the economy to rebound in the other half of the year.

On the other hand, The Bank of Japan offered 8.28 trillion yen (US$ 77.74billiom) in loans to financial organizations under a new lending program. The new fund was aimed at channeling funds to cash strapped firms hit by the coronavirus pandemic. BOJ also eased monetary policy in March & April by pledging to buy more assets, gobble up unlimited amounts of government’s debt and create lending facilities to channel more money to firms.

After BOJ decided to pay 0.1 % interest to financial institutions for taking up loans from the central bank, the number of participants surged to 180 from only 18 in March. The central bank announced that the three-month loans would be extended from Thursday through December 25. On the data front, the Services Producer Price Index (SPPI) from Japan for May came in line with the expectation. From the American side, the House Price Index for April came in as 0.2% against 0.3% expected and weighed on USD.

Daily Support and Resistance    

  • R3 107.99
  • R2 107.54
  • R1 107.28

Pivot Point 106.83

  • S1 106.58
  • S2 106.12
  • S3 105.87

USD/JPY – Trading Tips

The USD/JPY is trading with a bullish bias at 107.191 level, but the closing of recent candles below 107.220 level can drive selling or correction un the market. Although the pair has violated the downward trendline resistance at 107 level and technically, it should show us more buying in the USD/JPY pair. But we also need to consider the double top resistance level of 107.250. I will be happy to take a buy-trade if the USDJPY manages to break above 107.250 level to target 107.650 today. Good luck! 

Categories
Crypto Market Analysis

Daily Crypto Review, Jun 25 – Craig Wright Plays the Autism Card; Crypto Market Crumbling

The cryptocurrency market has spent the past 24 hours, either establishing its current levels or gaining a bit of value. Bitcoin is currently trading for $9,090, which represents a decrease of 5.76% on the day. Meanwhile, Ethereum lost 7.04% on the day, while XRP lost 4.98%.

Daily Crypto Sector Heat Map

Cryptocurrencies below the top50 did the best in the past 24 hours, with Quant gaining 19.69%, Flexacoin 19.53%, and Synthetix Network 13.15%. Seele-N was by far the worst daily performer, with a loss of 22.69%, followed by Compound’s loss of 12.70% and Siacoin’s loss of 10.27%.

  Top 10 24-hour Performers (Click to enlarge)

Bottom 10 24-hour Performers (Click to enlarge)

Bitcoin’s dominance level decreased slightly since we last reported, with its value currently at 64.93%. This value represents a 0.18% difference to the downside when compared to yesterday’s value.

Daily Crypto Market Cap Chart

The cryptocurrency market capitalization decreased greatly when compared to yesterday, with the market’s current value being $261.39 billion. This value represents a decrease of $14.46 billion when compared to the value it had yesterday.

_______________________________________________________________________

What happened in the past 24 hours?

_______________________________________________________________________

_______________________________________________________________________

Technical analysis

_______________________________________________________________________

Bitcoin

The largest cryptocurrency by market capitalization spent the past 24 hours falling sharply after not being able to pass the $9,735 level. Bears came into play after bears exhausted themselves on trying to push beyond the immediate resistance of $9,735, which made it easy for them to drastically bring Bitcoin’s price down. The most recent price drop brought it to the $8,980 support level, but Bitcoin quickly recovered to above-$9,000 levels. Bitcoin is trading on increased volume, while its RSI grazed the oversold territory without entering it.

The short-term future of Bitcoin will be decided on how it tackles the $9,120 level (if it ends up above or below it).

BTC/USD 4-hour Chart

Technical factors:

  • Triangle Formation broken to the downside
  • Price is below its 21 and 50-period EMA
  • Price is on top of the Lower BB
  • RSI near the oversold territory
  • Elevated Volume

Key levels to the upside          Key levels to the downside

1: $9,251                                 1: $9,120

2: $9,580                                 2: $8,980

3: $9,735                                  3: $8,820

Ethereum

Ethereum lost quite a bit of its value as well (in fact, even more than Bitcoin). The second-largest cryptocurrency by market cap dropped from the high of $250 all the way down to $227. It is currently trying to find a spot to consolidate at (the most probable consolidation price would be around $230). Ethereum is currently trading on elevated volume, with its RSI dropping to below-40 levels.

ETH/USD 4-hour Chart

Technical Factors:

  • Price below 21 and 50-period EMA
  • Price just above the Lower BB
  • RSI under the value of 40
  • Elevated Volume

Key levels to the upside          Key levels to the downside

1: $240                                    1: $228

2: $251.4                                 2: $225.4

3: $260                                     3: $217.7

Ripple

Just taking a look at the XRP/USD chart, we can see that the third-largest cryptocurrency by market cap has an extremely bearish outlook. XRP followed the overall crypto market trend and dropped in price in the past 24 hours, therefore losing the opportunity to contest (and possibly pass) the $0.19 resistance level. However, XRP did not fall under its $0.178 resistance, as the buying pressure was strong enough to hold the bears. XRP is currently recuperating from the drop at the $0.18 level.

XRP/USD 4-hour Chart

Technical factors:

  • XRP in a mid-term descending trend
  • XRP lacks strong support levels below $0.178
  • Price is below its 21 and 50-period EMA
  • Price is on top of the Lower BB
  • RSI in the oversold territory
  • Elevated Volume

Key levels to the upside          Key levels to the downside

1: $0.19                                    1: $0.178

2: $0.2                                      2: $0.147

3: $0.205


Categories
Forex Videos

Fundamental Analysis For Novices – China Fixed Asset Investments


Fundamental Analysis For Novices – China Fixed Asset Investments

Welcome to the educational video on Fundamental Analysis For Novices. In this session, we will be looking at some Chinese economic data, including Fixed Asset Investment, NBS Press Conference, Industrial Production, and Retail Sales.


If you are not already doing so, we advise you to check a reliable economic calendar each day to be forewarned about economic data releases from countries that might affect your trades.


Economic data releases impact the market in various degrees, and you should pay particular attention to the date of the event, the time, and most importantly, the likely impact it will have, which usually is in 3 degrees, low, medium, and high.


Reliable calendars will provide you with the previous data release in each category, the consensus, or the expected data release. This will have been compiled by analysts and economists who have come to an average consensus value and the actual figure, which is updated with the data upon release.
Each country releases similar titled economic data into the market, mostly on an embargoed basis, in order not to give traders an advantage and to avoid market manipulation.


China typically releases economic data releases during the Asian session. It is released by the National Bureau of Statistics of China. And due to the complex nature of the coronavirus pandemic and due to the fact that China was the first country to be severely affected by the disease and the fact that it is the first country to have significantly recovered from the disease, data coming out of the country is of greater market focus at the current time, than perhaps previously.
It is also important to remind ourselves that there is a brewing amount of this quiet between the United States and China and other countries and China who feel that China should have been more proactive when the disease initially broke out.


In the first instance, we can see that there is data due for release for fixed asset investments, year-to-date, year on year, and for the month of May, in monetary value.
Fixed asset purchases is a comprehensive index in the area of construction. These are also known as tangible assets, including machinery, land, buildings, installations, vehicles, and technology. The figure itself shows the scale of pace with regard to overall economic growth within urban investments. In general, a higher number he seemed as bullish for China while a lower number is considered negative. As the whole world looks towards China with regard to how it improves its economic position post epidemic, outside countries who trade with China view this as a significant release.


The data release is followed by a National Bureau of Statistics press conference where a prepared text is usually offered to the media and which will also shed light on the economic situation within China.

Also simultaneously released into the market is industrial production year on year on year for May. Again this has significant importance because it shows the volume of production within Chinese Industries, including factories and manufacturing. This data can also have an effect on inflation and, in which case it is closely monitored by the People’s Bank of China who will adjust monetary Policy if inflation falls outside of its target range.
Generally, high industrial production growth is positive, both in sentiment terms and economic terms for the country, and is seen as bullish. If the reading is low or negative, it means that China is still struggling to improve its economy post epidemic.


And finally, also simultaneously released into the market is retail sales year on year for May. This will also be viewed by all markets as important because it shows the recovery status for China and whether or not the general public is feeling confident enough to go out and purchase goods where they are available in outlets which have been allowed to reopen or have the confidence to post epidemic.
The figure measures the total receipts for retail consumer goods for household purchases, and in general, a high reading is positive because it shows the economy returning to normal, while a low reading is seen as negative, meaning that the Chinese economy is still struggling.
Therefore during the Asian session, you might expect that stock markets rally if the news is good, and you might find that stock markets fall if the news is bad. Commodity countries such as Australia and New Zealand who export heavily into China, might find that their local currencies improve against the dollar if the numbers are high, is because it means China is improving its economy and likely to be importing goods from these countries. And the opposite applies if the data from China is poor.