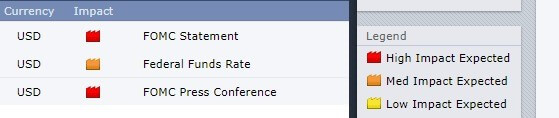
On the news front, the market isn’t expected to offer any major economic event today; therefore, most of the market movement is likely to be based upon technical levels. Choppy sessions are expected today.
Economic Events to Watch Today
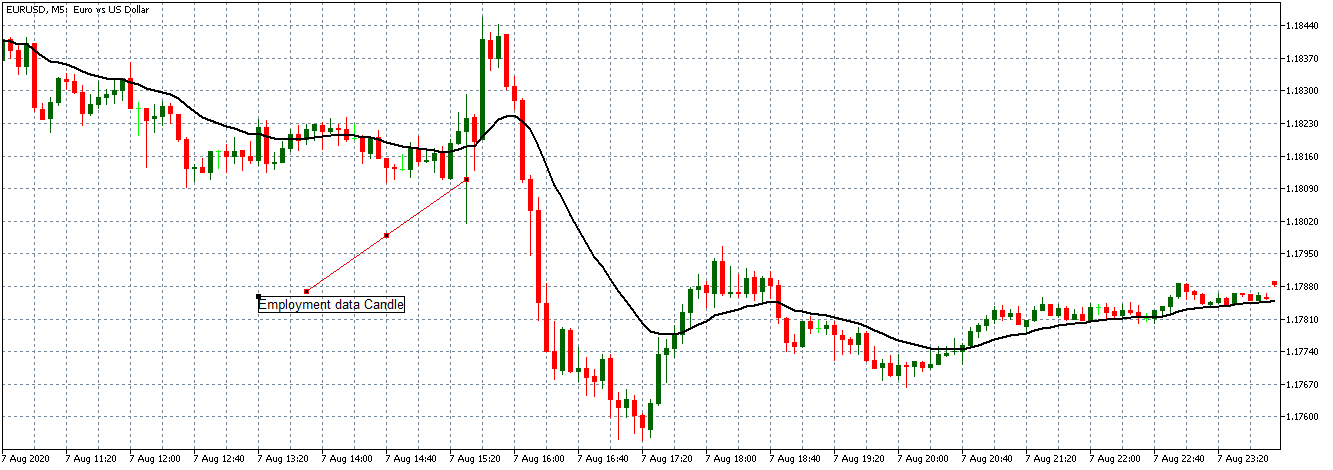
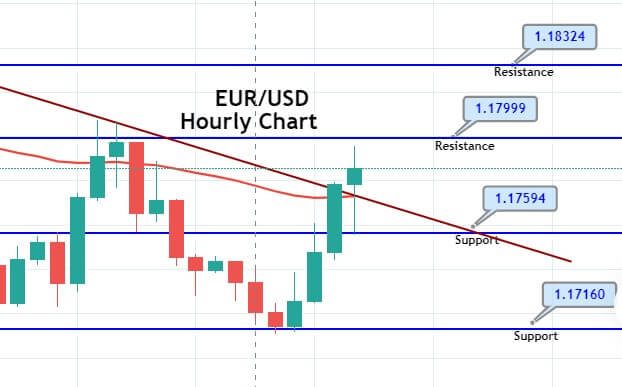
EUR/USD – Daily Analysis
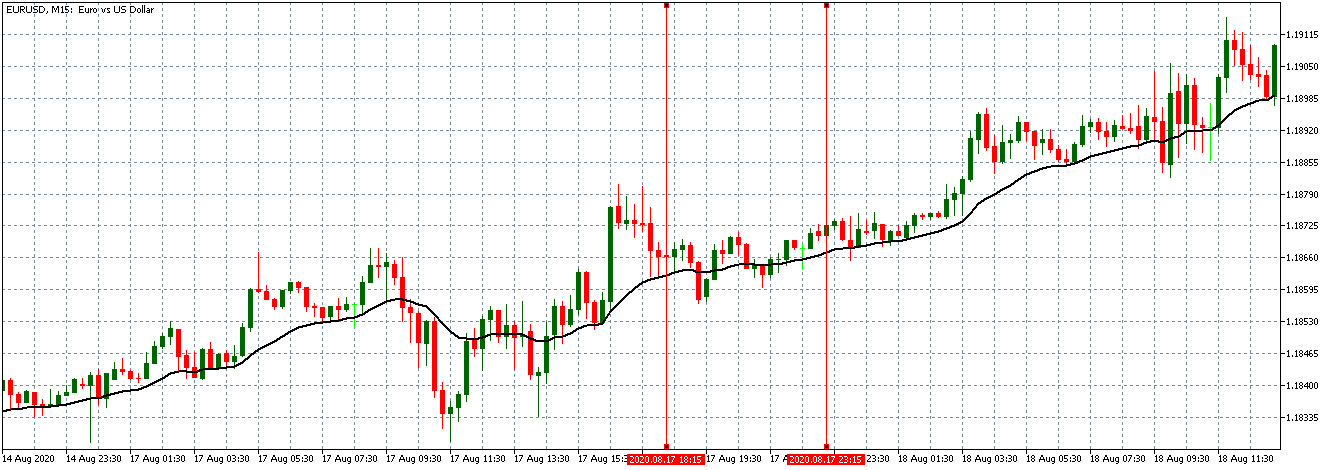
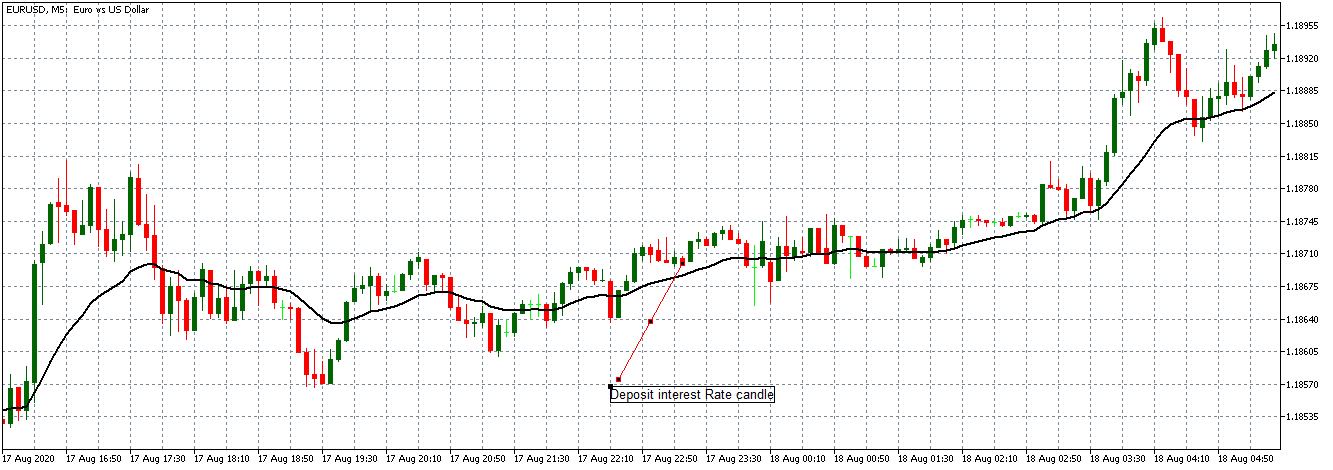
The EUR/USD closed at 1.17953 after placing a high of 1.18828 and a low of 1.17539. Overall the movement of EUR/USD remained bearish throughout the day. The EUR/USD pair dropped on Friday and bottomed at 1.1753; it’s lowest since August 12. A stronger U.S. dollar and the poor economic data from Europe weighed on EUR/USD pair.
At 12:15 GMT, the French Flash Services PMI for August fell to 51.9 from the expected 56.3, and the previous 57.3, weighed on Euro. The French Flash Manufacturing PMI also declined to 49.0 against the estimated 53.0 and previous 52.4 and added pressure on single currency Euro.
At 12:30 GMT, the German Flash Manufacturing PMI rose to 53.0 from the anticipated 52.2 and supported Euro; however, the German Flash Services PMI came in as 50.8 against the expected 55.3 and weighed on Euro on Friday.
At 13:00, the Flash Manufacturing PMI for the whole Eurozone declined to 51.7 in August from the projected 52.7 and previous 51.8. The Flash Services PMI for the whole bloc also fell to 50.1 against the forecasted 54.6 and added pressure on EUR.
Apart from German Manufacturing PMI, all the PMI from the whole bloc, including biggest economies, came in against EUR, and hence, EUR/USD pair suffered. The data showed that only German manufacturing activity was expanded in August. At the same time, other countries, along with whole euro bloc’s manufacturing & services activities, were contracted in August. Meanwhile, the greenback was the top performer on Friday with DXY up by 0.5% on 93.5 level, the highest since Monday.
The U.S. Dollar was already supported by the release of Fed Meeting minutes on Wednesday, and on Friday, the support was extended after the release of positive PMI and Home Sales data.
At 18:45 GMT, the Flash Manufacturing PMI and the Flash Services PMI were released from the U.S. The Manufacturing PMI surged to 53.6 against the expected 51.9, and the Services PMI was surged to 54.u from the 50.9 forecasted. The expansion in the Manufacturing & Services sector of the U.S. gave strength to the U.S. dollar. At 19:00 GMT, the Existing Home Sales in July exceeded the expectations of 5.40M and came in as 5.86Mand supported the U.S. dollar.
The strong U.S. dollar exerted more pressure on EUR.USD prices and dragged them down at the ending day of the week. Meanwhile, the Euro currency was also under pressure because of the resurgence of coronavirus cases in Europe. In recent days France, Germany, and Italy have experienced their highest daily case counts since the spring, and Spain has found itself amid a major outbreak.
Over the past two weeks, Spain has seen Europe’s fastest rising caseload with 142 positive cases per 100,000 people. The number had risen more than 3,000 by the time the state of emergency ended on June 21.
The EUR/USD pair was also under pressure on Friday because of the possible entry of a new phase of the pandemic in Europe.
Daily Technical Levels
| Support |
Pivot |
Resistance |
| 1.1787 |
1.1797 |
1.1807 |
| 1.1777 |
|
1.1817 |
| 1.1767 |
|
1.1827 |
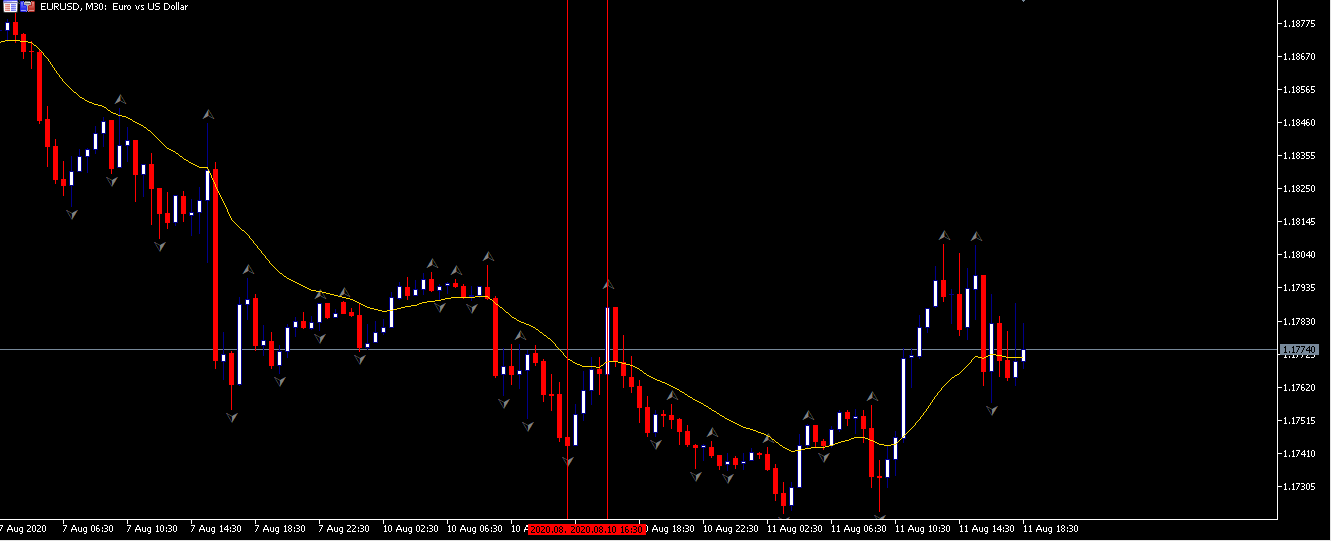
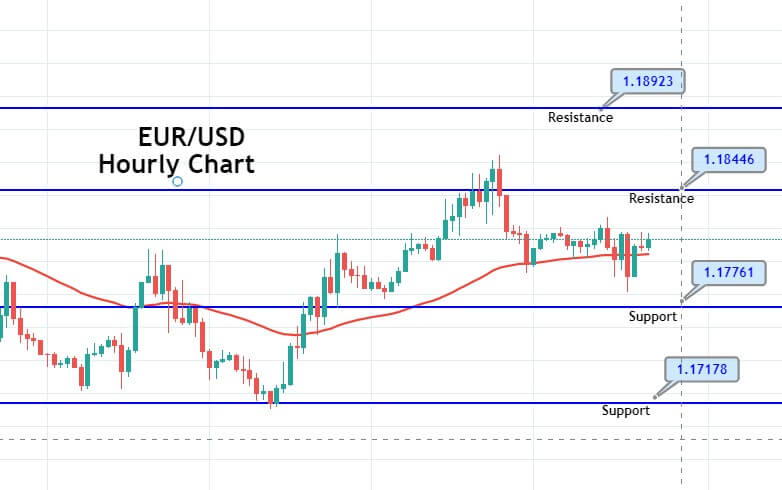
EUR/USD– Trading Tip
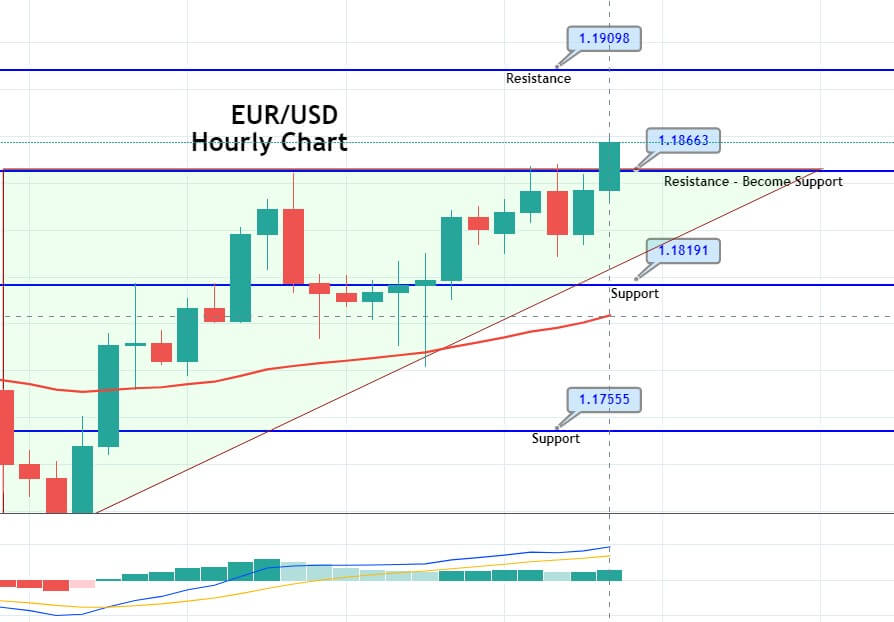
The EUR/USD pair fell sharply from 1.1954 level to 1.1790 level. For now, the pair is likely to find an immediate resistance at 1.1806 level, and a bullish breakout of 1.1806 level can lead EUR/USD prices towards 1.1886 level. On the lower side, the violation of the 1.1751 level can extend the selling trend until 1.1706.
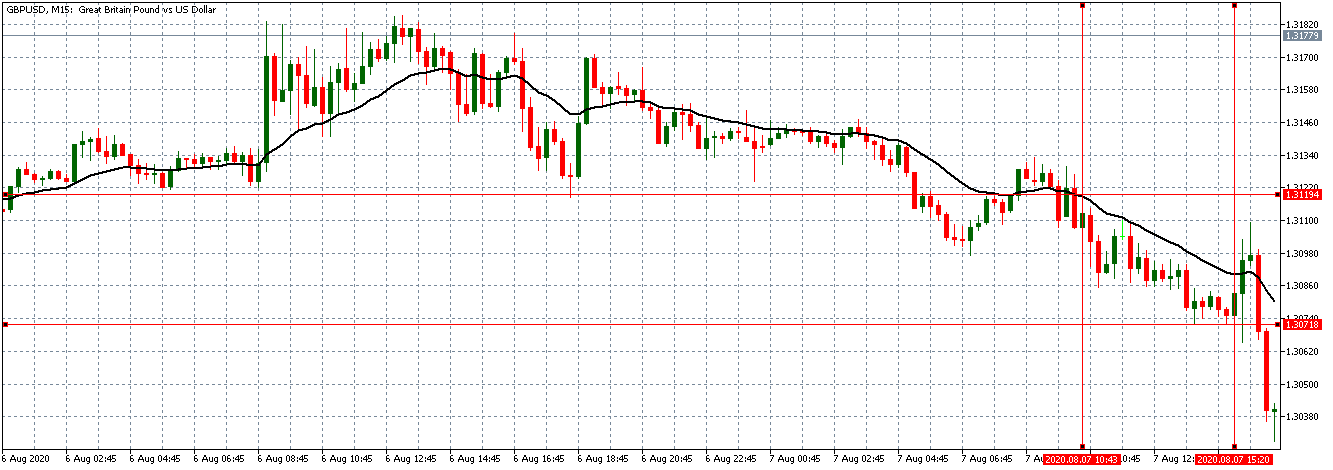
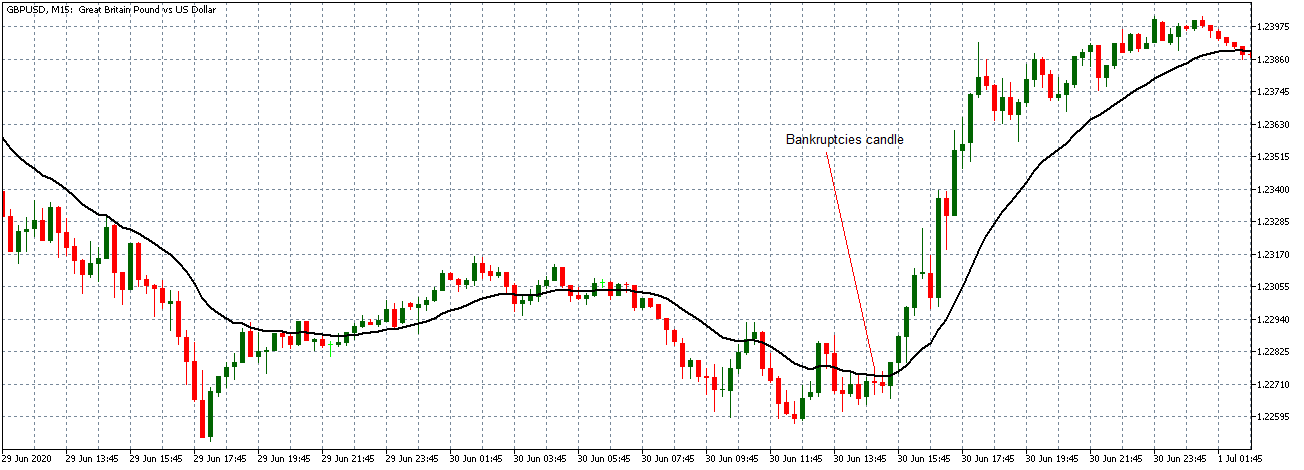
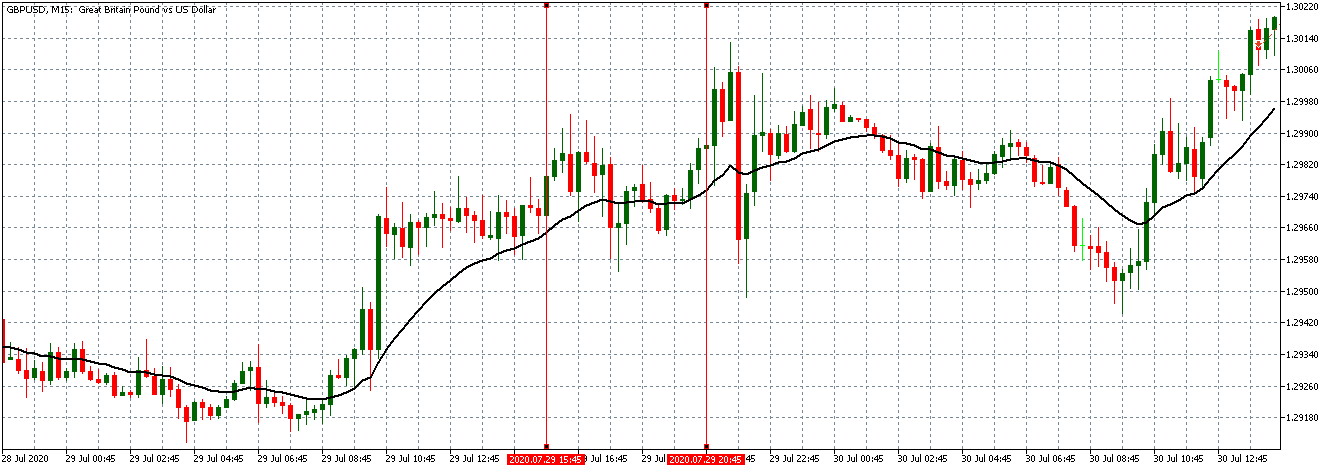
GBP/USD – Daily Analysis
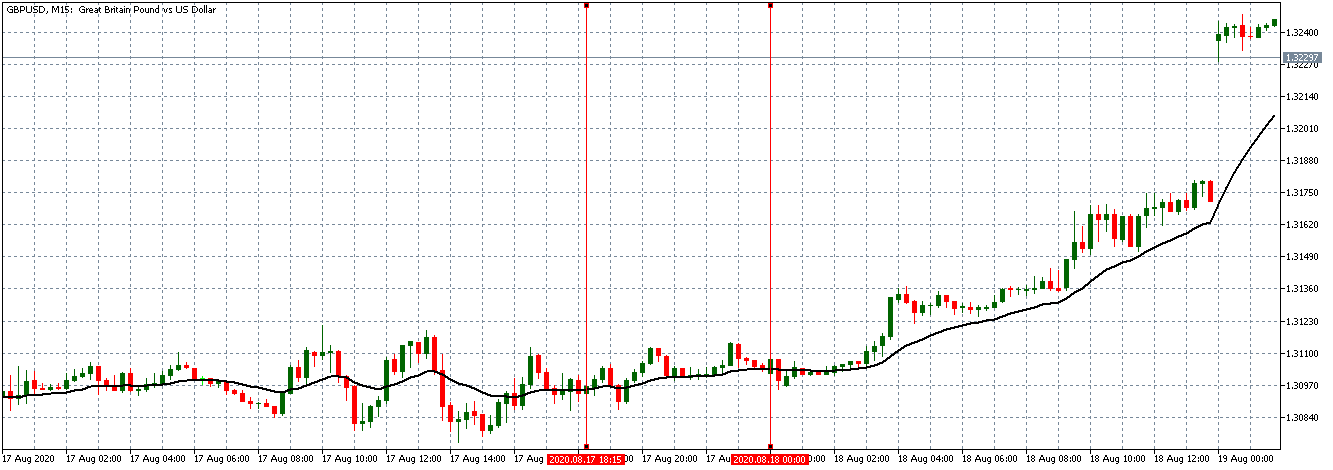
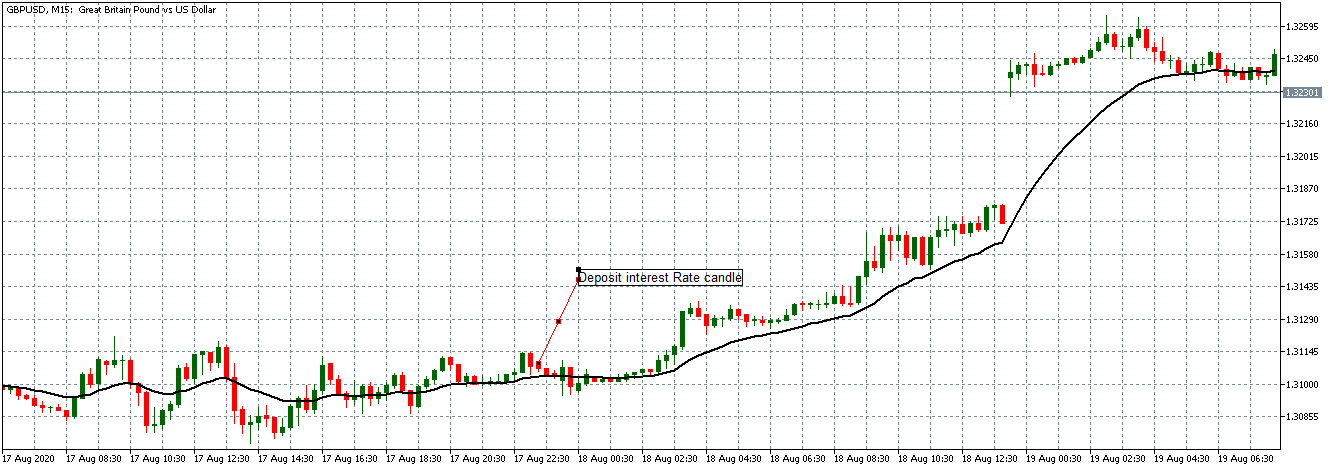
The GBP/USD pair was closed at 1.30884 after placing a high of 1.32550 and a low of 1.30588. Overall the movement of GBP/USD pair remained bearish throughout the day. At 04:01 GMT, the GfK Consumer Confidence in August declined to -27 against the forecasted -25 and weighed on British Pound and added in the losses of GBP/USD pair. At 11:00 GMT, the Public Sector Net Borrowing increased to 25.9B from the expected 28.3B and supported British Pound. The Retail Sales for July also increased to 3.6% from the forecasted 2.0% and supported British Pound.
At 13:30 GMT, the Flash Manufacturing MI from Britain exceeded the expectations of 54.0 and came in as 55.3 and supported GBP. The Flash Services PMI also rose to 60.1 against the estimated 57.0 and supported GBP. At 15:00 GMT, the CBI Industrial Order Expectation in August was declined to -44 from the anticipated -34 and weighed on GBP/USD pair and added in its losses on Friday.
On the other hand, at 18:45 GTM, the Flash Manufacturing PMI from the U.S. surged to 53.6 from the anticipated 51.9 and supported the U.S. dollar that weighed on currency pair. The Flash Services PMI also surged to 54.8 against the anticipated 50.9 and supported the U.S. dollar. The Existing Home Sales exceeded the estimate of 5.40M and came in as 5.86M and supported the U.S. dollar that ultimately weighed on GBP/USD pair.
Meanwhile, on Brexit front, On Friday, the British and European Union negotiator made slight progress towards the post-Brexit trade deal in talks this week. Both sides were concerned that time to reach an agreement was running out before an end-year deadline.
The E.U. Chief negotiator, Micheal Barnier, said that those who were hoping for negotiations to move swiftly forward this week would be disappointed. However, his British counterpart, David Frost, said that a deal on post-Brexit relations was still possible and was still London’s goal, but it would not be easy to achieve.
Frost said that several significant areas remain to be resolved, and even when there was a broad understanding between negotiators, there was still much work to do as a time for both sides was short.
Britain shifted to be the leading country to ever leave the European Union on January 31 after 46 years of membership. Both sides are now negotiating a new partnership to be effective from 2021 on everything from trade and transport to energy and security. If both sides failed to reach an agreement, Britain would follow the World Trade Organization’s rules.
The attest round of talks between the U.K. & E.U. was also not fruitful, and it has decreased hopes for a post-Brexit deal. It means the hopes about the no-Brexit deal returned in the market and weighed on GBP/USD pair that caused a sudden fall in its prices on Friday.
The U.K. economy is also under pressure as the furlough scheme that has protected millions of jobs is scheduled to end in October. This would hit the labor market and increase unemployment, making it difficult to recover from the record 20% slump in the second quarter of this year.
These fears have also weighed on single currency Pound and kept the pair GBP/USD under pressure.
Daily Technical Levels
| Support |
Pivot |
Resistance |
| 1.3082 |
1.3092 |
1.3103 |
| 1.3071 |
|
1.3113 |
| 1.3062 |
|
1.3124 |
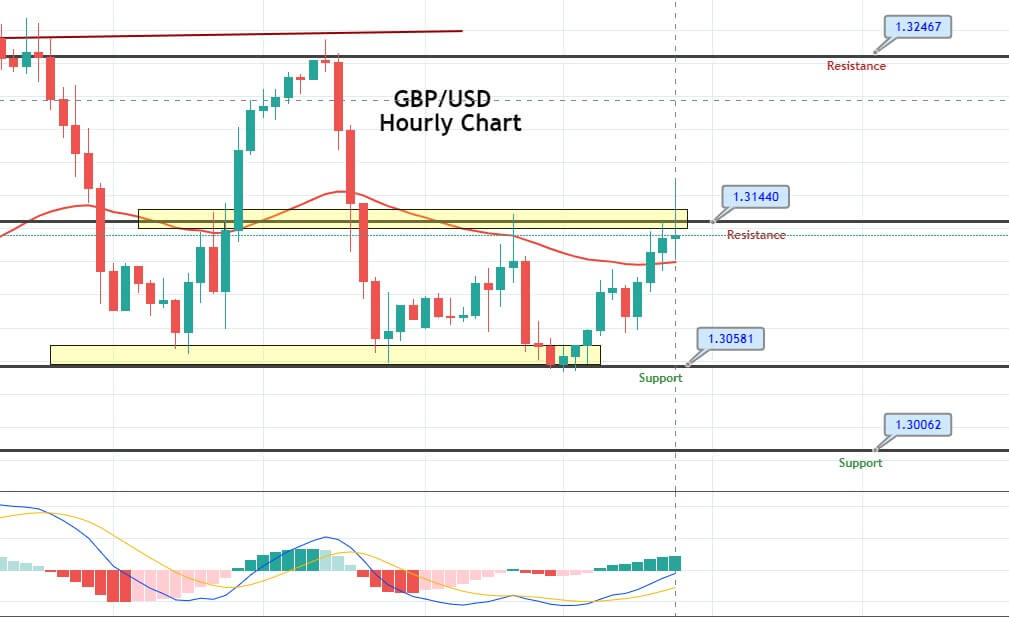
GBP/USD– Trading Tip
On Monday, the GBP/USD pair is trading sideways above a strong support level if 1.3072. The support here is extended by 1.3074 level, where the bearish breakout of 1.3074 level can extend selling unto 1.3007 level. On the higher side, the next resistance is likely to be found around 1.3155 level. The 50 EMA and the technical indicators such as RSI, MACD, and 50 periods of EMA suggest a selling bias in the Cable. Let’s consider taking selling trades below 1.3075 level, while buying can be seen if the GBP/USD pair continues to close candles over 1.3075 level.
USD/JPY – Daily Analysis
The USD/JPY pair was closed at 105.789 after placing a high of 106.070 and a low of 105.439. Overall the movement of USD/JPY remained almost flat yet slightly bullish. On Friday, the USD/JPY pair dropped in the first half of the day after the release of Japanese Manufacturing PMI and the persisting uncertainty due to ongoing geopolitical tensions. However, in the second half of the day, the USD/JPY pair recovered its early daily losses and rose to post slight gains amid better than expected U.S. economic data.
AT 04:30 GMT, the National Core CPI for the year declined to 0.0% from the estimated 0.1% and weighed on Japanese Yen. At 05:30 GMT, the Flash Manufacturing PMI from Japan in August rose to 46.6 against the estimated 45.0 and came in favor of Japanese Yen. The improvement in the manufacturing sector in Japan gave a push to Japanese Yen and dragged the pair USD/JPY to the lower level near 105.400.
However, after the release of positive macroeconomic data from the U.S., the USD/JPY pair started to rise and converted its daily losses in gains. At 18:45 GMT, the Flash Manufacturing PMI in August rose to 53.6 against the projected 51.9, and the Flash Services PMI rose to 54.8 against the anticipated 50.9.
The expansion in the U.S. manufacturing and services sector gave strength to the U.S. dollar that was more supported by the release of U.S. Existing Home Sales data. The Existing Home Sales in the U.S. for July rose to 5.86M from the anticipated 5.40M and gave a push to the U.S. dollar that added strength in USD/JPY pair.
The U.S. Dollar Index (DXY) that measures the value of the U.S. dollar against the basket of six major currencies rose by0.5% on Friday towards 93.5 level. It also helped USD/JPY pair to recover some of its daily losses on Friday.
Meanwhile, the ongoing geopolitical tensions between U.S. & China, along with the U.S. & Iran tensions, also kept the pair USD/JPY under pressure at the ending day of the week. On the US-China front, the US Trump administration denied acknowledging the plans to meet China over the discussion of implementations of the phase-one trade deal. The U.S. Commerce ministry spokesman Gao Feng said that in the coming days, the U.S. & China would hold meetings to discuss phase one trade deal.
However, the denial of any such meeting by Trump Administration added uncertainty in the market and kept the pair USD/JPY under pressure.
N the other hand, the U.S. called all U.N. sanctions to be restored on Iran after a violation of the 2015 nuclear deal. However, 13 out of 15 U.N. council members wrote against the U.S.’s request to impose sanctions on Iran as in 2018; the U.S. ended its legal terms with the 2015 nuclear deal by calling it the worst deal ever.
Meanwhile, the Chairman of China Banking and Insurance Regulatory Commission, Guo Shuqing said that the U.S. had placed domestic laws above international laws, which will affect the Chinese people and affect the whole world people including Americans. Shuqing also mentions that these sanctions by the U.S. on Hong Kong lacked legality and violated the market economy’s principles. The ongoing geopolitical tensions increased the uncertainty, which supported the Japanese Yen safe0haven status and contributed to the flat movement of the USD/JPY pair on Friday.
Daily Technical Levels
| Support |
Pivot |
Resistance |
| 105.7700 |
105.8500 |
105.9500 |
| 105.6700 |
|
106.0300 |
| 105.6000 |
|
106.1300 |
USD/JPY – Trading Tips
The USD/JPY is trading sideways in a broad trading range of 106.300 to 105.240. At the movement, the USD/JPY is tossing above and below 50 periods EMA, while the RSI and MACD are in support of a neutral trend. The recent series of Doji and Shooting start candles are suggesting indecision among traders. Sooner or later, we may see USD/JPY prices break out of the range. Once it happens, the USD/JPY may trade bullish over 106.300 to target 107.084. On the lower side, violation of 105.240 level can drive selling unto 104.300. Good luck!