
Introduction
The different proportion of contribution to GDP from the three sectors (primary, secondary, tertiary) can tell us a lot about the economic development stage a country is at the moment. GDP from Services can help us gauge the transition of countries from developing to developed status efficiently. Hence, it is useful for Central Authorities and business people to understand the growth of the Service Sector.
What is GDP from Services?
Service Sector
It refers to the production of intangible goods, services to be exact, that are not goods. Services are intangible, non-quantifiable, and formless. The result of service may or may not produce a physical good. For example, a construction service would give the client a building, whereas a lawnmowing service would not. It is the largest sector in the global economy and bears high significance in advanced economies.
How can the GDP from Services numbers be used for analysis?
The three different sectors of an economy are associated with different activities. The primary sector is mainly associated with dealing with agriculture, farming. It answers the basic needs. The secondary sector deals with industrialization, where livelihood, employment are answered through the production of goods.
The tertiary sector comes into picture when the basic needs like food, employment, security are taken care of. The tertiary sector consists mainly of services. Countries that have Service Sector as their main contributor to GDP are generally considered the more advanced economies. Indeed, the underdeveloped nations will primarily struggle for food and water, where Agriculture would be the primary need to feed the population.
The industrialization growth will be associated with low-cost wage labors working in factories for mass production to compete in the global market. Whereas, the service sector will be associated with high-cost services generally to provide “good-to-have” commodities.
For example, a vegetable is cheaper than an industrial product. Likewise, an industry product would be cheaper than a service sector like antivirus software. The cost of a 1kg of potato is about 2.50 US dollars, whereas 1kg of potato chips from a company like lays would cost 10 US dollars, whereas a Netflix subscription (service) would cost around 10-15 dollars a month.
It is a general trend where a software employee (service sector) gets paid more than a factory worker (industrial sector). A factory worker generally gets paid more than a farmer (agricultural sector). It is easily observed the wealth generated from the Service Sector far outpaces that of the Industrial Sector and essentially the Agricultural Sector.
In general, countries start to grow from underdeveloped to developing nations through industrialization. China and Japan would be good examples of industrialization-led growth. Once a country has firmly established its primary and secondary sectors, it can reach the status of a developed economy through the service sector only. India and China would be good examples of developing economies, increasing their service sector to generate higher wealth.
Hence, GDP from Service is essential to assess the status of a country transitioning from an emerging or developing economy status to a developed economy. As the contribution of Service Sector to GDP increases, it implies that more percentage of people are engaged in higher revenue-generating activities, and have crossed the stages of addressing basic survival needs.
It is also essential to understand that GDP from Service can increase only when the country is firmly established and stable in the primary and secondary sectors. Because when primary and secondary needs are not answered, people will first engage in meeting primary needs and not providing services.
The developed economies have substantial contributions to GDP from Service Sector. For example, the United States and the United Kingdom, have about 80% of their GDP contributed from the Service Sector. Developing economies like India and China have over 50% of their GDP from Service Sector. Underdeveloped nations like Uganda have only 24% of the Service Sector.
Impact on Currency
Leading indicators like Services PMI or NMI already forecast the GDP from Service, which would mean the increases from GDP from Services is already priced into the market. It is a proportional and lagging indicator.
Also, GDP from Services does not paint the full picture of the economy. Still, it can be an essential tool for the Central Authorities to keep track of Service Sector performance and its relative implications to the economy. As established, the Service Sector is a significant contributor to the GDP in developing and developed economies.
Hence, Service Sector GDP improvements bring more prosperity to a nation than an equivalent improvement in Agriculture or Industrial GDP. Service Sector GDP increase brings wealth to a nation and improves the standard of living of its people better than any other sector. A country can become a developed nation only when its Service Sector GDP increases to 70-80% of its GDP.
In general, Higher GDP from Services is good for the economy and its currency, and vice-versa.
Sources of GDP from Services
For the United States, the BEA reports are available here – GDP -BEA & GDP by Industry – BEA. World Bank also maintains the Service Sector’s contribution as a percentage of GDP on its official website – Service Sector – World % of GDP & GDP from Services – Trading Economics.
GDP from Services Announcement – Impact due to the news release
In the previous section of the article, we saw the contribution made by the service sector to the GDP, and it’s importance in the growth of the economy. But when it comes to fundamental analysis of a currency, the service sector’s contribution alone is not of great importance to investors as it represents only a small portion of the whole GDP.
Therefore, traders and investors look at a broader figure, which is essentially the GDP itself, and take a currency position based on the GDP of a country. So an increase or decrease in the contribution of ‘Services’ to GDP does not have any impact on the currency.
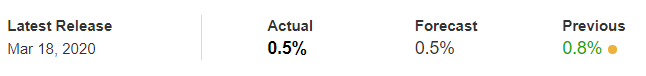
Now, let’s analyze the impact of GDP on different currency pairs and observe the change in volatility due to the news release. The below image shows the latest quarter on quarter GDP data of New Zealand released in March.
NZD/JPY - Before the announcement
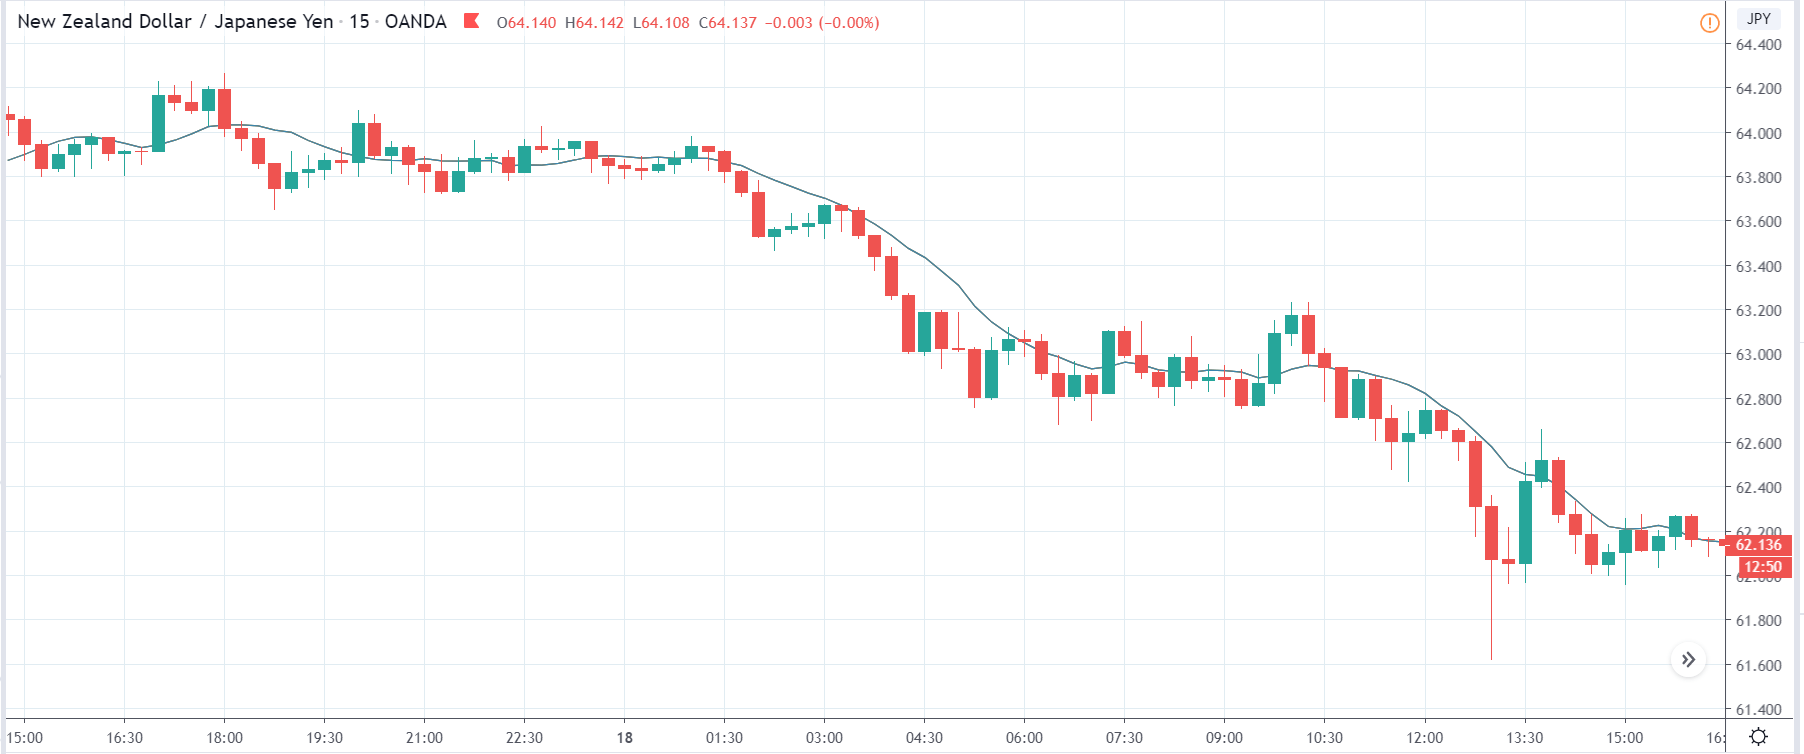
We will start with the NZD/JPY currency pair to examine the impact of GDP on the New Zealand dollar. The above chart shows the state of the market before the news announcement, where we see that the price was in a downtrend with the least number of retracements. Depending on the impact of the news release, we will position ourselves accordingly in the market. However, we should be looking to take a ‘short’ trade since the major trend of the market is down.
NZD/JPY - After the announcement
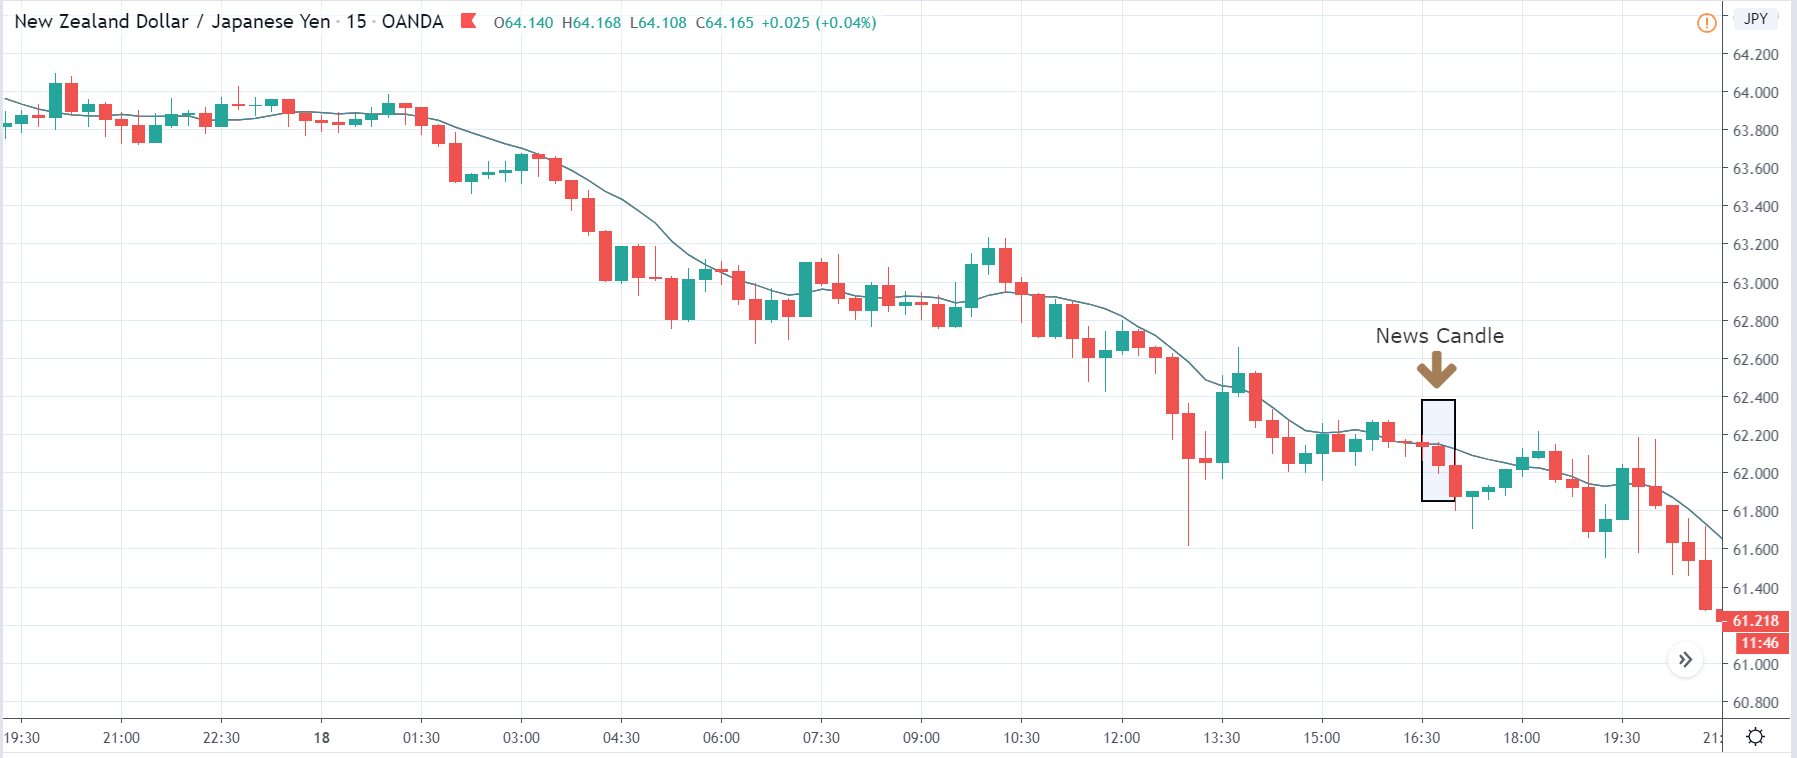
After the news announcement, the market moves lower by a little where the price closes, forming a bearish ‘news candle.’ The GDP data in the fourth quarter was lower than last time, which drove the price below the moving average. However, it did not cause a major crash in the market where the volatility slightly increased to the downside soon after the news release. One should wait for a price retracement before a ‘short’ trade.
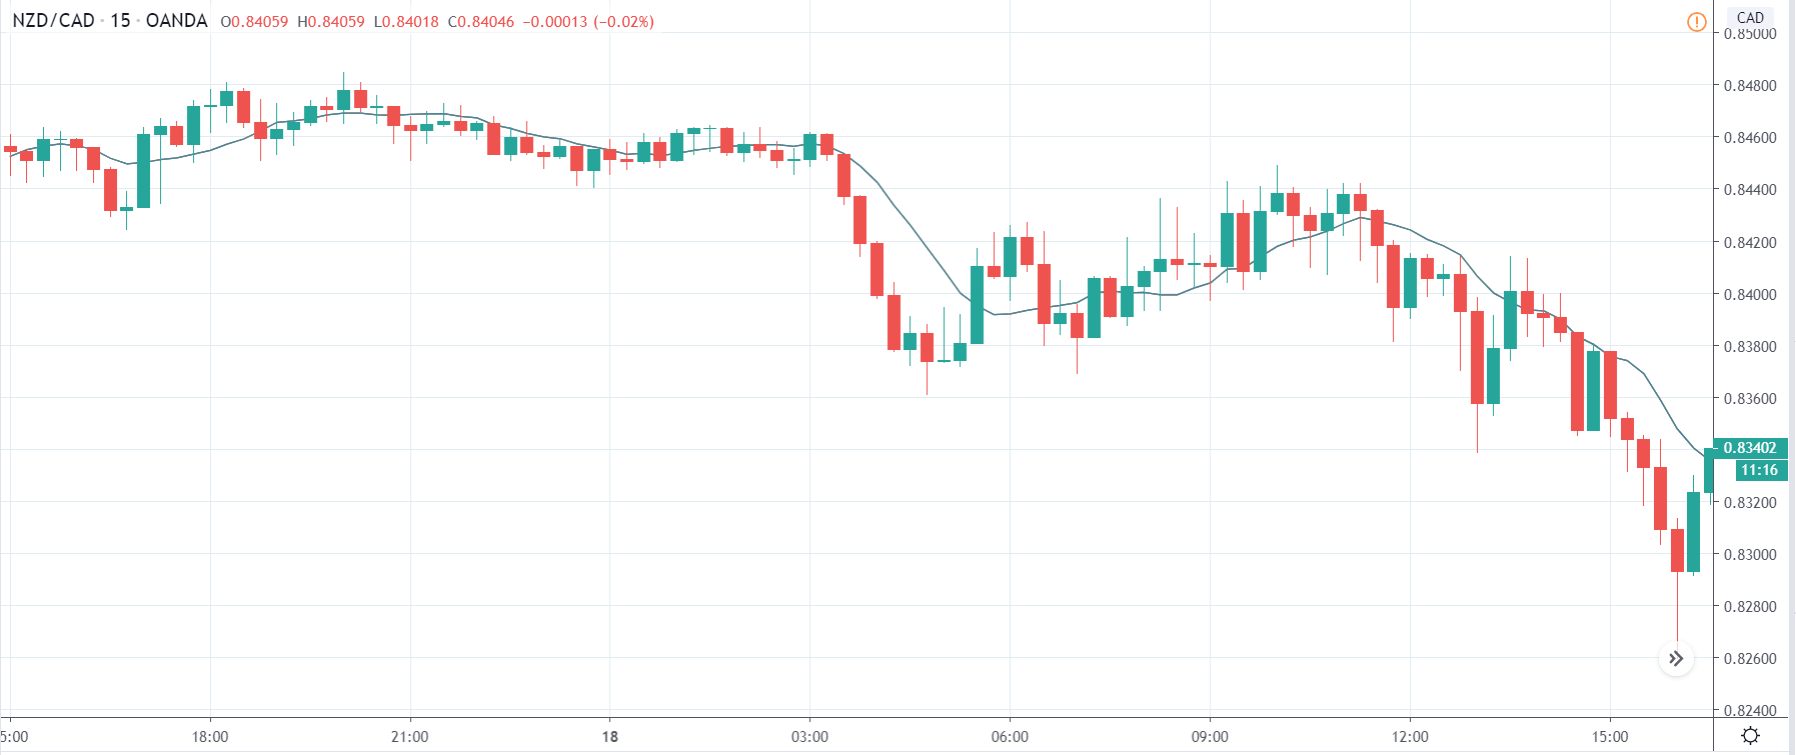
NZD/CAD - Before the announcement
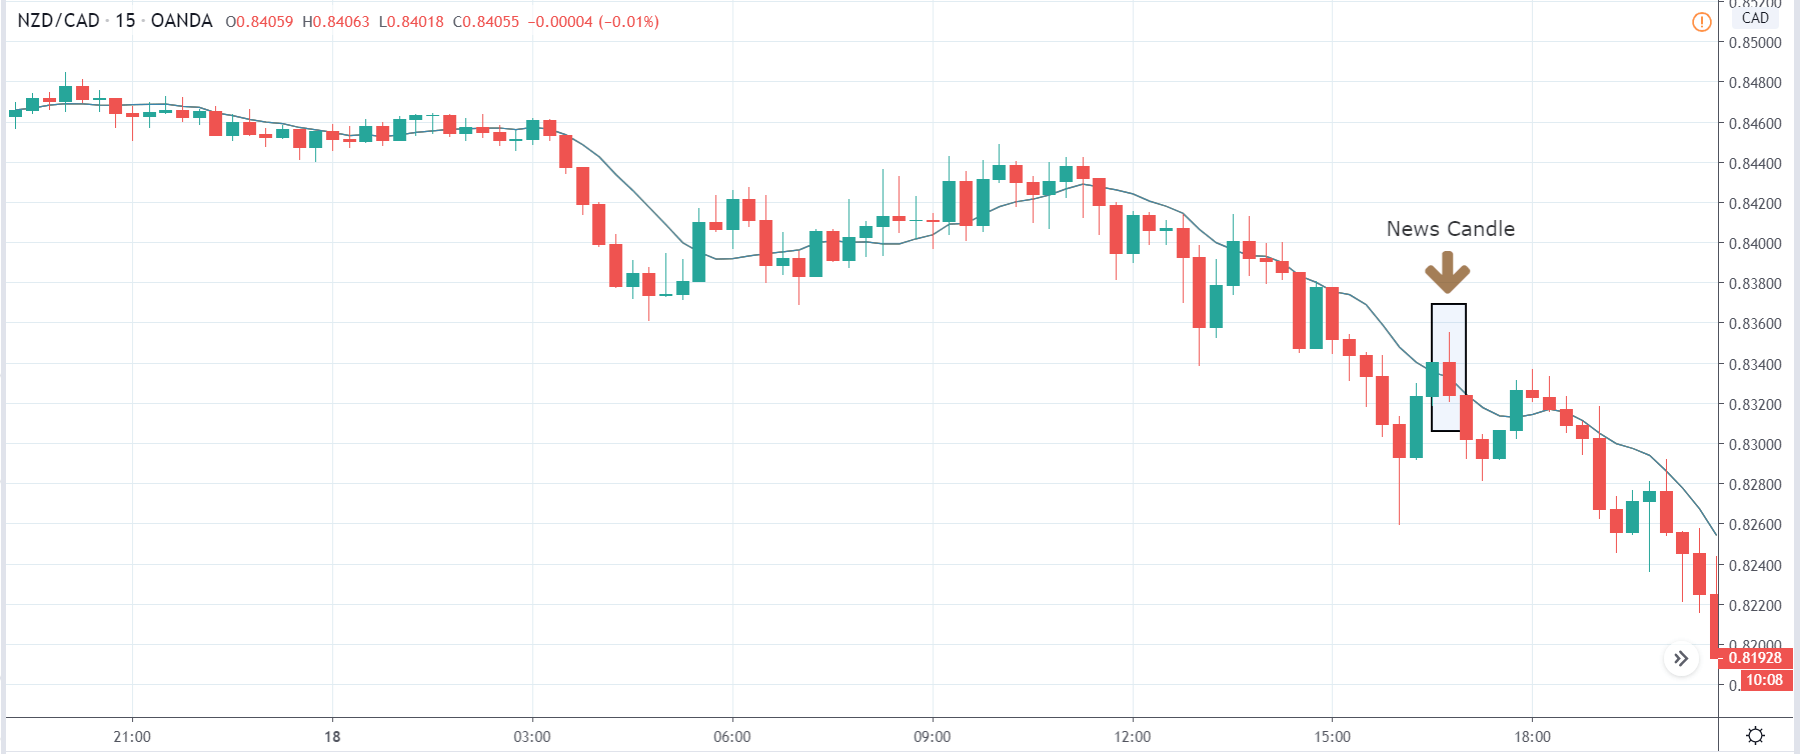
NZD/CAD - After the announcement:
The above images represent the NZD/CAD currency pair where we see in the first image the price violently moved lower, and few minutes before the news release, it has reversed from the ‘lows.’ Until the reversal is confirmed, we should be looking to sell the currency pair since the down move is very strong. Since a major news event is due, one should wait for its release and take a position based on the change in volatility.
After the news announcement, volatility expands on the downside, and the ‘news candle’ closes, forming a trend continuation pattern. The market reacted negatively to the GDP data since there was a decrease in the GDP by 0.3% in the fourth quarter. This can be taken as an opportunity for joining the downtrend where one can take a ‘short’ position with a stop loss above the ‘news candle.’
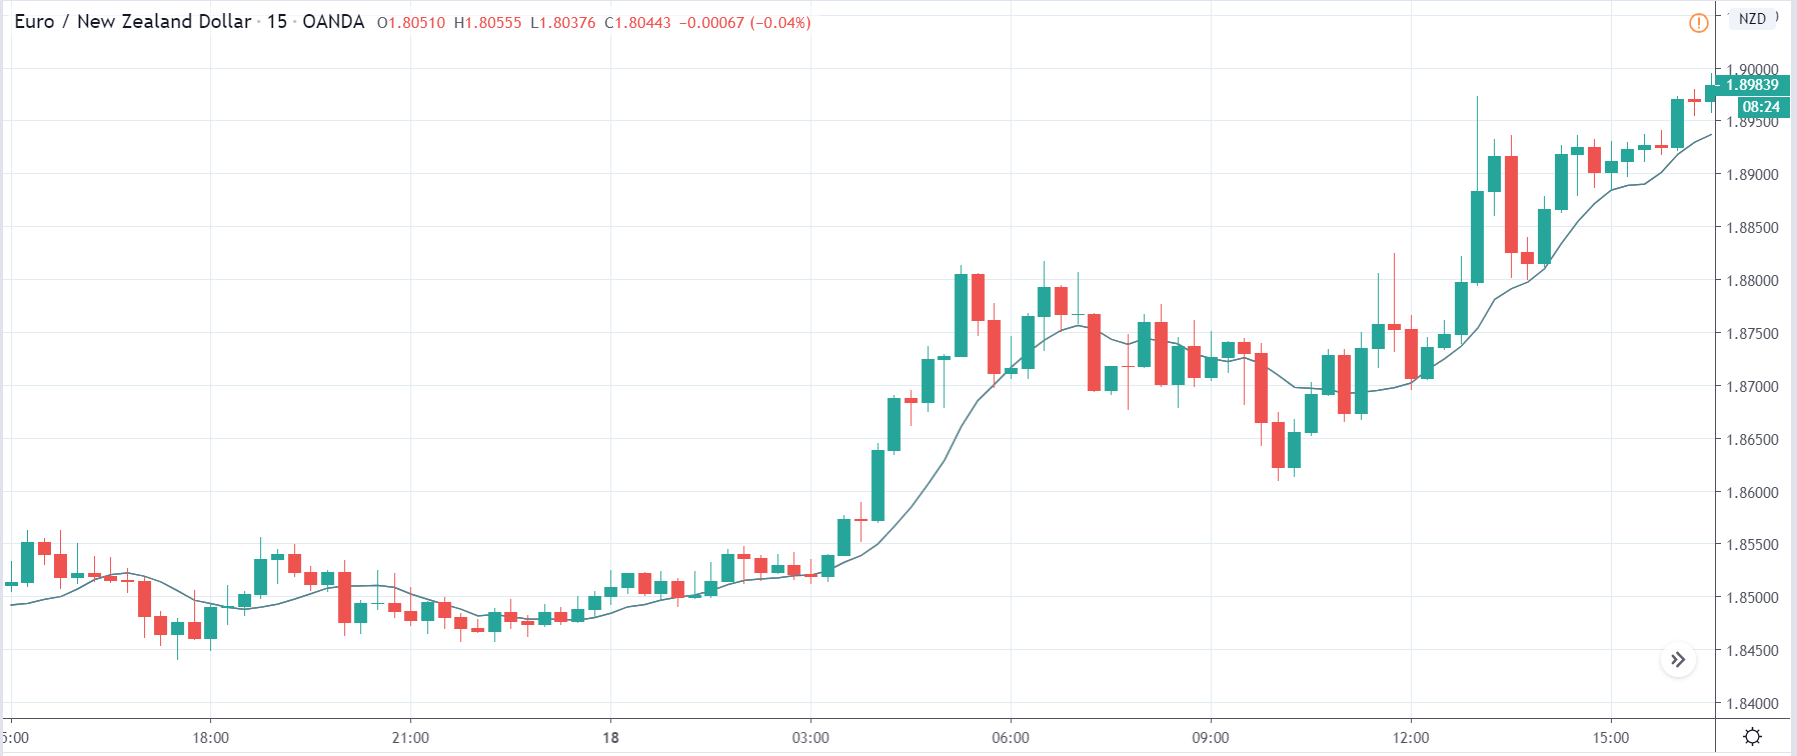
EUR/NZD - Before the announcement
EUR/NZD - After the announcement

The above images are that of the EUR/NZD currency pair, where the market is in an uptrend, and the price is currently at its highest point. The chart signifies weakness in the New Zealand dollar before the news announcement with no signs of strength. Technically, we will be looking to buy the currency pair after a pullback to a key technical level.
After the news announcement, the price moves higher and volatility expands on the upside, thereby further weakening the New Zealand dollar since it is on the right-hand side of the pair. At this point, one should be cautious by not taking a ‘long’ position as it would imply chasing the market. Cheers!