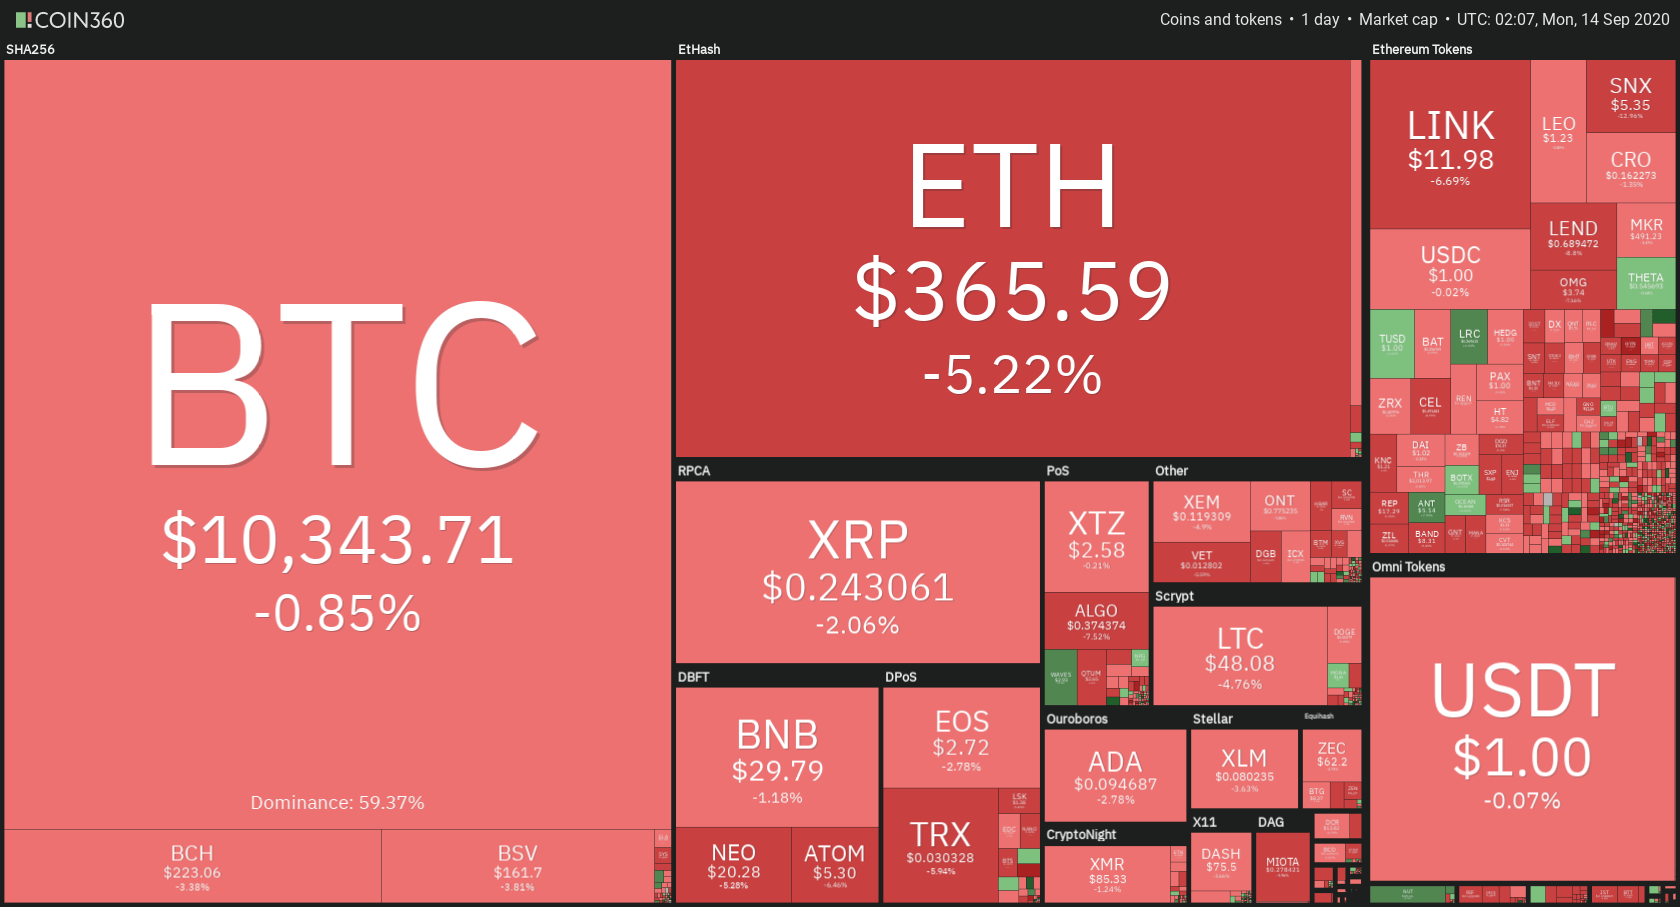
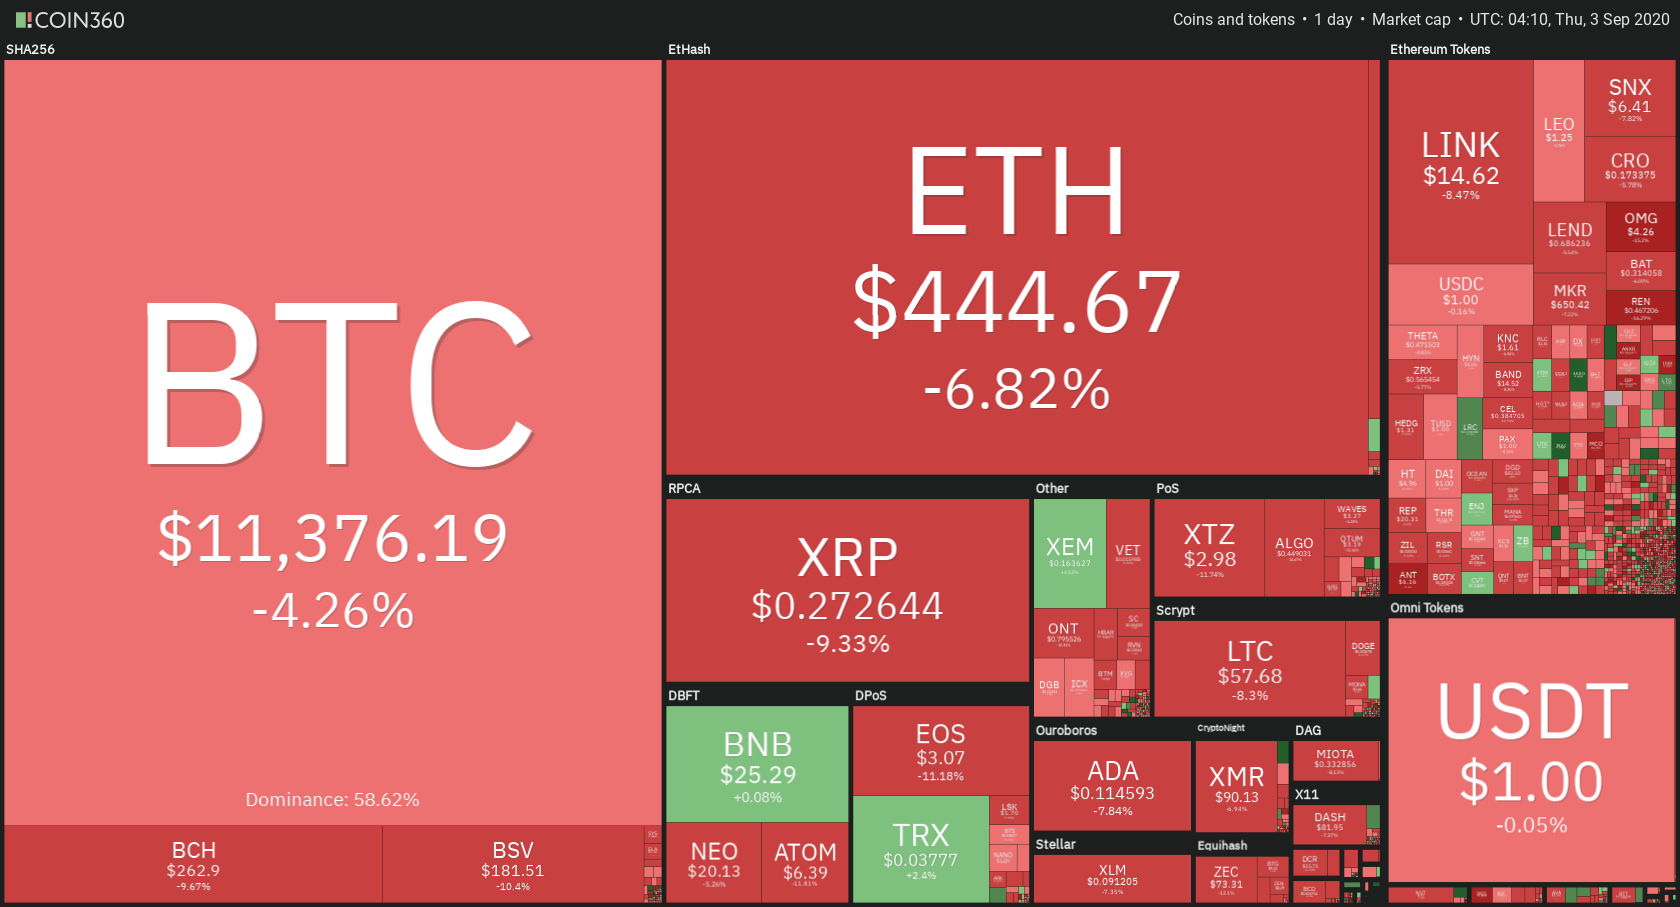
The cryptocurrency sector has dropped severely as the traditional markets tumbled and caused the crypto market to do the same. Bitcoin is currently trading for $10,458, representing a decrease of 4.38% on the day. Meanwhile, Ethereum lost 7.68% on the day, while XRP lost 5.87%.
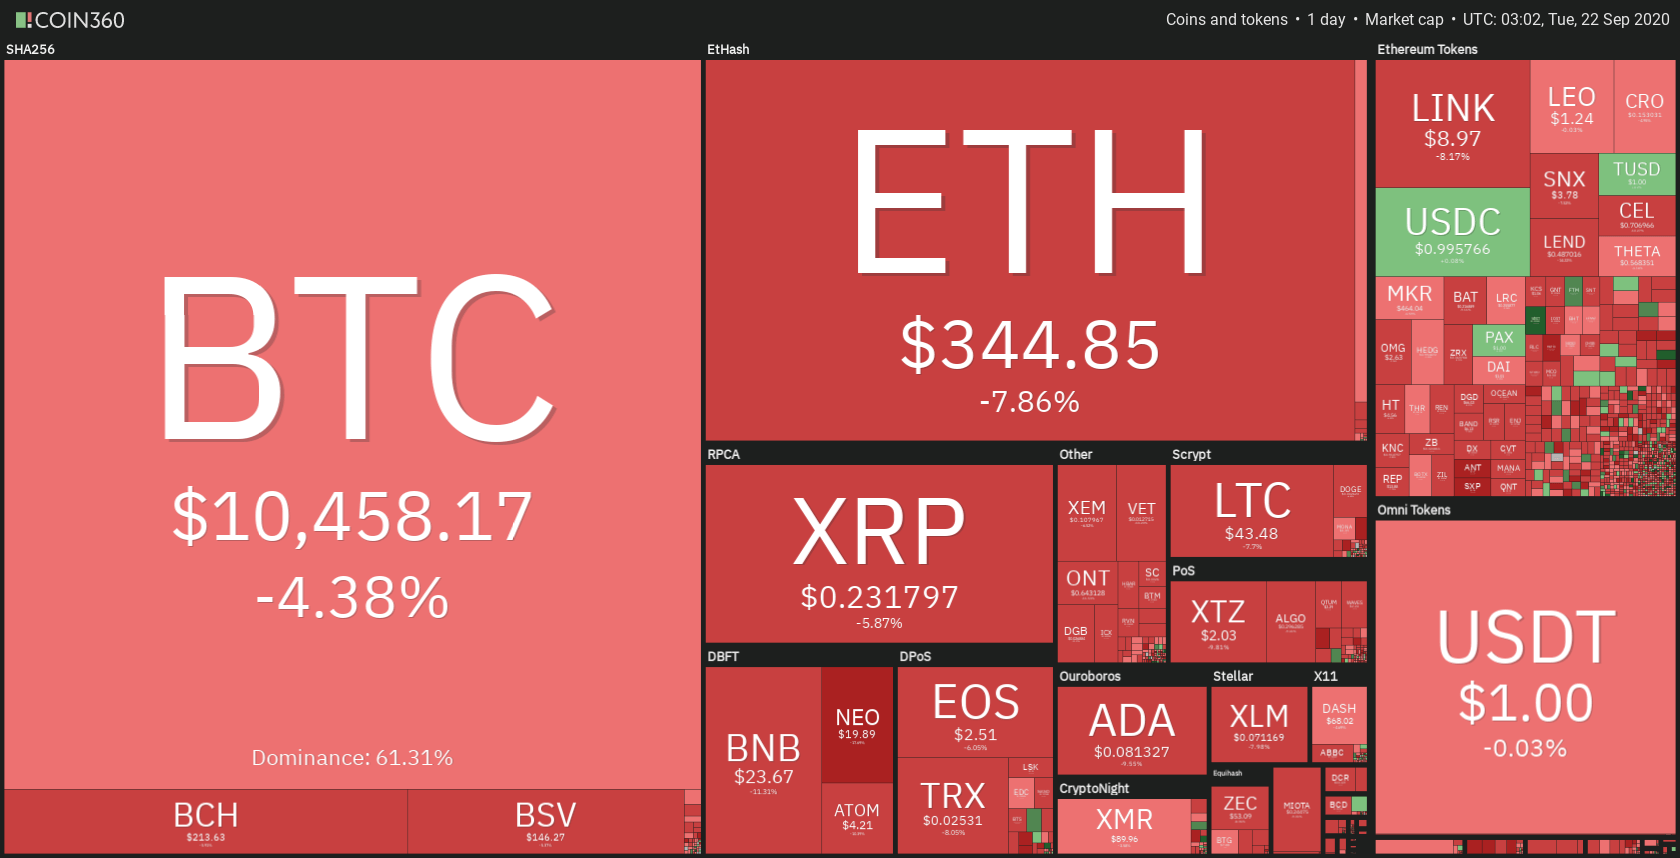
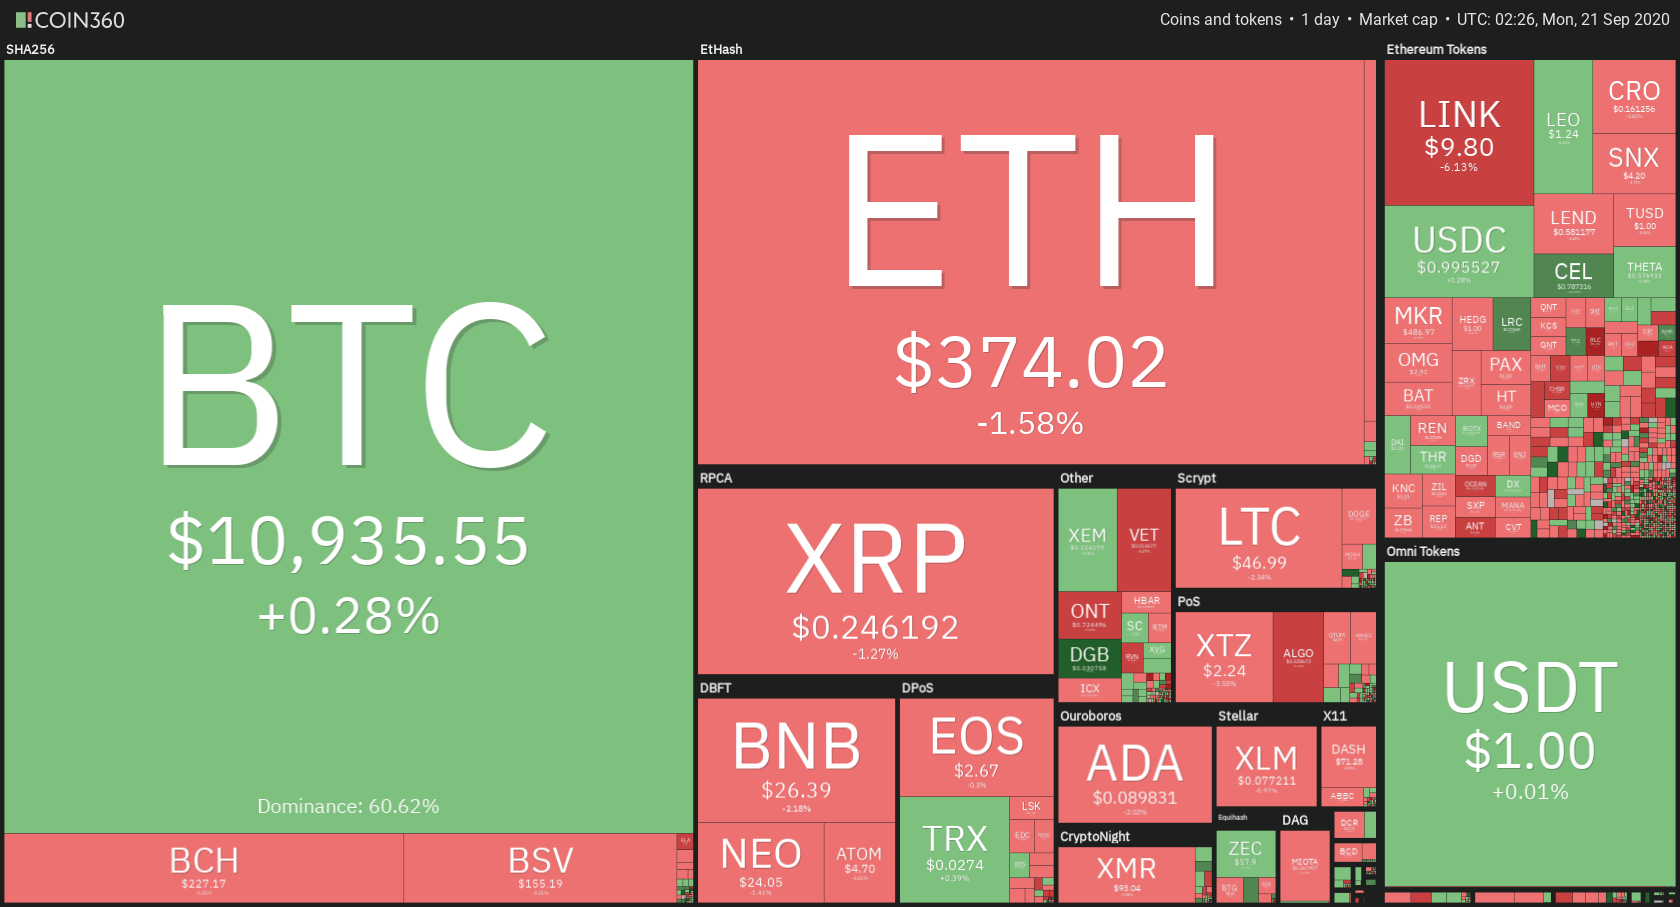
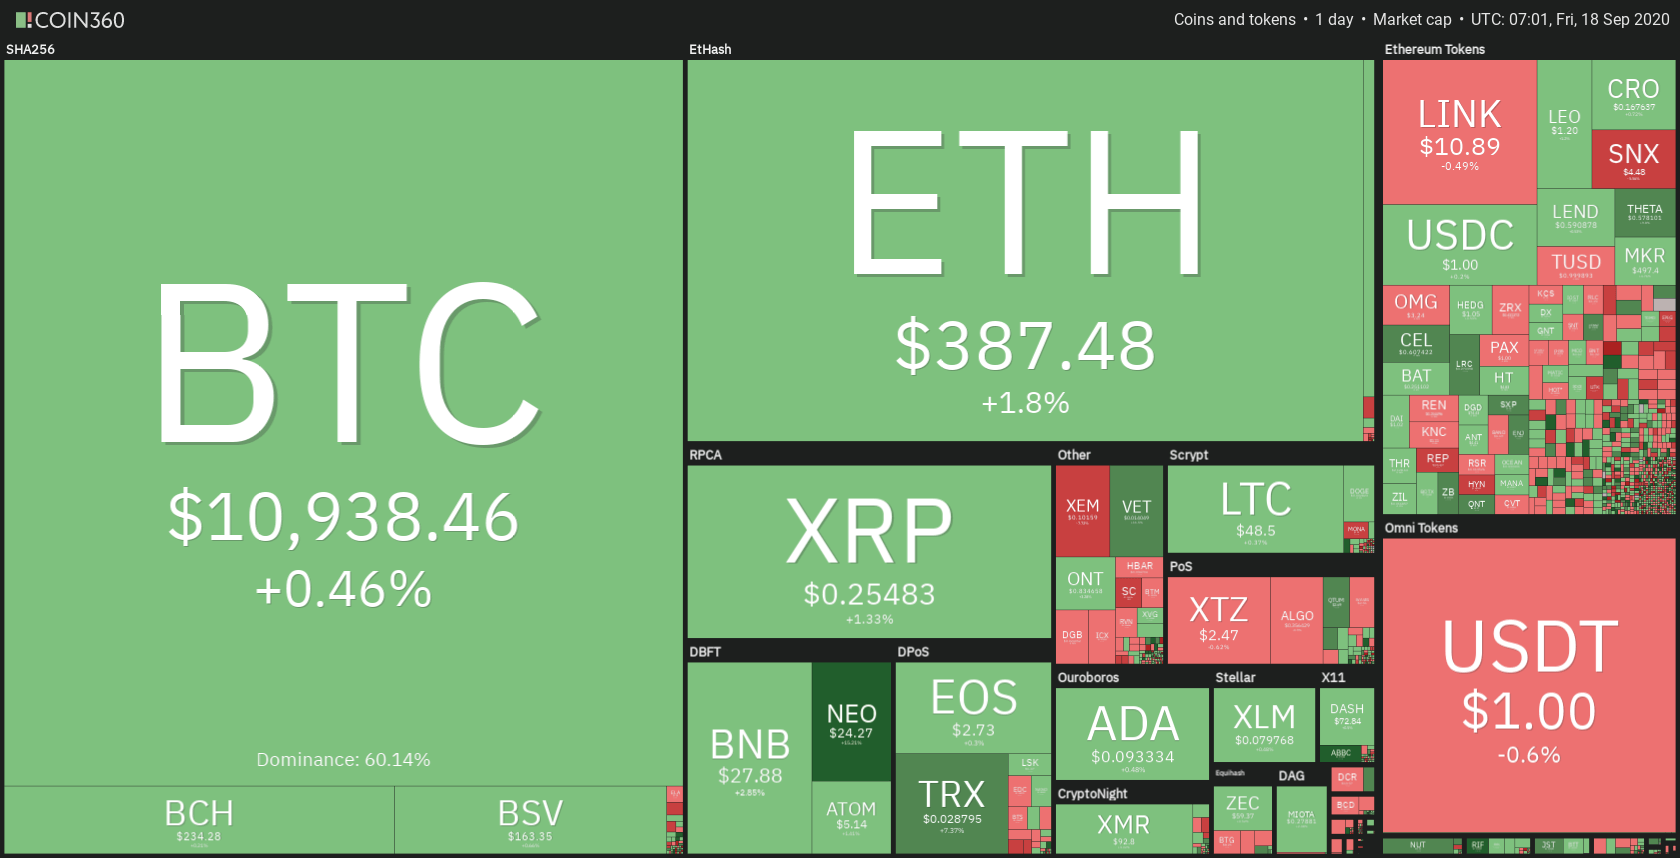
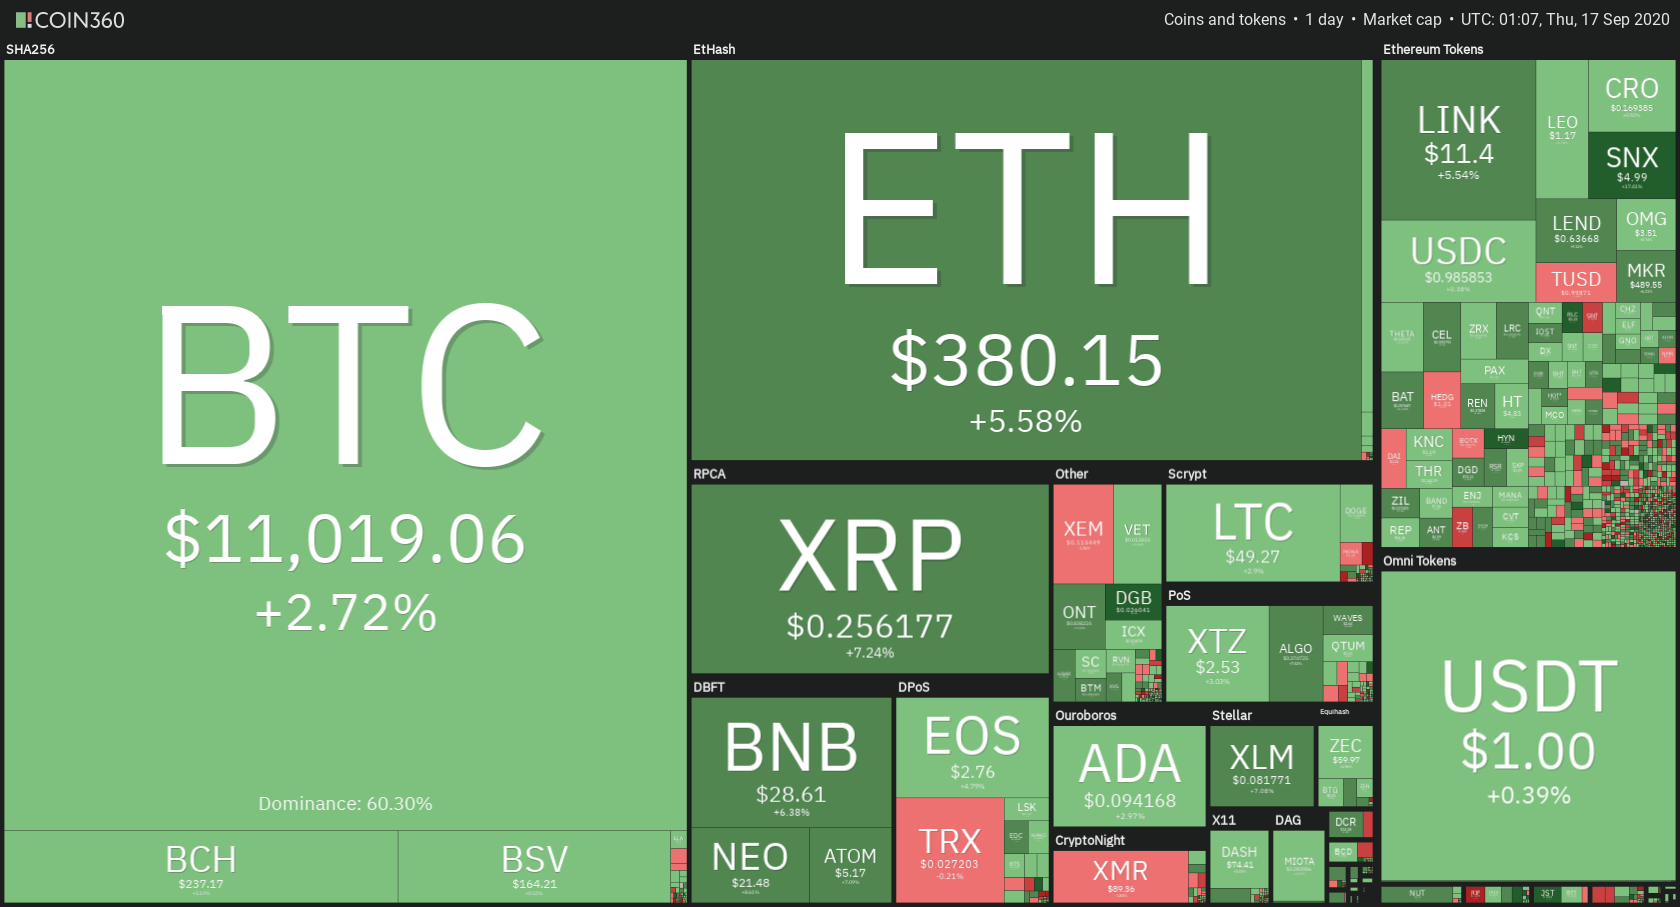
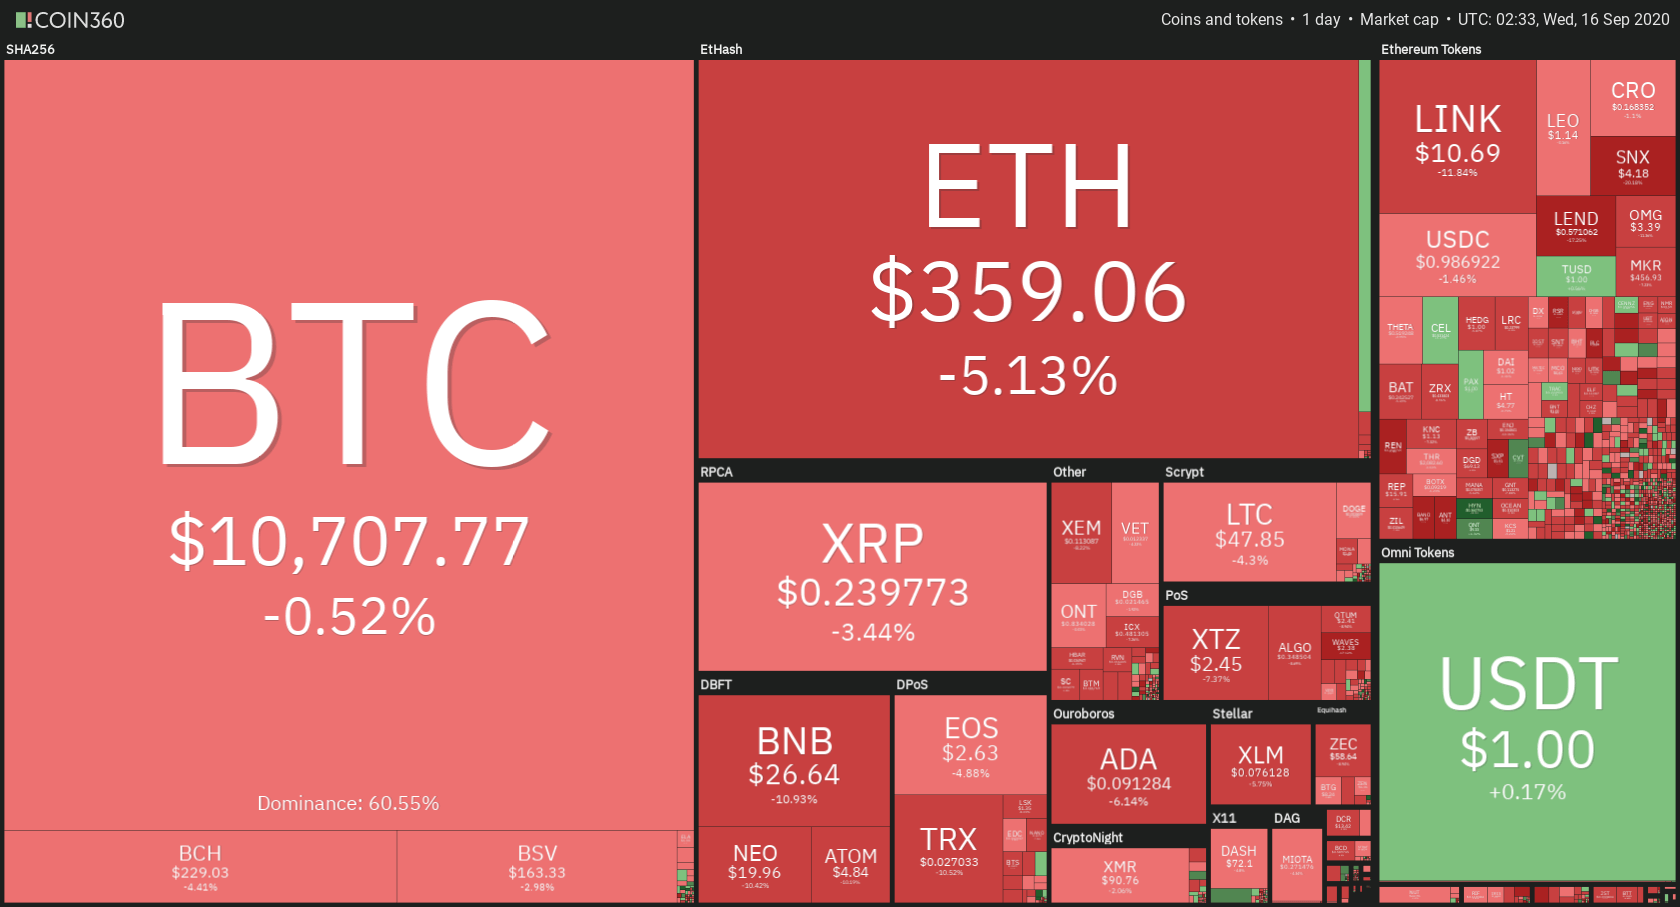
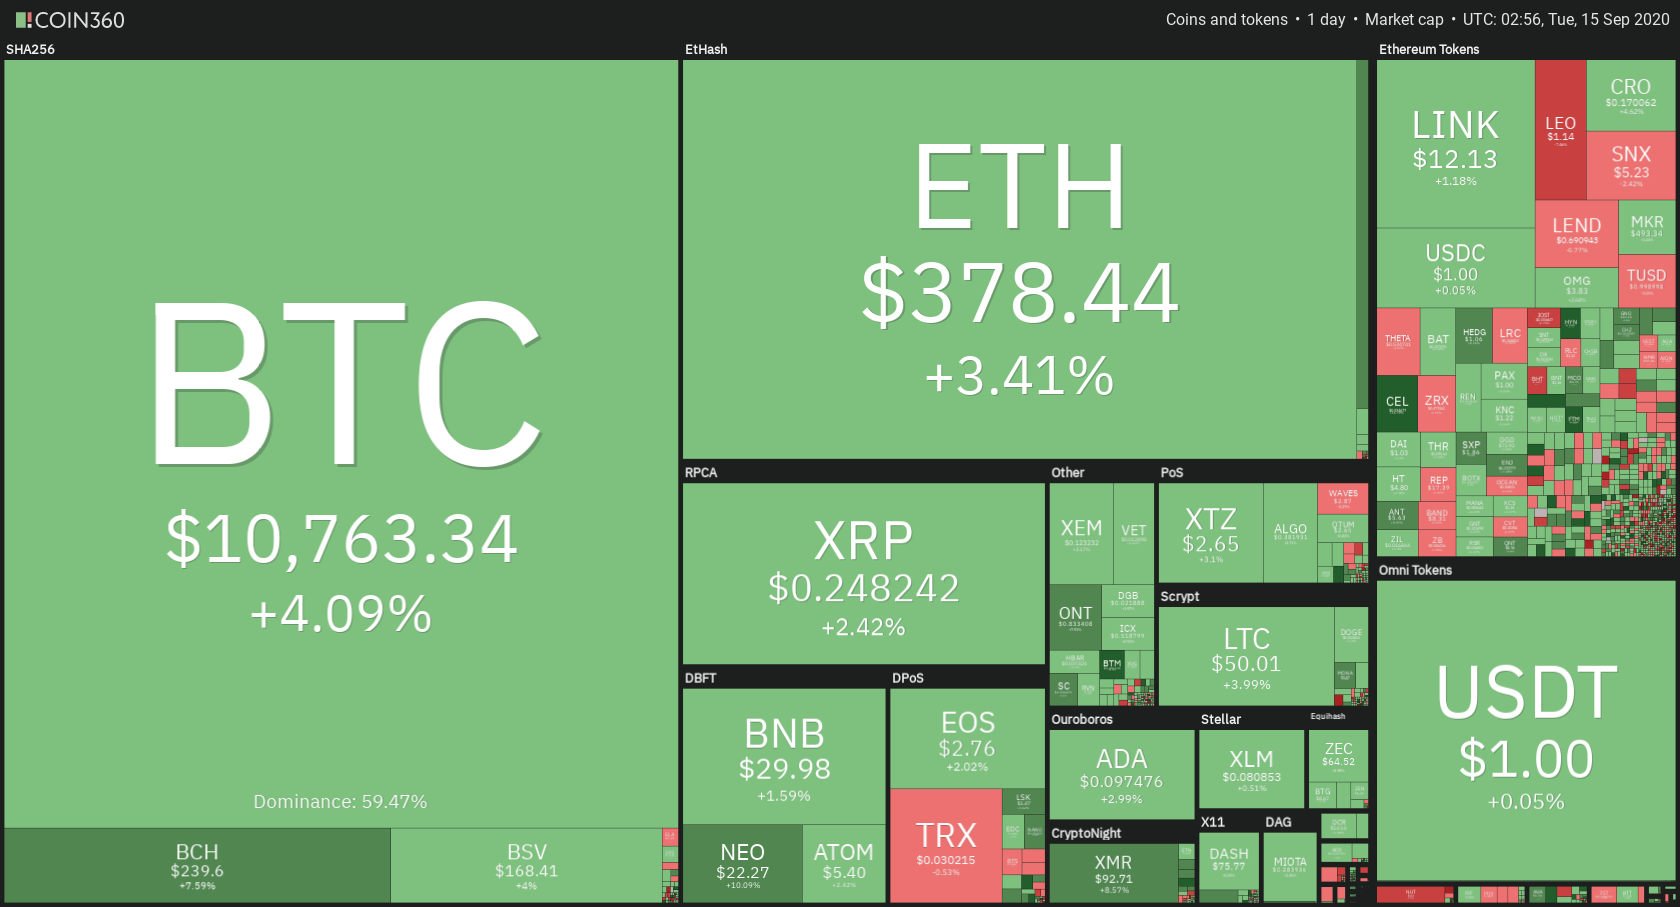
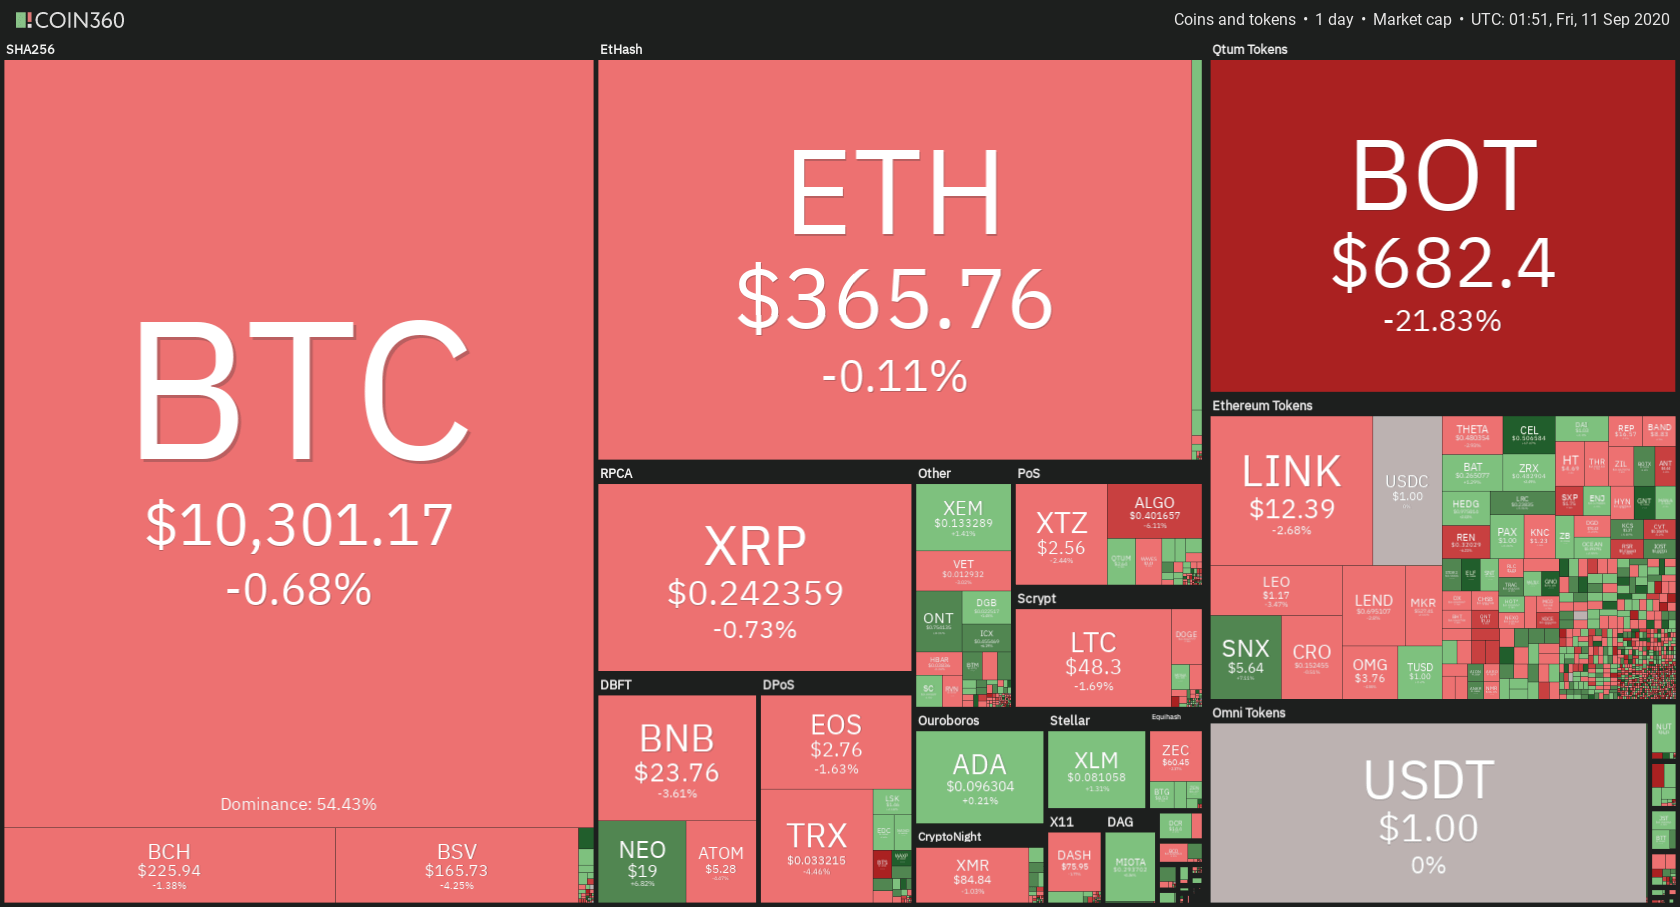
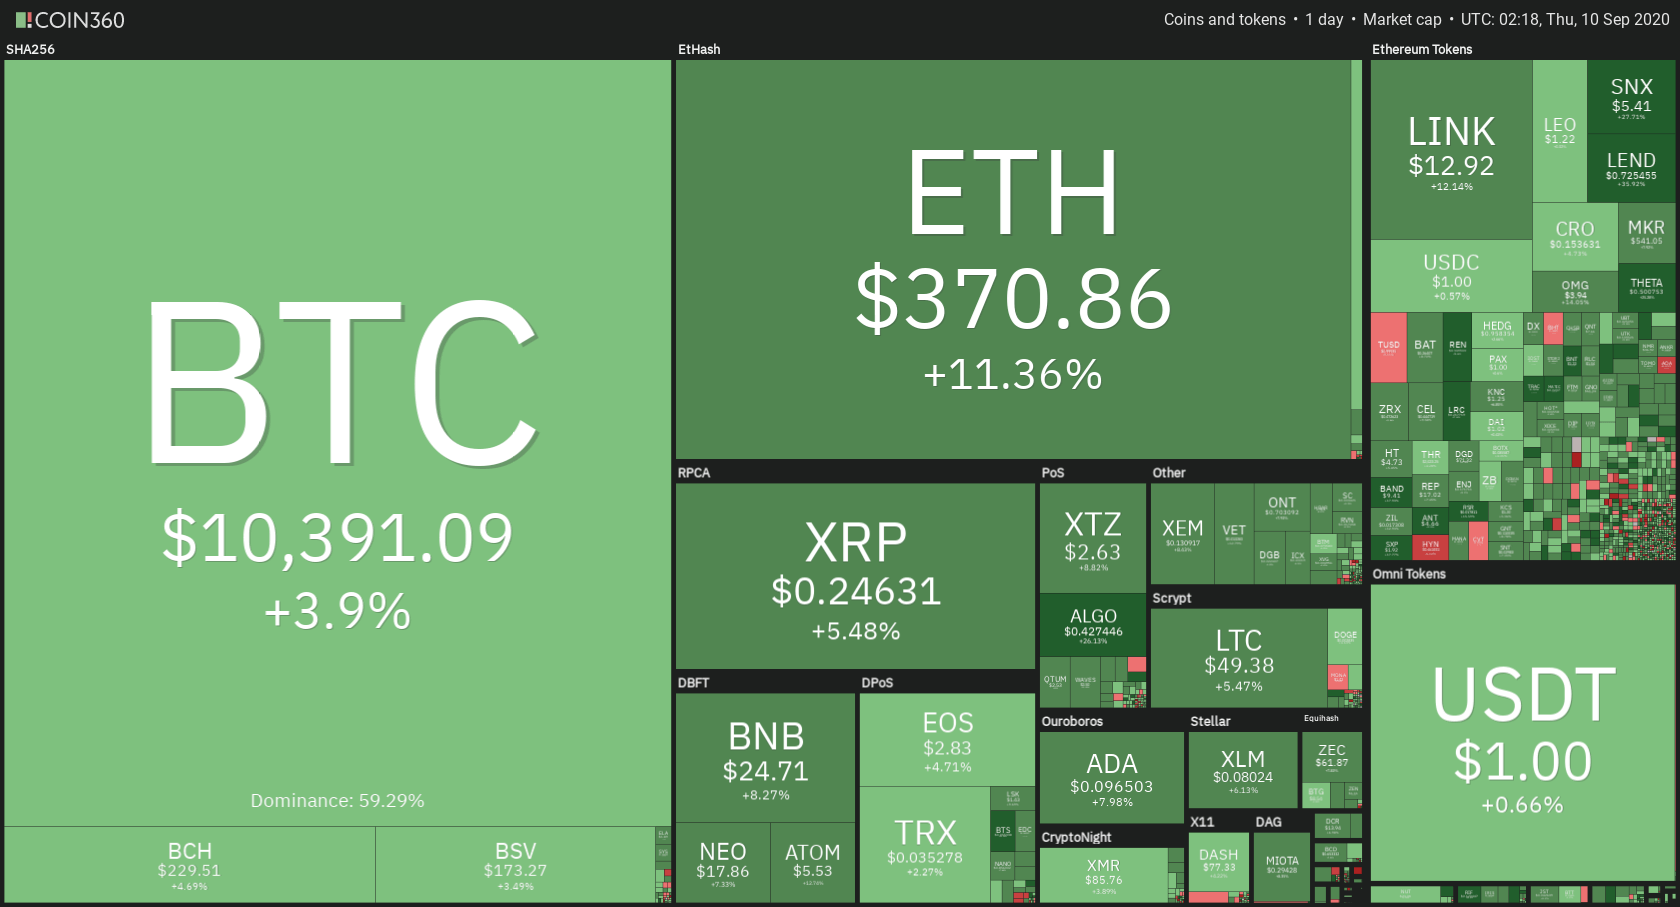
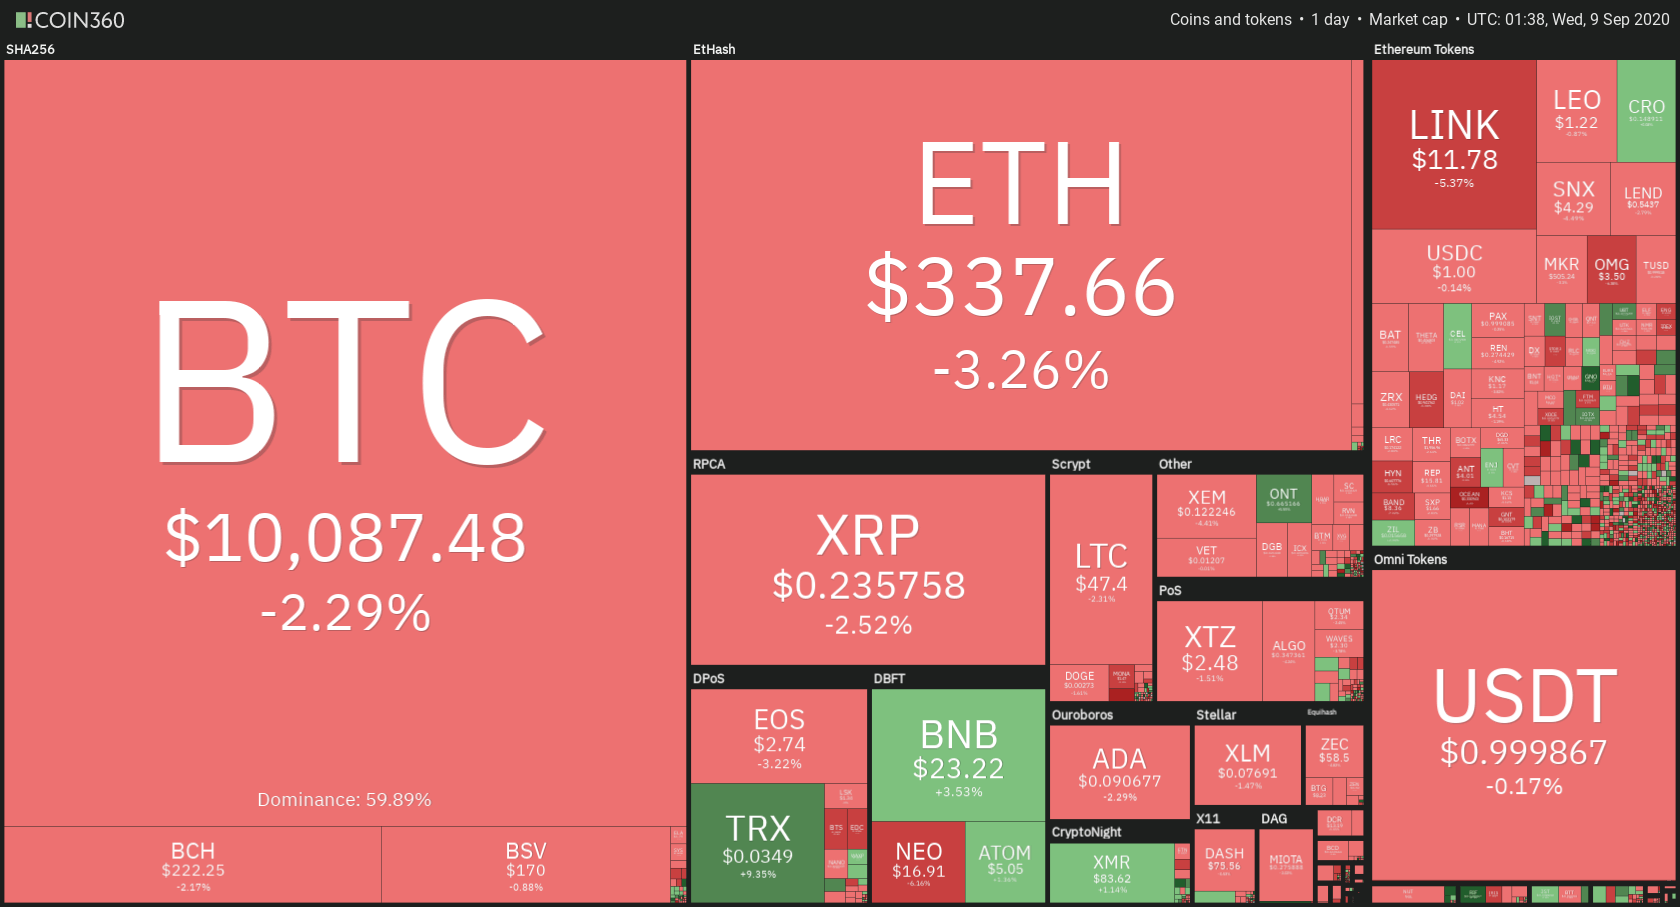
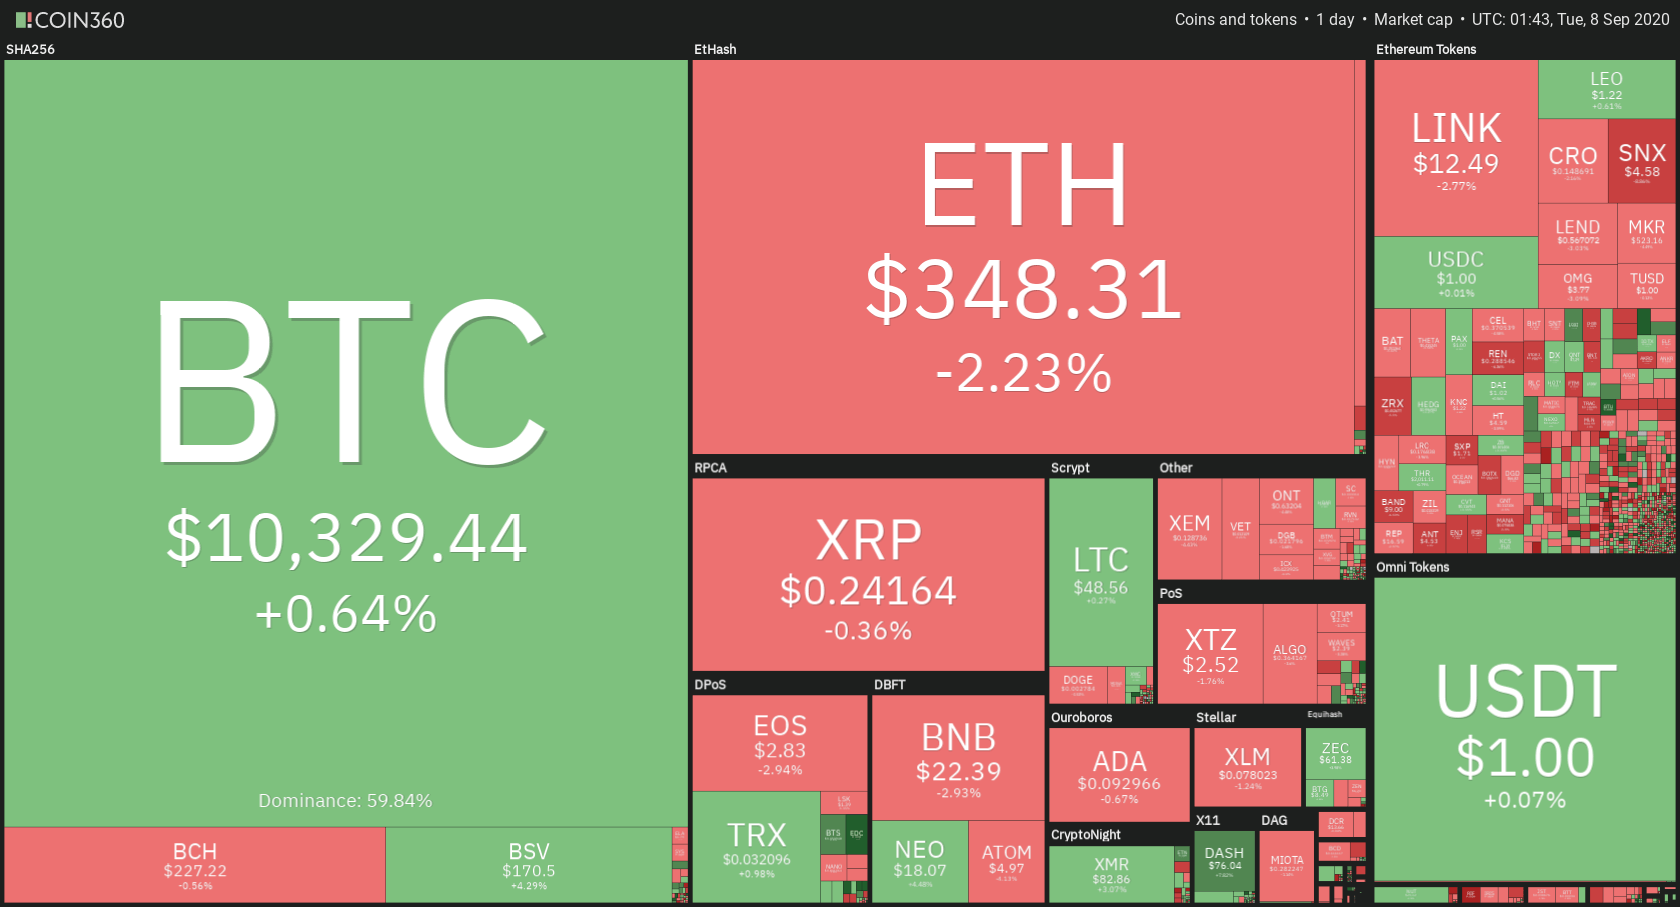
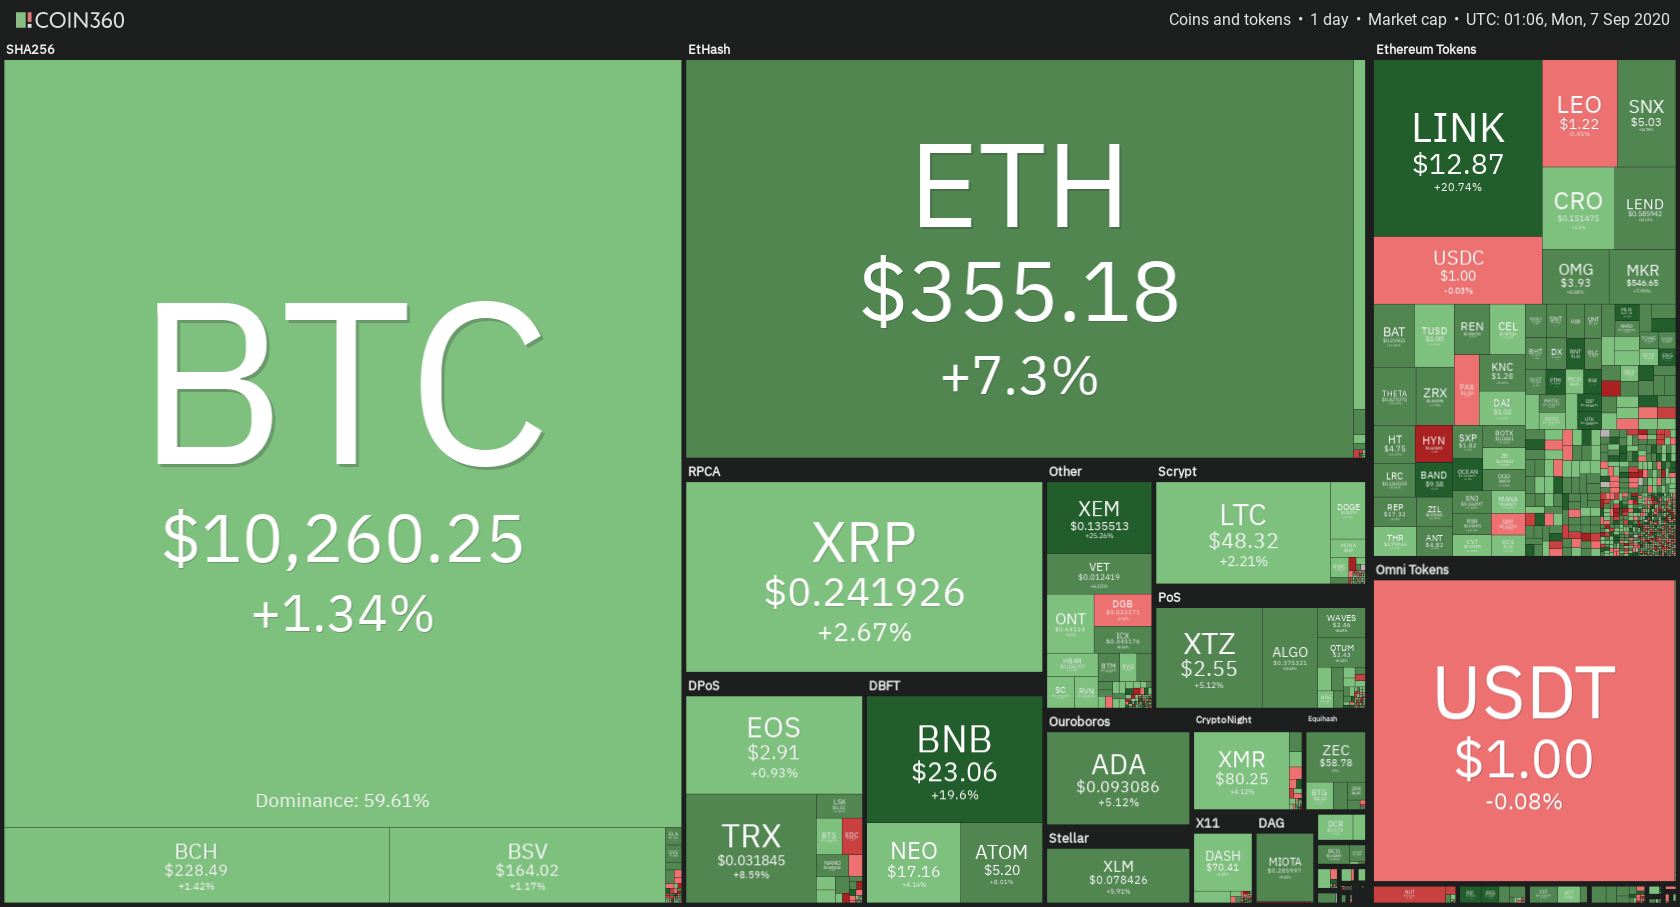
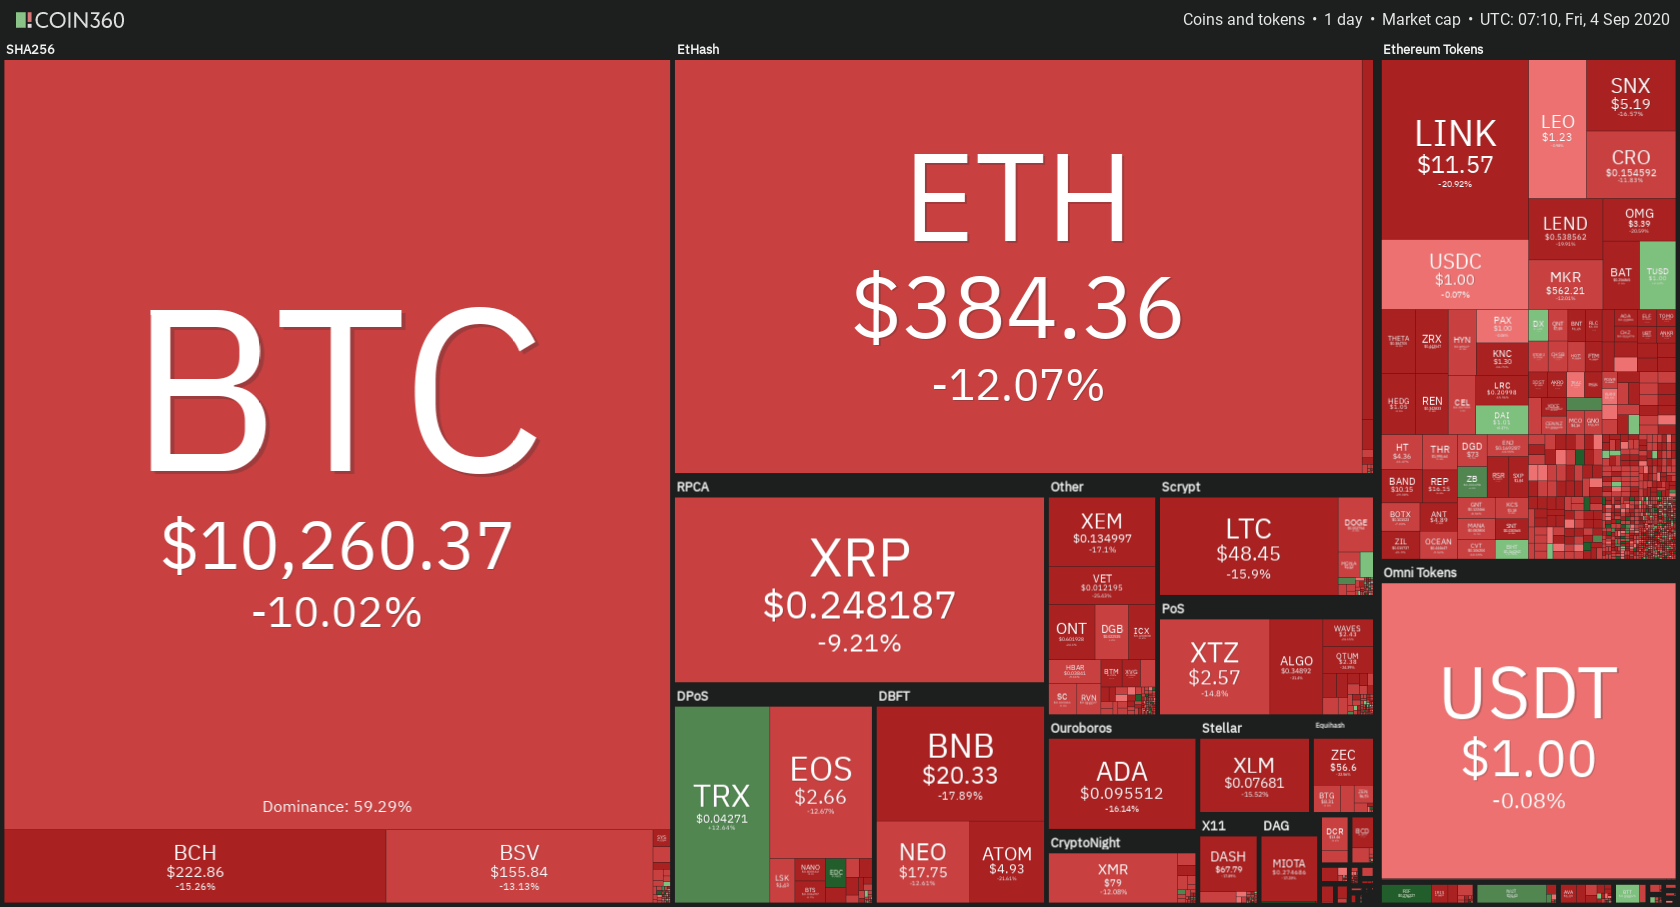
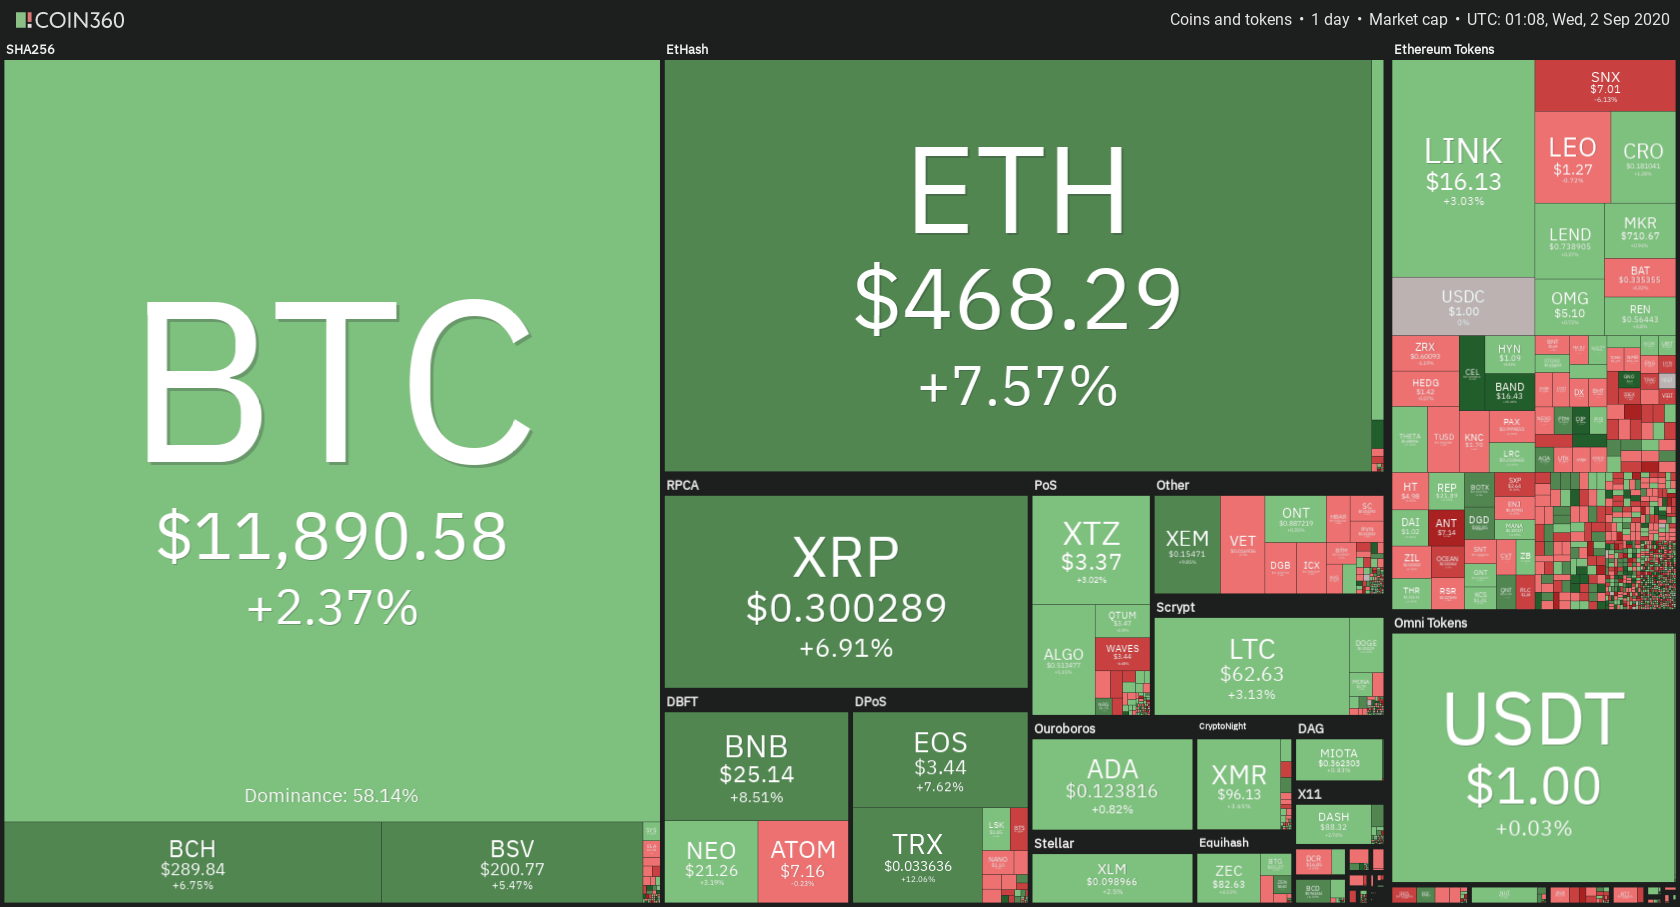
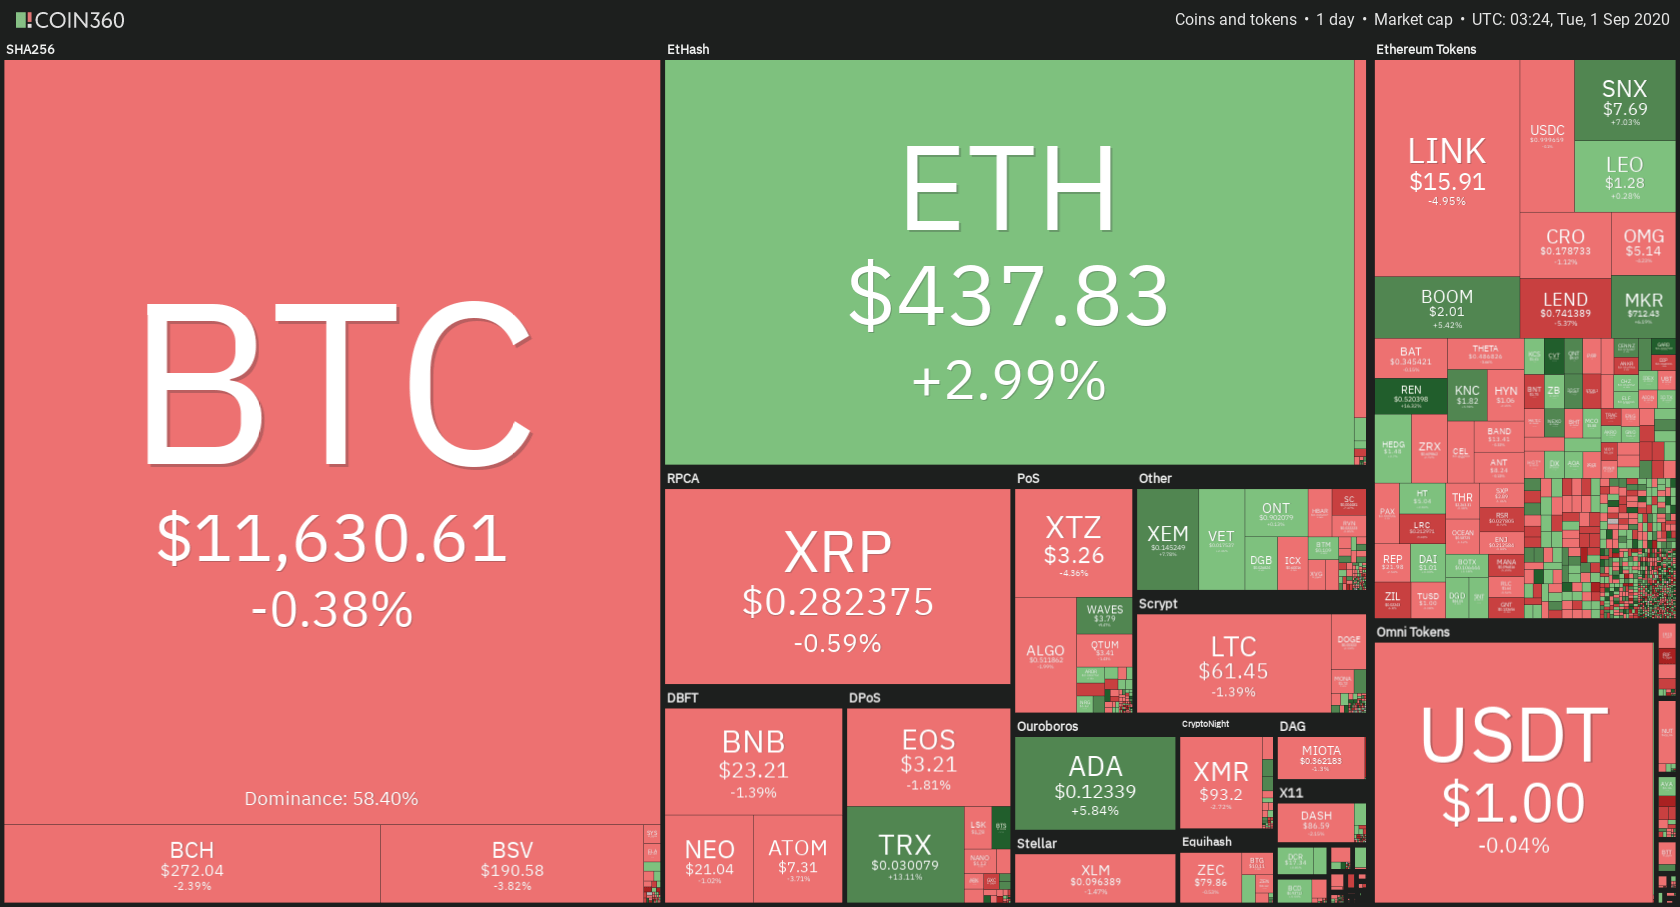
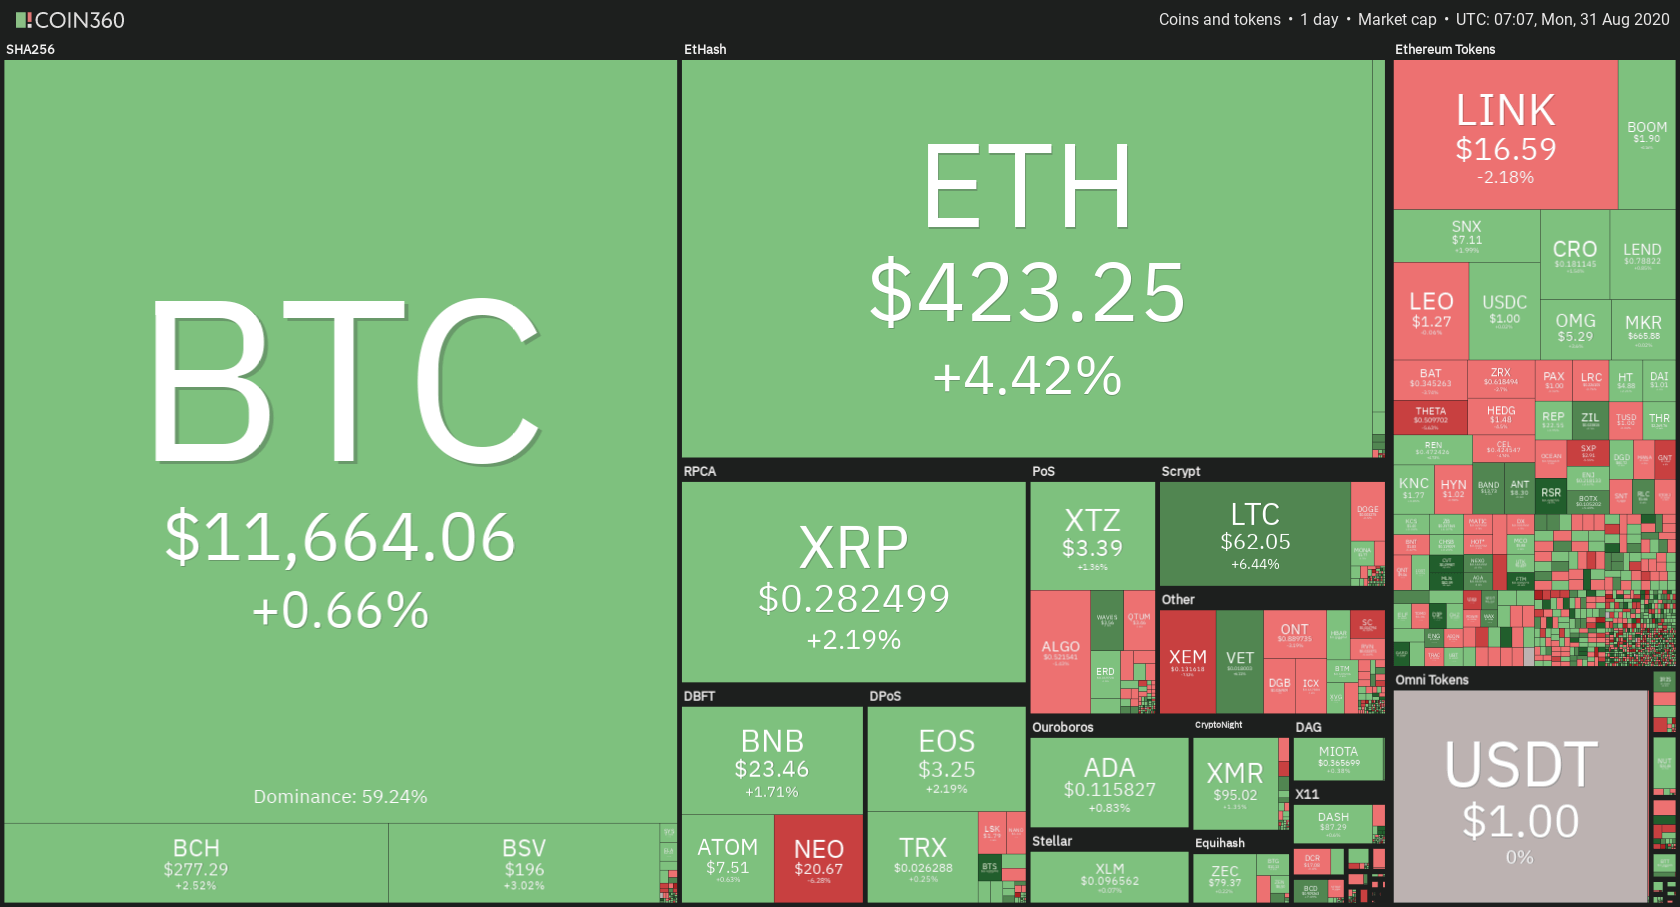
Daily Crypto Sector Heat Map
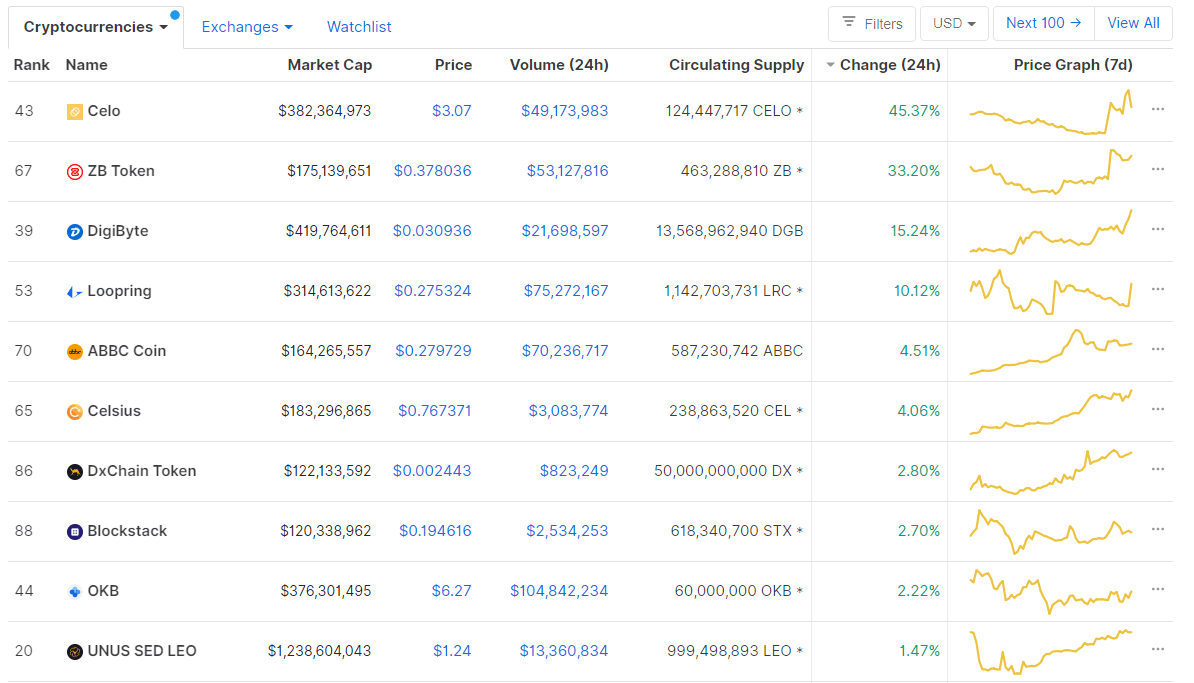
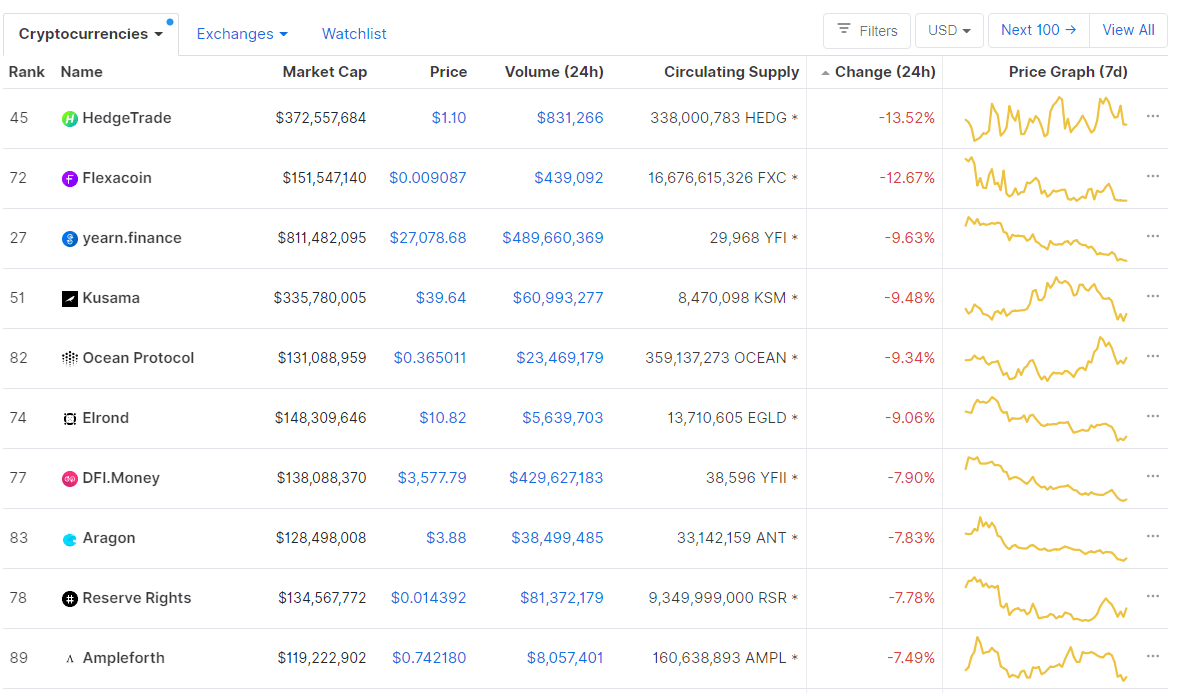
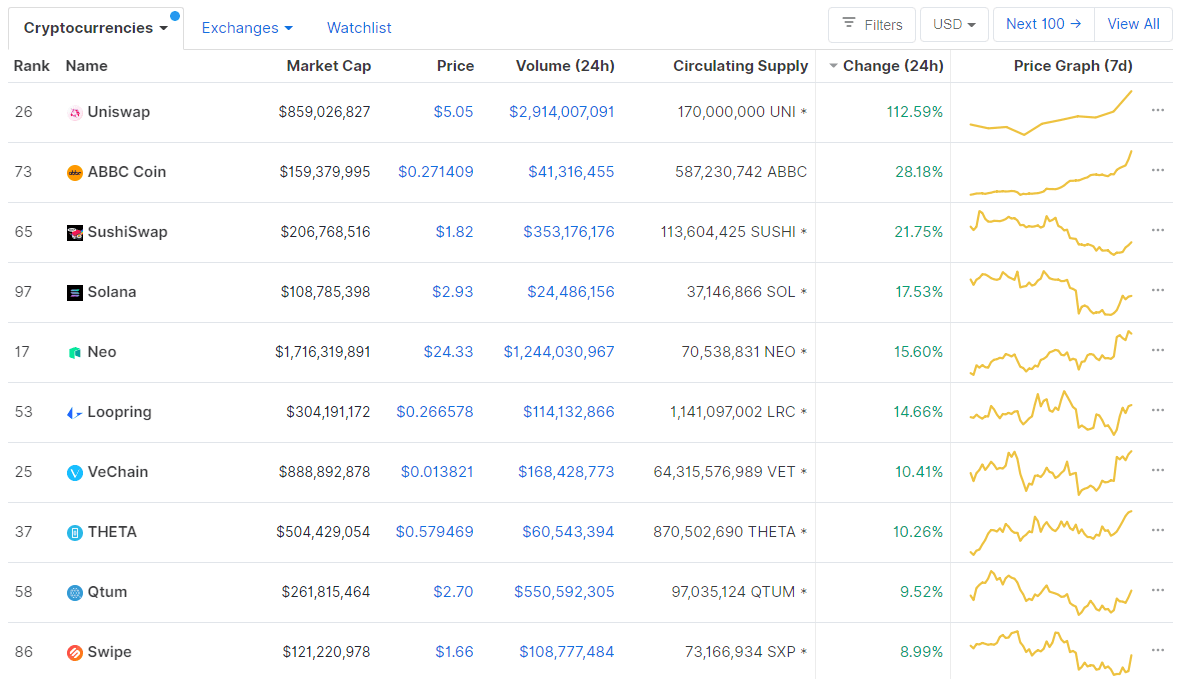
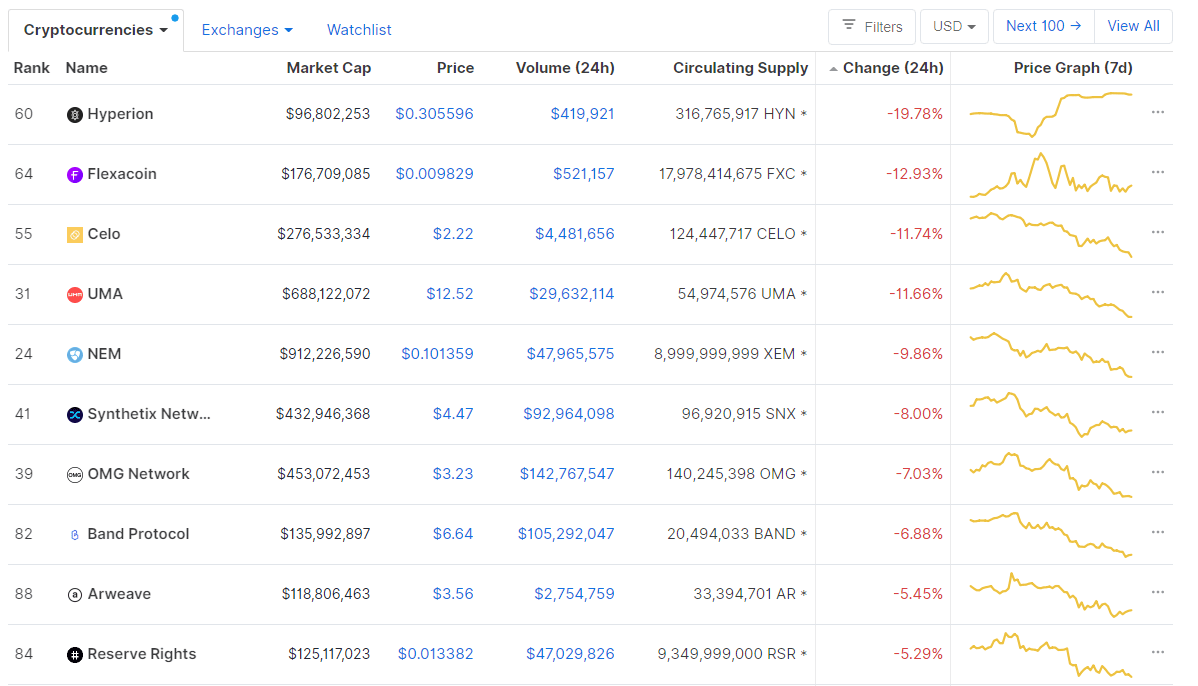
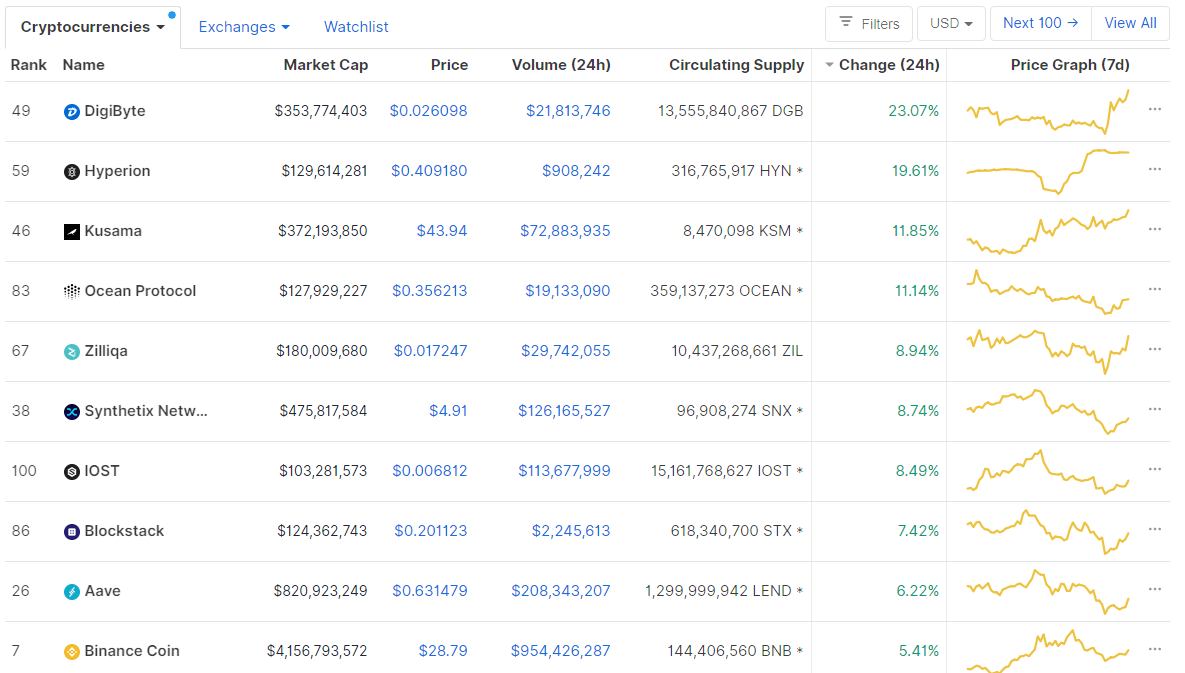
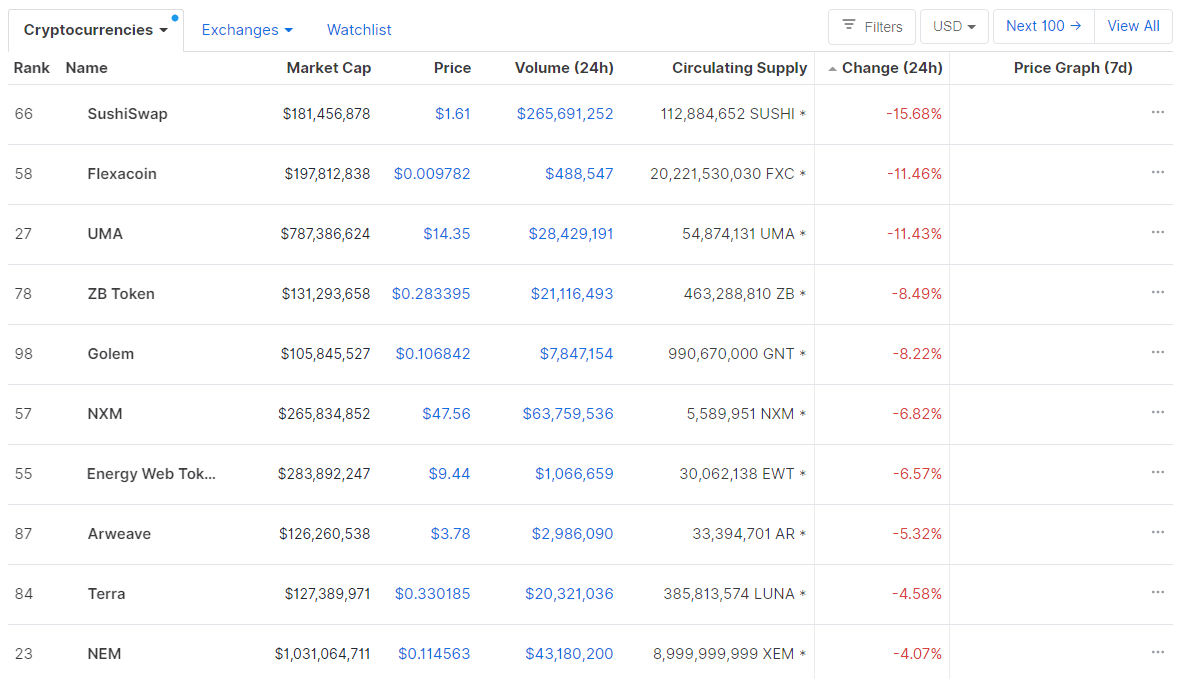
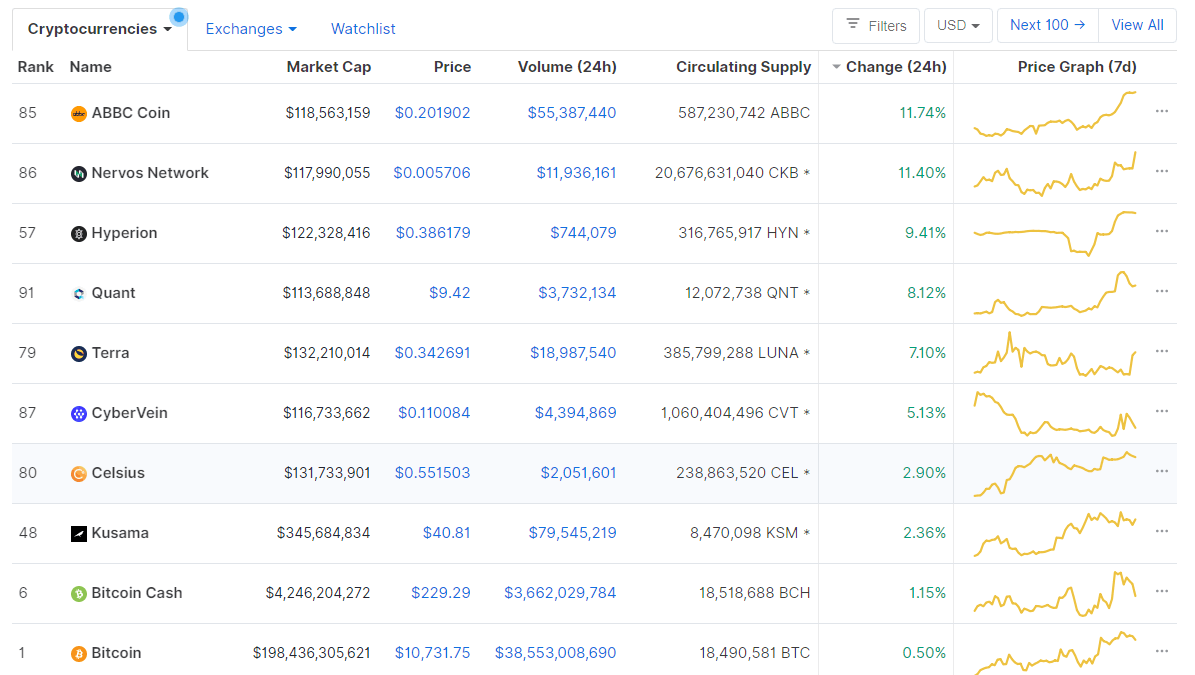
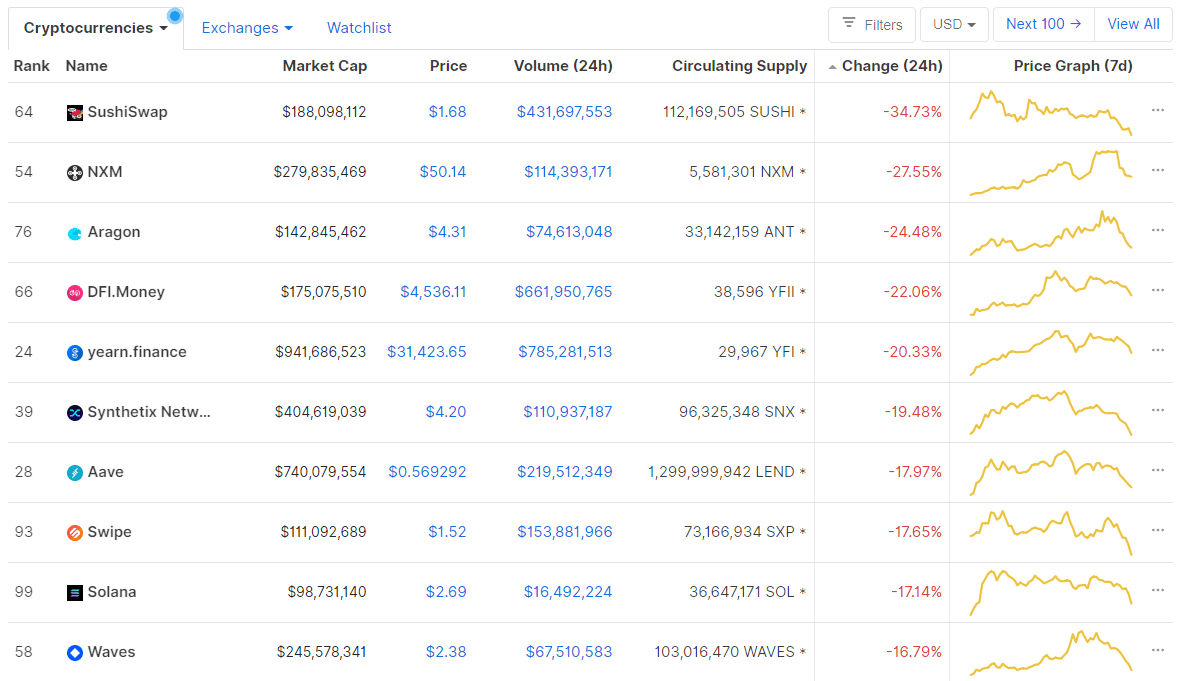
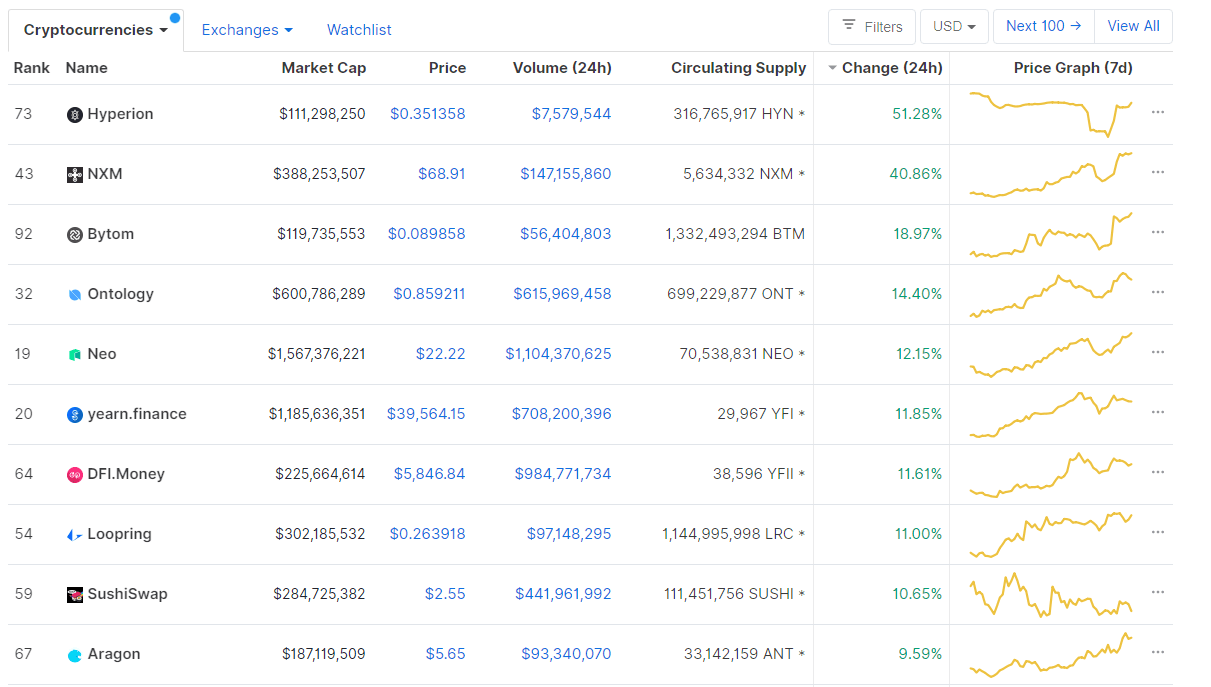
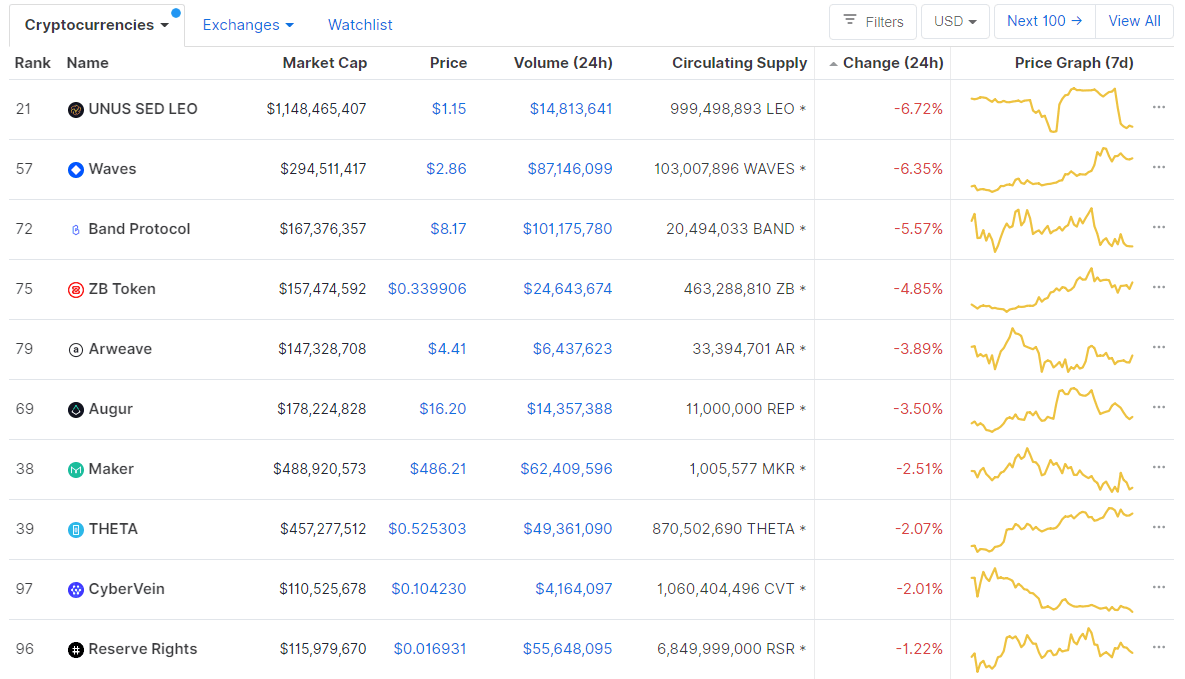
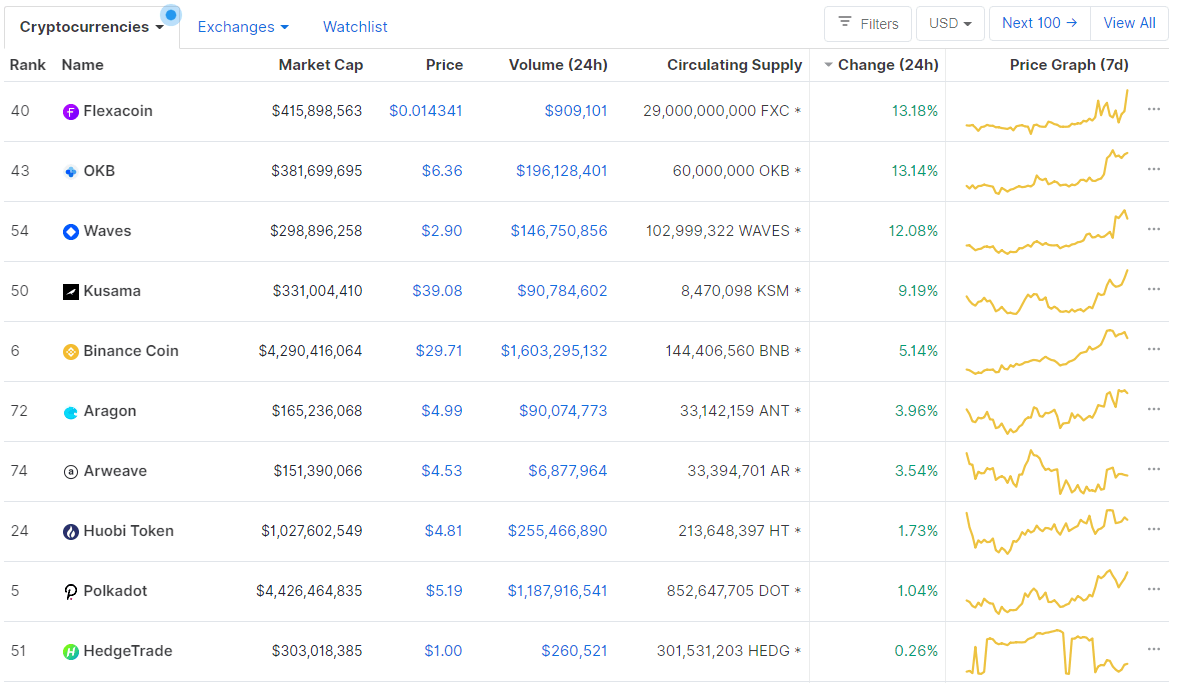
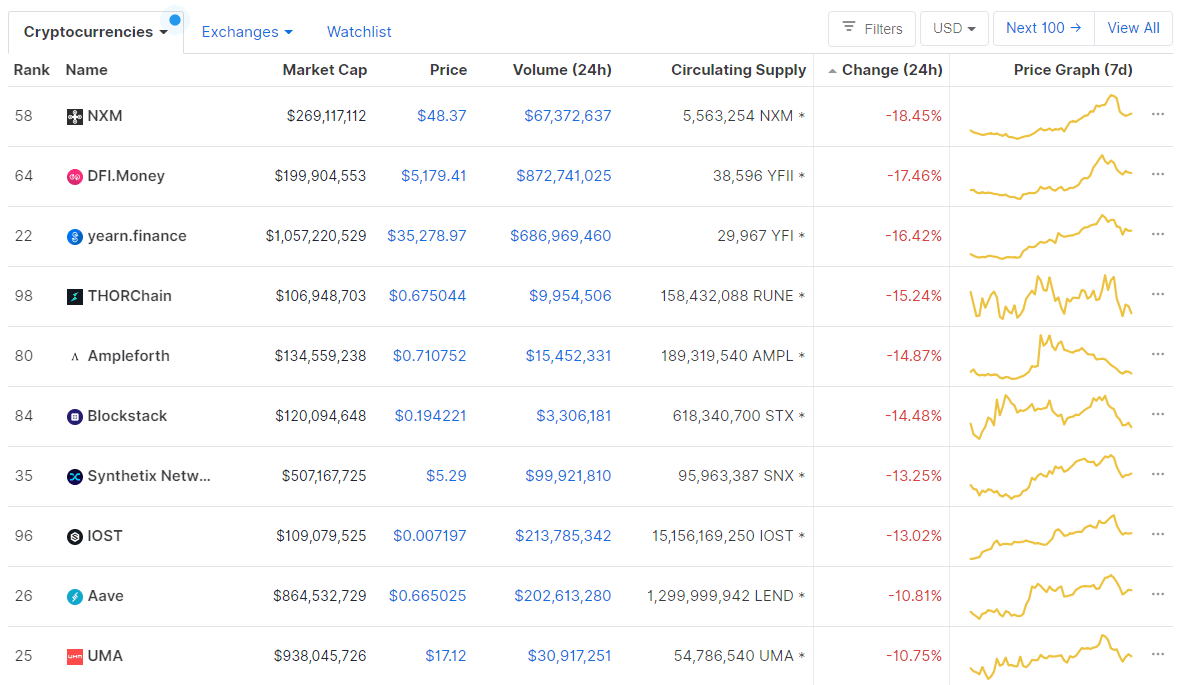
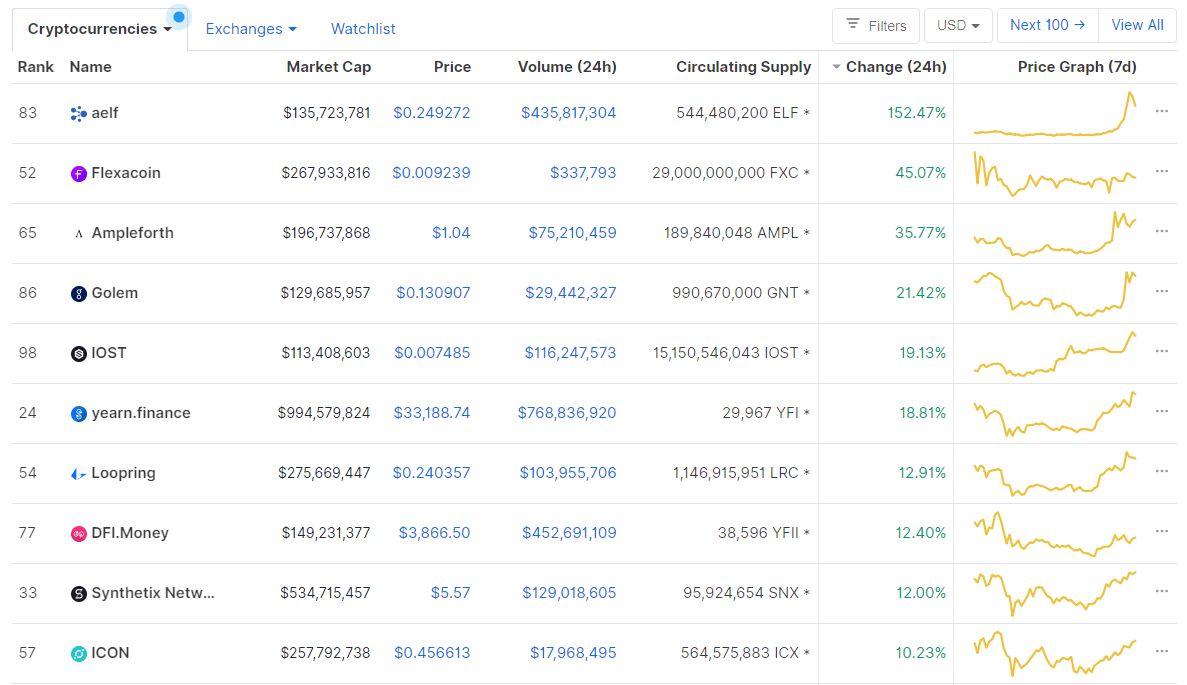
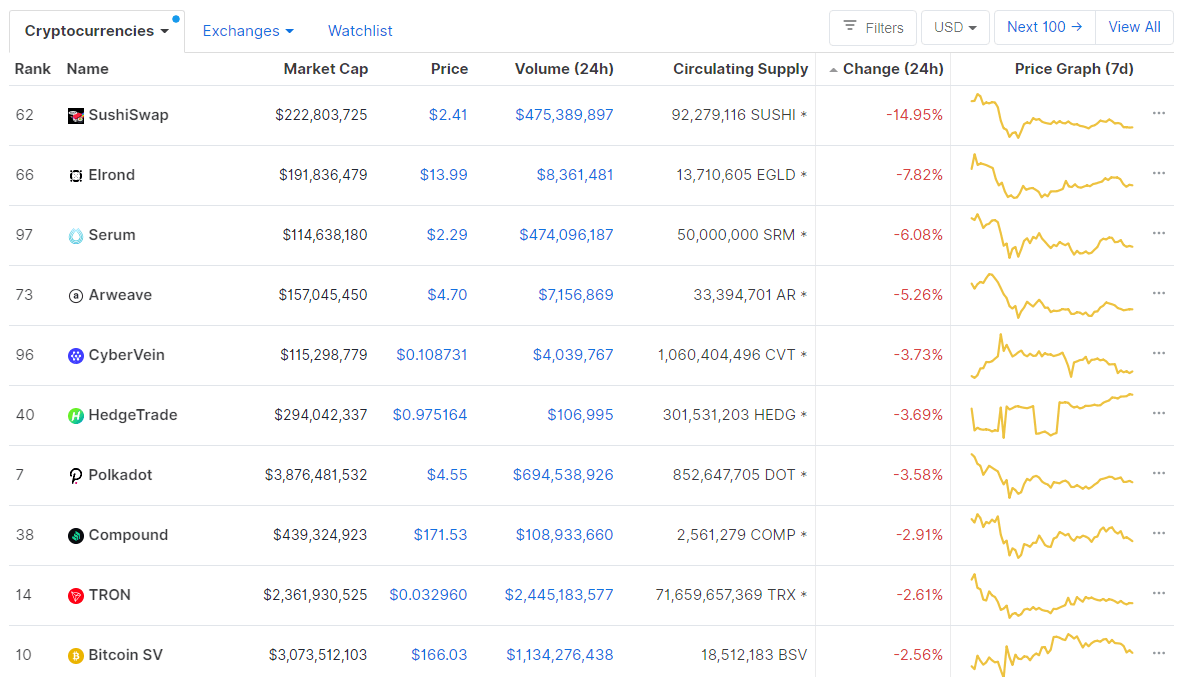
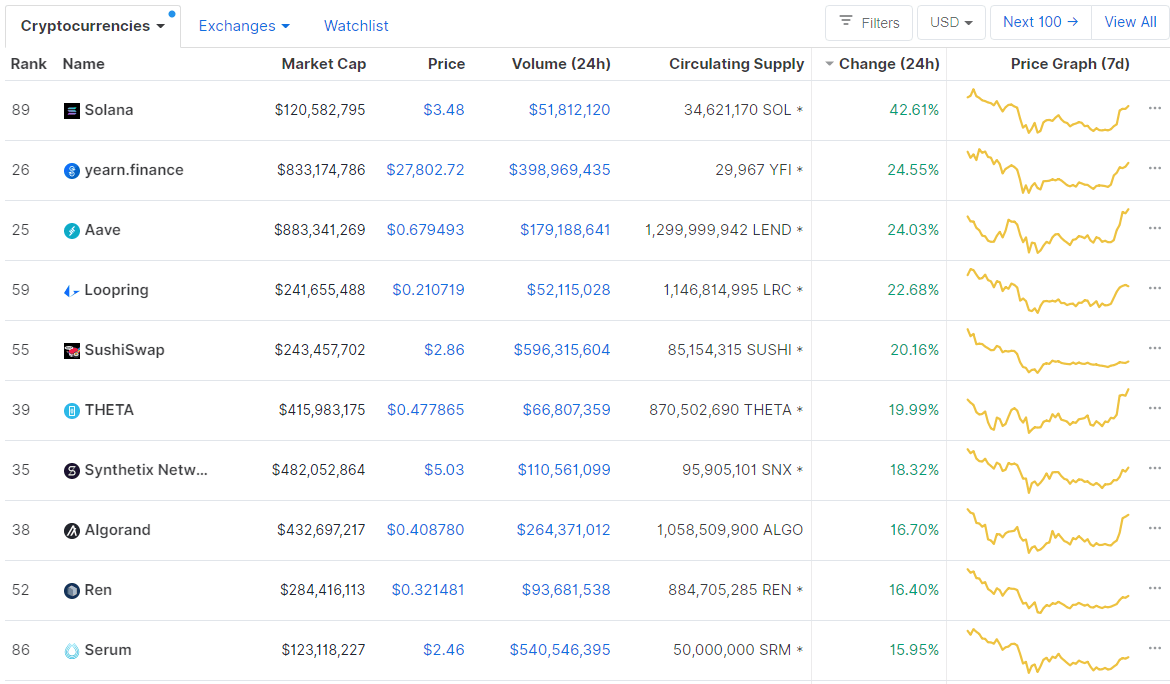
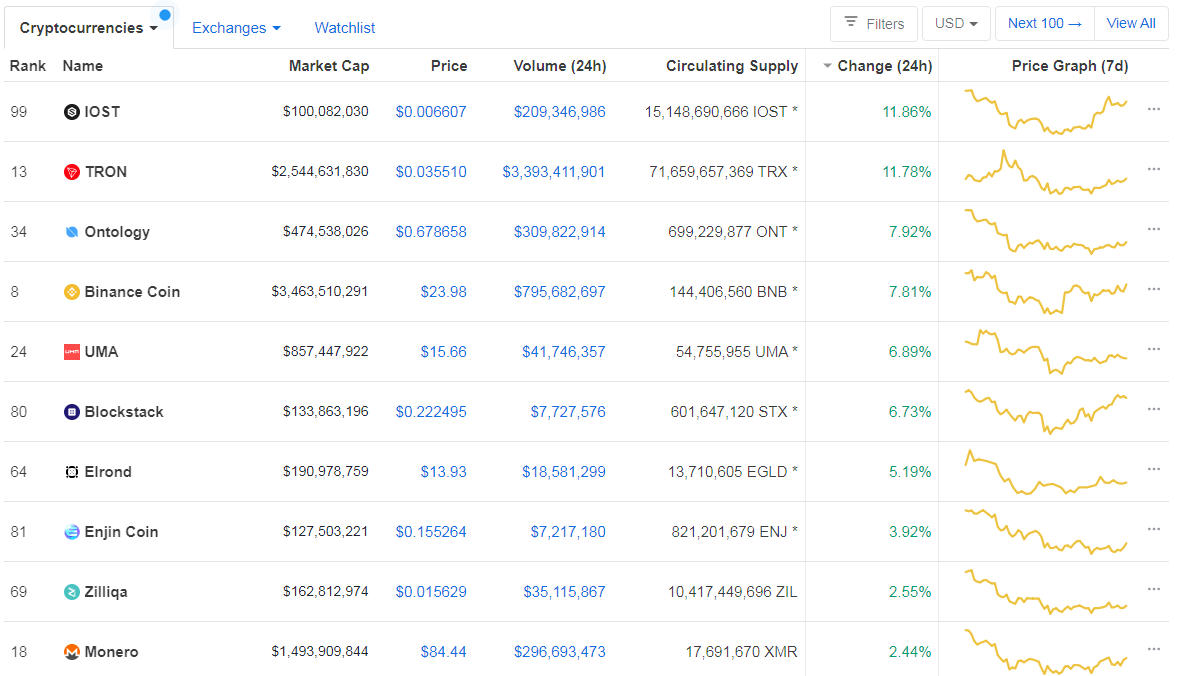
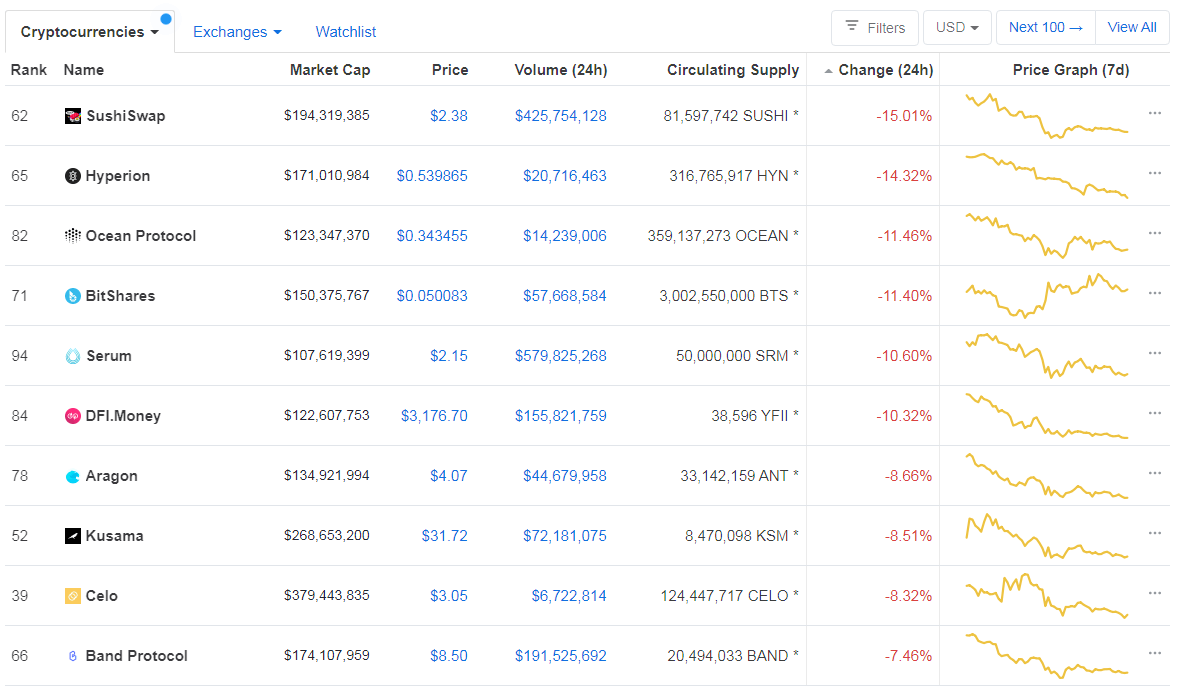
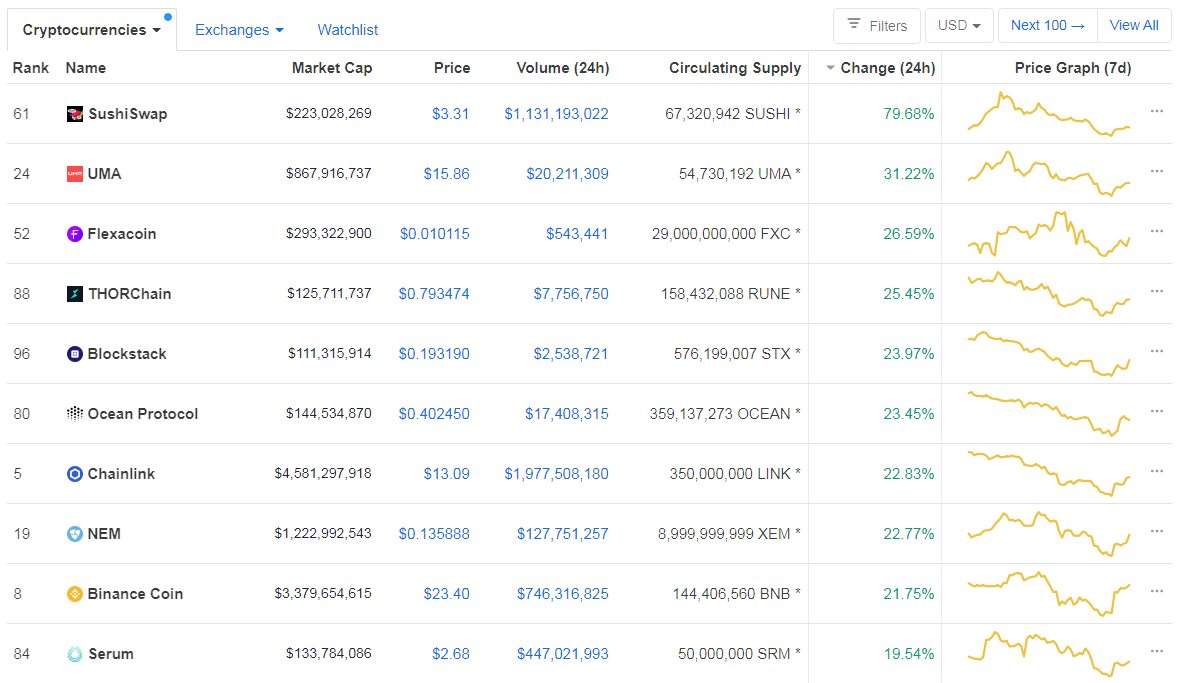
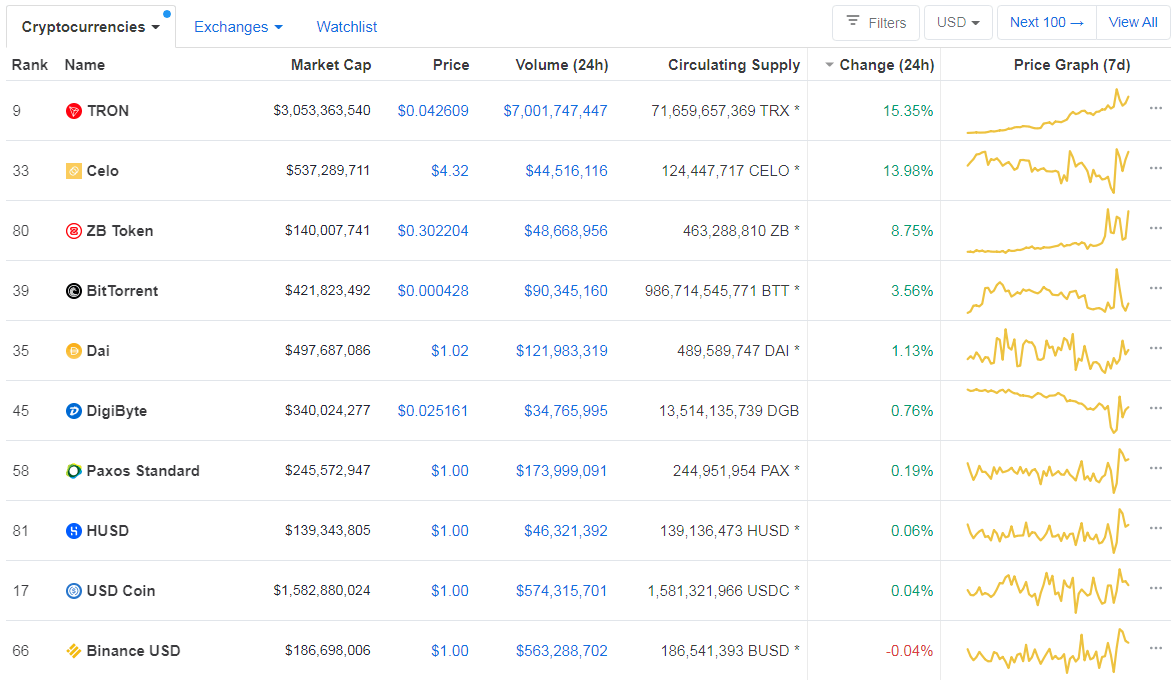
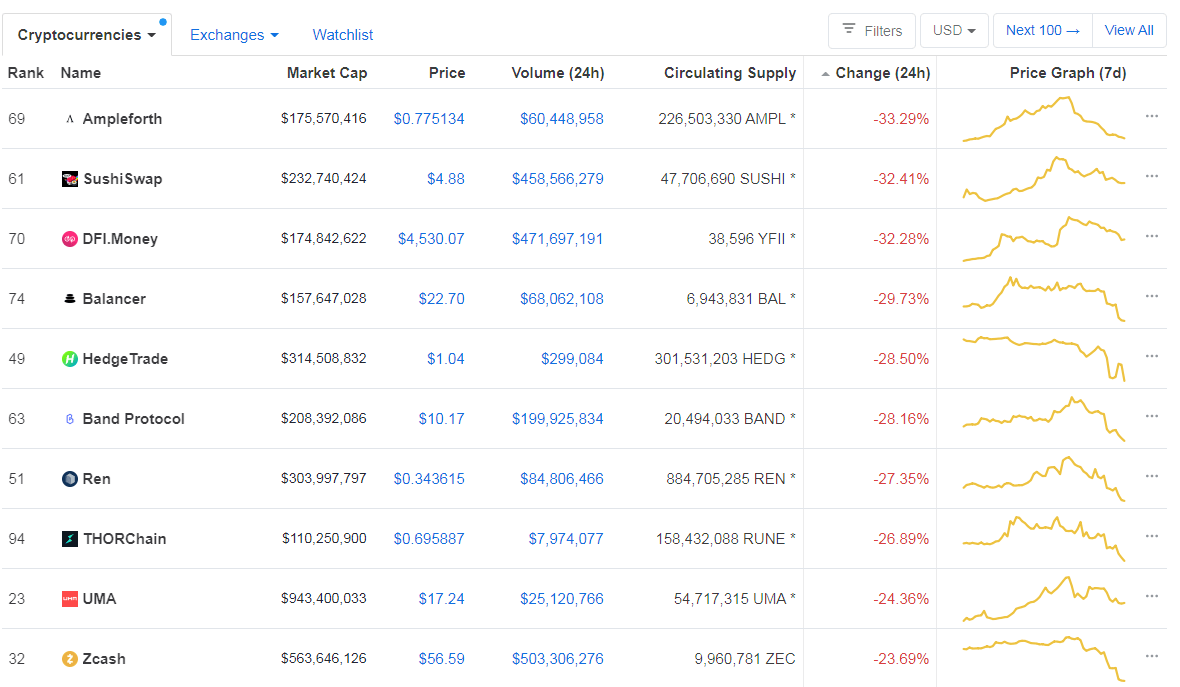
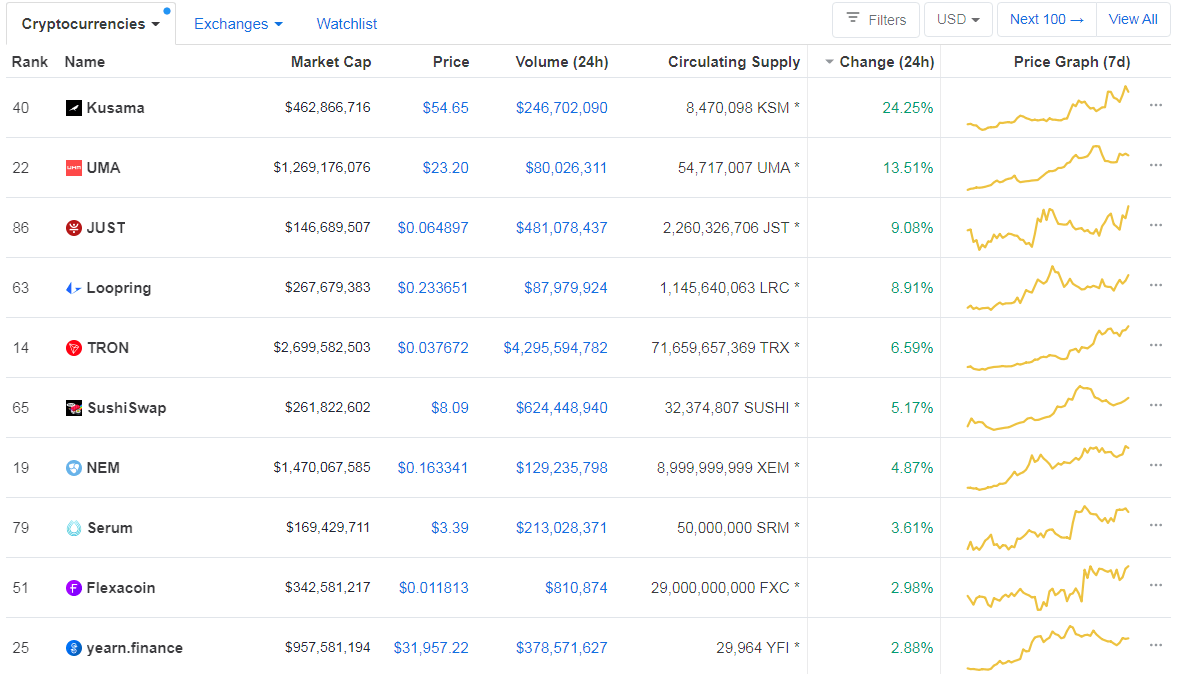
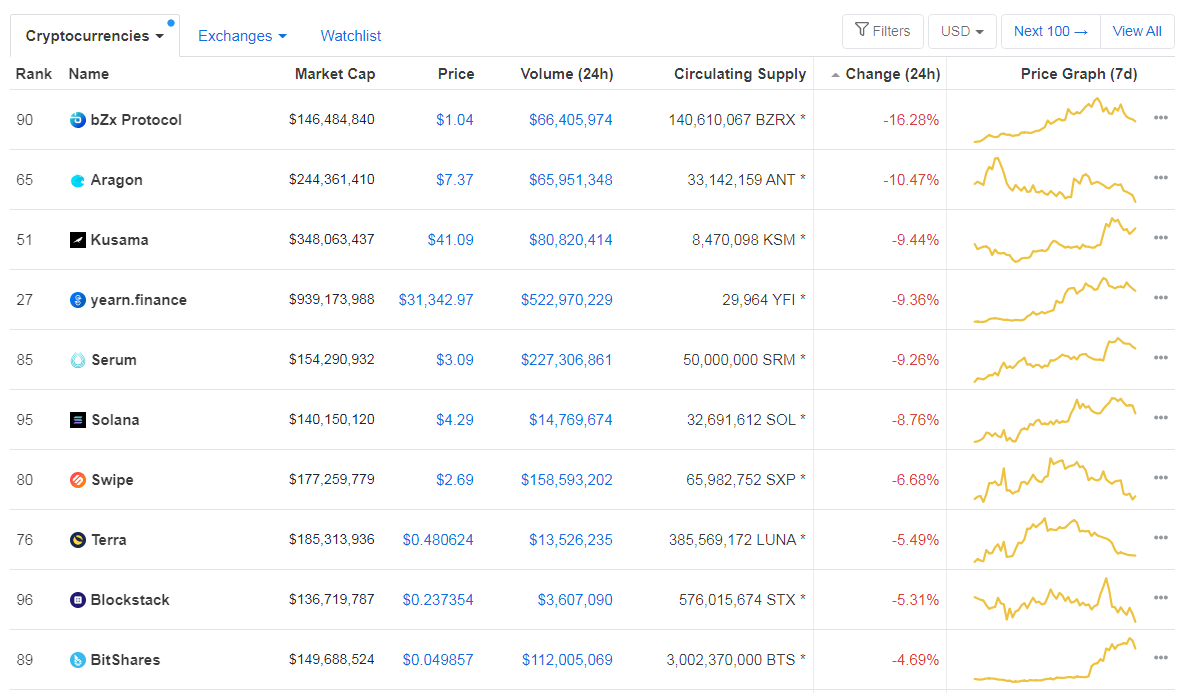
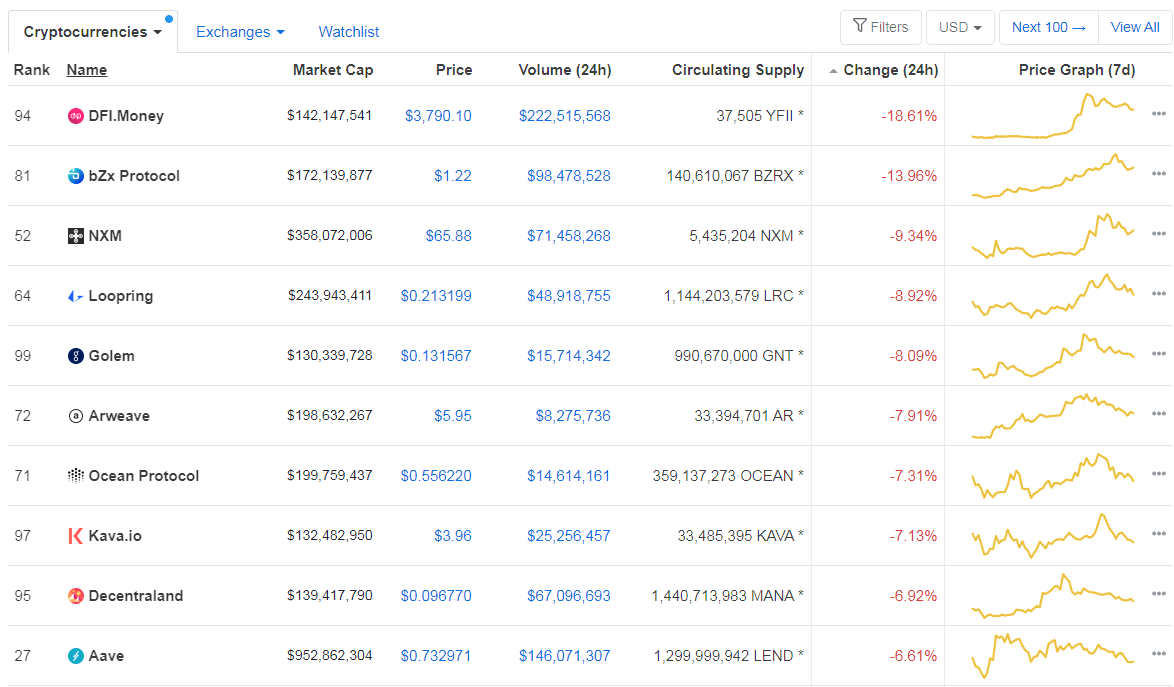
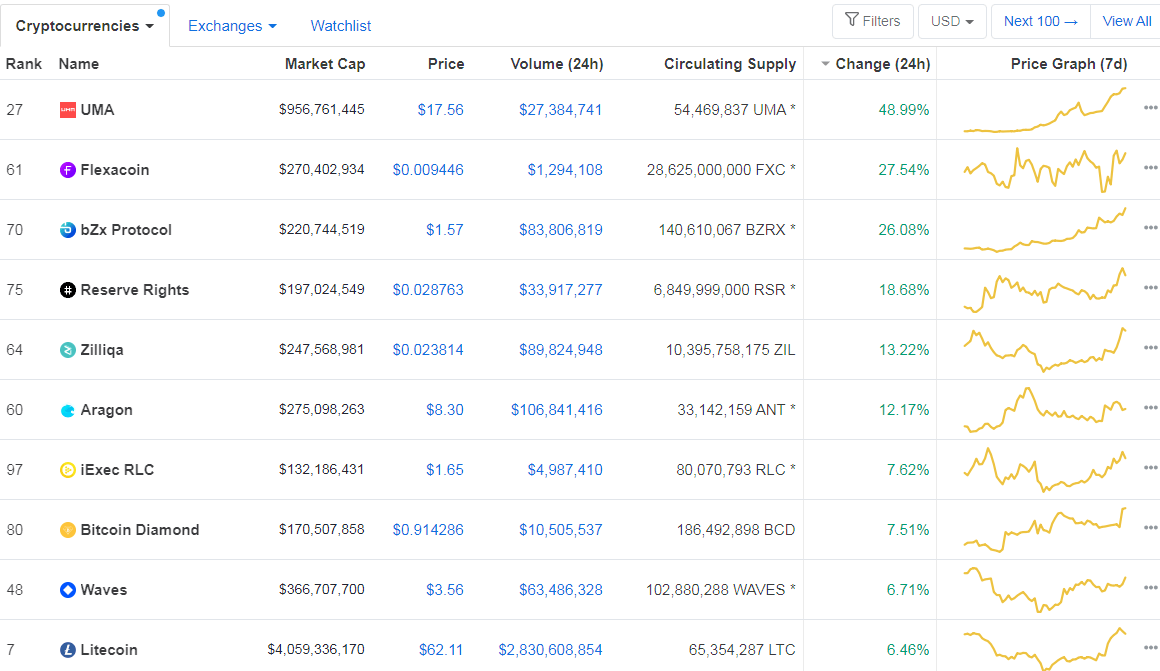
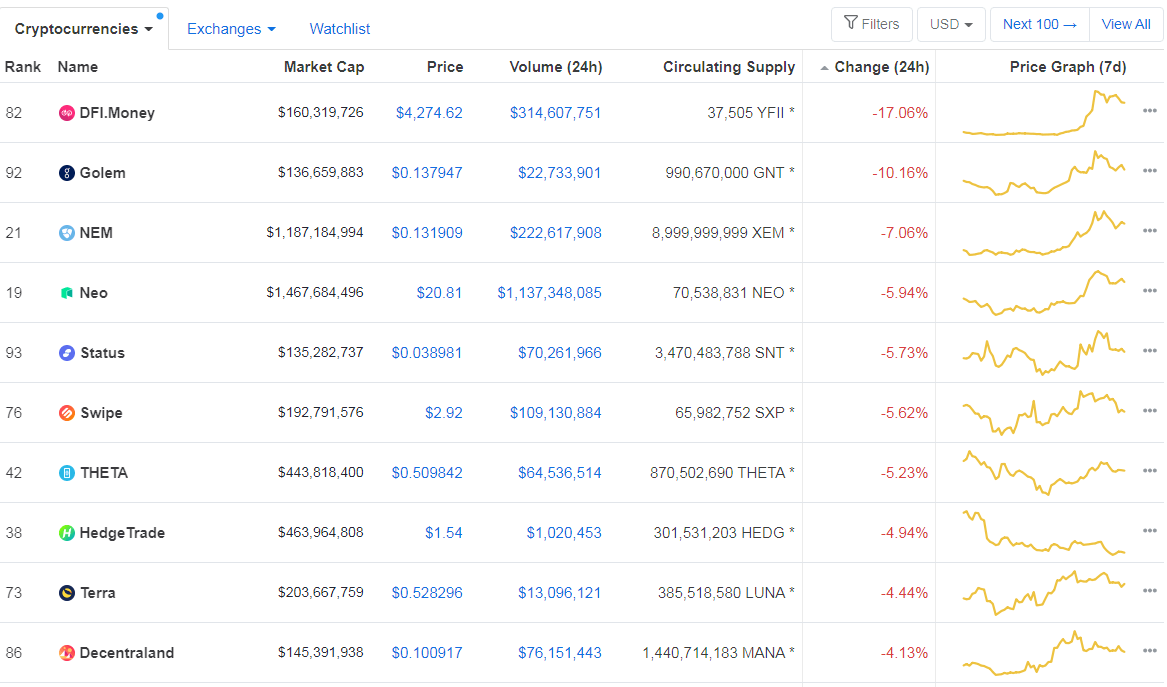
If we look at the top100 cryptocurrencies, only three have actually increased in value. Orchid gained 25.73% on the day, making it the most prominent daily gainer. Loopring (5.88%) and Hyperion (5.03%) also did great. On the other hand, Celo lost 19.17%, making it the most prominent daily loser. It is followed by Uniswap’s loss of 19.04% and Aave’s loss of 16.93%.
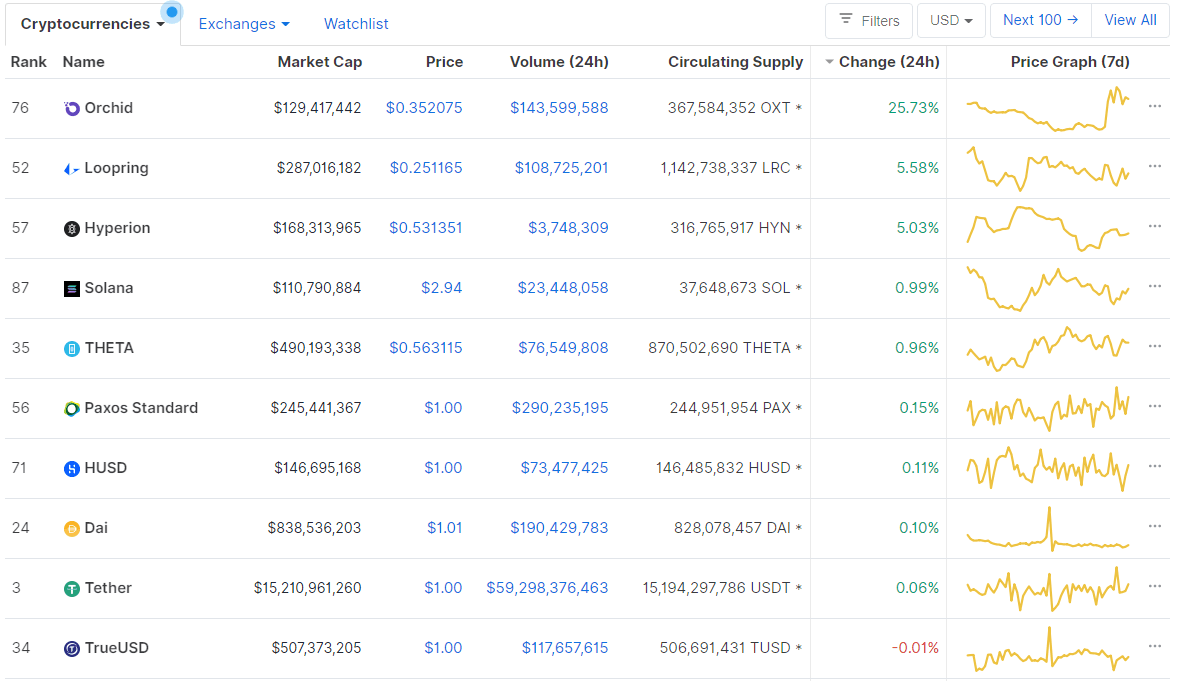
Top 10 24-hour Performers (Click to enlarge)
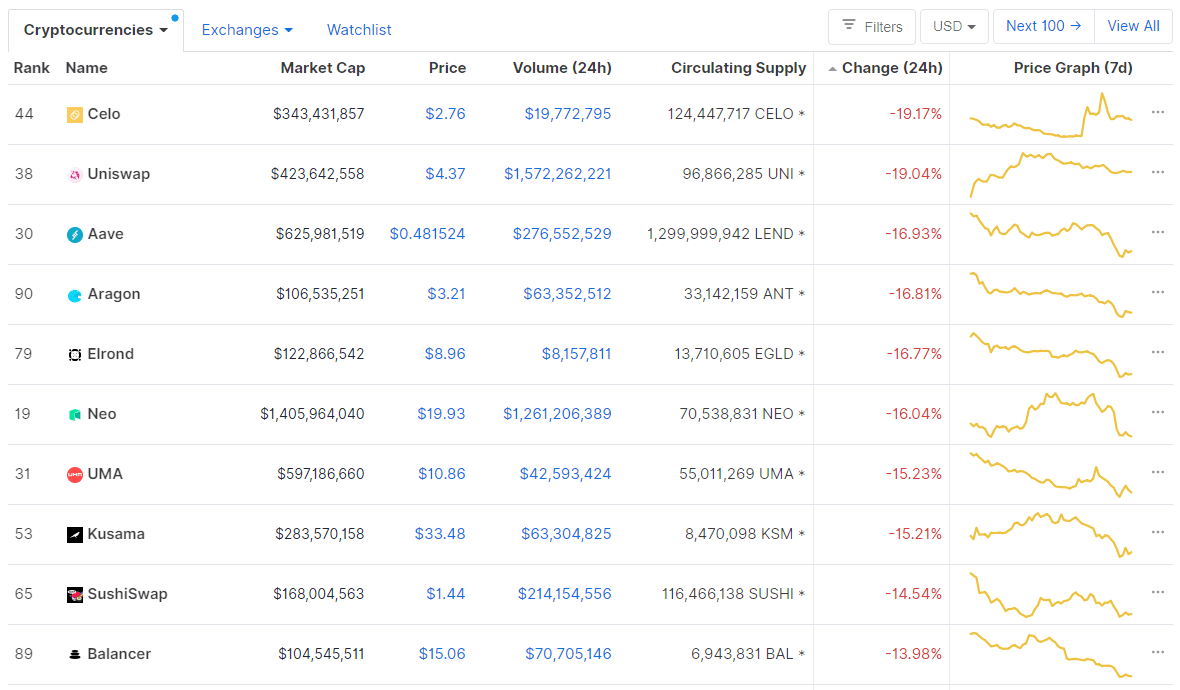
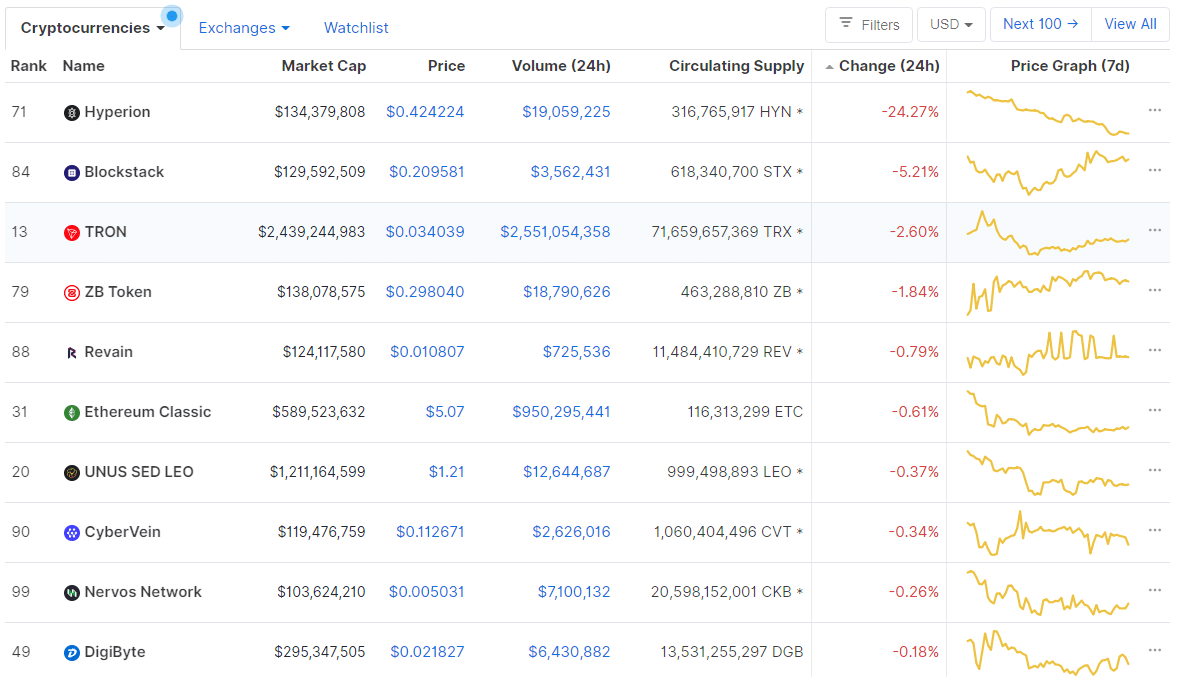
Bottom 10 24-hour Performers (Click to enlarge)
Bitcoin’s dominance level experienced an increase since our last report (as it always happens when the market drops), with its value currently being at 61.29%. This value represents a 0.67% difference to the upside when compared to when we last reported.
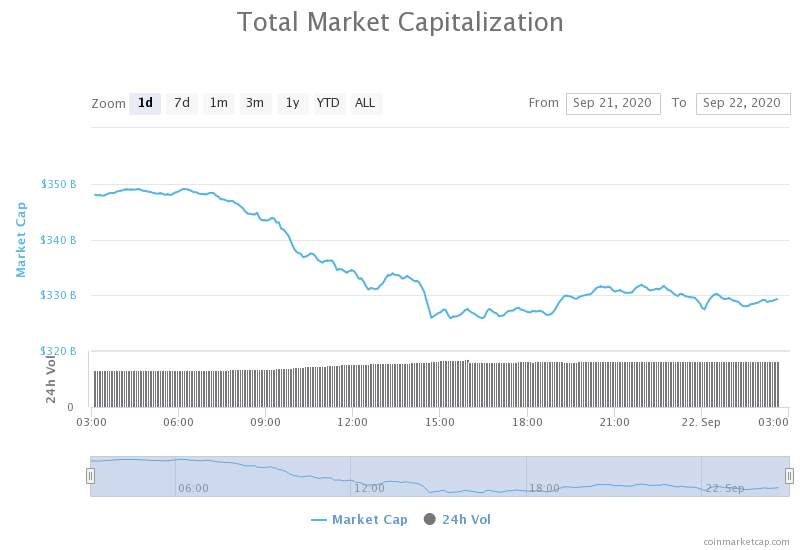
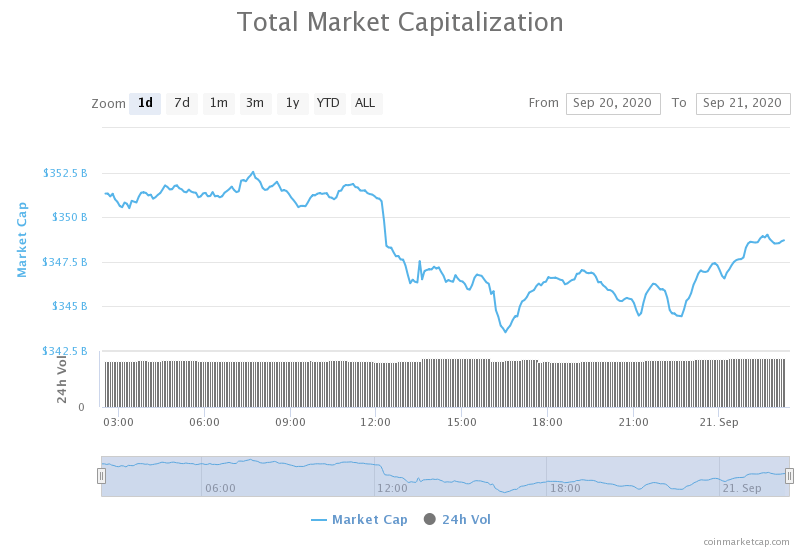
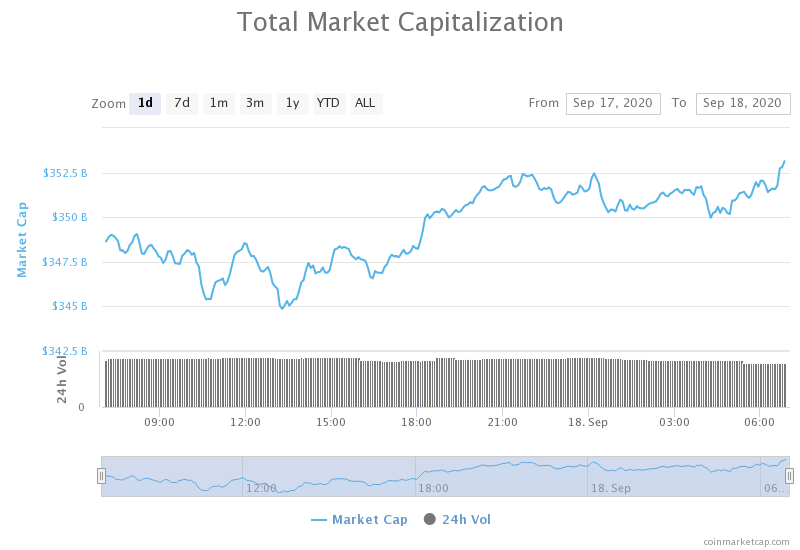
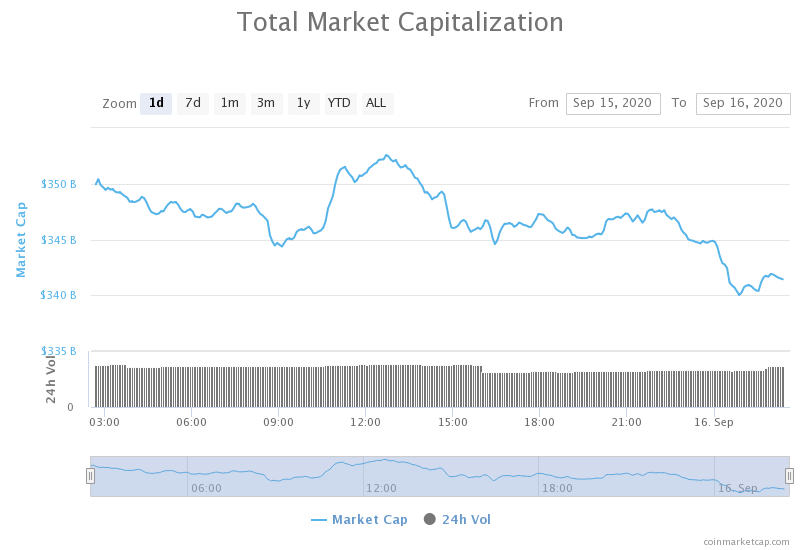
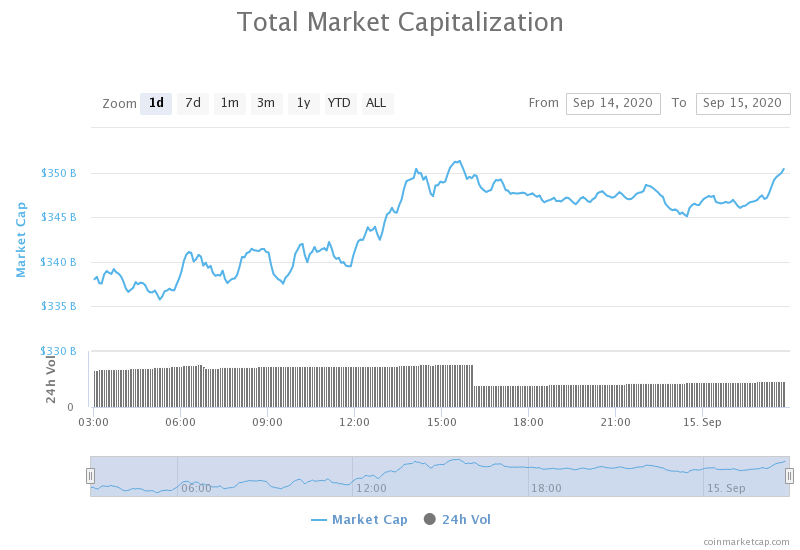
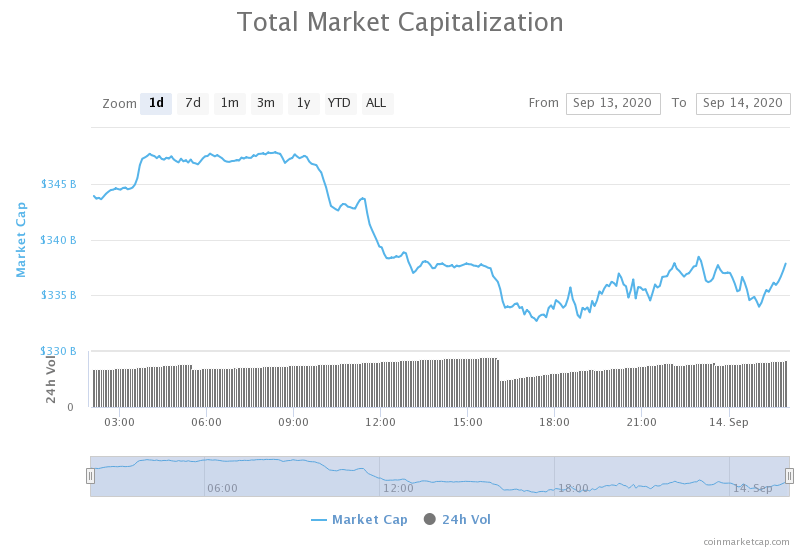
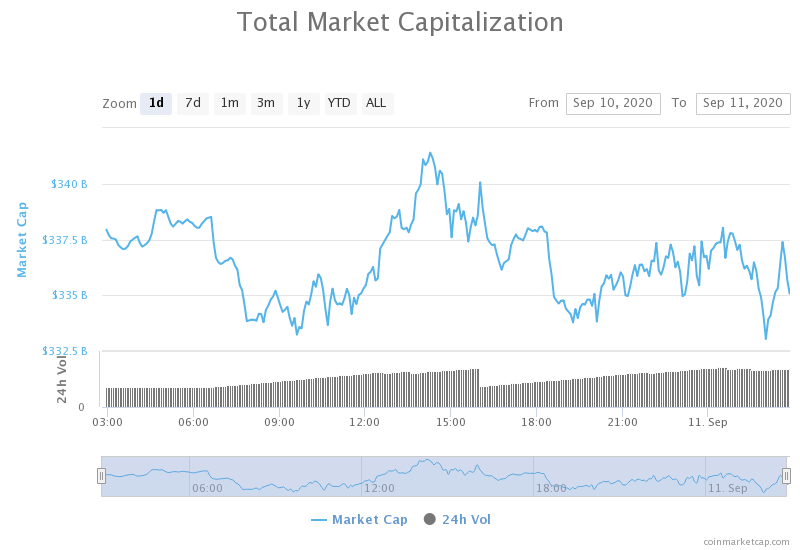
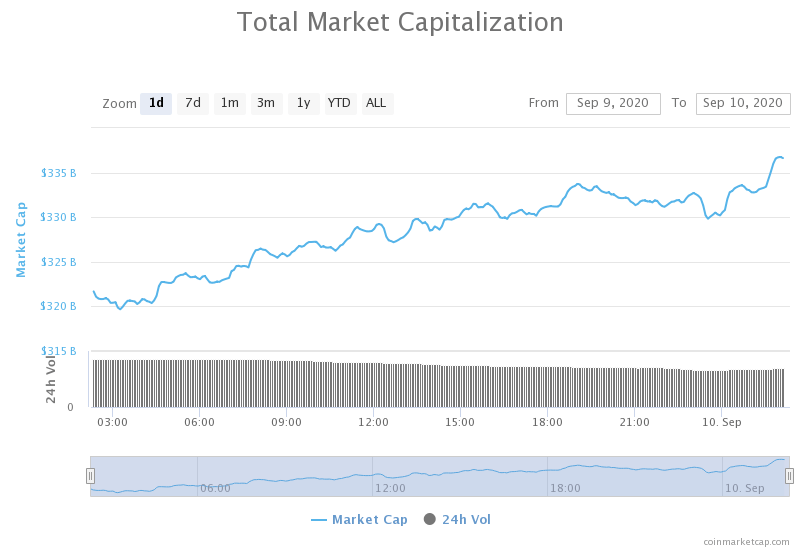
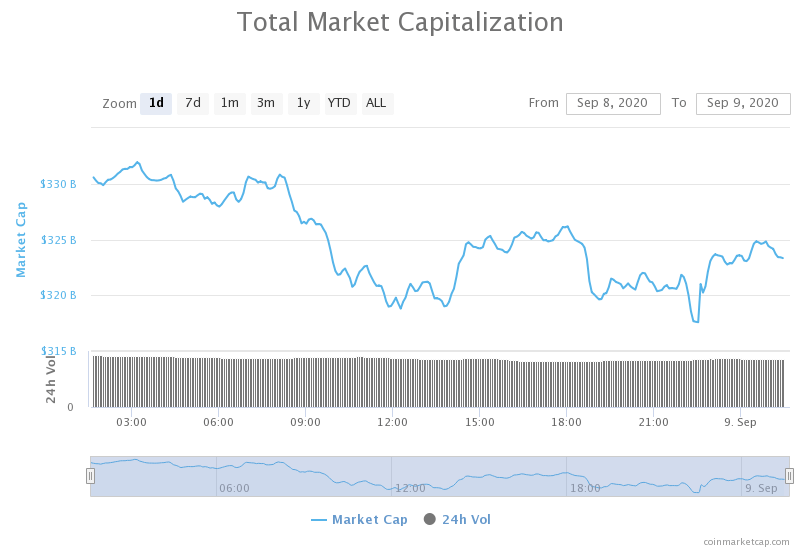
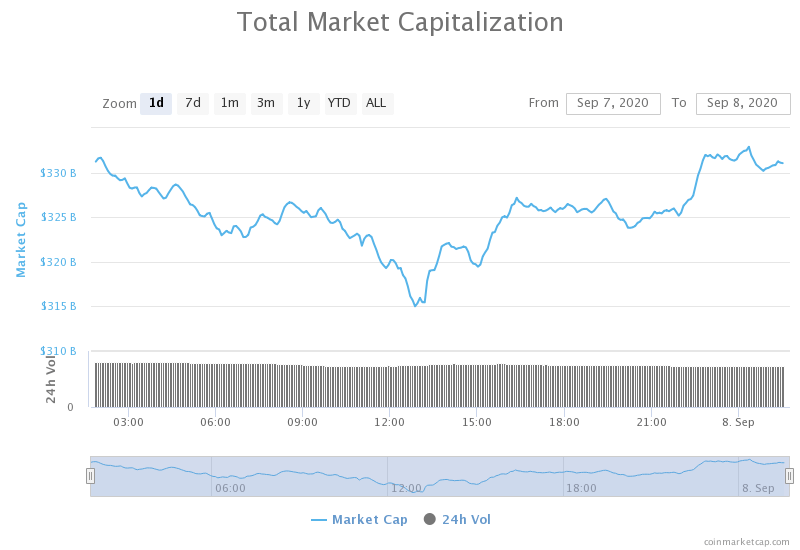
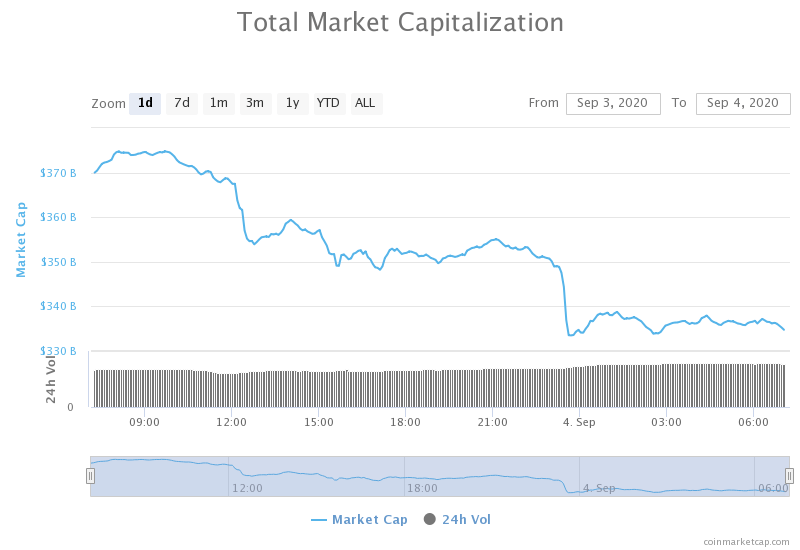
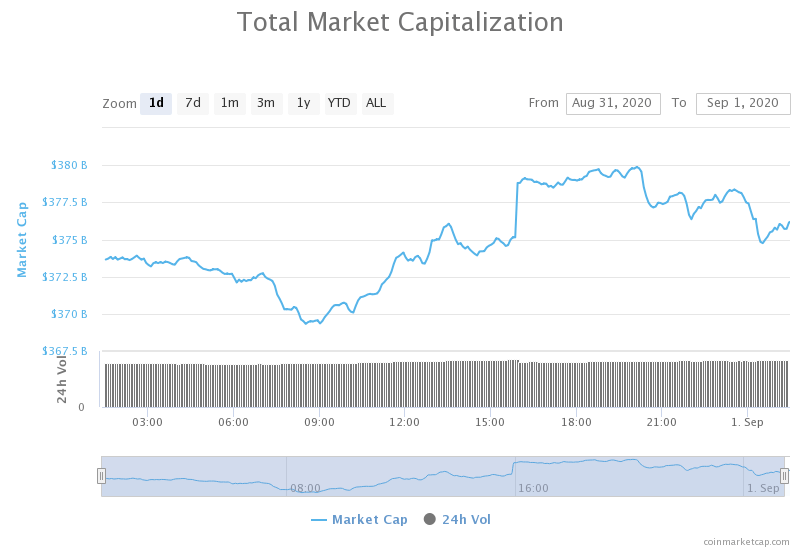
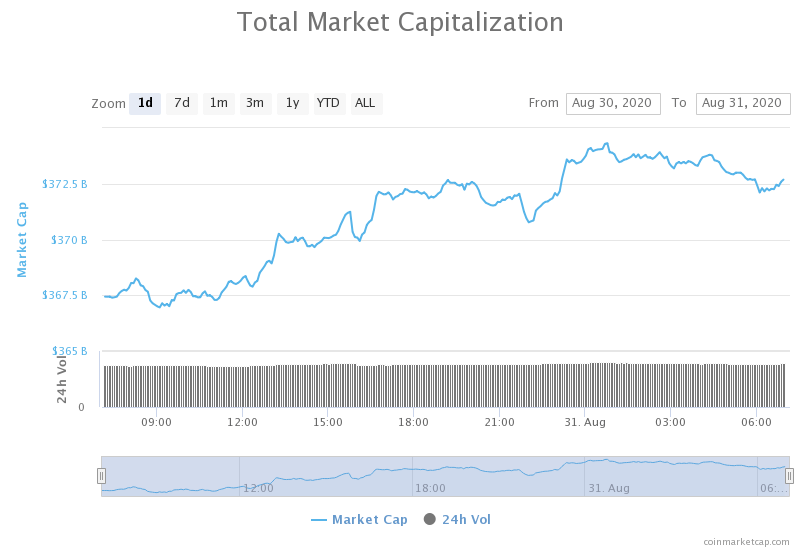
Daily Crypto Market Cap Chart
The crypto sector capitalization has lost value over the course of the past 24 hours. Its current value is $330.84 billion, which represents a decrease of $21.61 billion when compared to our previous report.
_______________________________________________________________________
What happened in the past 24 hours?
_______________________________________________________________________
- Craig Wright loses summary judgment bid in billion-dollar bitcoin case, which now heads to trial (The Block)
- US banks can hold reserve funds for stablecoin issuers, says federal regulator (The Block)
- SEC, OCC Issue First Regulatory Clarifications for Stablecoins (Coindesk)
- Yearn.finance (YFI) plunges to “do or die” support despite positive developments (Cryptoslate)
- Ethereum Classic is partnering with security firms to prevent further 51% attacks (Cryptoslate)
- DeFi darling Yam—after suffering a $750,000 bug—is back: what you need to know (Cryptoslate)
- Here’s how the Norwegian Government now indirectly holds over 570 Bitcoin (Cryptoslate)
- $165 Million Bitcoin Moved to Ethereum after Uniswap’s UNI Token Launch (Cryptobriefing)
- Bitcoin, Stocks and Gold Plummet as Markets Brace for US Presidential Election (Cryptobriefing)
- Brazilian fund manager and Nasdaq to launch world’s first Bitcoin ETF
_______________________________________________________________________
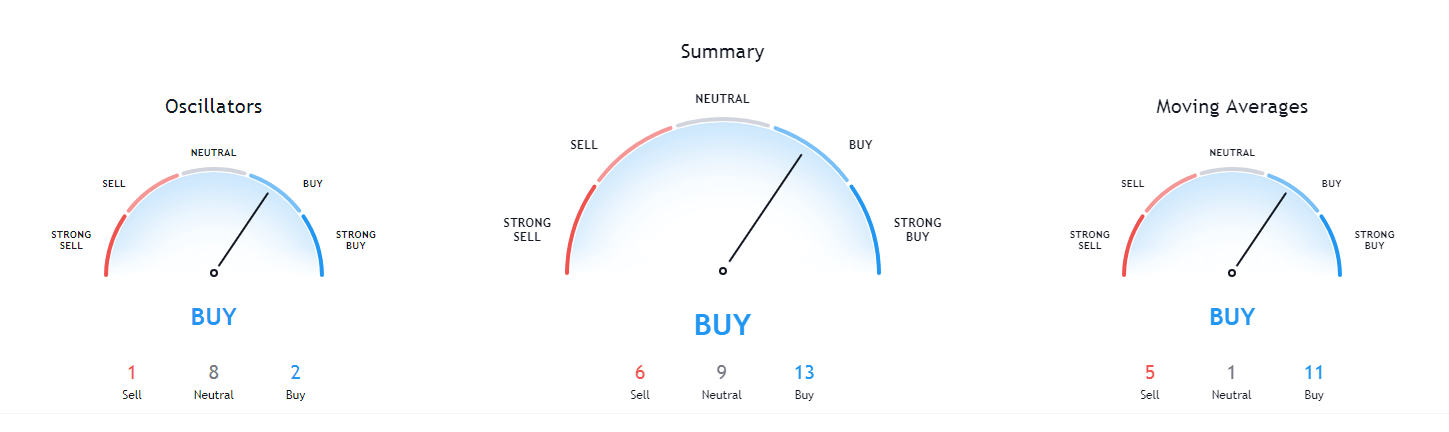
Technical analysis
_______________________________________________________________________
Bitcoin
Bitcoin has spent the day in a bearish pullback, which stopped at the 23.6% Fib retracement. However, its current position is just below that line, which makes it possible that it will continue its drop towards $9,300 to $9,500 levels. This push towards the downside was a bit premature, and most likely caused by the traditional market plummeting. Traditional markets have historically been slightly bearish before the presidential election, while they quickly recovered shortly after.
BTC/USD 4-hour Chart
If we take a look at the 4-hour time frame, the largest cryptocurrency by market cap has bounced off of the pink line after failing to break it, pushing further towards the downside, and ultimately breaking the 23.6% Fib retracement level. Bitcoin’s immediate position will be determined by whether it can break the 23.6% Fib retracement, but its overall short-term position is still bearish.
BTC/USD 4-hour Chart
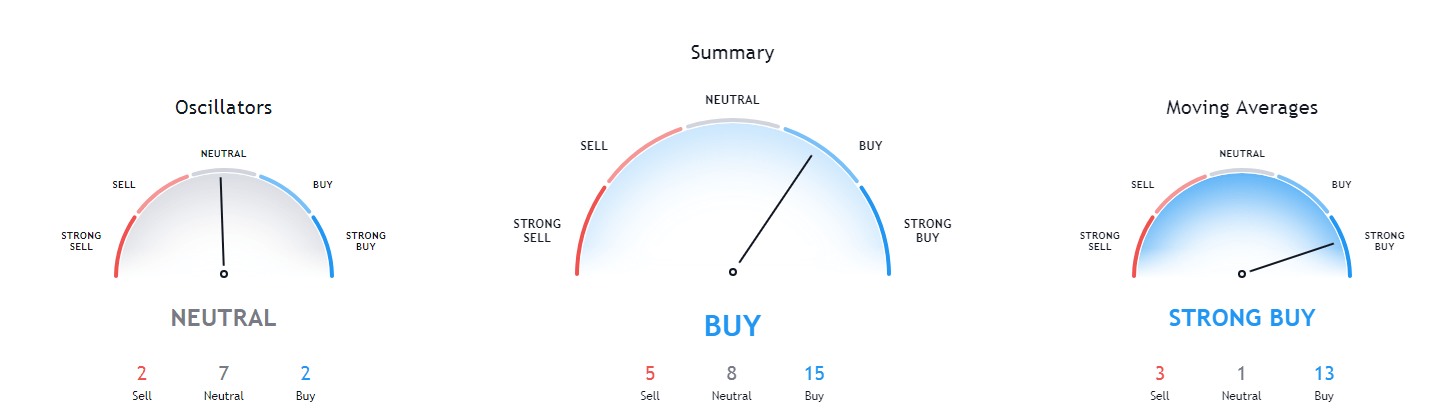
Bitcoin’s short-term technicals have turned bearish as BTC dropped in price. However, its longer-term technicals are still bullish. With that being said, we can expect Bitcoin to drop a bit further before turning towards the upside.
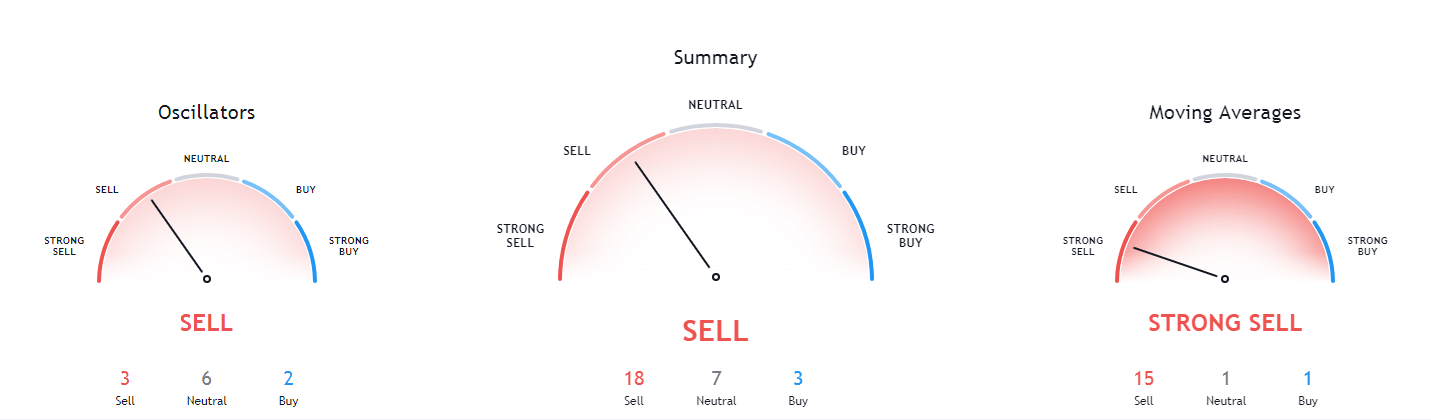
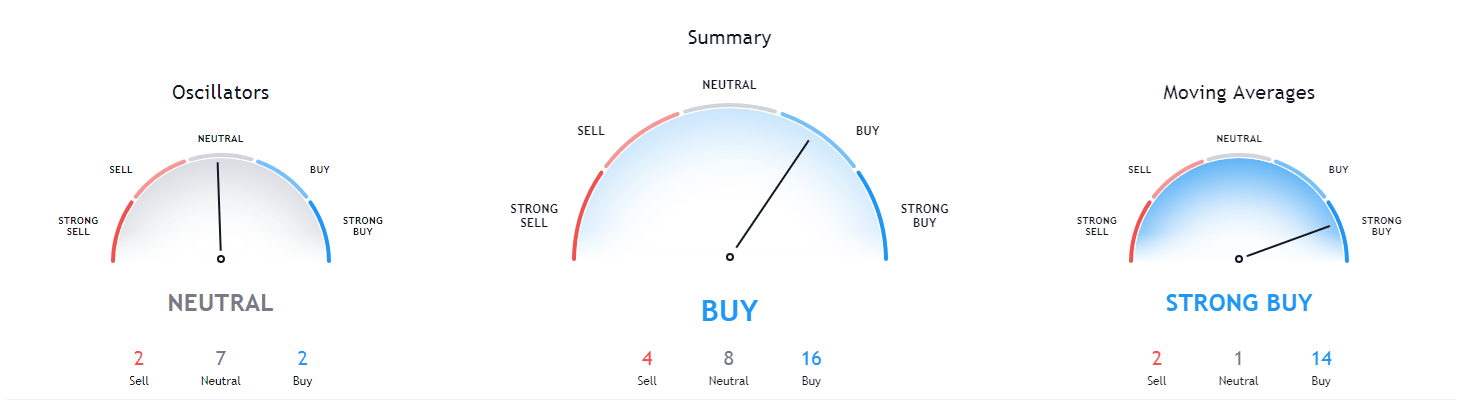
BTC/USD 4-hour Technicals
Technical factors (4-hour Chart):
- Price is far below its 50-period EMA and its 21-period EMA
- Price slightly above its bottom Bollinger band
- RSI is extremely close to being oversold (34.92)
- Volume is slowly descending from a massive spike
Key levels to the upside Key levels to the downside
1: $10,630 1: $10,500
2: $10,850 2: $10,015
3: $11,000 3: $9,880
Ethereum
While fundamental traders are calling for ETH’s price increase, most traders that take technical indicators into account are calling for a pullback towards $300. Etherum has lost over 7% of its value in the past 24 hours, with the move towards the downside ending at $340.
ETH/USD 4-hour Chart
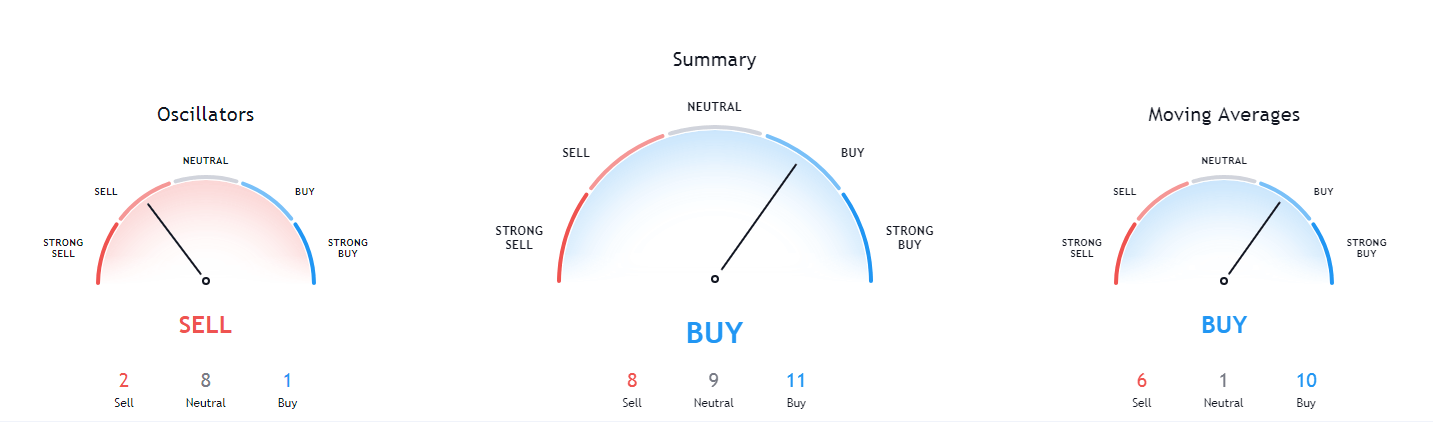
Ethereum’s short-term technicals are still extremely bearish, while its mid-term technicals are tilted towards the bear side just a bit. With that being said, we can expect Ethereum to push towards the $300 level, unless Bitcoin pulls out of its bearish sentiment and pushes the market upwards.
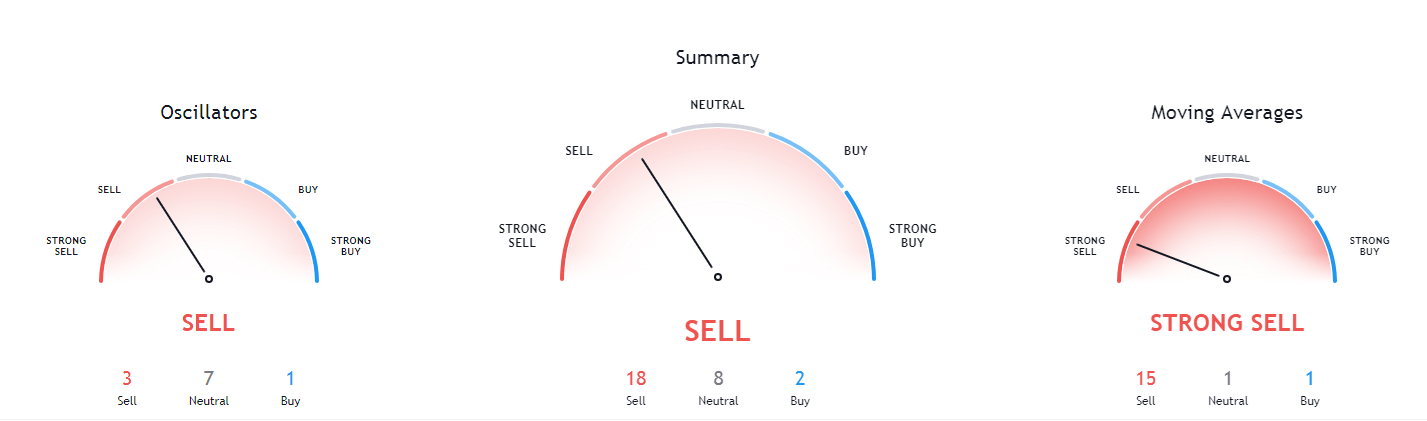
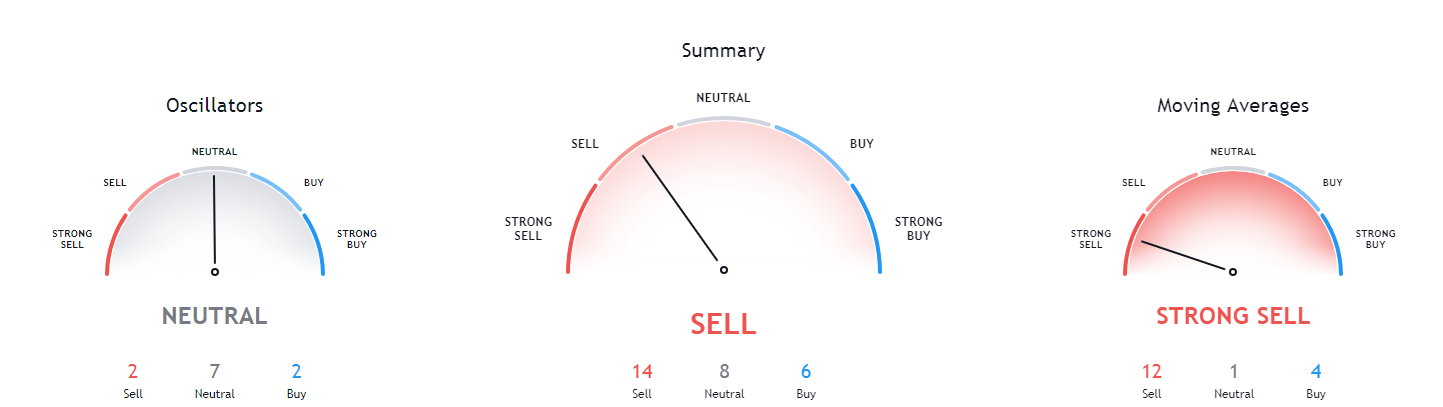
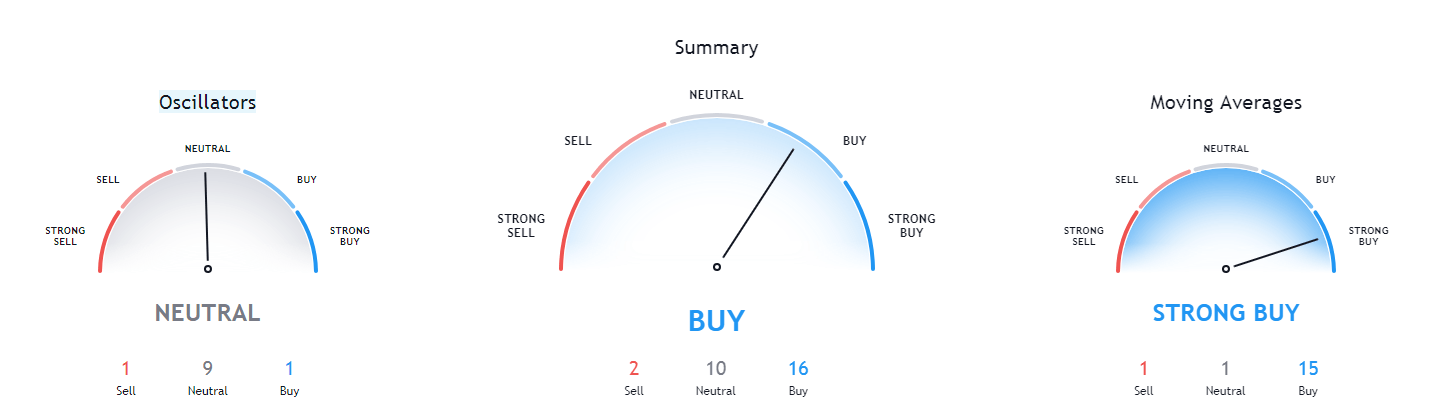
ETH/USD 4-hour Technicals
Technical Factors (4-hour Chart):
- The price is far below both its 21-period and its 50-period EMA
- The slightly above its bottom Bollinger band
- RSI is recovering from being oversold (32.42)
- Volume is descending from its spike during the downswing
Key levels to the upside Key levels to the downside
1: $360 1: $340
2: $371 2: $300
3: $400 3: $289
Ripple
XRP has spent the day (as almost every single cryptocurrency) pushing towards the downside. While the overall market move seemed premature and looked like it was pushed by the traditional markets, that may not be the case with XRP. If we take a look at the 4-hour chart, XRP’s 4th leg of the Elliot impulse wave has ended, which prompted the price to go towards the downside. Traders can most likely expect XRP’s price pushing towards $0.21.
XRP/USD 4-hour Chart
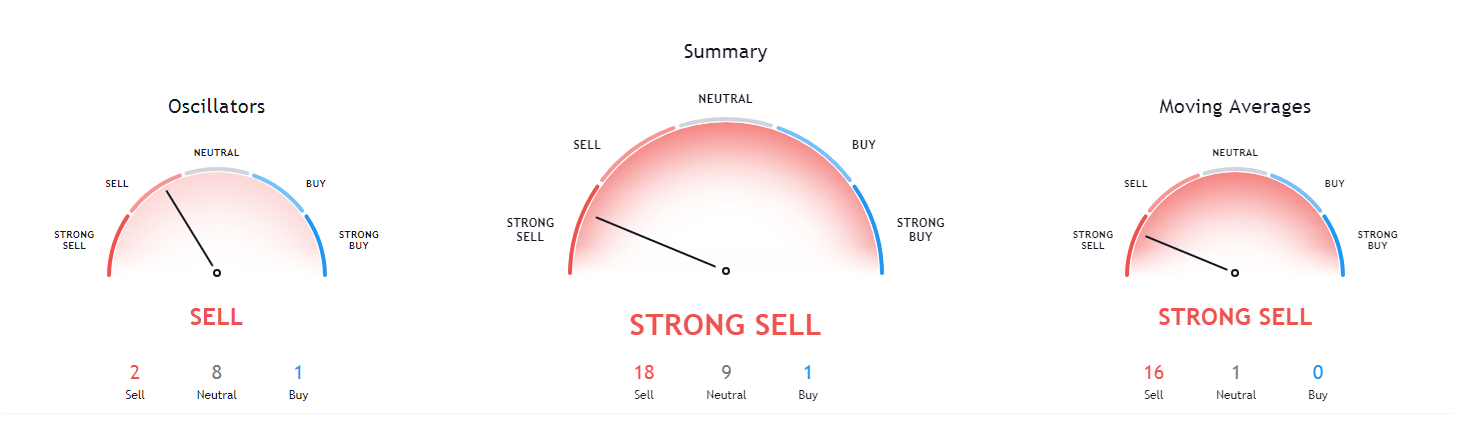
Taking a look at the technicals, XRP is showing bearish sentiment with both its short-term and long-term indicators. Its indicators change from just bearish to extremely bearish the longer we go in time, which implies an inherent bearishness when it comes to XRP.
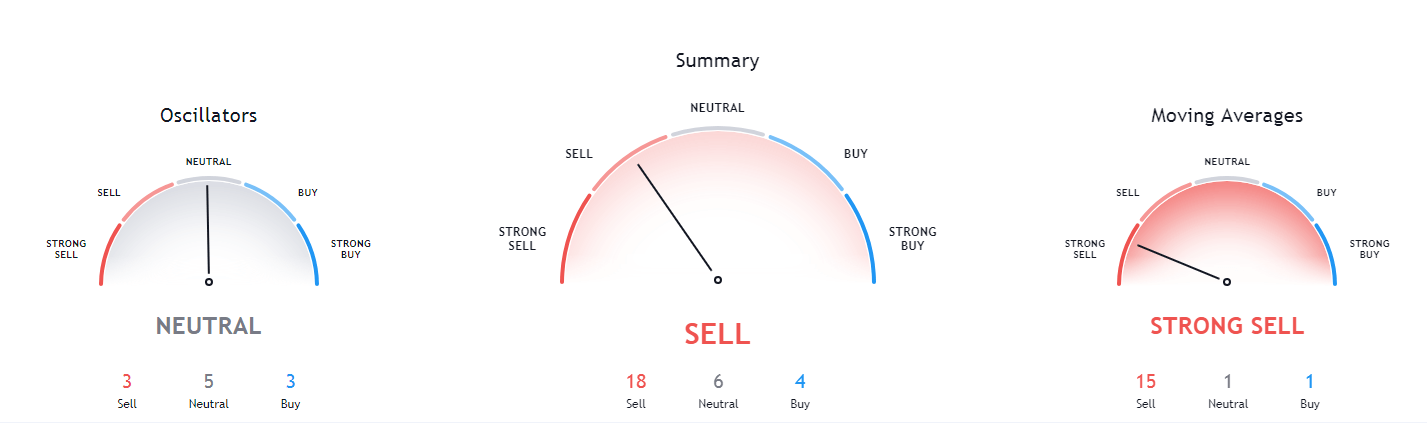
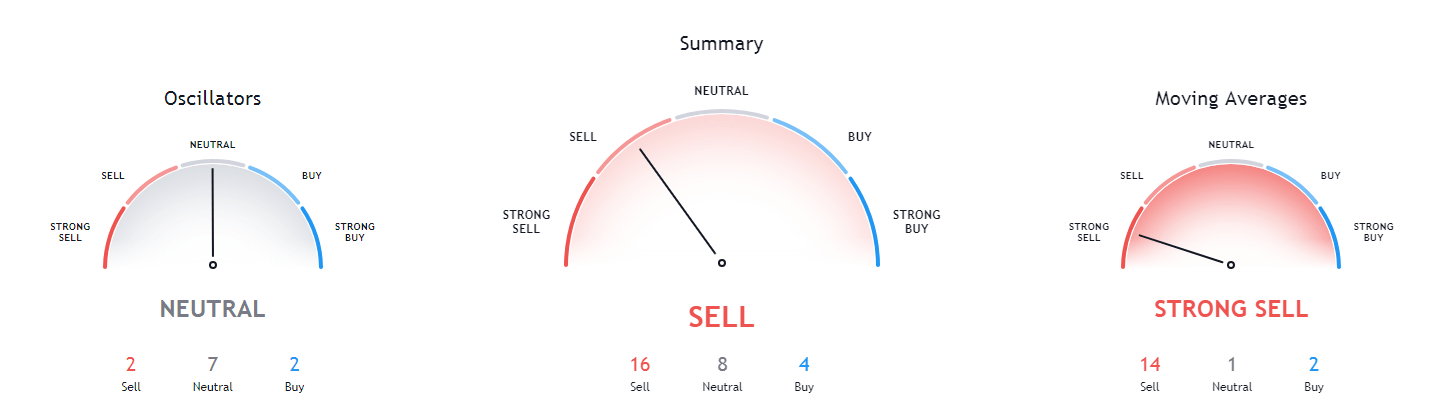
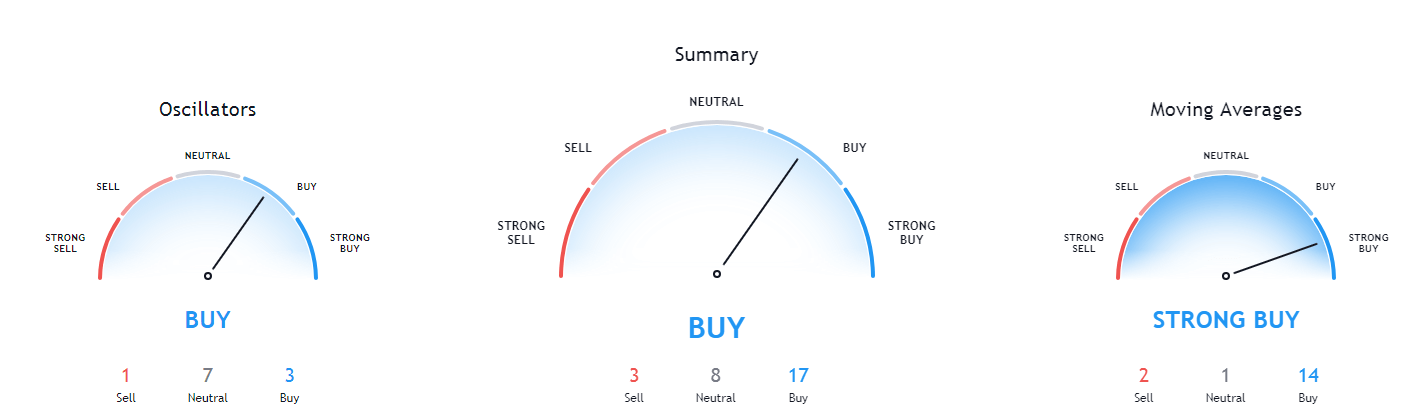
XRP/USD 4-hour Technicals
Technical factors (4-hour Chart):
- The price is well below both its 21-period EMA and its 50-period EMA
- Price is slightly above its bottom Bollinger band
- RSI is oversold but recovering (27.50)
- Volume is coming back to normal after a huge spike (low)
Key levels to the upside Key levels to the downside
1: $0.235 1: $0.227
2: $0.2454 2: $0.221
3: $0.266 3: $0.214


