While the top cryptocurrencies had quite a slow day, the DeFi market kept going up. Bitcoin is currently trading for $11,630, which represents a decrease of 0.38% on the day. Meanwhile, Ethereum gained 2.99% on the day, while XRP lost 0.59%.

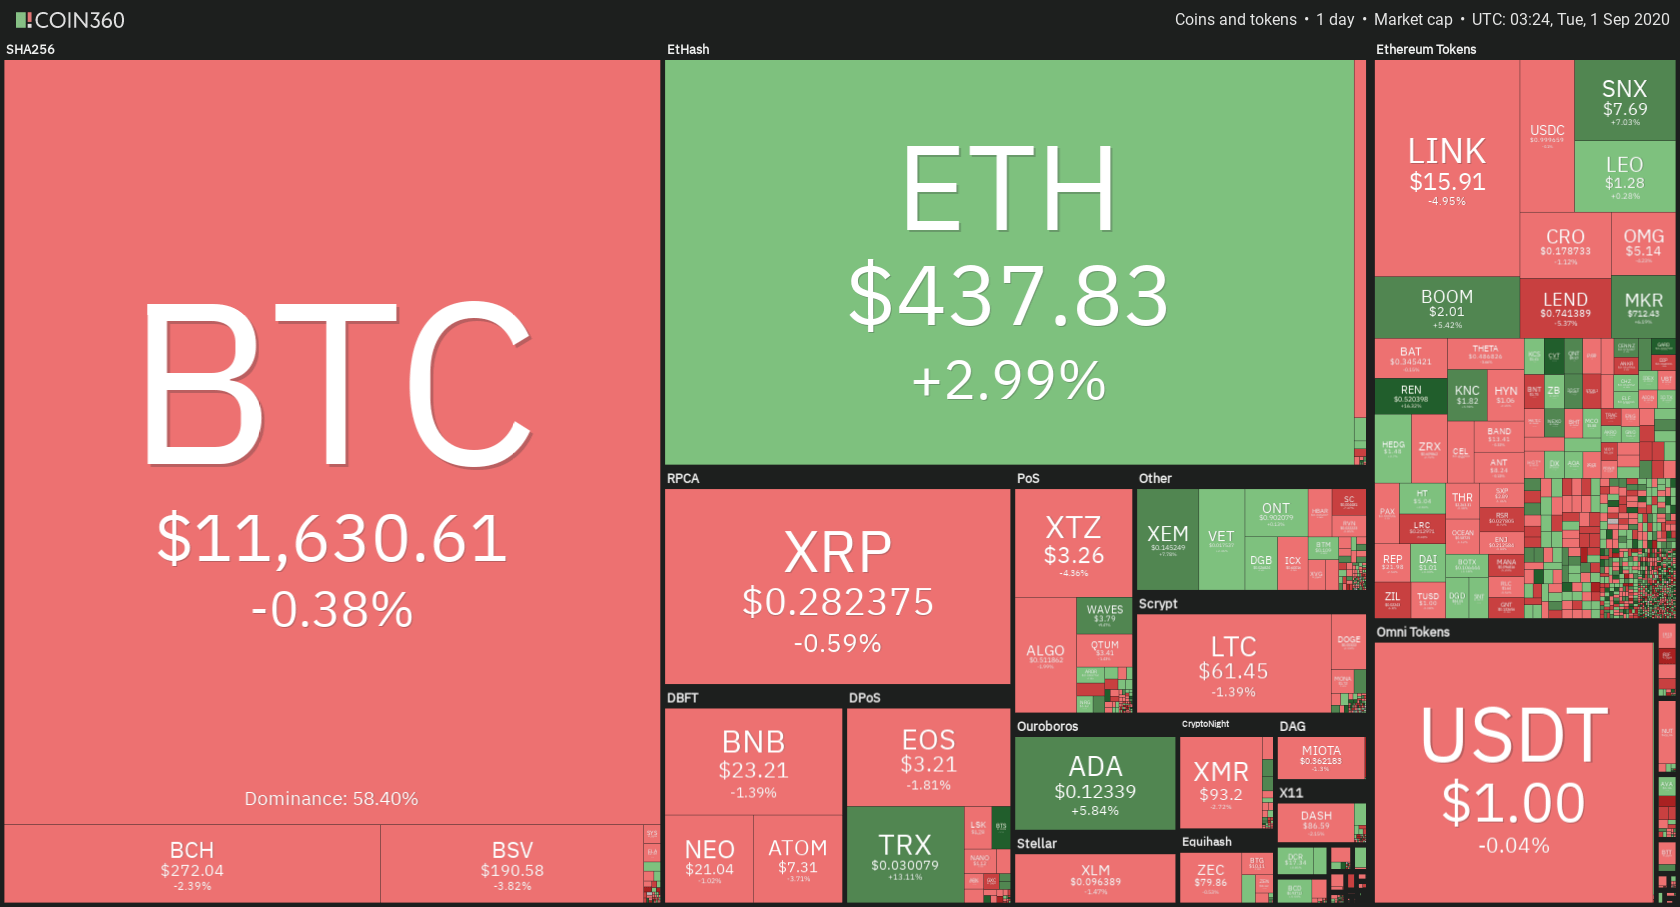
Daily Crypto Sector Heat Map
When taking a look at top100 cryptocurrencies, Sushi gained 110.98% on the day, making it the most prominent daily gainer. BitShares (72.48%) and Kusama (35.57%) also did great. On the other hand, DFI.Money lost 18.67%, making it the most prominent daily loser. It is followed by bZx Protocol’s loss of 13.96% and NXM’s drop of 9.34%.

Top 10 24-hour Performers (Click to enlarge)
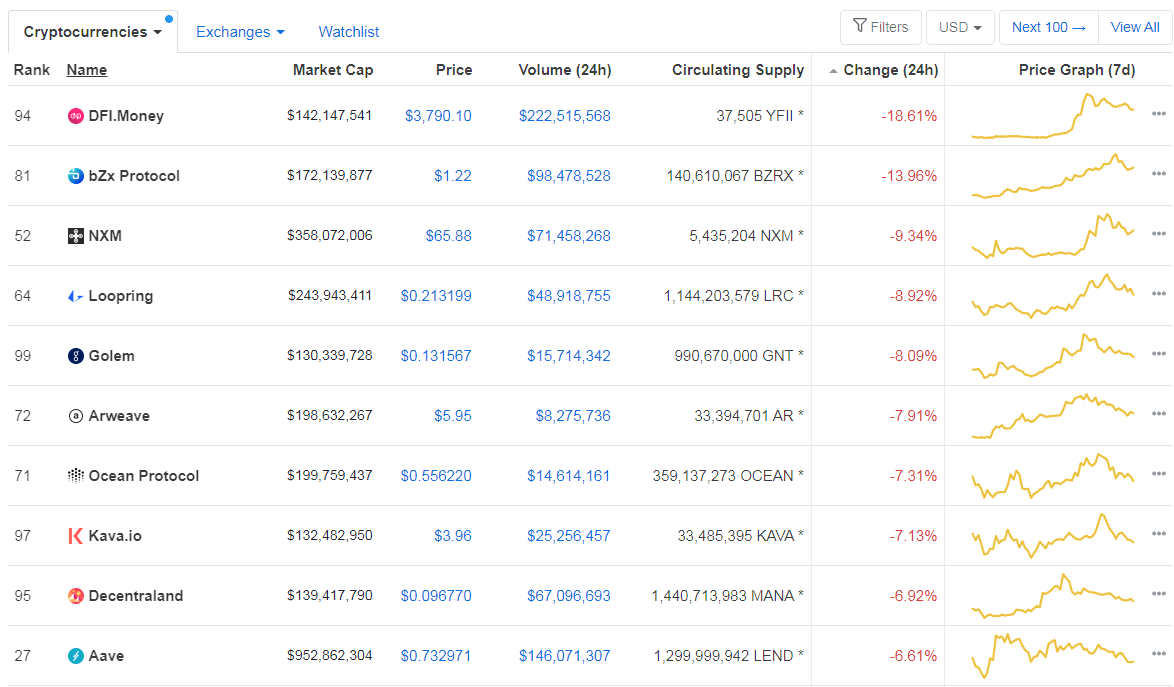
Bottom 10 24-hour Performers (Click to enlarge)
Bitcoin’s dominance level has gone down slightly, with its value is currently at 58.40%, represents a 0.84% difference to the downside when compared to our last report.

Daily Crypto Market Cap Chart
The crypto market cap has increased significantly over the course of the day. Its current value is $375.72 billion, which represents an increase of $3 billion when compared to our previous report.
_______________________________________________________________________
What happened in the past 24 hours?
_______________________________________________________________________
- Binance Card to soon expand to US as Swipe taps new partnership (Cointelegraph)
- Secret contracts may soon bring privacy features to public Blockchains (Cointelegraph)
- CoinMarketCap’s leadership team leaves — four months after Binance’s acquisition (The Block)
- Robinhood, Charles Schwab report platform issues during Monday’s morning session (The Block)
- Uniswap’s Daily Volume Just Overtook Coinbase by More than $80 Million (Cryptobriefing)
- Bitcoin Traders Grow Optimistic, Pundits Predict $500K BTC (Cryptobriefing)
- Only 400,000 or so addresses have used DeFi: sign of further growth to come (Cryptoslate)
- Ethereum DeFi giant Yearn.finance (YFI) is literally up 1,000,000% since its July launch (Cryptoslate)
- Huobi and OKEx Battle for Supremacy in China (Coindesk)
- Canaan’s Q2 Loss Narrows to $2.4M From Q1 on 160% Revenue Increase (Coindesk)
_______________________________________________________________________
Technical analysis
_______________________________________________________________________
Bitcoin
After a weekend of steady gains, Bitcoin spent the day trying to establish its presence above the newly-conquered $11,630 level. While the fight is still in progress, it seems that the largest cryptocurrency by market cap will stay above the level, thus turning it into support.
Traders should take a look at how Bitcoin handles its next resistance, which is at around $11,820.
BTC/USD 4-hour Chart
Technical factors:
- Price is above its 50-period EMA and 21-period EMA
- Price is above its middle band
- RSI is neutral but leaning towards overbought (57.26)
- Volume is low
Key levels to the upside Key levels to the downside
1: $11,630 1: $11,460
2: $12,015 2: $11,090
3: $12,330 3: $10,855
Ethereum
Unlike Bitcoin, Ethereum has had a great day. The second-largest cryptocurrency by market cap continued its rush towards the upside, fueled by the expansion of DeFi. The move towards the upside rekindled after ETH confirming its position above $415 and stopped (for now) at its next resistance level, which is sitting at $445. While Ethereum has a chance of breaking this level as well, it is unlikely that it will stay above it as the volume seems to be fading, while its RSI is in the overbought territory.
Ethereum traders should look for ETH’s pullback after the bullish move ends.
ETH/USD 4-hour Chart
Technical Factors:
- Price is currently above its 21-period and 50-period EMA
- Price is just below the upper band
- RSI is in the overbought territory (74.23)
- Volume is descending
Key levels to the upside Key levels to the downside
1: $445 1: $415
2: $496 2: $400
3: $360
Ripple
XRP’s move towards the upside ended abruptly as the third-largest cryptocurrency by market cap failed to break the $0.285 resistance level. While it is still very close to it, XRP shows no signs of breaking the resistance any time soon, unless it gets external help in the form of BTC pushing the price of the whole crypto market.
On the other hand, XRP doesn’t show any signs of going down anytime soon, so we can expect some range-bound trading in the near future.
Traders should look for an opportunity within the range XRP is currently in.
XRP/USD 4-hour Chart
Technical factors:
- The price is above its 21-period and 50-period EMA
- Price is slightly above its middle band
- RSI is stable and neutral (58.98)
- Volume is low and relatively stable
Key levels to the upside Key levels to the downside
1: $0.285 1: $0.266
2: $0.31 2: $0.2454
3: $0.32 3:$0.235
Related posts
 Daily Crypto Review, Sept 14 – The EU Regulating Stablecoins; Crypto Market Preparing For a Move
 Daily Crypto Review, Sept 25 – ETH Options Traders Like Trading Below $360; Crypto Market In the Green
 Daily Crypto Review, Oct 13 – G7 Will Continue to Oppose Libra; Bitcoin Consolidating After Another Bull Run
 Daily Crypto Review, Oct 15 – JP Morgan Says Bitcoin is Overvalued; XRP Crashes As it Breaks Major Support
One reply on “Daily Crypto Review, Sept 1 – Binance Crypto Card Expanding To The US; YFI Token Up 1,000,000% Since July”
Cards expanding to the US is a big step