Introduction
Investors and traders are continuously trying to determine which country is growing relatively faster to make currency investment decisions. Assessing growth for capitalist economies that use inflation as fuel can be tricky to understand. The differentiation between nominal and real growth, effects of inflation, and the role of a deflator are necessary to understand to arrive at correct conclusions from statistics.
What is GDP Deflator?
Most of the economies that we have today are capitalist economies and use inflation as the primary fuel for growth. Currency traders want to go “long” on currencies of countries that are experiencing relatively higher growth than other countries. Hence, a correct assessment of growth is crucial.
The broadest and most widely used measure of the growth of economies is the Gross Domestic Product (GDP). The GDP is the monetary measure of all goods and services produced within a country for a given period (quarter or year). Although, before GDP, Gross National Product (GNP) was widely used to compare growth amongst economies. GNP measures growth beyond borders and has certain limitations in its usage as a growth measure.
GDP Deflator
It is also known as GDP Price Deflator or Implicit price deflator. It measures the price changes in all goods and services produced within an economy. It measures inflation at the macroeconomic (or national) level. As prices of commodities increase over time, the GDP values are “inflated” over time.
For instance, a country that has a GDP of 10 million dollars for the year 2019 and 12 million dollars for the year 2020 would appear to have grown 20%. If the inflation rate for the duration was 10%, meaning the prices rose by 10% for all the commodities, then 1 million dollars out of 12 million dollars came purely through increased prices and not increased production. Hence, in 2020, the real GDP was only 11 million dollars. Therefore, real growth was only 10% instead of 20%.
The Nominal and Real GDP figures are vital to understand and measure the level of inflation by calculating the GDP deflator. The following formula gives the GDP deflator:
Here, the nominal GDP is the total dollar value of all commodities produced in an economy without accounting for inflation. It is a direct monetary measure of goods and services. Real GDP is the inflation-adjusted value of GDP. It strips away the effect of inflation from Nominal GDP to show real growth.
Deflators like the Real GDP also have a base year against which all other years’ figures are compared. For the United States, 2012 is the base year, meaning GDP deflator value for the year 2012 would be 100 (as nominal and real GDP would be equal due to zero inflation). Subsequent years will have higher or lower values accordingly to indicate inflation and deflation, respectively. The base year varies from country to country.
How can the GDP Deflator numbers be used for analysis?
It is essential to understand how inflation masks the real growth and leads us to make the wrong conclusions. As seen in the above example, countries may show higher and higher GDP figures, but in reality, they may have only achieved little or no growth at all. When comparing growth over several years, the GDP deflator is key to the analysis to strip away the effects of inflation. By employing the equation above, if we get a deflator score of say 110, it would indicate there is a 10 percent inflation during the observed period.
The Consumer Price Index (CPI) is the most popular and widely used indicator to measure inflation. The GDP deflator has some advantages over the CPI. As the CPI measures inflation for a fixed basket of goods and services, which does not change frequently, the GDP is a macroeconomic aggregate measure of inflation. The GDP deflator factors in any change in economic output and investment patterns. Any new change in the goods produced or change in the consumption patterns of people is accounted in by the GDP deflator, unlike CPI. The CPI basket is static and cannot account for commodities price changes that are not in the basket, whereas the deflator is all-inclusive in this regard.
It is also necessary to know that CPI includes the most commonly used goods and services that have an impact on the economy. It updates its basket as patterns change over the years. Hence, over time the GDP deflator and the CPI have similar trends and can be used interchangeably.
Impact on Currency
The GDP deflator is a basic measure of inflation that erodes currency value. It is an inversely proportional lagging indicator. High values of the deflator are bad for the currency value and vice-versa. Since it is one of the measures of inflation, it is a low-impact lagging indicator as it is not as popular and as frequent as the CPI. It is a quarterly statistic, whose effects are already priced in through more frequent inflation measuring statistics.
Economic Reports
The Bureau of EA releases quarterly reports of the GDP price deflator alongside the quarterly GDP figures on its official website for the United States. GDP and deflators are essential macroeconomic indicators, and therefore are available on the World Bank and many other international organizations like the OECD, IMF, etc.
Sources of GDP Deflator
The BEA releases its quarterly GDP deflator statistics on its official website for the public.
The World Bank also maintains GDP and GDP deflator statistics for most countries on its official website.
Deflator figures for most countries can be easily found on the Trading Economics website.
How GDP Deflator Data Release Affects The Price Charts
In the US, the GDP deflator is released by the Bureau of Economic Analysis quarterly, about 30 days after the quarter ends. It measures the annualized change in the price of all goods and services included in gross domestic product; and is the broadest inflationary indicator. The most recent data was released on July 30, 2020, at 8.30 AM ET can be accessed at Investing.com here. An in-depth review of the GDP deflator data release can be accessed at the Bureau of Economic Analysis website.
The screengrab below is of the GDP deflator from Investing.com. On the right, a legend indicates the level of impact the fundamental indicator has on the USD.
As can be seen, GDP deflator data is expected to have a medium impact on the USD after its release.
The screenshot below shows the most recent changes in the GDP deflator in the US. The GDP deflator changed by -2.1%, worse than analysts’ expectations of a 1.1% change. This change is expected to the negative for the USD.
Now, let’s see how this release made an impact on the Forex price charts.
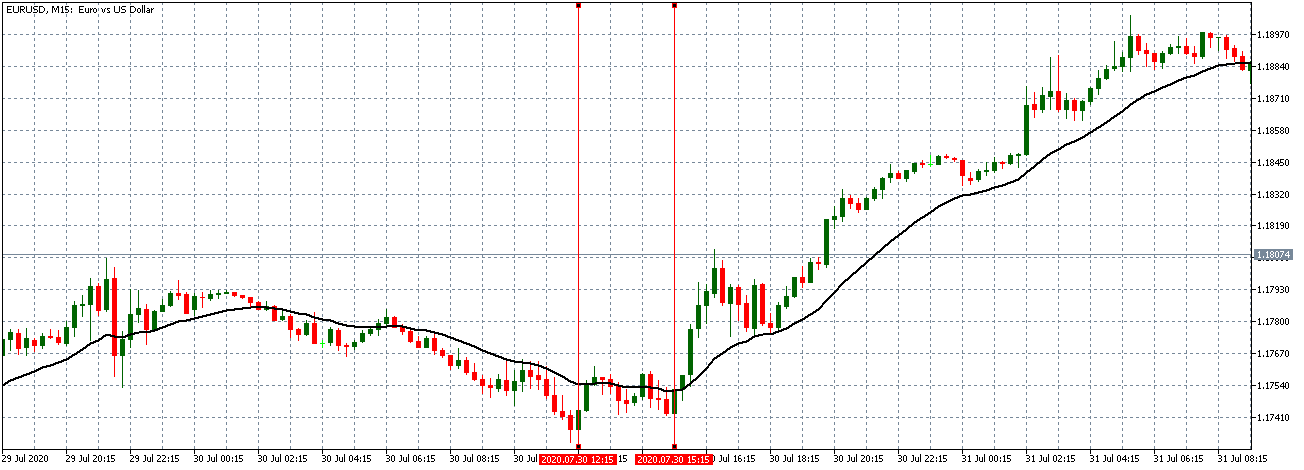
EUR/USD: Before the GDP Deflator Data Release on July 30,
2020, Just Before 8.30 AM ET
Before the news release, the EUR/USD pair traded in a neutral pattern. This trend is evidenced by the 15-minute candles forming on an already flattened 20-period Moving Average, as shown in the above chart.
EUR/USD: After the GDP Deflator Data Release on July 30,
2020, at 8.30 AM ET
After the data release, the pair formed a 15-minute “hammer” candle. This trend is as expected since the USD weakened against the EUR. The data release was significant enough to cause a change in the market trend. The market adopted a steady bullish stance as the pair traded in an uptrend with the 20-period Moving Average steeply rising.
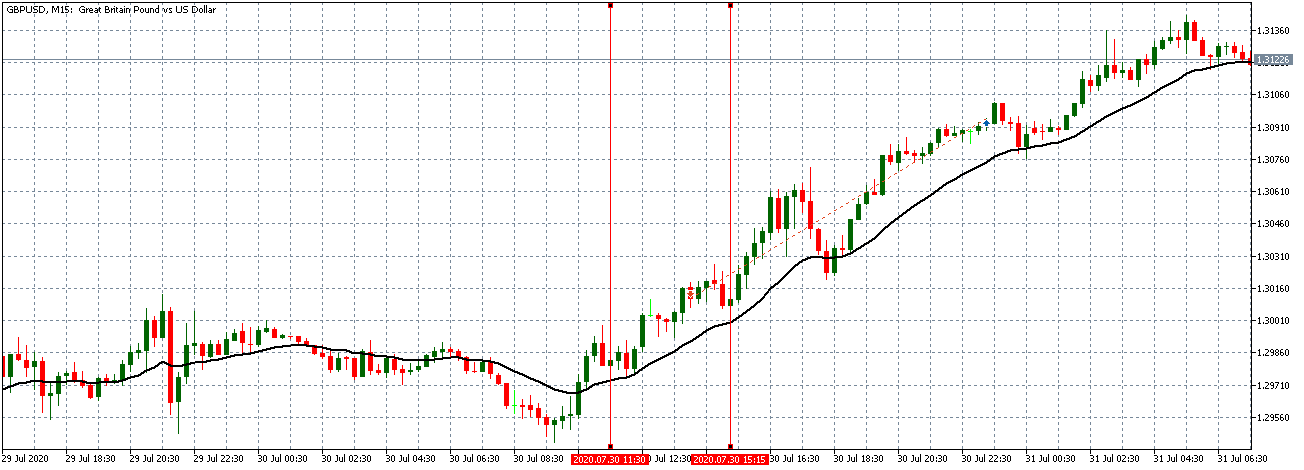
GBP/USD: Before the GDP Deflator Data Release on July 30,
2020, Just Before 8.30 AM ET
Unlike the EUR/USD pair, the GBP/USD pair was trading in a steady uptrend before the data release.
GBP/USD: After the GDP Deflator Data Release on July 30,
2020, at 8.30 AM ET
After the data release, the pair formed a bullish 15-minute candle. It subsequently traded in a renewed uptrend with the 20-period Moving Average steeply rising similar to the EUR/USD pair.
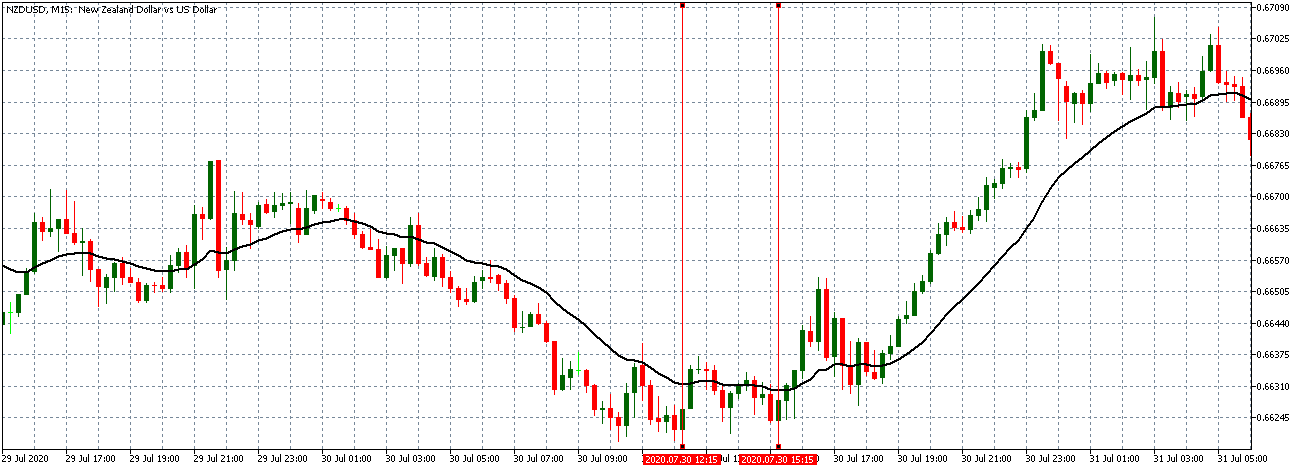
NZD/USD: Before the GDP Deflator Data Release on July 30,
2020, Just Before 8.30 AM ET
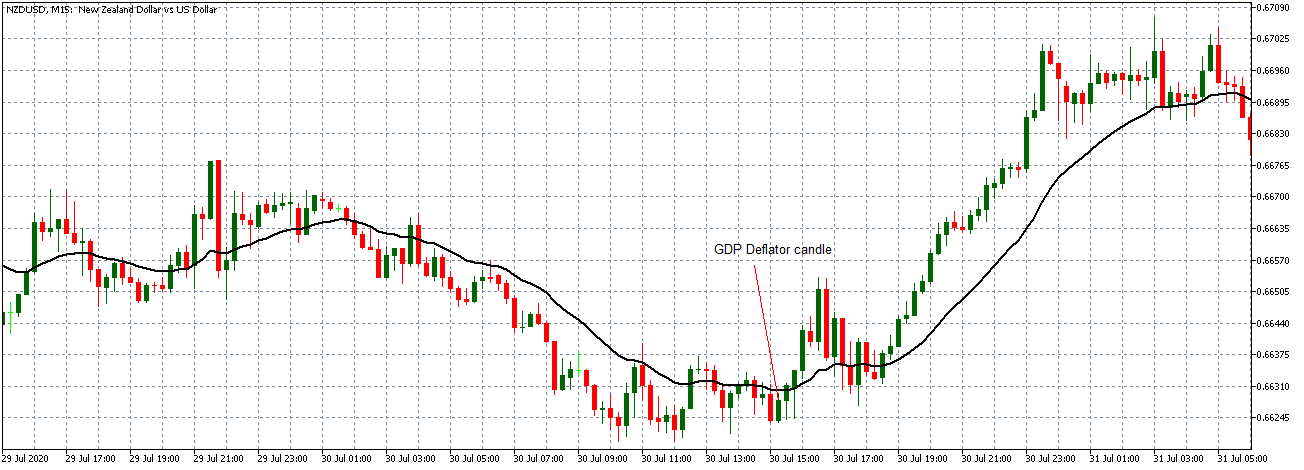
NZD/USD: After the GDP Deflator Data Release on July 30,
2020, at 8.30 AM ET
The NZD/USD pair was trading in a similar neutral pattern as the EUR/USD pair before the data release. Similar to the EUR/USD and the GBP/USD pairs, the NZD/USD pair formed a 15-minute bullish candle after the data release. Subsequently, the pair adopted an uptrend with the 20-period Moving Average steadily rising.
Bottom Line
As observed in this analysis, the GDP deflator has a strong impact on the price action, enough to alter the prevailing market trend upon its release. Forex traders should avoid having any significant open positions before the GDP deflator data release to avoid being caught on the wrong side of the news release.


