Introduction
One of the most significant uncertainties for policymakers is the future economic performance. All the policies adopted by governments and central banks are geared towards influencing the future’s economic performance. Economists, financial analysts, and forex traders alike use models and economic indicators to predict future economic performance. The commitment of traders (COT) report gives some insight into future economic performance.
Understanding the Commitments of Traders Report
In the US, the COT report is published by the Commodities Futures Trading Commission (CFTC). The COT report shows participation in the future market.
The COT report is comprised of four different types of reports. They are:
Legacy reports: This report breaks down the open interest positions of commercial, noncommercial, and retail traders into long, short, and spread positions. The report shows the total interest positions that are open along with the changes from the previous reporting period. This report is broken down into the long and short versions of ‘Futures Only’ and ‘Futures-and-Options-Combined’ segments. The Legacy COT report shows the open interests for 17 exchanges.
Supplemental reports: This report document contracts 13 agricultural commodities. These contracts are of both futures and options positions for noncommercial, commercial, and index traders together with nonreportable positions.
Disaggregated reports: This report covers the following five sectors; agriculture, petroleum, and its products, natural gas and its products, electricity, and metal. This report’s market participants are categorized into; producers, swap dealers, managed money, and ‘Others.’
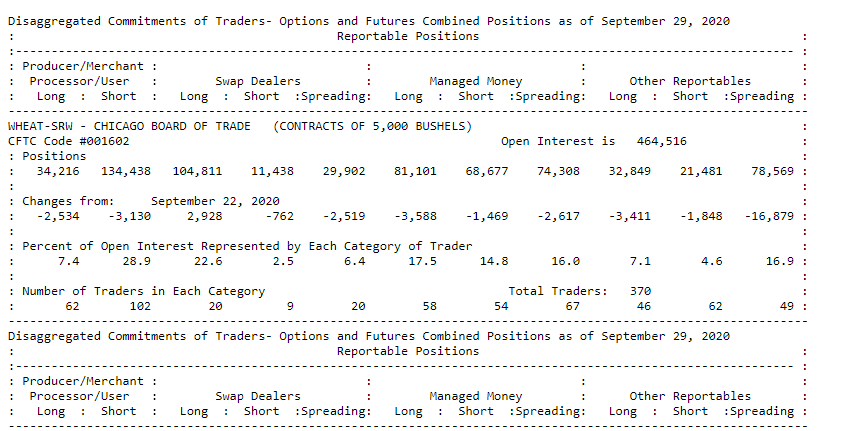
Producers are entities whose core business activities involve the production, processing, and handling of physical commodities. These producers use the futures market to manage or hedge against risks potential to their core operations.
Swap dealer is one who enters into an agreement to exchange cash flows of a given commodity over a specific period. They use the futures market to manage and hedge against risks inherent in their swaps.
Money manager, as used in this report, means a registered commodity pool operator, an unregistered fund, or a registered commodity trading advisor identified by CFTC. They participate in the futures markets on behalf of their clients.
Others represent all other participants in the futures markets who cannot be placed in the above categories.
Traders in Financial Futures (TFF) report: This report shows the participants in the futures market for currencies, stocks, US Treasury securities, VIX, and Bloomberg commodity index. It categorizes market participants into; dealers, asset managers, leveraged funds, and others.
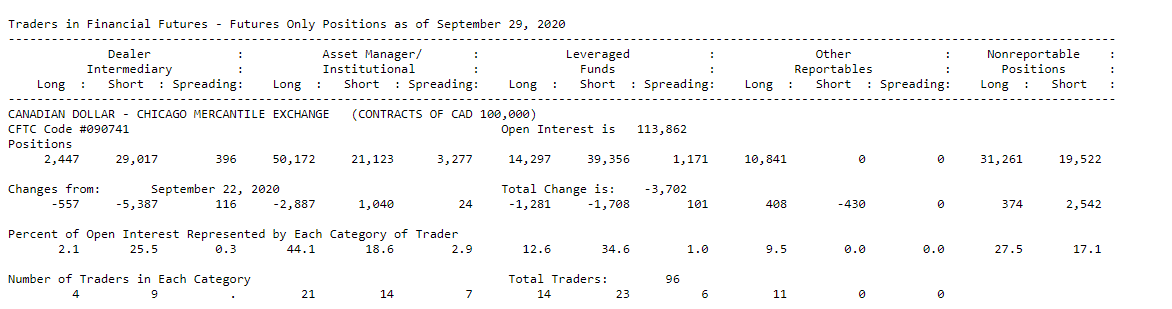
Dealer/ Intermediary is a participant on the ‘sell-side’ of a trade. Although they do not exclusively participate in the futures market, they have matched books meant to offset their risks. They are made up of large banks.
An asset manager is an institutional investor such as pension funds and insurance companies whose clients are predominantly institutional.
Leveraged funds hedge funds, registered commodity pool operator, an unregistered fund, or registered commodity trading advisors. Their activities in the futures market involve arbitrage across and within markets and taking outright positions.
Others include all reportable traders who cannot be placed in the above categories.
Using the Commitments of Traders (COT) Report in analysis
The COT report can be used to show whether investors are going long or short in the futures market. The CFTC collects the data used in making the COT report from reporting firms such as Futures Commission Merchants, foreign brokers, exchanges, and clearing members. Individual traders can also self-report by filling out the CFTC Form 40.
The COT report shows the open interests in the futures and options market as of Tuesday of each week. Since the COT report also shows the changes in the open positions, it can be used to show the sentiment about the economy over time. It is worth noting that the market positioning of the commercial traders and the noncommercial (speculative) traders is always the opposite of each other.
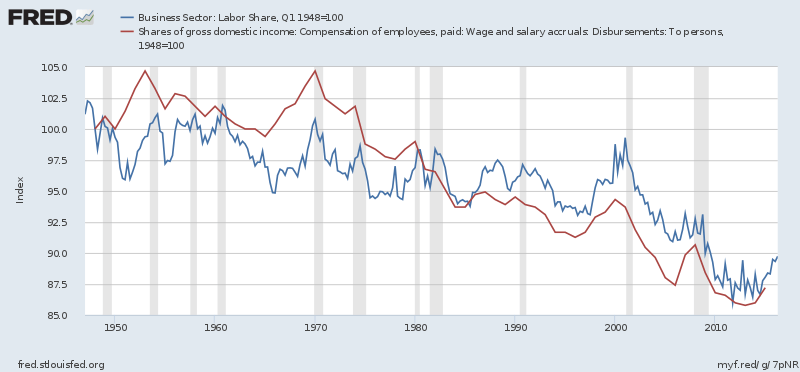
Commercial traders handle physical commodities. For them, it is natural to expect that the future price of their commodities will rise. In the futures and options market, commercial traders are hedging against risk; thus, they go short just in case prices fall. The noncommercial traders do not handle the underlying physical commodities, and thus, they are participating in the futures market speculatively and can either be long or short. Therefore, by looking at the behavior of noncommercial traders in the futures markets, we can gain insight into future price trends and the economy.
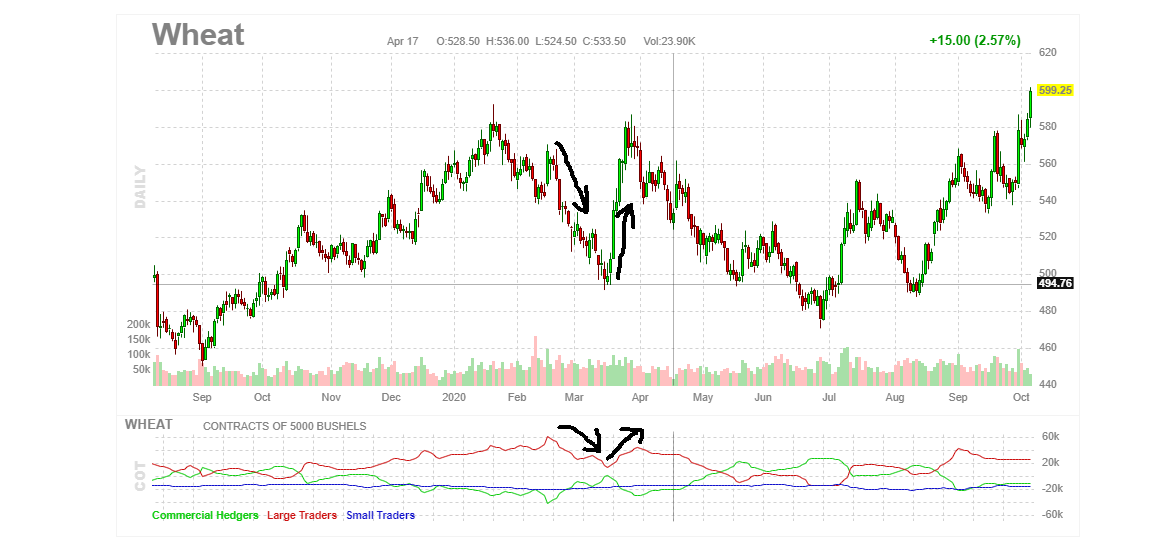
Take the above example of wheat futures, when the noncommercial traders are net short positioned in the futures market, the prices of wheat falls. Consequently, the wheat farmers and traders receive lesser pay for their products. In this case, their purchasing power is lowered, which decreases the aggregate demand in the general economy.
Impact on Currency
Forex traders pay close attention to the noncommercial traders in the financial futures. These speculative buyers tend to lead the market. When they are net long in a particular currency, it means that the demand for that currency will increase and, with it, its value relative to others. For most forex traders, the best way to trade forex using the COT report is by establishing the overbought and the oversold regions. These are the regions where trend reversal is imminent – when the noncommercial traders are at the lowest point could indicate a period of sustained short selling, and a reversal could follow.
The COT report can also be used to show a trend. For example, let’s take an instance where noncommercial traders are continuously net long on a particular currency in the futures market while the price for that currency steadily increases. With this strategy, forex traders can use noncommercial traders’ market positioning as confirmation of a trend.
Sources of Data
The US CFTC publishes the COT report.
How the publication of the COT Report Affects Forex Price Charts
The latest publication of the COT report was on October 2, 2020, at 3.30 PM ET. The release of this publication can be accessed at Investing.com.
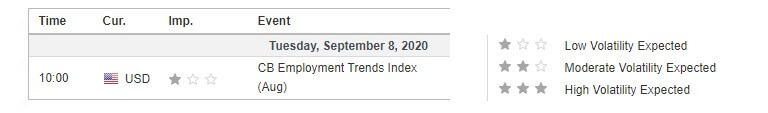
The screengrab below is of the weekly CFTC speculative net positions of the AUD from Investing.com. To the right is a legend that indicates the level of impact the fundamental indicator has on the AUD.
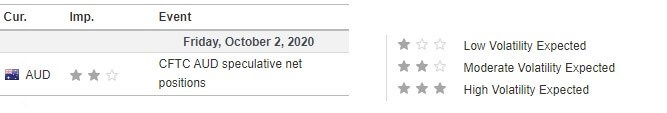
As can be seen, moderate volatility is to be expected.
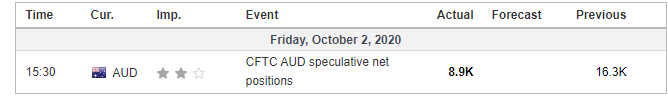
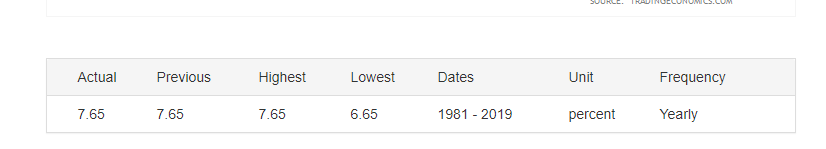
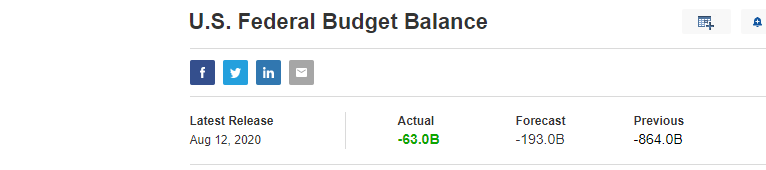
As of Tuesday, September 29, 2020, the AUD’s speculative net positions was 8.9K compared to the previous Tuesday’s of 16.3K. Noncommercial traders are net-long in the AUD futures, which should be positive for the AUD.
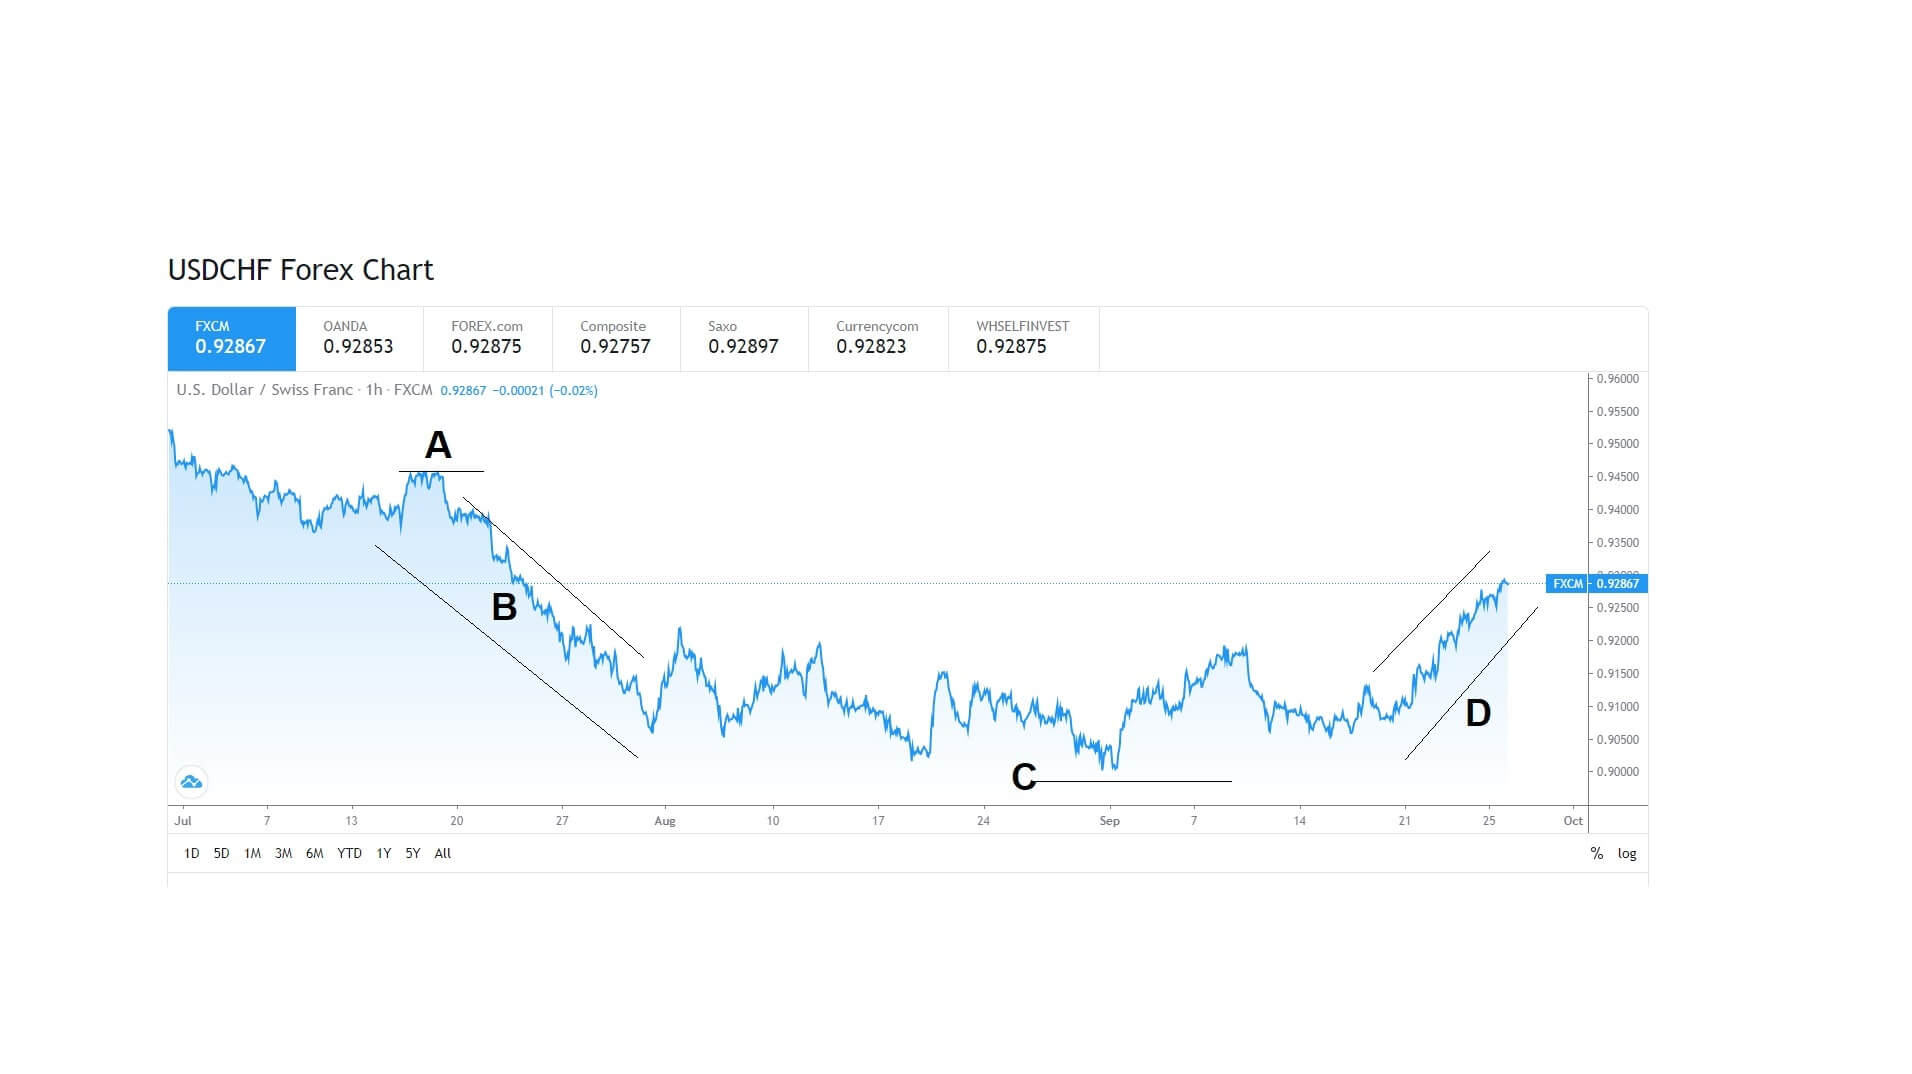
Now, let’s see how this release made an impact on the Forex price charts.
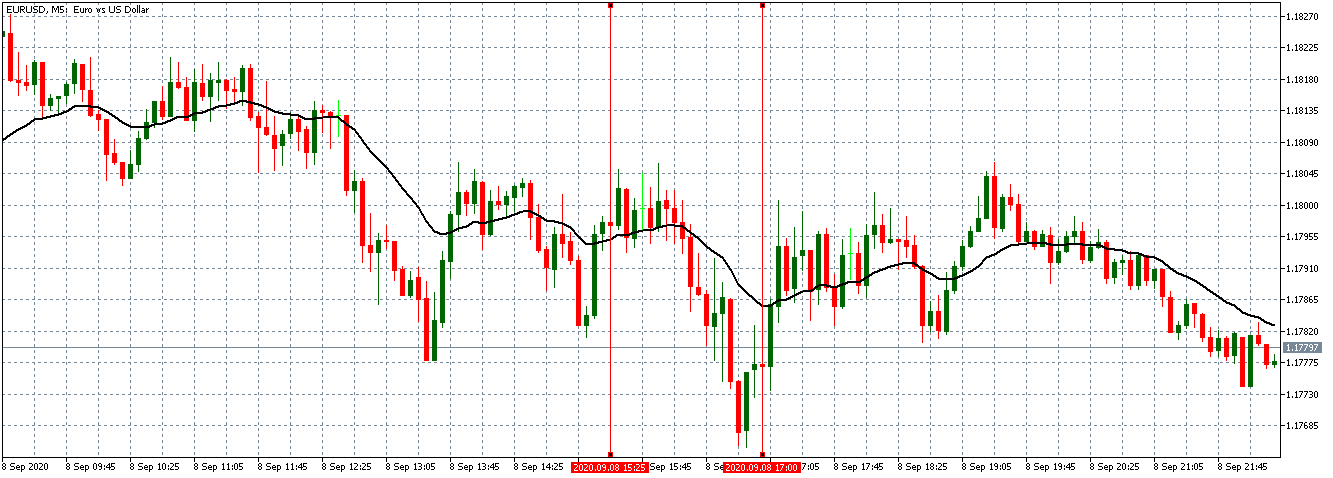
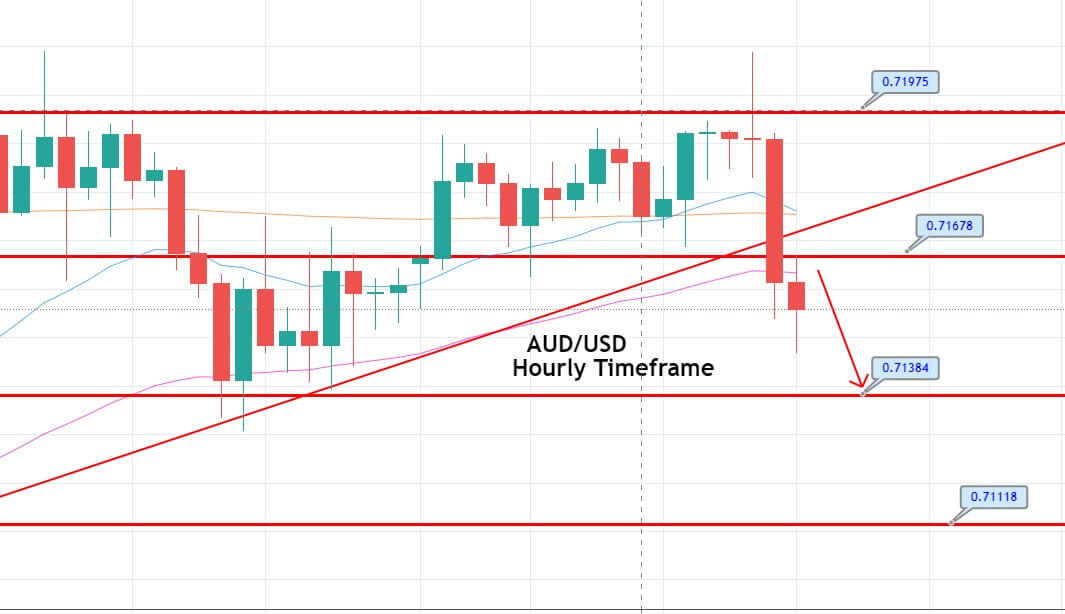
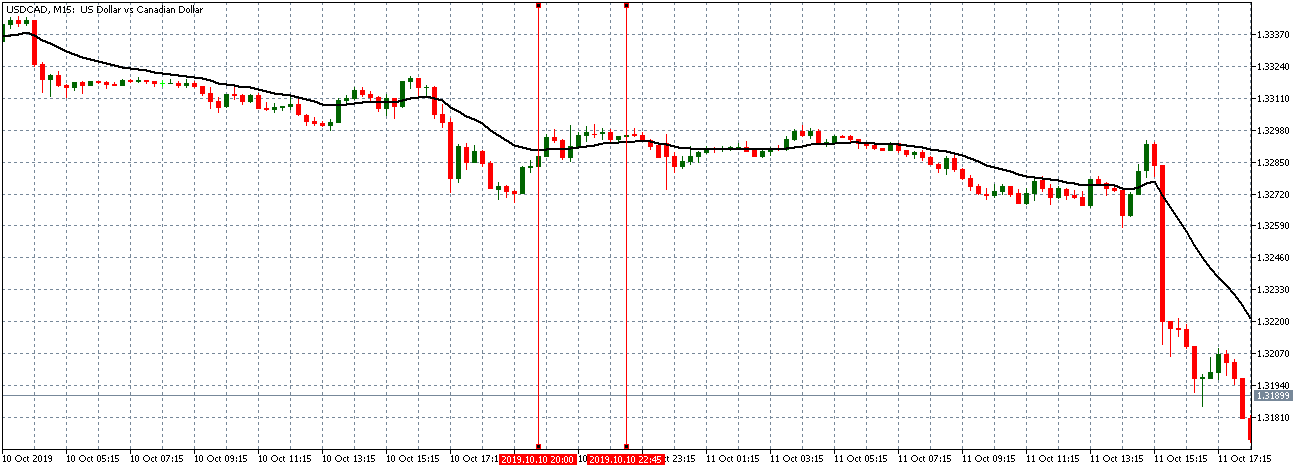
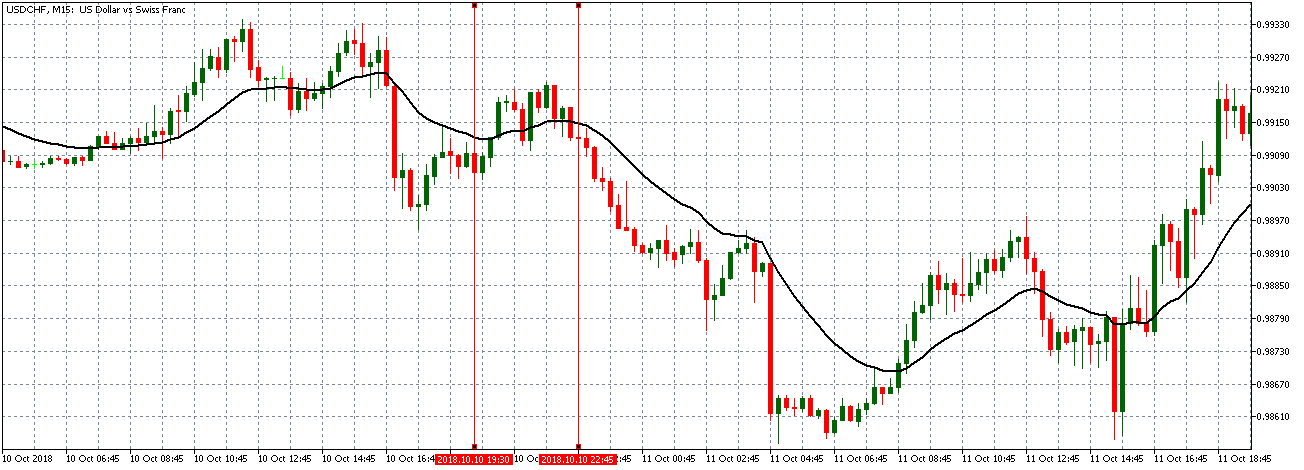
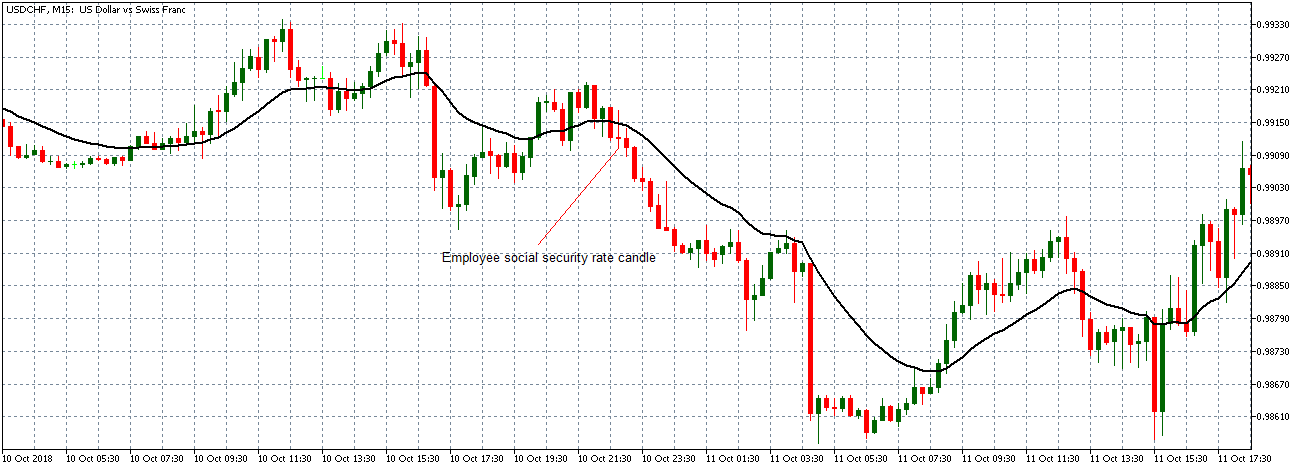
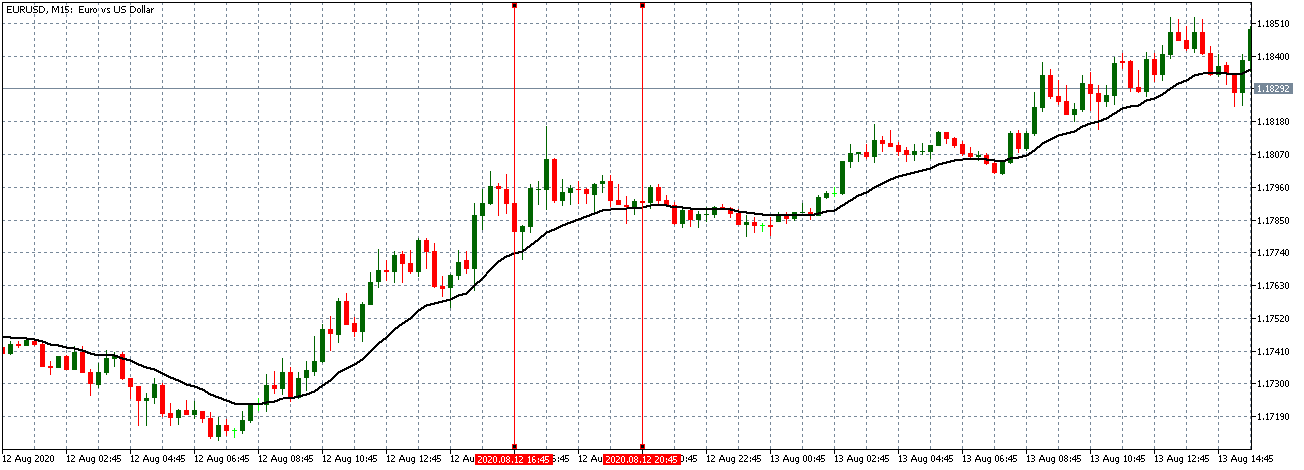
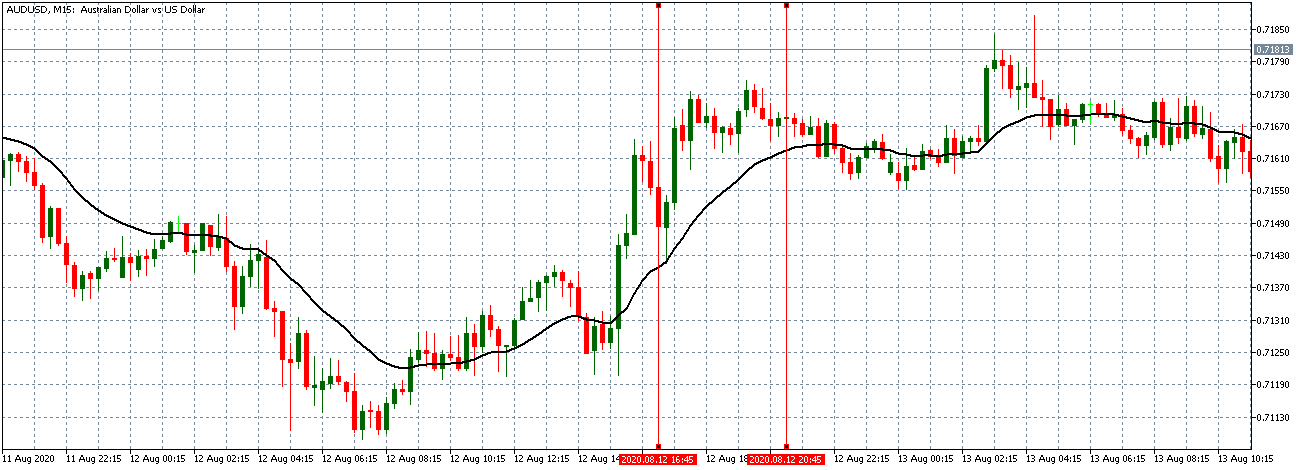
AUD/USD: Before the COT Report Release on October 2, 2020, Just Before 3.30 PM ET
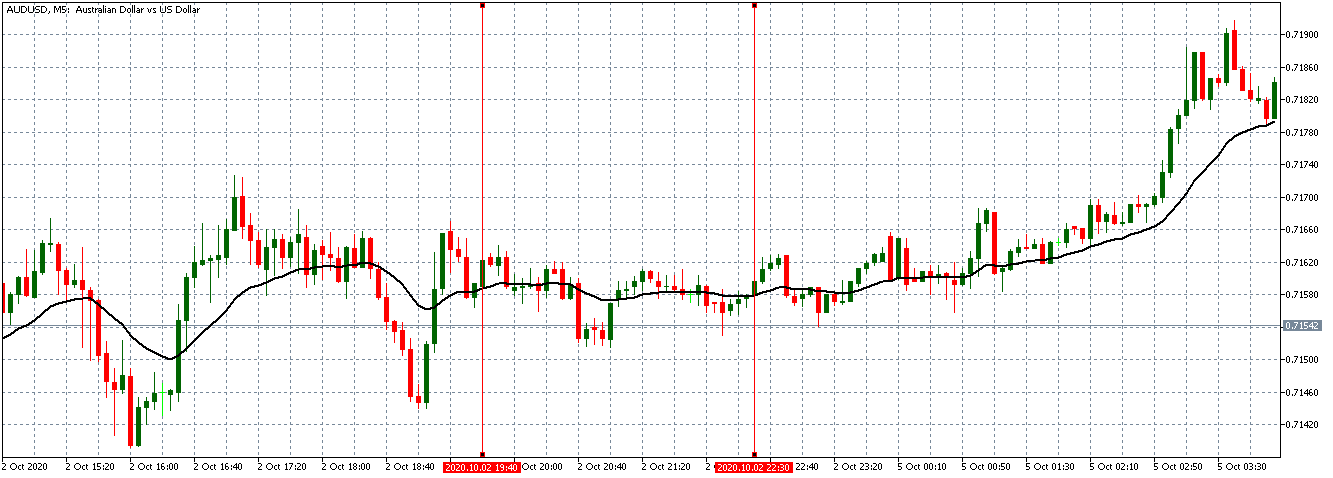
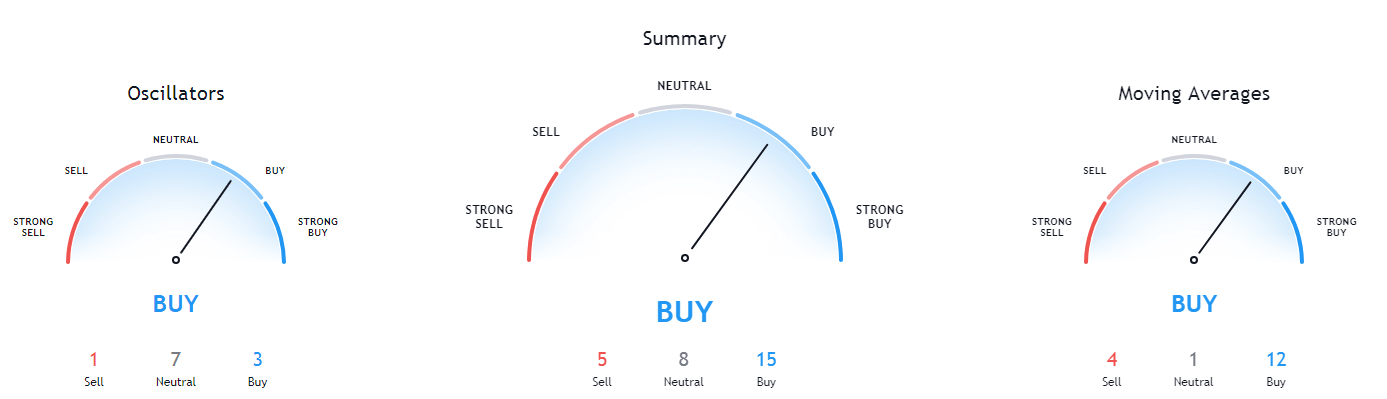
The AUD/USD pair was trading in a neutral position before the release of the COT report. The 20-period MA was flattened with candles forming just around it.
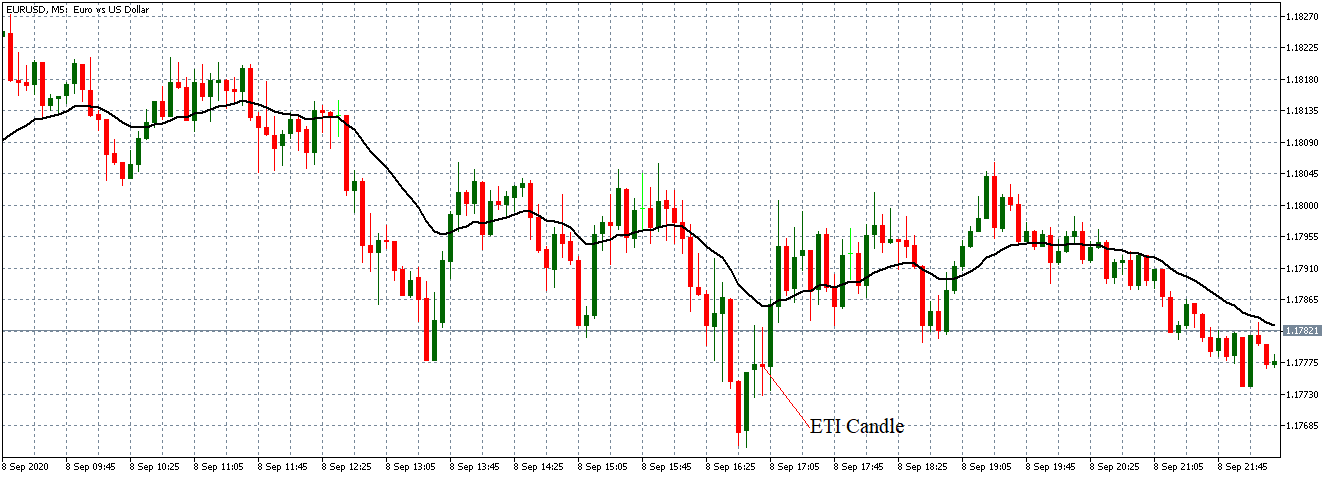
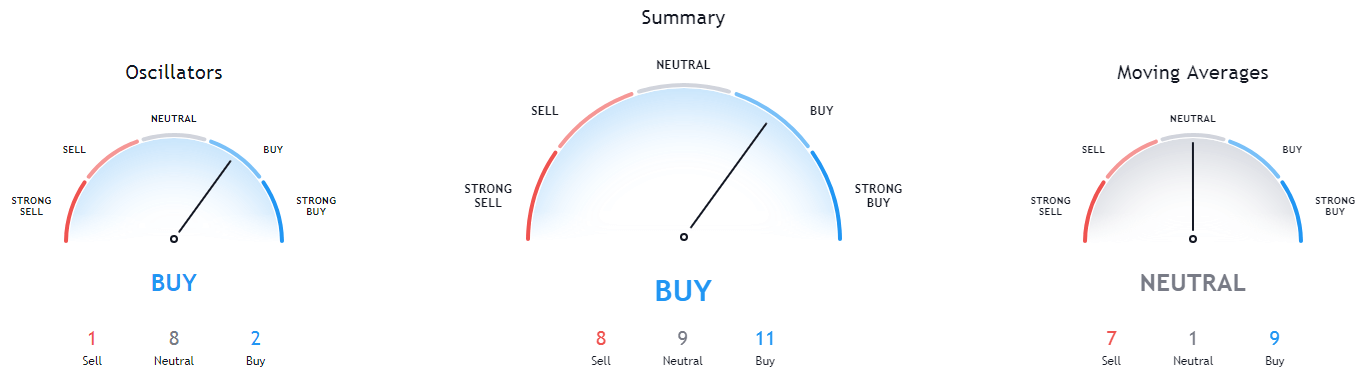
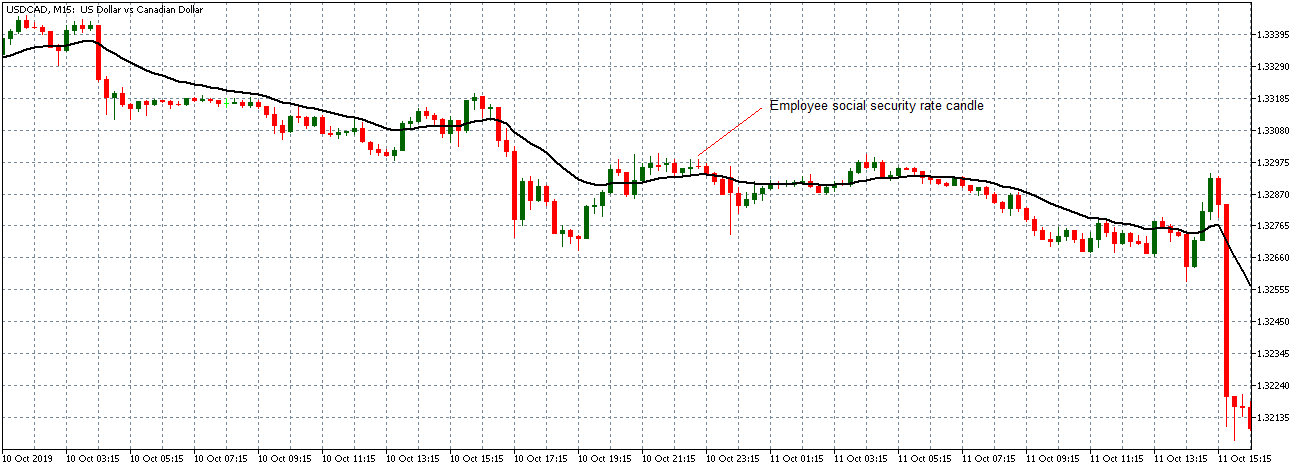
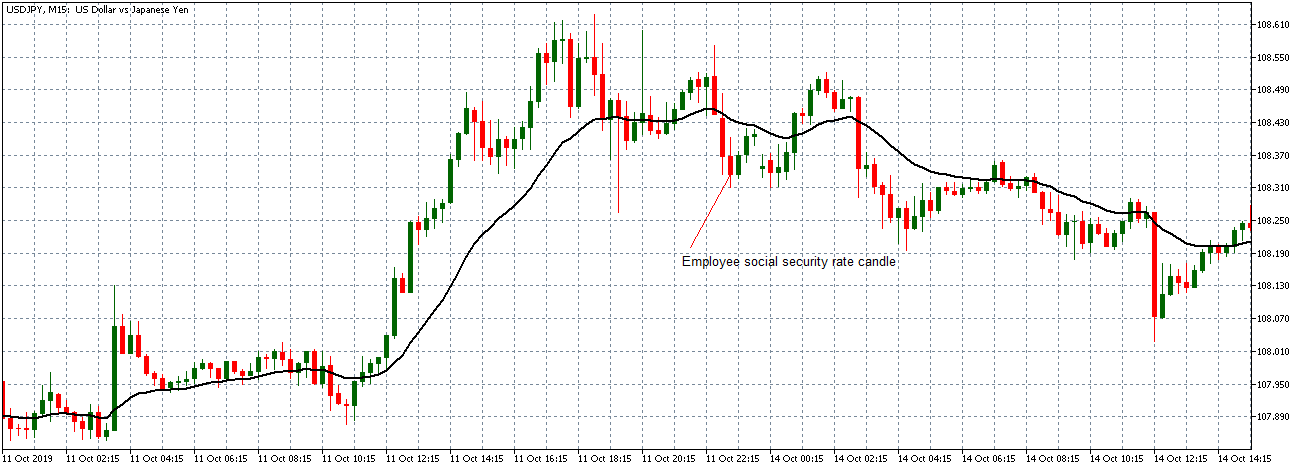
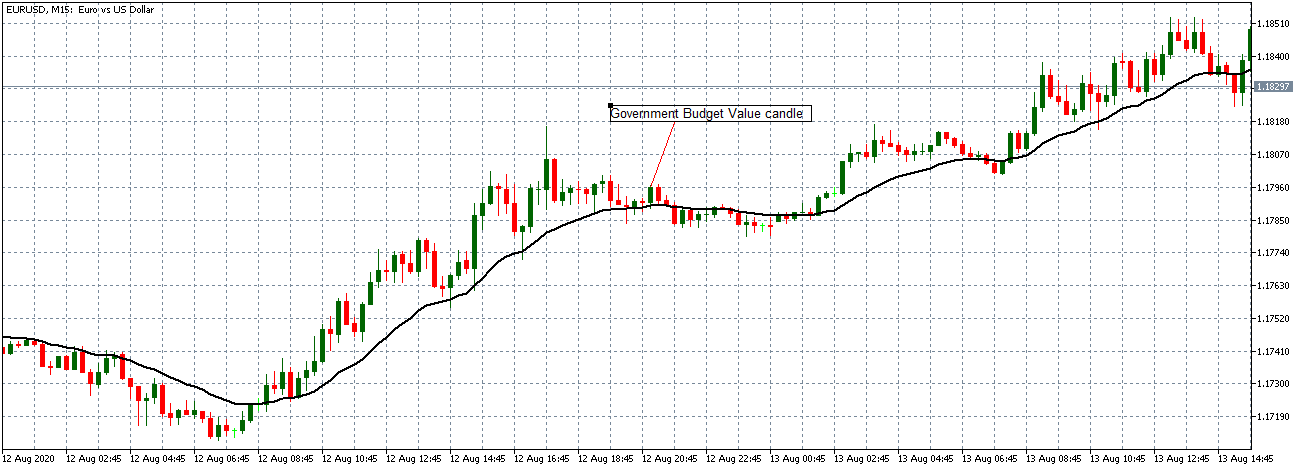
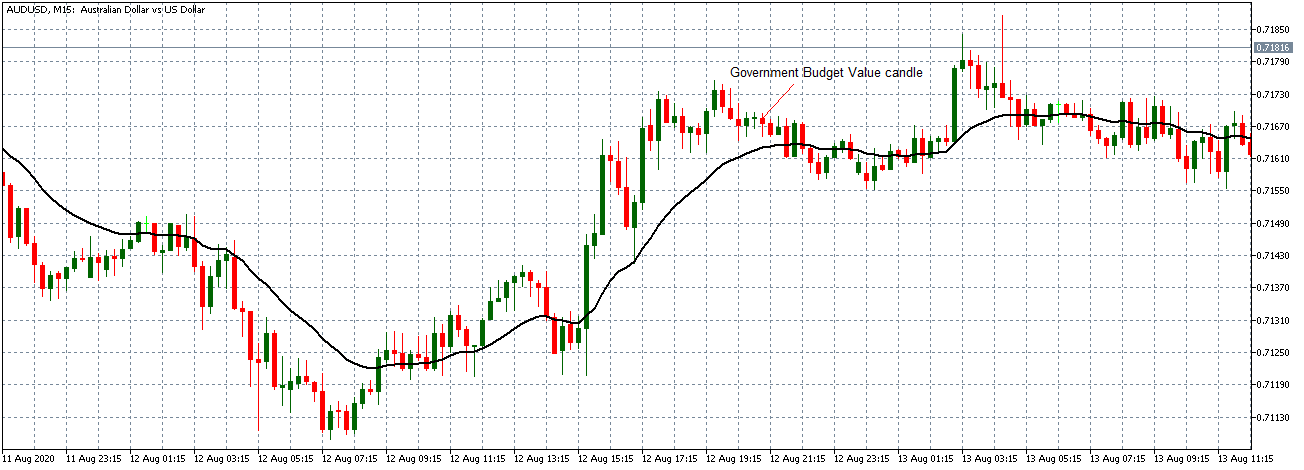
AUD/USD: After the COT Report Release on October 2, 2020, at 3.30 PM ET
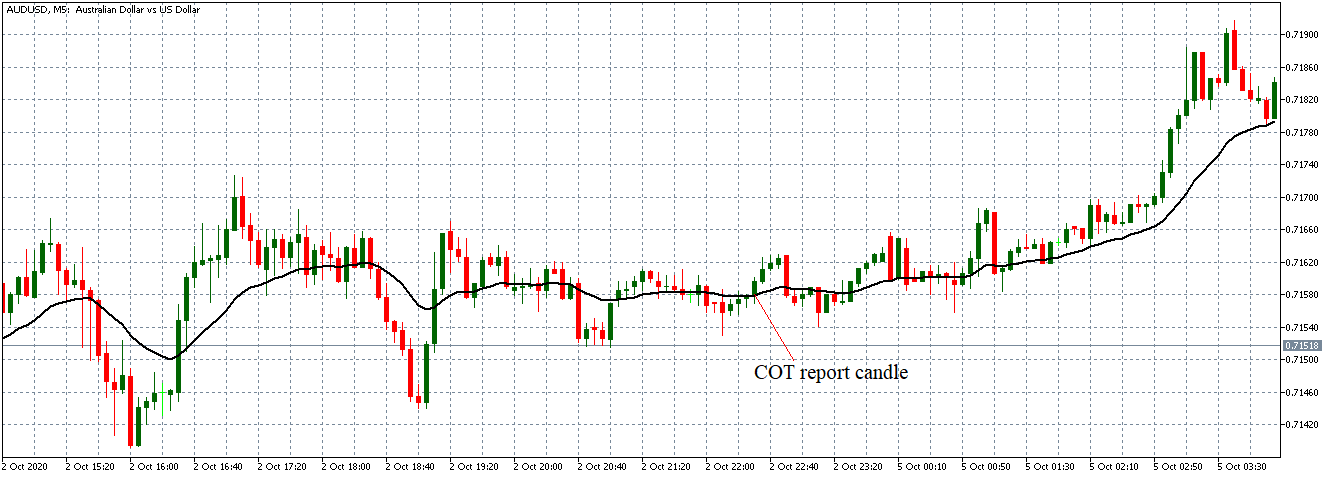
The AUD/USD pair formed a -minute bullish candle after the COT report’s release indicating that the AUD had appreciated relative to the USD. However, the pair could not sustain a bullish trend since it later continued trading in a neutral trend.
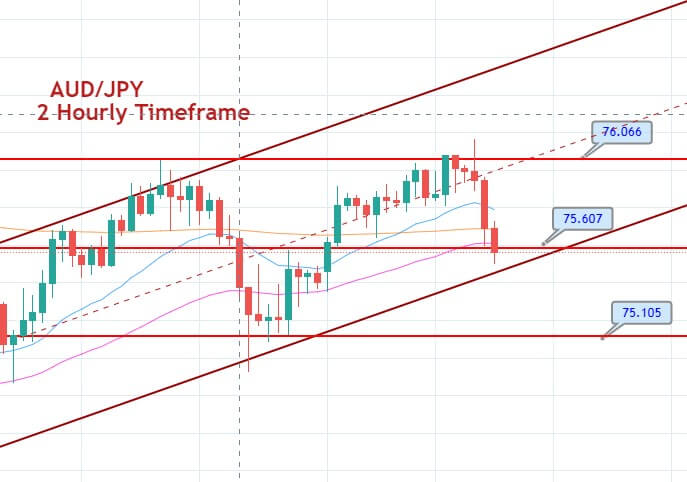
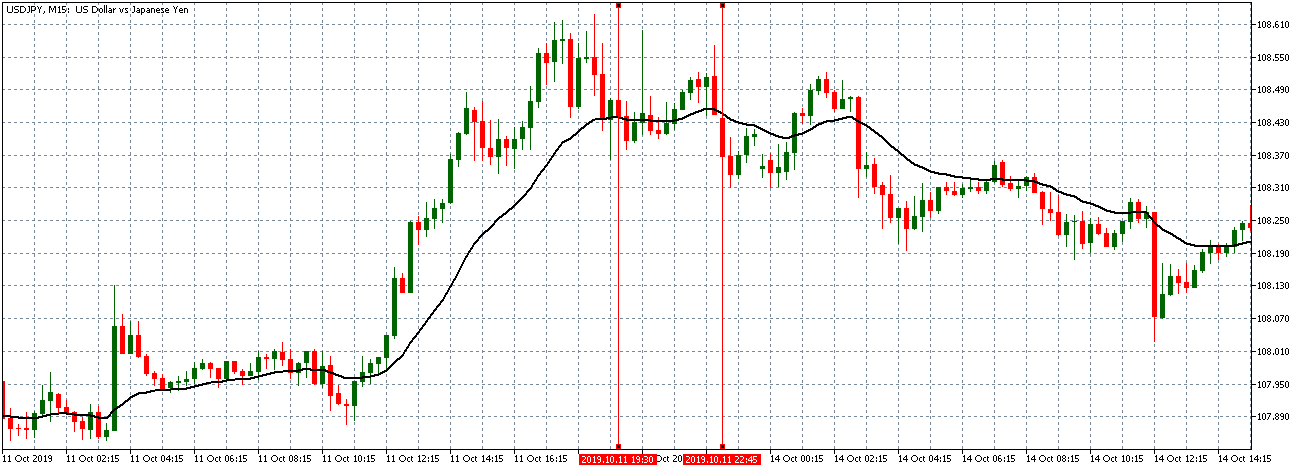
The effects of the COT report are long-term. For this reason, the weekly publication of the report has little impact on the short-term forex market.


