Categories
Forex Course

156. Why Interest Rates Matter While Trading Forex Currency Pairs

Introduction

The interest rate is one of the major fundamental indicators of a currency pair. Any increase in interest rate is a positive sign for an economy. However, there are some other factors that a trader should know.

What is the Interest Rate?

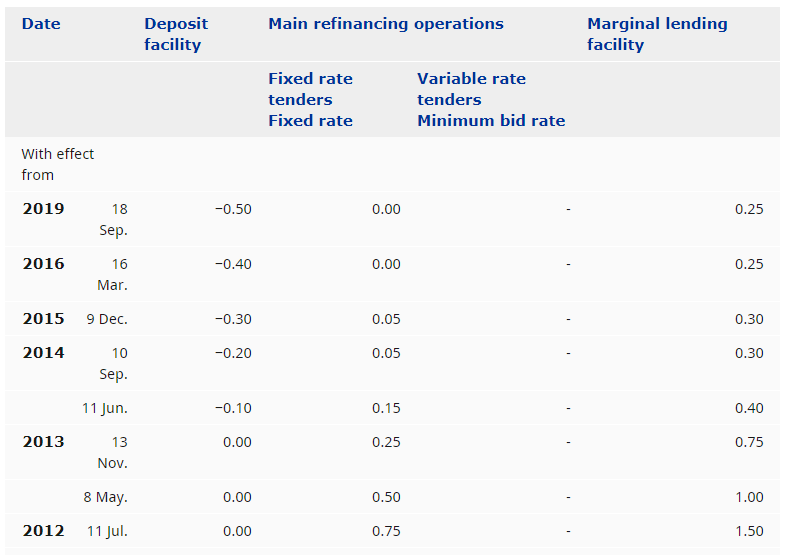
The interest rate is the charge that the Central Bank takes on loans and advances to control the money supply. The interest rate is usually revised quarterly based on the economic condition of a country.

The main aim of changing the interest rate is to control inflation and stabilize the country’s currency exchange rate. The interest rate is one of the most significant fundamental indicators for a country that directly affects the country’s economy both inside and outside.

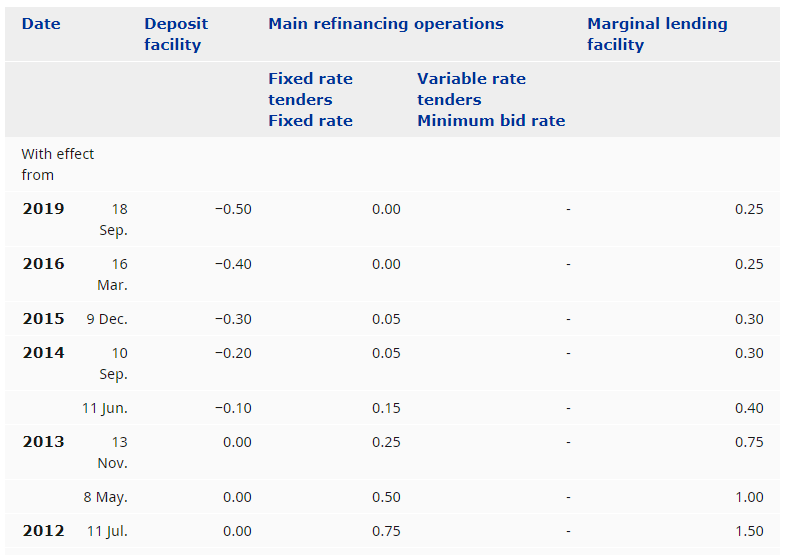
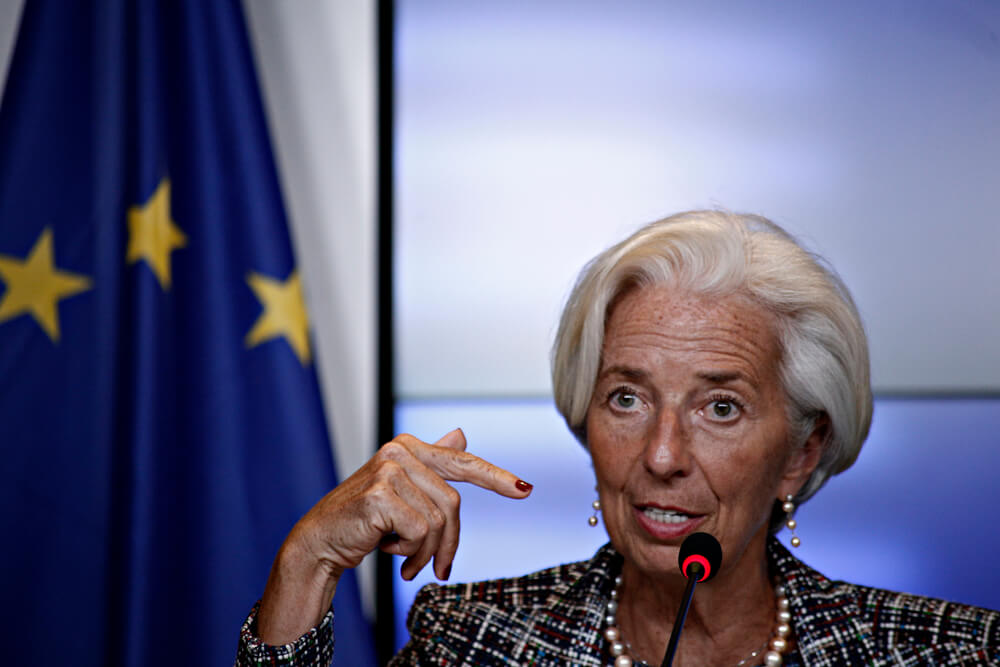
Image Source: https://www.ecb.europa.eu/

When the country’s economic condition is excellent, and the targeted inflation is achieved, the central bank tries to discourage people from taking loans from the Central by increasing the interest rate.

On the other hand, when the economic condition is not right, Central Bank tries to expand the country’s economic activity by attracting people to take more money from the bank with a cheaper interest rate.

How interest Rate Impact on a Currency Pair?

In the forex market, traders usually trade in currency pairs instead of a single currency. Therefore, they should evaluate two separate countries’ economic conditions to determine which country is more reliable. Based on this knowledge, we can say that increasing the country’s interest rate will influence the currency to be strong against other currencies.

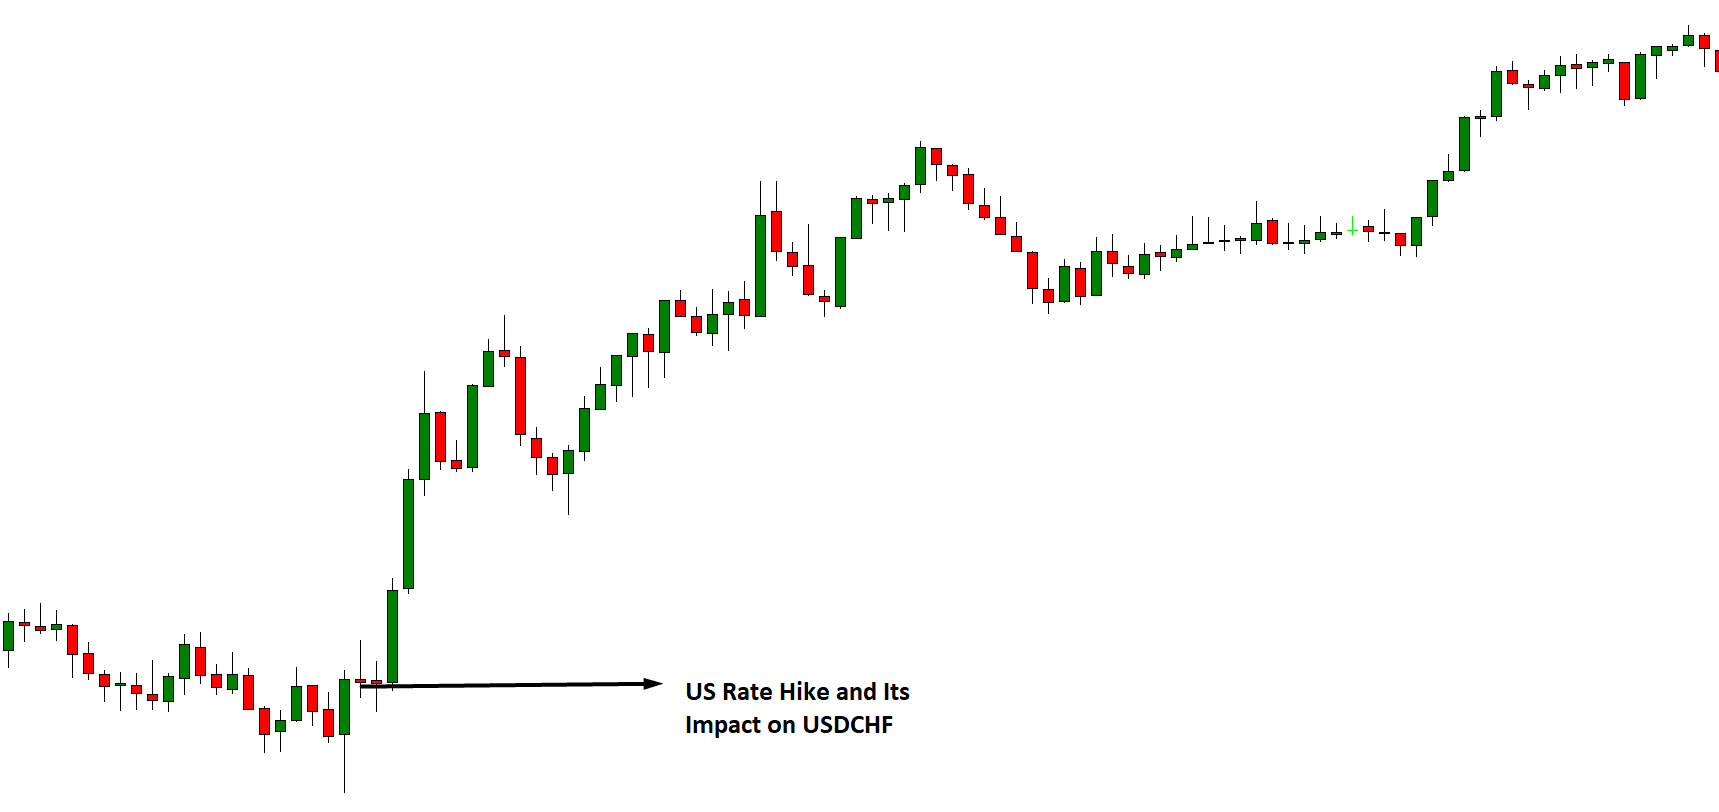
For example, we want to take a trade in the USDCHF pair, and we are waiting for the USD’s interest rate decision. When the news came, we saw that the Federal Reserve increased the interest rate from 2% to 2.5%. As a result, the USD became stronger immediately against the CHF, and the USDCHF goes up.

This is how the interest rate impacts on a currency. However, the opposite reaction might happen when the Federal Reserve decreases the interest rate from 2 % to 1.5% instead of increasing. In that case, the EURUSD might be stronger and move higher.

How to Make a Profit from the Interest Rate Change?

Making money from interest rates is an effective and solid way to trade based on the fundamental analysis. However, as a trader, we should focus on other fundamental releases and events to understand a currency pair’s overall structure. The significant economic releases of a country are interrelated. For example, if the inflation and GDP are good, an increase in interest rate is evident for the central bank.

Therefore, before taking a trade based on the interest, we should focus on what the other fundamental releases are telling about the currency.

Conclusion

After the above discussion, we can say that the interest rate is the most significant fundamental indicator of a currency pair. However, as the forex market consists of several uncertainties, we should focus on money management strongly. We may face some market conditions where the price might react against our expectations. So, the only way to make a consistent growth of our trading balance is to follow strong trade management.

[wp_quiz id=”86408″]
Categories
Forex Signals

USD/CAD Slips Below Downward Trendline – Brace for a Sell Signal! 

The USD/CAD pair was closed at 1.31447 after placing a high of 1.31519 and a low of 1.30808. Overall the movement of the USD/CAD pair remained bullish throughout the day. In the early trading session on Wednesday, the USD/CAD pair followed its Tuesday’s move and dropped to its lowest since 7th September over the US dollar’s weakness. The decline in crude oil prices also played a role in raising the USD/CAD pair on board. The negative macroeconomic data from Canada also added strength to the USD/CAD pair gains on Wednesday.

On the data front, the Consumer Price Index from Canada was released at 17:30 GMT for September, which came in line with -0.1%. The Core Retail Sales from Canada for September declined to 0.5% from the projected 0.9%. For September, the Retail Sales dropped to 0.4% against the expected 1.0% and weighed on the Canadian dollar. Dollarmmon and Median CPI from Canada came in line with the expectations of 1.5% and 1.9%, respectively.

 Whereas the NHPI for September raised to 1.9% from the forecasted 1.2%. The Core CPI for September also remained the same as the year at 0.1%. However, the Trimmed CPI for the year raised to 1.8% against the forecasted 1.7%. The highlighted CPI, Retail Sales, and Core Retails Sales data came in negative or as expected and weighed on the Canadian Dollar tDollartimately pushed higher the USD/CAD prices on Wednesday.

Meanwhile, the Crude Oil Inventories from the previous week dropped to -1.0M against the forecasted 0.5M and raised the demand for crude oil that ultimately supported the declining WTI crude oil prices on Wednesday.

Crude oil prices suffered on Wednesday though most of its losses recovered still, it closed its day weak, which made its commodity-linked currencies Loonie weaker and supported the rising USD/CAD pair.


Daily technical Levels

Support Resistance

1.3103 1.3184

1.3051 1.3213

1.3023 1.3265

Pivot point: 1.3132

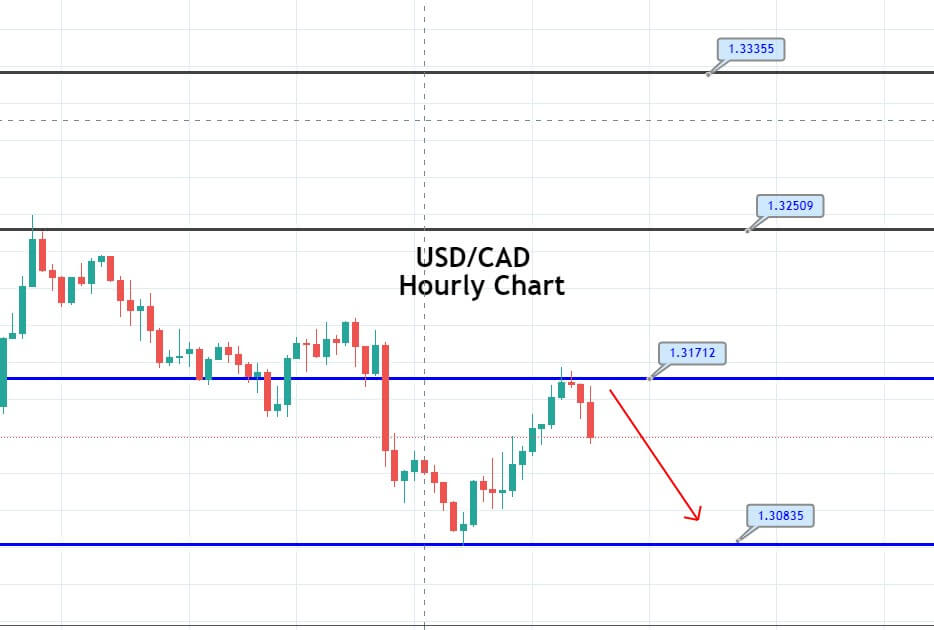
The USD/CAD is facing immediate resistance at the 1.3171 level, and closing of candles below this level is likely to drive selling bias in the market. The USD/CAD has recently closed a Doji candle below 1.3172, which is suggesting that the bullish bias seems to be over, and sellers may enter the market soon. As we can see on the chart, the USD/CAD’s very next candle is bearish engulfing, followed by a doji candle, support strong selling bias for the pair. Therefore, we have opened a sell signal, and we aim for quick 40 pips. Check out a trading plan below.

Entry Price – Buy 0.71124

Stop Loss – 0.70724

Take Profit – 0.71524

Risk to Reward – 1:1

Profit & Loss Per Standard Lot = -$400/ +$400

Profit & Loss Per Micro Lot = -$40/ +$40

Fellas, now you can check out forex trading signals via Forex Academy mobile app. Follow the links below.

iPhone Users: https://apps.apple.com/es/app/fasignals/id1521281368

Andriod Users: https://play.google.com/store/apps/details?id=academy.forex.thesignal&hl=en_US


Categories
Forex Market Analysis

Daily F.X. Analysis, October 22 – Top Trade Setups In Forex – U.S. Jobless Claims In Focus! 

The economic calendar is filled with medium impact economic events such as Unemployment Claims, C.B. Leading Index m/m, and Existing Home Sales from the United States on the news front. Besides, the Consumer Confidence from the Eurozone will also remain in the highlights today. The market may show some price action during the U.S. session on the release of U.S. Jobless Claims. 

Economic Events to Watch Today  


EUR/USD – Daily Analysis

The EUR/USD pair was closed at 1.18609 after placing a high of 1.18806 and a low of 1.18209. The EUR/USD pair extended its previous day’s gains and rose for the 4th consecutive session on Wednesday to reach its highest since mid-September. Despite the alarming comments from ECB President Christine Lagarde, the EUR/USD pair managed to post gains on Wednesday over the U.S. dollar’s weakness and improved risk sentiment.

The U.S. Dollar Index was down by 0.5% and fell to its seven-week lowest level on Wednesday to 92.46 over fresh hopes that the U.S. stimulus package for coronavirus would release soon. The hopes were encouraged by the comments of U.S. President Donald Trump, who said that he was ready to accept a larger coronavirus-relief package. This boosted investor’s optimism that eventually led to rising risk sentiment and increasing pressure on the safe-haven U.S. dollar. The U.S. dollar weakness added further strength to the already rising EUR/USD pair’s prices on Wednesday.

According to the White House spokesperson, Allysa Farah, she was optimistic that a fiscal deal between Democrats and Republicans would reach soon as Trump has suggested that he accept the $2.2 trillion bill proposed by Democrats. However, Senate Republicans have made it public that they will oppose a larger bill.

On Wednesday, the President of the European Central bank, Christine Lagarde, said in a pre-recorded interview that the economic outlook was under clear risk due to an unexpected early pickup in coronavirus infections. She said that more scientists in the Eurozone were expecting the epidemic’s resurgence in November or December with the cold. Lagarde’s concerning statements weighed on the single currency Euro and capped further gains in EUR/USD pair on Wednesday.

The central bank of Europe is set to hold a governing council next week to decide on its monetary policy. The majority of economists expect no change in policy until December. ECB is expected to ramp up its 1.35 trillion pandemics bond-buying program at its last policy meeting in 2020.

These expectations also weighed on the single currency Euro and capped further gains in currency pair EUR/USD.

Meanwhile, the number of coronavirus cases in Europe is continuously setting fresh records. However, market participants are ignoring the issue; it still holds some importance in driving the EUR/USD pair as there was no macroeconomic data to be released from Europe or the U.S. On Thursday, Europe will publish the Consumer Confidence Report, and the U.S. will publish its initial jobless claims from last week that will have a major impact on EUR.USD pair’s movements.

Daily Technical Levels

Support Resistance

1.1773     1.1854

1/1725     1.1889

1.1691     1.1936

Pivot point: 1.1807

EUR/USD– Trading Tip

The EUR/USD is trading sharply bullish amid a weaker U.S. dollar to trade at 1.1848 level, and the has formed inside bar down, which suggests that the bullish bias is getting weaker and sellers may dominate the market. On the lower side, the EUR/USD can go for bearish correction until the 1.1819 level that marks the 38.2% Fibonacci retracement level. Continuation of further selling trends can lead the EUR/USD price towards a 1.1800 mark, and below this, the next support level stays at 1.1765. The MACD and RSI are also supporting the bearish bias now. The bearish bias remains dominant today. 


GBP/USD – Daily Analysis

The GBP/USD pair was closed at 1.31461 after a high of 1.31765 and a low of 1.29332. On Wednesday, the GBP/USD pair followed its previous daily trend and rose for 3rd consecutive day. The British Pound jumped higher on the day by 1.6% and reached its highest since September 7.

The recent jump in British Pound against the U.S. dollar came in as the E.U. and the U.K. were set to resume talks after Britain welcomed the bloc’s desire to break the impasse in negotiations. The post-Brexit talks are set to resume on Thursday after the E.U. Brexit negotiator Micheal Barnier said a deal was in reach and pledged to seek the necessary compromises on both sides. He added that an agreement has reached within and if both sides were willing to work constructively and compromise despite the difficulties.

Great Britain signaled that it was ready to intensify talks to soften the key sticking issues included fisheries and sovereign aid. Micheal Barnier believed that sovereignty was a legitimate concern for the U.K., and E.U. would have to compromise. These developments in Brexit talks gave strength to British Pound and supported GBP/USD pair on Wednesday to post gains.

On the data front, at 11:00 GMT, the CPI for the year from Great Britain was released as 0.5% against the forecasted 0.4% in September and supported British Pound. The Core CPI for the year was also released and came in as expected by 1.3%. The Public Sector Net Borrowing advanced to 35.4B against the forecasted 32.5B and weighed on GBP. The RPI for the year also dropped to 1.1% against the expected 1.2% and weighed on GBP.

At11:03 GMT, the United Kingdom’s PPI input raised to 1.1% against the forecasted -0.9% and raised British Pound. However, at 12:30 GMT, the PPI output remained flat at -0.1%. The Housing Price Index for the year from Pound also came in line with 2.5% expectations.

The rising CPI and PPI Input data supported the bullish momentum of the GBP/USD pair on Wednesday.

The British Pound was also helped by easing fears over negative interest rates after Deputy Bank of England Governor Dave Ramsden said that cutting rates below zero could hamper lending activity. He also said that there might be an appropriate time to use negative interest rates, but this was not that time. These comments also gave strength to British Pound and raised the GBP/USD pair on Wednesday.

Meanwhile, the U.K. reported 26,688 coronavirus cases on Wednesday in comparison to Tuesday’s 21,331 cases. The rising number of coronavirus infections from the U.K. forced the government to impose new lockdown measures in the country’s parts. These lockdowns also held the upward trend of the GBP/USD pair on Wednesday.

On the U.S. front, the stimulus package talks were resumed after U.S. President Donald Trump agreed to increase the stimulus package’s size. The renewed hopes for a stimulus package before elections weighed on the U.S. dollar, which added further strength to the rising GBP/USD pair on Wednesday.

Daily Technical Levels

Support Resistance

1.2997     1.3220

1.2864     1.3310

1.2774     1.3443

Pivot point: 1.3087

GBP/USD– Trading Tip

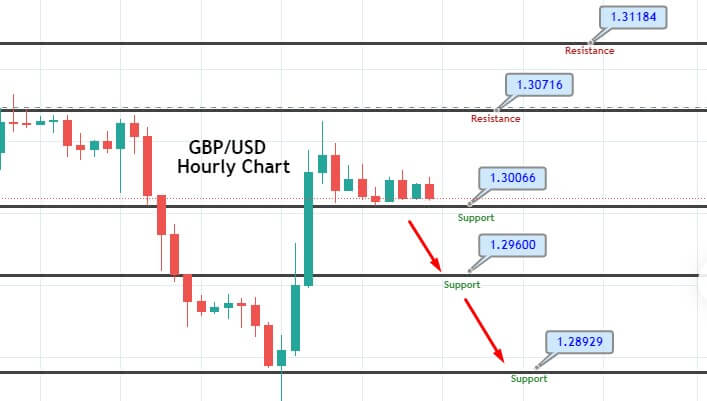
The GBP/USD soared sharply to trade at the 1.3170 level, and recently, it has entered the overbought zone. Below 1.3170, we may see the GBP/USD price trading bearish to complete 23.8% Fibo level and 38.2% Fibo level at 1.3100 and 1.3068 level. Continuation of a bearish trend can lead the Cable towards the 1.3006 level that marks a 61.8% Fibo level. The cable may face resistance at 1.3170 level today. 


USD/JPY – Daily Analysis

The USD/JPY pair was closed at 104.580 after placing a high of 105.523 and a low of 104.339. The USD/JPY pair reversed its previous day momentum and fell on Wednesday to its one-month lowest level on the back of fresh U.S. dollar weakness. The pair hit 104.339 level, the lowest level since September 21 after U.S. President Donald Trump boosted for a larger stimulus package. This report prompted some investors to move toward riskier assets and dampened the safe-haven appeal for the greenback.

The price action from the USD/JPY traders suggested that traders were betting heavily on the news that there might be a stimulus by this weekend and ignored the signs of opposition from Trump’s Republican Party.

The Senate Majority Leader Mitch McConnell provided no timetable for a relief bill and said that he was not in favor of larger stimuli before elections. Whereas, the White House Chief of Staff Mark Meadows preserved the hopes for a stimulus deal and said on Wednesday that he was very hopeful that progress was being made in the negotiations. He added that both parties would remain under talks over the coming days.

The U.S. Treasury yields held near their highest levels in four months on Wednesday over the expectations that a deal might be reached. The 10-year Treasury yield was up by 1.5 basis points and touched its fresh four months high at 0.84%. This weighed on the U.S. dollar and added further pressure on the USD/PY pair.

The Federal Reserve issued it Beige Book on Wednesday that revealed that economic activity was continuously increasing across all districts with a pace of growth characterized as slight to modest in most districts.

The USD/JPY pair’s main driver on Wednesday remained fresh hopes for a stimulus package as there was no macroeconomic data to be released on the day. The focus was entirely on the relief bill, where Nancy Pelosi also affirmed that she was optimistic about the chances of reaching an agreement before the U.S. Presidential elections.

Daily Technical Levels

Support Resistance

104.18     105.35

103.68     106.00

103.02     106.51

Pivot point: 104.84

USD/JPY – Trading Tips

The USD/JPY traded dramatically bearish to drop from 105.460 level to 104.349 level. Like other pairs, the USD/JPY has also entered the oversold zone, and now sellers seem to be exhausted. On the higher side, the USD/JPY pair has reversed some of the losses to trade at the 104.700 level. On the higher side, the pair may go after the 38.2% Fibonacci retracement level of 104.900 and 50% Fibo level of 105. Let’s consider taking a buying trade over 104.350 area today. Good luck! 

Categories
Crypto Market Analysis

Daily Crypto Review, Oct 22 – PayPal to Enable its Users to Buy and Sell Crypto; Bitcoin Skyrockets to $13,000 as a Response

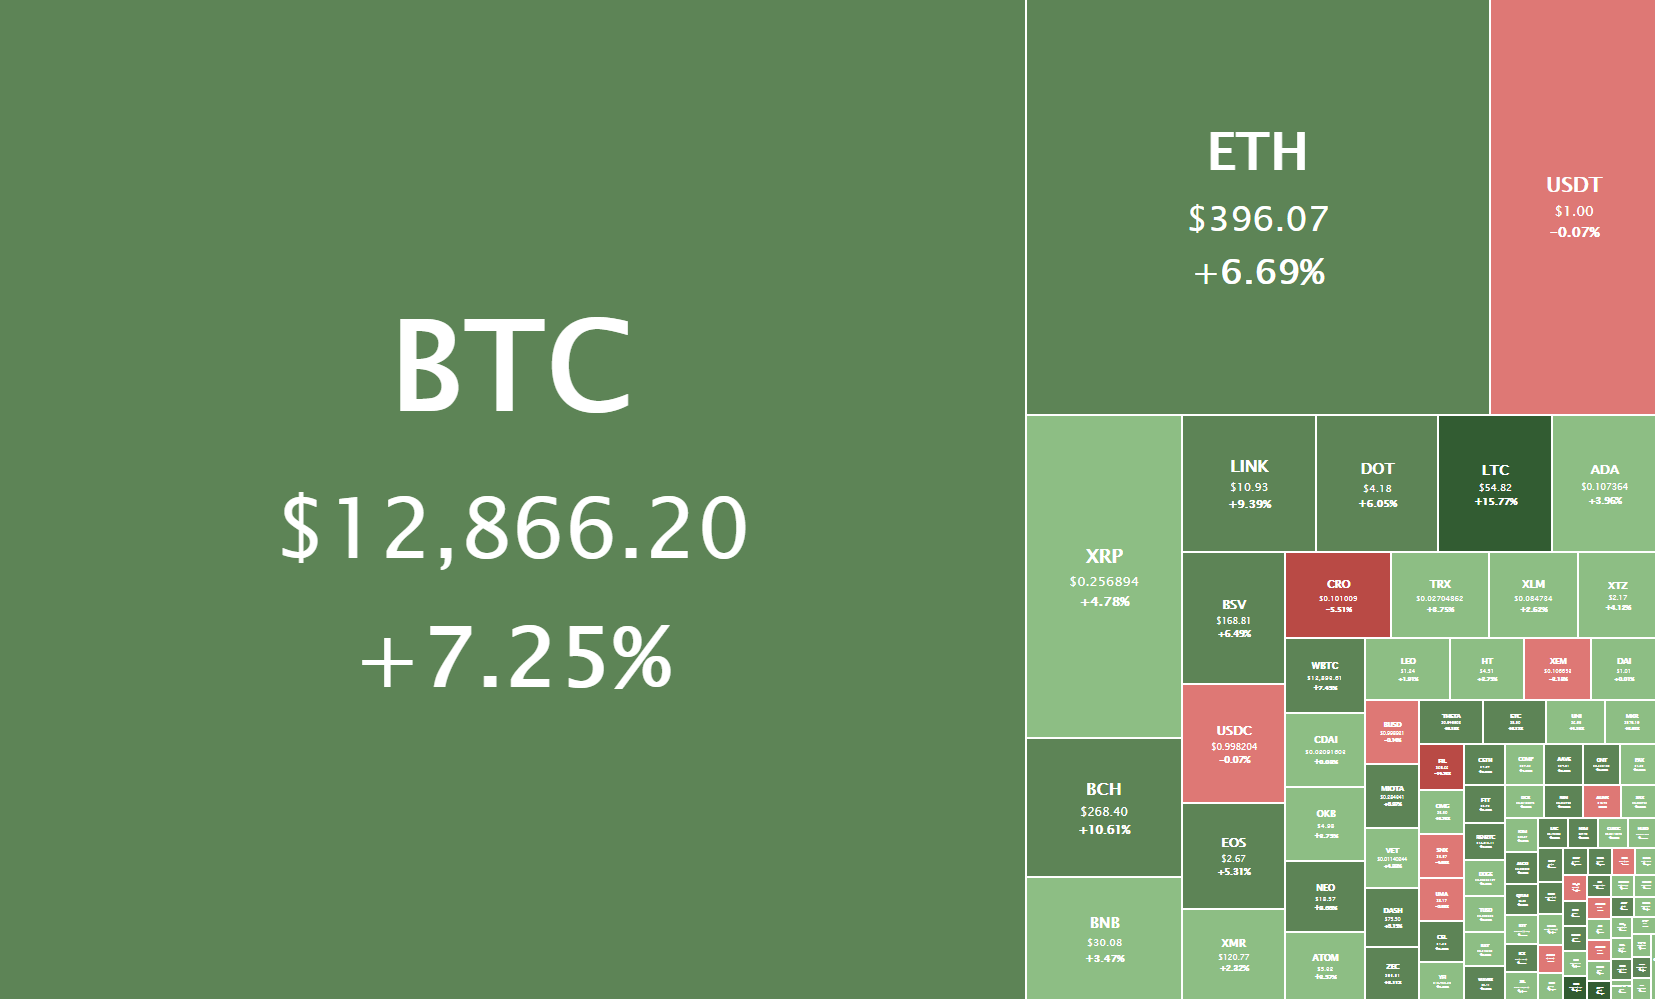
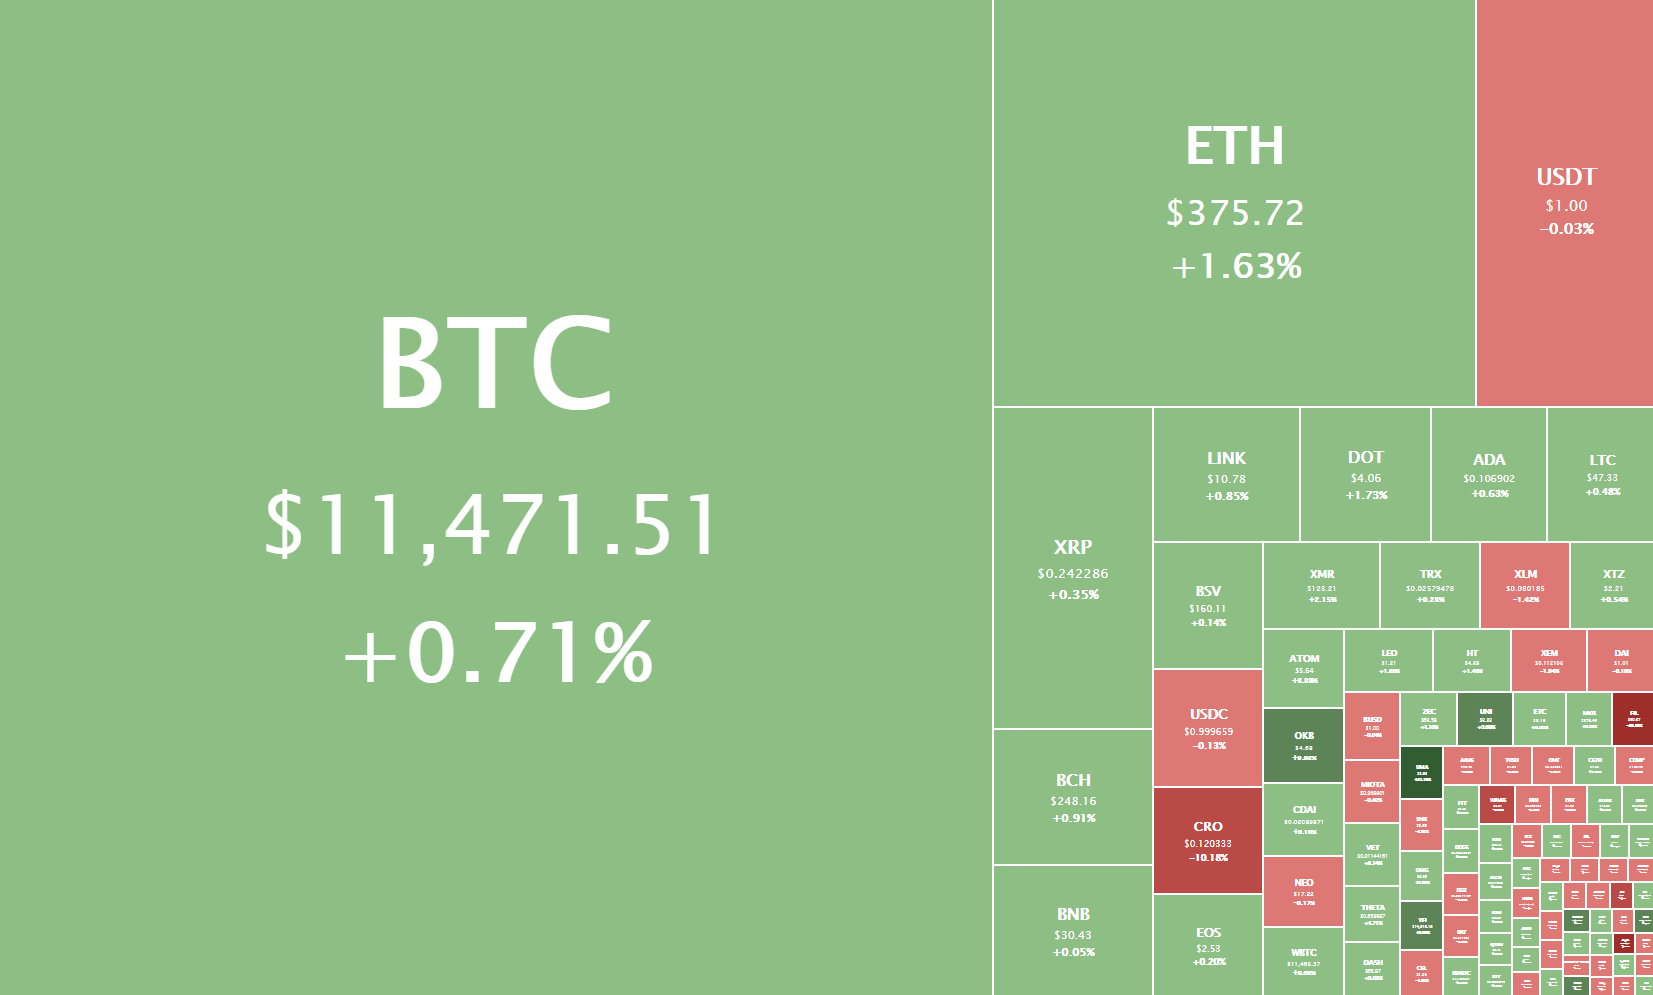
The cryptocurrency sector has rallied up and skyrocketed as PayPal announced that it will now support cryptocurrencies. Bitcoin has led the rally with an almost double-digit increase. It is currently trading for $12,886, representing an increase of 7.25% on the day. Meanwhile, Ethereum gained 6.69% on the day, while XRP gained 4.78%.

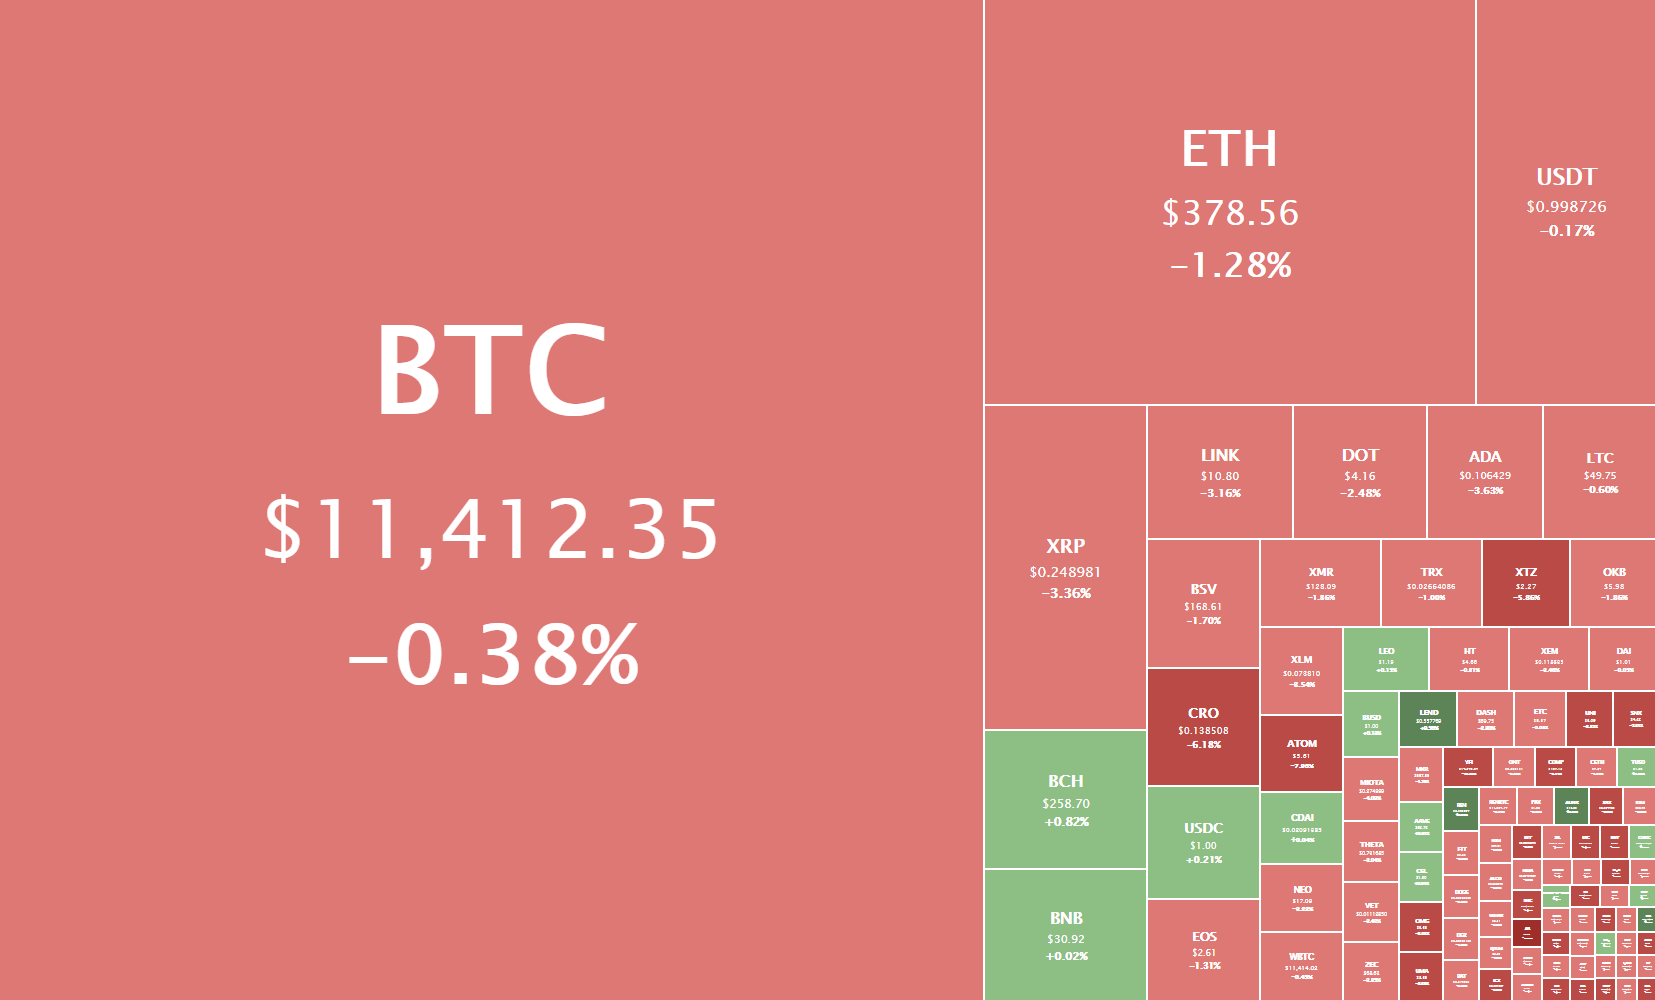
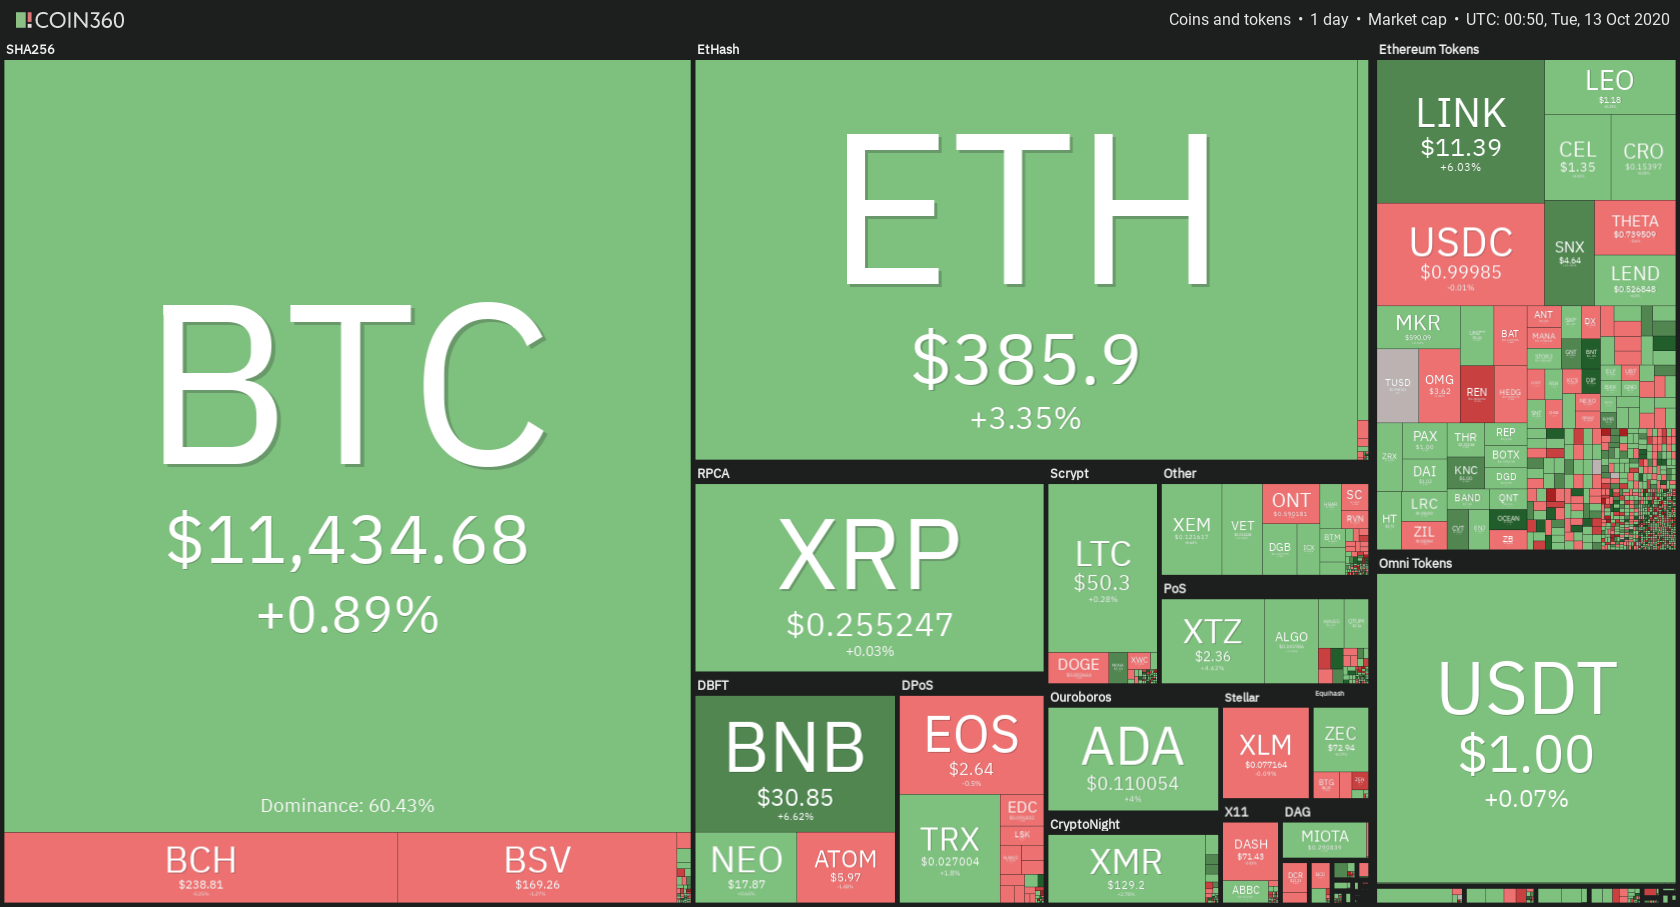
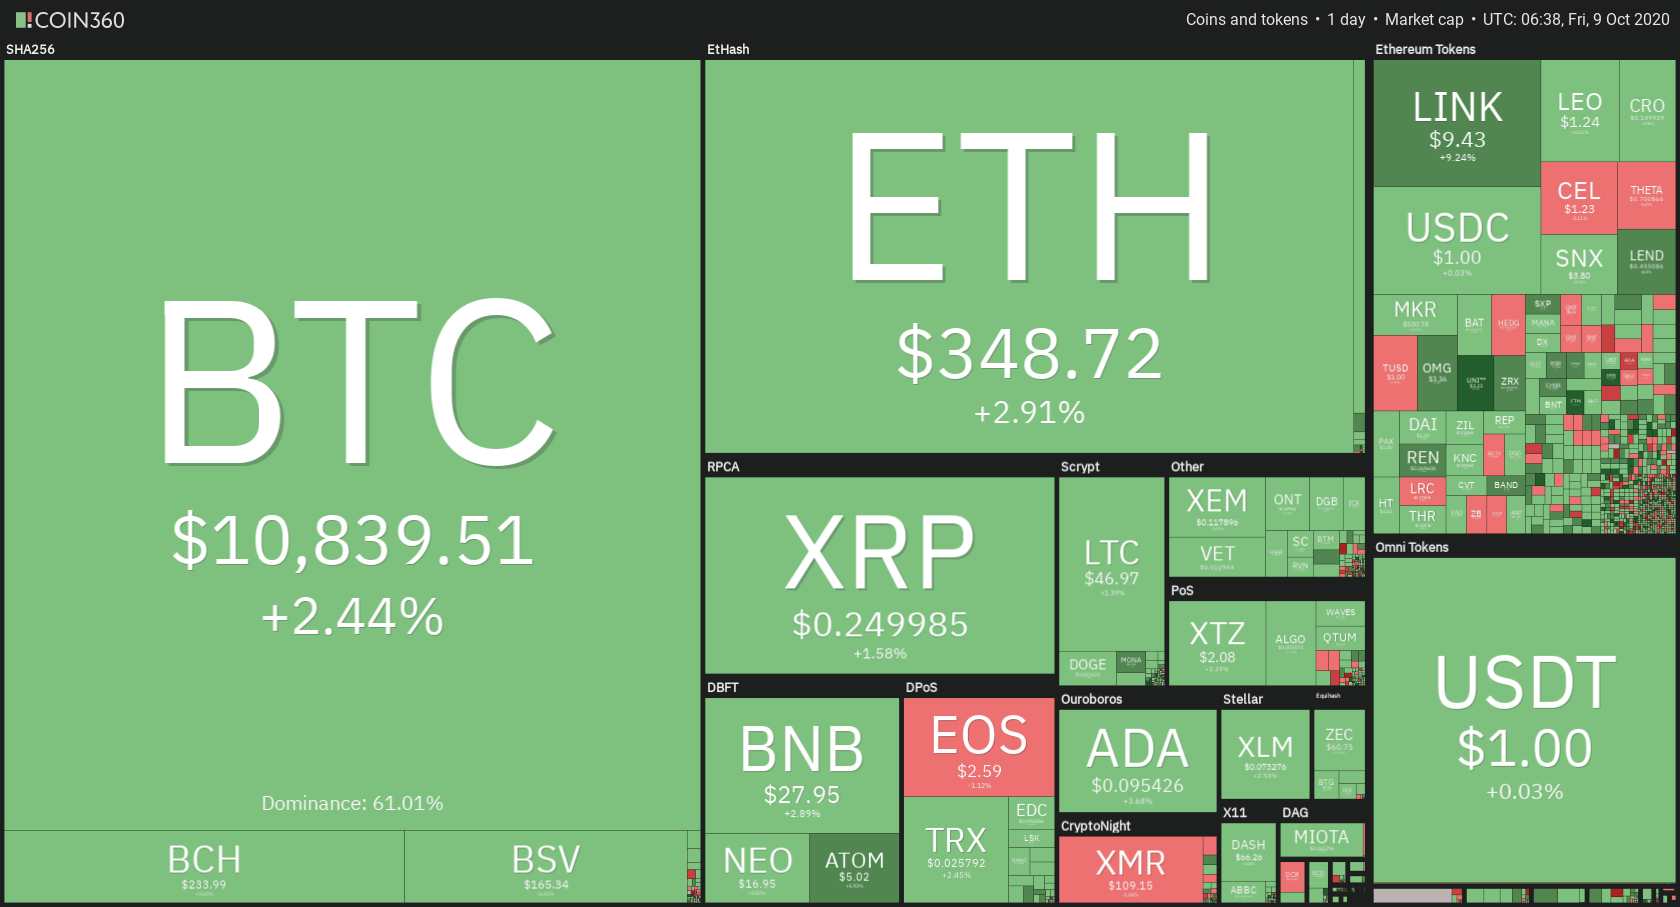
 Daily Crypto Sector Heat Map

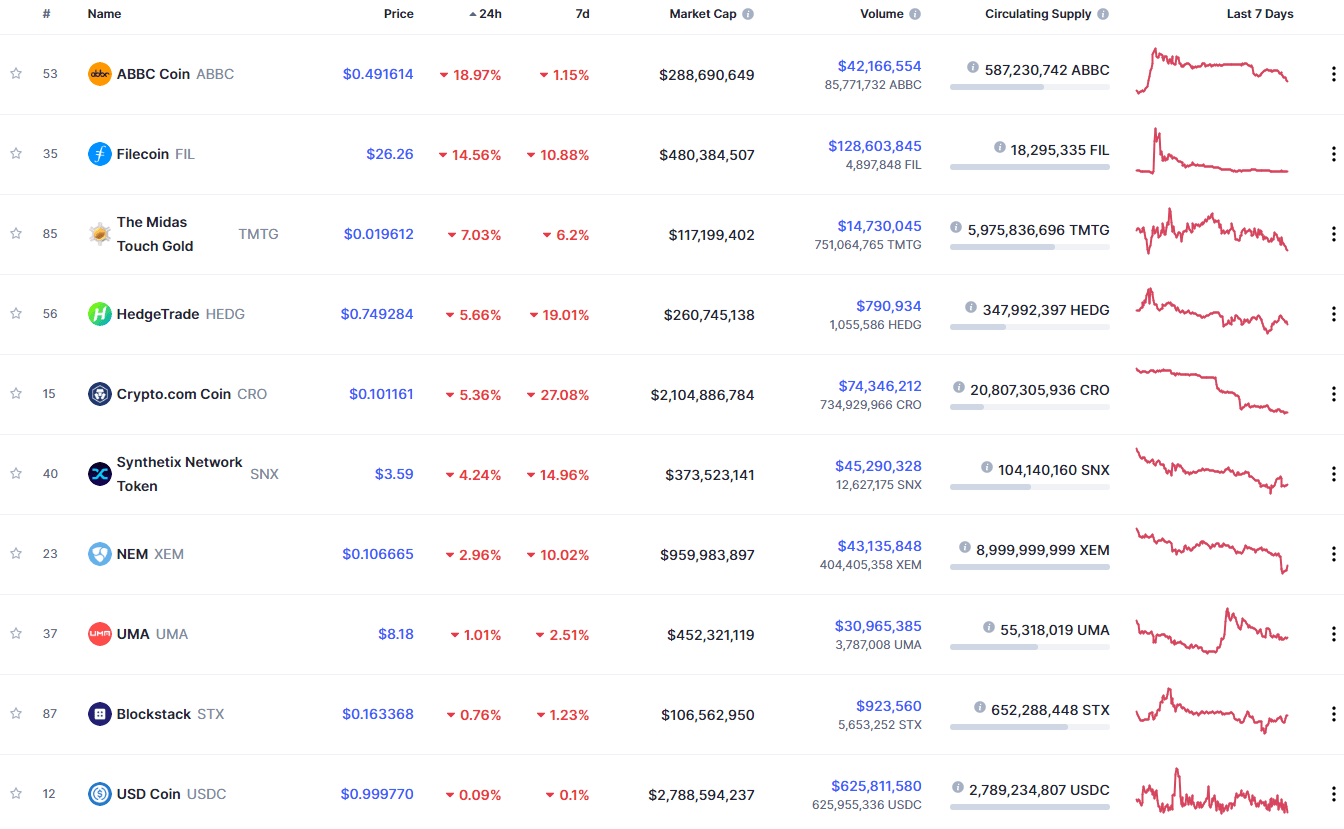
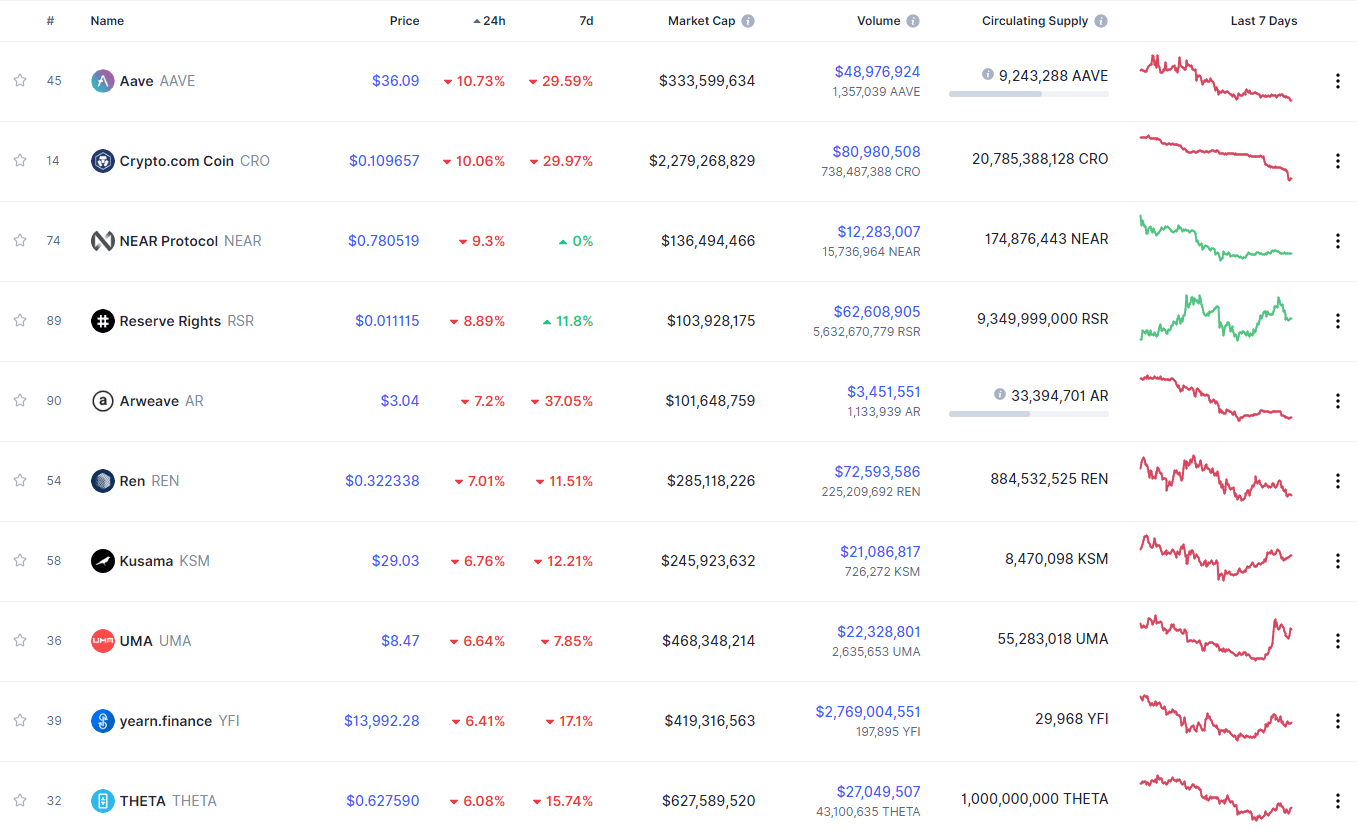
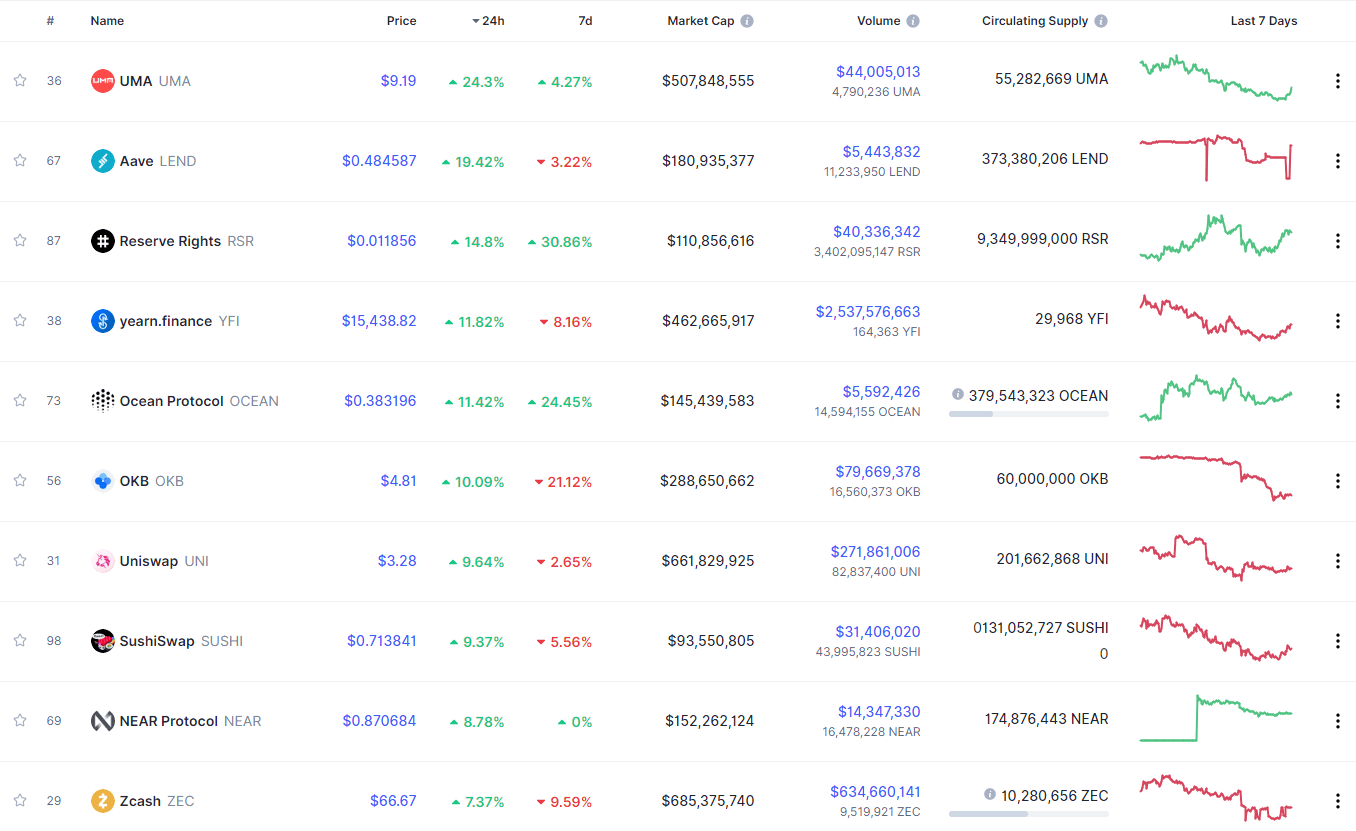
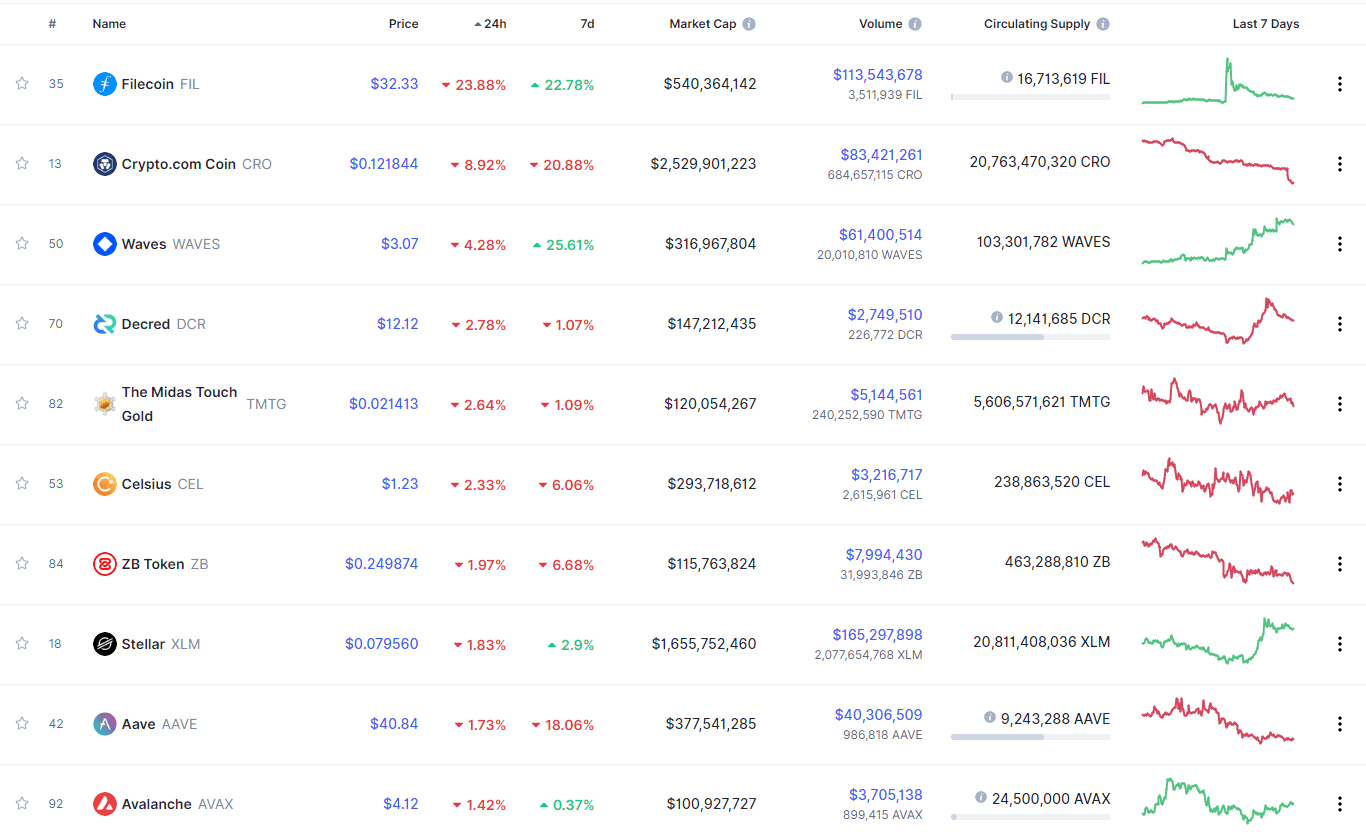
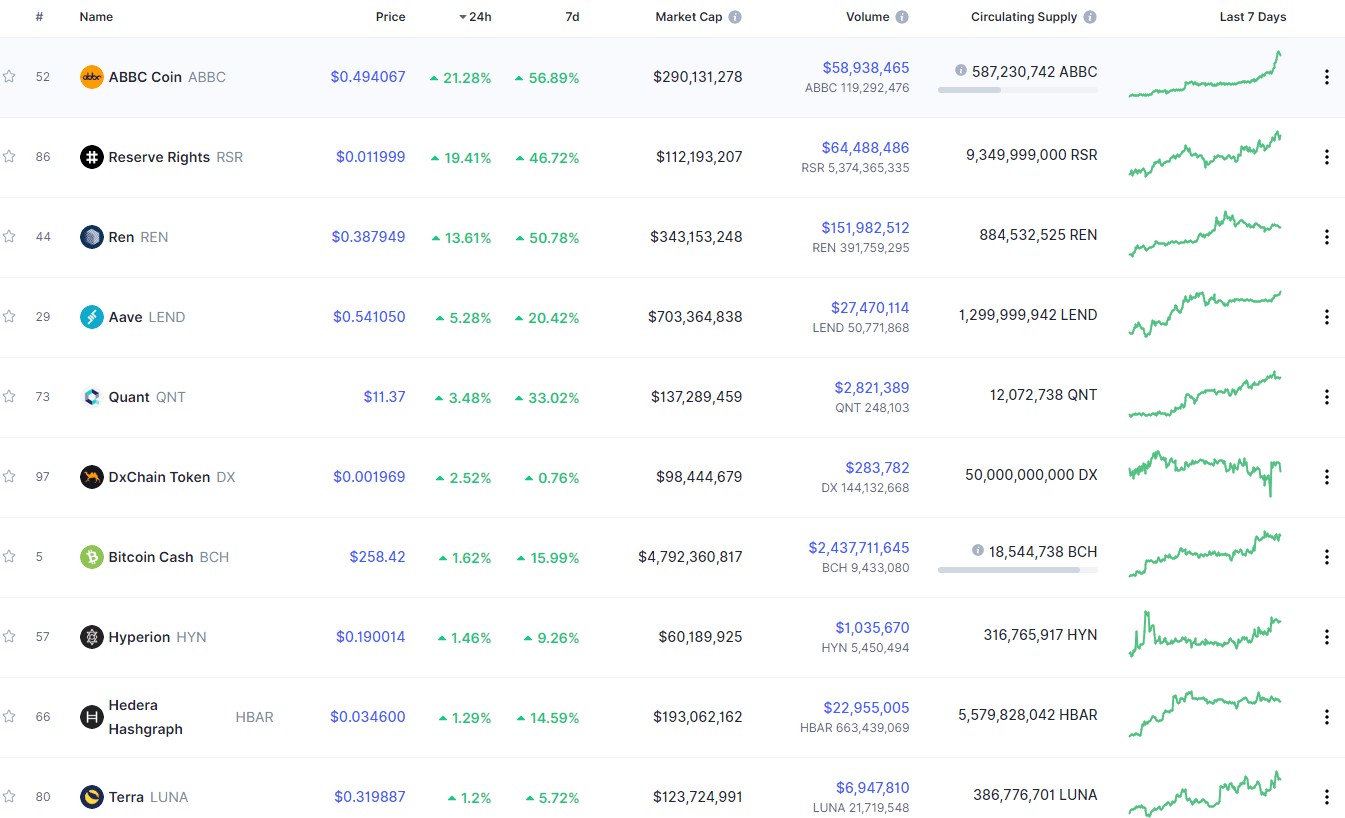
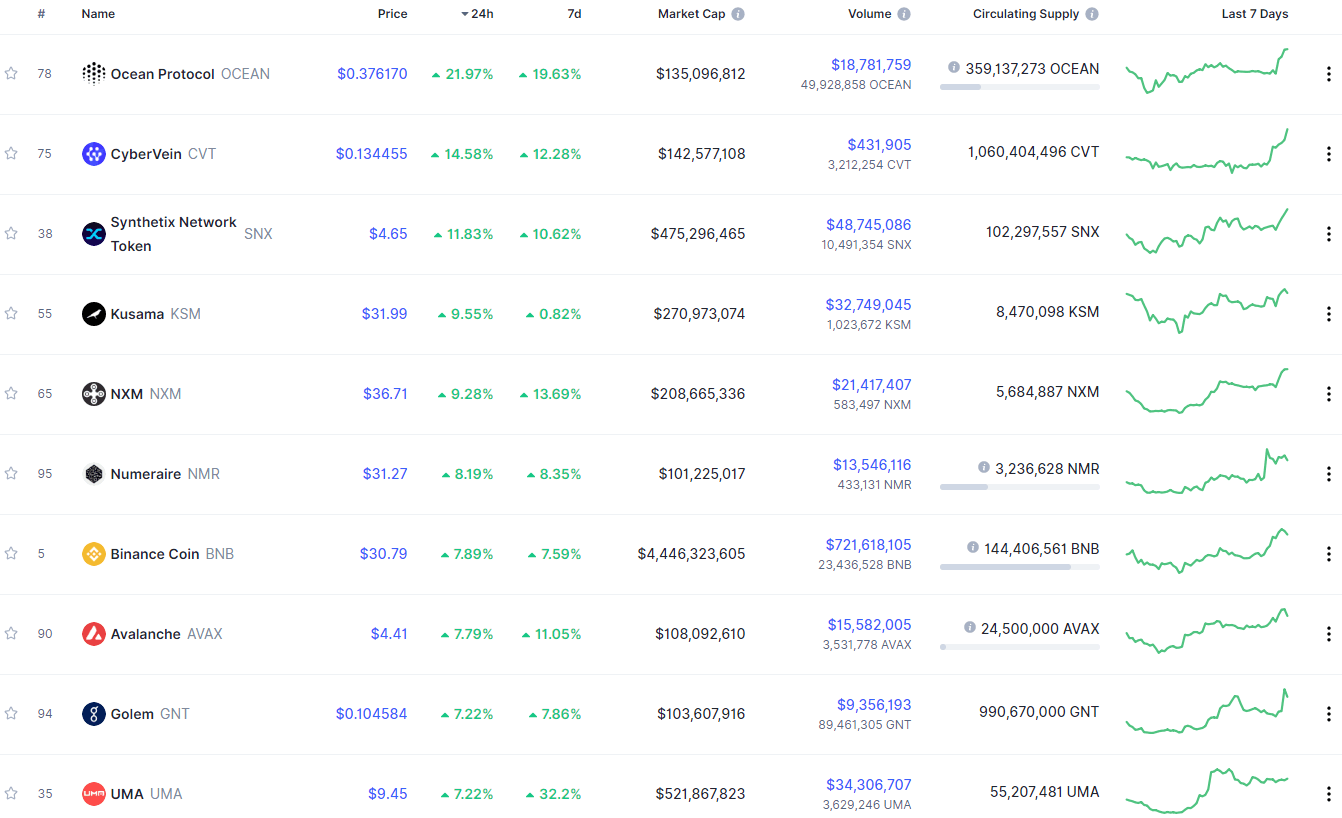
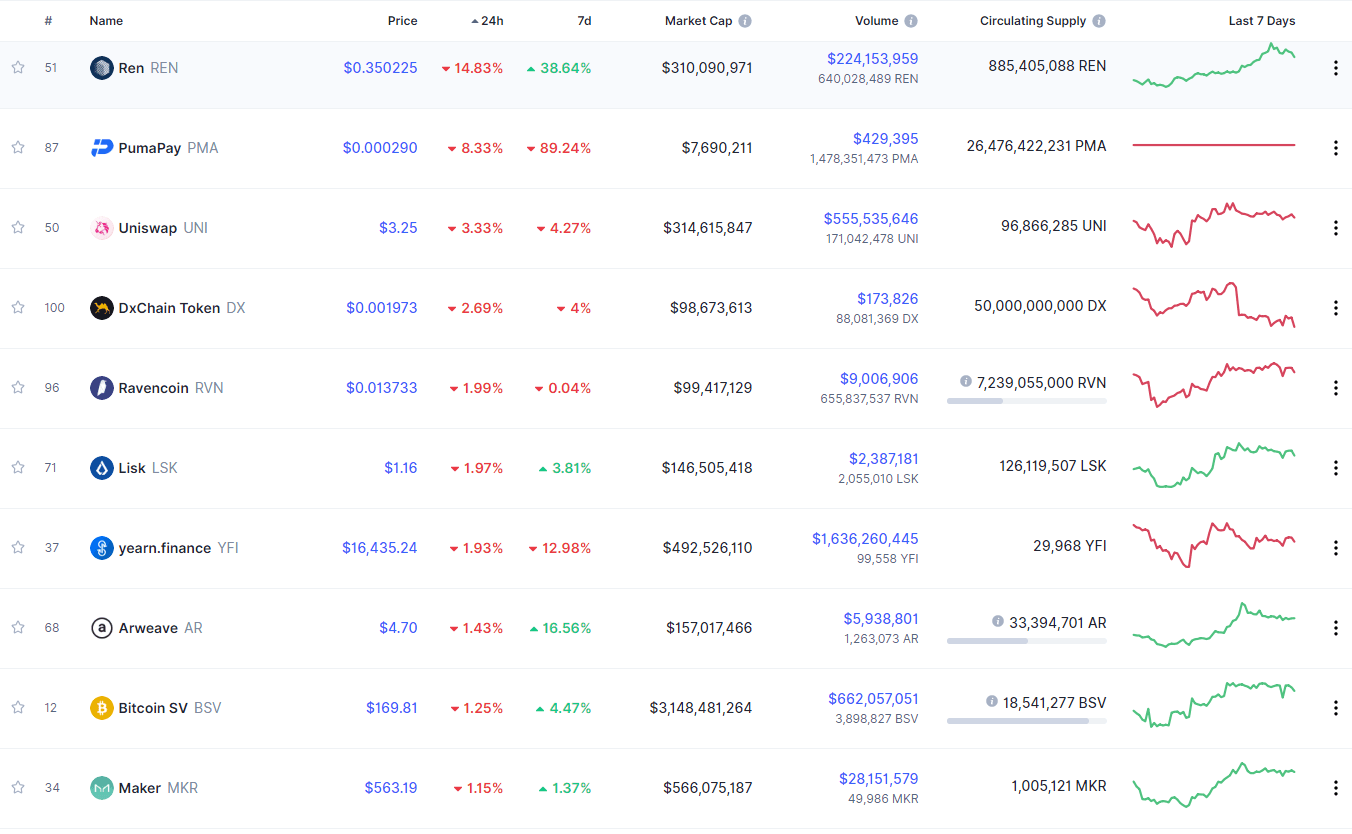
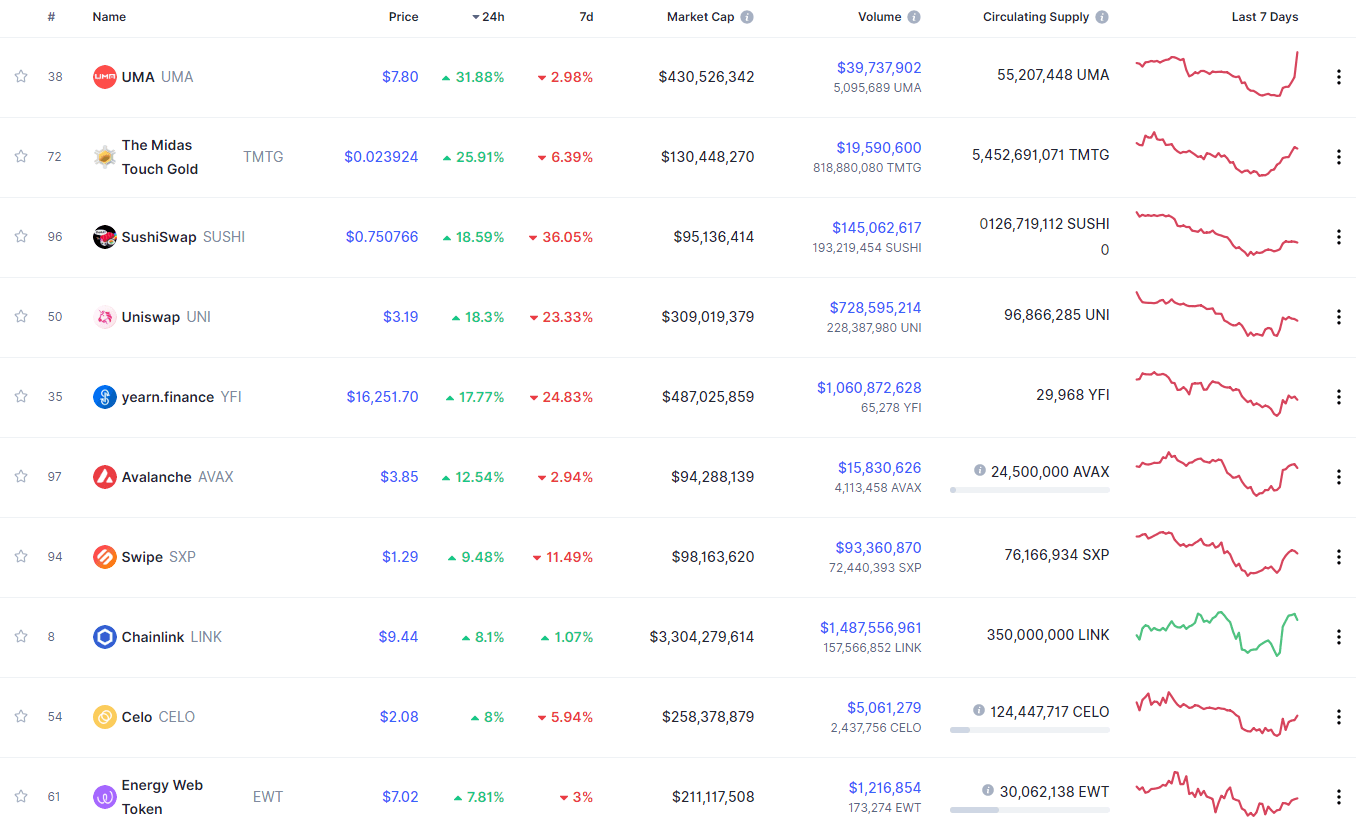
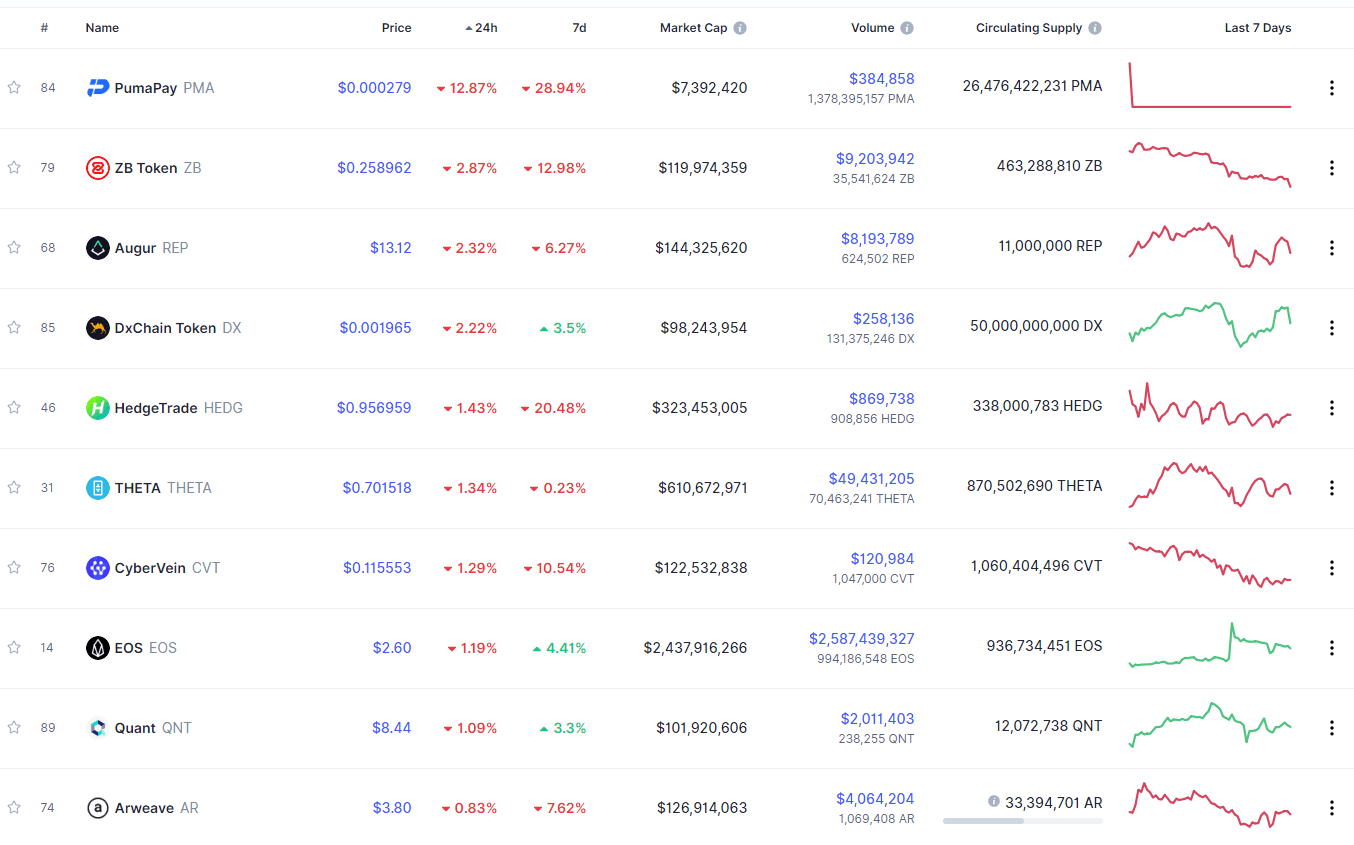
If we check out the top 100 cryptocurrencies, we can see that Reserve Rights gained 45.36% in the past 24 hours, making it the top daily gainer. Litecoin (16.03%) and Ampleforth (14.02%) also did great. On the other hand, ABBC Coin lost 18.97%, making it the most prominent daily loser. It is followed by Filecoin’s loss of 14.56% and The Midas Touch Gold’s loss of 7.03%.

Top 10 24-hour Performers (Click to enlarge)

Bottom 10 24-hour Performers (Click to enlarge)

Bitcoin’s market dominance level had increased slightly since when we last reported, with its value is currently 61.2%. This value represents a 0.7% difference to the upside when compared to when we last reported.

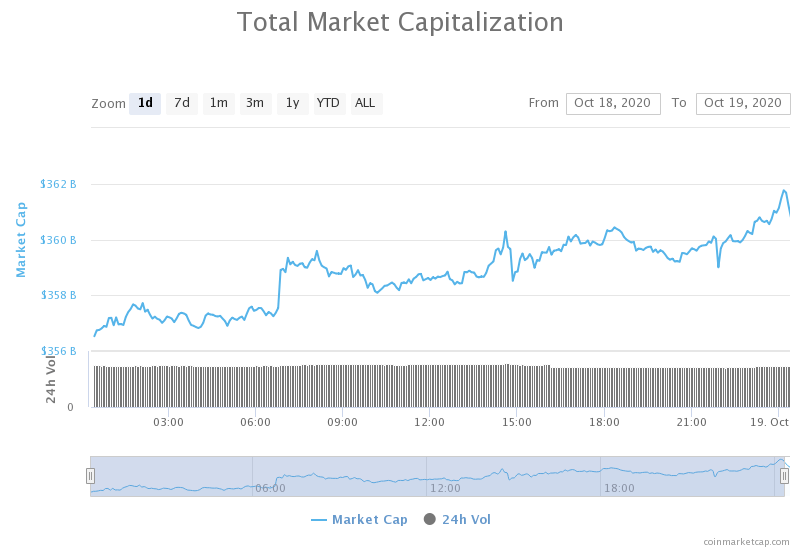
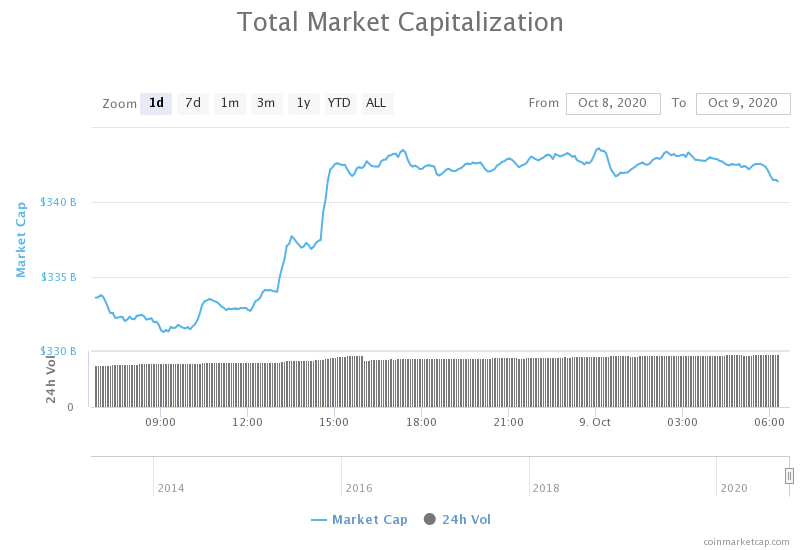
Daily Crypto Market Cap Chart

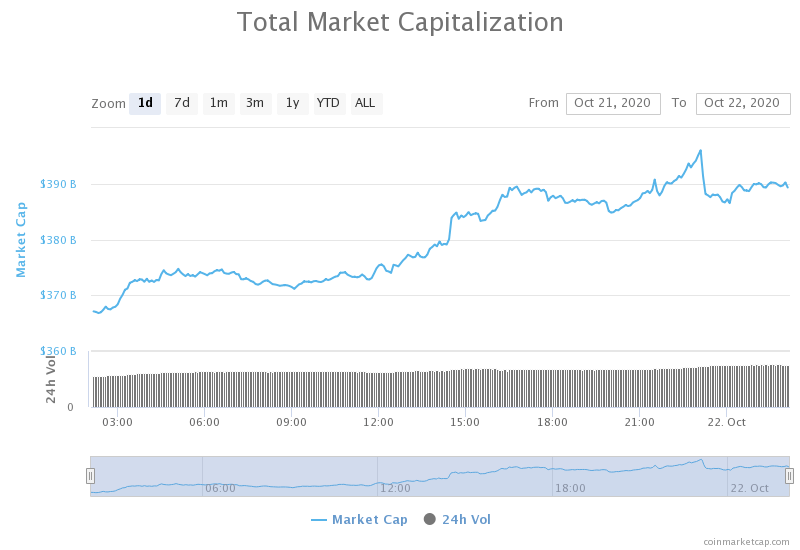
The crypto sector capitalization has experienced a huge increase since we last reported. Its current value is $390.24 billion, representing an increase of $23.98 billion compared to our previous report.

_______________________________________________________________________

What happened in the past 24 hours?

_______________________________________________________________________

_______________________________________________________________________

Technical analysis

_______________________________________________________________________

Bitcoin

The largest cryptocurrency by market capitalization has had quite an amazing day filled with volatility and extremely high bull presence. Fueled by PayPal’s announcement that it will enable its users to buy,  sell and hold crypto,  Bitcoin skyrocketed and reached as high as $13,235 before pulling back. It’s currently trying to consolidate just under the $12,870 resistance level.

Any skepticism regarding whether the bull market has started has been shattered with Bitcoin’s most recent move. However, while this move was intense, Bitcoin will need a lot of great news, adoption, and ultimately time to reach its all-time highs.

At the moment, traders should look at how Bitcoin handles the pullback and trade-off of that.


BTC/USD 1-day Chart

Bitcoin’s technical overview is very strongly tilted towards the buy-side on longer time-frames (weekly and monthly), while its short-term overviews are slightly more neutral.

BTC/USD 1-day Technicals

Technical factors (4-hour Chart):
  • Price is far above its 50-period EMA and at its 21-period EMA
  • Price above its top Bollinger band
  • RSI is extremely overbought (81.74)
  • Volume is extremely elevated
Key levels to the upside          Key levels to the downside

1: $12,870                                 1: $12,500

2: $13,200                                 2: $12,300

3: $14,000                                  3: $12,000

Ethereum

Ethereum has followed Bitcoin’s lead and pushed towards the upside, though with much less strength. Its price ultimately reached the $400 resistance before pulling back slightly. It is currently trying to consolidate right under the $400 level, which is still a great increase in price since yesterday when Ether was fighting to stay above $378.

Ethereum traders should pay attention to how the second-largest cryptocurrency by market cap handles its immediate resistance level, as well as an eventual further pullback.

ETH/USD 4-hour Chart

Ethereum’s technicals on all time-frames show bullishness, with its 4-hour and long-term technicals being a bit more tilted towards the neutral position, while its 1-day overview is completely bullish.

ETH/USD 1-day Technicals

Technical Factors (4-hour Chart):
  • The price is far above its 50-period and its 21-period EMA
  • Price is at the top Bollinger band
  • RSI is close to overbought (66.91)
  • Volume is elevated
Key levels to the upside          Key levels to the downside

1: $400                                     1: $378

2: $415                                     2: $371

3: $420                                      3: $360

Ripple

The fourth-largest cryptocurrency by market cap has, like yesterday, used the momentum that Bitcoin has provided to push further up. Its price has established itself above the $0.2454 support level and pushed past $0.25. However, the $0.26 resistance level has not fallen, and XRP is now consolidating at the ~$0.255 level.

XRP’s upside is a zone of strong resistance, which this cryptocurrency will hardly surpass without Bitcoin’s push. XRP traders should pay attention to Bitcoin’s moves while focusing on XRP’s moves towards the downside.

XRP/USD 4-hour Chart

XRP’s technicals have changed quite a bit since our last report. Its 4-hour, 1-day, and weekly overviews are strongly tilted towards the buy-side, while its monthly overview is still bearish with a slight hint of neutrality.

XRP/USD 1-day Technicals

Technical factors (4-hour Chart):
  • The price far above its 50-period EMA and above its 21-period EMA
  • Price is at its top Bollinger band
  • RSI is close to overbought (65.61)
  • Volume is below average
Key levels to the upside          Key levels to the downside

1: $0.26                                     1: $0.2454

2: $0.266                                   2: $0.235

3: $0.2855                                3: $0.227


Categories
Forex Course

155. Getting Started With Forex Fundamental Analysis

Introduction

Fundamental analysis and technical analysis are an essential part of Forex trading. A Forex trader cannot be a profitable trader unless he knows this analysis. Fundamental analysis provides a logical reason for the upcoming movement of a currency pair based on economic releases. Traders evaluate these releases to determine the exact movement of a currency pair.

What is Fundamental Analysis?

According to finance and accounting, Fundamental analysis is the process of analyzing the business’s financial statement, including the competitor and market analysis. Moreover, it considers the core feature of a country’s macroeconomic factor, including the interest rate, inflation, GDP, manufacturing index, export, import, etc.

However, in forex trading, the fundamental analysis focuses on macro-economic factors mostly. The currency pair in a forex market represents the economy of two separate countries. In fundamental analysis, traders usually focus on major economic events and releases and their impact on a currency pair. Moreover, most professional traders consider both technical and fundamental analysis to get the best output from the market.

Elements of Fundamental Analysis

The fundamental analysis has two major elements- the fundamental releases and the fundamental events.

The Fundamental Releases

Fundamental releases are economic news of releases of a country that is published at regular intervals. Among the fundamental releases, the primary 4 economic releases are most important as it creates an immediate impact on a currency pair. Let’s have a look at four major economic releases:

  • Interest rate: The interest rate is how much we have to pay to the central bank if we take any loan. Central banks raise the interest rate if the economic condition is excellent. On the other hand, the central bank reduces interest rates if the economic condition is terrible.

Image Source: https://www.ecb.europa.eu/

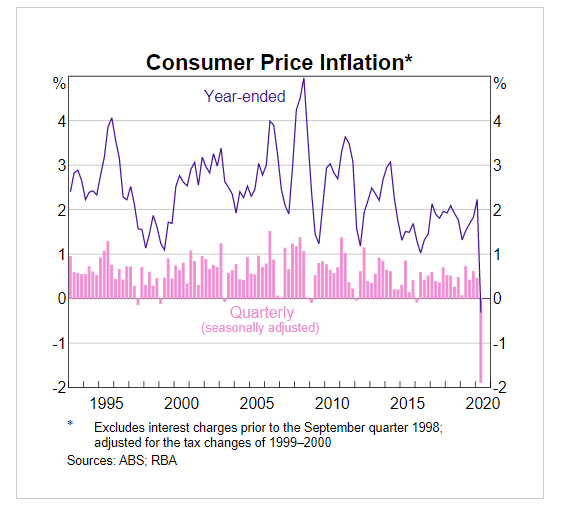
  • Inflation Rate: Inflation is the buying power of the money. The increase in inflation indicates a rise in the consumer product’s price that reduces the buying power of money. Any increase in the inflation rate is terrible for the economy.

Image Source: RBA

  • Gross Domestic Product: Gross Domestic Product or GDP refers to the country’s products and services’ total value. Any increase in GDP is positive for a particular currency.
  • Employment: The number of employed and unemployed persons for a country works as a crucial fundamental indicator. Any decrease in employment is bad for the economy, and any increase in employment is reasonable.

Image source: https://www.bankofcanada.ca/

Fundamental Events

Besides fundamental releases, some essential fundamental events put a significant impact on a currency pair as mentioned below:

  • Central Bank Meeting: Central of a country meets once a quarter and discusses its economic condition. Any dovish tone negatively impacts the currency, while a hawkish tone creates a positive impact.
  • Geopolitical Events: There is some condition when one country meets another country to discuss the trade deal or conflict. Any positive news from a country’s geopolitical event may create a bullish momentum of the country’s currency.

In fundamental analysis, traders usually evaluate these releases and events to measure the strength and weaknesses of a currency pair.

Conclusion 

Traders usually gather recent economic releases and compare the result with the previous result. Any better than expected result indicates a buying opportunity on a particular currency. On the other hand, traders often evaluate fundamental releases to measure the volatility of a currency pair.

[wp_quiz id=”86400″]
Categories
Crypto Videos

Forex & The Brexit Conundrum!

The Brexit Conundrum


Thank you for joining this forex academy educational video.

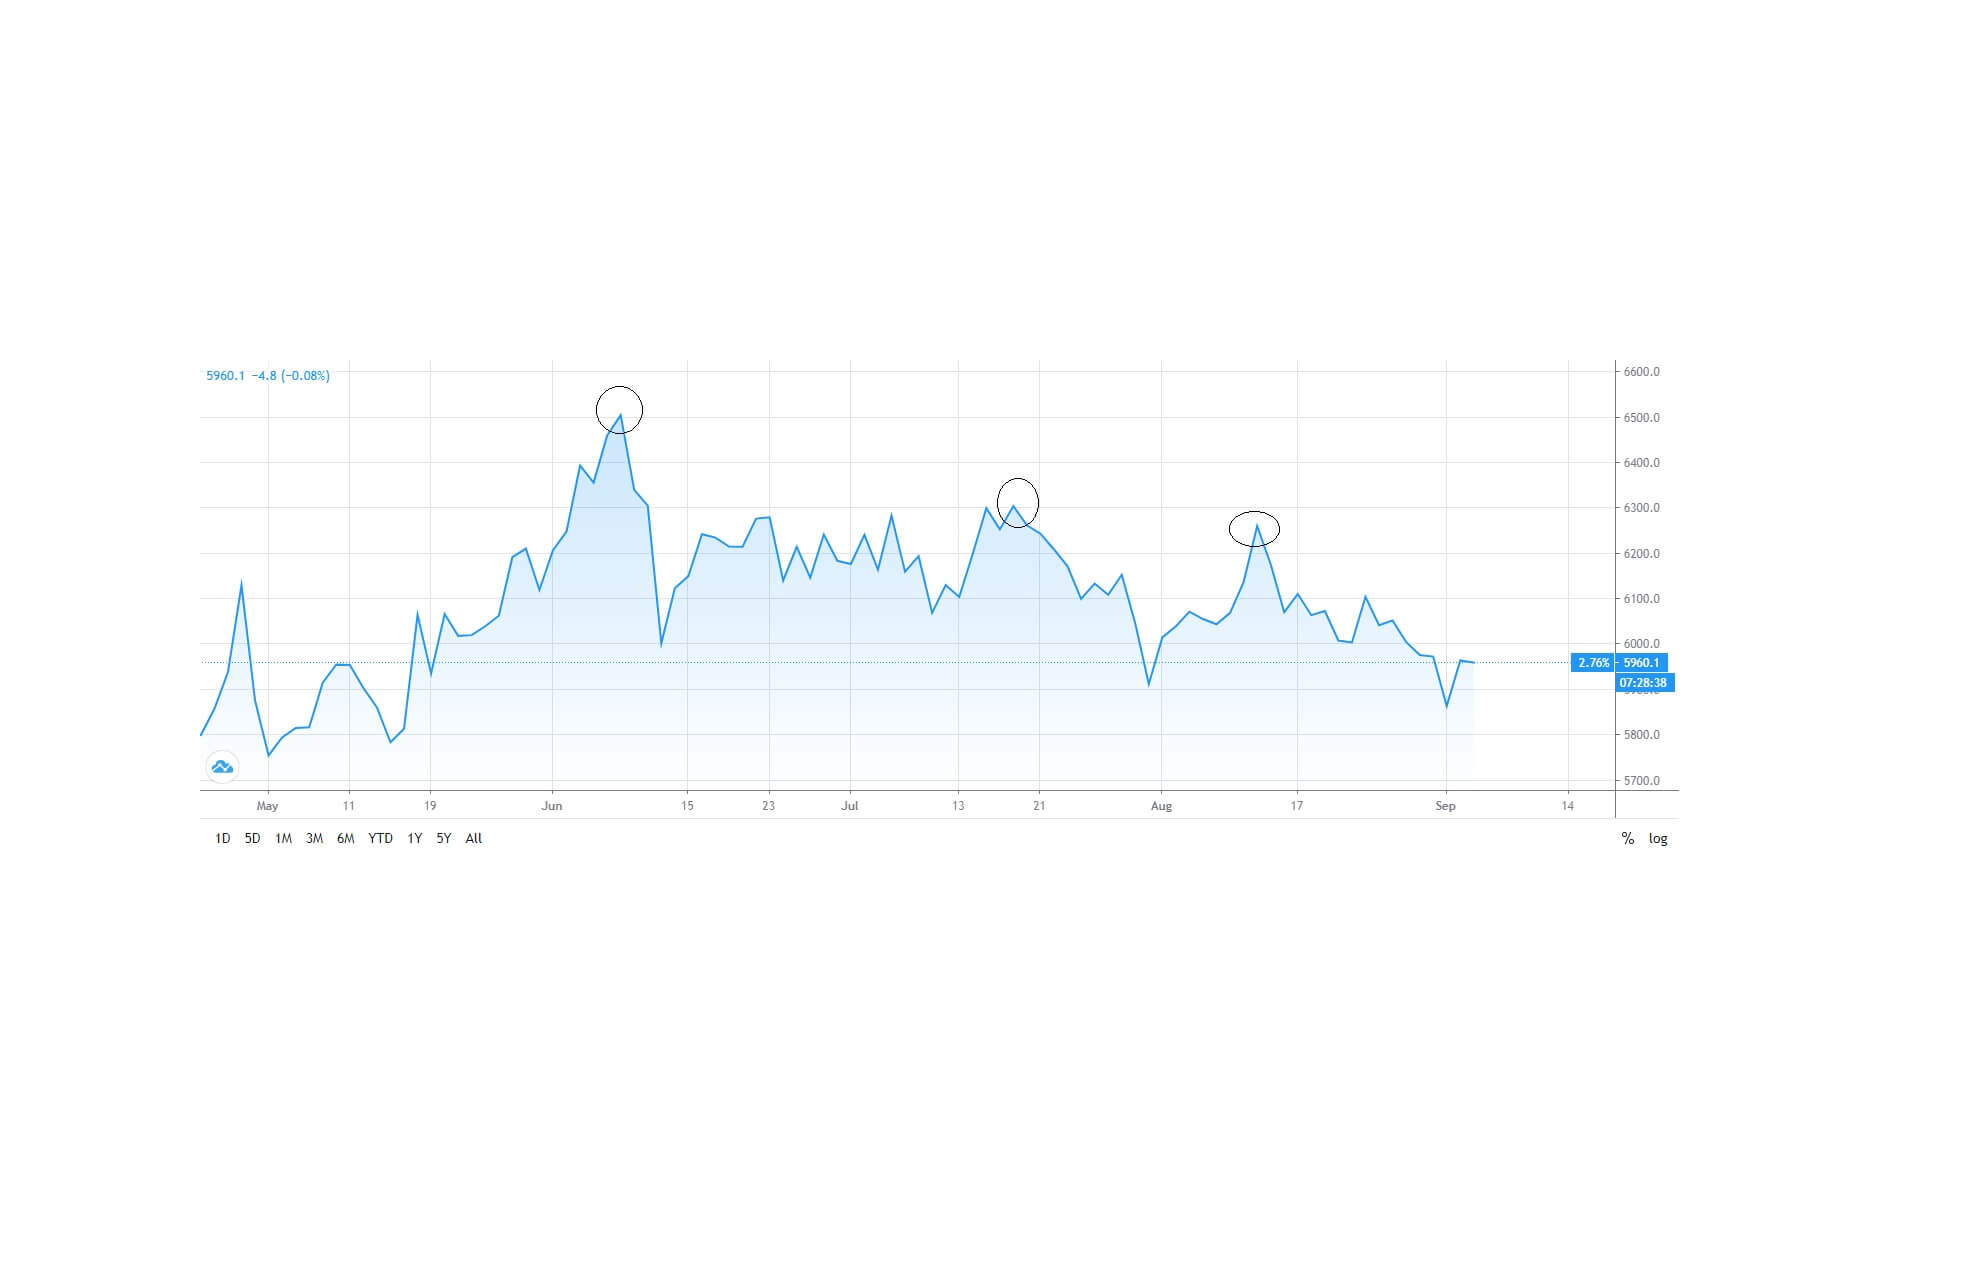
In this session, we will be looking at the Brexit situation and how it is unfolding, and the disparity between the British pound and the FTSE 100 index.
Here is the FTSE 100 index and where we can see 3 peaks that are falling, from a high of 6,500 to the current level, at the time of writing, at 5,960: a gradual trend lower since June 2020

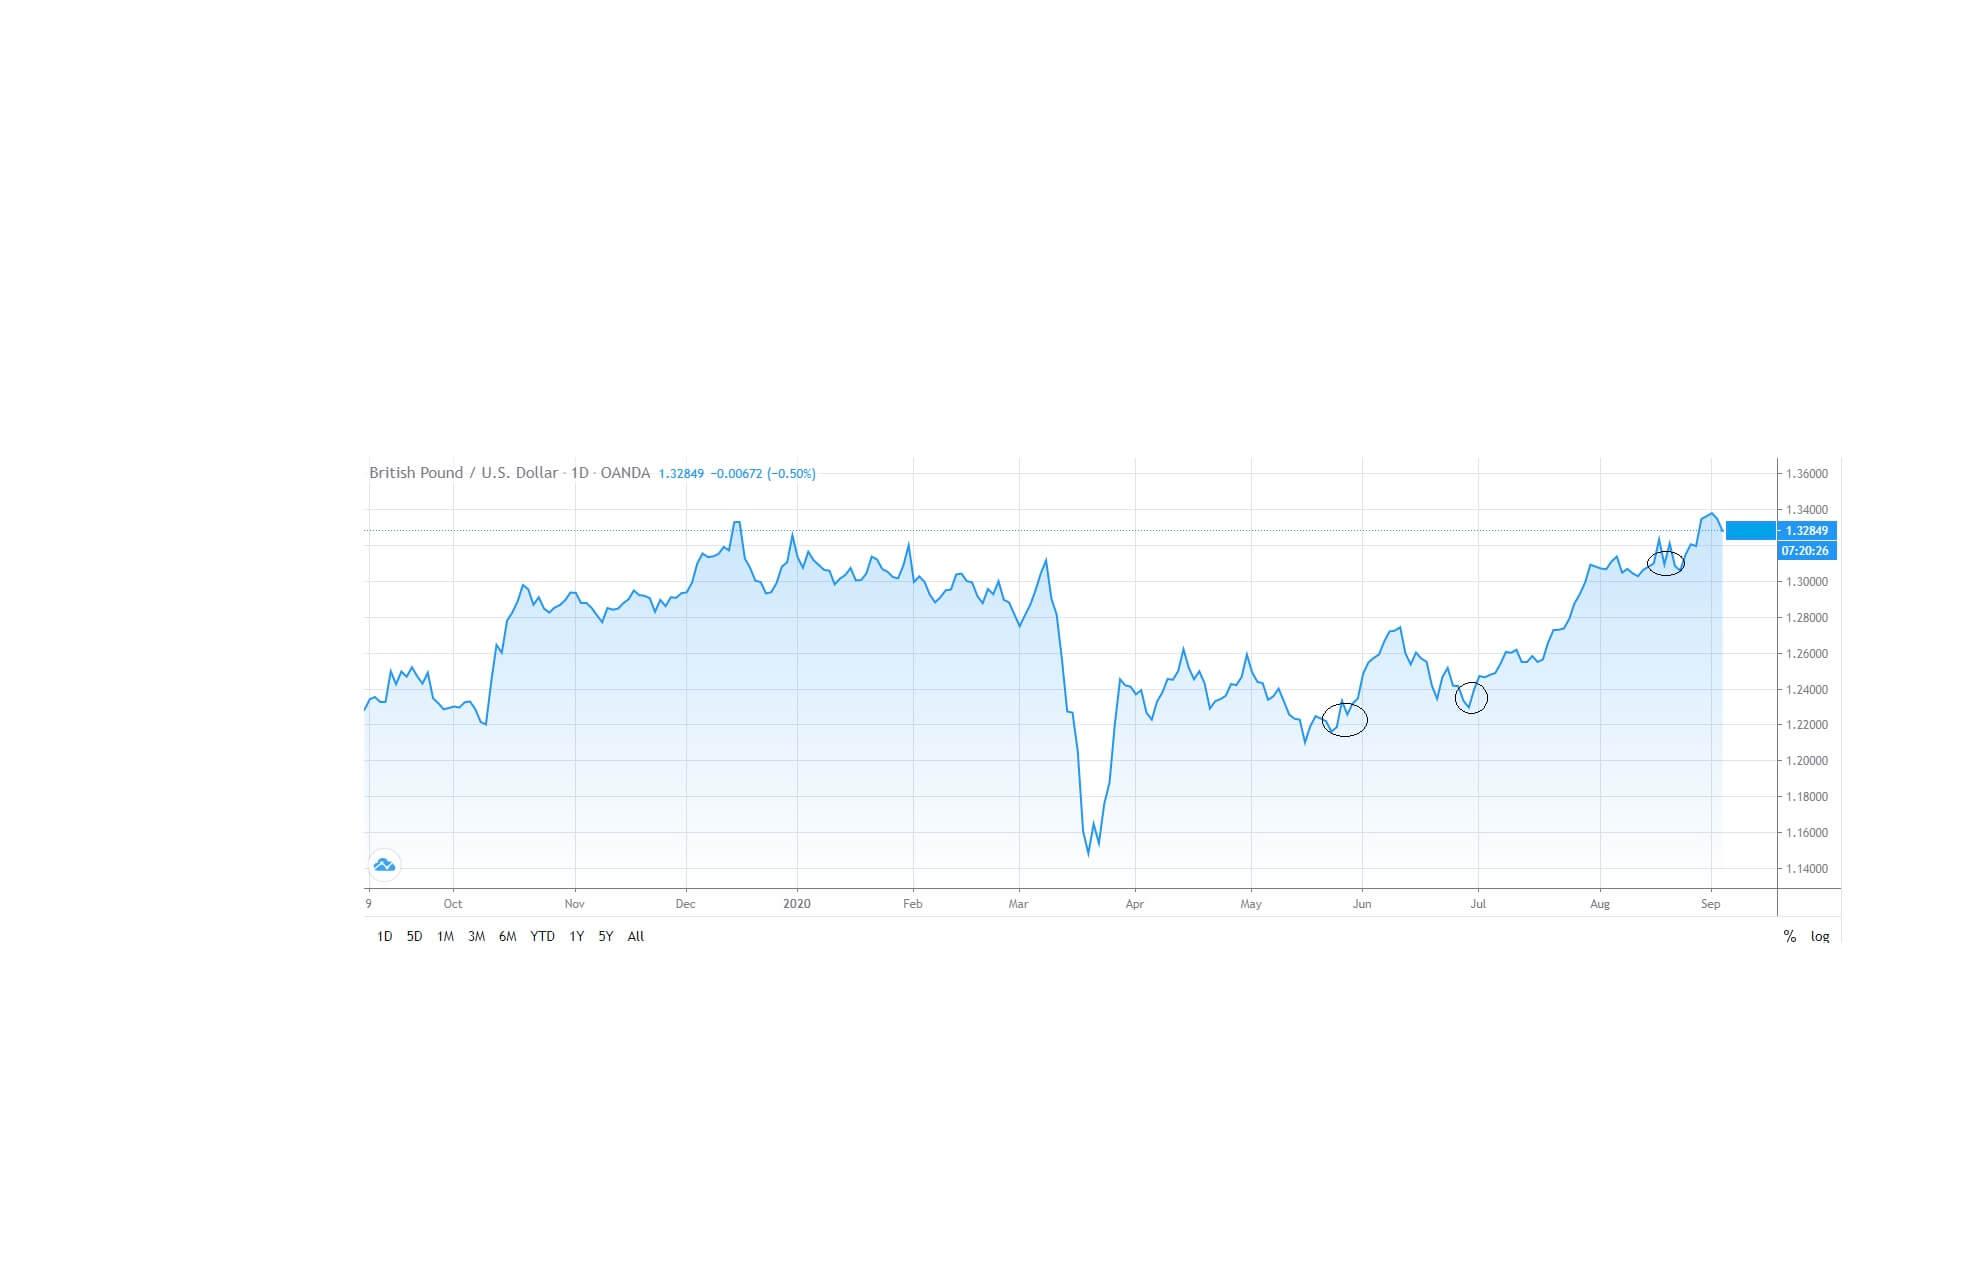
Here is a chart of the British pound against the United States dollar and where we can see during the same time period the pound has been extremely bullish against the dollar from 1.2200 to up to a peak of 1.3400 to its current trading range at 1,3284 at the time of writing.
This tells us a story that the pound is bullish, and this is largely due to US dollar weakness and where traders have been riding the wave upwards, following the trend, in a which has been fairly typical where US dollar weakness has been seen across the board and particularly with the other major currencies. So, we have bad continuing economics from the USA and bad US dollar sentiment.

However, if we revert back to our ftse100 chart, the same sentiments cannot be applied to the British economy, and this is typical because of one reason: fund managers do not act out of sentiment in the same way as currency traders so. Fund managers will typically take a more long-term view, and this, of course, must factor in the Brexit situation. And herein lies our conundrum: one set of traders is buying the pounds, and another set is selling UK equities, and mostly because of the risk of no trade agreement being reached between the European Union and British governments regarding a future trade deal. This has largely been put down to the European Union wanting more leeway regarding fisheries and European fishing vessels being allowed to fish in British waters and also so with regard to standards being maintained across the board between Britain and Europe within the financial services sector and other areas such as food. Both sides have red lines, which neither are prepared to budge from and where there seems to be a breakdown in the negotiations with Michel Barnier and his British government counterpart, David Frost.
Time is of the essence, and it is said that a deal must be reached by the end of October in order for the future trading relationships, including zero tariffs on either side, being implemented. Should an agreement not be reached, Britain will be left to trade outside of Europe on world trading organisation rules, which are not as favourable to Britain as they would be with no tariff arrangement with Europe.

Michel Barnier has made it clear that unless standards are unified across the board, and the UK are willing to move their red lines on fisheries, it could cause trading problems and frictions, even where buy British lorry drivers might not be allowed to pass through Europe.

So, where does this leave things? Pretty much hanging in the air. The strength of the pound belies the uncertainties regarding the future arrangements with the European Union. Both sides are up against it in terms of time, and if neither side will budge, there is a distinct possibility of a no-deal trade arrangement between the two nations.
And so what might we expect? If it comes down to the 11th hour, so to speak, and there is absolutely no trade agreement between Great Britain and the European, the party might be over for the British pound, which could suffer to the downside against counter currencies.
We might also see a further sell-off on the FTSE 100. AS time gets closer, it will be wise for traders to be extremely cautious while trading both of these assets. Incorporate tight stop losses and reduced leverage.

Categories
Crypto Market Analysis

Daily Crypto Review, Oct 21 – Bitcoin Above $12,000; Bull Market in Full Swing

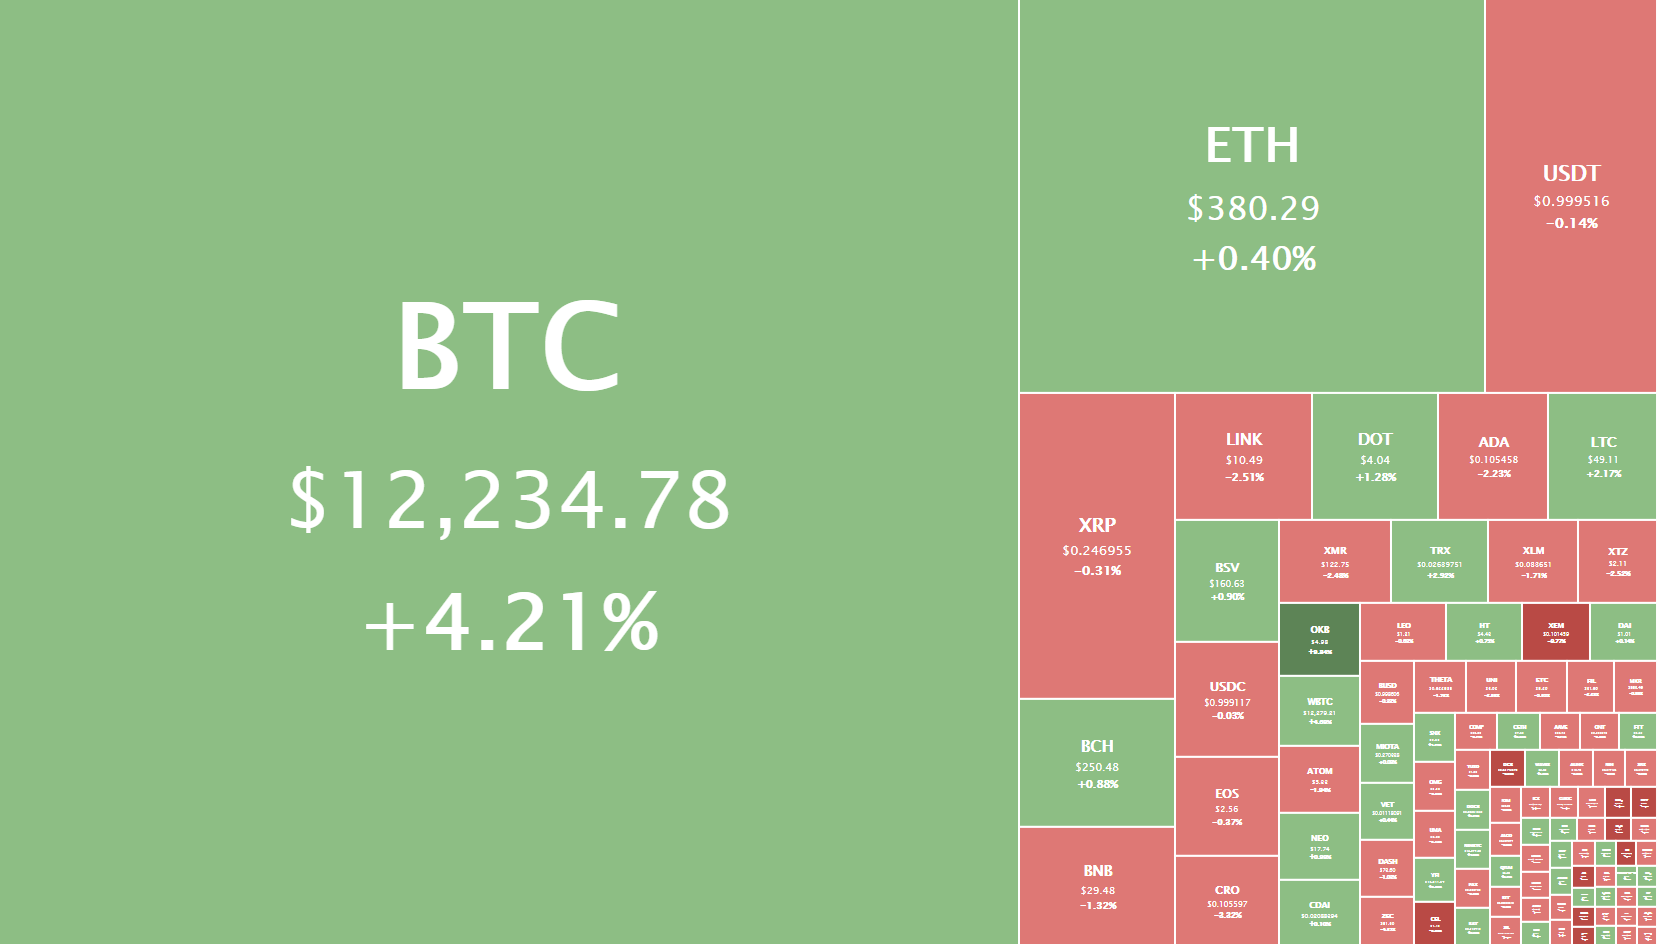
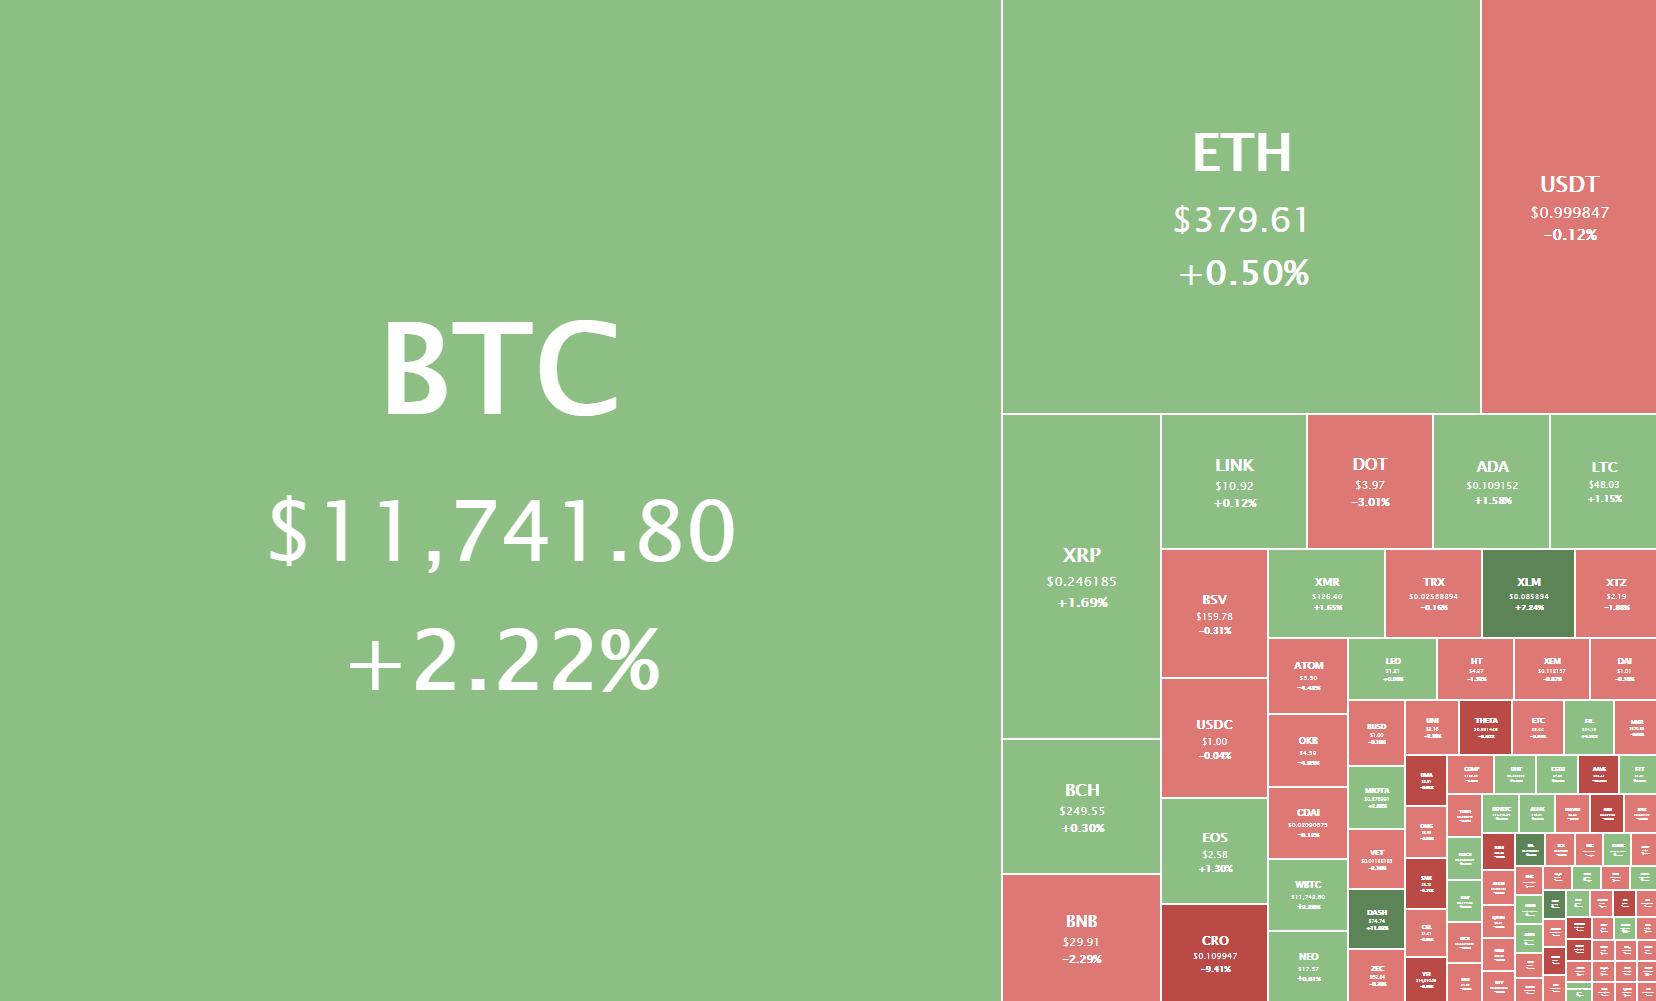
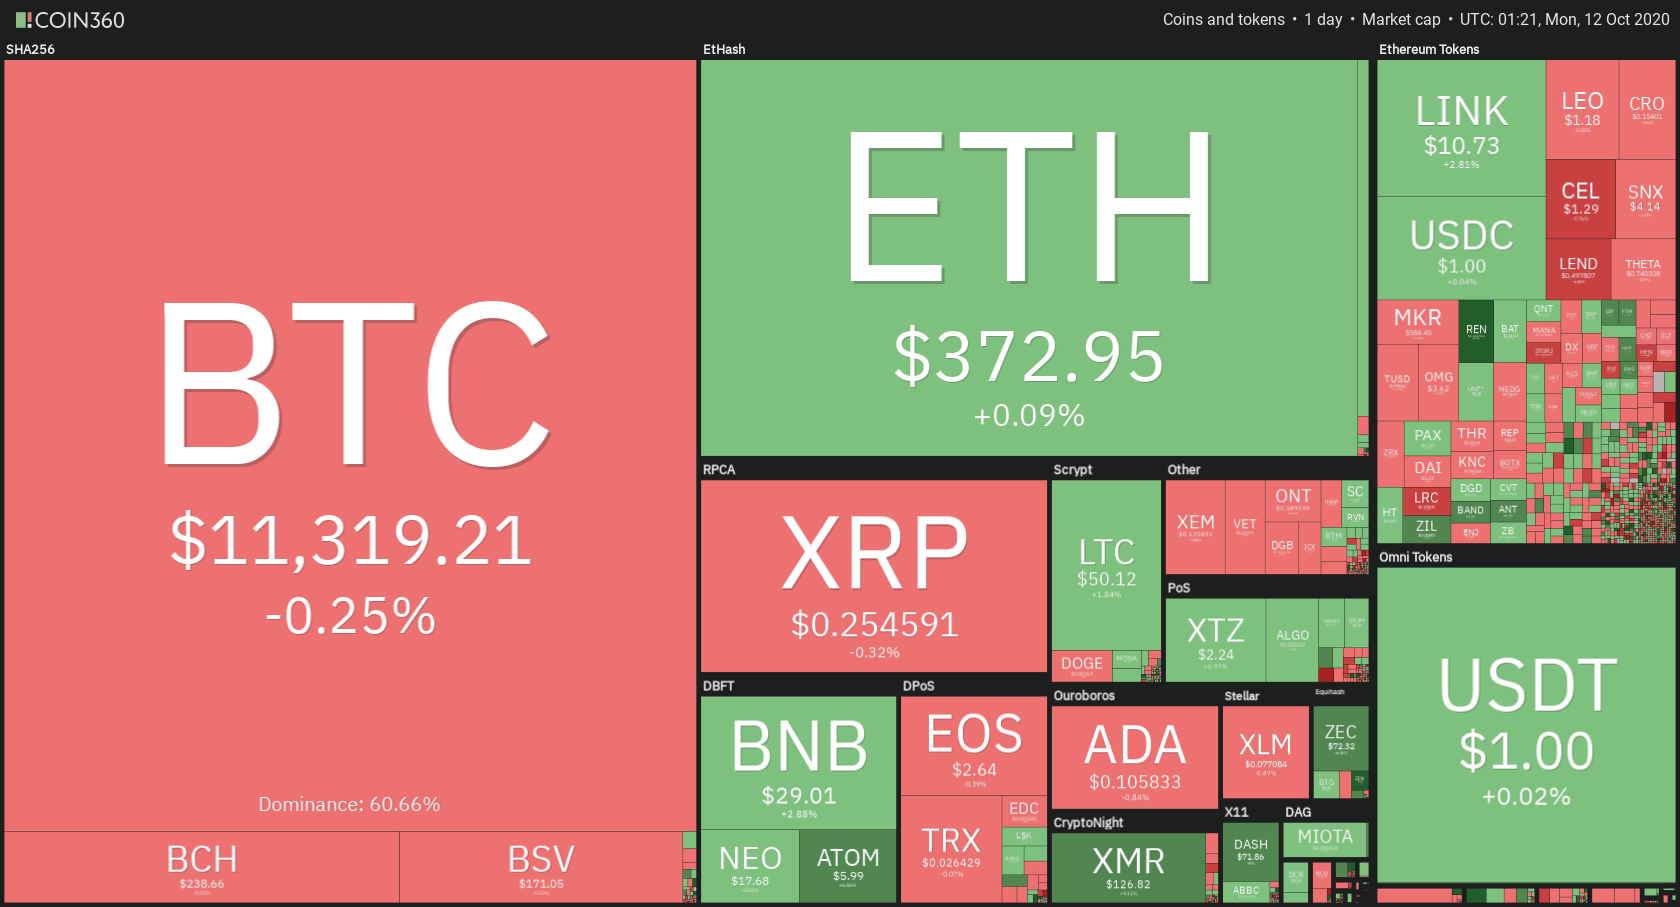
The cryptocurrency sector was mostly in the red until Bitcoin took the day to push past $12,000, after which some cryptos started following it towards the upside. Bitcoin is currently trading for $12.234, representing an increase of 4.21% on the day. Meanwhile, Ethereum gained 0.40% on the day, while XRP lost 0.31%.

 Daily Crypto Sector Heat Map

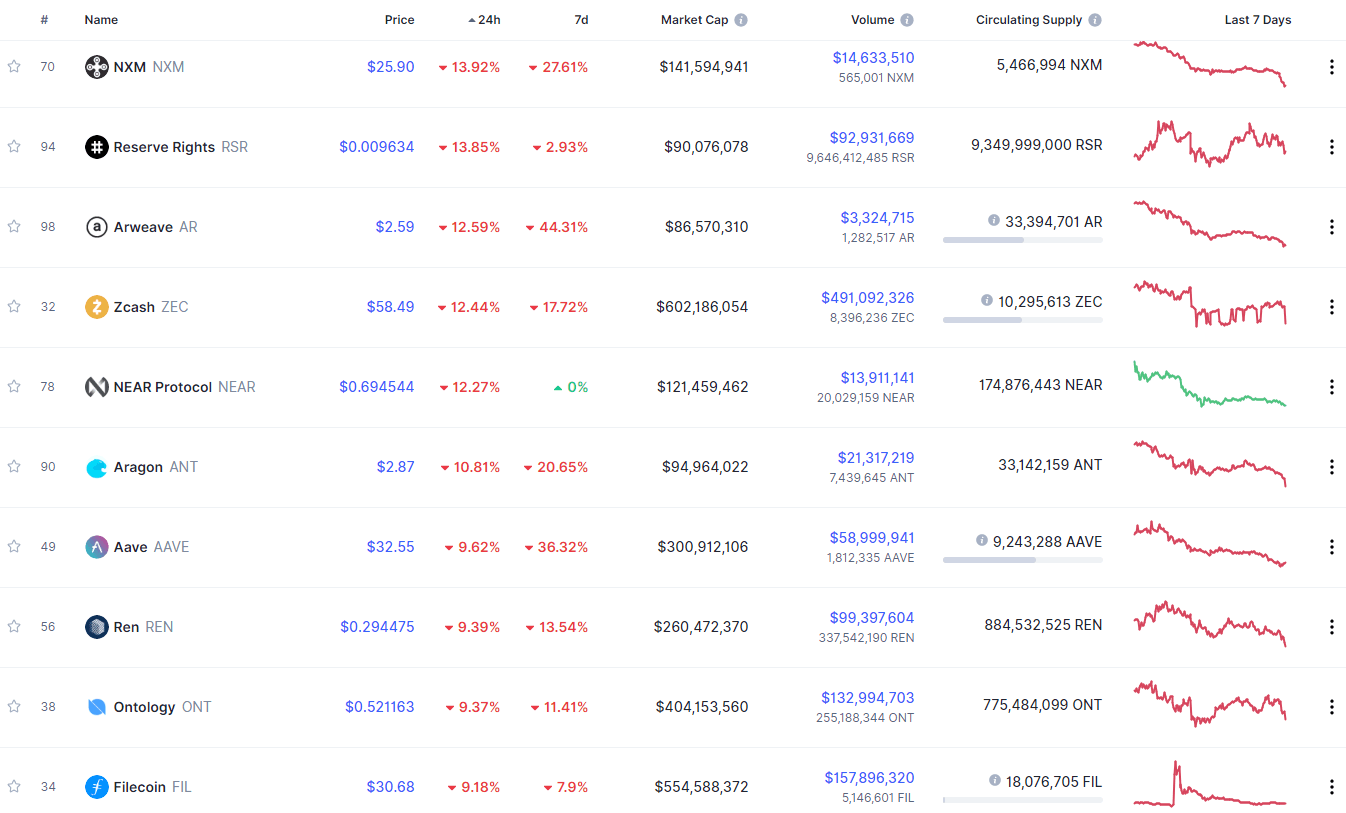
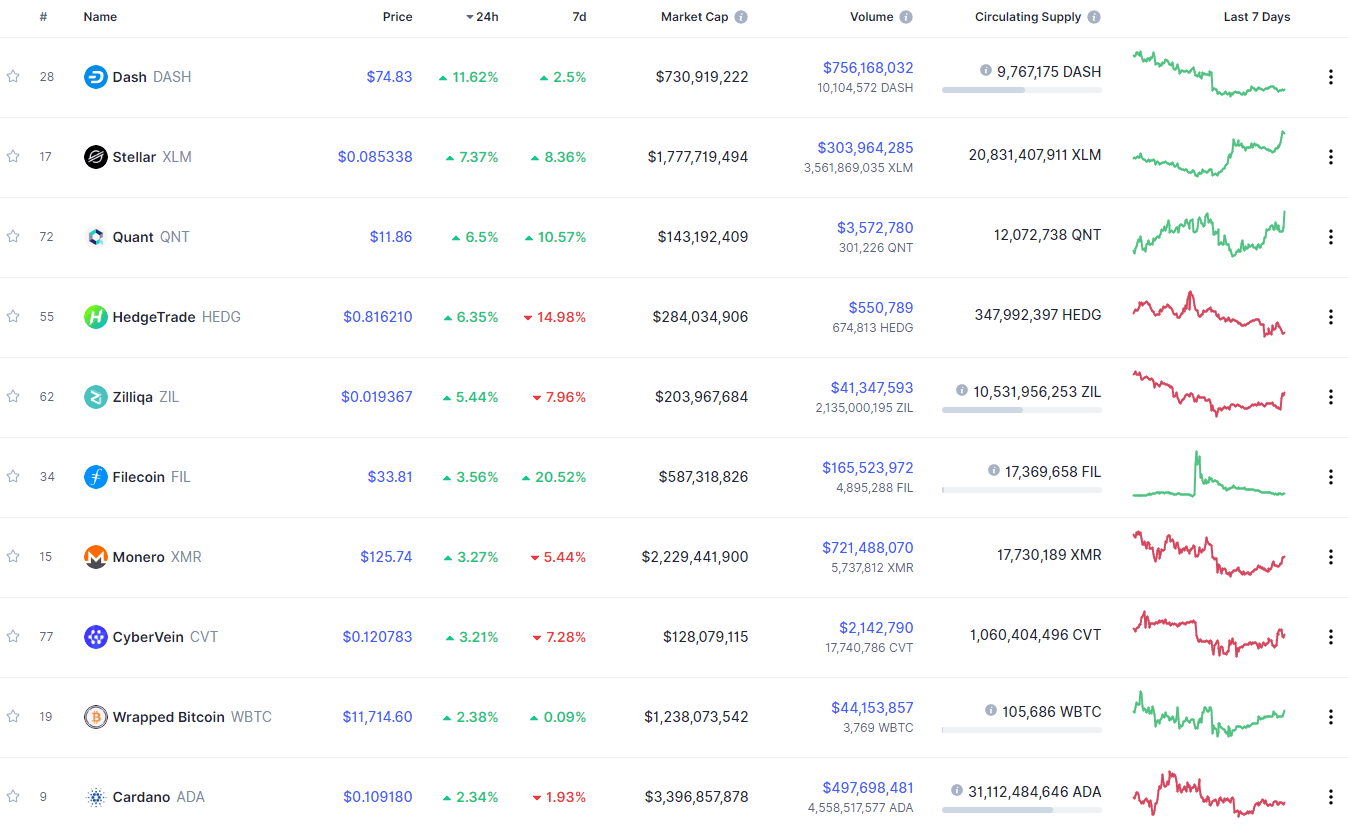
If we look at the top 100 cryptocurrencies, we can see that Nano gained 6.94% in the past 24 hours, making it the top daily gainer. Aave (5.59%) and OKB (5.41%) also did great. On the other hand, NXM lost 13.92%, making it the most prominent daily loser. It is followed by Reserve Rights’ loss of 13.85% and Arweave’s loss of 12.59%.

Top 10 24-hour Performers (Click to enlarge)

Bottom 10 24-hour Performers (Click to enlarge)

Bitcoin’s market dominance level has increased slightly since when we last reported, with its value is currently 60.5%. This value represents a 1% difference to the upside when compared to when we last reported.

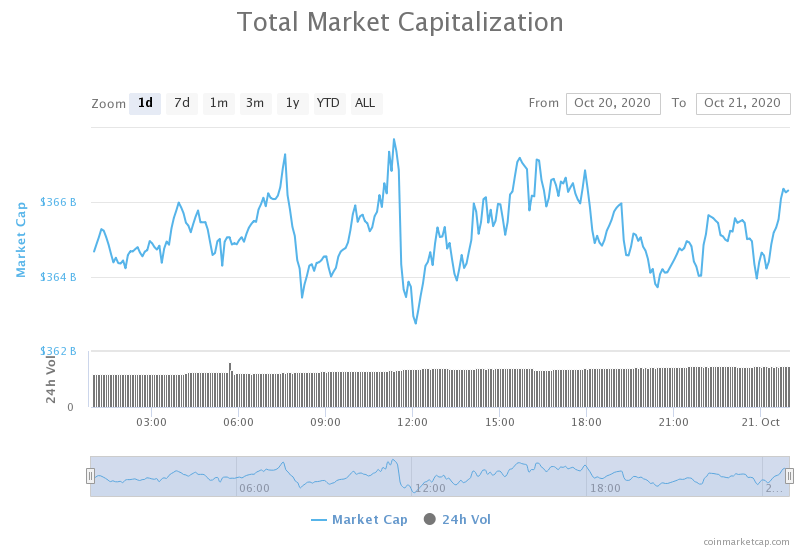
Daily Crypto Market Cap Chart

The crypto sector capitalization has stayed at the same spot since we last reported. Its current value is $366.26 billion, representing an increase of $0.79 billion compared to our previous report.

_______________________________________________________________________

What happened in the past 24 hours?

_______________________________________________________________________

_______________________________________________________________________

Technical analysis

_______________________________________________________________________

Bitcoin

The largest cryptocurrency by market capitalization is pushing past its psychological and actual major resistance of $12,000 right at this moment. The move started slow, with one candle testing the waters above $12,000 before backing out, before bulls went head-on and pushed the move quickly to far above this level. At the moment, Bitcoin has stopped its push at just above $12,250.

Traders should pay attention to hot Bitcoin finishes this move and trade either the pullback or the next wave up.

BTC/USD 1-day Chart

Bitcoin’s technical overview is strongly tilted towards the buy-side, with lower time-frames showing some signs of neutrality, while longer time-frames are completely bullish.

BTC/USD 1-day Technicals

Technical factors (4-hour Chart):
  • Price is far above its 50-period EMA and at its 21-period EMA
  • Price above its top Bollinger band
  • RSI is extremely overbought (80.30)
  • Volume is elevated
Key levels to the upside          Key levels to the downside

1: $12,330                                 1: $12,000

2: $12,500                                 2: $11,850

3: $12,870                                  3: $11,735

Ethereum

Ethereum’s price was pretty much stagnant until Bitcoin broke $12,000, which is when the second-largest cryptocurrency by market cap started pushing up as well. The price has slowly pushed past $371 and then explosively past $378, which is where it is at the moment.

Traders should pay attention to how ETH tries to establish itself above $378, and trade off of it.

ETH/USD 4-hour Chart

Ethereum’s 4-hour technicals are showing a tilt towards the sell-side, while its 1-day overview is still bullish. When taking a look at its longer time-frames, we can see heavy neutrality, but still overall bulishness.

ETH/USD 1-day Technicals

Technical Factors (4-hour Chart):
  • The price is above its 50-period and its 21-period EMA
  • Price is near the top Bollinger band
  • RSI is neutral (56.02)
  • Volume is elevated
Key levels to the upside          Key levels to the downside

1: $400                                     1: $378

2: $415                                     2: $371

3: $420                                      3: $360

Ripple

The fourth-largest cryptocurrency by market cap used the momentum Bitcoin’s move has created to push past its $0.2454 resistance once again after falling below it the day before. While this is a great thing, XRP couldn’t pass its previous resistance level of $0.25, which caused it to retest the support level. If it drops below $0.2454 again, bears may gather in a larger number and XRP might push down towards $0.235

XRP/USD 4-hour Chart

XRP’s technicals are quite mixed up, with its 4-hour and weekly overviews showing signs of bullish sentiment, while its daily and monthly overviews are tilted towards the sell-side.

XRP/USD 1-day Technicals

Technical factors (4-hour Chart):
  • The price is at its 50-period EMA and above its21-period EMA
  • Price is near its top Bollinger band
  • RSI is neutral (53.64)
  • Volume is below average
Key levels to the upside          Key levels to the downside

1: $0.26                                     1: $0.2454

2: $0.266                                   2: $0.235

3: $0.2855                                3: $0.227


Categories
Forex Market Analysis

Daily F.X. Analysis, October 21 – Top Trade Setups In Forex – U.K., U.S., Canada Events in Highlights! 

On the news front, the economic calendar is filled with a series of fundamentals from the U.K. and Canada, focusing on the U.S. Inflation data. The U.K. Inflation data is due during the European session, and economists expect a slight improvement in the U.K. CPI figures from 0.2% to 0.4%, while core CPI is likely to surge to 0.4% from 0.2%, and it may underpin the Cable pair today. On the other hand, the Canadian inflation report is also expected to perform slightly better today to support the Canadian dollar demand. 

Economic Events to Watch Today  


EUR/USD – Daily Analysis

The EUR/USD pair was closed at 1.8221 after placing a high of 1.18406 and a low of 1.17598. Overall the movement of the EUR/USD pair remained bullish throughout the day. The EUR/USD rose for the 3rd consecutive day and extended its previous day’s gains to reach its highest since September 21. On Tuesday, the EUR/USD pair’s upward momentum was supported by a weaker U.S. dollar across the board.

The U.S. Dollar Index was down by 0.45% at 93.0, the lowest October level, however, the Dow Jones gains 0l68%, and the NASDAQ rose by 0.30%. On Tuesday, the greenback remained weak against all of its rivals as the investors look for the results in negotiations for a new round of fiscal stimulus in the U.S.

The EUR/USD pair rose more than 0.5% on Tuesday above the 1.18400 level for the first time in October as the market mood improved. EUR/USD pair followed the lockdown on Brexit talks, coronavirus spread in Europe, and France is reporting the record-high number of people hospitalized with Ireland introducing tough restrictions.

On the data front, the German PPI for September raised to 0.4% from the forecasted 0.1% and supported the single currency. At 13:00 GMT, the Current Account from Eurozone also raised to 19.9B against the forecasted 17.2B and supported EUR/USD pair’s bullish move.

At 17:30 GMT, the Building Permits raised to 1.55M from the expected 1.52M and supported the U.S. dollar on the U.S. front. The Housing Starts from the U.S. declined to 1.42M against the forecasted 1.45M and weighed on the U.S. dollar that ultimately added strength to EUR/USD pair on Tuesday. Furthermore, the improved risk sentiment after the reviving hopes for additional U.S. fiscal stimulus and expectations of a COVID-19 vaccine by the end of this year boosted investors’ confidence. The risk-on flow smashed the greenback’s relative safe-haven status and was seen as a key factor driving the currency pair higher.

The U.S. House Speaker Nancy Pelosi said on Sunday that legislation on a wide-range of coronavirus relief packages could be pushed through before the election on November 3. Whereas, the investors remained unconvinced that a deal could be reached with Republicans before the self-imposed deadline by Pelosi.

Traders were also concerned about the rising number of coronavirus cases in Europe that could lead to fresh lockdown measures and dent global economic recovery. This, in turn, raised the U.S. dollar demand due to its safe-haven status and capped further upside momentum for EUR/USD pair.

Looking forward, the market participants will await the release of German PPI for September on Wednesday for finding fresh clues about the EUR/USD pair’s movements.

Daily Technical Levels

Support Resistance

1.1773     1.1854

1.1725     1.1889

1.1691     1.1936

Pivot point: 1.1807

EUR/USD– Trading Tip

The EUR/USD is trading sharply bullish amid a weaker U.S. dollar at 1.1848 level, and continuation of a bullish trend has formed three white soldiers on the 4-hour timeframe. That bullish setup may drive an upward movement until the 1.1870 mark and 1.1900 level. The MACD and RSI support the buying trend, and on the higher side, the EUR/USD may face resistance at 1.1870. Conversely, the bearish correction can also be seen until the 1.1831 level and 1.1807 mark. Above 1.1807, we can expect a continuation of a buying trade today. 


GBP/USD – Daily Analysis

The GBP/USD pair was closed at 1.29466 after placing a high of 1.29794 and a low of 1.29107. Overall the movement of the GBP/USD pair remained bullish throughout the day. The GBP/USD pair followed its previous daily trend and rose for the second consecutive day on Tuesday; however, the gains remain limited as the frozen Brexit talks overshadowed the U.S. dollar’s weakness. The parts of Britain went into lockdown to curb virus infections also weighed on the rising GBP/USD pair on Tuesday.

The Brexit trade deal’s trade talks were paused after a phone call between negotiators from both sides failed to make a breakthrough. The U.K. negotiator David Frost said that his call with E.U. counterpart Michel Barnier was constructive but in-person talks could not resume. He said that fundamental change in the E.U.’s approach was required before face-to-face talks should continue. At the same time, Barnier said that the E.U.’s door was open following the phone call. The Frenchman who had proposed intensified talks in London this week said that both sides should make the most out of the little time left as both sides sought an agreement to govern their trading relationship[ after the U.K.’s transition period in the E.U. ends in January 2021. Both sides are calling on the other to compromise ahead of the looming December deadline for a deal. The disagreement persists on key issues like fisheries, level playing field, and governance.

On Tuesday, the U.K. Prime Minister Boris Johnson reportedly told the Greek prime minister that Brexit talks would remain paused until the E.U. changes its stance on the negotiations. He also reaffirmed that the E.U. had effectively ended the negotiations by stating that they did not want to change their negotiating positions, so the E.U. should change their position, and then the U.K. would be willing to talk on a new basis.

Without a trade deal, the U.K. will trade on the terms of the World Trade Organization with the E.U. that will hurt both economies, particularly when some parts of Britain were under lockdown to control the rising infection cases. The PM Boris Johnson also confirmed that Great Manchester would be going into the highest lockdown level – Tier 3- from Friday. It came in because the U.K.’s coronavirus cases raised by 21,330 daily, its highest daily rise since June 5.

All these Brexit tensions and rising coronavirus cases, and the renewed lockdowns kept the GBP/USD pair’s additional gains under pressure on Tuesday. Whereas, the internal market of PM Boris Johnson that seeks to undermine parts of the Brexit withdrawal agreement was voted down in Parliament, and this supported the GBP/USD pair’s bullish trend on Tuesday.

There was no macroeconomic release from Britain’s side on the data front, and from the U.S., the Housing Starts were declined to 1.42M against the expected 1.45M and weighed on the U.S. dollar that ultimately added strength to GBP/USD pair.

Daily Technical Levels

Support Resistance

1.2910     1.2980

1.2875     1.3015

1.2841     1.3049

Pivot point: 1.2945

GBP/USD– Trading Tip

The GBP/USD surged sharply to trade at the 1.3006 mark, but soon it slipped again to trade at the 1.2939 level. The cable is currently gaining immediate support at the 1.2939 level, and a bearish breakout of the 1.2939 mark can lead to GBP/USD prices further lower towards the 1.2886 level. On the flip side, the resistance continues to hold around the 1.3006 level. The MACD and RSI show neutral bias as investors seem to wait for a solid reason to enter the market. 


USD/JPY – Daily Analysis

The USD/JPY pair was closed at 105.506 after placing a high of 105.745 and a low of 105.339. Overall the movement of the USD/JPY pair remained bullish throughout the day. The USD/JPY pair rose to its six-day highest level on Tuesday in the early trading session but started losing its intraday gains in the late session due to U.S. dollar weakness. The uncertainty surrounding the next round of the U.S. fiscal stimulus kept the U.S. dollar bulls defensive and the USD/JPY pair under pressure.

The main factor involved in the USD/JPY pair’s upward momentum in U.S. dollar weakness was the solid rebound in U.S. equity markets that undermined the safe-haven Japanese Yen. Furthermore, a strong pickup in the U.S. Treasury bond yields, though, failed to revive the U.S. dollar demand and remained supportive of the move.

On the data front, at 17:30 GMT, the Building Permits for September from the U.S. raised to1.55M from the projected 1.52M and supported the U.S. dollar that ultimately pushed the USD/JPY pair higher. The Housing Starts declined in September to 1.42M from the anticipated 1.45M and weighed on the U.S. dollar helped cap further upside momentum in the USD/JPY pair.

The trade’s focus was on the developments over the U.S. stimulus measure as the self-imposed deadline by the U.S. House of Representatives Speaker Nancy Pelosi to reach a deal with Republicans was about to end. The hopes for the next round of stimulus measures were fading away as only two weeks are left for U.S. presidential elections, and it seems hard that both sides will reach a deal by then.

These faded hopes also supported the U.S. dollar and added further strength to the rising USD/JPY pair on Tuesday.

Meanwhile, on Tuesday, the U.S. Federal Reserve Vice Chair Randal Quarles said that the nonbank financial system was significantly more fragile than its traditional counterparts, and it has been confirmed by the market stresses created by the coronavirus pandemic. Furthermore, the Philadelphia Federal Reserve Bank President Patrick Harker said that Fed’s new framework should help address shortfalls in employment and help affected workers find new opportunities. He said that tolerating higher inflation will be worth it to help achieve employment goals. These comments from Fed officials also supported the USD/JPY pair’s bullish move on Tuesday.

Daily Technical Levels

Support Resistance

105.33     105.69

105.18     105.90

104.96     106.05

Pivot point: 105.54

USD/JPY – Trading Tips

The USD/JPY trades with a bearish bias around the 105.250 level, having violated the upward channel at the 105.450 level. Closing of candles below this level may lead the USD/JPY pair towards the 105 mark; however, it needs to violate the immediate support area of 105.285. Closing of candles below 105.285 may help us capture quick selling trades until the 105 level. The USD/JPY has recently closed a bearish engulfing candle, and it has also violated the upward channel; both of these are supporting further selling trend in the USD/JPY pair today.  

Good luck!  

Categories
Forex Signals

USD/CAD Examines Double Bottom Support – Brace for Bullish Recovery! 

The USD/CAD pair was closed at 1.31273 after placing a high of 1.32036and a low of 1.31042. The USD/CAD fell to its fifth day lowest level on Tuesday amid the broad-based US dollar weakness and the strong rebound in crude oil prices.

The greenback was weak across the board due to the pertaining uncertainty over the US stimulus package’s development. The US Dollar Index dropped to 93.02 level, its lowest since October 9 on Tuesday amid the US equity market’s strength. The improved risk sentiment supported the US equity market and weighed on the US dollar that ultimately dragged the USD/Cad pair’s prices on Tuesday.

The focus of traders has been shifted to the US negotiations for a new round of US stimulus package for the coronavirus crisis. The US Speaker of the House, Nancy Pelosi, has set a deadline for reaching an agreement before the November 3 election.

Though US President Donald Trump has shown his support for the wide range of stimulus measures, still Nancy Pelosi has failed to break the impasse, and these developments have faded away from the hopes that US stimulus will be delivered before elections. These uncertainties kept the market sentiment under pressure, and the USD/CAD pair suffered because of it.

There was no macroeconomic fundamentals to be released from Canada on the data front, and from the US, the Building Permits were released for September that raised to 1.55M from the expected 1.52M and supported the US dollar. While the Housing Starts were declined to 1.42M from the expected 1.45M and weighed on the US dollar that ultimately dragged the USD.CAD pair’s prices.

On the crude oil side, the WTI prices soared on Tuesday after falling for three consecutive days and reached near the $42 level amid the broad-based US dollar weakness. The rising crude oil prices gave strength to commodity-linked Loonie that ultimately added weight on the already declining USD/CAD pair. The Canadian dollar’s strength driven by raised risk sentiment and crude oil prices dragged the USD/CAD pair’s prices towards its five days lowest level on Tuesday.


Daily Technical Levels

Support Resistance

1.3083 1.3186

1.3041 1.3247

1.2980 1.3289

Pivot point 1.3144

The USD/CAD traded sharply bearish at the 1.3103 level, having violated the double bottom support area of the 1.3103 level on the 4-hour timeframe. Below this level, we may see further selling until the 1.3055 mark; however, the MACD and RSI are in an extremely oversold zone, and we may see a slight bullish recovery before entering into an additional selling zone. The idea is to wait for a bullish correction until the 1.3140 level that marks the 38.2% Fibonacci retracement level before taking another selling trade. Good luck! 

Categories
Forex Signals

USD/CAD Managed to Extend Its Previous Session Modest Gains

During Tuesday’s early Asian trading session, the USD/CAD currency pair managed to extend its previous session modest gains and remain well bid around closer to 1.3200 level due to the declines in the crude oil prices, which tend to undermine the commodity-linked currency the Loonie and helps the currency pair to put the fresh bids during the early Asian session. 

On the contrary, the broad-based U.S. dollar weakness, triggered by the combination of factors, could be considered one of the key factors that kept the lid on any additional gains in the currency pair. As of writing, the USD/CAD currency pair is currently trading at 1.3190 and consolidating in the range between 1.3148 – 1.3195.

The optimism over the coronavirus (COVID-19) vaccine/treatment was recently overshadowed by the concerns about the second wave of coronavirus infections, which keep fueling the doubts over the global economic recovery. Besides this, the renewed conflict between the U.S. and China also weighed on the market trading sentiment. It is worth mentioning that Mike Pompeo has stated that ‘We are sanctioning mainland-China and Hong Kong entities and individuals for conduct related to the sanctioned proliferator the Islamic Republic of Iran Shipping Lines. He further added that our warning is clear: If you do business with IRISL or its subsidiaries, you will face U.S. sanctions.” This recently exerted downside pressure on the trading sentiment and contributed to the currency pair losses.

Despite this, the broad-based U.S. dollar remained depressed as the investors continue to sell U.S. dollars in the wake of the renewed hopes of additional U.S. fiscal stimulus measures and hopes of a coronavirus vaccine at the end of this year, which tends to undermine the safe-haven U.S. dollar. Elsewhere, the U.S. dollar losses were further bolstered by the doubts over the U.S. economic recovery amid rising coronavirus cases. Thus, the U.S. dollar losses become the key factor that cap further gains in the currency pair. Simultaneously, the U.S. Dollar Index that tracks the greenback against a bucket of other currencies dropped by 0.04% to 93.672.

On the bullish side, the WTI’s weakness restricts the USD/CAD bearish moves as oil is the biggest export-item for Canada. However, the WTI crude oil prices failed to extend its previous day gaining streak and remain depressed on the day mainly due to China’s GDP grew less than expected in the third quarter (Q3), which fueling concerns over the demand for crude oil from the world’s second-largest oil consumer. This, in turn, undermined the sentiment around the crude oil prices. The concerns over the sharp rise in new coronavirus cases, which could trigger renewed lockdown restrictions and damage the global economy’s ongoing recovery, continued challenging the crude oil bulls. Thus, the crude oil prices’ losses undermined the commodity-linked currency the Loonie and contributed to the currency pair gains.

Looking forward, the market traders keeping their eyes on the Housing Starts and Building Permits data. In the meantime, the updates surrounding the fresh Sino-US tussle, as well as the coronavirus (COVID-19), could not lose their importance.

Daily Support and Resistance

S1 1.308

S2 1.3141

S3 1.3166

Pivot Point 1.3202

R1 1.3226

R2 1.3263

R3 1.3323

The USD/CAD is trading mostly sideways over the 1.3170 level, and recently, it’s trying to a bullish engulfing pattern that may drive upward movement in the market until the 1.3250 level. Conversely, the bearish breakout of 1.3175 level can drive selling bias until 1.3095. Overall, the RSI and MACD are in support of selling bias until the 1.3095 level. Let’s consider taking a buy trade over 1.3170 and selling below the same level today. Good luck!

Categories
Forex Course

154. Understanding Hawkish and Dovish Central Banks

Introduction

The movement in a currency pair depends on several factors. Hawkish and Dovish Central bank is one of them. Besides economic releases, there are some events where Central provides an outlook and projection of the economy. Therefore, if the projection is excellent, it will create a positive impact on the currency market. If the projection is terrible, it will create a negative impact on the currency market.

What is Hawkish Central Bank?

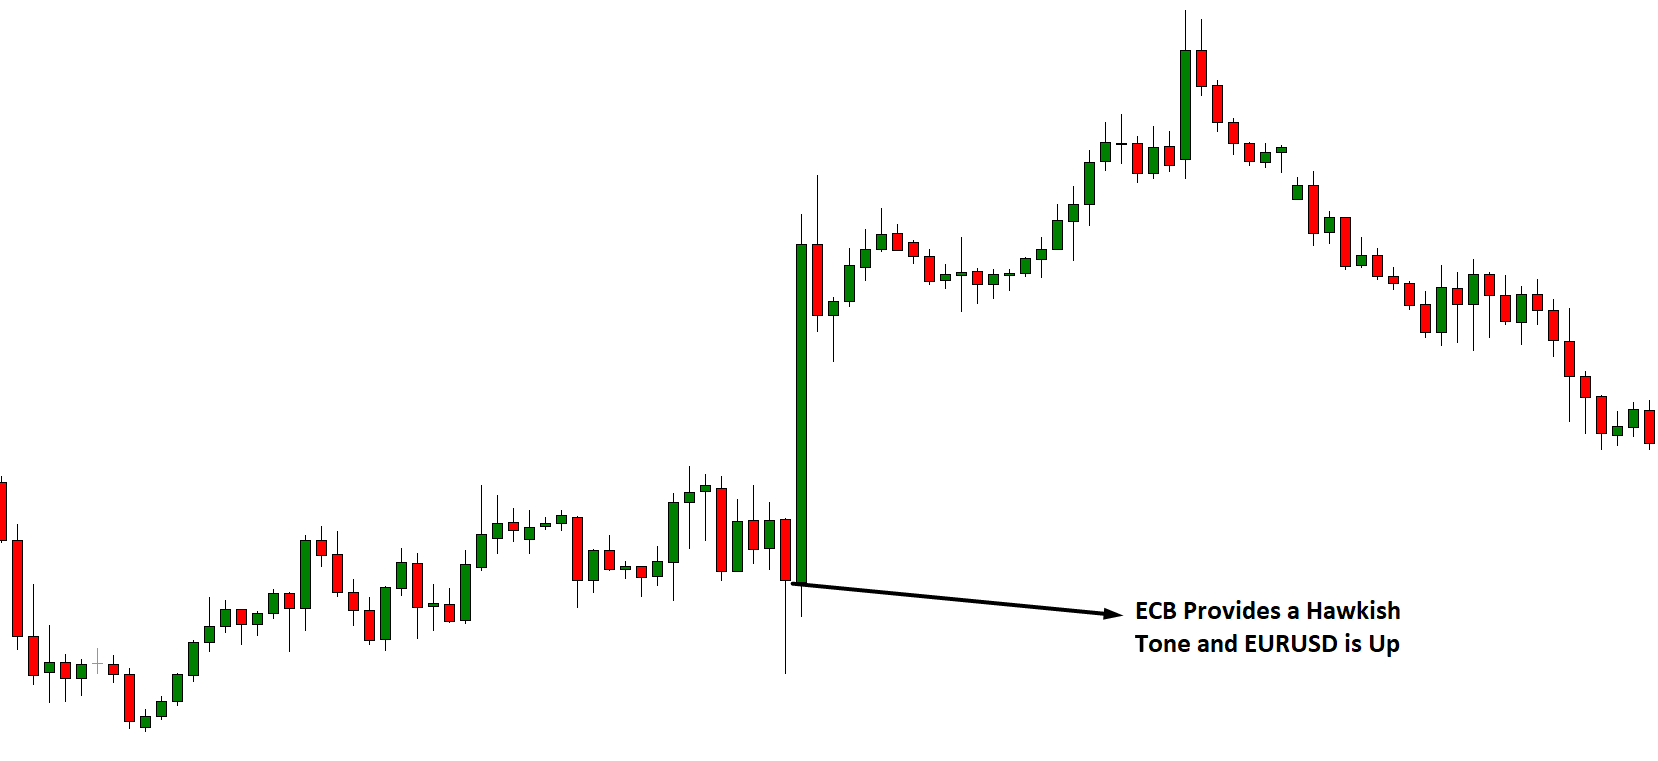
If the economic condition is good, the central bank will raise the interest rate to achieve the inflation target. The hawkish central bank means providing a positive statement regarding the country’s present and upcoming economic conditions, like the economy is getting stable or the inflation is under control.

Let’s say the US economy is getting stronger with a decreased unemployment rate and the controlled inflation target. In this situation, the central bank will provide an official statement saying that the economic condition is favorable, known as the hawkish tone.

What is the Dovish Central bank?

If the economic condition is wrong, the central bank will cut the interest rate and provide a dovish tone. The dovish central bank means providing an outlook of the economy, stating that the economy is facing difficulty to achieve the economic goal.

Let’s say that the European economy is struggling to achieve the targeted inflation level. Moreover, the unemployment rate is increasing. In this situation, the central bank is likely to provide a dovish tone starting that it is planning for a rate cut.

However, the dovish and hawkish tone might cover several factors, as mentioned in the table below:

Decision

Hawkish

Dovish

Objective Reduce inflation Stimulate the economy
Monetary Policy Tighten Loosen
Economic Growth Projection Strong Weak
Current Inflation increasing Decreasing
Interest Rate Increase Decrease
Currency Effect Strong Weak

How Hawkish and Dovish Tone Affect the Forex Market

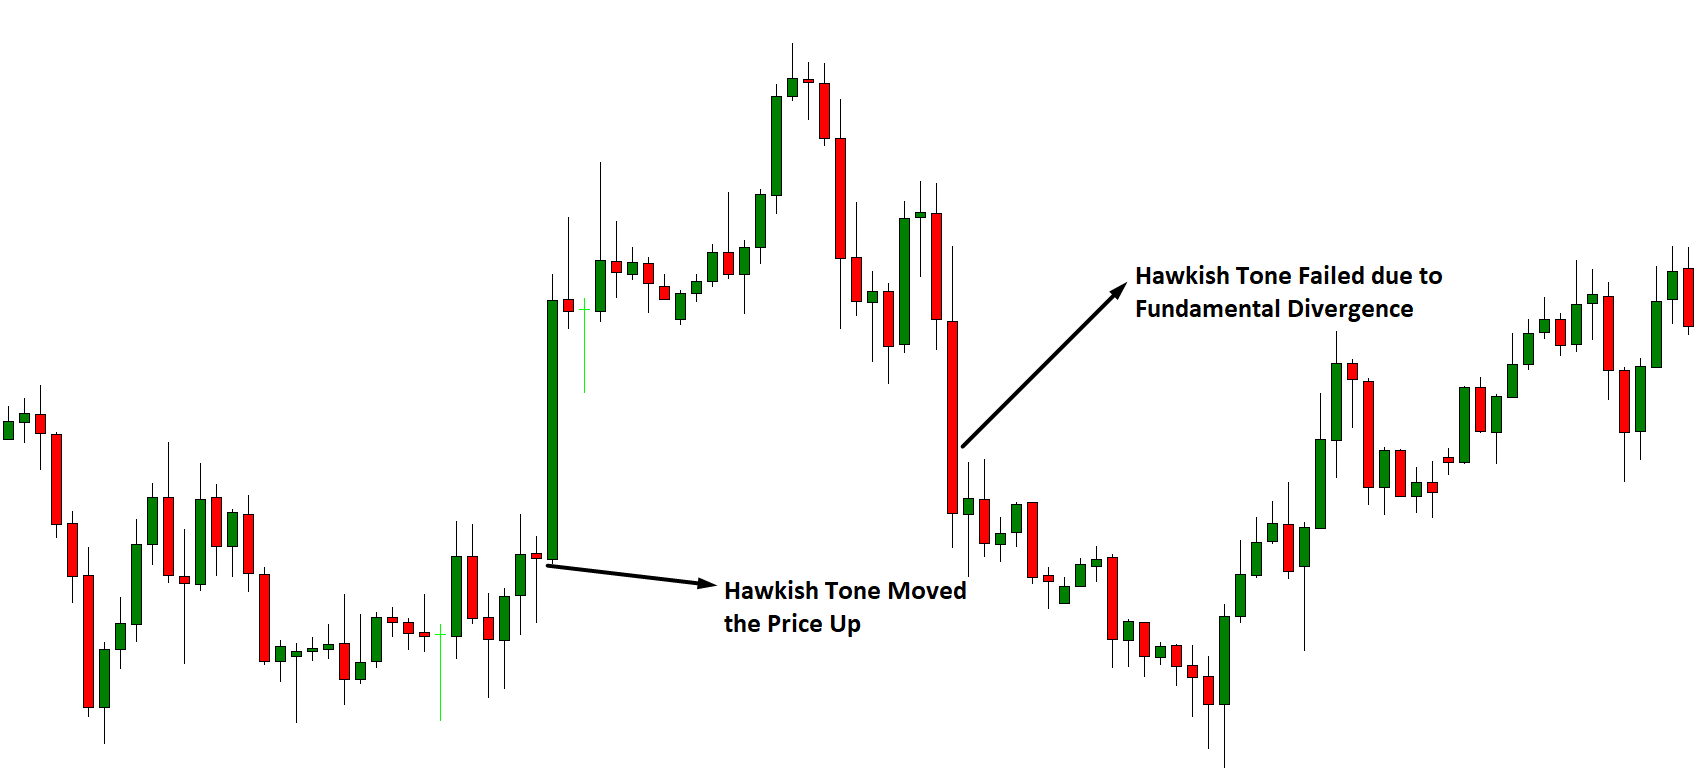
The hawkish and dovish central bank has both long term and short term impact on the currency market. If the US Federal Reserve provides a hawkish tone, we might see the US Dollar become stronger against most currencies. Therefore, if we want to trade on a short term basis, we can move to the 5-minute chart and take trades based on a suitable trading strategy.

Moreover, the hawkish or dovish tone will indicate the overall outlook of a country’s economy that might help traders understand the upcoming market direction. For example, suppose the CPI, GDP, export-import, and other fundamental indicators are favorable. In that case, the central bank will provide a hawkish tone, and traders can take trades in a specific direction until there is a dovish tone.

Conclusion

Hawkish and dovish central banks directly affect the price of a currency pair; therefore, traders should keep an eye on the economic calendar to know when the event will happen. Moreover, during the central bank meeting and press conference, the market becomes volatile, affecting running trades. Moreover, the central bank releases a note after the website’s meeting where traders can read to know the dovish and hawkish tone.

[wp_quiz id=”86379″]
Categories
Forex Market Analysis

Daily F.X. Analysis, October 20 – Top Trade Setups In Forex – European Events in Highlights! 

On the news front, the economic calendar is filled with a series of low impact economic events. However, the focus will remain on the German PPI m/m and Current Account from the Eurozone, and the point to note is that both of the data are expected to be positive so that it may underpin the Euro today. Besides, the FOMC Member Williams and Quarles speeches will be monitored for further price action. 

Economic Events to Watch Today  


EUR/USD – Daily Analysis

The EUR/USD pair was closed at 1.17708 after placing a high of 1.17936 and a low of 1.17030. Overall the movement of the EUR/USD pair remained bullish throughout the day. The EUR/USD pair was up on Monday and tried to approach the 1.1800 arear as the hopes of a U.S. stimulus package weighed on the U.S. dollar. 

The U.S. dollar was weak across the board due to mounting hopes that the U.S. stimulus package will be delivered soon and the encouraging Chinese data published on the day in early trading sessions. It was revealed that Republicans added 0.1 trillion dollars to its previous $1.8 trillion package offer to reach a consensus with Democrats. The Democrats, however, still found it difficult to reach a deal with republicans.

However, the hopes were increased in the market for U.S. stimulus as Republicans were making progress in compromising. This weighed on the U.S. dollar and helped the EUR/USD pair to extend its gains. On China’s front, the data from there reported its GDP at 4.9% in Q3 that was below the expectations of 5.2% and above the previous 3.2%. The U.S. dollar came under pressure because of China’s good performance in Q3 than Q2 and supported the EUR/USD pair’s upward momentum.

On Monday, the European Central Bank President Christine Lagarde said that she wanted E.U. governments to consider the possibility of making E.U. debt a permanent fixture of the bloc’s economic response to the crises. When asked about the 750 billion euros debt-fueled response to the coronavirus crisis, the E.U. commission will borrow on financial markets and disburse to E.U. countries as grants and loans; Lagarde said that this stimulus tool was a response to an exceptional situation like a pandemic. She added that there should be a discussion about this stimulus’s possibility to remain in the European toolbox to be mobilized again in identical circumstances.

Lagarde added that a debate on a common budgetary tool specific to the Euro area should take place and learn lessons from the situation that has happened recently. These comments from Lagarde added further strength to the already rising Euro currency and added additional gains. On the coronavirus front, Belgium extended its restrictions on bars and restaurants for the next four weeks as the infection rate rose continuously. The health minister warned that Belgium could soon be overwhelmed by new coronavirus infections.

Italy recorded its highest daily infection rate on Sunday and announced a raft of measures to control infection spread. Meanwhile, nine major French cities were also placed under curfew. However, these lingering coronavirus tensions failed to reverse the rising EUR/USD pair, and the currency pair remained on the positive track on Monday.

Daily Technical Levels

Support Resistance

1.1709     1.1723

1.1703     1.1731

1.1695     1.1737

Pivot point: 1.1717

EUR/USD– Trading Tip

The EUR/USD is consolidating below a strong resistance level of 1.1793 level, extended by a downward trendline on the 4-hour timeframe. On the lower side, the EUR/USD may find support at the 1.1735 level, and violation of this support level can extend selling until the 1.1690 level. On the higher side, bullish trend continuation can lead the EUR/USD price towards the next target level of the 1.1830 mark. The MACD supports bullish bias; therefore, we should look for buying trades upon today’s breakout of the 1.1790 level. 


GBP/USD – Daily Analysis

The GBP/USD pair was closed at 1.29827 after placing a high of 1.30244 and a low of 1.28912. The British Pound eased from session highs on Monday against the U.S. dollar but remained supported as the E.U. assured that it would remain committed to intensifying Brexit-deal talks with the U.K. The E.U. Brexit negotiator Michel Barnier confirmed that the E.U. remained available to intensify negotiations in London. This marked a change in tone after E.U. leaders dropped their pledge to intensify trade talks last week and called on the U.K. to make concessions for a deal. Barnier’s statement raised the possibility of a Brexit deal and helped GBP/USD pair to remain positive on Monday.

The U.K. Cabinet Office Minister Michael Gove had suggested that the U.K. would not resume talks before acknowledging signs of progress. He also said that he welcomes the constructive move on the part of the E.U. However, he said that there was no basis to find an agreement and that Brussel’s proposals were inconsistent with sovereign status. He also labeled potential talks as meaningless.

The pair GBP/USD was raised during the early trading session but failed to extend gains and eased due to Gove’s statement. Michael Gove said that the U.K. was increasingly well-prepared for an Australian-style exit from the E.U., meaning no-deal. The mixed statements from Barnier and Gove confused the traders, and the currency pair suffered from it as it moved on the upside in the early session and lost most of its gains in the late session.

On the data front, at 04:01 GMT, the Rightmove Housing Price Index for October came in as 1.1% compared to the previous 0.2%. From the U.S. side, the NAHB Housing Market Index rose to 85 from the forecasted 83 and supported the U.S. dollar that limited GBP/USD pair gains on Monday.

Meanwhile, the rising number of coronavirus in the U.K. also weighed on GBP/USD pair as an 18,804 new cases were reported for COVID-19 in the U.K. on Monday with 80 new deaths. This also kept the pair under pressure and its gains limited on the day.

Daily Technical Levels

Support Resistance

1.2900     1.2941

1.2874     1.2956

1.2859     1.2982

Pivot point: 1.2915

GBP/USD– Trading Tip

The GBP/USD surged sharply to trade at the 1.3006 mark, but soon it slipped again to trade at the 1.2939 level. The cable is currently gaining immediate support at the 1.2939 level, and a bearish breakout of the 1.2939 mark can lead to GBP/USD prices further lower towards the 1.2886 level. On the flip side, the resistance continues to hold around the 1.3006 level. The MACD and RSI show neutral bias as investors seem to wait for a solid reason to enter the market. 


USD/JPY – Daily Analysis

The USD/JPY pair was closed to 105.430 after placing a high of 105.501 and a low of 105.299. Overall the movement of the USD/JPY pair remained bullish throughout the day. Despite the U.S. dollar weakness, the USD/JPY pair posted gains on Monday and remained bullish as the U.S. stimulus package deal’s developments started moving on the positive side. The market mood was also better and played against the greenback after releasing the GDP report from China.

The Republicans extended its previous offer of $1.8 trillion to a $1.9 trillion packages on Monday, which was again failed by Democrats. The U.S. President Donald Trump has expressed his willingness for a larger stimulus package, but he still has to convince Republicans. Whereas, the U.S. House Speaker Nancy Pelosi has set out a 48-hour deadline for U.S. stimulus talks in the last effort to reach a deal before the elections.

Before elections, the hopes for a stimulus package dimmed and supported the U.S. dollar and raised the USD/JPY pair on Monday.

Meanwhile, China published its GDP report for the third quarter that came in as 4.9% and fell short of the forecasted 5.5% but extended compared to the previous 3.2%. The U.S. dollar came under pressure because of the Chinese GDP report and further capped gains in the USD/JPY pair on Monday.

On the data front, at 04:50 GMT, the Trade Balance from Japan for September came in as 0.48T against the forecasted 0.85T and weighed on the Japanese Yen. At 19:00 GMT, the NAHB Housing Market Index for October raised to 85 from the forecasted 83 and supported the U.S. dollar that pushed the USD/JPY pair even higher. Meanwhile, the Fed Chair Jerome Powell said in his speech on Monday that it should be more important for the U.S. to get the development of CBDC- cross-border digital currency right than being the first one to issue it.

China has given away about $1.5 million for its digital currency trials and has said that it would become the first to issue a CBDC. China wanted to reduce its dependence on the global dollar payment system and has taken the initiative to issue its digital currency.

Following China’s move, many central banks worldwide have started examining the possibility of issuing a digital currency. Facebook has also announced introducing Libra, its digital currency, given the increased demand for digital payments during the COVID-19 pandemic.

The Bank for International Settlements (BIS) and the seven other central banks, including the U.S. Fed and Bank of England, have released a report that tells the importance of CBDC to catch up with China’s move be the first one. According to Powell, the U.S. Fed has not yet decided on the issuance of digital currency, but it has been an active participant in research into the issue.

Moreover, the Federal Reserve Vice Chair Richard Clarida said on Monday that after taking a substantial hit from the pandemic, the U.S. economy was rebounded strongly. He said that it might take another year to reach pre-pandemic economic levels, but the labor market could take more than that to recover the pandemic’s damage. Fed officials’ comments also weighed on the U.S. dollar and caped further gains in the USD/JPY pair on Monday.

Daily Technical Levels

Support Resistance

105.37     105.50

105.28     105.56

105.23     105.64

Pivot point: 105.42

USD/JPY – Trading Tips

The USD/JPY trades with a bullish bias around the 105.550 level, holding below the double bottom area. Bullish crossover of 105.550 level may lead USD/JPY pair further higher until 105.800 level. On the 2 hour chart, the USD/JPY has formed an upward channel, which is likely to support the USD/JPY pair around the 105.300 level. Below this, the next support is likely to be found around 105.250 and 105.06. Let’s consider opening sell trade beneath 105.60 and buying over 105.050 level today. Good luck!  

Categories
Crypto Market Analysis

Daily Crypto Review, Oct 20 – Bitcoin Above $12,000 by the End of the Month? Bull Market has Already Started

The cryptocurrency sector has pushed towards the upside as Bitcoin reached $11,850. Bitcoin is currently trading for $11,741, representing an increase of 2.22% on the day. Meanwhile, Ethereum gained 0.50% on the day, while XRP gained 1.69%.

 Daily Crypto Sector Heat Map

If we look at the top 100 cryptocurrencies, we can see that Dash gained 11.62% in the past 24 hours, making it the top daily gainer. Stellar (7.37%) and Quant (6.5%) also did great. On the other hand, Aave lost 10.73%, making it the most prominent daily loser. It is followed by Crypto.com Coin’s loss of 10.06% and NEAR Protocol’s loss of 9.3%.

Top 10 24-hour Performers (Click to enlarge)

Bottom 10 24-hour Performers (Click to enlarge)

Bitcoin’s market dominance level has increased slightly since our last report, with its value is currently 59.5%. This value represents a 0.7% difference to the upside when compared to when we last reported.

Daily Crypto Market Cap Chart

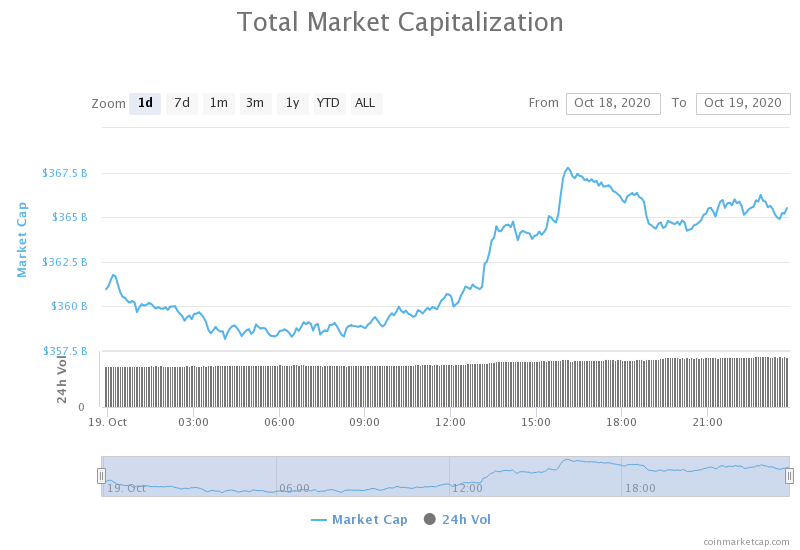
The crypto sector capitalization has lost a bit of its value since Friday. Its current value is $365.47 billion, representing a decrease of $4.35 billion compared to our previous report.

_______________________________________________________________________

What happened in the past 24 hours?

_______________________________________________________________________

_______________________________________________________________________

Technical analysis

_______________________________________________________________________

Bitcoin

The largest cryptocurrency by market capitalization has pushed past its major resistance sitting at $11,500. The push was accompanied by a major volume increase, which brought Bitcoin’s price to as high as $11,850 before dropping back down to sub-$11,800.


This new spike has put Bitcoin at above 60% year-to-date gains. On top of that, Bitcoin is on track to challenge (and even pass) $12,000, which is a crucial resistance. With the price ignoring all indicators showing that it would bounce back down and pull away from its highs, it does quite the opposite. This inspired many analysts to call for Bitcoin at over $12,000 even by the end of the month.

BTC/USD 1-day Chart

Bitcoin’s technical overview is heavily tilted towards the buy-side, with every single time-frame showing almost no signs of neutrality.

BTC/USD 1-day Technicals

Technical factors (4-hour Chart):
  • Price is above its 50-period EMA and at its 21-period EMA
  • Price near its top Bollinger band
  • RSI is pushing towards the overbought area (63.99)
  • Volume is descending after a major spike
Key levels to the upside          Key levels to the downside

1: $11,735                                 1: $11,630

2: $11,850                                 2: $11,500

3: $12,000                                  3: $11,300

Ethereum

Ethereum’s price moved towards the downside throughout the past week, but then rebounded after hitting the $361 support level and began a slow push towards the upside. Ethereum bulls were patient and slowly took over first the $371 resistance level and now the $378 level, turning them both into support. In both cases, the push was just enough to bring the price above these levels, but the consolidation phase always ended with Ether’s price above its newly found support.

The fundamentals surrounding Ethereum are (at the moment) looking particularly strong as investors are expecting a successful launch of Ethereum 2.0.


ETH/USD 4-hour Chart

Ethereum’s technicals are showing a tilt towards the buy-side on all time-frames. However, while its lower time-frames are being more positive, its longer time-frames are being a bit more neutral (mostly oscillators).

ETH/USD 1-day Technicals

Technical Factors (4-hour Chart):
  • The price is above its 50-period and its 21-period EMA
  • The price between its middle and top Bollinger band
  • RSI is neutral (57.27)
  • Volume is descending from a spike
Key levels to the upside          Key levels to the downside

1: $400                                     1: $378

2: $415                                     2: $371

3: $420                                      3: $360

Ripple

The fourth-largest cryptocurrency by market cap has unexpectedly pushed towards the upside as XRP whales reemerged and went on a buying spree. The most recent upswing has put XRP above the $0.2454 level, which has proven itself both as strong support and resistance level. At the time of writing, XRP seems like it will stay above the level, even though most of its indicators are showing a strong possibility of price pulling back a bit more.

Traders should pay attention to how XRP handles the $0.2454 support level and trade it as XRP bounces up or breaks below it.


XRP/USD 4-hour Chart

XRP’s technicals are quite mixed up. While its 4-hour overview is neutral-bullish, its 1-day chart is completely bearish. On the other hand, its weekly overview is tilted towards the buy-side, while its monthly overview is quite neutral, but still leaning slightly towards the bear side.

XRP/USD 1-day Technicals

Technical factors (4-hour Chart):
  • The price is at its 50-period EMA and above its21-period EMA
  • Price is near its top Bollinger band
  • RSI is neutral (53.39)
  • Volume is below average
Key levels to the upside          Key levels to the downside

1: $0.26                                     1: $0.2454

2: $0.266                                   2: $0.235

3: $0.2855                                3: $0.227


Categories
Forex Signals

AUD/USD Violates Bearish Flag – Bearish Bias Dominates!   

The AUD/USD pair was closed at 0.70685 after placing a high of 0.71144 and a low of 0.70685. Overall the movement of the AUD/USD pair remained bearish throughout the day. The AUD/USD pair extended its previous day’s losses and dropped for the third consecutive day on Monday as the market sentiment soared after the reports from the US dampening hopes of a US COVID-19 stimulus deal.

The upbeat Chinese GDP data for the third quarter gave strength to the Australian dollar and helped AUD/USD pair to open its week on a strong note. The Asian giant’s economy and the largest trading partner of Australia expanded by 4.9% in Q3 and showed strong industrial output and consumption figures that pointed out a strong recovery from the pandemic that hit Q2 hardest.

The China-proxy Aussie gained traction after the upbeat data from China, and the US dollar became weak, ultimately pushing the AUD/USD pair on the higher side in the early trading session on Monday. However, the gains were short-lived, and the AUD/USD pair’s movement reversed as the hopes for a US stimulus package faded away.

During the Weekend, the statement from Nancy Pelosi that a deal might be reached before elections over the US stimulus package gave strength to the risk sentiment. The improved risk sentiment pushed AUD/USD pair to open on a strong note, but the upward momentum was broken after hopes deteriorated on Monday.

The Republicans added another 0.1 trillion dollars to the previous $1.8 trillion stimulus package that failed to get approval. The US President showed his willingness to approve more stimulus before elections; however, he needed to deal with Republicans first. The US House Speaker Nancy Pelosi provided a 48-hours deadline to Republicans to reach a deal to pass the coronavirus stimulus package before elections. 

The mixed situation has weighed on the risk sentiment as the stimulus hopes are fading with the passage of time and the risk perceived Aussie suffered that reversed the direction of AUD/USD pair on Monday.

The pair AD/USD started moving in the downward trend because of the rate differentials between 10-year government bond yields of Australia and the US. The US 10-year Treasury yields were around 0.77%, and the Australian counterpart was at 0.750%. 

The market participants will be looking forward to the release of monetary policy meeting minutes from the Reserve Bank of Australia on Tuesday and will keep following the bearish bias until finding some fresh clues for future trading.


Daily Technical Levels

Support Resistance

0.7078 0.7101

0.7064 0.7110

0.7056 0.7124

Pivot point: 0.7087

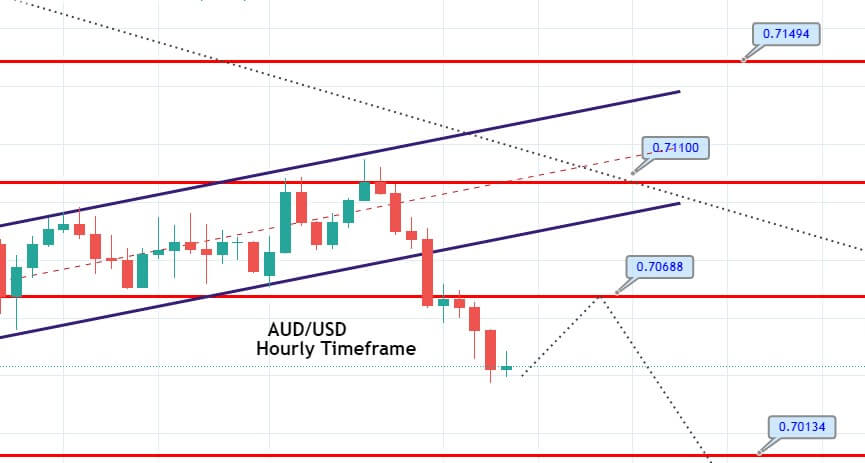
The AUD/USD is trading at the 0.7043 level, having violated the bullish flag pattern on the 2-hour timeframe. On the lower side, bearish trend continuation can lead the AUD/USD pair towards the support area of 0.7014 level. At the same time, the support continues to stay at the 0.7068 level. The bearish bias remains dominant today; therefore, we should look for selling trades below the 0.7067 level today. Good luck! 

Categories
Forex Fundamental Analysis Forex Technical Analysis

Cryptocurrency Negotiation Strategies for Fundamental and Technical Analysis

In this article, we summarize negotiation strategies for fundamental and technical analysis, telling you about the specific characteristics of cryptocurrency pairs in relation to fiduciary money and each other. You will learn: what news reacts more to cryptocurrencies, what are the prospects of start-ups, how to negotiate with patterns and resistance levels, and familiarize yourself with how to use the correlation dependency of cryptocurrency pairs with each other.

Cryptocurrency has become the most profitable asset of recent years. The strong side of cryptocurrencies: their high volatility, allowing them to win up to 30-50% in a successful operation in 1-3 days. No asset can show a similar result. However, high volatility carries great risks. If losing half the position in currency pairs in a day is only possible with the use of leverage, in cryptocurrencies it is possible to lose and without it. But the desire to win in the strong fluctuations of currencies does not stop. As the market moves in waves, there is always a chance to recover the previous loss without problems.

Cryptocurrency Trading Strategies

Compared to trading cryptocurrencies of exchange houses, Forex has a number of advantages:

Here you can open short positions. The high volatility indicates that currencies have long alternating ups and downs. This means that in case of an erroneous prognosis of the price direction it is necessary to simply open an opposite position, and in the case of an already open, or close in loss, or be patient until the quotes are not reversed. The undulating nature of the quotes is well visible in the weekly chart LTC/USD (Litecoin vs US Dollar). In addition to frequent intraday zigzags, the intra-week wave is clearly visible.

The speed of opening and closing of a position is several milliseconds. The purchase and sale of cryptocurrencies through purses can last several hours.

Perfect deposit protection. Nobody hacks into the broker’s accounts. Firstly, there is no sense (trading is done by CFDs), secondly, it is controlled by the regulator (exchanges are not controlled by anyone).

Trading According to Support and Resistance Levels

Graphical analysis in cryptocurrencies shows quite good results. Firstly, these are the psychological levels represented by the rounded figures. For example, for a ВТС is 6000, 7000, etc. coins often repel from rounded levels. It is easier for buyers to place a target sales level on a rounded number, in which a downward shift occurs. Below is the monthly graph of the pair DSH/USD (DASH vs US Dollar).

Also in the cryptocurrency market will be influenced by the general news: bankruptcy of cryptocurrency exchange houses, tightening of control over the trading of cryptocurrencies in China and South Korea, which represent the largest volume of sales, the loyalty of the legislation and the big corporations.

Trading According to Technical Analysis

As in currency trading, fundamental and technical analysis can be applied in the cryptocurrency market. Cryptocurrency is too young an instrument, in which there are a lot of speculative components. That’s why both options have advantages and disadvantages. Let’s look at the fundamentals of trading in technical and fundamental analysis.

Trading According to Fundamental Analysis

The cryptocurrencies presented are representatives of three types of projects. Payment systems (ВТС, LTC, XRP), decentralized networks for creation based on applications (ETH), anonymizer, payment systems with a high level of anonymity (XMR, DSH, ZEC). Consequently, they will influence the course of the news.

For example:

ETH/USD (Ethereum vs US Dollar). This pair will first be influenced by Vitalik Buterin’s statements regarding the effectiveness of the fork being performed, which includes the transition from the PoW algorithm to PoS. And although little information comes from him. However, ethereum is considered one of the most optimal currencies in the long run due to the potential interest of new projects on its platform.

XMR/USD (Monero vs US Dollar). Cryptocurrency encounters fierce resistance from legislation. Used for the gaming market and other online services, the currency is completely anonymous. This problem was one of the reasons the project lost its place in the Top 10 on the Coin Market Cap website. However, at the end of January, information appeared about the possible future merger of XMR and LTC. It is possible that developers are just filling in information. But if this happens, the hybrid will be able to turn the cryptocurrency market upside down.

Knowing there’s a perfect touch of levels, you can see. The yellow circle highlights the characteristic sections of the corridor. The first section is quite extensive, limited by the levels of 600 and 1000 US dollars. The second section that already shows the flat offensive is marked with a red circle and is at the level of 800 US dollars. The third section shows how the price has rebounded from the level of 400 US dollars, approaching 600 US dollars, almost stopped.

Rules for Building Support and Resistance Levels

-The level built by two points is not clear. Ideally, you should have at least three points. Let the price not reach the level or lose it slightly, it is not important for an overview.

-The ideal is the combination of the levels found in the short term and the long term, comparing how much they coincide.

-There are interesting indicators for MT4 that automatically draw levels. For example, PowerDynamiteAreas, ATR Levels.

Conclusion: In long term levels look pretty good due to the fact that traders basically don’t hold coins for long, winning on local raises. This is a psychological moment and must be taken into account in the development of the strategy. Some traders try to build strategies at Fibonacci levels, but for cryptocurrencies, this pattern is dubious, again due to psychology.

Trading According to Patterns

The psychology of traders is reflected in the cryptographic currency chart in the form of patterns, figures that indicate the possible reversion or origin of flat. Examples of the most common patterns in cryptocurrencies:

Pin bar. A candle with a very small body relative to the previous ones, a long shadow in the direction of the trend, and a short (or absent) reverse shadow. The model says that the price in the current term had a break forward, but at its end, it returned almost to the same positions. For a long position is a sign that the bulls stopped and a reversal is possible. The shade of a candle should be at least 2 times longer than the shade of the previous candle.

“Three soldiers on the move”. It is a model consisting of three consecutive sails (ascending or descending), each of which is larger than the previous one. The model shows that the trend has a pronounced direction. Generally, after them, there is a minor correction of 3-4 small candles. In the next sail of the main direction, one position can be opened.

For other more rare and less accurate patterns, but still useful, it is worth noting the following:

Double bottom (double vertex): Represents a double rebound of the support or resistance level. The first reverse can only be a correction before the level break. But if a second background (vertex) is formed and a rebound occurs, the trend will most likely develop.

Head and shoulders: A reverse figure, which is often found after a strong trend. It represents three consecutive peaks, of which the average is the highest (head). The first shoulder is characterized by a peak and a slight correction, the lowest point of which is not lower than the current price line. The head is a strong price boost, followed by recoil to the shoulder correction level. Then the third shoulder is formed, which means the attenuation of the trend and then you can safely open a short position. The second shoulder looks very confusing, but in the end, the price continues to fall.

Triangles, Flags, and Banners: Figures of consolidation, after which, as a general rule, follow the break of the limit of the figure.

Another interesting technical analysis tool is fractals. As practice shows, graphical analysis in the cryptocurrency market works under the same principles as in currency pairs. It will only be necessary to have the capacity to recognize the models in time and combine them with fundamental analysis and support levels.

If we are talking about technical indicators, in cryptocurrencies the classical stochastics, MACD, RSI, Momentum, ZigZag, sliding, give quite precise signals. The recommended period for the analysis, which mitigates volatility, is no less than H4.

Trading with Correlative Cryptocurrency Pairs

Compared to pairs, where the second currency is the US dollar, correlative pairs are less volatile. The strength of the coin in a pair, as practice shows, is determined by the enthusiasm of the market and its confidence in the project. A clear example is the strong outbursts of the last month. At the time of cascading growth, the “dinosaurs” ВТС and ETH grew more slowly. But at the time of a recession, they fell less.

At the time of growth of the entire cryptocurrency market, Ripple grew relative to both currencies, i.e., Bitcoin versus the dollar grew slower, than Ripple. But at the time of the reduction, the green line fell below the yellow line. This means that Bitcoin depreciated slower than Ripple. This is confirmed by Bitcoin’s share in capitalization. On January 10-13, it was 32-32.5% with a total capitalization of 750 billion US dollars, now the share of BTC is 35% with a capitalization of 400 billion US dollars. Very similar graphics in the other cryptocurrencies. The pair LTC/BTC (Litecoin vs Bitcoin) depreciated in the same proportion.

A stronger reduction in relation to BTC is the pair DSH/BTC (DASH vs Bitcoin) and ZEC/BTC (ZCash vs Bitcoin).

Conclusion: At the time of the rapid growth of the market it makes sense to bet on the reduction of ВТС in relation to other more recent projects, but at the time of the market fall “overflows” in ВТС. This can be explained as follows: Bitcoin is a payment system too old with many problems of scale and transaction speed. At the time of general growth, investors prefer to rely on young BTC analogs (this explains the drop in BTC’s share in capitalization from 60% in December 2017 to 35% by the end of February 2018). But in the moment of panic, the confidence towards BTC is much more due to its status in the world economic community.

Technical analysis can also be used in these pairs. And finally, some tips on trading cryptocurrencies on Forex:

-Do not use leverage or use it very carefully. Remember that because of volatility positions can be closed by stop out.

-Give preference to intraday trading, save on swaps.

-Limit the use of business advisors and better operate manually. The market is more subject to psychological and fundamental factors.

Categories
Cryptocurrencies Forex Fundamental Analysis

How Fundamental Factors Influence the Price of Cryptocurrencies

Investors believe in positive news and ignore the prohibitions of China and South Korea. On the eve of Segwit2x bitcoin for several days, it strengthened by more than 1000 US dollars and broke the level of 7000 dollars. Some believe that the exchange rate of bitcoin and cryptocurrencies is growing thanks to speculative capital, on the contrary others believe in the future of blockchain. A number of countries are on the road to progress, and some countries, on the contrary, impose limitations, trying to take cryptocurrencies under fiscal control. Traders ignore limitations, preferring to react to positive news. How fundamental factors influence cryptocurrencies and why legislative restrictions are ineffective.

What’s a Cryptocurrency Afraid Of?

Before a new bitcoin fork, there are still 2 weeks left, but cryptocurrency already puts new records on growth speed and historic highs. In recent days alone BTC has appreciated by more than 20%, rising from the level of 5700 to the level of 7200, in a year the cryptocurrency has grown almost 900% and clearly will not stop there. So far, analysts’ most optimistic forecasts regarding the bitcoin rate are around US$10,000 by the end of the year. According to the website of Coin Market Cup, the capitalization of bitcoin passed the level of 120 billion US dollars and represent more than 60% of the total capitalization of all cryptocurrencies. Still, a month ago, all capitalization accounted for about 130 billion and the share of bitcoin in it was about 47%.

For some prudent investors, such a rapid growth of bitcoin causes some concerns.

BTC speculative growth is too fast compared to other cryptocurrencies and may persist after fork (demand grows only because there is the possibility of obtaining coins after Segwit2x). Some analysts compare the situation of the cryptocurrency market with the situation of 2000 (“Bubble point”). Volatility of 400-500 US dollars in a day is too much. With such a sharp increase you can expect a no less sharp setback.

There are increasing restrictions on transactions and mining by several countries. Fears related to the reduction of bitcoin after fork are in vain. After the appearance of ВСН in August the bitcoin exchange rate instead went up. A similar situation with Bitcoin Gold. Only on fork eve was there a slight setback, and then again growth.

Fears in vain in relation to the “Dotcom Bubble”. Supporters of cryptocurrency believe that behind blockchain technology, in the future, it has as an argument the interest of corporations in technology. The capitalization of cryptocurrencies is 200 billion US dollars, the capitalization of NASDAQ companies at the time of the collapse of March 10, 2000 was trillions, so it is inappropriate to establish an analogy between cryptocurrencies and NASDAQ. The biggest problem with restrictions by other countries is that they can become an obstacle for bitcoin and cryptocurrencies.

How bitcoin responds to state restrictions and whether we should worry about them.

On September 4, 2017, in the media it was reported that China had banned ICO (initial offer of cryptocurrency), leaving the possibility for individuals to continue any operation with the cryptocurrency. A year ago, China accounted for about 85% of all bitcoin transactions, but after a series of restrictive measures, its volume dropped to less than 15%. Traders to China’s decision reacted with indolence, quotes fell temporarily from the 4800 level to the 4200 level and close to reaching the August lows.

The most influential traders reacted to the interruption of the trading of Chinese cryptocurrency ВТСС on September 14-15. This, obviously, we can see in the graph. A similar situation occurred on July 25, when one of the world’s largest stock exchanges ВТС stopped working. Then bitcoin lost about 20% of its value. This indicates that traders react more to practical problems with trading and trading than to any restrictions.

With the tightening of the policy of the Chinese authorities, the volume of bitcoin trading moved to Japan and South Korea. South Korea assumed about 30% of the cryptocurrency trading volume, ranking third in this indicator. By the end of September, traders were expecting the next blow, the ICO ban in South Korea. Although the country remains loyal to bitcoin, a ban is imposed on the emergence of new cryptocurrencies, as well as on all types of loans in digital currencies. The decision of South Korea on September 29 was almost ignored by traders, the low bitcoin of 4% compared to the subsequent growth is not serious.

Where the most active traders saw the news that Japan would legalize the cryptocurrency exchange and show loyalty to control over cryptocurrency trading. In April, Japan became the first country to equate bitcoin with fiduciary money. Last week bitcoin grows exclusively pending the November fork.

It is not far behind the countries of Asia and Russia. On October 24, Vladimir Putin ordered the government and the Central Bank to establish the requirements for the organization of cryptocurrency mining, and in the future to organize the registration of mining subjects. Previously, the Central Bank had already considered the possibility of taking control of the issuance and circulation of cryptocurrency in the country. The cryptocurrency exchange rate did not react to this message.

The desire of some countries to limit cryptocurrencies (and bitcoin, which has some degree of status as a means of payment) is understandable:

-The trading volume of cryptocurrencies and mining volumes are growing every day. And this is a good sector for taxes. And if income from trading on the stock exchange or Forex is taxed, why not tax income from trading in cryptocurrencies and mining?

-The virtue of cryptocurrency is anonymity. Countries that restrict the volume of cryptocurrency trading argue that they are preventing the country from withdrawing money by circumventing regulators and can serve as a means for money laundering.

-A country’s currency is an instrument for regulating the economy. And even the trading volume of the foreign currency is under the control of the regulator. The uncontrolled circulation of cryptocurrencies can be a threat to the economic integrity of the country.

Many countries still do not know how to interpret the concept of cryptocurrency from a financial point of view. The views of the authorities were as follows:

Cryptocurrencies are completely prohibited in Iceland, Vietnam, Bolivia, Ecuador, Bangladesh, Lebanon, Thailand (between countries it is easy to establish a parallel in terms of economic development). In Finland and Belgium, bitcoin is considered a valuable asset, exempt from VAT.

The United States

Here, cryptocurrency is a full-fledged financial instrument (commodity) subject to tax law. Already more than a year there is talk of the creation of the first ETF fund of cryptocurrency, but so far there is no permission from regulators.

Canada

Canada is completely open to bitcoin. Taxation is applied depending on how bitcoin is used: for resale or as an investment.

  1. Opinions are divided here. Germany with respect to bitcoin is loyal, admitting it as a “personal monetary fund”. In France, on the contrary, bitcoin is criticized for its anonymity. In 2015, the EU court abolished VAT on bitcoin transactions, calling it a kind of traditional currency.

In Cyprus, cryptocurrency status has not yet been determined, and in Bulgaria cryptocurrency is subject to taxation.

Russia

Cryptocurrency in this country is prohibited as a payment system, but mining is thriving, especially in regions with low electricity prices.

Most developed countries have not yet decided on bitcoin status and are looking for the possibility of its legitimization. They have already accepted the inevitability of cryptocurrency and allow operations on their territory. Amazon promised to start accepting bitcoins in October, at the moment does not accept bitcoins Aliexpress, but this problem is already beginning to be solved thanks to the help of intermediary services that accept cryptocurrencies and pay goods in real currency.

And now I’ll come back to the subject of fear of bitcoin and other cryptocurrencies, and what else they react to. It is easy to notice that traders ignore almost completely (or react in the short term) the decisions of countries, and vice versa, the price of cryptocurrencies grows at the time of reporting on new forks or agreements. Why traders ignore the prohibitions, it is easy to understand:

Regulators have almost no tools to limit cryptocurrency completely. Cloud services are on servers in different countries. It is almost impossible to ban mining or introduce a tax.

Cryptocurrency emission occurs in the global system. The lack of a single issuer (with the exception of private houses that create a cryptocurrency for personal purposes) does not permit the application of measures in relation to private natural persons.

While there is no unity between countries, the prohibition of cryptocurrency in one country automatically means the growth of its trading volume in another.

It is smarter to adapt to progressive technologies than to try to limit them.

The main key factors affecting cryptocurrency quotes are:

  • Innovations that make mining more profitable and simplistic.
  • Problems with cryptocurrency bags.

Bitcoin and ether in some cases have an inverse correlation with respect to other alts. Interest on a single alt may be the cause of the outflow of bitcoin money and vice versa, at the time of fundamental events (e.g., forks), the growth of bitcoin price is provided by the outflow of capital from other alts. The interest of traders with the project itself, which provides cryptocurrency. If the project is promising, then investors will react accordingly.

In the forums, you can find the opinion that volatility is related to algorithmic trading. It should be noted that analysts and themselves sometimes cannot accurately explain the reasons for the volatility of cryptocurrency, indicating a large speculative component and enormous popularity. In part, these are signs of a bubble, but maybe behind the cryptocurrency is really the future? And those who risk now, in the future will receive a huge benefit. In the near future, even bitcoin will not receive universal recognition, but within 5-10 years everything can change drastically.

While there are no serious fundamental factors that could deploy bitcoin in the opposite direction with a drop horizon of 25% or more. Traders prefer to hear positive news that can affect the reduction of commissions, the speed of transactions, the simplification of mining, and ignore all kinds of statements. That is probably the main difference between cryptocurrency and ordinary currencies, which are linked to speeches by representatives of the Fed, ECB, etc.

Categories
Forex Fundamental Analysis

What Should You Know About ‘Public Sector Net Borrowing’ Forex Fundamental Indicator

Introduction

Every government runs a budget. It is rare to find a scenario where a government has a balanced budget, i.e., its revenues match expenditures. Economists, policymakers, financial analysts, and consumers pay close attention to budget analysis figures. This interest in the budget is helpful to determine if the government is running a surplus or deficit. This information is vital in determining the country’s global credit rating, which will impact future investment decision-making, trade, and value of the currency.

Understanding Public Sector Net Borrowing

Public sector net borrowing refers to the government budget deficit. The budget deficit occurs when the income earned by the government is less than the public expenditures. Thus, the government can be said to be spending more than it collects in the form of taxes and trade. Governments fund their budgets, primarily using debt and taxation. While different governments have different lines of expenditures, they can all be summed up under three categories: current expenditures, capital expenditures, and transfer payments.

The budget deficits run by governments can tell us a lot about the health of the economy and possibly the cost of future funding. The budget report might be a complicated and tedious document for the average forex trader to analyze in its entirety. Thus, while there is a relationship between budget deficits and the economy’s health, it is advisable to compare the budget deficits with other economic indicators to get the full picture.

Increasing the budget deficit can tell us two things, either revenue collection is decreasing or the government expenditure is increasing rapidly. Here’s a look at how the budget deficit occurs. It starts with a decline in revenue. It is worth noting that exceedingly high budget deficits are connected to worsening economic conditions. When the economy is performing poorly, job losses become prevalent, leading to decreased aggregate demand forcing most companies to scale down while some discretionary consumer firms collapse entirely. Consequently, fewer people pay income tax, and corporate tax declines since most companies are making losses or bankrupt.

Naturally, most people will have to depend on social security programs to get essential needs. This overdependency forces the government to increase its expenditure on such programs. Furthermore, to bring the economy from recession, the government will be forced to increase capital expenditure to create more jobs and spur demand in the economy. Expansionary monetary policies, such as lowering interest rates, can also be used to make cheap loans available to the public.

Using Public Sector Net Borrowing in Analysis

Increasing budget deficit implies that the economy is slowing down, and the government is attempting to revive it. Budget deficits differ for different countries and may not necessarily give the entire picture of the economy’s health. Therefore, it is prudent to combine budget deficit analysis with the analysis of other fundamental economic indicators to determine if the expanding budget deficit is justifiable. For example, using a combination of unemployment levels and the aggressive government expenditure is creating the intended multiplier effect in the economy. More so, it can be used as a scorecard for the government’s fiscal policies’ efficiency and the public sector financial management.

With this strategy, we can spot if the budgetary allocations are going into viable capital expenditures or being spent on non-income generating activities such as paying for a bloated civil service wage. Furthermore, this approach can help stem out corruption in the public sector and seal any public monies’ leakages.

Source: St. Louis FRED

If the government employs expansionary fiscal policies year after year, it may result in a continually increasing inflation rate. Pumping more money into the economy continually increases the rate of inflation. In the flow of income, government spending is an injection. The resultant increase in the aggregate demand drives up prices since demand changes faster than producers can increase their production. It may be more challenging to keep the rising inflation in check if the central banks do not counter the expansionary policies. If the central banks do not implement contractionary monetary policies, the resultant inflation will distort the real wage and real interest rate levels in the economy.

Impact on Currency

As we mentioned earlier, forex traders should analyze the public sector net borrowing data along with other fundamental indicators to get a more comprehensive outlook of the economy. However, here is how the budget deficit affects the forex market.

An expanding public sector net borrowing is negative for the currency. An increasing budget deficit means that the government has to rely heavily on debt to fund its expenditure. With debt accumulation, repayment burden, especially the annual interest rates, weighs heavily on the revenues. If this trend persists, a significant portion of the government’s revenues will end up being used for debt servicing instead of development projects. The government may also be forced to restructure its debts, which come with increased costs. More so, if the growth of debt exceeds that of GDP, it would imply that the budget deficit is reaching unsustainable levels.

Source: St, Louis FRED

In the international markets, the country’s credit ratings will deteriorate. The country’s bonds may be downgraded from investment grade to junk bonds. Consequently, taking debt from the international markets will be more expensive since investors will demand a premium for taking higher risks. Borrowing from the domestic markets using treasury bills will be expensive since investors will demand higher discounts. Similarly, multilateral lenders will insist that the government implement a series of stringent austerity measures to qualify for loans and grants. All these factors come with severe economic and financial consequences for the country.

Sources of Data

In the United Kingdom, the Office for National Statistics (ONS) publishes the UK public sector net borrowing in its monthly Public Sector Finances reportTrading Economics publishes an in-depth review of the UK’s public sector net borrowing along with historical figures. A list of a country’s debt to GDP is also available at Trading Economics.

How Public Sector Net Borrowing Data Release Affects Forex Price Charts

The most recent release of the UK’s public sector net borrowing was on September 25, 2020, at 6.00 AM GMT and can be accessed at Investing.com.

The screengrab below is of the monthly UK public sector net borrowing from Investing.com. To the right, we can find a legend that indicates the level of impact this fundamental indicator has on the GBP.

As can be seen, this low volatility is expected.

In August 2020, UK’s public sector net borrowing worsened to 35.2B from 14.72B in July. This data was worse than analysts’ expectations of 35.05B.

Now, let’s see how this release made an impact on the Forex price charts.

GBP/USD: Before Public Sector Net Borrowing Release on September 25, 2020,
Just Before 6.00 AM GMT

Before the news release, the pair was trading in a neutral trend as shown by the above 5-minute GBP/USD chart. The 20-period MA was flattened with candles forming just around it.

GBP/USD: After Public Sector Net Borrowing Release on September 25, 2020, 
at 6.00 AM GMT

The pair formed a 5-minute bullish candle after the data release. This trend is contrary to the expected negative impact on GBP. Consequently, the pair adopted a bullish stance as the 20-period MA started rising with candles forming above it.

Although the Public Sector Net Borrowing is considered a vital indicator of economic health, public sector net borrowing data has an insignificant impact on the forex price charts.

Categories
Forex Course

153. The Affect Of Monetary Policy On the Forex Market

Introduction

Fundamental analysis is one of the most reliable forex trading strategies in the world that considers economic releases and events. In fundamental analysis, many indicators provide a possibility of upcoming movement in a currency pair. Besides the economic release, some events like monetary policy decisions create an immediate impact on a currency pair.

What is Monetary Policy?

Monetary policy is an action or decision taken by the central bank to control the money supply and achieve the economic sustainability and macroeconomic goal. Every country has a strategic goal based on the current performance and upcoming economic growth of the economy. Therefore, most of the central bank changes the interest rate based on the economic condition.

Usually, the central bank sits quarterly for a monetary policy meeting to discuss the following four core areas:

  • Guideline for the money market
  • Interest rate decision.
  • Monetary policy measurement.
  • The outlook of the economic and financial developments.

How Monetary Policy Affects the Forex Market?

In a monetary policy meeting, the central bank discusses the present economic condition of a country. Therefore, any hawkish tone may create an immediate bullish impact on a particular currency. On the other hand, a dovish tone may create an immediate negative impact on a particular currency in any trading pair.

Besides the immediate effect, there is a long-term impact on the price of a currency pair. We know that any strength in an economy indicates a stronger currency. For example, if the ECB (European Central Bank) provides some consecutive outlook of the European economy saying that the inflation is under control, and the interest rate increased, which is likely to increase again in the next quarter. In that case, the influential European economy may create a Bullish impact on EURUSD, EURAUD, or EURJPY pair.

Moreover, there is some case where the central bank cut the interest rate where traders and analysts were expecting a rate hike. In this scenario, investors may shock at the news, and the effect might be stronger than before.

How to Trade Based on Monetary Policy Statement?

There is two way to trade based on the monetary policy decision. The first one is based on the immediate market effect, which is known as news trading. On the other hand, traders can evaluate the economic condition based on the recent monetary policy statement and see how the economy is growing in the long run. Based on this market scenario, traders can find a long term direction in the market based on economic performance as per the monetary policy statement.

Another way of trading based on the monetary policy decision is the fundamental divergence. If one fundamental indicator does not support another fundamental indicator, it creates fundamental divergence. For example, the US interest rate is increasing based on the strong employment report, but inflation does not support the rate hike. In this situation, traders can take trades with the possibility that the rate hike’s effect will not sustain.

Summary

Let’s summarize the effect of monetary policy in the forex market:

  • Monetary policy meeting happens quarterly where the central bank takes interest rate decision.
  • In the monetary policy meeting, the central bank provides an outlook of the economic and financial developments.
  • A hawkish tone makes the currency stronger, while the dovish tone makes the currency weaker.
  • Traders can identify the fundamental divergence based on the decision on monetary policy meeting.
[wp_quiz id=”86369″]
Categories
Forex Market Analysis

Daily F.X. Analysis, October 19 – Top Trade Setups In Forex – Eyes on ECB and Fed Officials Speech!  

On the news side, the economic calendar is filled with high impact speeches from the central bank officials such as the U.S. Fed Chair Powell and ECB President Lagarde. The U.S. Fed Chair Powell participates in a panel discussion about cross-border payments and digital currencies at the International Monetary Fund’s annual meeting, via satellite. Audience questions are expected. Simultaneously, the U.K MPC Member Cunliffe and the FOMC Member Clarida are also due to speak during the U.S. sessions.

Economic Events to Watch Today  


EUR/USD – Daily Analysis

The EUR/USD pair was closed at 1.17043 after placing a high of 1.17458 and a low of1/16937. Overall the movement of the EUR/USD pair remained bullish throughout the day. On Friday, the EUR/USD pair showed limited movement as most of its daily gains vanished during late trading sessions after the U.S. dollar became strong across the board. The U.S. dollar became stronger after the hopes for the next round of stimulus ahead of upcoming elections faded away.

Meanwhile, the financial markets were calmed on Friday by the hopes that Pfizer could apply for a U.S. emergency use of its coronavirus vaccine in November. The financial markets were affected by the coronavirus pandemic’s resurgence that could undermine the fragile economic recovery. The Wall Street futures and European stocks came back into positive territory on Friday after the U.S. pharmaceutical group said that the vaccine’s regulatory filing could come as soon as safety data are available in the 3rd week of November.

The rising risk sentiment in the market helped EUR/USD stay on the positive trend on Friday despite the rising number of coronavirus cases across Europe. On the data front, at 14:00 GMT, the Final CPI for the year from Eurozone remained flat with the projections of -0.3%. The Final Core CPI for the year also came in line with the expectations of 0.2%. Whereas, the Trade Balance from Eurozone showed a surplus of 21.9B against the forecasted 18.1B and the previous 19/3B and supported single currency Euro that ultimately added strength in EUR/USD pair.

Whereas, the Italian Trade Balance was released at 14:02 GMT that showed a surplus of 3.93B against the forecasted 7.23B and weighed on the Euro. Most data from Eurozone came in line with the forecasts and had a null-effect on EUR/USD pair. From the U.S. side, the Core Retail Sales rose to 1.5% against the forecasted 0.4%, and the Retail Sales was advanced to 1/9% against the projected 0.7% and supported the U.S. dollar. The gains in EUR/USD pair were dragged down by the strong Retail Sales figures from the U.S. that added strength to the U.S. dollar and exerted pressure on EUR/USD pair’s prices on Friday.

The combination of the severe economic downturn due to coronavirus and the high value of the Euro weighed heavily on inflation levels on the Eurozone economy. That is why most of the daily gains in EUR/USD were lost on Friday as the continuous threat of deflation remains a severe problem for policymakers; however, it seems like the negative trend would continue for some time.

Whereas the Capacity Utilization Rate from the U.S. dropped to 71.5% against the expected 72.1%, and the Industrial Production from the U.S. also declined to -0.6% from the forecasted 0.6% and weighed heavily on the U.S. dollar. U.S. reports’ negative results exerted pressure on the U.S. dollar and ultimately raised the EUR/USD pair’s gains.

On the other hand, the U.S. dollar was stronger because of the U.S. President’s offer to increase the size of a fiscal stimulus package by Republicans to win the Democrats’ support. The attempt to increase the stimulus package’s size was due to securing his position in the upcoming elections by providing aid to the struggling Americans. However, there are still no signs that Democrats and Republicans will reach an agreement before November 3rd. The strong U.S. dollar weighed on EUR/USD pair and capped further gains in the currency pair on Friday.


Daily Technical Levels

Support Resistance

1.1676     1.1748

1.1646     1.1790

1.1605     1.1820

Pivot point: 1.1718

EUR/USD– Trading Tip

The EUR/USD is trading at 1.1706 level, holding above an immediate double bottom support level of 1.1693. The U.S. dollar is likely to show some volatility during the day on the back of high and medium impact economic events from the United States. A stronger dollar may trigger a selling trend until the 1.1656 level, while the resistance can be found around 1.1725 and the 1.1748 levels.


GBP/USD – Daily Analysis

The GBP/USD pair was closed at1.29150 after placing a high of 1.29622 and a low of 1.28616. Overall the movement of the GBP/USD pair remained flat throughout the day. On Friday, the GBP/USD pair remained flat as the day’s opening and closing levels for the currency pair remained the same at 1.29150. However, the GBP/USD pair remained marginally lowered for the week because of the contradictory reports. The coronavirus and the U.S. Presidential elections headlines and the Brexit developments had a great impact on GBP/USD pair’s prices during the week.

The GBP/USD pushed to the higher side after the hopes that the U.K. and E.U. could continue trade talks emerged in the market. The U.K. foreign secretary Dominic Raab said that both sides were close to a deal, and this encouraged hopes that PM Boris Johnson will not walk away from further discussions. However, the gains in GBP/USD pair could not live for long as the same hopes faded away after the spokesman to PM Boris Johnson said that the trade talks between the U.K. and E.U. were over unless there was a fundamental change from the economic bloc. These comments weighed on the local currency British Pound, and the pair GBP/USD lost all of its gains from the earlier session.

A day earlier, the E.U. leaders dropped their commitments to work intensively with the U.K. to reach a trade deal and said Britain should make the necessary moves to secure an agreement. The key sticking points for Brexit negotiations were still the level playing field, fisheries, and governance issues.

The lack of progress in Brexit talks and the rising number of coronavirus cases in Britain weighed on local currency GBP. There was no macroeconomic data release from the United Kingdom on the data front, so traders kept following the U.S. dollar movements on Friday. At 17:30 GMT, the Core Retail Sales for September from the U.S. advanced to 1.5% from the projected 0.4%. The U.S. dollar Retail Sales also increased to 1.9% against the forecasted 0.7% and supported the U.S. dollar. The Capacity Utilization Rate from the U.S. dropped to 71.5% from the forecasted 72.1% and weighed on the U.S. dollar. The Industrial Production from the U.S. dropped to -0.6% from the anticipated 0.6% and weighed heavily on the U.S. dollar. The economic data from the United States on Friday also came in mixed and provided a null effect on the GBP/USD pair.

Apart from economic data, the U.S. dollar was strong on Friday due to the U.S. stimulus package’s latest developments. It seems like U.S. President Donald Trump wants to win elections and secure his position for the second time on November 3rd. Trump proposed increasing the $1.8trillion package to provide aid to struggling areas before upcoming elections. However, this statement was not enough to raise bars for the GBP/USD pair on Friday.

Over Brexit Front, the PM Boris Johnson agreed to extend the E.U.’s trade talks until October. It was already agreed between the PM Johnson and E.U. Commission president Ursula von der Leyen. The extended deadline raised the chances for a Brexit deal before the end of the transitions period on December 31st. The rising optimism in the market helped the risk sentiment and favored the GBP/USD pair’s upward direction. However, the upward trend of the currency pair was reversed due to the rising number of coronavirus cases, and the pair ended its day at the same level it had started its day with.


Daily Technical Levels

Support Resistance

1.2859     1.3000

1.2804     1.3086

1.2718     1.3141

Pivot point: 1.2945

GBP/USD– Trading Tip

The GBP/USD is trading at 1.2890 level, having supported over 1.2890 level. Above this, the next target is likely to be found around 1.2957 and 1.3020 level. Simultaneously, a bearish breakout of the 1.2890 support level can extend selling bias until 1.2840. The bearish bias remains solid below the 1.2890 mark. The cable may exhibit a breakout on the release of U.S. related economic events, especially the retail sales and consumer confidence. The leading indicators, such as MACD and RSI, support selling; therefore, it’s worth taking a selling trade below 1.2880 today. 


USD/JPY – Daily Analysis

The USD/JPY pair was closed at 105.377 after placing a high of 105.444 and a low of 105.188. Overall the movement of the USD/JPY pair remained bearish throughout the day. Despite the US dollar’s strength across the board on Friday, the pair USD/JPY dropped and posted losses for the day. It was mainly due to the US stimulus measure’s mixed developments in the market.

On Friday, the US President Donald Trump said that he was ready to increase the $1.8 trillion stimulus relief package for coronavirus. This news raised the hopes that the next round of stimulus will be delivered before elections on November 3rd and raised risk sentiment that supported the USD/JPY pair.

However, the same hopes were faded away after the Senate Majority Leader Mitch McConnell said that he wanted to put forward a highly targeted proposal of $500 billion despite the prior skinny bill that was failed. After Trump’s above statement, the Republican senator’s comments showed that Republicans were against the big stimulus package before elections. It raised concerns that stimulus will not be delivered before elections and weighed on risk sentiment, and dragged the USD/JPY pair on Friday to the lower side.

Meanwhile, the Federal Reserve Bank of Minneapolis President Neel Kashkari said on Friday that the US regulators were going in the wrong direction when it comes to the banks, and the arguments banks use against the strict requirements amount to nonsense. He added that there should be tough and higher capital requirements on the bigger banks.
At 17:30 GMT, the highlighted Core Retail Sales from the United States advanced to 1.5% against the forecasted 0.4% and supported the US dollar. The US dollar Retail Sales also raised to 1.9% from the forecasted 0.7% and supported the US dollar. At 19:00 GMT, the Prelim UoM Consumer Sentiment for October also raised o 81.2 against the forecasted 80.2 and supported the US dollar.

All these highlighted macroeconomic releases from the US gave strength to its local currency but failed to provide upside momentum to the USD/JPY pair on Friday as the focus of trades has been shifted towards stimulus package and upcoming US presidential elections.

At 18:15 GMT, the Capacity Utilization Rate from the United States for September dropped to 71.5% against the projected 72.1% and weighed on the US dollar. In August, the Industrial Production from the US also dropped to -0.6% against the forecasted 0.6% and weighed on the US dollar.

At 19:00 GMT, the Business Inventories in August remained flat with a projection of 0.3%. The Prelim UoM Inflation Expectations came in as 2.7% in October against September’s 2.6%. At 23:00 GMT, the Federal Budget Balance also came in line with the expectations of -124.6B.
The US side’s negative data weighed on the US dollar, which ultimately dragged the USD/JPY pair on the downside on Friday. Furthermore, the risk sentiment was also supported by the news that Pfizer could be applied for a US emergency use of its coronavirus vaccine in November. The raised risk sentiment helped limit the losses of the USD/JPY pair on Friday.


Daily Technical Levels

105.05     105.70

104.82     106.12

104.40     106.36

Pivot point: 105.47

USD/JPY – Trading Tips

The USD/JPY traded sideway, with a neutral bias within a narrow trading range of 105.600 level to the 105.250 mark. Most of the selling triggered following the USD/JPY disrupted an upward channel at the 105.900 mark on Monday. The USD/JPY is trading at 105.459 marks, the support that’s was prolonged by double bottom mark on the two-hourly charts. A bearish violation of the 105.450 mark may encourage additional selling unto the 105.070 support level as the MACD, and the 50 periods EMA are in support of selling sentiment today. Let’s consider opening sell trade beneath 105.60 and buying over 105.050 level today. Good luck!  

Categories
Crypto Market Analysis

Daily Crypto Review, Oct 19 – Stablecoin Market Surpasses $20 Billion; Tether Dominating With Market Cap of Almost $16 Billion

The cryptocurrency sector has spent the weekend pushing towards higher highs but ultimately being stopped out at the most recent highs. Bitcoin is currently trading for $11,471, representing an increase of 0.71% on the day. Meanwhile, Ethereum gained 1.63% on the day, while XRP gained 0.35%.

 Daily Crypto Sector Heat Map

If we look at the top 100 cryptocurrencies, we can see that UMA gained 24.3% in the past 24 hours, making it the top daily gainer. Aave (19.42%) and Reserve Rights (14.8%) also did great. On the other hand, Filecoin lost 23.88%, making it the most prominent daily loser. It is followed by Crypto.com Coin’s loss of 8.92% and Waves’ loss of 4.28%.

Top 10 24-hour Performers (Click to enlarge)

Bottom 10 24-hour Performers (Click to enlarge)

Bitcoin’s market dominance level has increased slightly since our last report, with its value is currently 58.9%. This value represents a 0.2% difference to the upside when compared to when we last reported.

Daily Crypto Market Cap Chart

The crypto sector capitalization has lost a bit of its value since Friday. Its current value is $361.12 billion, representing a decrease of $1.44 billion compared to our previous report.

_______________________________________________________________________

What happened in the past 24 hours?

_______________________________________________________________________

_______________________________________________________________________

Technical analysis

_______________________________________________________________________

Bitcoin

The largest cryptocurrency by market capitalization has spent its weekend building up a bull presence and trying to push towards (and past) the $11,500 resistance level. However, the move failed, and Bitcoin is now trading just under the resistance line. With that being said, the volume that followed this move was incredibly low, which implies that a bigger move is ahead, and that traders should pay attention to what happens with the volume in the near future.

Bitcoin will most likely either go up or stay above $11,300, as many analysts say that Bitcoin is done with its sub-$11,000 area. However, we do have to pay attention to the Bitcoin CME Futures Gap.

BTC/USD 1-day Chart

Bitcoin’s technical overview is tilted towards the buy-side on every single time-frame. While its 4-hour and 1-day time-frames are showing neutral bullishness, its weekly and monthly sentiment is extremely positive.

BTC/USD 1-day Technicals

Technical factors (4-hour Chart):
  • Price is above its 50-period EMA and at its 21-period EMA
  • Price near its top Bollinger band
  • RSI is neutral (57.29)
  • Volume is below average and descending
Key levels to the upside          Key levels to the downside

1: $11,500                                 1: $11,300

2: $11,630                                 2: $11,180

3: $12,000                                  3: $11,000

Ethereum

Ethereum’s price movement throughout the weekend looked a lot like Bitcoin’s, but with a twist. The second-largest cryptocurrency by market cap moved towards the downside and (just like Bitcoin) created three lower highs on the way down. However, unlike Bitcoin, Ethereum has broken the downtrend and shot up in recent hours, though only to be stopped by the $378 resistance level. While there is still a chance for Ethereum to break this level, it will most likely be stuck below it (possibly within a range bound by $371 and $378) in the short-term.

ETH/USD 4-hour Chart

Ethereum’s technicals are showing a tilt towards the buy-side on all time-frames, with lower time-frames being more positive, while longer time-frames being more tilted towards the neutral stance (mostly oscillators).

ETH/USD 1-day Technicals

Technical Factors (4-hour Chart):
  • The price is above its 50-period and its 21-period EMA
  • The price at its middle Bollinger band
  • RSI is neutral (54.55)
  • Volume is descending
Key levels to the upside          Key levels to the downside

1: $378                                     1: $371

2: $400                                     2: $360

3: $415                                      3: $334

Ripple

XRP spent the weekend mostly trading sideways or rising a little after a whole week of price drops. The fourth-largest cryptocurrency by market capitalization fell under the $0.2454 and stayed below it over the weekend, and even though it is moving towards it, the current volume would not support a break of such a major resistance level.

Many analysts are calling for even more downward movement from XRP, justifying it by saying that this is a continuation of a trend dating back from 2018. The reduced volatility and range-bound trading seem to be confirming this thesis.

XRP/USD 4-hour Chart

XRP’s technicals are extremely bearish. Its 4-hour and daily sentiment being tilted towards the sell-side fully, while its weekly and monthly overviews are showing some signs of neutrality, though they are also heavily bearish.

XRP/USD 1-day Technicals

Technical factors (4-hour Chart):
  • The price is below both its 50-period EMA and its 21-period EMA
  • Price is at its middle Bollinger band
  • RSI is neutral (42.17)
  • Volume is below average
Key levels to the upside          Key levels to the downside

1: $0.2454                                 1: $0.235

2: $0.26                                     2: $0.227

3: $0.266                                  3: $0.221


Categories
Crypto Market Analysis

BTC/USD Chart Overview + Possible Outcomes

In this BTC /USD 1-day time-frame analysis, we will be looking at the most recent events, the current technical formations, as well as discussing possible outcomes.

Overview

Bitcoin has had a week of explosive gains, mostly due to its fundamentals. The US President Donald Trump announced another set of stimulus packages (while he was completely against it just before the announcement), as well as Jack Dorsey’s Square investing $50 million in Bitcoin sparked bulls’ interest and made the largest cryptocurrency by market cap push above $11,700. Bitcoin established support above its previous heavy resistance level, which is certainly another great sign for the bulls. However, one technical formation says that additional correction is ahead before the next push towards $12,000.

Technical factors

Bitcoin has left its triangle formation abruptly and to the upside, breaking not only the formation but also numerous resistances. The price started consolidating in a range bound by $11,300 to the downside and $11,500 to the upside, which was a great trading opportunity for traders that like sideways trading. Taking a look at smaller time-frames, Bitcoin has built a downwards-sloping channel that calls for a slight pullback (and a possible fill of the Bitcoin CME Futures gap) before pushing further up.

There are two most likely versions of this pullback, and both will be discussed above. However, an unexpected price spike or plummet is always a possibility, no matter how slim.

Likely Outcomes


Bitcoin currently has two main scenarios. It can play out, and both involve a pullback before a push towards $12,000.

  1. As shown on the chart, Bitcoin will most likely follow the channel until it finds strong support; it cannot go below, after which it will break the channel to the upside. After finding confirmation above it, it is free to push towards the upside ($11,730, $11,960, or even $12,000).
  2. The other scenario is a bit tricky, and therefore a bit less likely. The premise for this scenario is the head and shoulders chart pattern that started in late April of this year. The most recent high of this scenario is the top of the right shoulder, while the neckline is the black ascending line shown on the chart. In this scenario, the price would move alongside the dotted line until it hit the neckline, after which it would start to go up. In this case, the pullback and confirmation would most likely happen above $11,300, and only after consolidating above this level could Bitcoin push to the aforementioned targets.
  3. The scenario in which Bitcoin suddenly pushes up or down sharply and swiftly is incredibly unlikely and would have to be backed by some major news.
Categories
Forex Course

152. Knowing The Fundamental Factors That Affect The Currency Values

Introduction

Many fundamental factors affect currency value. Therefore, whether we trade based on technical analysis fundamental analysis, we should know these factors to understand the currency markets.

Important Fundamental Factors That Affect Currency Values

Fundamental factors are economic releases and events that have a direct impact on currency value. If we want to trade based on fundamental analysis, we should focus on these releases and make a decision based on the result. Let’s have a look at the important fundamental factors that affect currency values

Interest Rate

Interest rate is the amount that a central bank charges if anyone takes loans from the bank. Central banks change the interest rate to control the country’s money supply; therefore, it directly affects the currency value.

Inflation Rate

Inflation is the buying power of money. Lower inflation means higher buying power, and higher inflation, the lower buying power.

Consumer Price Index (CPI)

CPI or CPI inflation is the price of consumer needs. Any increase in CPI is bad for the currency, while a decrease in CPI is good for the currency.

Producer Price Index (PPI)

PPI is the price of products or elements of businesses. An increase in PPI means businesses need additional money to buy raw materials that may increase the finish product rate.

Retail Sales

Retail sales indicate the number of products and services bought by consumers. An increase in retail sales indicates higher consumer activity in the market that is good for the currency value.

Foreign Exchange reserve

Foreign exchange reserve is the amount of money that is reserved in the central bank. An increase in foreign reserves is positive for a country’s economy and currency value.

Non-Farm Payroll (NFP)

On the first Friday of every month, US Labor Statistics releases the number of unemployed persons in the USA. As the US dollar is the most used currency globally, any change in NFP affects the overall forex market.

Central Bank Meets

In every quarter, central banks of every country provide an outlook of the domestic and international economy. In this meeting, any hawkish tone creates a positive impact on the currency value, while any dovish tone creates a negative impact on the currency value. We should keep an eye on how central banks are reacting to the central banks meeting to get an outlook of the currency value.

Conclusion

Besides the above-mentioned fundamental factors, there is a political movement, trade natural disaster, etc. also impacts the currency market. Moreover, in an uncertain market condition, no trading strategy works well, whether based on technical or fundamental analysis. Let’s dig deeper into each of these fundamental factors and more interesting aspects in the upcoming lessons. Cheers.

[wp_quiz id=”86366″]
Categories
Forex Fundamental Analysis

Understanding The Importance Of ‘New Home Sales’ Macro Economic Indicator

Introduction

In any economy, demand is one of the primary leading indicators of economic growth and inflation. Therefore, the aggregate demand data plays a vital role in predicting economic growth and possible monetary and fiscal policies. Although considered a lagging indicator, the data on new home sales provides insight into households’ changing demand and their income situation.

Understanding New Home Sales

As the name suggests, new home sales provide data on the newly built single-family that were sold or are for sale during a given period. New home sales data is also referred to as new residential sales. Sales mean that a deposit for the house has been taken or a sales agreement has been signed.

The data on new home sales is derived from a survey of a sample of houses from the building permits register. Since the data obtained is from a sample survey, it is bound to be subject to sampling variability as well as non-sampling error. Response bias, nonreporting, and under-coverage factors also influence this data. Nonetheless, the data is nationally representative.

The new home sales report shows data for the new privately-owned houses and new houses by construction stage. The report presents data that are both seasonally adjusted and those not seasonally adjusted.

  • The number of units sold during the period
  • The number of units for sale at the end of that period
  • The ratio between the houses sold and those for sale
  • The median and average sale price

How to use New Home Sales Data for Analysis

Although the new home sales data is generally regarded as a lagging economic indicator of demand in real estate, there is no dispute that broader macroeconomic trends influence new home sales. Here are some of the factors that influence new home sales.

Household income: Significant changes in the households’ disposable income will change their demand for new homes. Disposable income is the residual amount after paying taxes. These income changes could be brought about by an increase in wages, reduction in taxes, or investment windfall. If there is an increase in disposable income, households’ demand for new homes will increase. They could right away purchase already completed units or get into sale agreements for houses ongoing construction. Therefore, new home sales can be expected to increase during the period of increased household income. Conversely, a decrease in disposable income will make households cut back on non-essential expenditure, such as buying new homes. Consequently, new home sales will be expected to decline.

Unemployment: The rate of unemployment in the economy is directly linked to the households’ welfare. A lower unemployment rate implies that more households have income and can thus afford to put down deposits for a new home. Similarly, the unemployment rate reduction signifies that more people can afford to service a mortgage loan. Therefore, a low unemployment rate can be correlated to an increase in the demand for new houses, hence increasing new home sales.

Source: St. Louis FRED

Conversely, higher rates of unemployment mean that more people are out of gainful employment. This instance forces households to prioritize their expenditures to cater to the essential items. Furthermore, higher unemployment could mean that more households do not qualify for a mortgage. Thus, a reduction in the new home sales can be expected with increasing unemployment.

Interest rate: In the financial markets, the prevailing interest rate determines the cost of borrowing – especially home mortgages. When interest rates are low, it means that more households can afford to borrow cheaply. It becomes easier for households to service debt without digging too much into their income, thus ensuring no significant changes in their welfare. Since most households can afford to borrow cheaply when interest rates are low, the demand for new homes can be expected to increase.

When interest rates are high, the cost of borrowing increases, and with it, the cost of a mortgage. Higher rates would restrict some households from servicing expensive debt without significantly impacting their welfare. Thus, with an increasing interest rate, it can be expected that new home sales will decline.

Impact on Currency

The new home sales data can impact a country’s currency in several ways. Here is how.

The new home sales can be used to show economic recoveries. Buyers of new homes could be speculative buyers – those who expect these homes’ prices to increase in the future then resell. To them, to them, new homes are an investment. Thus, the new home sales data can be taken as a sentiment about the economy. An increase in the new home sales could imply that the future economy is expected to improve. Similarly, in times of recessions, like the current coronavirus-inflicted recession, the new home sales data can be used to show market recovery. Therefore, an increase in the new home sales can be seen as a sign of economic recovery, which increases the value of the currency relative to others.

The new home sales can also be used to show when an economy is headed for a recession. Typically, recessions are punctuated with declining economic conditions, such as an increasing unemployment rate. Continually declining new home sales could indicate a looming recession as economic welfare of households is deteriorating. Furthermore, in these circumstances, expansionary monetary and fiscal policies tend to be implemented. These policies are designed to prevent the worst-case scenario from playing out. In the first quarter of 2020, such expansionary policies were witnessed globally. They were meant to prevent extreme economic shocks from the coronavirus pandemic. These policies result in the depreciating of the currency relative to other currencies.

Sources of Data

In the US, for example, the US Census Bureau conducts the survey and publishes the new home sales data for the US. An in-depth and historical review of the US’s new home sales is available at St. Louis FREDTrading Economics publishes new home sales data for countries globally. Furthermore, you can access the forecast of the new home sales globally up to 2022.

How New Home Sales Data Release Affects Forex Price Charts

The most recent release of the US’s new home sales was on September 24, 2020, at 10.00 AM ET. The news release can be accessed at Investing.com.

The screengrab below is of the monthly new home sales from Investing.com. On the right, we can see a legend that indicates the level of impact this fundamental indicator has on the USD.

As can be seen, high volatility is to be expected.

In August 2020, the new home sales were 1011K compared to 965K in July. The sales were higher than the anticipated 895K. Thus, a strong USD is expected.

Now, let’s see how this release made an impact on the Forex price charts.

EUR/USD: Before New Home Sales Release on September 24, 2020, 
Just Before 10.00 AM ET

Before the news release, the EUR/USD pair was trading in a neutral pattern as the 5-minute candles formed just around a flattening 20-MA.

EUR/USD: After New Home Sales Release on September 24, 2020, at 10.00 AM ET

After the news release, the pair formed a 5-minute ‘hammer’ candle, indicating that the USD weakened. Subsequently, the pair adopted a bullish stance with the 20-period MA rising.

As shown by the above analyses, the US new home sales data release failed to produce significant volatility. Therefore, we can conclude that new home sales are insignificant in the forex market as an economic indicator.

Categories
Forex Signals

AUD/CAD Trimmed Its Eary-Day Gains & Dropped – Downward Channel In Play!   

The AUD/CAD failed to extend its early-day modest gains and edged lower around the 0.9362 level. However, the bearish sentiment around the currency pair could be associated with the on-going tussle between the US-China and stimulus deadlock in the U.S., which leads to the decline in U.S. stock’s future. This, in turn, undermined the perceived risk currency Australian dollar and contributed to the currency pair losses. The acceleration in the coronavirus (COVID-19) wave 2.0 also played a major role in undermining the market trading sentiment, which added further burden around the Australian dollar’s perceived risk currency and dragged the currency pair low. 

On the contrary, the weaker crude oil prices, triggered by the combination of factors, tend to weaken the demand for the commodity-linked currency the loonie, which becomes the factor that helps the currency pair to limit its deeper losses. The AUD/CAD currency pair is currently trading at 0.9362 and consolidating in the range between 0.9357 – 0.9386.

Intensifying restrictive measures such as lockdowns and curfews in Europe and the U.K. to control the 2nd-wave of coronavirus outbreak pushed global equity markets down. As per the latest report, the daily new cases increased past Thursday’s record level of 6,638, with 7,334 new infections leading to 348,557 total counts. The death toll seems to ease from the previous day’s 33 to 24 while marking a total of 9,734 fatalities. Apart from this, the U.S. policymakers’ inability to offer the much-awaited COVID-19 stimulus also played its major role in weakening the market trading sentiment, which in turn exerted some additional pressure on the perceived riskier Australian dollar and contributed to the currency pair losses.

Elsewhere, the intensifying tensions between the U.S. and China added additional burdens around the global trading market. The tension between the world’s two largest economies fueled further after China aggressively warns the U.S. to step back from Taiwan Strait. However, these lingering Sino-US tensions kept challenging the risk-on market sentiment and contributed to the currency pair losses.

Access the pond, the reason for the downbeat market trading sentiment could also be associated with the latest report suggesting that the World Health Organization (WHO) said that the previously cheered corona-vaccine from Gilead Sciences Inc., Remdesivir, did not affect COVID-19 patients’ length of hospital stay or chances of survival. These negative headlines exerted some additional pressure on the market sentiment. The S&P 500 Futures dropped as it currently marks 0.15% intraday losses to 3,472.

The reason for the crude oil losses could also be associated with the latest reports suggesting that the Organization of the Petroleum Exporting Countries (OPEC) decided to ease supply cuts despite rapidly falling fuel demand in Europe and the U.S. amid rising numbers of COVID-19 cases in both regions. Thus, the decline in oil prices undermined the demand for the commodity-linked currency the loonie and became the key factor that helps the currency pair limit its deeper losses.

In the absence of the major data/events on the day, the market traders will keep their eyes on September month’s Retail Sales and Michigan Consumer Confidence for October. Meanwhile, the USD moves and coronavirus headlines will also closely followed as they could play a key role in the crude oil. 


Daily Support and Resistance

S1 0.9242

S2 0.9303

S3 0.9341

Pivot Point 0.9364

R1 0.9402

R2 0.9426

R3 0.9487

Entry Price – Sell 0.93594

Stop Loss – 0.93994

Take Profit – 0.93194

Risk to Reward – 1:1

Profit & Loss Per Standard Lot = -$400/ +$400

Profit & Loss Per Micro Lot = -$40/ +$40

Fellas, now you can check out forex trading signals via Forex Academy mobile app. Follow the links below.

iPhone Users: https://apps.apple.com/es/app/fasignals/id1521281368

Andriod Users: https://play.google.com/store/apps/details?id=academy.forex.thesignal&hl=en_US

Categories
Forex Market Analysis

Daily F.X. Analysis, October 16 – Top Trade Setups In Forex – Retail Sales in Focus! 

On the news side, the economic calendar is likely to offer another round of central bankers’ speeches worldwide. BOC Gov Council Member Lane, U.S. FOMC officials, is due to speak today. Simultaneously, the main highlight of the day is likely to be ECB President Lagarde Speaks and Unemployment Claims from the U.S. economy.

Economic Events to Watch Today  


EUR/USD – Daily Analysis

The EUR/USD pair was closed at 1.17068 after placing a high of 1.17576 and a low of 1.16883. Overall the movement of the EUR/USD pair remained bearish throughout the day. The EUR/USD pair dropped on Thursday to its nine-day lowest level over the strength of the U.S. dollar and rising fears of a second wave of coronavirus in Europe. 

The U.S. dollar was strong across the board on Thursday, with the market ruling out the chance of more fiscal stimulus before the November elections despite the surge in coronavirus cases. Furthermore, the unexpected rise in the Philadelphia Fed Manufacturing Index also helped raise the U.S. dollar across the board on Thursday. At 17:30 GMT, it raised to 32.3 in October against the expectations of 14.4 and supported the U.S. dollar. The advanced index encouraged hopes that the U.S. economy could demonstrate greater resilience in the year’s final months.

This raised the U.S. dollar despite the rise in initial jobless claims and weighed on EUR/USD pair.

Meanwhile, the E.U. Summit started on Thursday. E.U. leaders met in Brussels to seek a way out of the Brexit impasse as the bloc remained divided over-ambitious targets to slash greenhouse gas emissions.

E.U. leaders also agreed to extend the trade negotiations with Britain. In a joint statement, E.U. leaders called on the U.K. to make the necessary moves to make an agreement possible and shift from their red lines to make a Brexit deal possible.

The E.U. chief negotiator Michel Barnier said that he wanted talks to continue with the U.K. till next month. Whereas, the German Chancellor Angela Merkel said that the E.U. should also compromise with the U.K. to reach a final agreement. On the data front, the French Final CPI for September came in line with -0.5% expectations. The data from Europe failed to impact the prices of a single currency.

Moreover, the European Central Bank President Christine Lagarde said on Thursday that ECB would be prepared to inflict additional emergency measures to seize the economic fallout from the coronavirus crisis, with the region facing a rapid surge in coronavirus infections. As per the World Health Organization, Europe has recorded more than 7.4 million coronavirus cases, with more than 251000 deaths and an alarming hospitalization rate. Lagarde said that as the second wave of coronavirus was hitting Europe’s coastline, ECB should make sure all the resources that ECB has available will be used to deal with the situation. She added that many resources, including asset purchases and interest rates, were still available, and ECB was ready to use them in need.

The ECB’s concerns and readiness to use further stimulus in need also weighed on Euro currency and dragged the EUR/USD pair downward.

Daily Technical Levels

Support Resistance

1.1676     1.1748

1.1646     1.1790

1.1605     1.1820

Pivot point: 1.1718

EUR/USD– Trading Tip

The EUR/USD is trading at 1.1706 level, holding above an immediate double bottom support level of 1.1693. The U.S. dollar is likely to show some volatility during the day on the back of high and medium impact economic events from the United States. A stronger dollar may trigger a selling trend until the 1.1656 level, while the resistance can be found around 1.1725 and the 1.1748 levels.


GBP/USD – Daily Analysis

The GBP/USD pair was closed at 1.29037 after placing a high of 1.30299 and a low of 1.28903. Overall the movement of the GBP/USD pair remained bearish throughout the day. The British Pound fell dramatically against the U.S. dollar on Thursday after the E.U. leaders urged U.K. to make necessary moves to secure an agreement instead of committing to work intensively with the U.K. to reach a trade deal. 

After the first day of the E.U. Summit, the chief EU negotiator Michel Barnier said that the level playing field, fisheries, and governance issues remained, as the key sticking points that held up the progress on trade talks. E.U. officials also criticized the U.K. Brexit negotiator David Frost and called on the U.K. to make further concessions to reach a deal on trade. Prime Minister Boris Johnson will announce his decision on whether the U.K. will walk away or continue talks on Friday.

One of many reasons behind the lack of progress in talks was the U.K. facing an aggressive second wave of the coronavirus that has forced the government to impose lockdown restrictions that could slow the recovery.

In Great Britain, talks continued between the government and local leaders over expanding the strictest coronavirus restrictions to more parts of England. The rising number of coronavirus cases in the U.K. raised the need for restrictions that will affect the economic recovery. These recovery fears weighed on local currency and ultimately dragged the GBP/USD pair on the downside.

On the data front, the C.B. Leading Index from the United Kingdom came in as 0.5% for August compared to July’s 0.8% and weighed on GBP that added further pressure on GBP/USD pair. From the U.S. side, the Philly Fed Manufacturing Index rose in October to 32.3 from September’s 15.0, and the forecasted 14.4 supported the U.S. dollar. The strong U.S. dollar added further strength to the rising GBP/USD pair on Thursday.

Meanwhile, the U.S. dollar was also strong onboard after Nancy Pelosi said that Trump only wanted to secure his position. That is why he was forcing a smaller stimulus package ahead of elections. She added that he did not have any concern about the struggling Americans and refused to pass a half stimulus measure. These lingering tensions confusion related to U.S. stimulus measures raised uncertainty and supported the U.S. dollar. The main driver of the GBP/USD pair’s downward momentum on Thursday was E.U. leaders’ calls for the U.K. to make necessary moves to reach consensus on the Brexit deal and the rising number of restrictions in England. 

Daily Technical Levels

Support Resistance

1.2859     1.3000

1.2804     1.3086

1.2718     1.3141

Pivot point: 1.2945

GBP/USD– Trading Tip

The GBP/USD is trading at 1.2890 level, having supported over 1.2890 level. Above this, the next target is likely to be found around 1.2957 and 1.3020 level. Simultaneously, a bearish breakout of the 1.2890 support level can extend selling bias until 1.2840. The bearish bias remains solid below the 1.2890 mark. The cable may exhibit a breakout on the release of U.S. related economic events, especially the retail sales and consumer confidence. The leading indicators, such as MACD and RSI, support selling; therefore, it’s worth taking a selling trade below 1.2880 today. 


USD/JPY – Daily Analysis

The USD/JPY pair was closed at 105.420 after placing a high of 105.491 and a low of 105.060. Overall the movement of the USD/JPY pair remained bullish throughout the day. On Thursday, the U.S. dollar appreciated across the board due to its safe-haven status after the rising concerns about tightened coronavirus restrictions. The rising number of coronavirus infections with little expectations of a fiscal stimulus deal kept the investors away from risk.

On Thursday, the U.S. Treasury Secretary Steven Mnuchin said he was open to a targeted deal with the House Speaker Nancy Pelosi. He said that Pelosi should move 300 billion dollars to needy Americans from the previous fund’s leftovers. In response, she replied that Donald Trump only wanted to seek a symbolic victory and genuinely had no intentions to help the struggling poor people. Pelosi also said that she would not go for a half stimulus measure and stick to her $2.2 trillion packages.

These tensions surrounding the U.S. stimulus package dropped the hopes that any measure will release before elections and supported the U.S. dollar. The rising U.S. dollar help provides further support to the USD/JPY pair.

The Philly Fed Manufacturing Index for October raised to 32.3 from the forecasted 14.4 and the previous 15.0 and supported the U.S. dollar. At 17:30 GMT, the Unemployment Claims from the U.S. for last week raised to 898K from the forecasted 810K and weighed on the U.S. dollar. The Empire State Manufacturing Index from the U.S. dropped to 10.5 from the expected 13.9 and weighed on the U.S. dollar. The Import Prices from September remained flat with the expectations of 0.3%. From the Japan side, the Tertiary Industry Activity for August was released at 09:30 GMT that fell short of expectations of 1.2% and came in as 0.8% and weighed on the Japanese Yen that ultimately supported the additional gains in USD/JPY pair on Thursday.

Traders ignored the rising number of unemployment claims and shifted their focus towards the rising Philly Fed Manufacturing Index and supported the USD/JPY pair’s bullish movement. The advanced index refreshed hopes that the U.S. economy could reveal greater flexibility in the final months of the year.

Furthermore, the Dallas Federal Reserve President Robert Kaplan said that minorities and women who have been affected by the job losses due to the coronavirus pandemic would need help to get back to work. Kaplan said that the economic activities were shifting more towards the less dependent sectors on face-to-face interaction due to the fears of coronavirus spread. Whereas, the Fed’s vice chair of supervision, Randal Quarles, said a need for more aid in the short-term funding market.

The rising number of coronavirus in the absence of any approved vaccine has raised fears for an economic recovery that has already been under pressure due to ongoing geopolitical tensions, the trade war between the U.S. & China, and the deep recession. These uncertainties kept the U.S. dollar supportive due to its safe-haven status and helped the USD/JPY pair post gains on Thursday.

Daily Technical Levels

105.05     105.70

104.82     106.12

104.40     106.36

Pivot point: 105.47

USD/JPY – Trading Tips

The USD/JPY traded sideway, with a neutral bias within a narrow trading range of 105.600 level to the 105.250 mark. Most of the selling triggered following the USD/JPY disrupted an upward channel at the 105.900 mark on Monday. The USD/JPY is trading at 105.459 marks, the support that’s was prolonged by double bottom mark on the two-hourly charts. A bearish violation of the 105.450 mark may encourage additional selling unto the 105.070 support level as the MACD, and the 50 periods EMA are in support of selling sentiment today. Let’s consider opening sell trade beneath 105.60 and buying over 105.050 level today. Good luck!  

Categories
Crypto Market Analysis

Daily Crypto Review, Oct 16 – ICO That Raised $257 Million in 60 Minutes Finally Launched; Bitcoin Pushing Towards $11,500

The cryptocurrency sector has spent the day trying to push higher highs but failed as Bitcoin didn’t make it above $11,500. Bitcoin is currently trading for $11,486, representing an increase of 0.65% on the day. Meanwhile, Ethereum lost 0.64% on the day, while XRP lost 1.42%.

 Daily Crypto Sector Heat Map

If we look at the top 100 cryptocurrencies, we can see that Filecoin gained an astonishing 120.78% in the past 24 hours, making it the top daily gainer. ABBC Coin (39.25%) and Blockstack (9.35%) also did great. On the other hand, Aave lost 15.89%, making it the most prominent daily loser. It is followed by Arweave’s loss of 14.13% and Synthetix Network Token’s loss of 8.96%.

Top 10 24-hour Performers (Click to enlarge)

Bottom 10 24-hour Performers (Click to enlarge)

Bitcoin’s market dominance level has stayed at the same level since our last report, with its value currently being 58.7%. This value represents a 0% difference when compared to when we last reported.

Daily Crypto Market Cap Chart

The crypto sector capitalization has gained a bit of its value over the course of the past 24 hours. Its current value is $362.56 billion, representing an increase of $1.46 billion compared to our previous report.

_______________________________________________________________________

What happened in the past 24 hours?

_______________________________________________________________________

_______________________________________________________________________

Technical analysis

_______________________________________________________________________

Bitcoin

The oldest cryptocurrency spent the past 24 hours trying to push past the $11,500 resistance. While the fight for it still continues, there is a strong possibility that Bitcoin will actually stabilize its price above it. If that happens, bulls might come in even stronger and push the price towards $11,630, or even $11,730.

If, however, Bitcoin moves back below $11,500, the sentiment won’t change to a lot more bearish one, as Bitcoin is used to trading above $11,300 as of lately.

BTC/USD 1-day Chart

Bitcoin’s technical overview is extremely bullish on every single time-frame for almost a month now, with longer time-frames showing complete bullish sentiment, while the shorter ones are slightly less tilted towards the buy-side.

BTC/USD 1-day Technicals

Technical factors (4-hour Chart):
  • Price is above its 50-period EMA and at its 21-period EMA
  • Price near its top Bollinger band
  • RSI is neutral (60.70)
  • Volume is average
Key levels to the upside          Key levels to the downside

1: $11,500                                 1: $11,300

2: $11,630                                 2: $11,180

3: $12,000                                  3: $11,000

Ethereum

Unlike Bitcoin that tried to push towards its resistance level, Ethereum spent the day fighting to stay above the $378 level it recently fell under. The second-largest cryptocurrency by market cap tested the $371 support level, which held up quite nicely and attempted a push towards (now) resistance level of $378. While the fight for it still lasts, Ethereum will most likely end up above it if Bitcoin’s price doesn’t drop and pull ETH alongside.

ETH/USD 4-hour Chart

Ethereum’s technicals on all time-frames are a varying degree of bullish. While its 4-hour and monthly overviews are a bit more neutral, its daily and weekly overviews are strongly tilted towards the buy-side.

ETH/USD 1-day Technicals

Technical Factors (4-hour Chart):
  • The price is above its 50-period and right at its 21-period EMA
  • The price at its middle Bollinger band
  • RSI is neutral (54.03)
  • Volume is average
Key levels to the upside          Key levels to the downside

1: $378                                     1: $371

2: $400                                     2: $360

3: $415                                      3: $334

Ripple

XRP has spent the past 24 hours continuing its drop towards the $0.2454 support level. XRP is approaching a quarterly price drop of 20% if the price breaks to the downside. However, so far, the $0.2454 support level is holding up, and XRP bears are not able to break it. If the support level break, we can expect XRP to move towards $0.235.

Traders should either wait for a bounce towards the upside (less likely and riskier) or wait for a possible break below $0.2454 to trade alongside the strong move to the downside.


XRP/USD 4-hour Chart

XRP’s technicals have changed the sentiment to quite bearish in the past couple of days. While its monthly sentiment was bearish for a while, its 4-hour and 1-day overviews have turned completely towards the sell-side. On the other hand, XRP’s weekly overview is still slightly bullish.

XRP/USD 1-day Technicals

Technical factors (4-hour Chart):
  • The price is below both its 50-period EMA and its 21-period EMA
  • Price is slightly above its lower Bollinger band
  • RSI is neutral (40.83)
  • Volume is average (except for a couple of huge volume candle)
Key levels to the upside          Key levels to the downside

1: $0.266                                   1: $0.2454 

2: $0.27                                     2: $0.235

3: $0.273                                  3: $0.227


Categories
Forex Signals

AUD/USD Breaks Below Upward Channel – Braceof Sell Upon Retracement! 

During Thursday’s early European trading hours, the AUD/USD currency pair failed to stop its previous session bearish moves and took further offers near well below 0.7100 level, mainly due to the disappointing release of employment details, which showed that Australia’s economy lost 29.5K jobs in September. This, in turn, undermined the Asutliann dollar and contributed to the currency pair declines. Apart from this, the increasing probabilities of an interest rate cut by the Reserve Bank of Australia in November also played its major role in undermining the Australian dollar. Across the pond, the prevalent risk-off market sentiment, triggered by the worsening coronavirus (COVID-19) conditions in Europe and the U.K., exerted some additional pressure on the perceived riskier Aussie and dragged the currency pair below 0.7100 mars.

However, the global risk sentiment was further pressured by the fading hopes of additional U.S. fiscal stimulus. On the data front, the economy has lost 29.5K jobs in September against expectations for 35K losses and down from August’s 111K additions. The seasonally adjusted Unemployment Rate surged to 6.9% against expectations for a rise to 7.1% from 6.8%. In the meantime, the part-time jobs dropped by 9.4K in September against 74.8K additions in August. At the same time, the full-time employment sank by 20.1K against 36.2K additions in August. 

Considering the recent condition of the economy, the RBA’s Governor Lowe said that the benchmark interest rate could be cut down to 0.10% from the current record low of 0.25%, which undermined the Australian dollar exerted some additional pressure on the currency pair. The market trading sentiment remains depressed during the early European session as the condition of the second wave of coronavirus infections in Europe and the U.K. getting worse time by time, which suggests that the local lockdowns cannot tame the pandemic, which in turn suggests fresh national activity restrictions. 

In the meantime, the fears of a no-deal Brexit and the dovish tone of major central bankers pushing for further fiscal help also exert downside pressure on the market trading sentiment, which in turn undermined perceived riskier Aussie and dragged the currency pair below 0.7100 marks.

Additionally, the long-lasting inability to pass the U.S. fiscal package also weighed on the risk sentiment, which eventually undermined the perceived riskier Australian dollar and contributed to the currency pair gains. Despite U.S. President Donald Trump’s recent push to break the coronavirus stimulus deadlock, the opposition Democratic Party remains up in its demands. As per the latest report, the U.S. Treasury Secretary Mnuchin recently blamed the opposition to put obstacles for the much-awaited aid package before the presidential election to keep President Donald Trump lagging the election polls. 

At the US-China front, the renewed concerns over worsening diplomatic tensions between the world’s two largest economies also exerted downside pressure on the market trading, which keeps the AUD/USD currency pair under pressure. Other than the US-China tussle, Australia and China are also loggerheads with each other.

As a result, the broad-based U.S. dollar succeeded in extending its Asian session loss gains es and took some further bid during the early European session as investors still prefer the safe-haven assets in the wake of the risk-off market sentiment. However, the U.S. dollar gains seem rather unaffected by the intensifying political uncertainty ahead of the upcoming U.S. presidential election on November 3. However, the incoming polls tend to recommend a clear-cut presidential success for the Democrat nominee Joe Biden, which might cap additional upside momentum for the U.S. dollar. However, the U.S. dollar gains become the key factor that kept the currency pair under pressure. At the same time, the U.S. Dollar Index that tracks the greenback against a bucket of other currencies inched up 0.02% to 93.398 by 9:58 PM ET (1:58 AM GMT).

Looking forward, the traders will keep their eyes on the weekly U.S. Initial Jobless Claims, which is expected 825K versus 840K prior. Apart from this, the continuous drama surrounding the US-China relations and updates about the U.S. stimulus package will not lose their importance. 


Daily Support and Resistance

S1 0.7095

S2 0.7133

S3 0.715

Pivot Point 0.717

R1 0.7187

R2 0.7208

R3 0.7245

The AUD/USD pair has violated the double bottom support level of 0.7150 level, and below this, the pair may drop further until the next support area of 0.7098 level. On the higher side, the pair may find resistance at 0.7150 and 0.7190 level. The bearish bias remains solid today, especially below 0.7150.

Entry Price – Buy 105.245

Stop Loss – 105.645

Take Profit – 104.845

Risk to Reward – 1:1

Profit & Loss Per Standard Lot = -$400/ +$400

Profit & Loss Per Micro Lot = -$40/ +$40

Fellas, now you can check out forex trading signals via Forex Academy mobile app. Follow the links below.

iPhone Users: https://apps.apple.com/es/app/fasignals/id1521281368

Andriod Users: https://play.google.com/store/apps/details?id=academy.forex.thesignal&hl=en_US

Categories
Forex Market Analysis

Daily F.X. Analysis, October 15 – Top Trade Setups In Forex – ECB President Lagarde Speaks

On the news side, the economic calendar is likely to offer another round of central bankers’ speeches worldwide. BOC Gov Council Member Lane, U.S. FOMC officials, is due to speak today. Simultaneously, the main highlight of the day is likely to be ECB President Lagarde Speaks and Unemployment Claims from the U.S. economy.

Economic Events to Watch Today  


EUR/USD – Daily Analysis

The EUR/USD pair was closed at 1.17459 after placing a high of 1.17708 and a low of 1.17197. Overall the movement of the EUR/USD pair remained flat yet slightly bullish throughout the day. The EUR/USD pair followed its previous day’s bearish trend and extended its decline in the first half of the day but started to recover losses in the second half of the day as the U.S. dollar became weak. However, the gains were also limited due to the increased uncertainty in the market related to Europe’s coronavirus situation.

The risk sentiment in the market supported the consolidated movement of the EUR/USD pair on Wednesday and turned the prices on the upside after the European Union agreed to pay more than 1 billion euros, about 1.2 billion dollars to Gilead GILD.O. The amount will be paid for a six-month supply of its antiviral drug Remdesivir shortly before the publication of the coronavirus medication’s biggest trial. This news helped EUR/USD pair to recover some losses of the day on Wednesday.

Other than that, the U.S. dollar was weak across the board on Wednesday after the Federal Reserve Vice Chairman Richard Clarida said that the U.S. economic data since May has been surprisingly strong; however, it will still take another year for output to reach back to its pre-pandemic level. 

The rising uncertainty about the economic recovery weighed on risk sentiment and dragged the EUR/USD prices on Wednesday to the downward direction.

On the data front, at 14:00 GMT, the Industrial Production from Eurozone dropped to 0.7% from the expected 0.8% and weighed on the Euro currency. At 17:30 GMT, the Core PPI & PPI data from the U.S. for September raised to 0.4% from the projected 0.2% and supported the U.S. dollar. The macroeconomic data from both sides weighed on EUR/USD pair and kept the pair under pressure on Wednesday.

On October 14, the European Central Bank President Christine Lagarde said that European countries would need to invest 290 billion euros each year to meet their commitments under the 2015 Paris climate agreement. 

The little gains in EUR/USD could also be attributed to the latest Brexit optimism that emerged after U.K. Prime Minister Boris Johnson suggested that the U.K. continue to work on Brexit deal past the October 15 deadline. This raised hopes that no-deal will be out of option soon and raised EUR/USD pair on Wednesday.

Furthermore, the downward pressure on the EUR/USD pair was due to the latest moves from Eli Lilly and Co. to halt the government-sponsored clinical trials of its coronavirus vaccine. This move after a day when Jonson & Johnson halted its vaccine’s clinical trials due to an unexpected illness found in one participant raised economic recovery concerns and weighed on the riskier EUR/USD pair.

Daily Technical Levels

Support Resistance

1.1720     1.1773

1.1694     1.1798

1.1668     1.1825

Pivot point: 1.1746

EUR/USD– Trading Tip

The EUR/USD pair traded sharply bearish to break below a solid support area of 1.1780 extended by an upward channel. On the lower side, the EUR/USD is gaining support at the 1.1732 level, and the bearish breakout of the 1.1732 level may lower the EUR/USD price further than the 1.1697 level. The MACD and RSI favor selling bias, but we may see a slight upward movement until the 1.1764 level before seeing further selling in the pair.


GBP/USD – Daily Analysis

The GBP/USD closed at 1.30113 after placing a high of 1.30642 and a low of 1.28627. Overall the movement of the GBP/USD pair remained bullish throughout the day. The currency pair GBP/USD raised on Wednesday amid the renewed hopes of a Brexit deal and the U.S. dollar weakness. On Wednesday, the U.S. dollar was weak as the U.S. Treasury Secretary Steven Mnuchin said that the U.S. stimulus package would not be delivered before November Presidential elections. The hopes for stimulus measure faded away and weighed on the U.S. dollar, ultimately helping the GBP/USD pair’s upward momentum.

Meanwhile, the upward trend in GBP/USD pair was also supported by the latest extension to the reach a Brexit deal by PM Boris Johnson. The U.K. government allowed Brexit talks to extend beyond the former deadline of October 15, announced by the PM Boris Johnson.

The extension raised renewed hopes to reach a Brexit deal and supported the local currency that favored the additional gains in GBP/USD pair.

However, the gains were limited by the rise of coronavirus cases in the United Kingdom, as it reported almost 20,000 new coronavirus cases on Wednesday. PM Boris Johnson said on the issue of coronavirus spread that the latest three-tier regional approach was productive in controlling the spread as the aim was to avoid the nationwide lockdown.

Moreover, the Brexit headlines overshadowed the coronavirus threats, and the pair kept moving in the upward direction on Wednesday. The main operator of the GBP/USD pair on Wednesday was the optimism about the Brexit deal in the market. On the flip side, the Bank of England chief Andy Haldane said that he was hopeful that Britain’s economic recovery from coronavirus’s initial impact would persist despite the risks. He said it because of the adaptability of businesses and households in the region.

He said that the consumption patterns and work practices of Britain’s had been changed since March lockdowns. This positive comment also raised the British Pound bars that helped the GBP/USD pair’s upward movement. The Core PPI for September and the PPI data rose to 0.4% from the forecasted 0.2% and capped further gains in GBP/USD pair from the U.S. side.

However, the comments from Federal Reserve member Clarida that it will take another year for economic output to reach its pre-pandemic level weighed on the U.S. dollar that helped additional gains in GBP/USD pair on Wednesday.

Daily Technical Levels

Support Resistance

1.2894     1.3098

1.2777     1.3183

1.2691     1.3301

Pivot point: 1.2980

GBP/USD– Trading Tip

The GBP/USD is trading at 1.3020 level, having supported over 1.3005 level. Above this, the next target is likely to be found around 1.3050 and 1.3070 level. At the same time, a bearish breakout of the 1.3005 support level can extend selling bias until 1.2959. The bullish bias remains strong over 1.3005. The leading indicators, such as MACD and RSI, support selling; therefore, it’s worth taking a selling trade below 1.2944 today. 

USD/JPY – Daily Analysis

The USD/JPY currency pair successfully stopped its previous day losing streak and took some fresh bids near two-week highs, around the 105.30 regions in the last hour. However, the reason for the pair’s prevalent bullish bias could be attributed to the stronger U.S. dollar. Hence, the U.S. dollar remained supportive on the back of fading hopes over additional U.S. fiscal stimulus measures and surging COVID-19 cases in the leading European countries, which keeps the market trading sentiment under pressure and increase demand for traditional safe-haven assets. Apart from this, the latest halts in the COVID-19 vaccine trials are also weighing on the market risk tone. On the contrary, the prevalent risk-off market sentiment underpinned demand for traditional safe-haven assets, including the Japanese yen, which could be considered one of the key factors that kept the lid on any additional gains currency pair. At this particular time, the USD/JPY is currently trading at 105.25 and consolidating in the range between 105.10 – 105.30.

However, the market risk sentiment extended the previous two-day slumps to 3,478, down 0.08% intraday on the day. The market trading sentiment was being pressured by the fears of no U.S. stimulus ahead of the U.S. presidential election. Moreover, the S&P 500 Futures’ losses were further bolstered by the intensifying coronavirus (COVID-19) conditions in Europe amid pauses in the (COVID-19) virus vaccine trials. In the meantime, the on-going Brexit woes and downbeat U.S. inflation also exerted downside pressure on the market trading sentiment, which underpinned the demand for traditional safe-haven assets, including the U.S. dollar and Japanese yen.

As per the latest report, the U.S. Treasury Secretary Steve Mnuchin blamed the opposition Democratic Party to stop the stimulus package from keeping President Donald Trump lagging the election polls. Across the pond, the rising COVID-19 cases in notable European countries, such as Spain, France, Germany, and the U.K., orders for strict local lockdowns in recent days. Whereas, Johnson and Johnson’s pause in vaccine trials and Eli Lily also dragged the market sentiment down.

Moreover, the market risk-off sentiment was further bolstered by the reports suggesting that no deal was signed between the European Union (E.U.) and the U.K. Furthermore, the intensifying tussle between the U.S. and China also exerted downside pressure on the market. This, in turn, underpinned the safe-haven Japanese yen, which becomes the key factor that kept the lid on any additional gains in the currency pair.

The broad-based U.S. dollar managed to keep its gains throughout the Asian session as the traders still cheering the risk-off marker mood. However, the U.S. dollar gains seem rather unaffected by the intensifying political uncertainty ahead of the upcoming U.S. presidential election on November 3. However, the incoming polls suggest a clear-cut presidential victory for the Democrat candidate Joe Biden, which might cap further upside momentum for the U.S. dollar. However, the U.S. dollar gains become the key factor that helps the currency pair to stay bid. Simultaneously, the U.S. Dollar Index that tracks the greenback against a bucket of other currencies inched up 0.02% to 93.398 by 9:58 PM ET (1:58 AM GMT).

Looking forward, the traders will keep their eyes on the weekly U.S. Initial Jobless Claims, which is expected 825K versus 840K prior. Apart from this, the continuous drama surrounding the US-China relations and updates about the U.S. stimulus package will not lose their importance. 

Daily Technical Levels

105.05 105.70

104.82 106.12

104.40 106.36

Pivot point: 105.47

USD/JPY – Trading Tips

The USD/JPY traded sideway, with a neutral bias within a narrow trading range of 105.600 level to the 105.250 mark. Most of the selling triggered following the USD/JPY disrupted an upward channel at the 105.900 mark on Monday. The USD/JPY is trading at 105.459 marks, the support that’s was prolonged by double bottom mark on the two-hourly charts. A bearish violation of the 105.450 mark may encourage additional selling unto the 105.070 support level as the MACD, and the 50 periods EMA are in support of selling sentiment today. Let’s consider opening sell trade beneath 105.60 and buying over 105.050 level today. Good luck!  

Categories
Forex Signals

GBP/USD Breaking Below 1.3000 Support – Is It Worth Selling? 

In the European trading session, the GBP/USD currency pair managed to stoop its previous session declining streak and refresh the intra-day high around mid-1.2900 level mainly due to easing fears of a no-deal Brexit, which initially underpinned the Pound and contributed to the currency pair gains. This was witnessed after the latest reports suggesting that the European Union leaders will be meeting in Brussels on Thursday and Friday to discuss Brexit and label progress in talks with the U.K. 

On the other hand, the broad-based U.S. dollar fresh weakness, backed by the U.S. economic recovery worries, also played a major role in supporting the currency pair. Moreover, the U.S. dollar losses were further bolstered after the Bank of America Corp (N: BAC) reported a 15.8% drop in quarterly profit, which instantly raised extra doubts about the U.S. economic recovery pushed the U.S. dollar down. At a particular time, the GBP/USD currency pair is currently trading at 1.2978 and consolidating in the range between 1.2864 – 1.2980.

As we already mentioned, the GBP/USD currency pair witnessed strong progress over the last hours, in the wake of the latest Brexit headlines ahead of the critical meeting between the UK PM Boris Johnson and the E.U. Commission President Ursula von der Leyen later on Wednesday. As per the latest report, the 27 national leaders will tell their negotiators to extend conversations with the U.K. to reach an agreement from January 1, 2021. They will also decide to step up contingency preparations for an abrupt economic split without a deal to avoid tariffs or quotas. These positive headlines instantly underpinned the British Pound and pushed the currency pair higher. 

Across the pond, the Bank of U.S. reported a 15.8% drop in quarterly profit on the day, hit by higher provisions for credit losses due to the COVID-19 pandemic, which in turn, adds burden around the broad-based U.S. dollar. Detail suggested, “Net income applicable to common shareholders dropped to $4.44 billion, or 51 cents per share, in the 3rd-quarter ended September 30, from $5.27 billion, or 56 cents per share, a year earlier.

Despite the risk-off market sentiment, the broad-based U.S. dollar failed to extend its long-day bullish rally and edged lower during the European session amid Bank of America profit falls on pandemic woes. On the other hand, the concerns about the ever-increasing number of coronavirus cases and weakness in the U.S. Consumer Price Index (CPI) also weighed on the broad-based U.S. dollar. However, the losses in the U.S. dollar kept the currency pair higher. Whereas the U.S. Dollar Index that tracks the greenback against a basket of other currencies down to 93.493.

On the contrary, the COVID-19 cases in the U.K. continue to pick up the pace as the U.K. reported the highest new cases since June on the previous day, with 143 deaths and 17,234 new confirmed cases. As in result, the opposition Labour Party ordered the national lockdown for at least two weeks. While considering the previous day’s downbeat employment data, the ruling Conservatives imposed local lockdowns. Hence, the renewed coronavirus worries became the key factor that kept the lid on any additional currency pair gains.


Daily Support and Resistance

S1 1.2683

S2 1.2829

S3 1.2883

Pivot Point 1.2976

R1 1.3029

R2 1.3122

R3 1.3268

Entry Price – Buy 1.29966

Stop Loss – 1.30366

Take Profit – 1.29566

Risk to Reward – 1:1

Profit & Loss Per Standard Lot = -$400/ +$400

Profit & Loss Per Micro Lot = -$40/ +$40

Fellas, now you can check out forex trading signals via Forex Academy mobile app. Follow the links below.

iPhone Users: https://apps.apple.com/es/app/fasignals/id1521281368

Andriod Users: https://play.google.com/store/apps/details?id=academy.forex.thesignal&hl=en_US

Categories
Crypto Market Analysis

Daily Crypto Review, Oct 15 – JP Morgan Says Bitcoin is Overvalued; XRP Crashes As it Breaks Major Support

The cryptocurrency sector has spent the day trying to find a point of consolidation. However, most cryptocurrencies did end up in the red. Bitcoin is currently trading for $11,412, representing a decrease of 0.38% on the day. Meanwhile, Ethereum lost 1.28% on the day, while XRP lost 3.36%.

 Daily Crypto Sector Heat Map

If we look at the top 100 cryptocurrencies, we can see that ABBC Coin gained 21.28% in the past 24 hours, making it the top daily gainer. Reserve Rights (19.41%) and Ren (13.61%) also did great. On the other hand, Storj lost 13.98%, making it the most prominent daily loser. It is followed by Uniswap’s loss of 12.63% and Energy Web Token’s loss of 9.94%.

Top 10 24-hour Performers (Click to enlarge)

Bottom 10 24-hour Performers (Click to enlarge)

Bitcoin’s market dominance level has decreased since our last report, with its value currently being 58.7%. This value represents a 2.54% difference to the downside when compared to when we last reported.

Daily Crypto Market Cap Chart

The crypto sector capitalization has lost a bit of its value over the course of the past 24 hours. Its current value is $360.10 billion, representing a decrease of $1.88 billion compared to our previous report.

_______________________________________________________________________

What happened in the past 24 hours?

_______________________________________________________________________

_______________________________________________________________________

Technical analysis

_______________________________________________________________________

Bitcoin

The largest cryptocurrency by market cap spent the past 24 hours stuck within a range bound by the $11,300 support level and $11,500 resistance level. The price entered a state of enormous volatility at one point, where Bitcoin tried to break both to the upside and downside. However, the move to the upside was quickly shut down, while the move towards the downside took a bit more time but failed as well. This left Bitcoin in a narrow range, which it will come out of as soon as the bulls and bears stabilize. Its decreasing RSI and volume are proof of future possible, sideways trading, as well as a big move up ahead.

BTC/USD 1-day Chart

Bitcoin’s technical overview is extremely bullish on every single time-frame, with longer time-frames showing full tilt towards the buy-side, while the shorter ones are slightly tilted towards the buy-side.

BTC/USD 1-day Technicals

Technical factors (4-hour Chart):
  • Price is above its 50-period EMA and at its 21-period EMA
  • Price is at the middle Bollinger band
  • RSI is neutral and descending (53.49)
  • Volume is average
Key levels to the upside          Key levels to the downside

1: $11,500                                 1: $11,300

2: $11,630                                 2: $11,180

3: $12,000                                  3: $11,000

Ethereum

Ethereum (just like Bitcoin) tried to find a consolidation price but failed to do so. The second-largest cryptocurrency by market cap faced an upward-facing trend line which it could not follow anymore that triggered a selloff and a drop below the line as well as the $378 support level. While Ethereum is still fighting for the support (now resistance) level, the price will most likely stay above this line.

ETH/USD 4-hour Chart

Ethereum’s technicals on all time-frames are bullish, with longer time-frames having a stronger bullish sentiment than the shorter ones. However, its monthly overview’s oscillators are showing indecisiveness, as they are neutral.

ETH/USD 1-day Technicals

Technical Factors (4-hour Chart):
  • The price is above its 50-period and at its 21-period EMA
  • The price at its middle Bollinger band
  • RSI is neutral (51.89)
  • Volume is average
Key levels to the upside          Key levels to the downside

1: $378                                     1: $371

2: $400                                     2: $360

3: $415                                      3: $334

Ripple

XRP had the worst day performance-wise out of the three cryptocurrencies we are covering. The third-largest cryptocurrency by market cap has dropped below its ascending support trend line, which extended the push towards the downside. The price reached as low as the $0.2454 support level, which is where the bulls picked up the pace and pushed the price up slightly.

Traders should pay attention to how XRP’s price moves around the ascending (yellow) resistance line, as well as the $0.2454 support level.

XRP/USD 4-hour Chart

XRP’s technicals are quite inconsistent, with its 4-hour and monthly technicals being tilted towards the sell-side. On the other hand, its weekly overview is bullish, while its daily overview is tilted more towards the bull side, with moving averages still having a hint of bearish sentiment.

XRP/USD 1-day Technicals

Technical factors (4-hour Chart):
  • The price is below both its 50-period EMA as well as its 21-period EMA
  • Price is at its lower Bollinger band
  • RSI is pushing towards the oversold area (38.64)
  • Volume is average (with the exception of one huge volume candle)
Key levels to the upside          Key levels to the downside

1: $0.266                                   1: $0.2454 

2: $0.27                                     2: $0.235

3: $0.273                                  3: $0.227


Categories
Forex Signals

USD/CHF Failed to Extend Previous Session Gains – Downward Channel In Play

Today in the European trading session, the USD/CHF currency pair stopped its previous session bullish momentum. They edged lower below the 0.9150 level, mainly due to the risk-off market sentiment, triggered by lack of additional U.S. fiscal stimulus and the US-China tussle, which eventually underpinned the safe-haven Swiss franc and kept the currency pair under pressure. Moreover, the market trading sentiment was further pressured by the downbeat reports that Johnson & Johnson paused the coronavirus vaccine trails, which also burdened the currency pair. 

Across the pond, the bearish tone around the currency pair could also be associated with the fears of national lockdowns in Europe, which add further burden to the trading sentiment and dragged the currency lower. On the contrary, the broad-based U.S. dollar strength, backed by the market risk-on tone, becomes the key factor that kept the lid on any additional losses in the pair.

However, the equity market has been flashing red since the day started. Although, the reason could be associated with the major negative catalysts, including the further delay in the much-awaited coronavirus (COVID-19) relief package and the resurgence of COVID-19 new cases in the U.S. and Europe, which keep fueling the worries over the global economic growth. Apart from this, the fears of the U.K. and the European Union’s (E.U.) Brexit talks and the latest pause in the COVID-19 vaccine trials also add pessimism around the market trading sentiment. This, in turn, provided a boost to the safe-haven Swiss Fran and exerted some additional pressure on the currency pair.

As in result, the broad-based U.S. dollar managed to keep its gains throughout the Asian session as the traders still cheering the risk-off marker mood. However, the U.S. dollar gains seem relatively unaffected by the intensifying U.S. political uncertainty. However, the incoming polls suggest a clear-cut presidential victory for the Democrat candidate Joe Biden, which might cap further upside momentum for the U.S. dollar. However, the U.S. dollar gains become the key factor that helps the currency pair limit its more profound losses. Simultaneously, the U.S. Dollar Index that tracks the greenback against a bucket of other currencies rose by 0.01% to 93.550 by 10:12 PM ET (2:12 AM GMT).

Looking forward, the traders will keep their eyes on the release of the US PPI figures for September. Meanwhile, FOMC members and the RBNZ policymaker’s scheduled speeches will key to watch for some meaningful trading direction. Apart from this, the ongoing drama surrounding the US-China relations and updates about the U.S. stimulus package will not lose their importance.

Daily Support and Resistance

S1 0.9006

S2 0.9069

S3 0.9109

Pivot Point 0.9132

R1 0.9172

R2 0.9195

R3 0.9258


The USD/CHF is trading with a bearish bias at 0.9125, holding below an immediate resistance level of 0.9157 resistance area. Closing of candles below this level may drive selling bias until the 0.9086 level. On the two-hourly timeframes, the USD/CHF pair has formed a downward channel that is likely to drive selling bias, and that’s one reason we opened a selling signal in the USD/CHF pair. Here’s a trading plan… 

Entry Price – Sell 0.91392

Stop Loss – 0.91792

Take Profit – 0.90992

Risk to Reward – 1:1

Profit & Loss Per Standard Lot = -$400/ +$400

Profit & Loss Per Micro Lot = -$40/ +$40

Fellas, now you can check out forex trading signals via Forex Academy mobile app. Follow the links below.

iPhone Users: https://apps.apple.com/es/app/fasignals/id1521281368

Andriod Users: https://play.google.com/store/apps/details?id=academy.forex.thesignal&hl=en_US

Categories
Forex Videos

What The Japanese PM Shinzo Abe’s Resignation Meant For Forex!

Japanese Prime Minister Shinzo Abe resigns where next for the Yen?

Thank you for joining this educational video. in this session, we will be looking at the impact of the Japanese yen now that long-standing prime minister Shinzo Abe has resigned.


If we look at this one-hour chart of the US dollar Japanese yen pair from Friday 28th of August, rumours started to enter the financial markets during the European session that prime minister Shinzo Abe was about to resign due to ill health. The currency pair declined as investors sought to buy Japanese yen. Typically, when uncertainty surrounds a country, such as an important announcement that the long service serving prime minister was about to resign, you might expect the currency to the devalue.
However, the Yen is also seen as a safe-haven currency due to the American economy’s continuing uncertainties because of the ongoing pandemic and upcoming presidential elections. A lack of any kind of stimulus package being agreed on between the democrats and the republicans did not help the US dollar, coupled with the fact that the day before the Fed’s chairman, Jerome Powell, change policy with regard to allowing inflation target to move higher than the 2% benchmark that it had worked to for many years, thus allowing the potential for low-interest rates to remain at record lows for years to come.

On the flip side, we have a fairly strong and stable Japanese economy, which Shinzo Abe will be attributed for, being one of the longest-standing prime ministers in Japanese history. He was liked and respected around the globe, and his tight policy-making has proved an asset or the Japanese economy. He managed to negotiate a trade deal with America, which was beneficial to both countries and is proving successful, but he also stood up to China with regard to what the Japanese saw, as is an infringement on Japanese businesses being able to work within China. Although he stood up to the Chinese government, he did so without any animosity or threats. Such is the high regard that he was held as a statesman for Japan.


If we take a look at this monthly chart of the pair going back to September 2017, we can see that it has not been averse to large swings from lows of 98.00 to highs of 119.00, but where the general trend in the last 12-months has been towards a firmer Japanese yen.
While the Japanese economy will be reeling from its prime minister’s loss, the markets have not been acting adversely, possibly due to the previously mentioned fundamental reasons.

Therefore, it is highly likely that we can expect little change in sentiment for the Japanese yen. The general trend in the pair is lower as investors look to safe-haven assets, such as the yen, and while the market is currently in volatile mode, the downward pressure on this pair will likely remain for the foreseeable future.

Categories
Forex Signals

Bearish Bias Dominates EUR/JPY – Downward Channel In Play! 

Today in the early European trading session, the EUR/JPY currency pair failed to stop its previous session losing streak and picked up further offers around below the 124.00 marks. However, the bearish sentiment around the currency pair could be attributed to the prevalent market risk-off sentiment, which benefitted the safe-haven Japanese yen and exerted some heavy pressure on the currency pair. Thus, the market trading sentiment was being pressured by the US policymakers’ failures to offer the much-awaited fiscal stimulus as well as the intensification of the Sino-American tussle also weighed on the market trading tone. 

Whereas, the renewed halt in the trials of a vaccine for the highly contagious coronavirus diseases also played its major role in weakening the market risk mood, which in turn, adds further burden around the currency pair. Across the pond, the latest data from Germany’s Robert Koch Institute (RKI) fueled the market’s fears of a larger coronavirus (COVID-19) in Europe, which tends to undermine the shared currency and contributing to the currency pair losses. 

On the contrary, the positive remarks from the German Economy Ministry over the EUR economy become the key factor that helps the currency pair to limit its deeper losses. At this particular time, the EUR/JPY currency pair is currently trading at 123.76 and consolidating in the range between 123.64 – 123.97.

As we already mentioned that the market trading sentiment has been flashing mixed signals since the day started. Be it the failure of the American lawmakers to offer any positive announcement on the coronavirus (COVID-19) relief package or the fresh escalation in the Sino-American tussle, not to forget the downbeat US data, these all factors kept the market risk sentiment under pressure. This, in turn, benefitted the safe-haven Japanese yen and exerted some heavy pressure on the currency pair.

Most of the investors remain cautious on the back of the delay in the production of a vaccine for the highly contagious coronavirus diseases. This was witnessed after the Johnson & Johnson suspended clinical trials for its COVID-19 vaccine due to an unexplained illness. 

Moreover, the market trading sentiment was further bolstered by the rising coronavirus cases in the US and Europe, which has been fueling worries about global economic recovery. According to the coronavirus (COVID-19) data from Johns Hopkins University data., the number of global cases crossed 38 million as of Oct. 14. Whereas, the U.S. still not showing any signs of decreasing infection rates, which raised concerns over the economic recovery. 

Across the pond, the shared currency was being pressured by the latest data from Germany’s Robert Koch Institute (RKI), which fueled the market’s fears of a larger coronavirus (COVID-19) in Europe. As per the latest report, the daily new confirmed cases grew 5,132 to 334,585 in Europe while the death toll also rose by 40, taking the total to 9,677. 

On the contrary, the latest positive remarks from the German Economy Ministry over the EUR economy become the key factor that helps the currency pair to limit its deeper losses. As per the keywords, “the economy is expected to show by far the highest quarterly growth rate ever recorded in Q3, though indicators signal a slowed continuation of the recovery process in Q4.” He further added ” COVID-19 effects on the labor market are still significant, slight improvement is already apparent.

The US Michigan Consumer Sentiment Index for September, which is expected 75 versus 74.1 prior, will likely help resolve near-term USD moves. Furthermore, the risk catalyst like geopolitics and the virus woes, not to forget the Brexit, will also be key to watch for the fresh direction.


Daily Support and Resistance

S1 122.75

S2 123.4

S3 123.65

Pivot Point 124.05

R1 124.3

R2 124.71

R3 125.36

The EUR/JPY has already violated the double bottom support level of 123.922 level and closing of candle below this area is likely to drive selling trend until next support area of 123.350 level. On the further lower side, the EUR/JPY may find the next support at 123.270. 

Entry Price – Sell 123.81

Stop Loss – 124.21

Take Profit – 123.41

Risk to Reward – 1:1

Profit & Loss Per Standard Lot = -$400/ +$400

Profit & Loss Per Micro Lot = -$40/ +$40

Fellas, now you can check out forex trading signals via Forex Academy mobile app. Follow the links below.

iPhone Users: https://apps.apple.com/es/app/fasignals/id1521281368

Andriod Users: https://play.google.com/store/apps/details?id=academy.forex.thesignal&hl=en_US

Categories
Crypto Market Analysis

Daily Crypto Review, Oct 14 – Analysts Calling for a Bull Market; Bitcoin Back Under $11,500

The cryptocurrency sector has experienced a pullback as Bitcoin went under its $11,500 support. Bitcoin is currently trading for $11,425, representing a decrease of 0.31% on the day. Meanwhile, Ethereum gained 0.09% on the day, while XRP lost 0.52%.

 Daily Crypto Sector Heat Map

If we look at the top 100 cryptocurrencies, we can see that PumaPay gained 13.55% in the past 24 hours, making it the top daily gainer. ABBC Coin (9.05%) and Uniswap (6.64%) also did great. On the other hand, Solana lost 7.81%, making it the most prominent daily loser. It is followed by Loopring’s loss of 6.9% and Kusama’s loss of 6.77%.

Top 10 24-hour Performers (Click to enlarge)

Bottom 10 24-hour Performers (Click to enlarge)

Bitcoin’s market dominance level has decreased slightly since our last report, with its value currently being 60.24%. This value represents a 0.16% difference to the downside when compared to when we last reported.

Daily Crypto Market Cap Chart

The crypto sector capitalization has lost a bit of its value over the course of the past 24 hours. Its current value is $361.98 billion, representing a decrease of $5.11 billion compared to our previous report.

_______________________________________________________________________

What happened in the past 24 hours?

_______________________________________________________________________

_______________________________________________________________________

Technical analysis

_______________________________________________________________________

Bitcoin

The largest cryptocurrency by market cap went into pullback mode as it couldn’t stay at its daily high of a little over $11,700. Bitcoin’s bull exhaustion triggered a pullback, which then broke the $11,500 support level to the downside, putting the cryptocurrency boxed in between $10,300 support and $10,500 resistance level. With the volume decreasing and RSI dropping down, we may expect sideways trading in the short-term before another attempt of (mostly likely) upwards motion.

Many analysts say that Bitcoin has almost no chance of going under $11,000 and that the most recent break above it has turned Bitcoin’s sentiment into a bullish one. However, if Bitcoin manages to go under $11,000, we may expect that the move will continue downwards quickly.

BTC/USD 4-hour Chart

Bitcoin’s technical overview is extremely bullish on all time-frames, with longer time-frames showing even stronger bull overview than the shorter ones.

BTC/USD 1-day Technicals

Technical factors (4-hour Chart):
  • Price is above both its 50-period EMA and 21-period EMA
  • Price is at the middle Bollinger band
  • RSI is descending (57.23)
  • Volume is above-average (descending
Key levels to the upside          Key levels to the downside

1: $11,500                                 1: $11,300

2: $11,630                                 2: $11,180

3: $12,000                                  3: $11,000

Ethereum

Ethereum also experienced a pullback from its highs as ETH bulls couldn’t go past $496. However, unlike Bitcoin, Ethereum didn’t break any support levels during the move towards the downside. As it bounced off of the $378 support level, it continued moving alongside a very steep upwards-trending line, which is a very bullish short-term sign.

While moving alongside this line is unsustainable in the long-term, Ethereum might experience some more stable gains in the next couple of days.

ETH/USD 4-hour Chart

Ethereum’s 1-day and weekly overviews extreme tilt towards the bull-side, while its 4-hour and monthly overviews show a bit of indecisiveness, though they are still bullish.

ETH/USD 1-day Technicals

Technical Factors (4-hour Chart):
  • The price is above both its 50-period and its 21-period EMA
  • The price slightly above its middle Bollinger band
  • RSI is neutral (60.70)
  • Volume is elevated (descending to average)
Key levels to the upside          Key levels to the downside

1: $378                                     1: $371

2: $400                                     2: $360

3: $415                                      3: $334

Ripple

XRP is known for being less correlated to Bitcoin’s movements than most other cryptocurrencies, which it has shown today as well. The third-largest cryptocurrency by market cap has traded sideways and hasn’t experienced any pullbacks. It has been trading alongside the upward-trending (yellow) line, which will force XRP to either go under it or face its resistance at the $0.26 level. In the meantime, however, we may expect low volatility.

XRP/USD 4-hour Chart

XRP’s technicals are quite inconsistent, as its daily and weekly overviews show quite a bullish tilt, while its monthly overview is almost completely bearish. Its 4-hour overview is leaning towards the buy-side but is quite neutral.

XRP/USD 1-day Technicals

Technical factors (4-hour Chart):
  • The price is above its 50-period EMA as well as its 21-period EMA
  • Price is at its middle Bollinger band
  • RSI is flat (52.19)
  • Volume is average but descending
Key levels to the upside          Key levels to the downside

1: $0.266                                   1: $0.2454 

2: $0.27                                     2: $0.235

3: $0.273                                  3: $0.227


Categories
Forex Market Analysis

Daily F.X. Analysis, 14th October – Top Trade Setups In Forex – U.S. PPI Figures Ahead! 

On the news side, the focus will remain on the Core PPI and PPI figures that are likely to underperform compared with the previous month’s data, with this, the dollar may get weaker against other currencies. However, the FOMC members’ speeches will be worth monitoring to predict further market action. 

Economic Events to Watch Today  


EUR/USD – Daily Analysis

The EUR/USD closed at 1.17451 after placing a high of 1.18154 and a low of 1.17301. The EUR/USD pair dropped on Tuesday amid the strength of the U.S. dollar, dampened hopes of a coronavirus vaccine, and the rising number of coronavirus cases from the Eurozone along with the rising unemployment fears in the Euro area.

Euro currency remained stressed on Tuesday due to the strength of its rival U.S. dollar across the board. The impasse over the U.S. stimulus package after the comments from U.S. House Speaker Nancy Pelosi that the newly proposed stimulus relief bill from the U.S. President was not sufficient to meet Americans’ requirements gave strength to the U.S. dollar. The strength of the U.S. dollar weighed on EUR/USD pair on Tuesday.

Meanwhile, the market’s risk appetite was declined by Johnson & Johnson’s recent decision to halt the trials of their COVID-19 vaccine. The dampened hopes of a coronavirus vaccine weighed on the riskier currency Euro and dragged the prices of the EUR/USD pair further on the downside.

Furthermore, the coronavirus pandemic situation in European nations escalated and raised fears for the Eurozone’s economic recovery. The Eurozone’s economic prospects were also down because of the increased uncertainty about the Brexit deal and the U.S. presidential elections. The rising uncertainty caused an increased demand for safe-haven greenback that ultimately added to the EUR/USD pair’s losses on Tuesday.

Moreover, at 10:59 GMT, the German Final Consumer Price Index (CPI) for September remained in-line with the expectations of -0.2%. At 14:00 GMT, the ZEW Economic Sentiment from Eurozone dropped to 52.3 against the forecasted 72.0 and the previous 73.9 in October and weighed on a single currency added further in EUR/USD pair. The German ZEW Economic Sentiment also dropped in October to 56.1 from the forecasted 74.1 and the previous 77.4 and weighed on Euro that ultimately dragged EUR/USD prices on the downside.

The rising number of coronavirus cases in European nations has forced authorities to impose restrictions, which has raised fears for unemployment. The official data suggested that U.K. unemployment started to grow even before the government imposed new restrictions to control the virus’s spread. These fears continuously weighed on the euro currency and EUR/USD pair.

From the U.S. side, the NFIB Small Business Index came in as 104.0 against the projected 100.9 and supported the U.S. dollar added in the EUR/USD pair’s losses on Tuesday. Simultaneously, the CPI and Core CPI data from the U.S. remained flat with the expectations of 0.2% and had no impact on the U.S. dollar and EUR/USD pair.

Daily Technical Levels

Support Resistance

1.1791    1.1832

1.1767    1.1851

1.1749    1.1874

Pivot point: 1.1809

EUR/USD– Trading Tip

The EUR/USD pair traded sharply bearish to break below a solid support area of 1.1780 extended by an upward channel. On the lower side, the EUR/USD is gaining support at 1.1732 level, and the bearish breakout of 1.1732 level may lower the EUR/USD price further than the 1.1697 level. The MACD and RSI favor selling bias, but we may see a slight upward movement until the 1.1764 level before seeing further selling in the pair.


GBP/USD – Daily Analysis

The GBP/USD pair was close at 1.29340 after placing a high of 1.30678 and a low of 1.29216. The British Pound fell sharply on Tuesday amid the rising concerns about the no-deal Brexit and fears over a looming lockdown hurt sentiment.

The chances that the U.K. will leave the E.U. without a trade deal increased after the French government appeared reluctant to give in to U.K. demands over its fisheries’ control. The French foreign minister Jean-Yves Le Drian said that the possibility of the U.K. leaving the E.U. without a trade deal was a credible hypothesis.

The French government has already said that it will not accept any bad deal in fisheries, and this has raised the uncertainty over the deal just ahead of October 15-16 European summit. The E.U. Brexit negotiator Michel Barnier will provide updates on Brexit negotiations at the E.U. summit. Barnier will elaborate on the E.U. summit’s situation on the Brexit’s key sticking points with the details about priorities and the red lines. 

The British Pound remained under pressure as the concerns were raised after the French government’s warning about the no-deal Brexit. This weighed ultimately on the GBP/USD prices. Furthermore, the rising number of coronavirus in the United Kingdom forced the local government to impose further restrictions to control the virus’s spread. PM Boris Johnson said that the rising number of cases in the U.K. was flashing at them like dashboard warnings in a passenger jet. 

Boris Johnson unveiled a new three-tier system that categories areas based on the medium, high, and very high alert levels due to an uptick in coronavirus cases across the country. The U.K. government’s rising restrictions to control the spread of the virus raised fears of economic recovery that weighed on the local currency, which added further losses in the GBP/USD pair.

On the data front, at 04:01 GMT, the BRC Retail Sales Monitor for the year from Britain rose in September to 6.1% from the expected 3.5% and the previous 4.7% and supported British Pound and caped further losses in GBP/USD pair. AT 11:00 GMT, the Claimant Count Change in September dropped to 28.1K against the forecasted 78.8K and the previous 39.5K and supported British Pound. In September, the Unemployment Rate rose to 4.5% from the forecasted 4.3% and weighed on British Pound and added the GBP/USD pair’s additional losses.

At 11:02 GMT, Britain’s Average Earnings Index came in as 0.0% for the quarter against the expected -0.6% and supported GBP. On the other hand, the NFIB Small Business Index was released from the United States at 15:30 GMT and raised to 104.0 from the anticipated 100.9 and supported the U.S. dollar that dragged the GBP/USD pair even downward.

Daily Technical Levels

Support Resistance

1.3018    1.3098

1.2971    1.3131

1.1938    1.3177

Pivot point: 1.3051

GBP/USD– Trading Tip

The GBP/USD is trading at 1.2894 level, holding right below an immediate resistance level of 1.2944. The resistance is extended by an intraday horizontal level on the two-hourly timeframes. Below the 1.2944 resistance level, the Sterling can trigger selling until the 1.2894 level and 1.2845 level. On the flip side, a bullish breakout of 1.2944 levels can trigger buying until the 1.2994 level. The leading indicators, such as MACD and RSI, support selling; therefore, it’s worth taking a selling trade below 1.2944 today. 


USD/JPY – Daily Analysis

The USD/JPY closed at 105.475 after placing a high of 105.625 and a low of 105.234. The risk aversion market sentiment kept the USD/JPY pair on the high on Tuesday. The impasse supported the market sentiment over the U.S. stimulus package, the pandemic spread worldwide, and the pause of vaccine trials by Johnson & Jonson along with the Australian and Chinese recent clash.

The latest talks between Republicans & democrats for a fresh round of stimulus measures also failed to provide meaningful results and weighed on market sentiment. The U.S. House Speaker Nancy Pelosi downplayed the hopes for another round of stimulus package further after saying that the newly proposed package by US Trump was insufficient to meet the United States’ needs.

These dampened hopes over the next round of coronavirus relief bill raised risk aversion market sentiment and supported the U.S. dollar due to its safe-haven status and supported USD/JPY pair. Furthermore, the risk-off market bias was underpinned by the rising number of coronavirus cases across the globe and the governments’ restrictive measures to curb coronavirus’s effect on the economy. The economic recovery concerns raised even further after the IMF report that revealed that business and other economic activities were highly disturbed by the coronavirus pandemic-induced lockdowns. 

However, the IMF projection for the global recession somewhat improved on Tuesday to 4.4% than the previous projection of 5.2% in summer. This projection helped improve the risk sentiment and weighed on the safe-haven Japanese yen that added further gains in the USD/JPY pair.

The U.S. Dollar Index was up by 0.5% on Tuesday after the risk sentiment suffered due to the pause of vaccine trials by Johnson & Johnson. The company paused its trials after an unexpected illness was found in one of the participants. This pause increased the uncertainty over the economic recovery and supported the safe-haven greenback that pushed the USD/JPY pair.

On the data front, at 04:50 GMT, the M2 Money Stock for the year from Japan dropped to 9.0% from the expected 9.1% and weighed on the Japanese Yen that added strength to the USD/JPY pair on Tuesday. At 15:00 GMT, the NFIB Small Business Index for September advanced to 104.0 against the expected 100.9 and previous 100.2 and supported the U.S. dollar that lifted the USD/JPY pair. At 17:30 GMT, the CPI and the Core CPI data from September remained flat with the anticipated 0.2% and had a null-effect on the U.S. dollar.

Furthermore, China reportedly banned imports of Australian coal and left Australian vessels stuck at Chinese ports. These tensions between China and Australia increased concerns and raised uncertainty that helped improve the safe-haven Japanese yen and capped further gains in the USD/JPY pair on Tuesday.

Daily Technical Levels

105.05    105.70

104.82    106.12

104.40    106.36

Pivot point: 105.47

USD/JPY – Trading Tips

The USD/JPY traded sideway, with a neutral bias within a narrow trading range of 105.600 level to the 105.250 mark. Most of the selling triggered following the USD/JPY disrupted an upward channel at the 105.900 mark on Monday. The USD/JPY is trading at 105.459 marks, the support that’s was prolonged by double bottom mark on the two-hourly charts. A bearish violation of the 105.450 mark may encourage additional selling unto the 105.070 support level as the MACD, and the 50 periods EMA are in support of selling sentiment today. Let’s consider opening sell trade beneath 105.60 and buying over 105.250 level today. Good luck!  

Categories
Forex Signals

Choppy Trading in USD/CAD – Brace for a Breakout Setup! 

Today in the early European trading session, the USD/CAD currency pair extended its previous session recovery rally and remains bullish around 1.3144 level, mainly due to the broad-based U.S. dollar strength, backed by the risk-off market mood. However, the reason for the prevalent risk-off market sentiment could be associated with the reports suggesting that the U.K. pharma giant, Johnson, and Johnson, stopped its COVID-19 vaccine trial due to an unexplained illness. This, in turn, underpinned the safe-haven U.S. dollar and contributed to the currency pair gains. The on-going uncertainty over the American stimulus package also weighs on the market risk-tone, which gives further support to the U.S. dollar and keeps the currency pair higher. 

Petroleum Institute data becomes the factor that capped further upside momentum in the currency pair. However, the bullish sentiment around the crude oil prices was being supported by optimism over U.S. President Donald Trump’s negative status for the pandemic. Currently, the USD/CAD is trading at 1.3115 and consolidating in the range between 1.3108 – 1.3144.

However, the market trading sentiment failed to extend its previous day bullish moves and remained depressed by combining factors. Be it the worrisome headlines concerning the Brexit or the tension between the US-China, not to forget the coronavirus woes in the U.S. and Europe, the market trading sentiment has been flashing red since the day started, which ultimately keeps the safe-haven assets supportive on the day. 

As per the latest report, the U.K. pharma giant, Johnson and Johnson, delayed its COVID-19 vaccine trial due to an unexplained illness. Moreover, China’s dislike of the White House arms sale to Taiwan and the recent ban from Beijing to use Aussie coal for power stations adds additional pressure around the market sentiment.

This, in turn, the broad-based U.S. dollar succeeded in gaining positive traction on the day. However, the U.S. dollar gains seem rather unaffected by the political uncertainty in the U.S. ahead of U.S. elections. Thus, the gains in the U.S. dollar become the key factor that kept the currency pair higher. Whereas, the U.S. Dollar Index, which tracks the greenback against a bucket of other currencies, rose by 0.11% to 93.207 by 10:04 PM ET (2:04 AM GMT). However, the bullish sentiment around the crude oil prices could be associated with the positive reports suggesting that the U.S. President Donald Trump’s negative status for the virus infection. 


Daily Support and Resistance

S1 1.3233

S2 1.3272

S3 1.3292

Pivot Point 1.3312

R1 1.3331

R2 1.3351

R3 1.339

The USD/CAD pair is trading sideways within a narrow trading range of 1.3145 – 1.3103 level, which marks double bottom and double top level on the 2-hour timeframe. A bullish breakout of 1.3145 level may lead the USD/CAD price towards the next resistance area of 1.3207 mark, while on the lower side, the support is likely to be found around 1.3040 level today. 

Entry Price – Buy 1.31421

Stop Loss – 1.31021

Take Profit – 1.31821

Risk to Reward – 1:1

Profit & Loss Per Standard Lot = -$400/ +$400

Profit & Loss Per Micro Lot = -$40/ +$40

Fellas, now you can check out forex trading signals via Forex Academy mobile app. Follow the links below.

iPhone Users: https://apps.apple.com/es/app/fasignals/id1521281368

Andriod Users: https://play.google.com/store/apps/details?id=academy.forex.thesignal&hl=en_US

Categories
Forex Videos

The Forex Market reaction to Fed Powell speech & What It Means Going Forward!

Market reaction to Fed Powell speech 27 August 2020: The new framework

Thank you for joining this forex academy educational video. In this session, we will look at the extreme market volatility after federal reserve chairman Jerome Powell’s speech at Jackson Hole on the 27th of August.

The United States dollar has remained on the back foot this week with the DXY punching through 93.00. There was a lot of expectation for the US data on Thursday the 27th, especially the 2ND quarter gross domestic product, which came in slightly better than expected and also the initial jobless claims, which again was very slightly better than expected.

However, while that data had a fairly muted effect, keeping the euro US dollar pair just above point 1.1800. It was fed Powell’s speech on monetary policy, which really caused volatility in the marketplace, causing the pair to spike to a high of 1.1900 and a low 1.1759 while the market tried to digest the new policy and how it might affect the markets in general.
Whenever we get spikes and reversals after a policy shift from a major Western government, especially the USA, it is largely because analysts and economists are fairly split on whether or not the new policy will help or hinder the United States economy, and whether or not it is good or bad for investors.

The policy centers around the feds benchmark 2% inflation target and where it says it is now in a position for that to be over-shot to slightly above on occasions. This new policy, to tolerate inflation above 2%, is largely seen by the markets that the Fed will be holding interest rates lower for longer, possibly even years. This, of course, is not attractive for people who want to hold United States dollars. Although interest rates have been low for some time, to assist the United States economy rebound from the catastrophic effects of the coronavirus, the fact that we may see low interests rates in the United States for many years to come is not attractive to Dollar investors, and this is why we are seeing almost pandemonium in the currency markets. Most of this pertains to the US dollar.

So, what can we expect in the currency markets? Posted speech, the Asian session continued the US dollar sell-off, where great volatility has been seen in the market since Powell’s speech. The DXY index has been taking a major beating, and no end looks to be in sight. Therefore, we suggest traders’ limits risk by keeping stop losses tight and lowering leverage until market volatility decreases

Categories
Forex Videos

Forex Fundamental Analysis for Novices – US Construction spending!


Fundamental Analysis for Novices US Construction spending

Thank you for joining this fundamental analysis for novices’ educational video. In this session, we will be looking at construction spending data releases and, in particular, within the United States.


If this is the first time you have viewed one of our fundamental analysis videos for novices, please make sure you search for the many other videos in this series which will help you understand the importance of such data releases when they hit the market and which are usually subject to an embargo.
You should refer to your economic calendar every single day and make sure you plot your trades around these risk events.

The most important sections of an economic calendar of the time of day and date of the release the type of event. For example, here we can see that the first one on the list is the right move house price index month on month for August for Great Britain, which was due for release at 00:01 on Monday, August 17th, where the impact was low.

Most economic calendars will provide you with the likely volatility impact of such news releases, and these will typically be released as low, medium, or high impact. Here we can see that the strength of the impact is measured by a bar where low-impact is a third of the bar coloured in orange, a medium impact such as the EURO group meeting at 1:00 takes up a third of the bar in orange, and a high impact bar which we can see at 12:50 in the morning, where the Japanese gross domestic product was considered to be a high impact and where the bar was completely coloured in red.

Economic calendars will also show you the previous data, which could be weekly, monthly, quarterly, or annually, and they will provide you with a general consensus as compiled by market experts and economists, and of course, the actual release section will be populated shortly after the embargo.

Here we can see a recent data release of us construction spending, which came out on Monday, August 3rd, and was simultaneously released at 3 p.m. BST with other important United States data including ISM manufacturing employment and manufacturing orders and prices.

While the market will look at all of this information simultaneously, some of this has been covered in previous videos, which we would ask you to take a look at. Still, in this video, we will only be focusing on the construction spending component, which was month-on-month for June, where we can see here came in at – 0.7%.

The information is released by the United States census bureau and is a measurement of the total amount of spending in the United States for various construction types. Because it includes a residential component, it is useful for predicting new home sales and mortgages. A high reading is seen as positive for the United States dollar while a low reading he seen as negative or perish for the United States dollar.

While the impact indicator considers this to be of low importance, when taken into to context with the other data being released simultaneously, traders will need to take a holistic view, especially in the current economic climate where the pandemic is still in the grips of the United States at the time of writing this article and where even low impact data can cause shock waves and market jitters. In which place, it is better to be prepared for this and wait for the market to react to the news before spotting trends and trying to get on them.

Categories
Forex Signals

EUR/USD Sideways Session Continues – Brace for Sell Position

The EUR/USD failed to stop its previous session losses and further offers around below the 1.1800 level. However, the bearish sentiment around the currency pair was boosted after the fresh downbeat released German ZEW headline numbers for October, showing that the Economic Sentiment Index came in at 56.1 against 73.0 expectations 77.4 last. This, in turn, undermined the sentiment around the shared currency and contributed to the currency pair losses. 

Apart from this, the reason for the bearish bias around the currency pair could also be associated with the fresh reports suggesting the re-imposition of stricter restrictions in Germany, Spain, and France to stop the coronavirus second-wave. On the flip side, the broad-based U.S. dollar strength, backed by the upbeat market sentiment, also played a major role in undermining the currency pair. At the moment, the EUR/USD currency pair is currently trading at 1.1793 and consolidating in the range between the 1.1779 – 1.1817.

At the data front, the German ZEW headline numbers for October showed that the Economic Sentiment Index arrived in at 56.1 against 73.0 expectations and 77.4 last. Moreover, the currency pair losses were also bolstered by reports suggesting a sharp rise in the coronavirus cases in Spain, France, and German. It is very downhearted headlines that the second-wave of the virus is picking up pace in Europe once again, which leads re-imposition of stricter restrictions in Germany, Spain, and France to contain the coronavirus second-wave.

According to the coronavirus (COVID-19) data from Germany’s Robert Koch Institute (RKI), the country’s cases rose around ~39,000 as of yesterday while the latest update today added 13 deaths more so that brings the total tally to 9,634 persons. This, in turn, undermined the shared currency and contributed to the currency pair.

Apart from this, the risk sentiment has been flashing red since the Asian session started, witnessed by the S&P 500 Futures’ negative performance. However, the reason for the downbeat trading sentiment could be associated with the worrisome headlines concerning Brexit and on-going tension between the U.S. and China. dislike for the U.S. proposal to the Congress about selling three sales of advanced weaponry to Taiwan recently renewed the trade war saga

At the US-China front, the renewed conflict between the U.S. and China fueled after the Dragon Nation China’s Washington Embassy lashed out at the U.S. passage of the three advanced weaponry sales to Taiwan during late-Monday, per Reuters. As per the latest report, China’s representative said, “China consistently and firmly opposes U.S. arms sales to Taiwan.” This, in turn, added additional pressure around the market sentiment.

Across the pond, the recent coronavirus (COVID-19) warning from the U.S. health official Anthony Fauci and stimulus uncertainty also keep the market trading sentiment under pressure. As per the keywords, “Dr. Anthony Fauci, director of the U.S. National Institute of Allergy and Infectious Diseases (NIH), suggests another 181,000 deaths in the United States by February. 

As per the latest report, the US Centers for Disease Control and Prevention (CDC) reported 7,740,934 cases of the new coronavirus yesterday, with an increase of 46,069 from its previous count. As in result, the broad-based U.S. dollar remains on the bullish track and still reporting gains on the day. However, the U.S. dollar gains were being supported by the reports suggesting that the U.K. pharma giant, Johnson, and Johnson, stopped its COVID-19 vaccine trial due to an unexplained illness, which eventually boosted the safe-haven assets like the U.S. dollar.

However, the U.S. dollar gains seem rather unaffected by the U.S. political uncertainty ahead of U.S. elections. Thus, the gains in the U.S. dollar become the key factor that kept the currency pair lower. Whereas, the U.S. Dollar Index, which tracks the greenback against a bucket of other currencies, rose by 0.11% to 93.207 by 10:04 PM ET (2:04 AM GMT). Looking forward, the market traders will keep their eyes on the U.S. Consumer Price Index (CPI) data. Furthermore, the risk catalyst like geopolitics and the virus woes, not to forget the Brexit, will not lose their importance.

Daily Support and Resistance

S1 1.1626

S2 1.1672

S3 1.1694

Pivot Point 1.1718

R1 1.174

R2 1.1764

R3 1.181

The EUR/USD pair is supported over 1.1790 level, which marks double bottom level on the 4-hour timeframe. Above this level, the EUR/USD is likely to bounce off until the 1.1811 level, and the bullish breakout of the 1.1831 level can also extend buying until the next target level of 1.1870. Conversely, the bearish breakout of the 1.1790 level can extend the selling trend until the 1.1750 level.

Entry Price – Buy 1.17872

Stop Loss – 1.18272

Take Profit – 1.17472

Risk to Reward – 1:1

Profit & Loss Per Standard Lot = -$400/ +$400

Profit & Loss Per Micro Lot = -$40/ +$40

Fellas, now you can check out forex trading signals via Forex Academy mobile app. Follow the links below.

iPhone Users: https://apps.apple.com/es/app/fasignals/id1521281368

Andriod Users: https://play.google.com/store/apps/details?id=academy.forex.thesignal&hl=en_US

Categories
Forex Signals

EUR/JPY Continues to Trade Below Previously Violated Upward Channel – Signal Update! 

The EUR/JPY failed to stop its previous session bearish streak and drew further offers around the 124.17 regions. However, the basis for the bearish sentiment around the EURJPY pair could be associated with the fresh reports suggesting the re-imposition of stricter restrictions in Germany, Spain, and France to stop the coronavirus second-wave. This, in turn, weakened the forecast around the shared currency and dragged the currency pair lower. Apart from this, the intensification of the Sino-American tussle and the uncertainty over the American stimulus package, keep weighing on the market risk-tone, which eventually underpinned the Japanese yen’s safe-haven demand and contributed to the currency pair losses. Moreover, the risk-off market sentiment was further boosted by the fresh discouraging vaccine news, which put a further bid under the safe-haven Japanese yen. At this particular time, the EUR/JPY is trading at 124.29 and consolidating between 124.17 – 124.48.

The shared currency remained pressured by the vaccine news and re-imposed stricter restrictions in Spain and France, and Germany to stop the coronavirus second-wave. New infections in Germany once again top 4000 on Tuesday. According to the coronavirus (COVID-19) data from Germany’s Robert Koch Institute (RKI), the country’s cases rose around ~39,000 as of yesterday while the latest update today added 13 deaths more so that brings the total tally to 9,634 persons. This, in turn, undermined the shared currency and contributed to the currency pair.

Moreover, the sentiment around the shard currency was further bolstered by the reports suggesting that the UK pharma giant, Johnson, and Johnson, delayed its COVID-19 vaccine trial due to an unexplained illness.

Across the pond, the market trading sentiment has been flashing mixed signals since the day started. Be it the American lawmakers’ failure to offer any positive announcement on the coronavirus (COVID-19) relief package or the recent escalation in the Sino-American tussle, not to forget the Brexit worries, these all factors have been weighing on the market risk tone. At the US-China front, China recently showed his dislikes over the White House arms sale to Taiwan and the recent ban from China to use Aussie coal for power stations, which eventually offered additional pressure to the market sentiment and contributed to the currency pair losses.


Moving on, the ZEW will release its German Economic Sentiment Index and the Current Situation Index at 0900 GMT in the EU session later today, which is expected to drop to 73.0 in October as against a 77.4 reading booked in the previous month. Meanwhile, the Current Situation Sub-Index is expected to arrive at -60.0 against a -66.2-figure recorded last month. Apart from this, the market traders will keep their eyes on the US Consumer Price Index (CPI) data. Furthermore, the risk catalyst like geopolitics and the virus woes, not to forget the Brexit, will not lose their importance.

Daily Support and Resistance

S1 121.85

S2 122.64

S3 123.04

Pivot Point 123.43

R1 123.83

R2 124.22

R3 125

The EUR/JPY pair is trading with a bearish bias at 125.35 level, having violated the support become a resistance level of 124.460 level. On the lower side, the EUR/JPY may gain support at 123.735 levels as worked as a support in the past. Checkout a trading plan below…

Entry Price – Buy 124.19

Stop Loss – 124.59

Take Profit – 123.79

Risk to Reward – 1:1

Profit & Loss Per Standard Lot = -$400/ +$400

Profit & Loss Per Micro Lot = -$40/ +$40

Fellas, now you can check out forex trading signals via Forex Academy mobile app. Follow the links below.

iPhone Users: https://apps.apple.com/es/app/fasignals/id1521281368

Andriod Users: https://play.google.com/store/apps/details?id=academy.forex.thesignal&hl=en_US

Categories
Crypto Market Analysis

Daily Crypto Review, Oct 13 – G7 Will Continue to Oppose Libra; Bitcoin Consolidating After Another Bull Run

The cryptocurrency sector has experienced another surge as Bitcoin moved away from $11,300 and closer to $11,500. Bitcoin is currently trading for $11,434, representing an increase of 0.89% on the day. Meanwhile, Ethereum gained 3.35% on the day, while XRP gained 0.03%.

 Daily Crypto Sector Heat Map

Taking a look at the top 100 cryptocurrencies, we can see that Ocean Protocol gained 21.97% in the past 24 hours, making it the top daily gainer. CyberVein (14.58%) and Synthetix Network Token (11.83%) also did great. On the other hand, Ren lost 14.83%, making it the most prominent daily loser. It is followed by PumaPay’s loss of 8.33% and Uniswap’s loss of 3.33%.

Top 10 24-hour Performers (Click to enlarge)

Bottom 10 24-hour Performers (Click to enlarge)

Bitcoin’s market dominance level has decreased slightly since our last report, with its value currently being 60.40%. This value represents a 0.26% difference to the downside when compared to when we last reported.

Daily Crypto Market Cap Chart

The crypto sector capitalization has a bit more value over the course of the past 24 hours. Its current value is $366.13 billion, representing an increase of $7.71 billion compared to our previous report.

_______________________________________________________________________

What happened in the past 24 hours?

_______________________________________________________________________

_______________________________________________________________________

Technical analysis

_______________________________________________________________________

Bitcoin

The largest cryptocurrency by market cap has continued its push towards the upside, getting past $11,500 and even close to the $12,000 mark. The move died out when it approached $11,750. Bitcoin is now in the pullback phase, where its price has breached $11,500 to the downside and is testing how low it can go until the bulls step in again.

Traders should pay attention to how Bitcoin handles the $11,300-$11,500 level when looking for their next trade.


BTC/USD 4-hour Chart

Bitcoin’s technical overview on all time-frames is tilted towards the buy-side, with longer time-frames showing an extremely strong bull overview.

BTC/USD 1-day Technicals

Technical factors (4-hour Chart):
  • Price is above both its 50-period EMA and 21-period EMA
  • Price descending from the top Bollinger band
  • RSI is descending from almost-overbought levels (62.46)
  • Volume is above-average
Key levels to the upside          Key levels to the downside

1: $11,500                                 1: $11,300

2: $11,630                                 2: $11,180

3: $12,000                                  3: $11,000

Ethereum

Ethereum has had another bull-run in the past 24 hours, with its price reaching as high as $396. However, the second-largest cryptocurrency by market cap couldn’t reach past the $400 mark, triggering bull exhaustion, and ultimately a pullback. With volume and RSI dropping, we may expect Ethereum to look for a price to consolidate a bit lower than its current price, and possibly test the $371 support level.


ETH/USD 4-hour Chart

Ethereum’s 1-day and monthly overviews show some signs of doubt in the bullish sentiment, while its 4-hour and weekly overviews are completely bullish.

ETH/USD 1-day Technicals

Technical Factors (4-hour Chart):
  • The price is above both its 50-period and its 21-period EMA
  • The price at its top Bollinger band
  • RSI is flat and nearly overbought (66.74)
  • Volume is elevated
Key levels to the upside          Key levels to the downside

1: $378                                     1: $371

2: $400                                     2: $360

3: $415                                      3: $334

Ripple

Unlike Bitcoin and Ethereum, which both had a strong bull presence today, XRP has been trading sideways for most of the day. Its inability to reach past the $0.26 level has proven to be a problem, and we may expect XRP’s price to collide with the ascending trend line very soon. There is a small probability that XRP will reach past $0.26 and get close to $0.266, but it will most likely happen with Bitcoin’s help (though it is more likely that XRP will face the ascending line first).


XRP/USD 4-hour Chart

XRP’s 1-day technicals show a hint of doubt in its short-term bullish sentiment, while the 4-hour and weekly overviews are completely bullish. However, XRP’s monthly overview is still completely tilted towards the sell-side.

XRP/USD 1-day Technicals

Technical factors (4-hour Chart):
  • The price is above its 50-period EMA as well as its 21-period EMA
  • Price is at its middle Bollinger band
  • RSI is flat (55.33)
  • Volume is average but descending
Key levels to the upside          Key levels to the downside

1: $0.266                                   1: $0.2454 

2: $0.27                                     2: $0.235

3: $0.273                                  3: $0.227


Categories
Forex Market Analysis

Daily F.X. Analysis, 13th October – Top Trade Setups In Forex – U.S. Inflation in Highlights! 

Investor’s eyes will stay on the Final CPI and Final core CPI due to the U.S. Economy. The analysts are forecasting no significant changes in the inflation rate; thus, it may go muted. However, the Claimant Count Change and Unemployment Rate data from the U.K. is likely to drive market movements. Let’s keep an eye on U.K. labor market figures and U.S. CPI m/m later today.

Economic Events to Watch Today  


EUR/USD – Daily Analysis

The EUR/USD pair was closed at 1.18109 after placing a high of 1.18265 and a low of 1.17865. Overall the movement of the EUR/USD pair remained flat throughout the day. The EUR/USD pair was flat on Monday, as the European Central Bank members reportedly downplayed expectations that it would adopt the Federal Reserve’s average inflation targeting measure, cooling bets on central banks allowing inflation to run above target.

Several ECB policymakers appeared reluctant to follow the Fed with an average inflation target on concerns it could lead to unrealistic expectations about future policy decisions. The European Central Bank has targeted an inflation policy of below but close to 2% for years. If ECB adopts average inflation targeting like Fed, this move will see the ECB allow inflation to run above its 2% target for some time to make up for periods of sluggish price increases. 

Recently, Eurozone inflation has remained short of the bank’s target. Following U.S. Federal Reserve on inflation targeting measure could allow inflation to rise above 2% and makeup periods of lagging price pressures.

Meanwhile, the signs that the second wave of coronavirus has started to weigh on growth have attracted the central bank’s attention and caused a sluggish move in the single currency Euro. On the data front, at 10:59 GMT, the German Wholesale Price Index dropped to 0.0% from the forecasted 0.2% and weighed on single currency Euro that ultimately weighed on EUR/USD pair.

On the U.S. front, the U.S. dollar remained strong onboard on Monday amid the rising hopes that a small coronavirus relief bill will be passed before elections as the talks over the massive stimulus bill stalled on the day. The new proposed bill by Trump of 1.8 trillion dollars faced rejection from both Republicans and Democrats. Republicans were reluctant to add more to the government debt pile, and Democrats wanted their 2.2 trillion packages.

After this, Trump Administration called on Congress for a small stimulus package to be funded from leftover funds and used for hardly-hit sectors like airline and small businesses. The hopes that a small package will be delivered before elections gave strength to the U.S. dollar that added pressure on EUR/USD, and the pair remained flat throughout the day.

Daily Technical Levels

Support Resistance

1.1791 1.1832

1.1767 1.1851

1.1749 1.1874

Pivot point: 1.1809

EUR/USD– Trading Tip

The EUR/USD pair is supported over 1.1790 level, which marks double bottom level on the 4-hour timeframe. Above this level, the EUR/USD is likely to bounce off until the 1.1811 level, and the bullish breakout of the 1.1831 level can also extend buying until the next target level of 1.1870. Conversely, the bearish breakout of the 1.1790 level can extend the selling trend until the 1.1750 level.

GBP/USD – Daily Analysis

The GBP/USD pair was closed at 1.30644 after placing a high of 1.30824 and a low of 1.30052. Overall the movement of the GBP/USD pair remained bullish throughout the day. The GBP/USD pair remained positive on Monday despite broad-based U.S. dollar strength. The pair traded at its four-week highest level, but the prospect remained depressed as the local country’s coronavirus situation escalated and forced to impose new restrictive measures.

The U.S. dollar was high on board after the talks for massive stimulus measures stalled again, and the Chinese yuan depreciated. The strong U.S. dollar helped cap further gains in GBP/USD pair on Monday. The latest move also weighed the gains in the GBP/USD pair from the Bank of England, who asked commercial banks earlier today about their readiness to cope with negative interest rates. On Monday, the Bank of England wrote banks to ask them how ready they were to cope with adopting negative interest rates.

This move from BoE raised concerns that it was considering cutting interest rates further to cope with the rising coronavirus cases in the U.K. The rising speculations over further rate cuts from BoE in the coming months weighed on British Pound and limited the additional gains in GBP/USD pair.

Meanwhile, the Governor of Bank of England, Andrew Bailey, said on Monday that the central bank thought Britain’s economy could struggle more than it has forecasted to recover from the coronavirus pandemic crisis. Bailey said that risk was, unfortunately, all on the downside, which added further pressure on British Pound.

Moreover, British Prime Minister Boris Johnson implemented a three-tiered system of restrictions with the closure of pubs in certain parts of England as the country was trying to deal with the rising number of coronavirus cases. These restrictive measures also exerted downside pressure on GBP/USD pair on Monday.

Furthermore, on the U.S. front, the U.S. dollar remained strong across the board after the Chinese yuan was depreciated. The Chinese city gave away 10M yuan in a lottery trial of digital currency. The latest digital currency trial was aimed at stimulating consumer spending to aid China’s economic recovery from the coronavirus pandemic.

Other than that, the U.S. dollar was also strong as the talks for a massive stimulus bill stalled again when Republicans and Democrats disagreed with passing the newly proposed bill by Trump of worth $1.8 trillion. After this, Trump Administration called on Congress to small stimulus aid for airline and small businesses. The strong U.S. dollar also kept the GBP/USD pair’s gain limited on Monday.

On the Brexit deal front, the concerns rose that negotiations could collapse as the differences between E.U. & U.K. demands were only rising. The deadline to reach a deal is just three days far, and no progress has been reported as of yet that has raised the risk sentiment in the market. The improved risk sentiment kept the GBP/USD pair higher on board.

Daily Technical Levels

Support Resistance

1.3018 1.3098

1.2971 1.3131

1.1938 1.3177

Pivot point: 1.3051

GBP/USD– Trading Tip

The GBP/USD is trading at 1.3043 level, holding right below an immediate resistance level of 1.3063. The resistance is extended by an upward channels’ trendline on the two-hourly timeframes. Below the 1.3063 resistance level, the Sterling can trigger selling until the 1.3003 level and 1.2959 level. On the higher side, a bullish breakout of 1.3063 levels can trigger buying until the 1.3127 level. The fundamental side is muted today, and the U.S. banks are closed in the observance of Columbus day; therefore, we may experience thin volatility. 

USD/JPY – Daily Analysis

The USD/JPY pair was closed at 105.317 after placing a high of 105.817 and a low of 105.240. Overall the movement of the USD/JPY pair remained bearish throughout the day. The USD/JPY pair failed to cheer the Chinese Yuan depreciation and U.S. dollar strength on Monday and continued decline over the fresh hopes that the U.S. stimulus aid package will be delivered before the elections.

The people’s Bank of China removed a 20% reserve requirement ratio for yuan forward settlements that undermined the cost of shorting yuan and weighed on the Chinese currency. But investors failed to take advantage of this depreciation in yuan, and the pair USD/JPY remained depressed in the market.

The rising number of coronavirus cases worldwide and the increased restrictions to curb the coronavirus pandemic’s effect raised the safe-haven appeal and supported the Japanese Yen that weighed on the USD/JPY pair. Meanwhile, the absence of key macroeconomic events due to the U.S. and Canada celebrating Columbus Day and Thanksgiving respectively exerted more pressure on the USD/JPY pair.

On the Japan front, the Bank Lending for the year was released at 04:50 GMT that remained flat at 6.4%. The Core Machinery Orders raised to 0.2% from the forecasted -1.0% and supported the Japanese Yen that weighed on the USD/JPY pair. Whereas, the PPI for the year from Japan decreased to -0.8% against the forecasted -0.5%. At 10:58 GMT, the Prelim Machine Tool Orders for the year remained flat at -15.0%.

Furthermore, the newly proposed U.S. stimulus measure of $1.8 trillion by Trump also faced rejection from both parties. In response to this, the Trump administration asked Congress to provide Americans with a small relief fund specifically for airlines and small businesses before elections.

The hopes that a small package could be passed before elections and a massive stimulus package after elections weighed on the U.S. dollar and added further losses in the USD/JPY pair on Monday.

Moreover, the White House physician Sean Conley said that U.S. President Donald Trump was free of transmission risk to others on Saturday. On Sunday, Trump claimed that he was now immune from the coronavirus, but the chances to get infected remained again. Trump was tested positive for coronavirus on first October, and he has been getting medical assistance since then. The news that Trump was getting better and has no transmission risk raised risk sentiment and capped further losses in the USD/JPY pair by weighing on safe-haven Japanese yen.

Daily Technical Levels

105.05 105.70

104.82 106.12

104.40 106.36

Pivot point: 105.47

USD/JPY – Trading Tips

On Tuesday, the USD/JPY traded sharply bearish to drop from 105.900 level to the 105.450 mark. Most of the selling triggered after the USD/JPY violated an upward channel at 105.900 level. Currently, the USD/JPY pair is trading at 105.459 level, the support level that’s extended by double bottom level. A bearish breakout of 105.450 level may drive further selling until the 105.070 support level as the MACD, and the 50 periods EMA are in support of selling bias today. Let’s consider opening sell trade below 105.40 level today. Good luck!  

Categories
Crypto Market Analysis

Daily Crypto Review, Oct 12 – Crypto Market Consolidating After a Surge: What’s Next?

The cryptocurrency sector has experienced a surge over the weekend as Bitcoin pushed above $11,000. Bitcoin is currently trading for $11,319, representing a decrease of 0.25% on the day. Meanwhile, Ethereum gained 0.09% on the day, while XRP gained 0.32%.

 Daily Crypto Sector Heat Map

Taking a look at the top 100 cryptocurrencies, we can see that Ren gained 27.02% in the past 24 hours, making it the top daily gainer. Monero (9.75%) and Cosmos (7.98%) also did great. On the other hand, Loopring lost 7.99%, making it the most prominent daily loser. It is followed by StorJ’s loss of 6.76% and PumaPay’s loss of 6.54%.

Top 10 24-hour Performers (Click to enlarge)

Bottom 10 24-hour Performers (Click to enlarge)

Bitcoin’s market dominance level has decreased slightly since our last report, with its value currently being 60.66%. This value represents a 0.67% difference to the downside when compared to when we last reported.

Daily Crypto Market Cap Chart

The crypto sector capitalization has gained quite a bit of value over the course of the weekend. Its current value is $358.48 billion, representing an increase of $14.33 billion compared to our previous report.

_______________________________________________________________________

What happened in the past 24 hours?

_______________________________________________________________________

_______________________________________________________________________

Technical analysis

_______________________________________________________________________

Bitcoin

The largest cryptocurrency by market cap has continued its push towards the upside on Friday/Saturday, reaching as high as $11,500. The move has died out since, and Bitcoin is now trading in a narrow range between the $10,300 support level and $10,500 resistance level (61.8% Fib retracement). The volume seems to be dying off, while the RSI is descending, which may indicate a short window where traders shouldn’t expect much volatility, but rather trade within this range. However, Bitcoin cannot stay locked up in such a narrow range for too long and will have to make another move in the short future.


BTC/USD 4-hour Chart

Bitcoin’s technical overview is tilted towards the buy-side overall, but its short-term (4-hour and 1-day) technicals are a bit mixed up, with oscillators questioning the bullishness. However, its long-term outlook is completely bullish

BTC/USD 1-day Technicals

Technical factors (4-hour Chart):
  • Price is above both its 50-period EMA and 21-period EMA
  • Price is near the middle Bollinger band
  • RSI is descending from almost-overbought levels (66.90)
  • Volume is descending
Key levels to the upside          Key levels to the downside

1: $11,500                                 1: $11,300

2: $11,630                                 2: $11,180

3: $12,000                                  3: $11,000

Ethereum

Ethereum’s movement over the weekend was similar to Bitcoin’s, with its price skyrocketing on Friday/Saturday, only to consolidate after the move ended. Ethereum bulls reached exhaustion after the price hit the 38.2% Fib retracement, and started consolidating right below it. Just as with Bitcoin, Ethereum is stuck within a range, bound by $371 to the downside and $378 to the upside.

Ethereum’s flat (and nearly overbought) RSI and descending volume indicate that Ethereum is preparing for a move.

ETH/USD 4-hour Chart

Ethereum’s short-term technicals are somewhat unclear, with its 4-hour overview turning to bullish and 1-day overview still being tilted towards the sell-side quite heavily. On the other hand, its long-term technicals are quite bullish.

ETH/USD 1-day Technicals

Technical Factors (4-hour Chart):
  • The price is above both its 50-period and 21-period EMA
  • The price is near its middle Bollinger band
  • RSI is flat and nearly overbought(66.85)
  • Volume is below average
Key levels to the upside          Key levels to the downside

1: $378                                     1: $371

2: $400                                     2: $360

3: $415                                      3: $334

Ripple

While XRP has also moved over the weekend, its move was not as significant as Bitcoin’s or Ethereum’s move. This is simply because it did not break any recent resistances, but rather got stuck at the same one it couldn’t get past on Oct 6. XRP is now consolidating at around $0.255, and we may possibly see a pullback to the orange ascending line as a retest of this upward-facing trend.

XRP has two possibilities now: it will either push towards $0.266 (less likely) or pull back towards the ascending line (more likely). Traders should keep in mind both of these scenarios when attempting to trade XRP.

XRP/USD 4-hour Chart

XRP’s 4-hour, 1-day, and weekly technicals are practically the same and are all tilted towards the buy-side (with oscillators being more or less neutral), while its monthly overview is heavily tilted towards the sell-side.

XRP/USD 1-day Technicals

Technical factors (4-hour Chart):
  • The price is above its 50-period EMA and at its 21-period EMA
  • Price is at its middle Bollinger band
  • RSI is descending (52.16)
  • Volume is average (descending)
Key levels to the upside          Key levels to the downside

1: $0.266                                   1: $0.2454 

2: $0.27                                     2: $0.235

3: $0.273                                  3: $0.227


Categories
Forex Fundamental Analysis

Everything You Should Know About ‘Reserve Assets’ As A Macro Economic Indicator

Introduction

In the current age of globalization and increasing international trade, every country strives to have a favorable balance of payment and a stable currency in the international market. As is with any other market, a currency’s exchange rate is majorly determined by the forces of demand and supply. For stability of its exchange rate, a country might opt to purchase its currencies from the international market to reduce its supply, using its reserve assets.

Understanding Reserve Assets

In finance, reserve assets refer to foreign currencies held and controlled by a country’s central bank. The central banks are mandated to use the reserve currency as they deem fit to benefit the local economy. A reserve currency is supposed to be a universally accepted currency whose value is relatively stable over time. The US dollar is the most preferred reserve currency. Other major currencies include the Euro and GBP.

Purposes of the Reserve Assets

A country’s central bank can use the reserve assets it controls in several ways.

The reserve assets can be used to influence the exchange rate of the local currency against international currencies. Countries can do this whether their exchange rate is fixed or floating. For a fixed exchange rate, a country will peg the exchange rate of its currency against a reserve currency. Pegging the local currency against another one means that the local currency’s value will adjust at the same rate as the other currency.

In this case, when the local government wants to increase its currency value, it uses the reserve assets to buy its currency from the international market. In turn, the demand for the local currency goes up along with its value. The main goal for currency pegging is to remove inflation or changes in the interest rates from impacting the trade between two economies.

Source: St. Louis FRED

For countries whose exchange rate is floating, the central banks use the reserve assets to adjust their currencies relative to that of the reserve currency. If a country wants to weaken its currency to make its exports competitive in the international market, it will sell its currency to buy reserve assets. Conversely, if it wants to increase its currency value, it will use the reserve assets to purchase its currency from the international market.

Another function of the is to shore up the economy in case of natural or human-made disasters. In such disasters, economic activities in the country may be crippled, which significantly lowers the exports. Consequently, the foreign exchange earned in the international market. The central banks use the reserve assets to ensure there is enough liquidity of foreign currency for importation.

Furthermore, in such disasters, investors may flee the country by withdrawing from the local banks. The resultant shortage of foreign currency will reduce the value of the local currency. The central banks can use the reserve assets to buy the local currency to prevent over-inflation and keep the local currency stable.

The country’s reserve assets are also used to meet its financial obligations, such as debt repayment. When a country borrows from the international markets, the interest payments are usually demanded to be paid in the reserve currency. Debtors prefer the reserve currency since it guarantees them that their cash flow is protected from rapid inflation. Therefore, having adequate reserve assets gives investors and creditors confidence that their capital is protected.

Using the reserve assets data for analysis

There is a minimum limit of reserve assets that a country is recommended to hold. This minimum threshold is meant to ensure that in case of any economic shocks, the country can fund essential imports in the short term. Furthermore, the minimum reserves should cover all the country’s debt obligations for about a year.

Therefore, when the reserve assets held by a country are dropping, it could indicate that the economy is experiencing shocks, and the central banks have stepped in to mitigate. When these levels are continually dropping, it means that the economic shocks being experienced are not reducing.

Source: St. Louis FRED

Considering that the reserve assets increase when the balance of payments accounts is improving, a drop in the reserve assets signals that a country in exceedingly becoming a net importer. A reduction in the number of exports or a drop in the value of exports results in net imports. Either way, it implies that the country’s living standards have deteriorated, and unemployment is on the rise.

All these factors point towards a shrinking economy. Conversely, a constant increase in reserve assets implies that the country is a net exporter, which could increase the quantity of exports or quality through value addition. These two factors signal a growing economy with possibly improving labor market conditions.

Impact on Currency

Apart from the direct influence of the exchange rate by buying and selling the reserve assets, here are some of the ways changing levels of a country’s reserve assets impact its currency. Higher reserve assets levels show that the country is well prepared to deal with any unforeseen economic shocks. For investors, this is a sign of stability and encourages them to invest in the country, which leads to lower unemployment and economic growth. Thus, increasing levels of reserve assets lead to a currency’s appreciation.

Conversely, a persistent drop in the reserve assets is negative for the currency. Dropping reserve assets is an indicator that the local currency is under pressure, and the central banks are selling reserve assets to stabilize the currency. Similarly, it could mean that exports in the economy have been reducing over time. Both these instances point towards an adversely affected economy.

Sources of Data

In the US, the data on reserve assets is published monthly by the US Federal Reserve Board, while in the EU, it is published by the European Central BankThe IMF publishes data on global reserve assets balances.

How Reserve Assets Data Release Affects Forex Price Charts

The most recent release of the EU’s reserve assets data was on September 15, 2020, at 10.00 AM GMT. The release can be accessed at Investing.com. The screengrab below is of the monthly reserve assets from Investing.com. To the right is a legend that indicates the level of impact the FI has on the EUR.

As can be seen, this low volatility is expected upon the release of the reserve assets data.

In August 2020, the EU’s total reserve assets were 915.08 billion compared to 923.07 billion in July 2020.

EUR/USD: Before the Reserve Assets Data Release on September 15, 2020, 
Just Before 10.00 AM GMT

Before the publication of the reserve assets data by the ECB, the EUR/USD pair was trading in a neutral trend. The 20-period MA was flattening with candles forming just around it.

EUR/USD: After the Reserve Assets Data Release on September 15, 2020, 
at 10.00 AM GMT

After the news release, the pair formed a 5-minute “Doji” candle. Subsequently, the pair adopted a bullish trend with candles crossing and forming above the rising 20-period MA.

Bottom Line

The total reserve assets that a country holds is a crucial indicator of its economic health and balance of payments condition. But as can be seen in the above analyses, this indicator has no significant impact on the forex price action. We hope you found this article informative. Let us know if you have any questions in the comments below. Cheers!

Categories
Forex Market Analysis

Daily F.X. Analysis, 12th October – Top Trade Setups In Forex – U.S. Bank Holiday! 

On the news front, the market is likely to exhibit slight movements as the U.S. and Canadian banks are closed in Columbus’s observance and thanksgiving holiday. Therefore, most of the focus should stay on the technical side of the market today.

Economic Events to Watch Today  


EUR/USD – Daily Analysis

The EUR/USD pair was closed at 1.18296 after placing a high of 1.18308 and a low of 1.17478. Overall the movement of the EUR/USD pair remained bullish throughout the day. The EUR/USD raised to its more than 2-weeks highest level on Friday on the back of lifted sentiment in the market after the renewed hopes for a U.S. stimulus package. EUR/USD pair rose on Friday despite the increasing tensions regarding the coronavirus pandemic.

The second wave of the COVID-19 pandemic in the Eurozone forced governments across the region to start implementing fresh restrictions mostly on leisure activities like bars, pubs, and restaurants. The Chief Economist of European Central Bank, Philip Lane, said that the next phase of coronavirus would be tougher for the European economy.

Lane said that the central bank would wait to see the government’s response to the coronavirus challenge as they publish their budgets for 2021; by saying so, he dampened expectations for fresh stimulus from the ECB by this month. The news that the ECB will not announce any stimulus measure by the end of this month despite rising coronavirus cases raised the risk sentiment and pushed EUR/USD pair on board. 

On the other hand, Trump, who said earlier this week that talks between Republicans & Democrats will be halted until elections, said that he wanted a bigger stimulus package for Americans on Friday. The U-turn by Trump for the coronavirus stimulus package came in after polls suggested a victory of Joe Biden in upcoming elections due to his support for the big stimulus package.

The talks between Nancy Pelosi and Steven Mnuchin resumed on Friday after Trump gave the go-ahead stimulus package. These developments raised risk sentiment in the market as the hopes increased that a package will be delivered before the elections. This, in turn, weighed on the U.S. dollar, and that ultimately pushed the already rising EUR/USD pair on the upside towards more than 2—weeks highest level.

Meanwhile, at 11:45 GMT, the French Industrial Production for August declined to 1.3% from the expected 2.1% and weighed on Euro on the data front. At 13:00 GMT, the Italian Industrial Production for August raised to 7.7% from the expected 1.3% and supported the single currency that ultimately added further in the EUR/USD pair upside momentum.

From the U.S. side, the Final Wholesale Inventories dropped to 0.4% from the forecasted 0.5% and supported the U.S. dollar that capped further gains in EUR/USD pair.

Daily Technical Levels

Support Resistance

1.1734     1.1784

1.1708     1.1808

1.1684     1.1834

Pivot point: 1.1758

EUR/USD– Trading Tip

On Monday, the EUR/USD is trading with a bullish bias around 1.1798 level, having an immediate resistance at 1.1832 level. A bullish crossover of 1.1832 level may lead the EUR/USD pair further higher until the 1.1870 mark. At the same time, the support continues to stay at 1.1798 level. The violation of the symmetric triangle pattern nad an upward channel is supported by bullish bias in the EUR/USD pair today. Let’s consider taking a buy trade over 1.1798 level today. 


GBP/USD – Daily Analysis

The GBP/USD pair was closed at 1.30441 after placing a high of 1.30489 and a low of 1.29135. Overall the movement of the GBP/USD pair remained bullish throughout the day. The GBP/USD pair moved to its one month’s highest level on Friday after the U.S. dollar came under pressure over fresh stimulus hopes. In the absence of any latest development surrounding the Brexit talks, the GBP/USD pair continued following the U.S. dollar’s movements.

Wall Street’s main indexes remained in the positive territory for the third straight day on Friday after Trump gave the go-ahead for talks over the next round of the stimulus package. Earlier this week, Trump ordered to halt further talks with Democrats over the stimulus package till elections. But later, he decided sideways and said that he wanted a small stimulus package specifically for airline workers. And now, on Friday, Trump said that he wanted to give a big stimulus package to Americans before the elections. He proposed a $1.8 trillion package and approved further talks. The latest proposed package will include checks to individuals and an extension of the paycheck protection program.

The U.S. Treasury Secretary Steven Mnuchin and House Speaker Nancy Pelosi resumed talks on the revised package of 1.8 trillion dollars on Friday. This gave hopes that the package will be delivered before elections and supported the GBP/USD pair’s risk sentiment.

On the Brexit front, on Friday, an E.U. diplomat said that European Union chief Brexit negotiator, Michel Barnier wanted a few more concessions from Britain before entering the last intense phase of negotiations on a trade deal.

The two main negotiators from the E.U. side, Barnier and David Frost, said they were inching towards a deal. However, they also said that important gaps remained on fishing, level playing field, and governance issues. 

As we already know, the PM Boris Johnson has given the 15th October deadline to reach a deal, and given this deadline, before reaching the final round of make-or-break negotiations, Barnier has asked for a few more concessions. It remains that Johnson will allow for a further concession or not; however, both sides have confirmed that they were prepared for a no-deal scenario if needed. 

Furthermore, France has sharpened its tone on fishing rights and warned that an agreement on the fishing issue with the United Kingdom would be an integral part of the Brexit deal, and its proposals have fallen short. The French Minister of the Sea Annick Girardin said that the U.K. had made unacceptable proposals, and the nation’s fisherman has said in response that they would prefer no-deal over a bad one.

On the data front, at 11:00 GMT, the Construction Output for August dropped to 3.0% against the forecasted 5.1% and weighed on GBP/USD pair. August’s GDP also fell to 2.1% from the forecasted 4.6% and weighed on GBP/USD pair. 

The Goods Trade Balance came in line with the expectations of -9.0B. The Index of Services for the quarter raised 7.1% from the forecasted 7.0% and supported British Pound. The Industrial Production for August decreased to 0.3% from the projected 2.6% and weighed on GBP. The Manufacturing Production for August also declined to 0.7% from the projected 3.2% and weighed on British Pound. Despite poor than expected macroeconomic data from Great Britain, the GBP/USD pair raised in the market to its one month’s highest level on the back of improved risk sentiment amid Brexit and U.S. stimulus package developments.

Daily Technical Levels

Support Resistance

1.2921     1.3013

1.2863     1.3049

1.2828     1.3106

Pivot Point: 1.2956

GBP/USD– Trading Tip

The GBP/USD is trading at 1.3043 level, holding right below an immediate resistance level of 1.3063. The resistance is extended by an upward channels’ trendline on the two-hourly timeframes. Below the 1.3063 resistance level, the Sterling can trigger selling until the 1.3003 level and 1.2959 level. On the higher side, a bullish breakout of 1.3063 levels can trigger buying until the 1.3127 level. The fundamental side is muted today, and the U.S. banks are closed in the observance of Columbus day; therefore, we may experience thin volatility 


USD/JPY – Daily Analysis

The USD/JPY pair was closed at 105.603 after placing a high of 106.039 and a low of 105.579. Overall the movement of the USD/JPY pair remained bearish throughout the day. On Friday, the USD/JPY pair dropped and reversed its direction as the U.S. President Donald Trump took a U-turn from his earlier statements related to the U.S. stimulus package. The market moved against the U.S. dollar and made it weak across the board after hopes for Joe Biden to win the election increased, and Trump approved stimulus talks.

On Friday, the U.S. President Donald Trump said he wanted a new and big stimulus package than earlier proposed in a radio interview. He said that he wanted to provide checks to Americans before elections. Whereas, earlier this week, Trump said that he wanted to halt further talks till elections, and after that, he said that he wanted a small stimulus package for airline workers.

The U-turn by U.S. President over the stimulus package gave a boost to risk sentiment as it increased the hopes that the package will be delivered before the elections. This weighed on the U.S. dollar, and the pair USD/JPY suffered on Friday. Furthermore, on Friday, Larry Kudlow said that Trump had approved the talks for a new proposed stimulus package worth $1.8 trillion. The talks for it have resumed on Friday between U.S. Treasury Secretary Steven Mnuchin and House Speaker Nancy Pelosi. 

On the data front, at 04:30 GMT, the Average Cash Earnings for the year declined to -1.3% against the forecasted -1.2% and weighed on the Japanese Yen. The Household Spending for the year from Japan also dropped to -6.9% from the forecasted -6.6% and weighed on the Japanese Yen. Despite Japan’s negative macroeconomic data, the USD/JPY pair remained bearish throughout the day amid broad-based U.S. dollar weakness. From the U.S. side, the Final Wholesale Inventories for August were released at 19:00 GMT that dropped to 0.4%from the projected 0.5% and supported the U.S. dollar. However, traders ignored the U.S. data as the focus was shifted completely towards the U.S. stimulus developments.

On the other hand, the United Kingdom’s coronavirus situation worsened as one of the U.K.’s top scientists warned that the country was at a tipping point. He said that more deaths from the viruses would follow a rise in cases in the coming weeks. He added that country was facing a similar situation that it last seen in March. The rising number of coronavirus cases worldwide raised safe-haven appeal and supported the Japanese Yen and weighed on the USD/JPY pair.

Daily Technical Levels

Support Resistance

105.53    105.80

105.42     105.98

105.25     106.08

Pivot point: 105.70

USD/JPY – Trading Tips

The USD/JPY traded sharply bearish to drop from 105.900 level to 105.450 mark. Most of the selling triggered after the USD/JPY violated an upward channel at 105.900 level. Currently, the USD/JPY pair is trading at 105.459 level, the support level that’s extended by double bottom level. A bearish breakout of 105.450 level may drive further selling until the 105.070 support level as the MACD, and the 50 periods EMA are in support of selling bias today. Let’s consider opening sell trade below 105.40 level today. Good luck!  

Categories
Crypto Market Analysis

BTC/USD Weekly Overview + Possible Outcomes

This is the BTC/USD 1-day timeframe analysis, where we are looking at the most recent events, the current technical formations, as well as discussing possible outcomes.

Overview


Bitcoin has shown some volatility in recent days after bouncing off of the 100-period moving average (black line). The largest cryptocurrency by market cap bounce off of this line as well as the $10,500 level brought a lot of bulls back to the market, causing another price swing upwards. While it was more likely that Bitcoin would push down towards $10,360, the news surrounding it (many accredited and institutional investors putting their funds in the market at this particular moment) outweighed the bearishness caused by the macro events.

Technical factors

Bitcoin has been building a triangle formation for over a month now, and it was a consensus among analysts and traders that the triangle will most likely break towards the downside. However, the most recent push off of the 100-period MA (mostly due to fundamentals rather than technical factors) has proven traders wrong and decided Bitcoin’s short-term future.

The push towards the upside briefly stopped after breaking the uncertainty area, only to consolidate there and create enough pressure for the next move. After this happened, Bitcoin was free to move towards the $11,000 resistance level . At the moment, the pressure created by the bulls is fading, and we may expect a pullback.

Likely Outcomes


Bitcoin has encountered strong resistance at the $11,000 level, which will most likely cause it to back down towards $10,850. With (as we spoke in our numerous analyses) $10,850 level being the pivot pointBitcoin will choose to either back down towards $10,500 or $10,360 before (most likely) rising again, or to bounce from the $10,850 area and push towards $11,000-$11,300. At this moment, the most likely scenario is that Bitcoin will stay above $10,850 for the time being and that its next push will possibly move its price above $11,000, but almost certainly not above $11,300.

If we are talking about straightforwards pushes towards the upside or downside, it would take a great deal of pressure to either side to break its support or resistance levels, sitting at $10,850 and $11,300.

Categories
Forex Signals

EUR/JPY Upward Channel Underpins Bullish Trend – An Update on Signal 

During the Friday’s European trading hours, the EUR/JPY currency pair succeeded to extend its previous session gaining streak and hit the intra-day high level around above 125.00 level mainly due to the risk-on market sentiment, backed by the prevalent optimism over treatment for the highly infectious coronavirus, which tends to undermine the safe-haven Japanese yen and contributes to the currency pair gains. Moreover, the market risk tone was further boosted by the increasing expectations of further US stimulus package, which provided further boost to the currency pair. 

On the contrary, Europe’s quickly rising coronavirus (COVID-19) cases fueled the worries over the EUR economy recovery, which becomes the key factor that kept the lid on any additional gains in the currency pair. Meanwhile, the latest report that the Spanish Prime Minister (PM) Pedro Sánchez announced a state of emergency in Madrid also played a major role in capping further currency pair gains. As of writing, the EUR/JPY currency pair is currently trading at 124.97 and consolidating in the range between 124.51 – 125.02.

As we already mentioned that the equity market has been flashing green since the day started. The reason could be associated with the major positive catalysts. Be it the renewed probabilities of the further stimulus package or optimism over treatment for the highly infectious coronavirus, not to forget the upbeat China data, these all factors favor the market trading sentiment, which could be considered the main factors that kept the currency pair higher. 

It should be noted that the US President Donald Trump stepped back from his earlier ‘NO’ to the coronavirus (COVID-19) aid package talks. However, US President Donald Trump is ready to shift towards the large scale bill, which propels the market’s risk sentiment and weighs on the safe-haven Japanese yen. Apart from this, the coronavirus (COVID-19) vaccine’s hopes also favored the market risk tone, which eventually underpinned the safe-haven US Japanese yen and contributed to the currency pair gains.

As per the latest report, China joins the World Health Organization’s virus vaccine program after returning from one week-long holiday, which initially fueled the hopes of a disease cure. Meanwhile, the market trading sentiment was further bolstered by the positive reports that Gilead and Regeneron’s vaccine research efforts will offer strong results to stop the virus.

On the contrary, the Spanish Prime Minister (PM) Pedro Sánchez announced a state of emergency in Madrid as the COVID-19 cases in the UK and Germany are also worrisome. At the coronavirus front, the coronavirus cases grew to 314,660, with a total of 9,589 deaths toll, according to the German disease and epidemic control center, Robert Koch Institute (RKI) report. In the meantime, the cases rose by 4,516 on the day while the death toll rose by 11. The daily rise in new cases topped 4,000 for the second day in a row, the highest numbers since April 10. These virus fears could be considered one of the key factors that kept the lid on any additional currency pair gains.

In the absence of the major data/events on the day, the market traders will keep their eyes on the Canadian jobs data. In the meantime, the risk catalyst like geopolitics and the virus woes, not to forget the Brexit, will also be key to watch for the fresh direction.


Daily Support and Resistance

S1 121.85

S2 122.64

S3 123.04

Pivot Point 123.43

R1 123.83

R2 124.22

R3 125

The EUR/JPY has violated the triple top resistance level of 124.850 mark, and now this is opening further room for buying until the next resistance level of 125.300 level. On the lower side, the support continues to stay at 124.850 level. The MACD and the 50 periods EMA are also supporting the buying trend today and check out a trading plan below.

Entry Price – Buy 124.933

Stop Loss – 124.533

Take Profit – 125.333

Risk to Reward – 1:1

Profit & Loss Per Standard Lot = -$400/ +$400

Profit & Loss Per Micro Lot = -$40/ +$40

Fellas, now you can check out forex trading signals via Forex Academy mobile app. Follow the links below.

iPhone Users: https://apps.apple.com/es/app/fasignals/id1521281368

Andriod Users: https://play.google.com/store/apps/details?id=academy.forex.thesignal&hl=en_US

Categories
Crypto Market Analysis

Daily Crypto Review, Oct 9 – Bitcoin Close to $11,000: What’s Next?

The cryptocurrency sector as a whole has experienced a quick push to the upside. Bitcoin is currently trading for $10,839, representing an increase of 2.44% on the day. Meanwhile, Ethereum gained 2.91% on the day, while XRP gained 1.59%.

 Daily Crypto Sector Heat Map

If we look at the top 100 cryptocurrencies, we can see that UMA gained 31.88% in the past 24 hours, making it the most prominent daily gainer. The Midas Touch Gold (25.91%) and SushiSwap (18.59%) also did great. On the other hand, PumaPay lost 12.87%, making it the most prominent daily loser. It is followed by Zuba Token’s loss of 2.87% and Augur’s loss of 2.32%.

Top 10 24-hour Performers (Click to enlarge)

Bottom 10 24-hour Performers (Click to enlarge)

Bitcoin’s market dominance level has stayed at the same place since our last report, with its value currently being at 61.01%. This value represents a 0.05% difference to the upside when compared to when we last reported.

Daily Crypto Market Cap Chart

The crypto sector capitalization has gained quite a bit of value over the course of the past 24 hours. Its current value is $343.72 billion, representing an increase of $10.6 billion compared to our previous report.

_______________________________________________________________________

What happened in the past 24 hours?

_______________________________________________________________________

_______________________________________________________________________

Technical analysis

_______________________________________________________________________

Bitcoin

The largest cryptocurrency by market cap has broken its triangle formation towards the upside after a bounce from the $10,500 support level. The massive bull presence had brought the price just under $11,000 before BTC started to pull back and seek an appropriate level to consolidate at. At the time being, Bitcoin is fighting for $10,850, and staying above, it would be a major precursor to its future possible push towards $11,000-$11,300.

Traders should pay close attention to Bitcoin’s price movement around the $10,850 level, as well as the ascending line (pink), and trade based on how the price reacts to these levels.

BTC/USD 4-hour Chart

Bitcoin’s technical overview has turned bullish overall, with every single time-frame being bullish. While its weekly and monthly overviews were bullish for months now, its daily and 4-hour technicals have turned bullish only after the most recent spike.

BTC/USD 4-hour Technicals

Technical factors (4-hour Chart):
  • Price is above both its 50-period EMA and 21-period EMA
  • Price is near the top Bollinger band
  • RSI is descending from almost-overbought levels (61.39)
  • Volume is descending from above-average
Key levels to the upside          Key levels to the downside

1: $11,000                                 1: $10,850

2: $11,180                                 2: $10,630

3: $11,300                                  3: $10,500

Ethereum

Ethereum has moved towards the upside alongside Bitcoin, but its price movement didn’t do anything as impactful as Bitcoin’s price. While the bounce from the $344 level was significant, it could not reach, let alone pass, the $360 level. Ethereum’s short-term future is certainly within this range, which traders can make use of.

Once again, we will point out an extremely high chance of Ethereum staying between $334 and $360.

ETH/USD 4-hour Chart

Ethereum’s short-term technicals are somewhat unclear, with its 4-hour overview turning to bullish and 1-day overview still being tilted towards the sell-side quite heavily. On the other hand, its long-term technicals are quite bullish.

ETH/USD 4-hour Technicals

Technical Factors (4-hour Chart):
  • The price is above both its 50-period and 21-period EMA
  • The price is near its middle Bollinger band
  • RSI is neutral (54.08)
  • Volume is below average (one-candle spike)
Key levels to the upside          Key levels to the downside

1: $360                                     1: $334

2: $371                                     2: $300

3: $400                                      3: $289

Ripple

XRP has used Bitcoin’s move towards the upside to fuel its own move and established itself above the $0.2454 level. The third-largest cryptocurrency by market cap has bounced off the ascending line (and not the $0.2454 level this time) dating back from Sep 24 and pushed up, reaching as high as $0.253 before ending the move.

Traders should pay attention to any sharp increases in volume, as well as how XRP handles the immediate support and resistance levels. Most analysts are currently quite bullish on XRP, mostly when it comes to 1-hour and 4-hour charts.

XRP/USD 4-hour Chart

XRP 4-hour, daily, and weekly technicals are quite bullish, while its monthly overview is tilted towards the sell-side.

XRP/USD 4-hour Technicals

Technical factors (4-hour Chart):
  • The price is above its 50-period EMA and its 21-period EMA
  • Price is close to its middle Bollinger band
  • RSI is neutral (55.13)
  • Volume is above average
Key levels to the upside          Key levels to the downside

1: $0.266                                   1: $0.2454 

2: $0.27                                     2: $0.235

3: $0.273                                  3: $0.227


Categories
Forex Signals

Overbought Gold Braces for Bearish Correction – Brace for a Sell! 

The yellow metal prices extended its early-day bullish rally and remained well bids around above the 1,900 level. However, the bullish sentiment around the bullion prices could be associated with the broadly weaker U.S. dollar. The risk-on market sentiment undermined that. Meanwhile, the U.S.’s prevailing political uncertainty also pushed the U.S. dollar down for the second consecutive day. Thus, the U.S. dollar losses could be considered one of the key factors that kept the gold prices higher as the price of gold is inversely related to the price of the U.S. dollar. Apart from this, the surge in the coronavirus (COVID-19) numbers in the U.K. and Europe also favoring the yellow-metal bulls. 

In the meantime, the U.S. geopolitical tension with the Middle East and China provided an additional boost to the safe-haven metal prices. On the contrary, the optimism over a potential vaccine/treatment for the highly infectious coronavirus and hopes of the further stimulus package keep the market trading sentiment bullish, which could be considered as the key factor that cap further upside momentum for the gold prices. Whereas, the Trump recovery from the COVID-19 infection also offers an additional reason for the market traders to remain hopeful. The yellow metal prices are currently trading at 1,909.87 and consolidating in the range between 1,893.78 – 1,912.96.

Despite the ongoing Sino-US tussle and worries concerning the coronavirus (COVID-19) crisis, the market trading sentiment extended its early-day positive tone and remained supportive by combining factors. As in result, the S&P 500 Futures gain over 0.40%, whereas Japan’s Nikkei slips four points to 23,643 as of writing. Hence, the basis for the risk-on market trading bias could be connected to the positive headlines implying that the discussions between House of Representative Speaker Nancy Pelosi and Treasury Secretary Steven Mnuchin over the U.S. stimulus package resumed overnight. While President Donald Trump announced that discussions with Congress have resumed despite stopped the coronavirus (COVID-19) stimulus talks until the Nov. 3 presidential election. However, this helped the market’s risk sentiment and undermined the U.S. dollar’s safe-haven demand.

Apart from this, Trump continues to recover from the COVID-19 infection. Whereas the White House physician Sean Conley said that Trump completed his therapy course, and his condition remains stable since returning to the White House on Monday.

Across the ocean, the tensions between the U.S. and China and the surge in the coronavirus (COVID-19) numbers in the U.K. and Europe keep challenging the market risk-on tone. Although the Dragon Nation has recently started facing global pressure against its treatment of Uighur Muslims, 18 Iranian banks were sanctions off-late by the U.S. State Department to curb Tehran’s financial access help further safe-haven yellow metal.

At the coronavirus front, the ongoing rise in COVID-19 cases globally continues to fuel worries concerning the global economic outlook for the foreseeable tomorrow. As per the latest report, Spanish Prime Minister (PM) Pedro Sánchez announced a state of emergency in Madrid while the calls of closing the pubs and restaurants in the U.K. have been out and clear off-late. Looking forward, the market traders will keep their eyes on updates surrounding the Sino-US tussle and stimulus headlines. Whereas China’s return and Caixin Services PMI will be key to watch. In the meantime, the 


Daily Support and Resistance

S1 1847.32

S2 1874.78

S3 1887.18

Pivot Point 1902.24

R1 1914.64

R2 1929.7

R3 1957.16

Gold has risen distinctly to trade at 1,912 marks, but the neutral candle’s closing below 1,912 levels implies mixed bias amongst traders. Hence, another formation of bearish engulfing or tweezers top pattern may begin bearish correction/retracement in gold. On the downside, gold may gain support at 1,906 and 1,899. Conversely, a bullish breakout of 1,912 stand-level may prolong the buying trend until the 1,919 level.
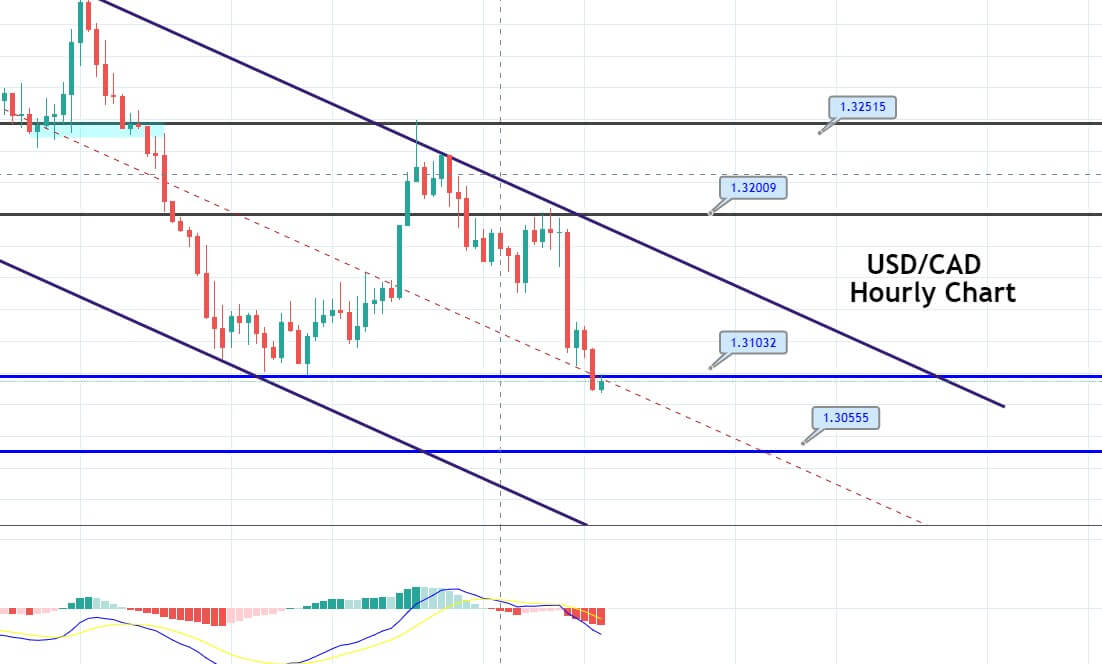
Entry Price – Sell 1909.74

Stop Loss – 1915.74

Take Profit – 1902.24

Risk to Reward – 1:1

Profit & Loss Per Standard Lot = -$600/ +$750

Profit & Loss Per Micro Lot = -$60/ +$75

Fellas, now you can check out forex trading signals via Forex Academy mobile app. Follow the links below.

iPhone Users: https://apps.apple.com/es/app/fasignals/id1521281368

Andriod Users: https://play.google.com/store/apps/details?id=academy.forex.thesignal&hl=en_US

Categories
Forex Market Analysis

Daily F.X. Analysis, 09th October – Top Trade Setups In Forex – U.K. GDP in Highlights 

On the news front, the eyes will remain on the series of economic events from the U.K., especially the GDP m/m, Goods Trade Balance, and Industrial Production m/m. The sterling may suffer today as the GDP and Construction Output are forecasted to be worse than before. Besides, the Canadian economy will also remain in highlights for the release of Employment Change and Unemployment Rate as both of these are expected to report negative data.

Economic Events to Watch Today  


EUR/USD – Daily Analysis

The EUR/USD pair was closed at 1.17599 after placing a high of 1.17815 and a low of 1.17325. Overall the movement of the EUR/USD pair remained flat throughout the day. The EUR/USD pair remained flat on Thursday as it closed its day on the same level it was started with. The earlier decline in the EUR/USD pair was due to the rising concerns mentioned in monetary policy accounts. At the same time, the surge in the EUR/USD pair was caused by the latest comments from President Trump about the U.S. stimulus deal.
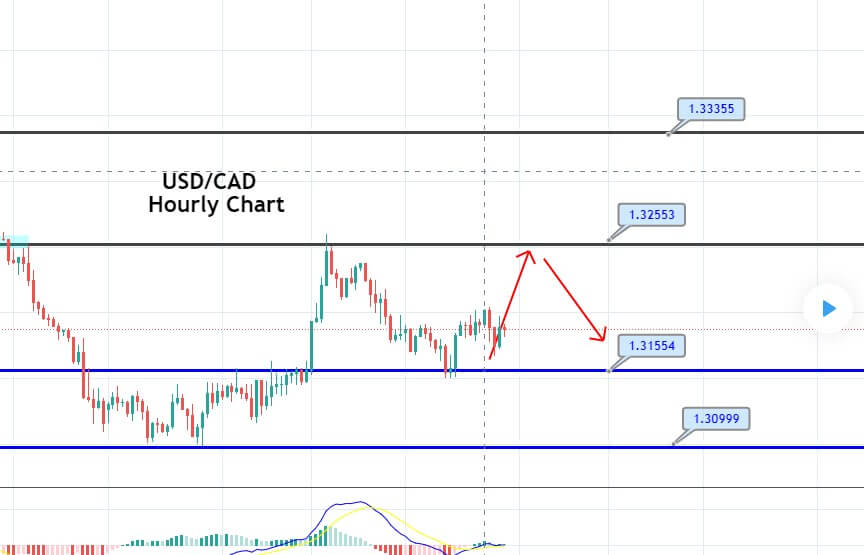
The ECB issued its September’s monetary policy meeting minutes on Thursday that suggested that ECB could roll out more stimulus later this year as the Bank was more concerned about the pandemic hit economy than analysts had previously thought. 

The minutes revealed that ECB was more concerned about the inflation trajectory and Euro than market participants anticipated. The Euro struggled to find demand after the release of minutes that suggested that further stimulus was not too distant in the future amid an uncertain economic outlook. The ECB officials’ tone in the September meeting minutes was in contrast to the ECB President Christine Lagarde’s speech that showed no concerns about the rising Euro and was optimistic about the Eurozone economy.

Lagarde had said that the strong rebound in activity was broadly in line with previous projections. Whereas, the ECB accounts showed that members preferred the Bank to remain flexible on policy and have concerns about the pace of inflation.

Furthermore, the Vice President of the European Central Bank, Luis de Guindos, said that ECB has to use its tools at its disposal as the coronavirus pandemic depresses inflation expectations. These concerns weighed on single currency euro and dragged the prices of the EUR/USD pair in the early trading session. Whereas, in the late trading session, the U.S. President Donald Trump said that he favored a mini-accord focused on airlines and checks to all Americans. After terminating talks with Democrats for further stimulus, these comments raised hopes that some packages will be announced soon. This weighed on the U.S. dollar and raised the EUR/USD pair in the late trading session and closed the day at the opening level that provided flat movement in the pair.

On the data front, at 10:59 GMT, the German Trade Balance for August dropped to 15.7B from the projected 17.1B and weighed on single currency Euro. Whereas from the U.S. side, the Unemployment claims during last week rose to 840K against the expected 820K and weighed on the U.S. dollar that added strength to EUR/USD pair.

Daily Technical Levels

Support Resistance

1.1734    1.1784

1.1708    1.1808

1.1684    1.1834

Pivot point: 1.1758

EUR/USD– Trading Tip

The EUR/USD pair is consolidating below 1.1780 level, and the closing of candles below the triple top resistance level of 1.1780 level may drive the selling trend in the EUR/USD pair until the support level of 1.1758 and 1.1740 level. Conversely, the bullish breakout of the 1.1780 level can trigger a sharp buying trend until today’s 1.1807 marks.


GBP/USD – Daily Analysis

The GBP/USD pair was closed at 1.29340 after placing a high of 1.29702 and a low of 1.28913. Overall the movement of the GBP/USD pair remained bullish throughout the day. The Governor of the Bank of England’s positive comments and Trump’s support for the U.S. stimulus package pushed GBP/USD pair higher on grounds on Thursday. GBP/USD pair raised and extended its previous day’s gains despite rising concerns over the coronavirus situation in the U.K. and Brexit deal.

On Thursday, the Bank of England Governor Andrew Bailey said that the Bank was not out of power to handle the downside risks faced by the economy as the country focus was shifted to the second wave of the coronavirus crisis. Bailey said that economic recovery has been very uneven, with different sectors gaining more than others. He also said that there was an unprecedented level of uncertainty at the moment, and the risk was very much on the downside, but the Bank was not out of ammunition to fight the crisis yet. 

He added that the Bank has many policy tools that could be used promptly in response to the second wave and third wave if needed. 

Britain experienced a record decline in economic output in the second quarter of this year by a GDP contraction of 19.8%, the biggest drop since the record began in 1955. Bailey said that the country was still in a very big recession, with the economic recovery from the pandemic height very uneven. These comments from Bailey raised British Pound and helped GBP/USD pair to post gains.

The upward trend of the GBP/USD pair was further supported by the latest Trump’s call for a small stimulus package from the U.S. Congress for airline and small businesses. The change of view by Trump over stimulus measure within a day weighed on the U.S. dollar and supported the upward movement of the GBP/USD pair.

 Furthermore, the U.S. dollar was also weighed by the last week’s Unemployment Claims that rose to 840K from the projected 820K last week. The weak U.S. dollar pushed GBP/USD further on the upside on Thursday and extended its gains.

Whereas, the coronavirus cases in the north of England were getting out of control and were under a serious situation. The minister defended the government plans to introduce new restrictions that would include a ban on overnight stays and closing the pubs and restaurants in the worst-affected areas. These potential restrictions to control the coronavirus situation in the U.K. weighed on GBP and capped further gains in GBP/USD pair on Thursday.

On the data front, at 04:01 GMT, the RICS House Price Balance raised to 61% from the expected 39% and supported British Pound that added strength to GBP/USD pair. On the Brexit front, the hopes for a Brexit deal were fading in the market and weighing on British Pound with Boris Johnson giving threats to walk away from talks if the deal was not reached by 15th October. At the same time, E.U. officials have dared Johnson to walk away if he views a deal as impossible. 

According to Bloomberg, the E.U. officials are working on a plan that will find a way to carry on discussions into the second half of October despite some differences remaining on both sides. The uncertain Brexit developments have weighed on British Pound and limited the additional gains in GBP/USD on Thursday.

Daily Technical Levels

Support Resistance

1.2921    1.3013

1.2863   1.3049

1.2828    1.3106

Pivot Point: 1.2956

GBP/USD– Trading Tip

The GBP/USD is trading at 1.2960 level, holding right below an immediate resistance level of 1.2960. The resistance is extended by a double top resistance level on the hourly timeframe. Below the 1.2960 resistance level, the Sterling can trigger selling until the 1.2920 level and 1.2900 level. On the higher side, a bullish breakout of 1.2960 levels can trigger buying until the 1.3000 level. The fundamental side is busy today, and the U.K. economy is due to release series of economic events, with a special focus on the U.K. GDP data. A positive date is likely to drive a bullish breakout until 1.3000. At the same time, the negative GDP figures may lead the GBP/USD price towards 1.29350. 


USD/JPY – Daily Analysis

The USD/JPY pair was closed at 106.026 after placing a high of 106.106 and a low of 105.923. Overall the movement of the USD/JPY pair remained bullish throughout the day. The pair USD/JPY consolidated in a range of around 106 marks on Thursday amid mixed statements from President Trump, House Speaker Pelosi, and Treasury Secretary Mnuchin related to U.S. stimulus measure. 

Earlier this week, President Trump halted further negotiations with Democrats for a stimulus measure package and said he would provide a massive stimulus measure to win the election. However, the next day, Trump backed from his statement amid the need for financial support to airlines and small businesses that had been hit hardest by the pandemic crisis. 

Trump called for a small stimulus aid for airlines, which weighed on the U.S. dollar that was moving higher due to his previous comments. U.S. stocks, however, rallied after the new call for a small package by President Trump. These statements helped the USD/JPY pair to post gains due to improved risk sentiment in the market on Thursday.

On the other hand, the House Speaker Nancy Pelosi said that a mini-accord was not possible without passing a big stimulus in response to calls for a small aid package. These contrasting statements from both sides frustrated the traders and increased concerns in the market. After Pelosi’s comments, the rally in equities that started earlier suffered and was reversed on Thursday.

On the data front, at 04:50 GMT, the Current Account Balance from Japan raised in August to 1.65T against the forecasted 1.50T and supported the Japanese Yen. At 10:02 GMT, the Economy Watchers Sentiment increased to 49.3 from the projected 45.0 and supported the Japanese Yen.

From the U.S. side, the Consumer Credit for August was released at 00:00 GMT, which dropped to -7.2B against the forecasted 14.9B and weighed on the U.S. dollar. At 17:30 GMT, the Unemployment Claims from last week raised to 840K from the anticipated 820Kand weighed on the U.S. dollar.

Despite Japan’s positive data and negative data from the United States, the currency pair USD/JPY managed to remain bullish throughout the day on Thursday. Meanwhile, the risk sentiment was also improved by the latest news that the United States has enough coronavirus vaccine for every American by March. The Health and Human Services (HHS) Secretary Alex Azar said that Americans could use vaccines by March to be available for every one of them. This improved risk sentiment weighed on the safe-haven Japanese Yen and supported the USD/JPY pair on Thursday.

Daily Technical Levels

Support Resistance

105.66    106.18

105.36    106.42

105.13    106.71

Pivot point: 105.89

USD/JPY – Trading Tips

The USD/JPY pair has violated the ascending triangle pattern at 105.800 level, and now the same level is working as a support for the safe-haven pair. On the higher side, the USD/JPY pair can continue its bullish bias until the 106.270 level. However, we can expect USD/JPY to retrace back until the support level of 105.800 level before showing us a bullish trend. Let us wait to buy over 105.800, but the next support will prevail at the 105.450 level. Let’s consider staying bullish over the 105.800 level today, and selling should also be considered only below this level today. Good luck!