

Fundamental Analysis for Novices US Construction spending
Thank you for joining this fundamental analysis for novices’ educational video. In this session, we will be looking at construction spending data releases and, in particular, within the United States.
If this is the first time you have viewed one of our fundamental analysis videos for novices, please make sure you search for the many other videos in this series which will help you understand the importance of such data releases when they hit the market and which are usually subject to an embargo.
You should refer to your economic calendar every single day and make sure you plot your trades around these risk events.
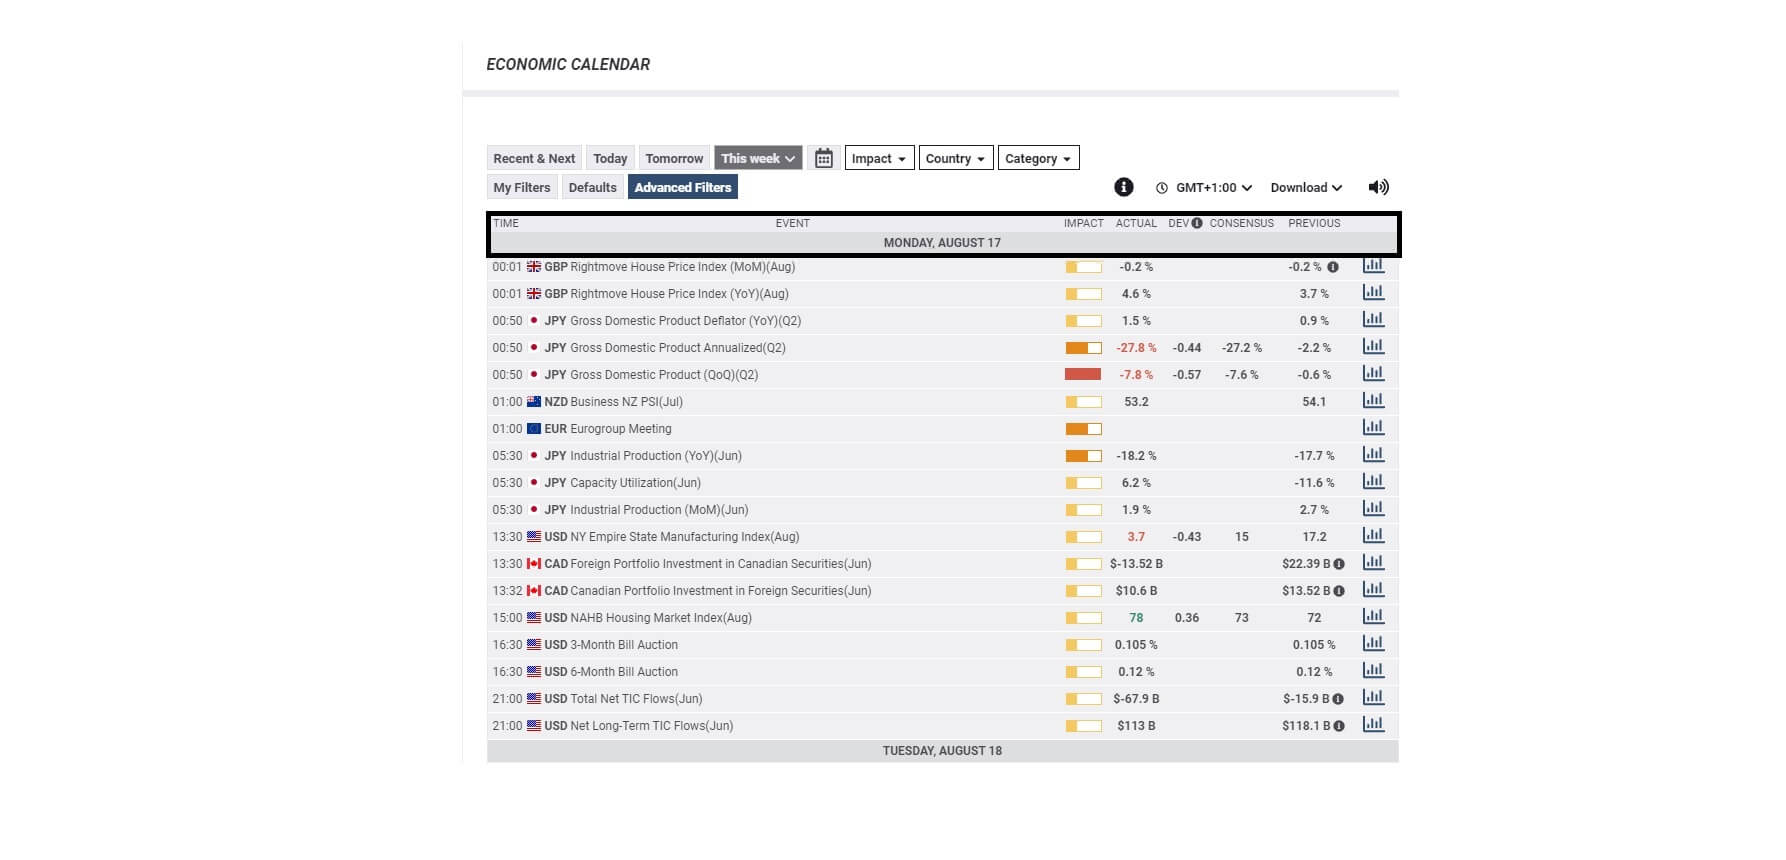
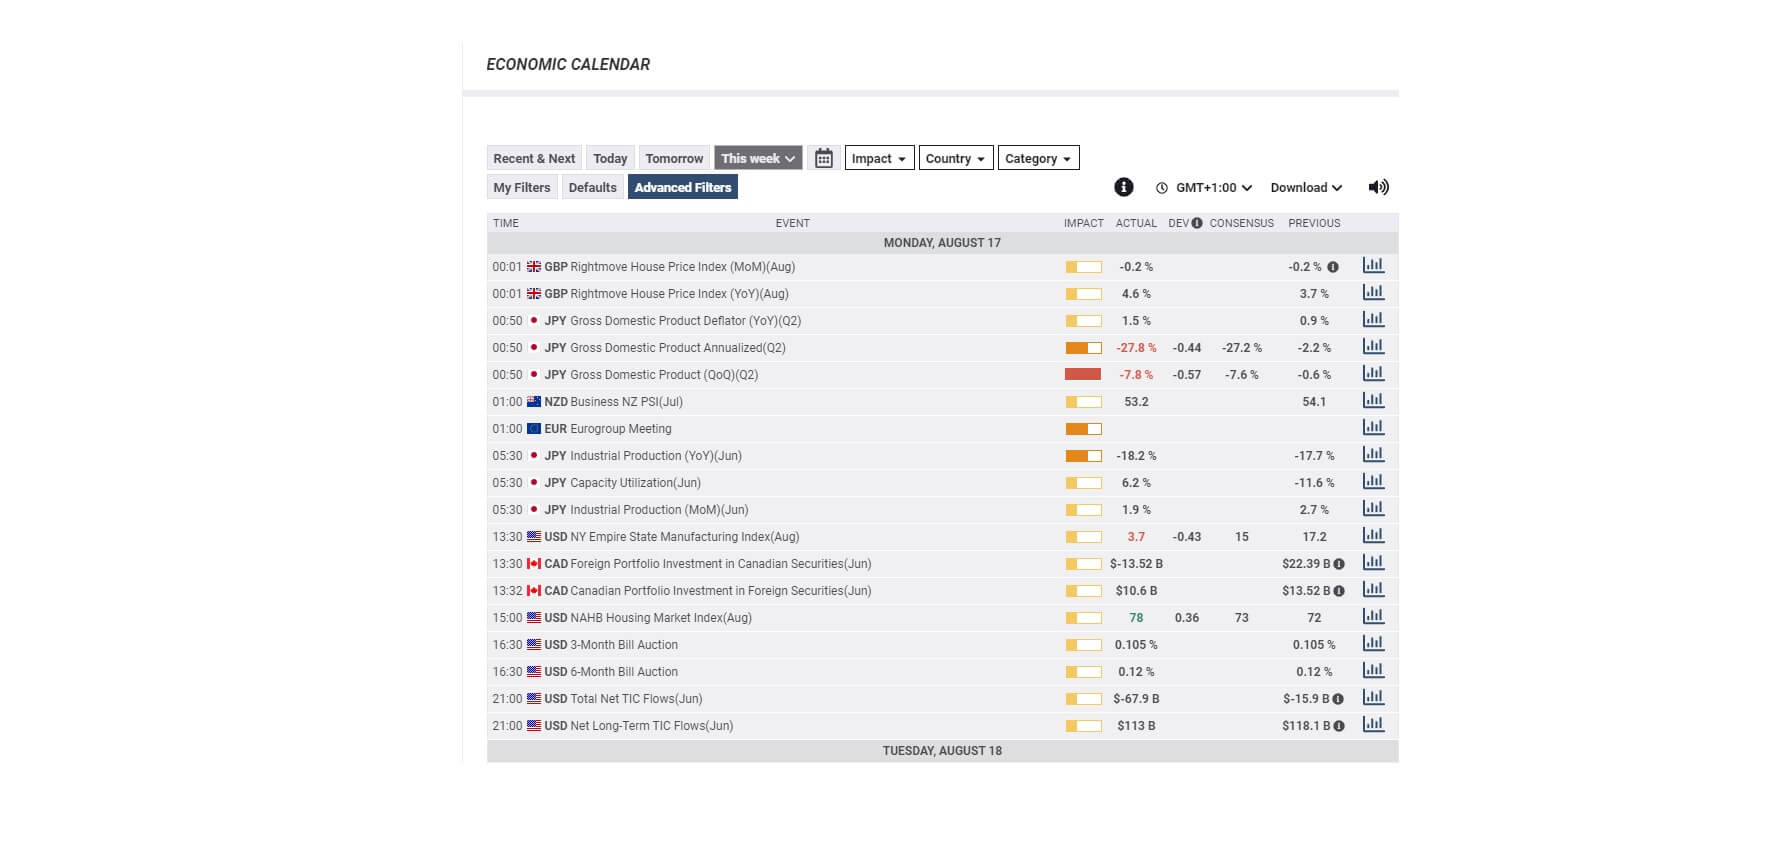
The most important sections of an economic calendar of the time of day and date of the release the type of event. For example, here we can see that the first one on the list is the right move house price index month on month for August for Great Britain, which was due for release at 00:01 on Monday, August 17th, where the impact was low.
Most economic calendars will provide you with the likely volatility impact of such news releases, and these will typically be released as low, medium, or high impact. Here we can see that the strength of the impact is measured by a bar where low-impact is a third of the bar coloured in orange, a medium impact such as the EURO group meeting at 1:00 takes up a third of the bar in orange, and a high impact bar which we can see at 12:50 in the morning, where the Japanese gross domestic product was considered to be a high impact and where the bar was completely coloured in red.
Economic calendars will also show you the previous data, which could be weekly, monthly, quarterly, or annually, and they will provide you with a general consensus as compiled by market experts and economists, and of course, the actual release section will be populated shortly after the embargo.
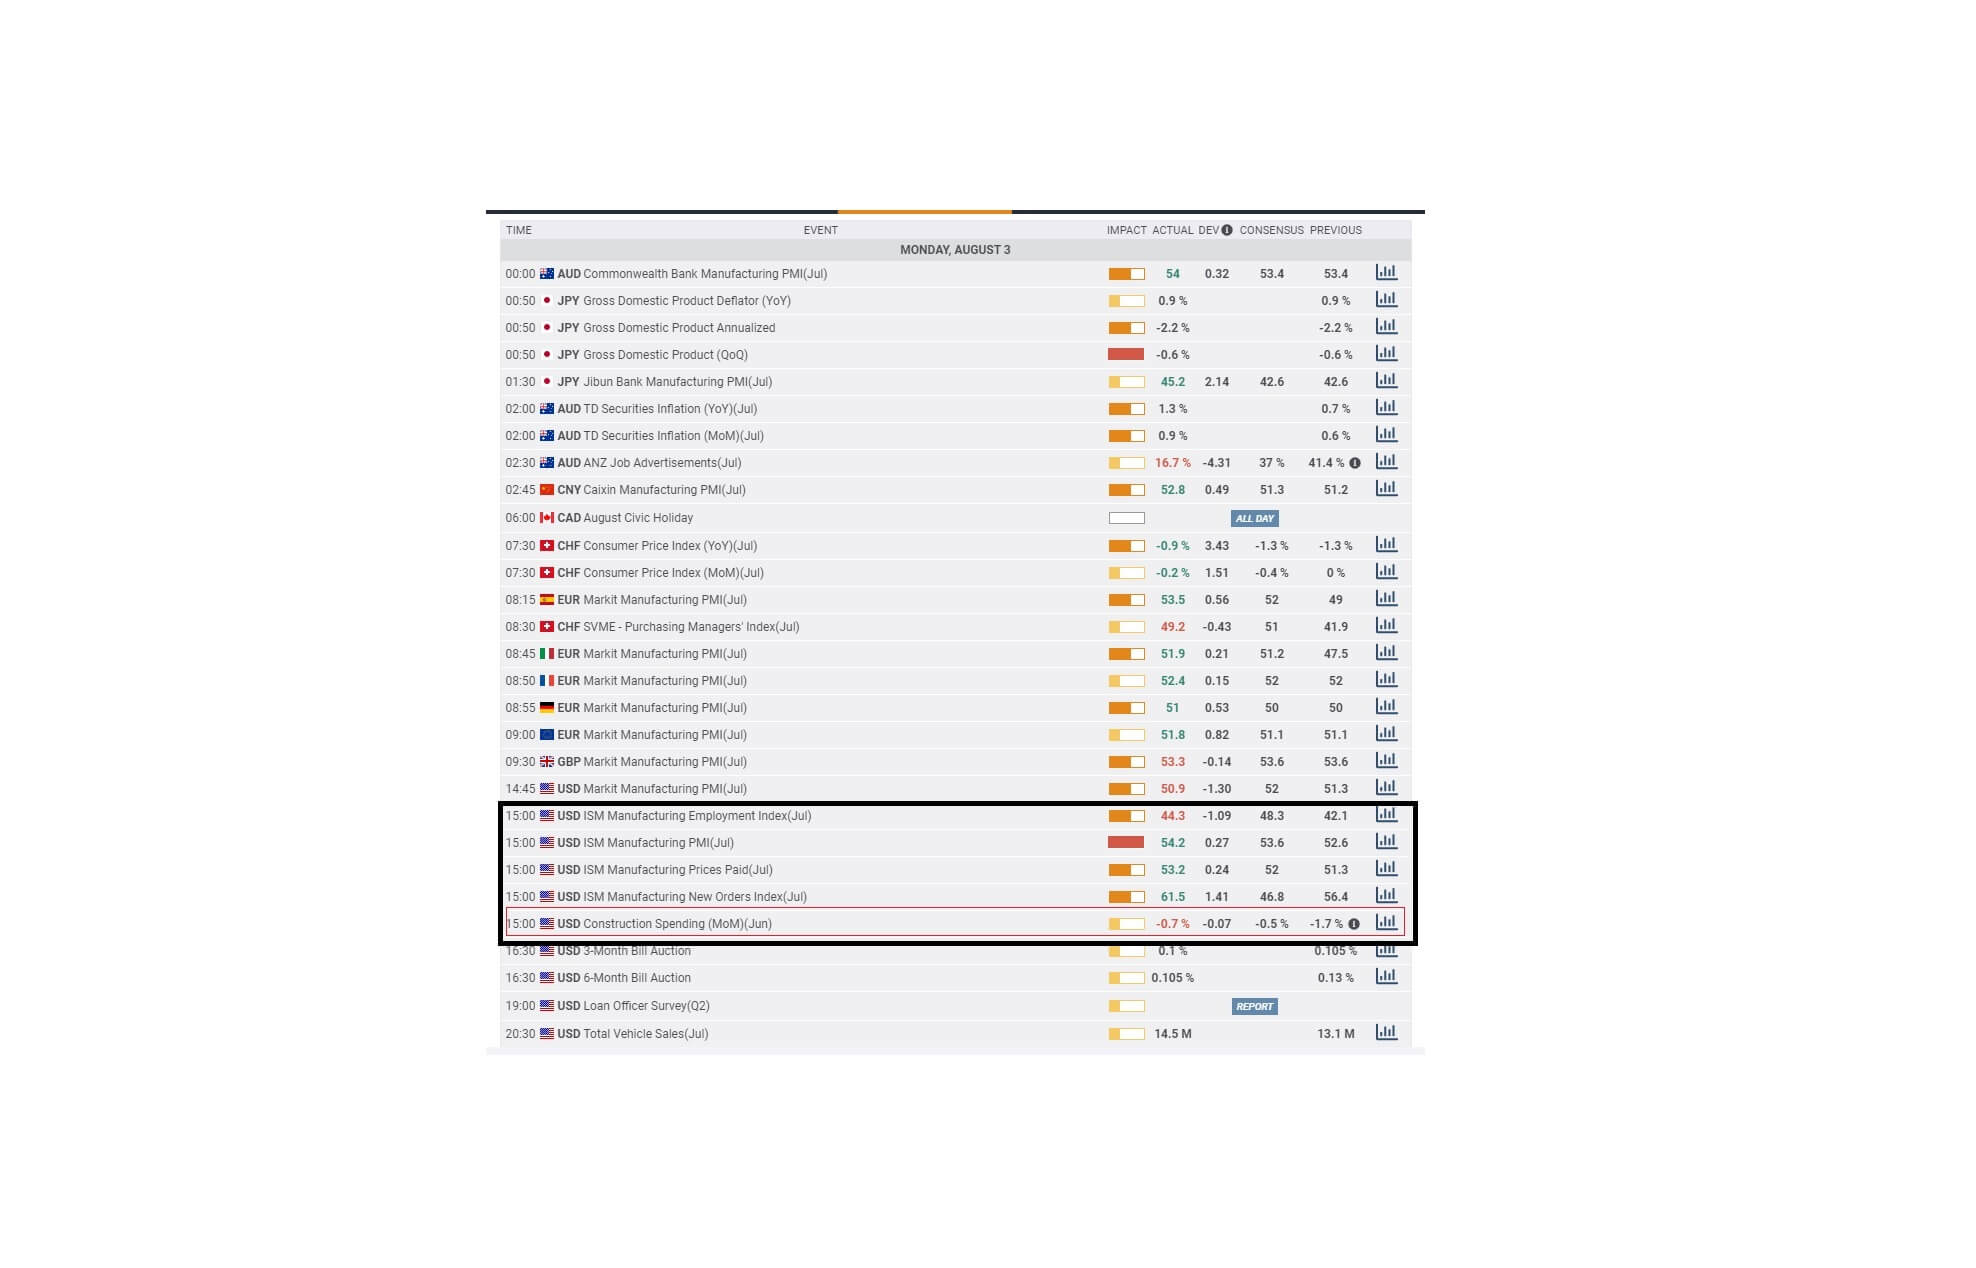
Here we can see a recent data release of us construction spending, which came out on Monday, August 3rd, and was simultaneously released at 3 p.m. BST with other important United States data including ISM manufacturing employment and manufacturing orders and prices.
While the market will look at all of this information simultaneously, some of this has been covered in previous videos, which we would ask you to take a look at. Still, in this video, we will only be focusing on the construction spending component, which was month-on-month for June, where we can see here came in at – 0.7%.
The information is released by the United States census bureau and is a measurement of the total amount of spending in the United States for various construction types. Because it includes a residential component, it is useful for predicting new home sales and mortgages. A high reading is seen as positive for the United States dollar while a low reading he seen as negative or perish for the United States dollar.
While the impact indicator considers this to be of low importance, when taken into to context with the other data being released simultaneously, traders will need to take a holistic view, especially in the current economic climate where the pandemic is still in the grips of the United States at the time of writing this article and where even low impact data can cause shock waves and market jitters. In which place, it is better to be prepared for this and wait for the market to react to the news before spotting trends and trying to get on them.